
Philippines - Anilao: Dive and Trek

Part of the regional summaries: Philippines - Luzon and Philippines
More info
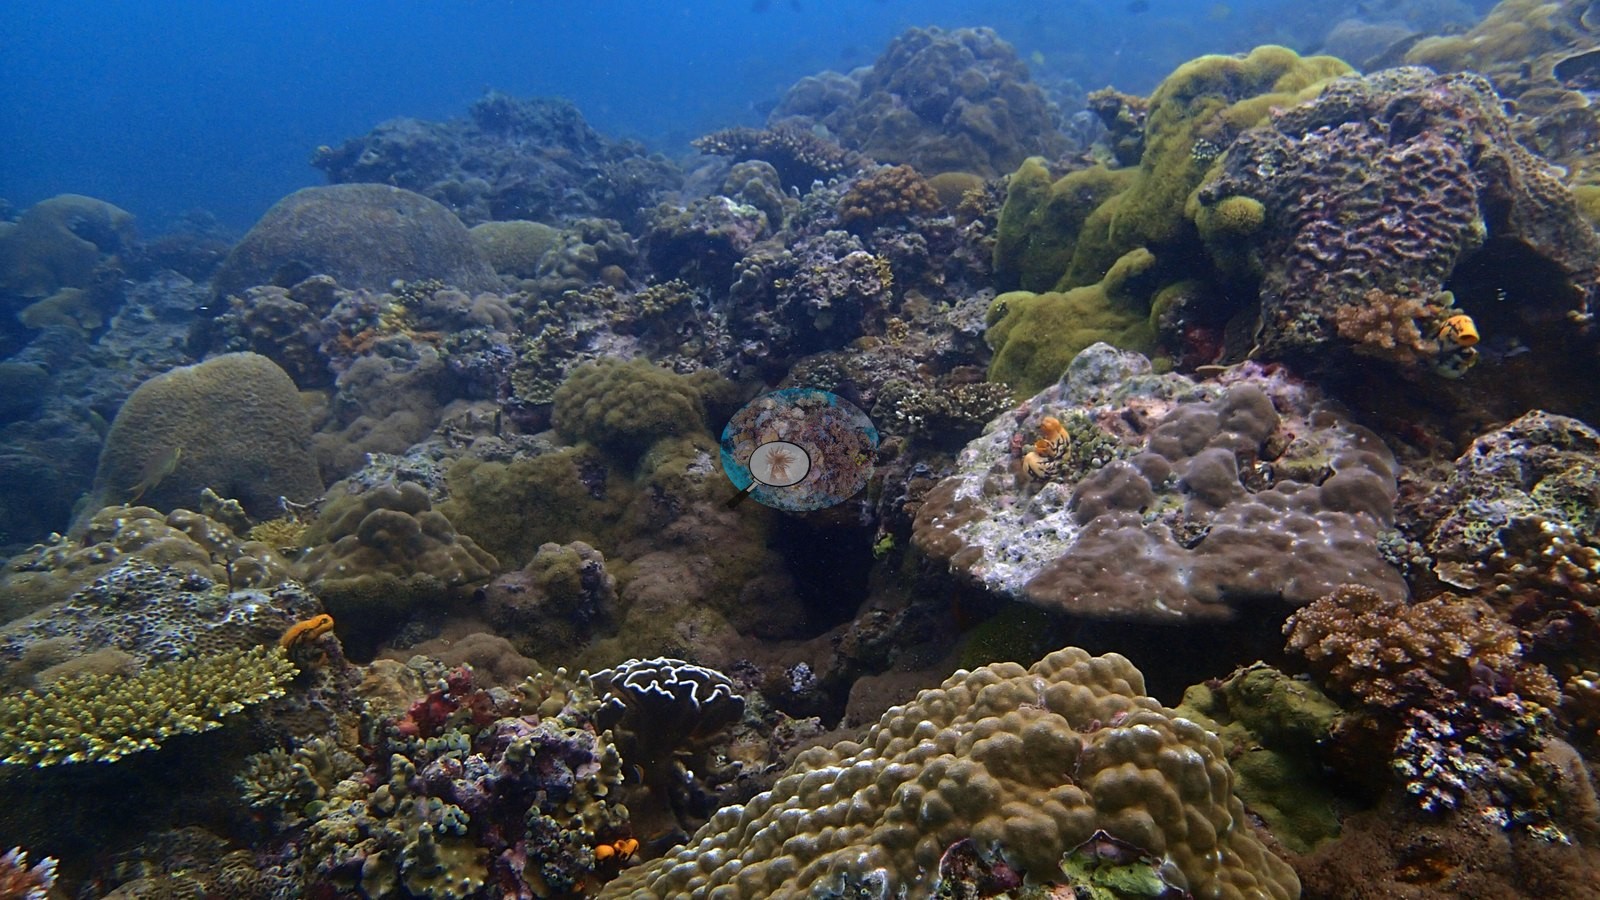
Central Philippines (NOAA CRW virtual station) · Eastern Philippines ecoregion mean=7.5°C-heating weeksA managed marine sanctuary at Bauan built around a Virgin Mary statue and submerged cross, notable for a genuine giant clam restocking garden across several size classes and species. The reef is otherwise high-cover and healthy, with one stand of stark-white branching Acropora suggesting recent bleaching or mortality. Cover estimate is roughly 27-31%, averaging 29.1%.
Isang pinamamahalaang santuwaryong pandagat sa Bauan na itinayo sa palibot ng isang estatwa ng Mahal na Birhen at isang lubog na krus, kilala sa isang tunay na hardin ng muling pagpaparami ng higanteng taklobo sa iba't ibang laki at espesye. Sa kabila nito, mataas ang saklaw ng koral at malusog ang bahura, maliban sa isang pangkat ng lantang-puting sumasangang Acropora na nagpapahiwatig ng kamakailang pamumuti o pagkamatay. Ang tantiya ng saklaw ay humigit-kumulang 27-31%, na may katamtamang 29.1%.
Salin ng buod na ito gamit ang AI; ang Ingles ang opisyal na bersyon.
Two independent survey stations shown with the program’s logo — click one to see how far it is from this site.
One other CRD dive site within 5 km shown in orange — click a marker to open its page.
19 of these 50 photographs are shown beside the text that discusses them under "Site description" below.
Site description
Setting
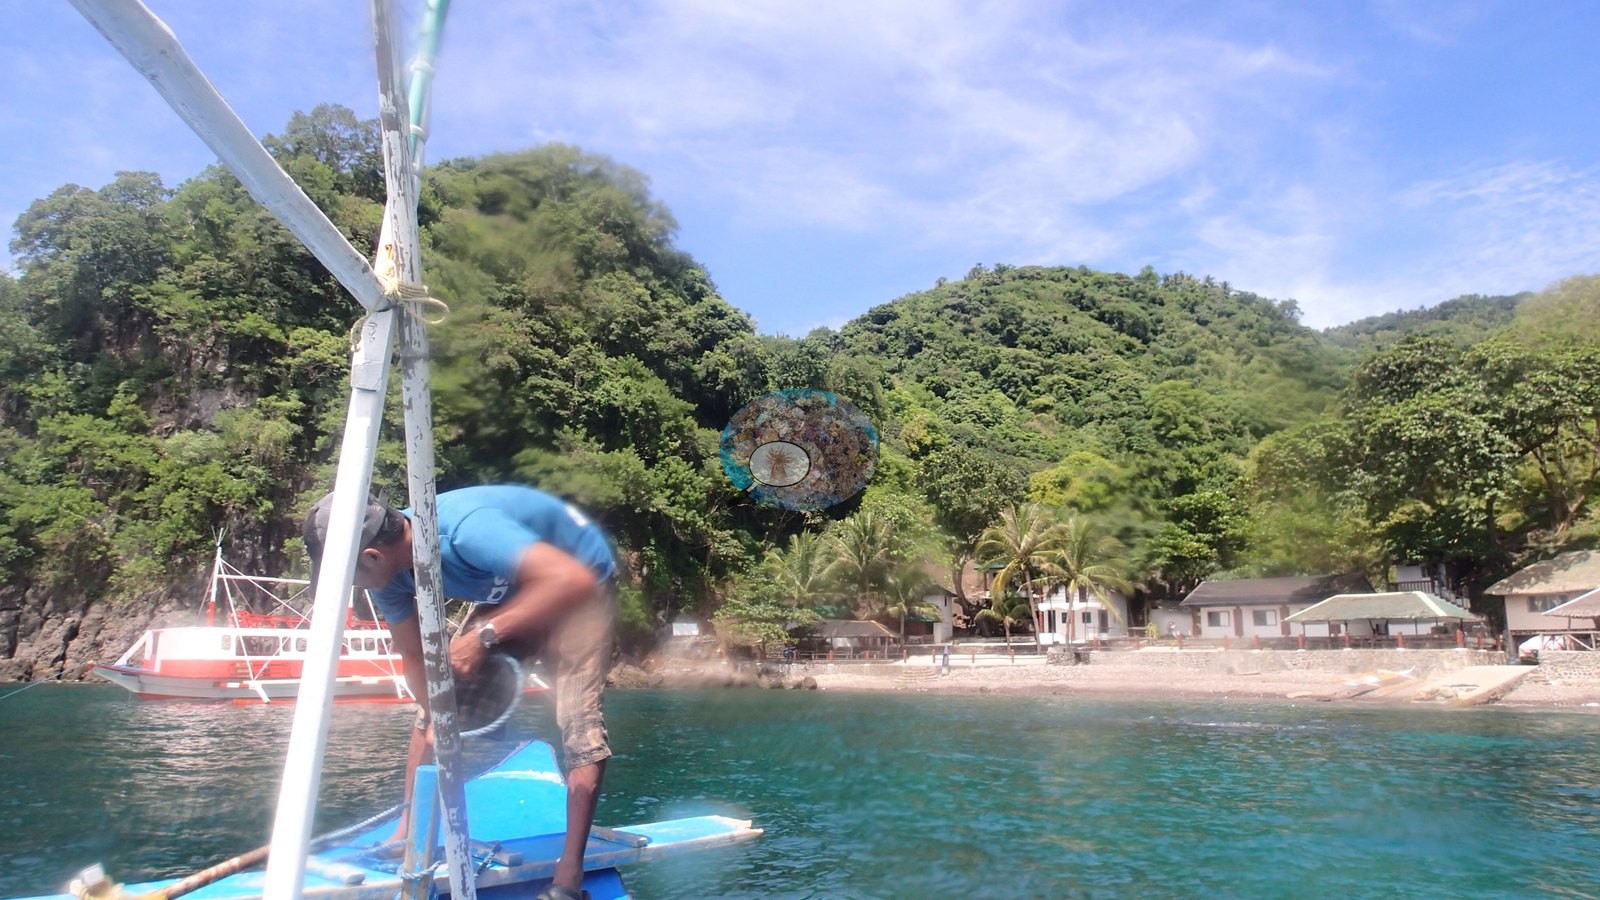
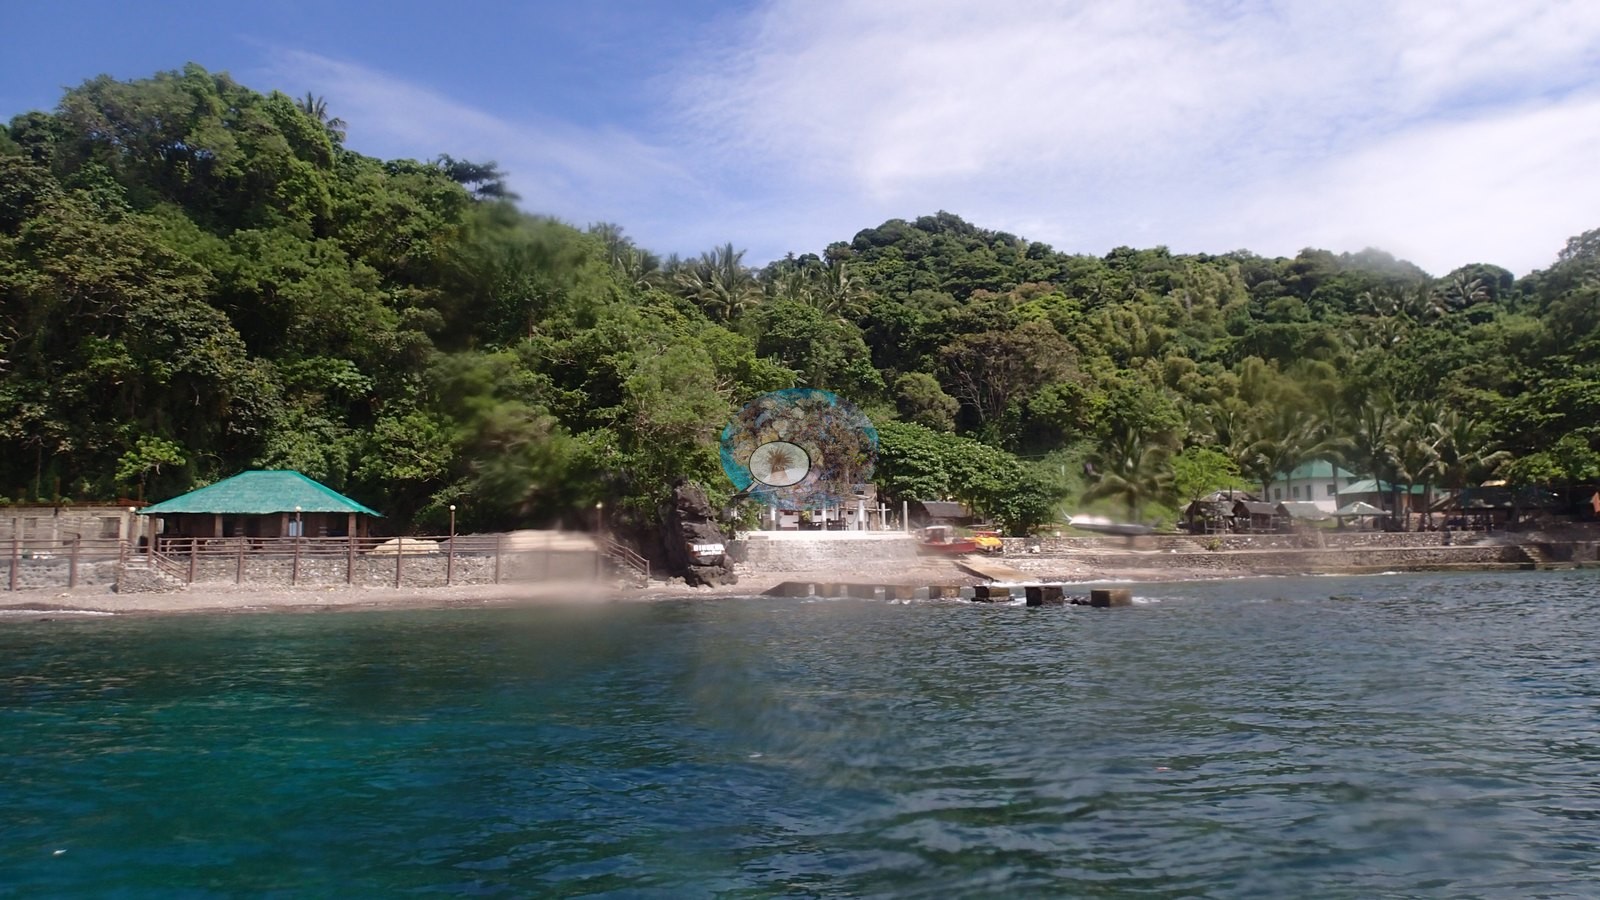
The second dive of 30 September 2016, at the Dive and Trek private marine sanctuary at Bauan, reached by bangka outrigger beneath a steep forested headland; all 89 available frames were reviewed, five of them topside boat and shoreline shots. It is a managed reserve and the photographs make that obvious.
General benthic features
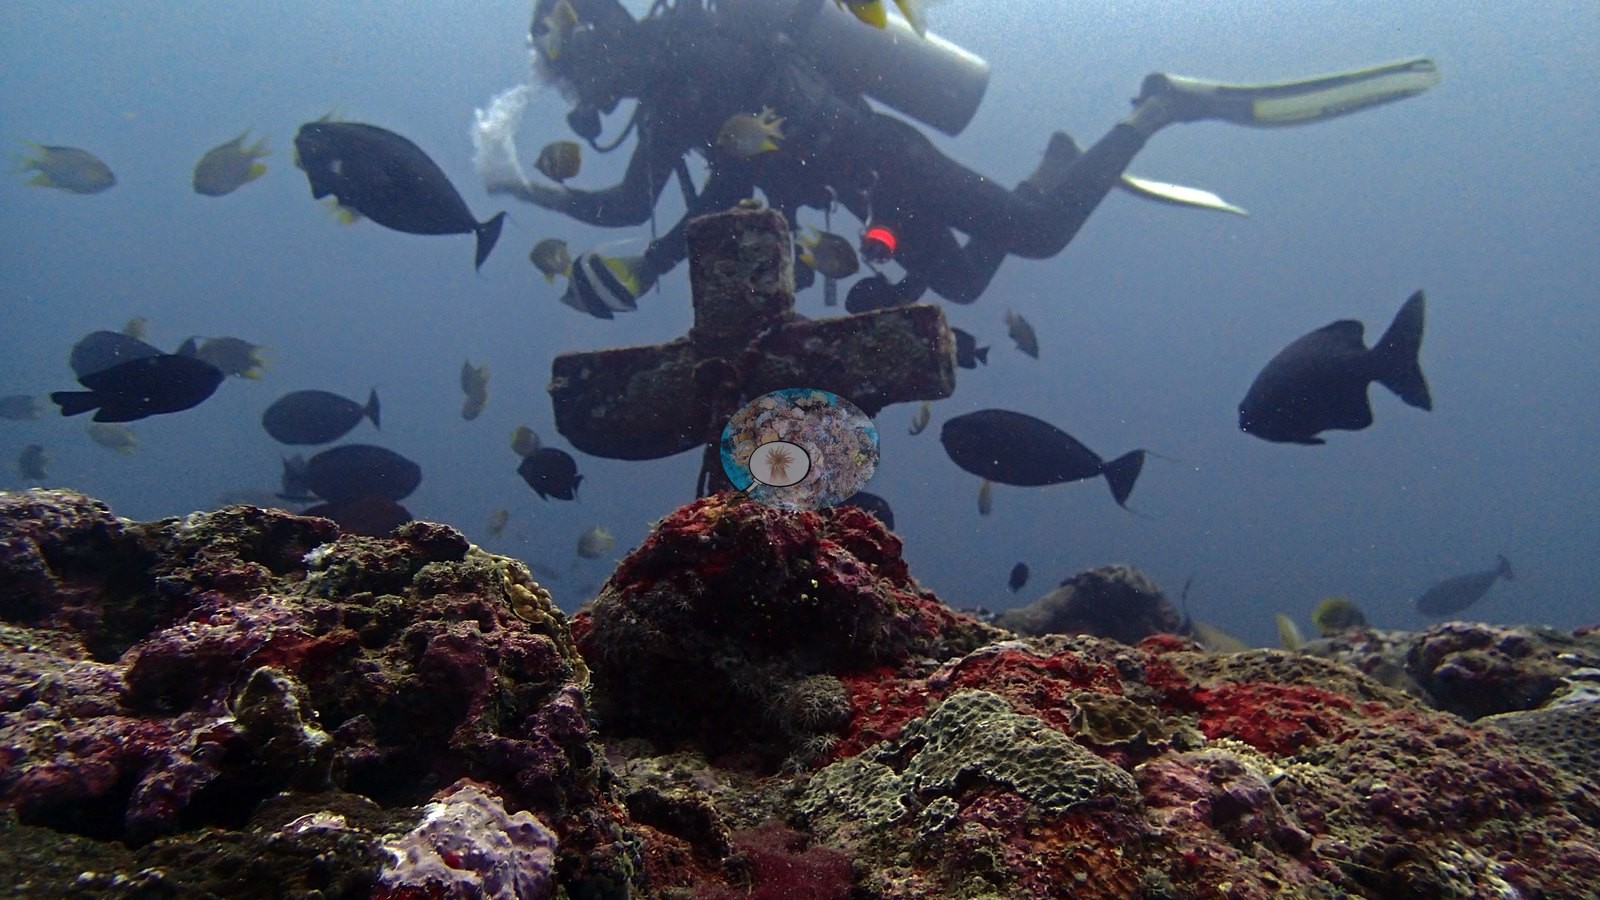
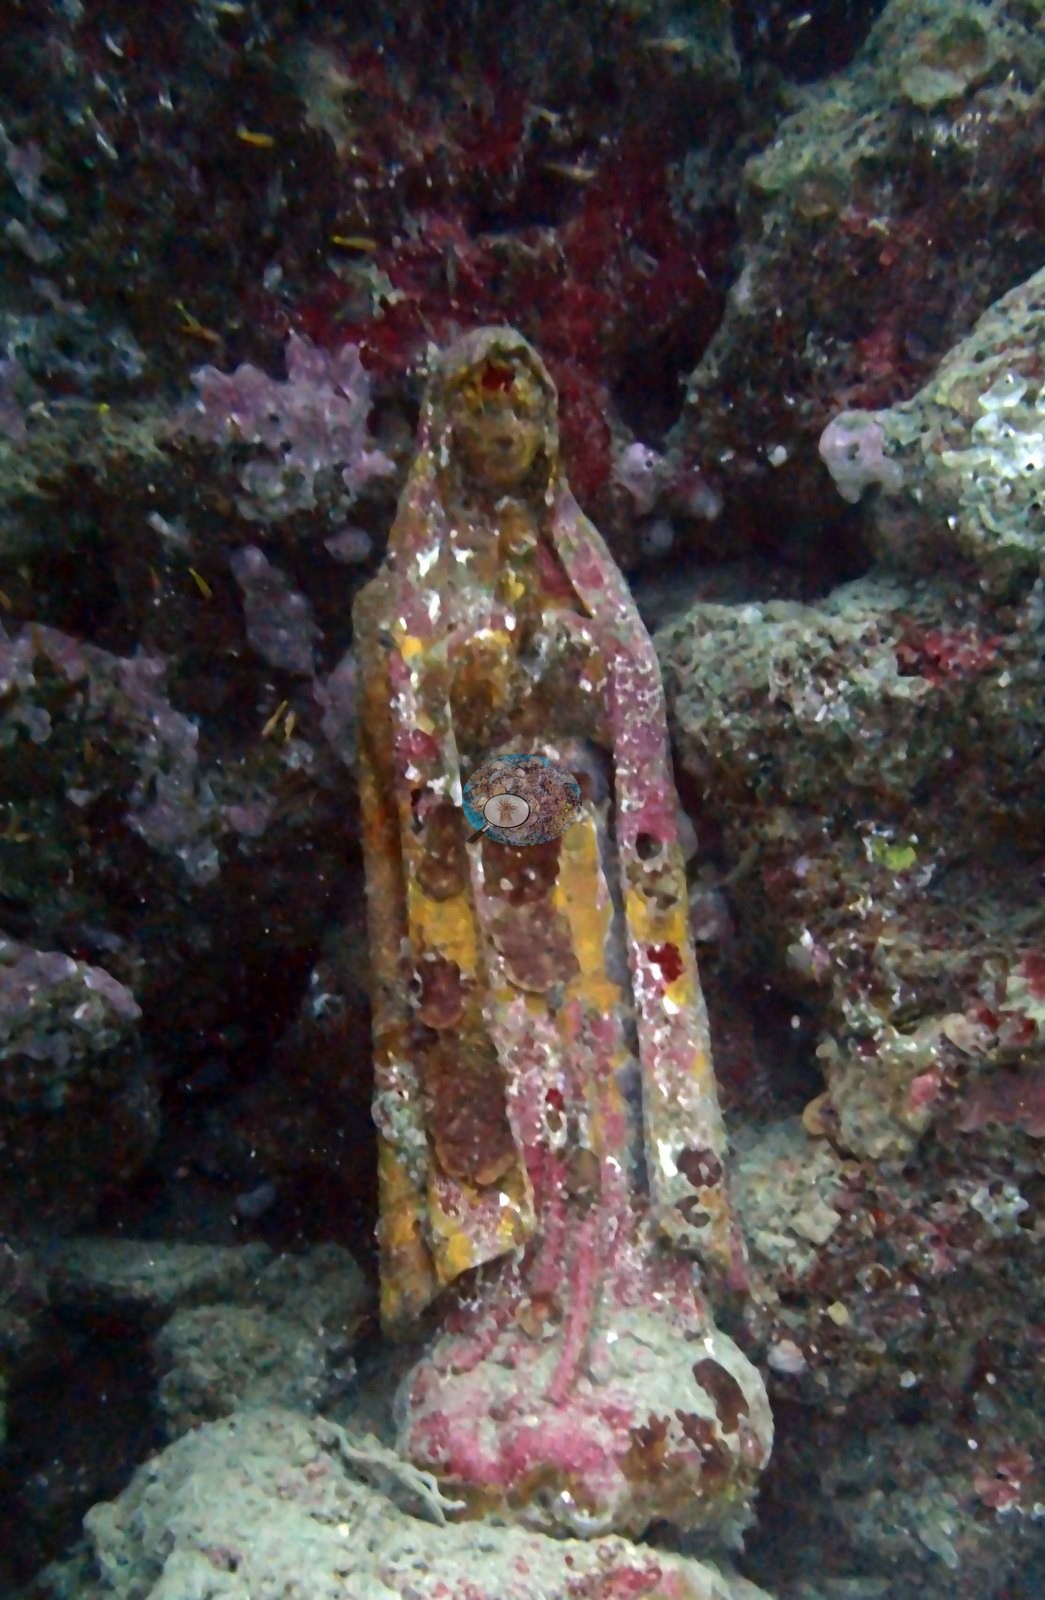
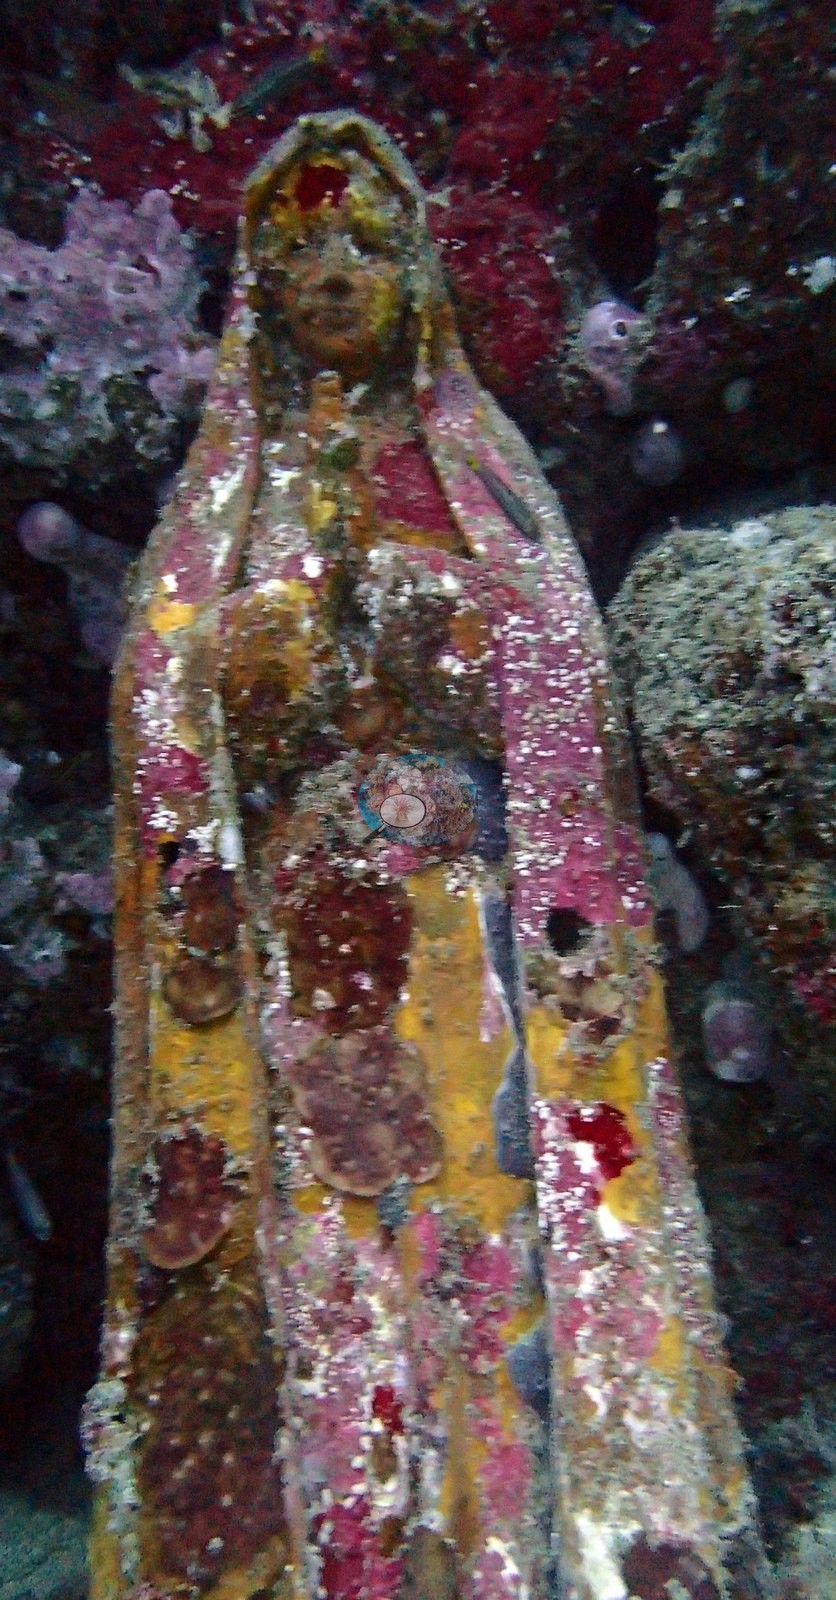
A standing Virgin Mary figure, thickly encrusted with coralline algae and sponge, and a large submerged cross with fish shoaling around it both sit on the slope (e.g., Image 7).
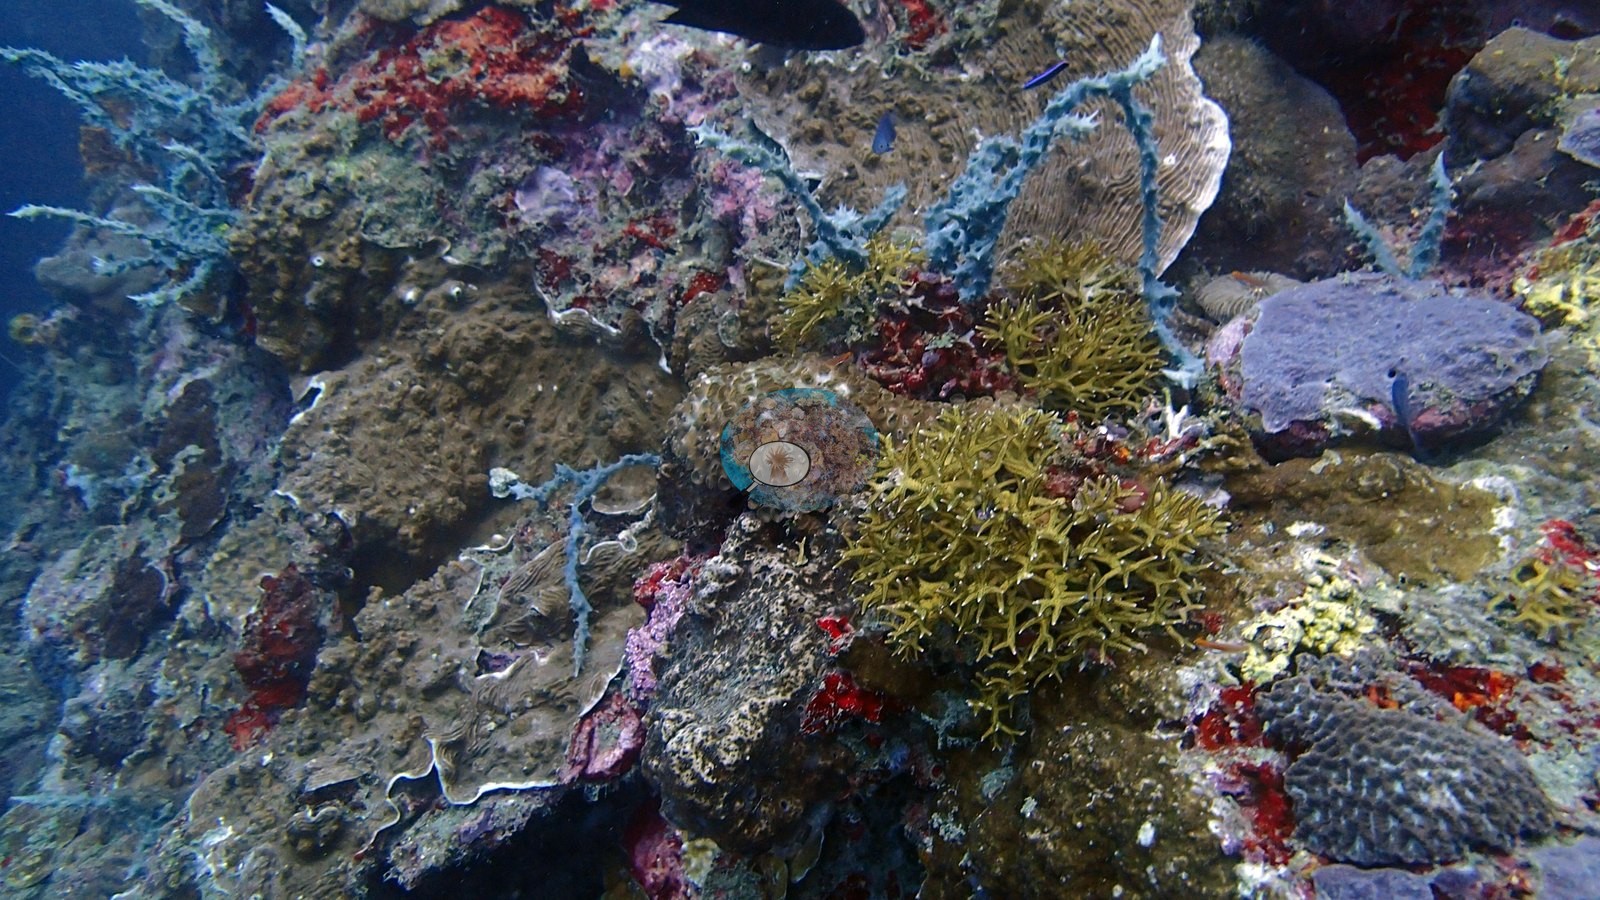
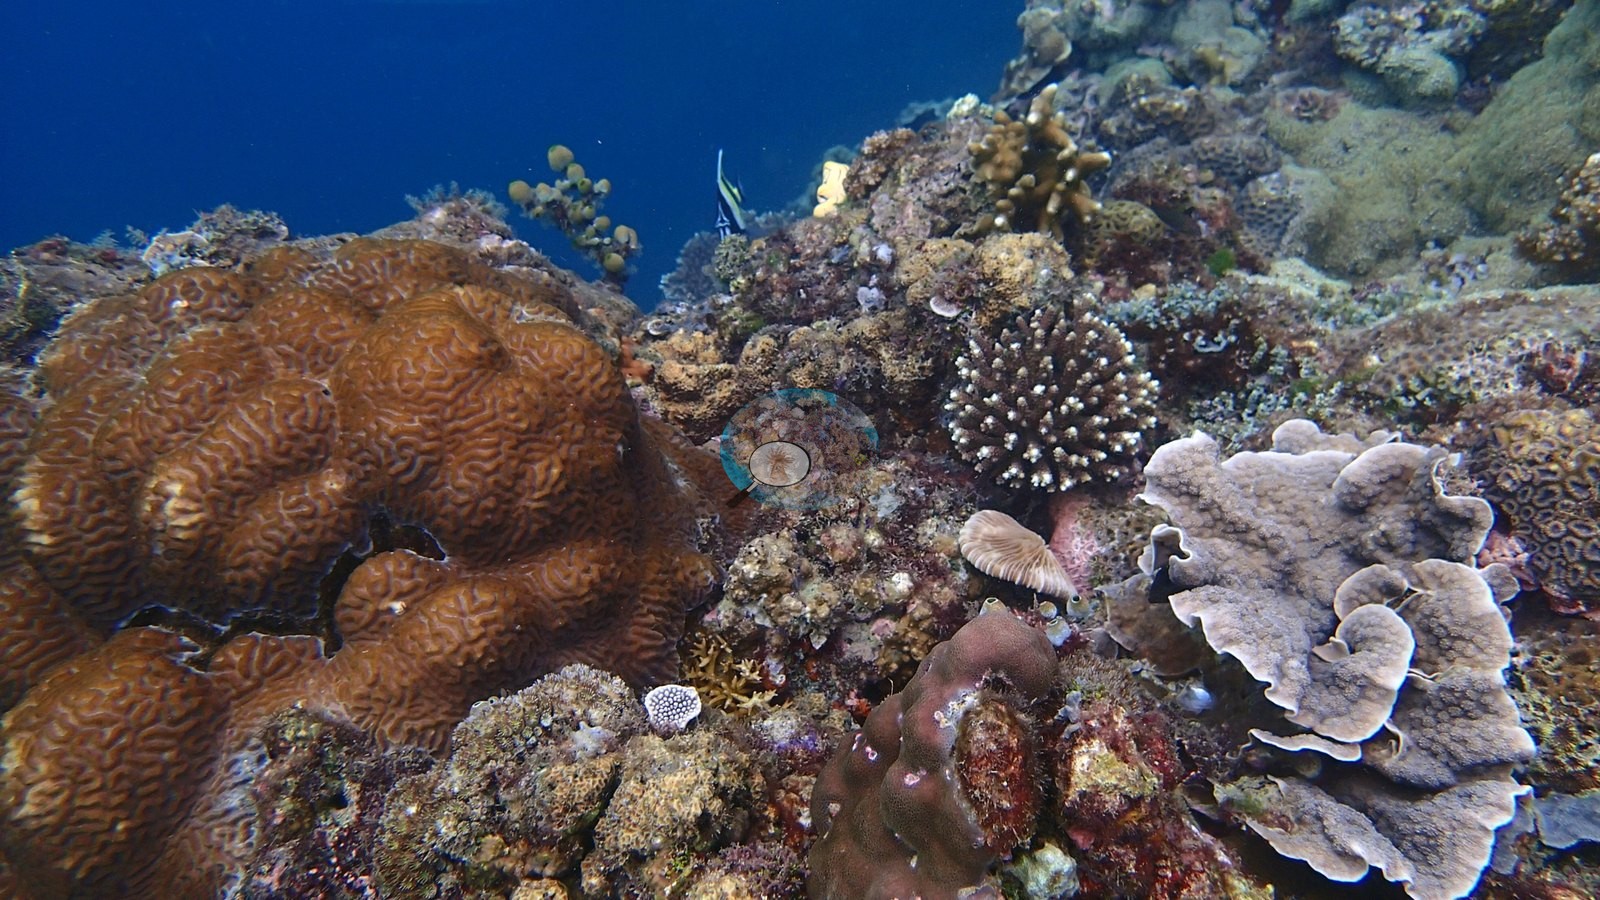
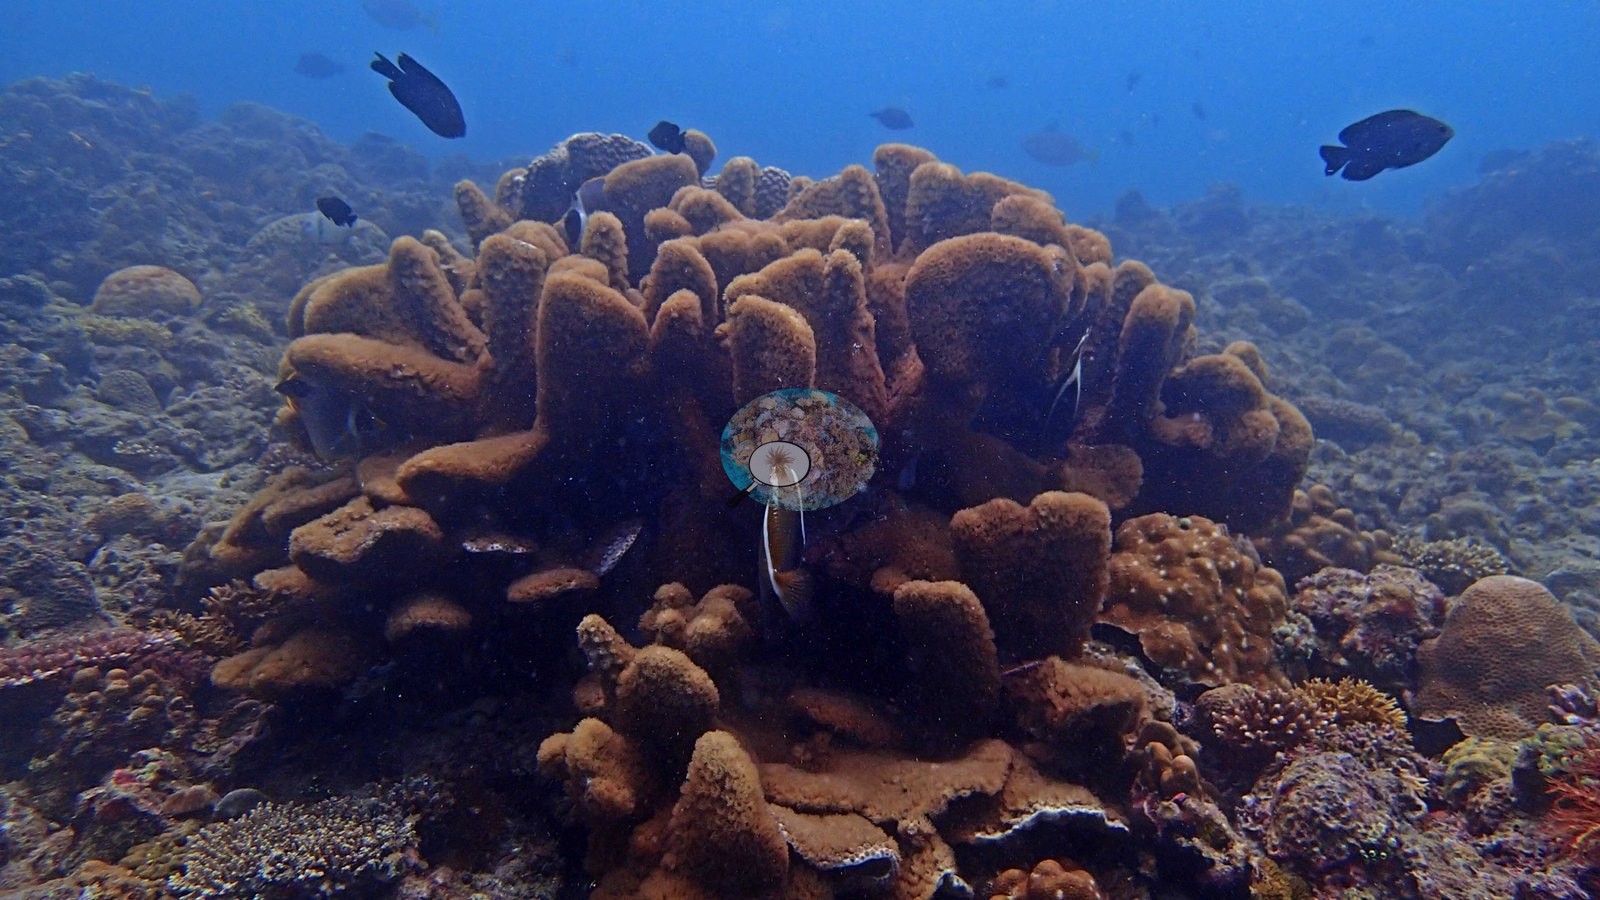
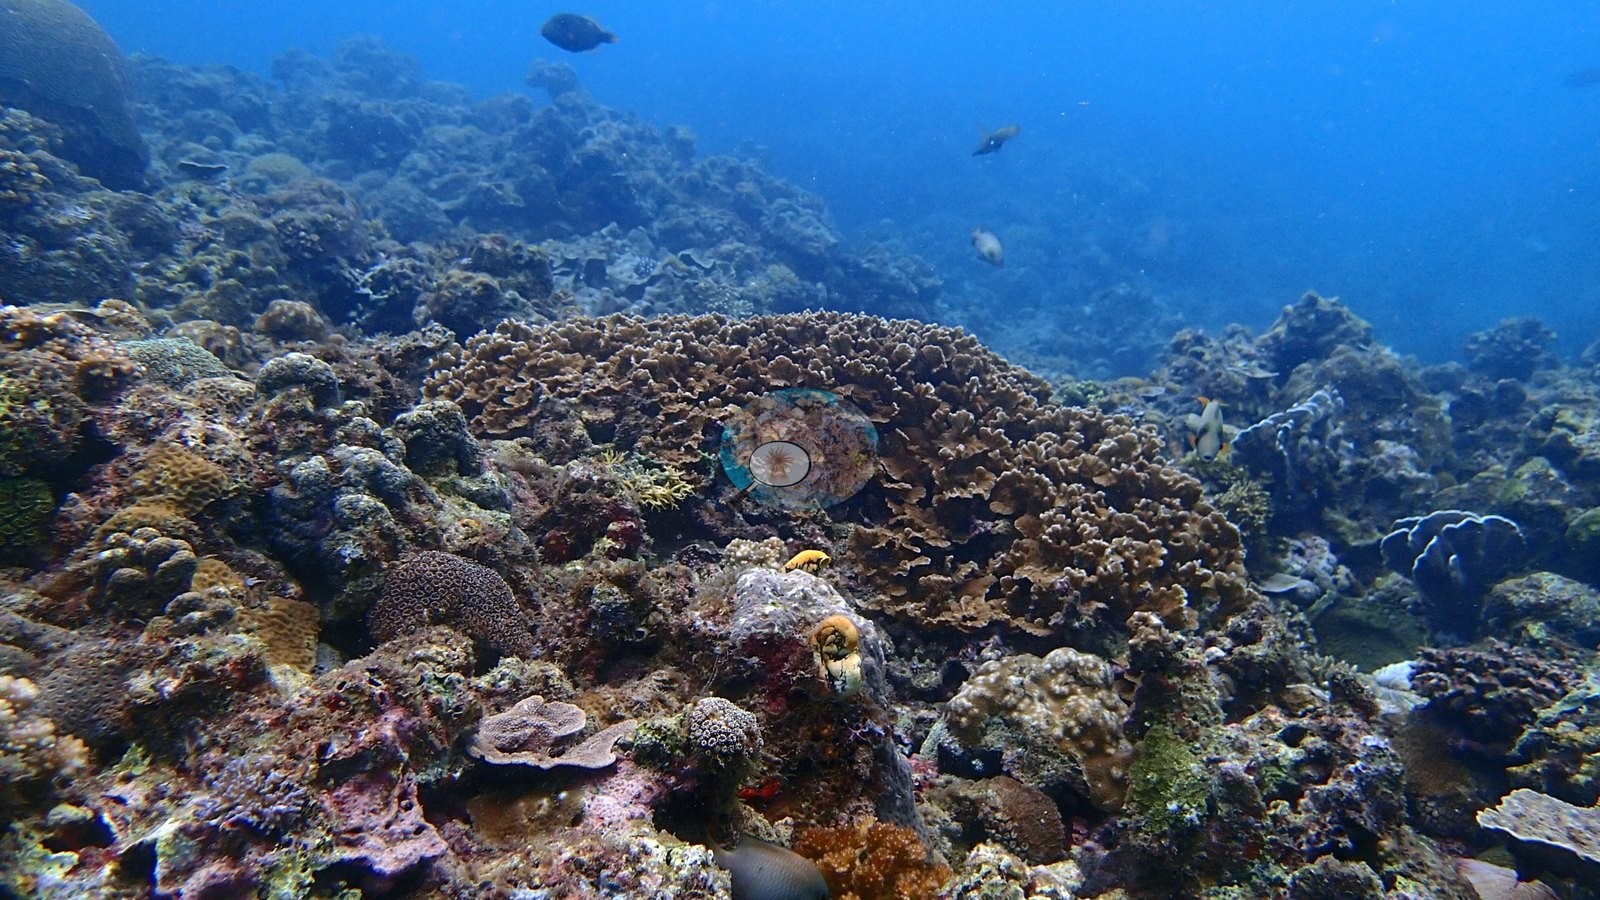
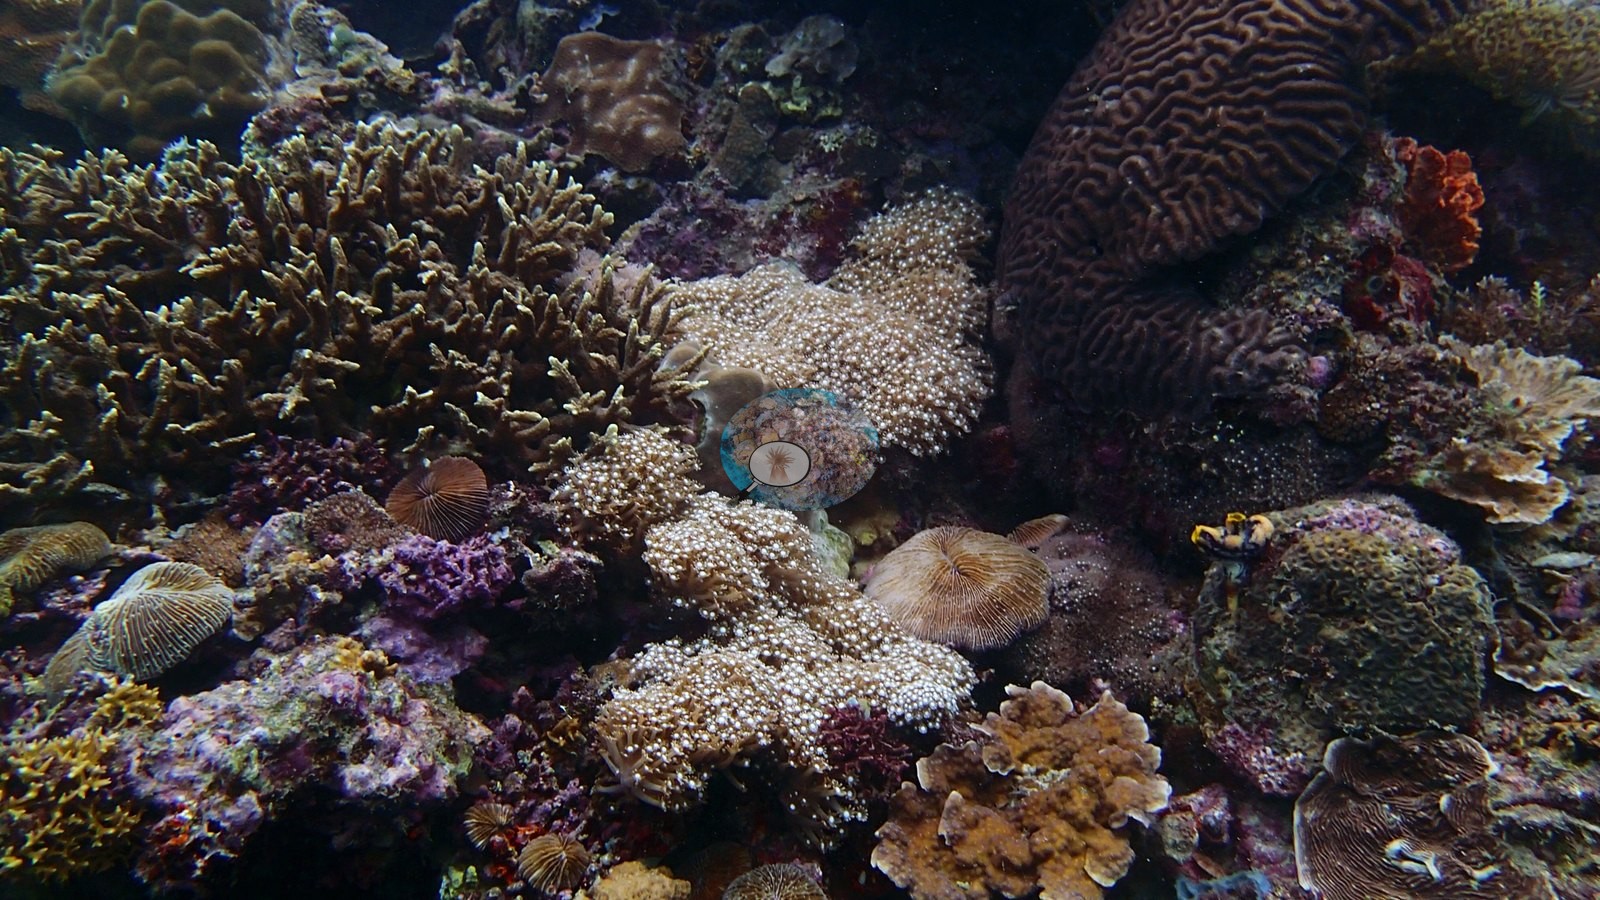
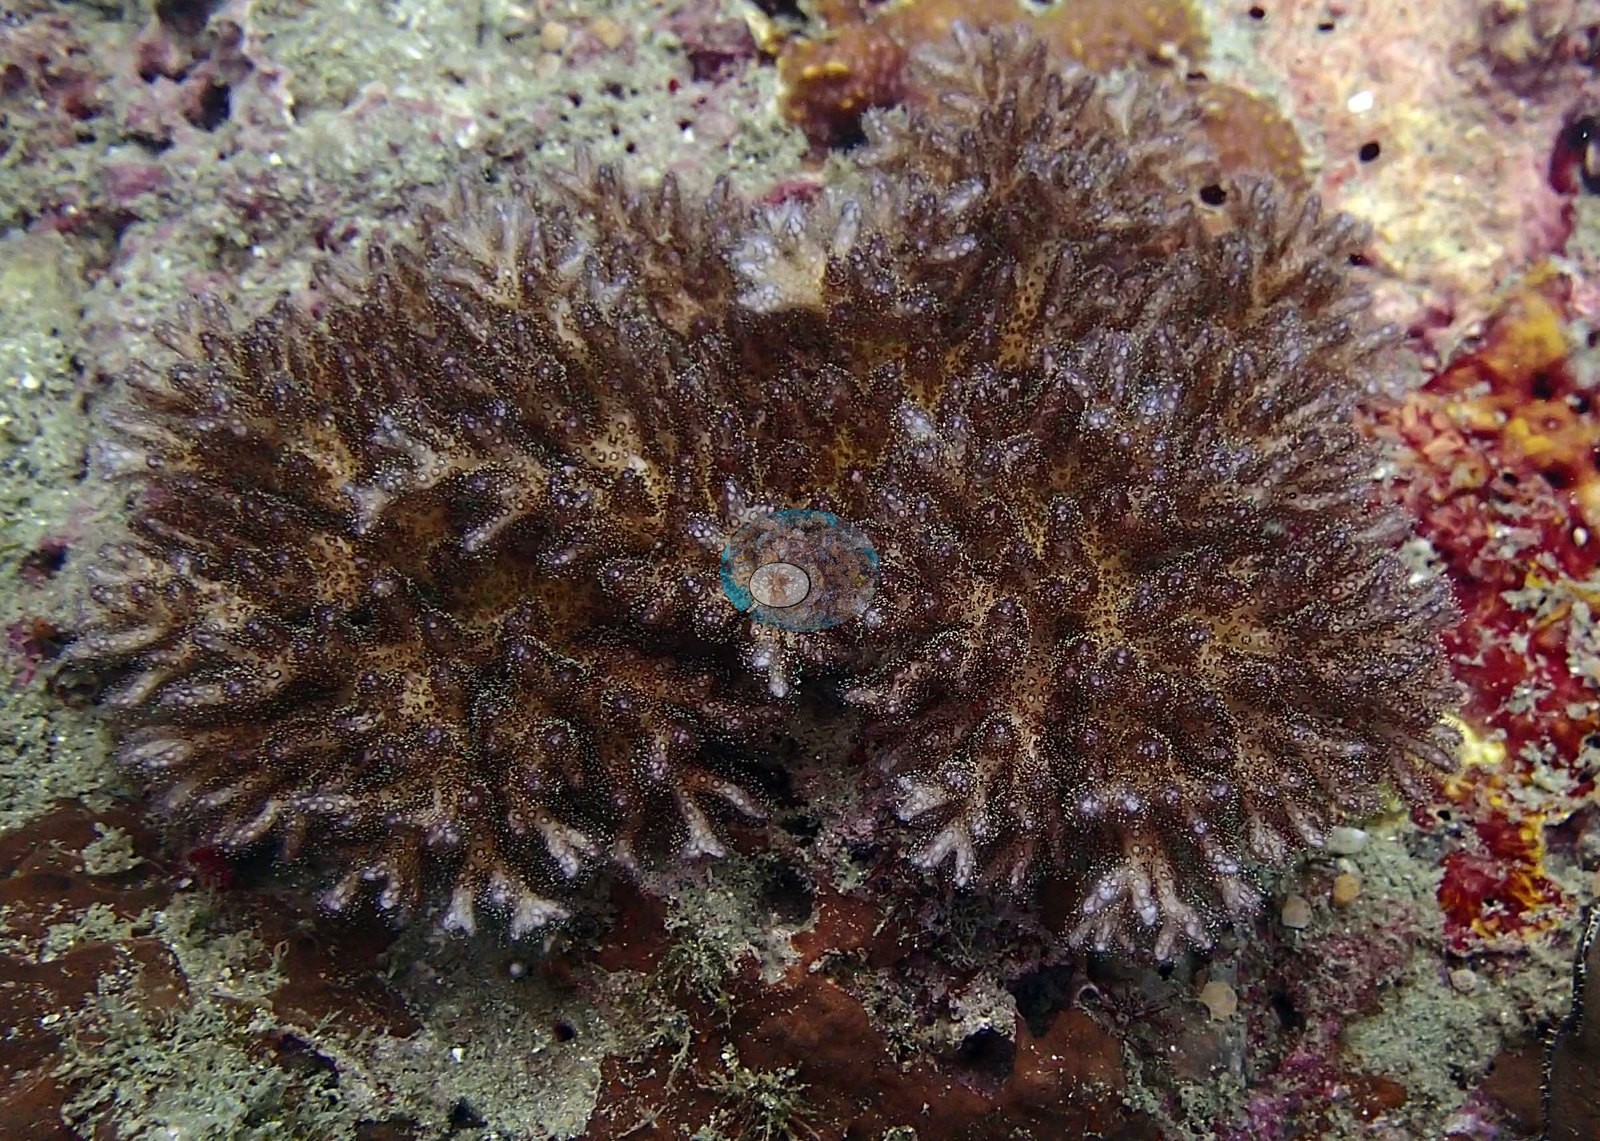
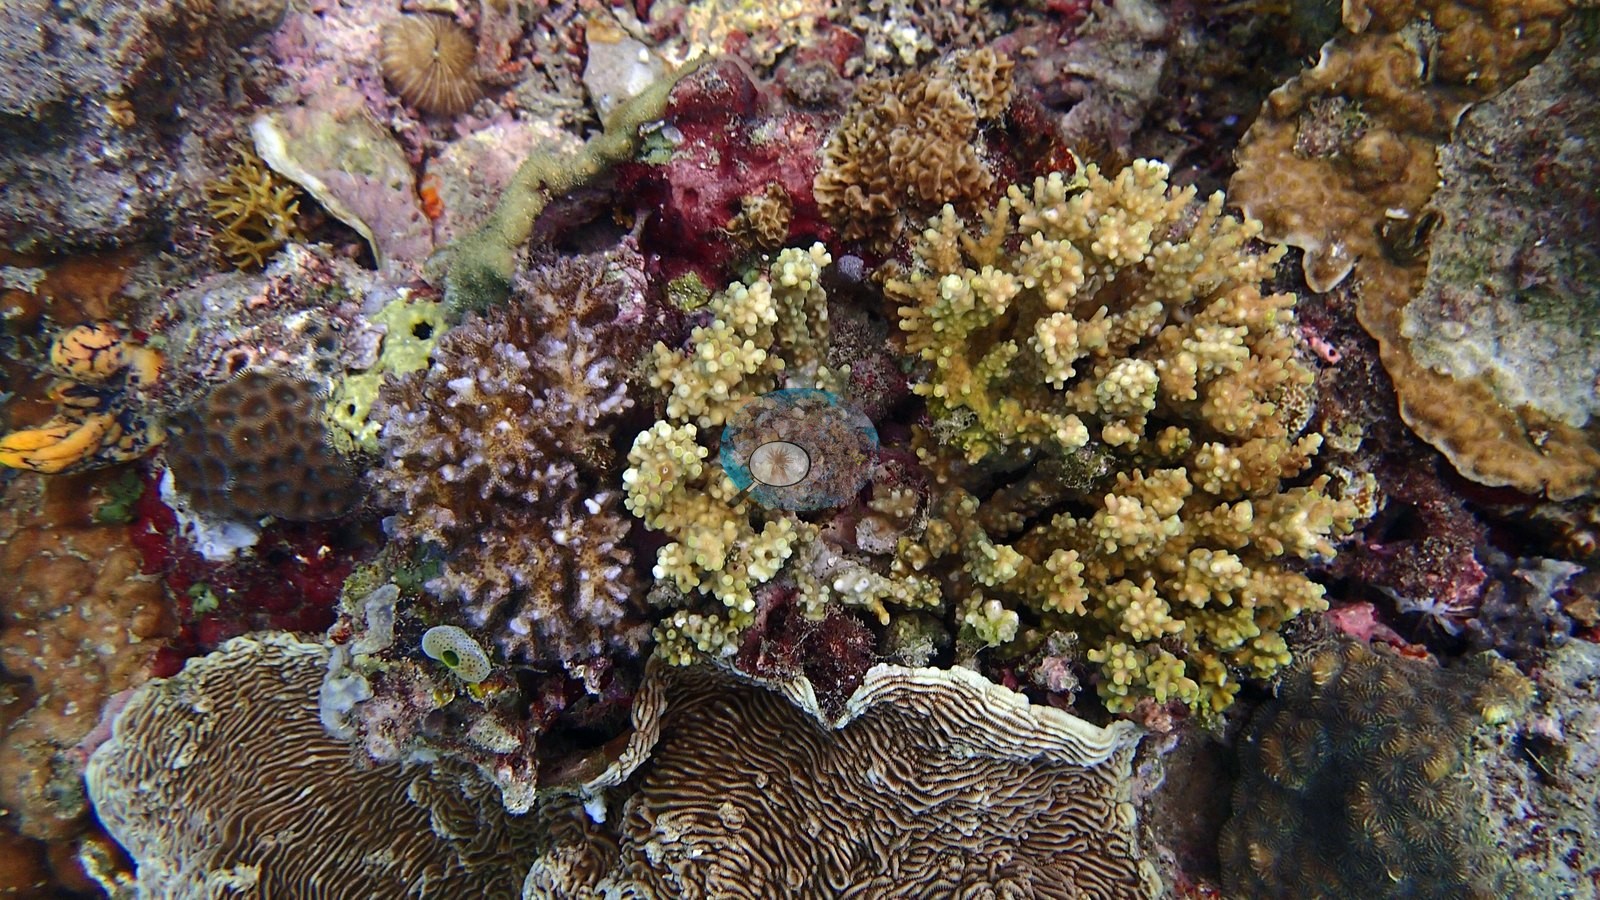
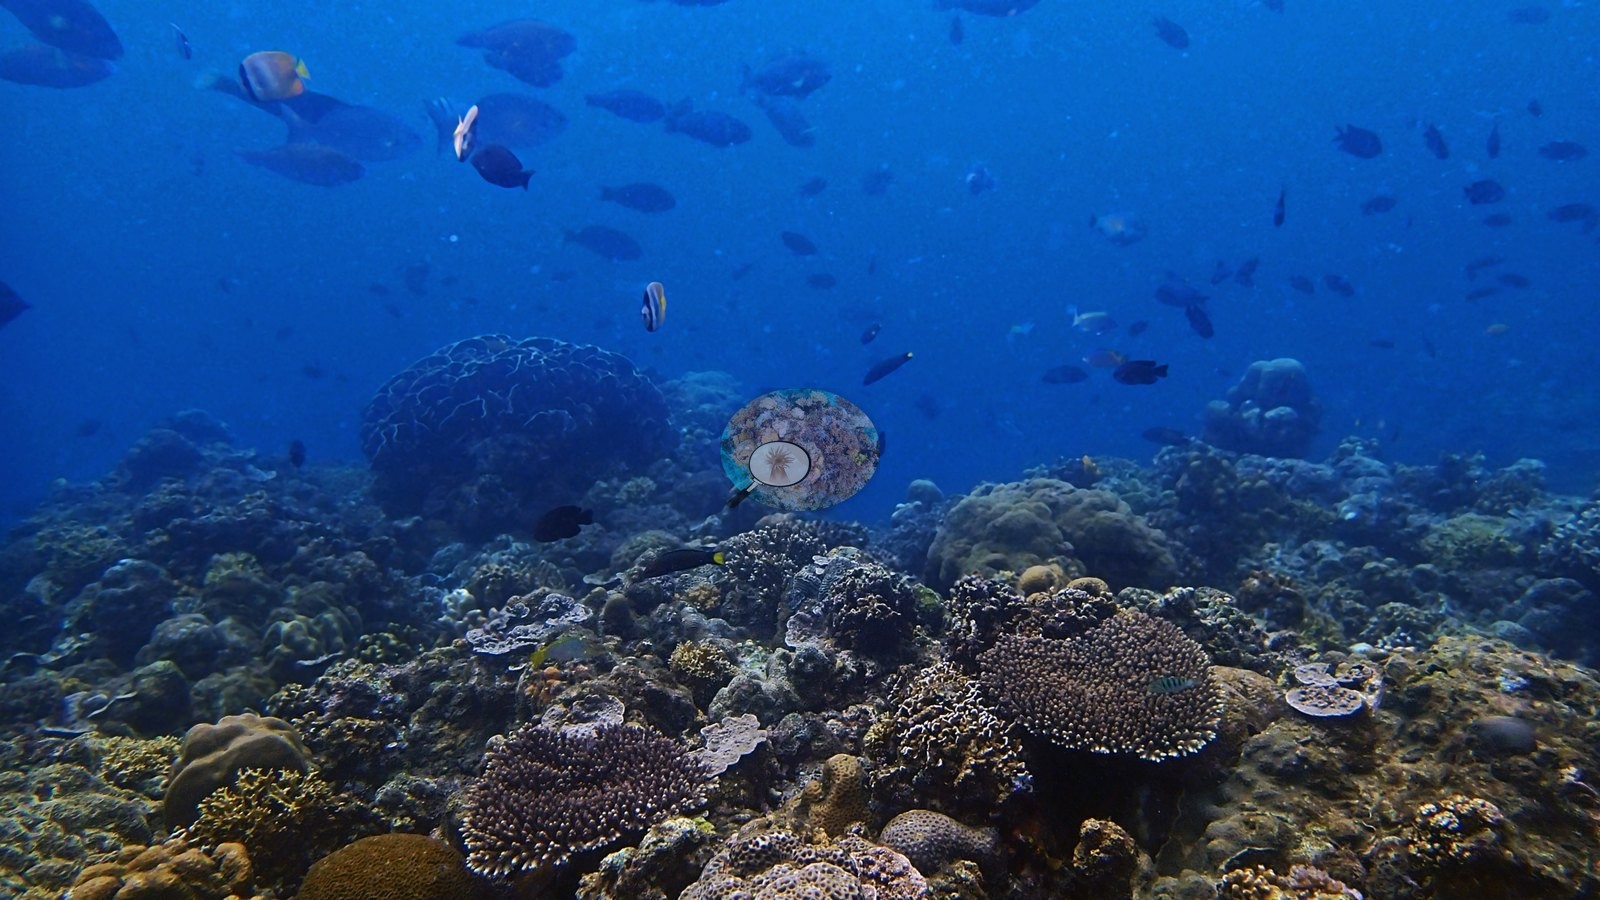
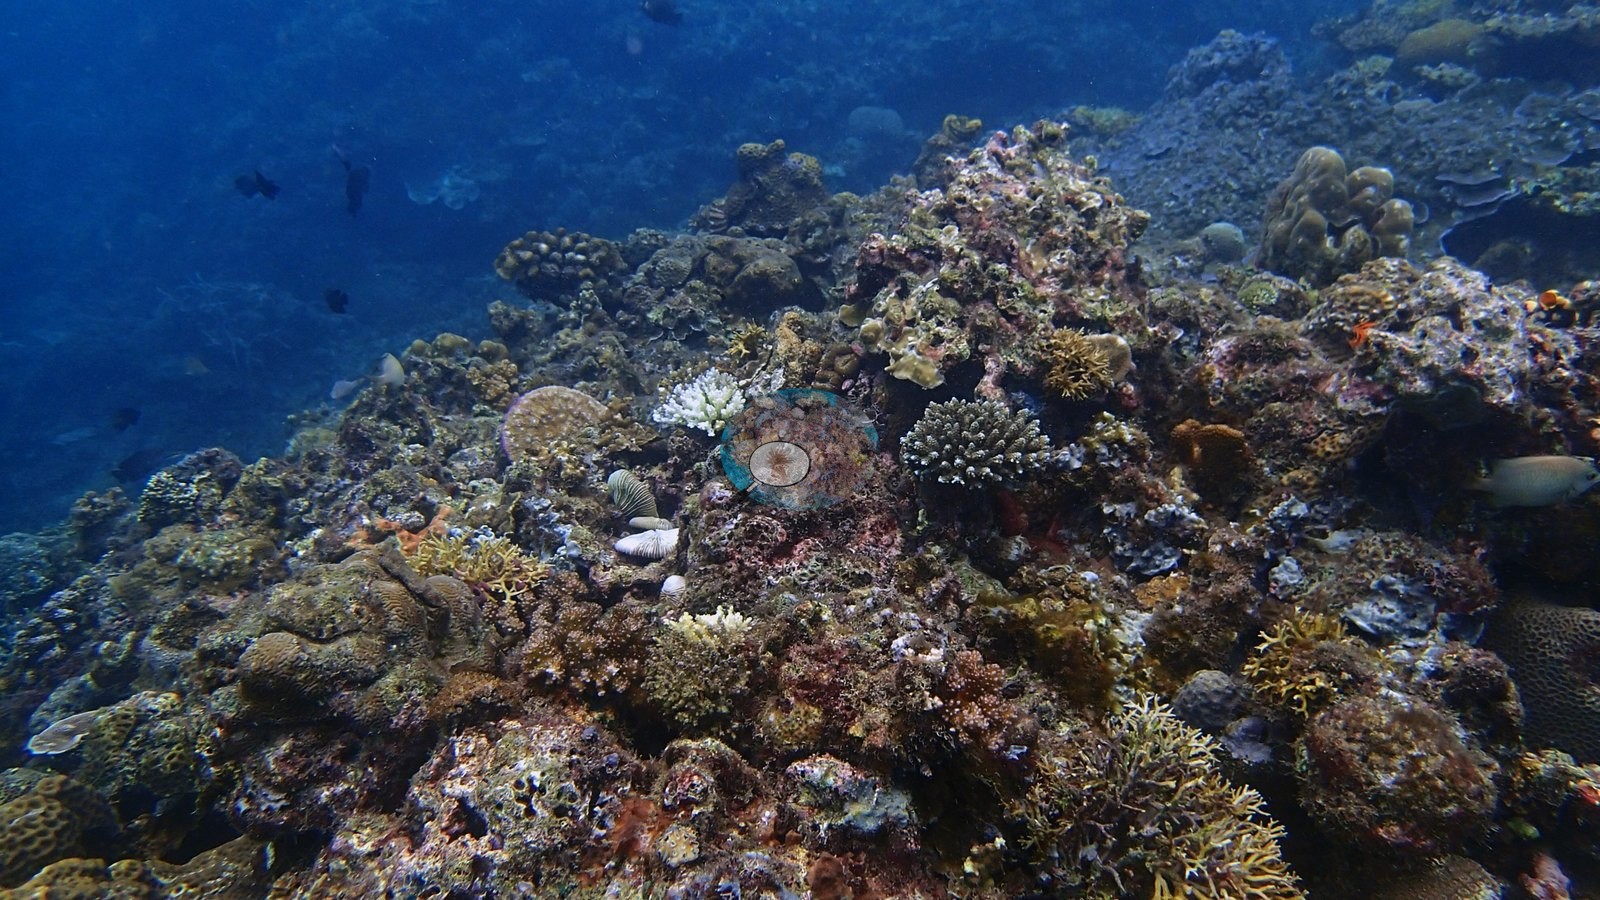
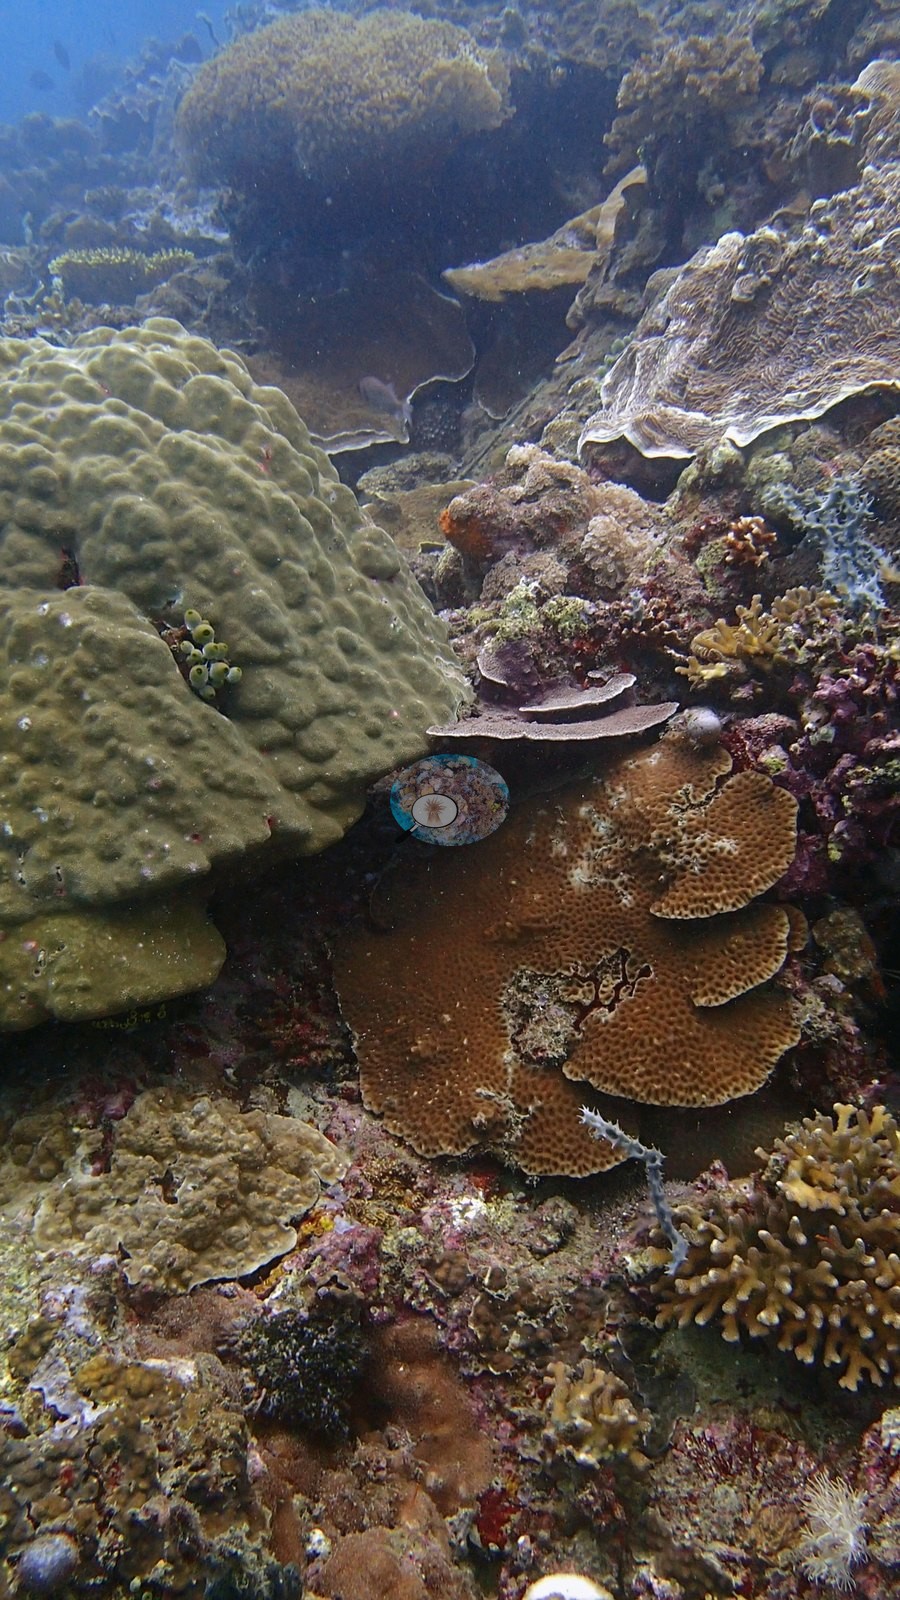
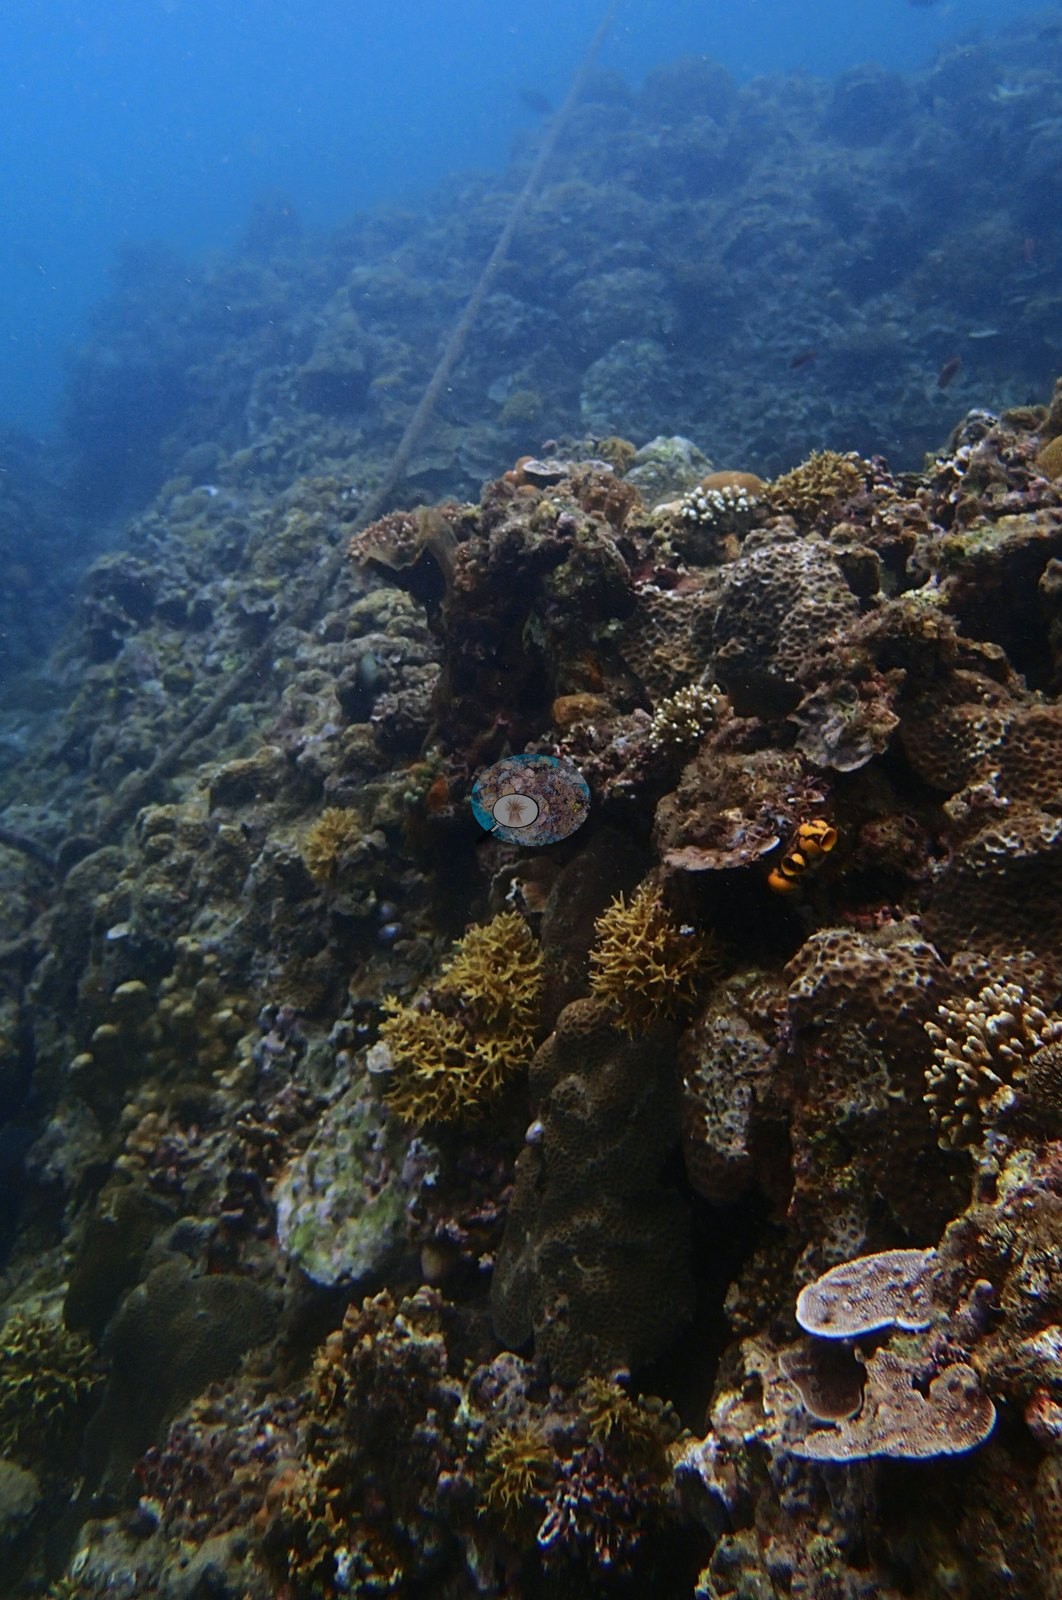
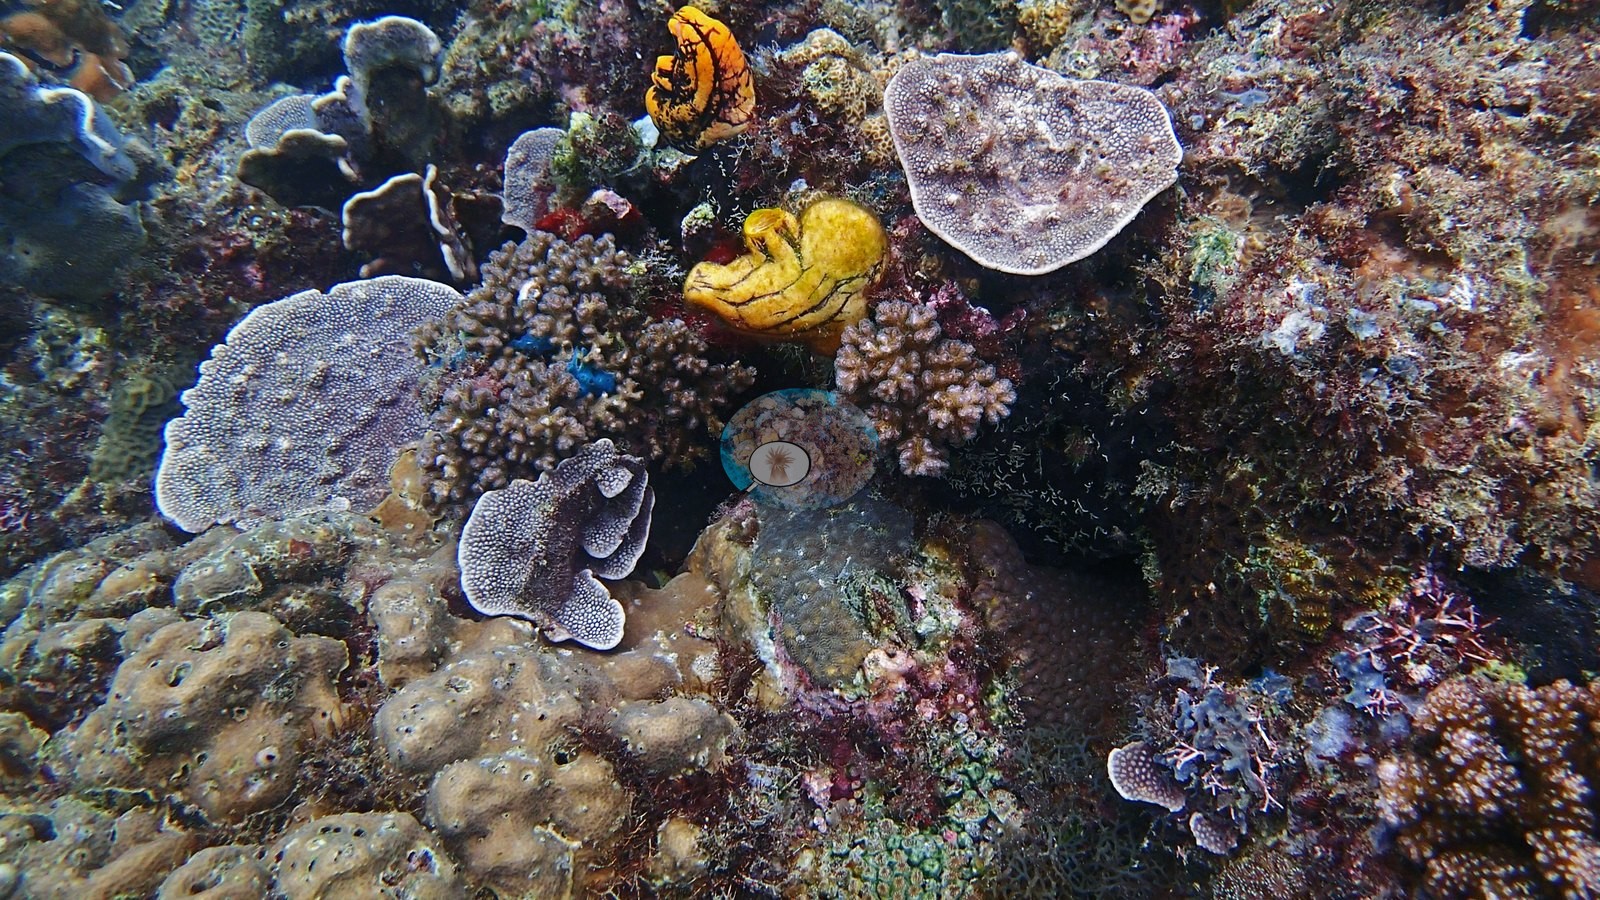
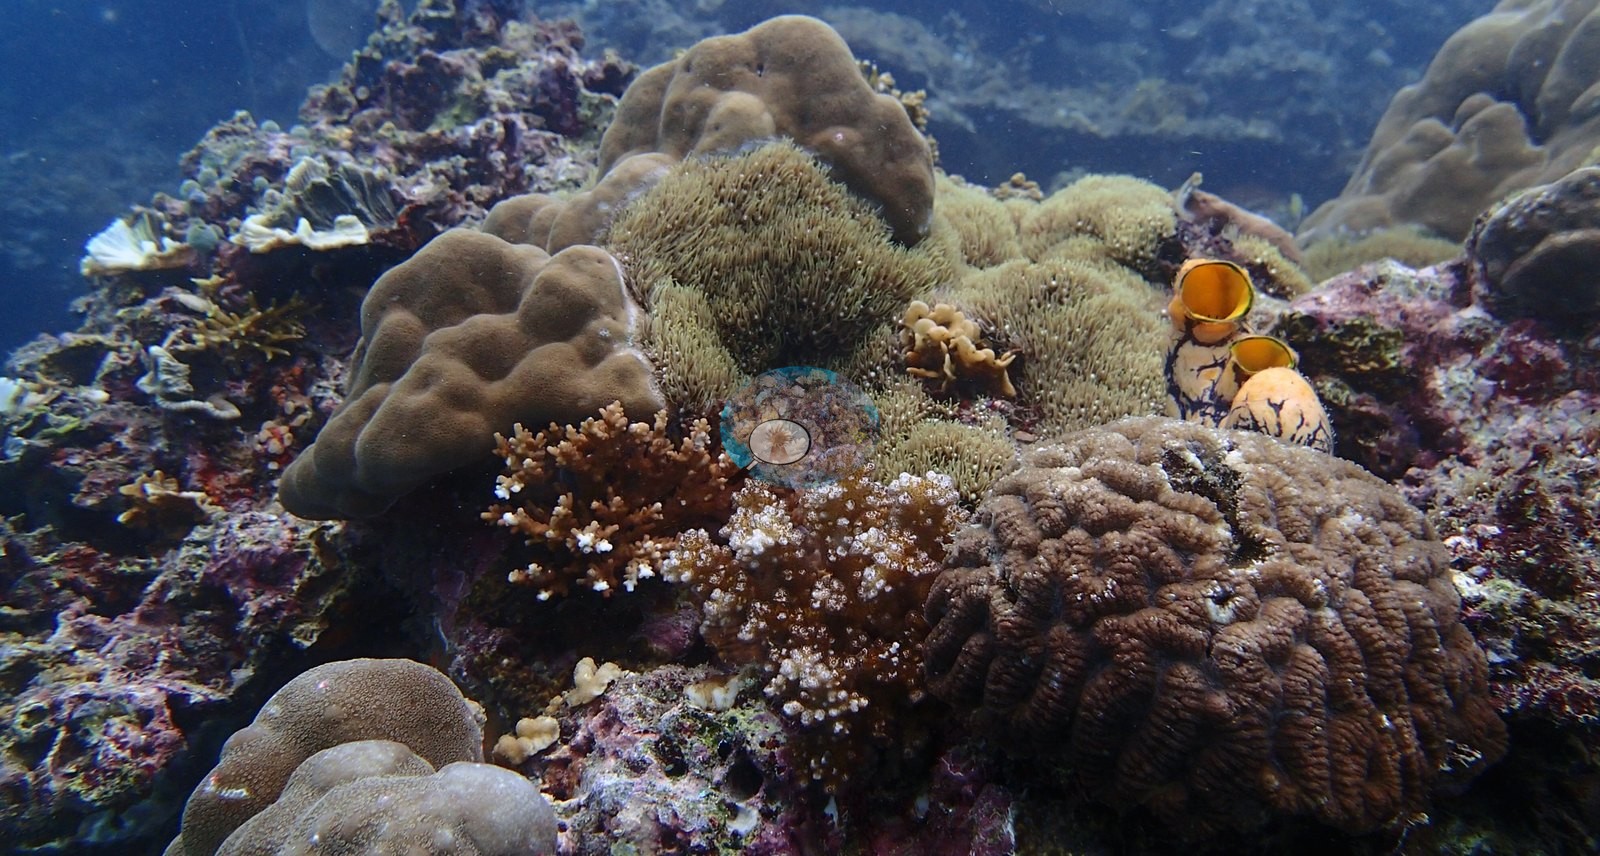
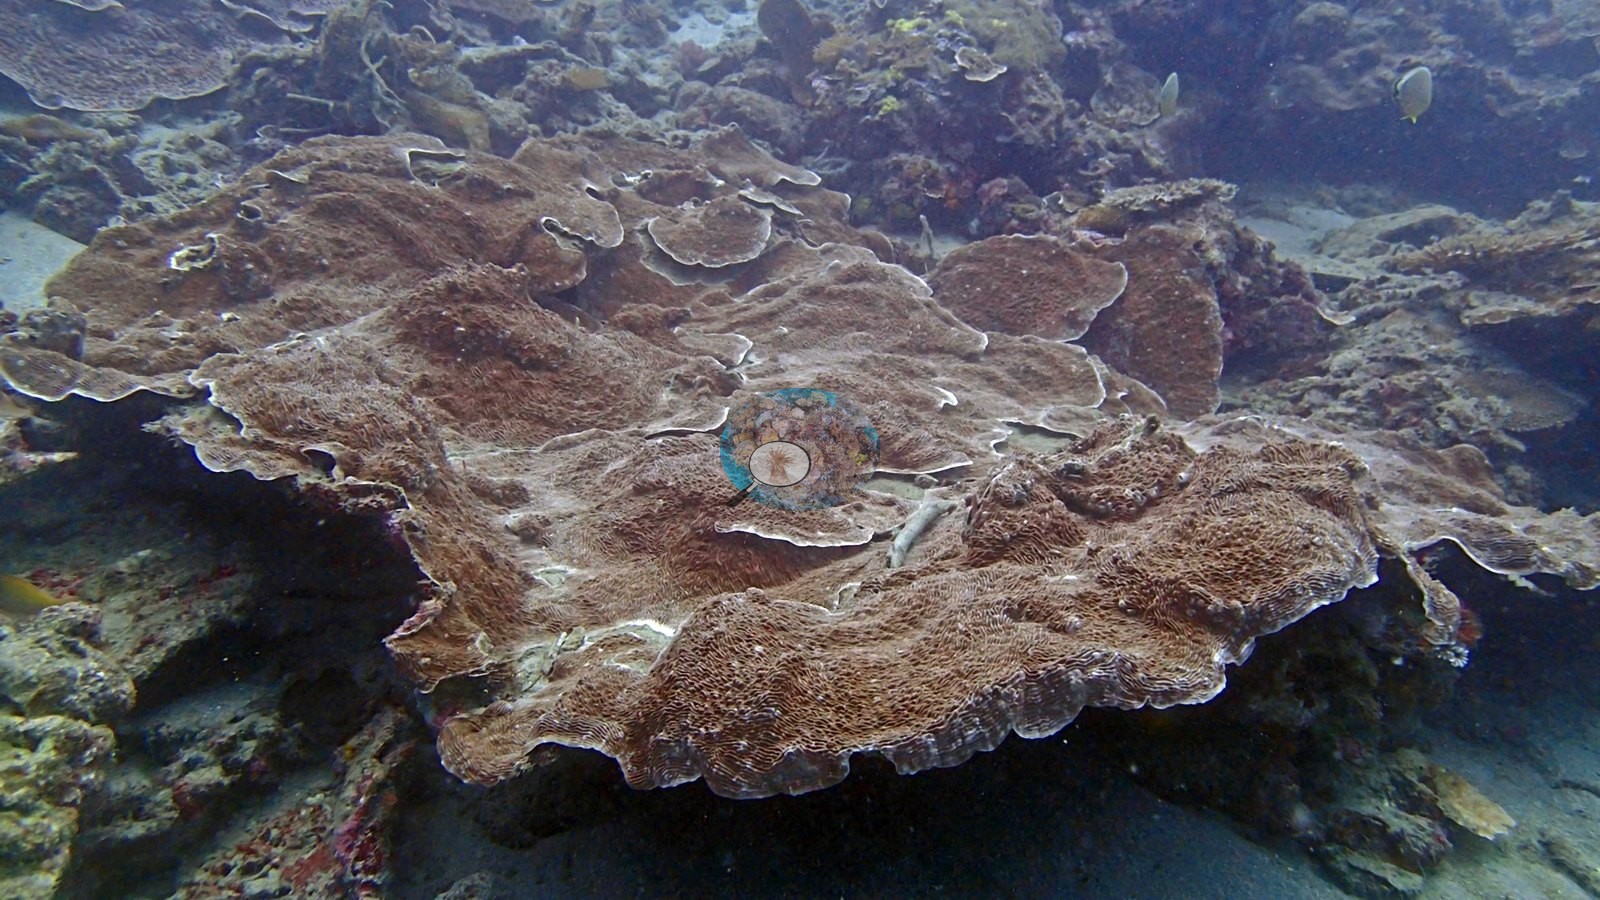
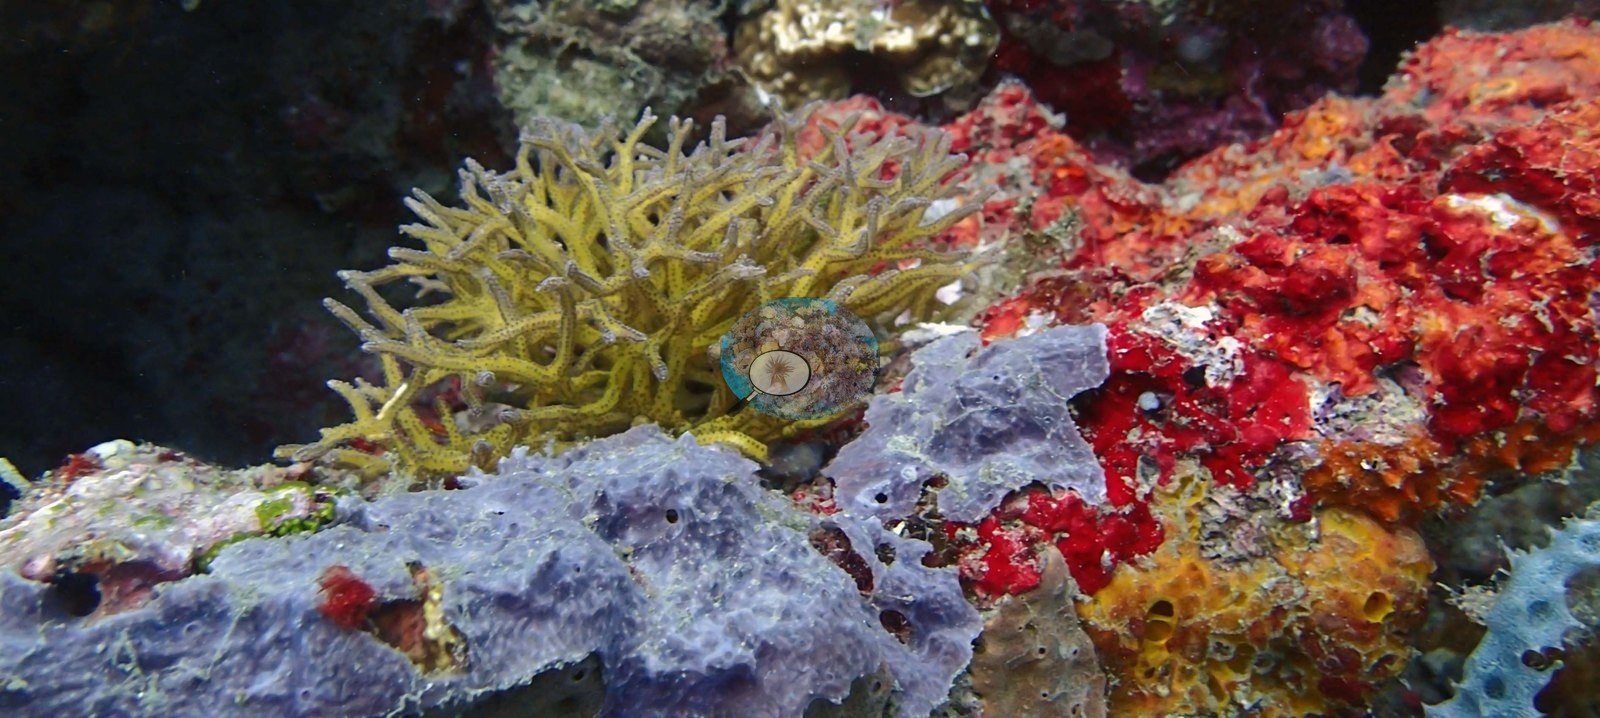
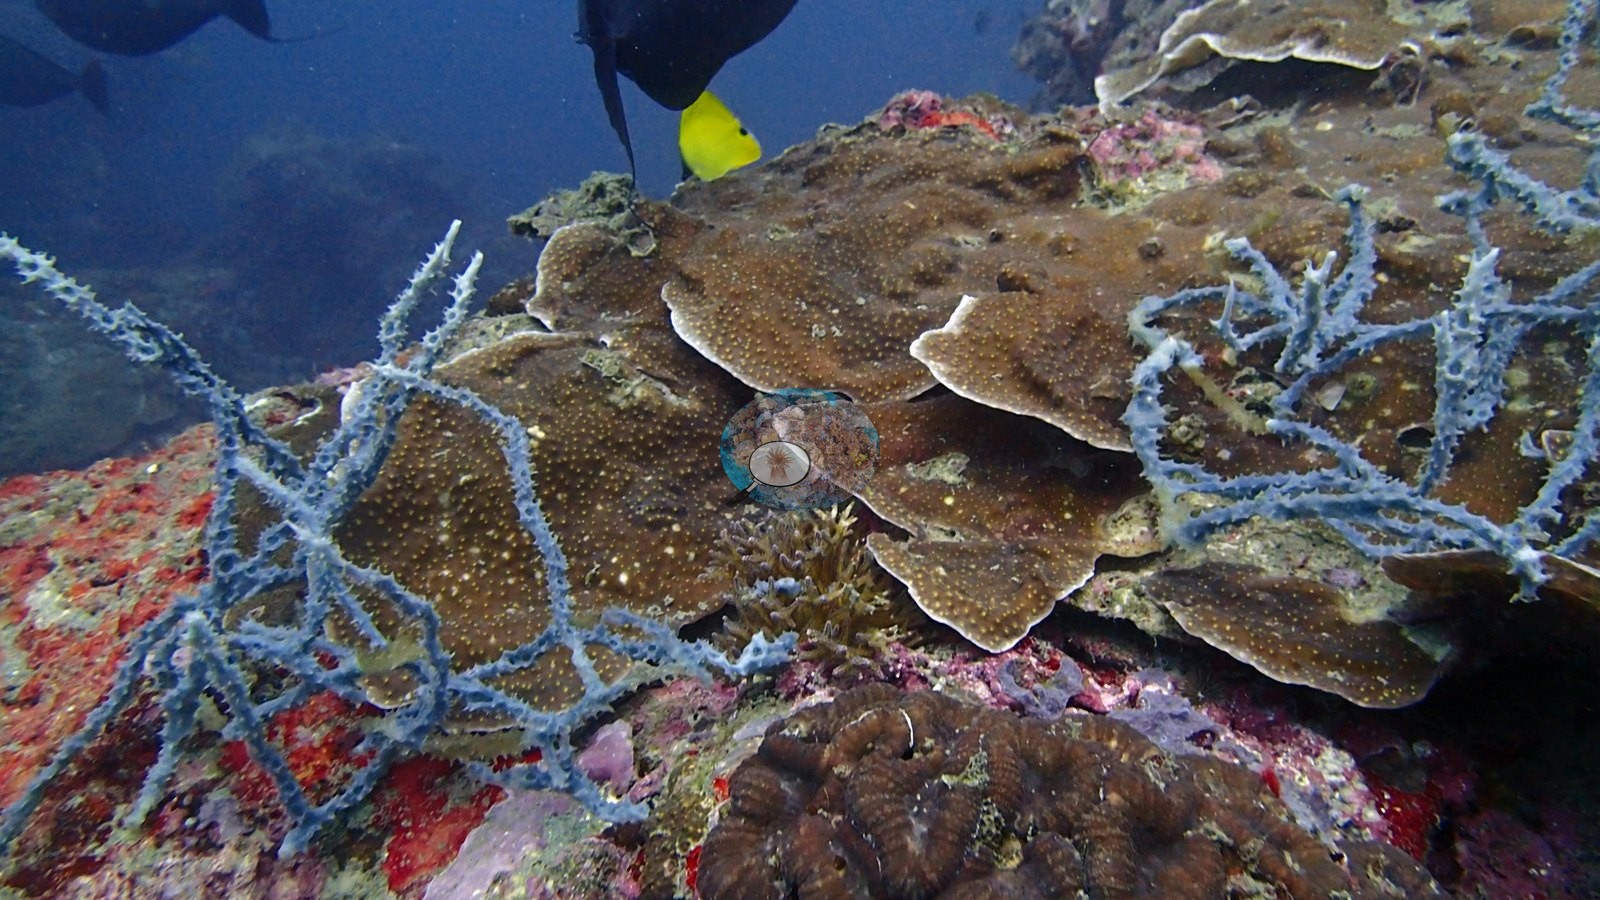
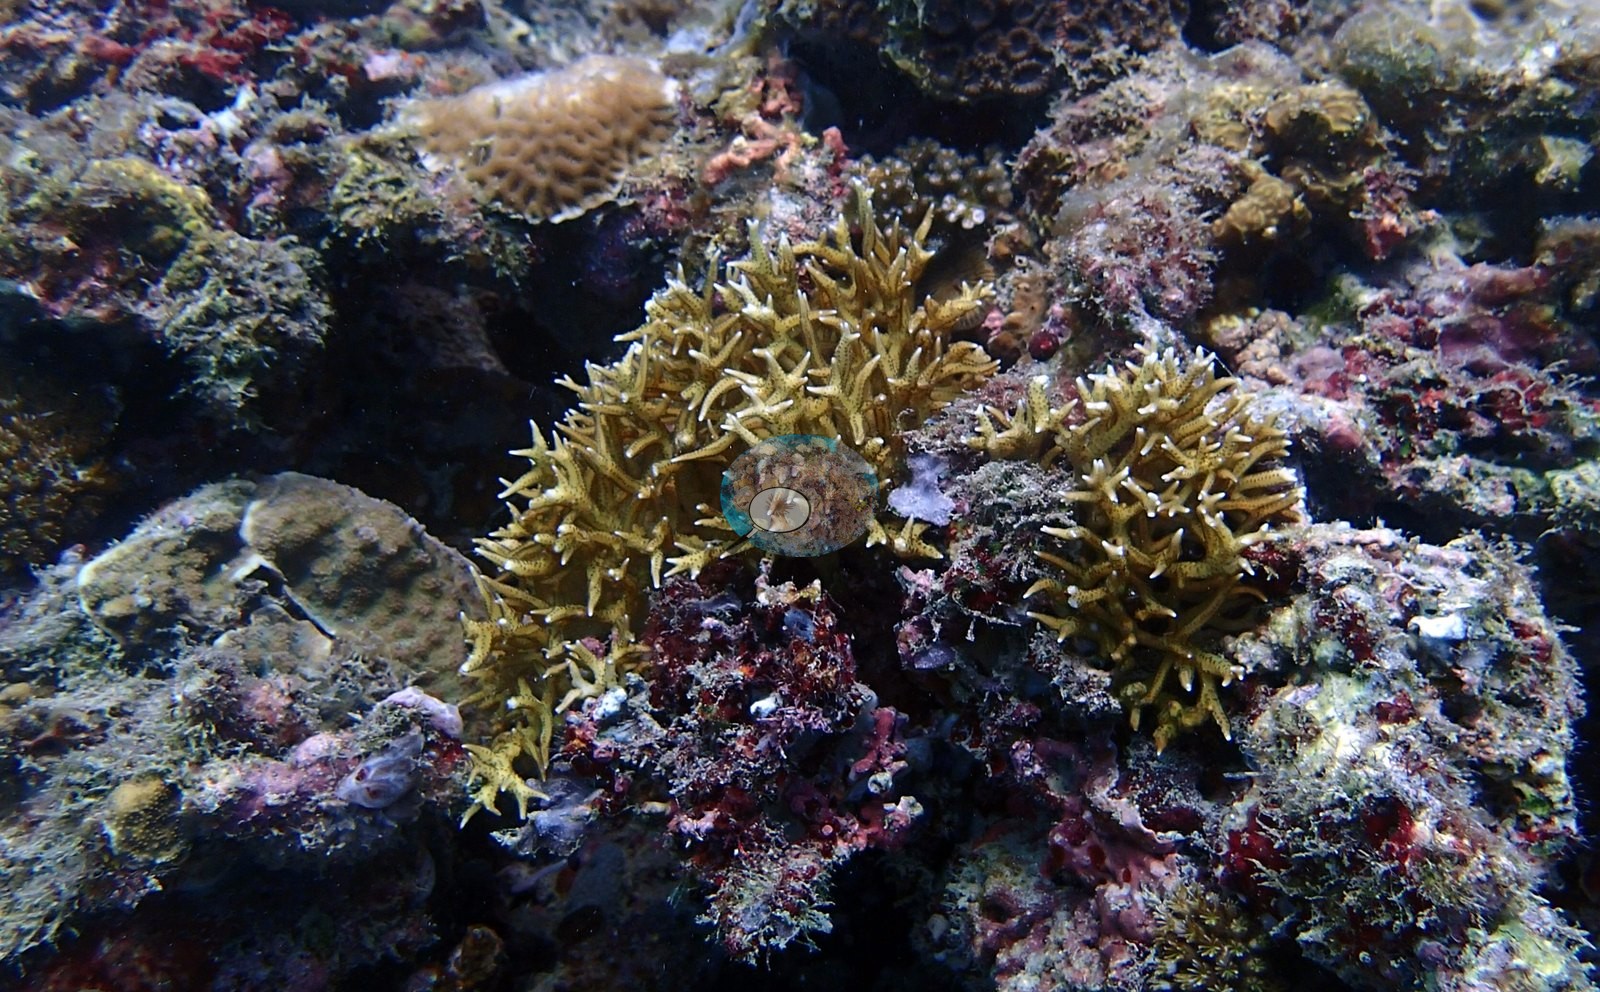
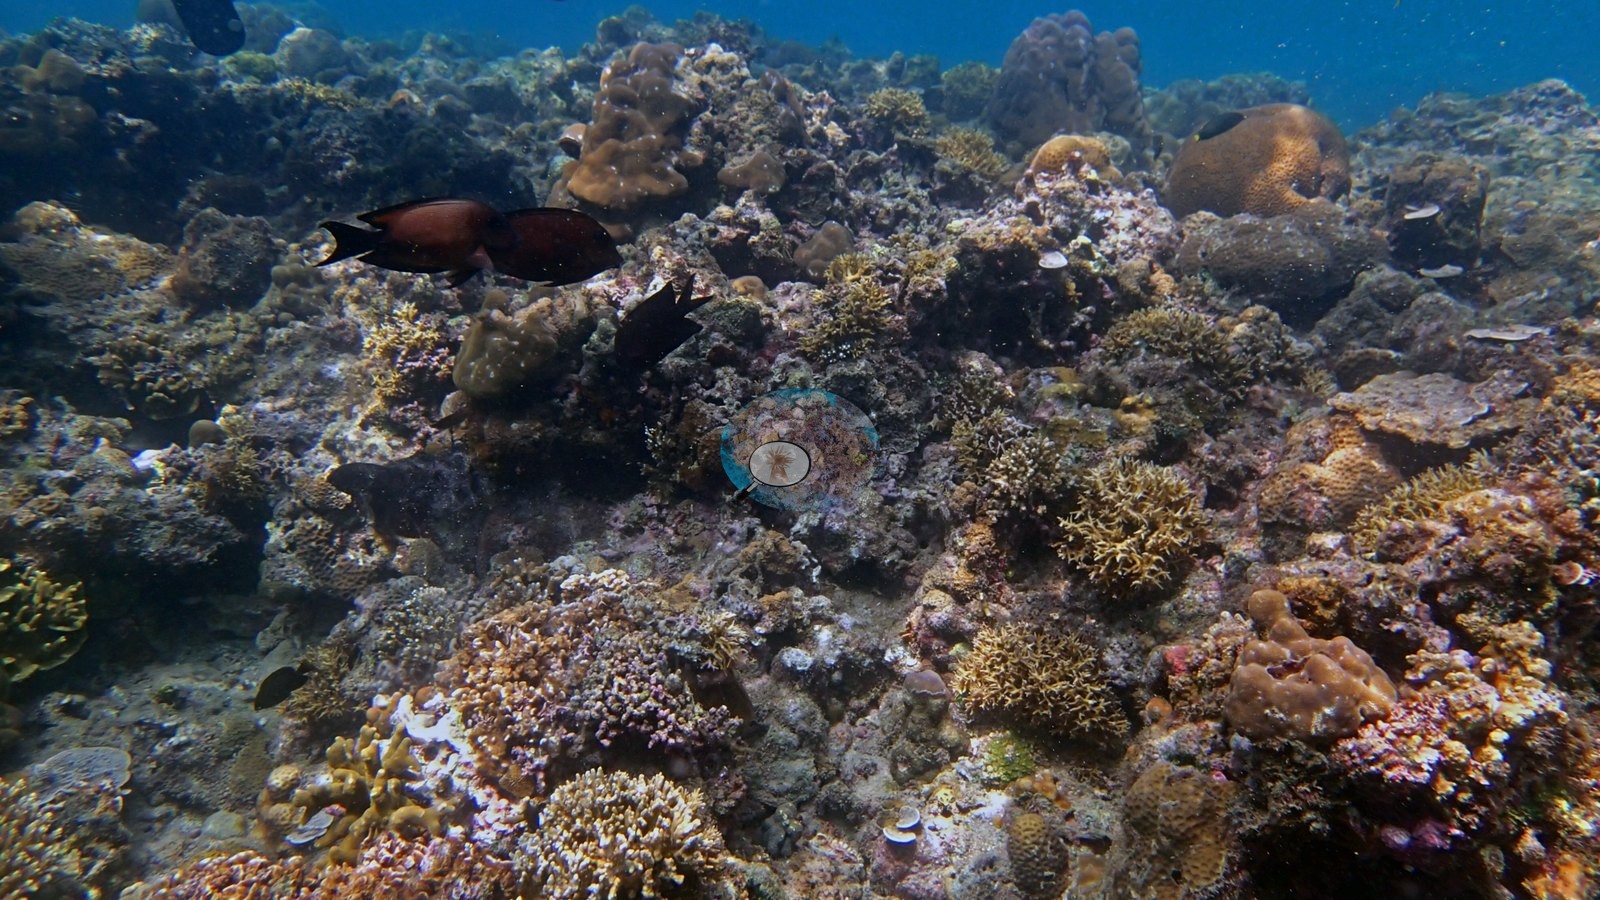
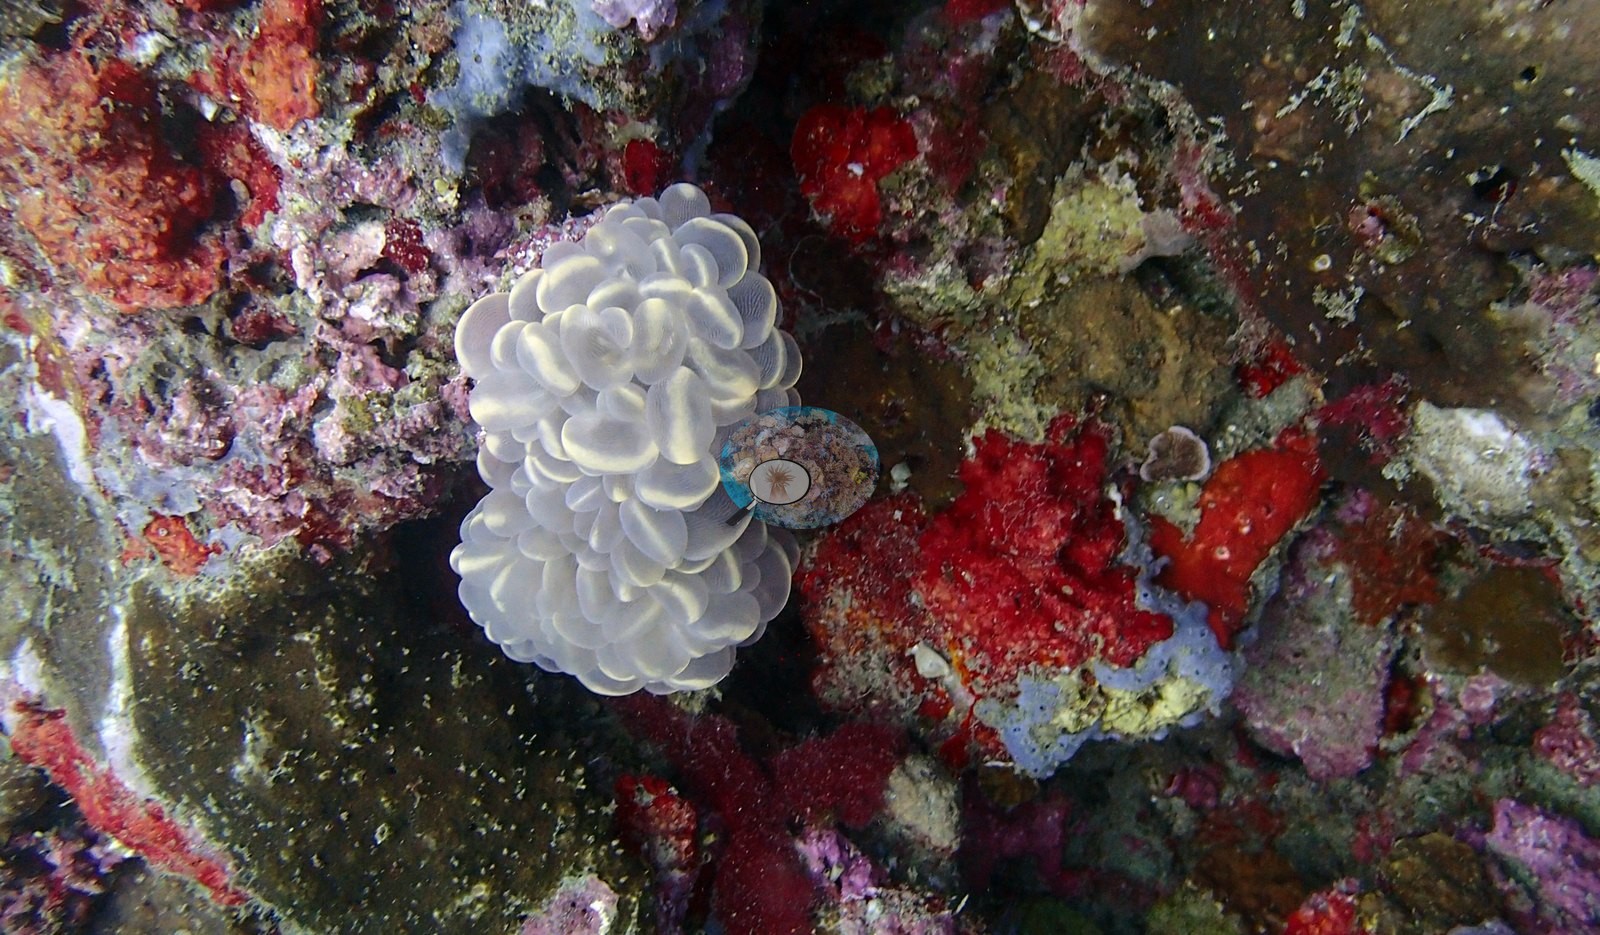
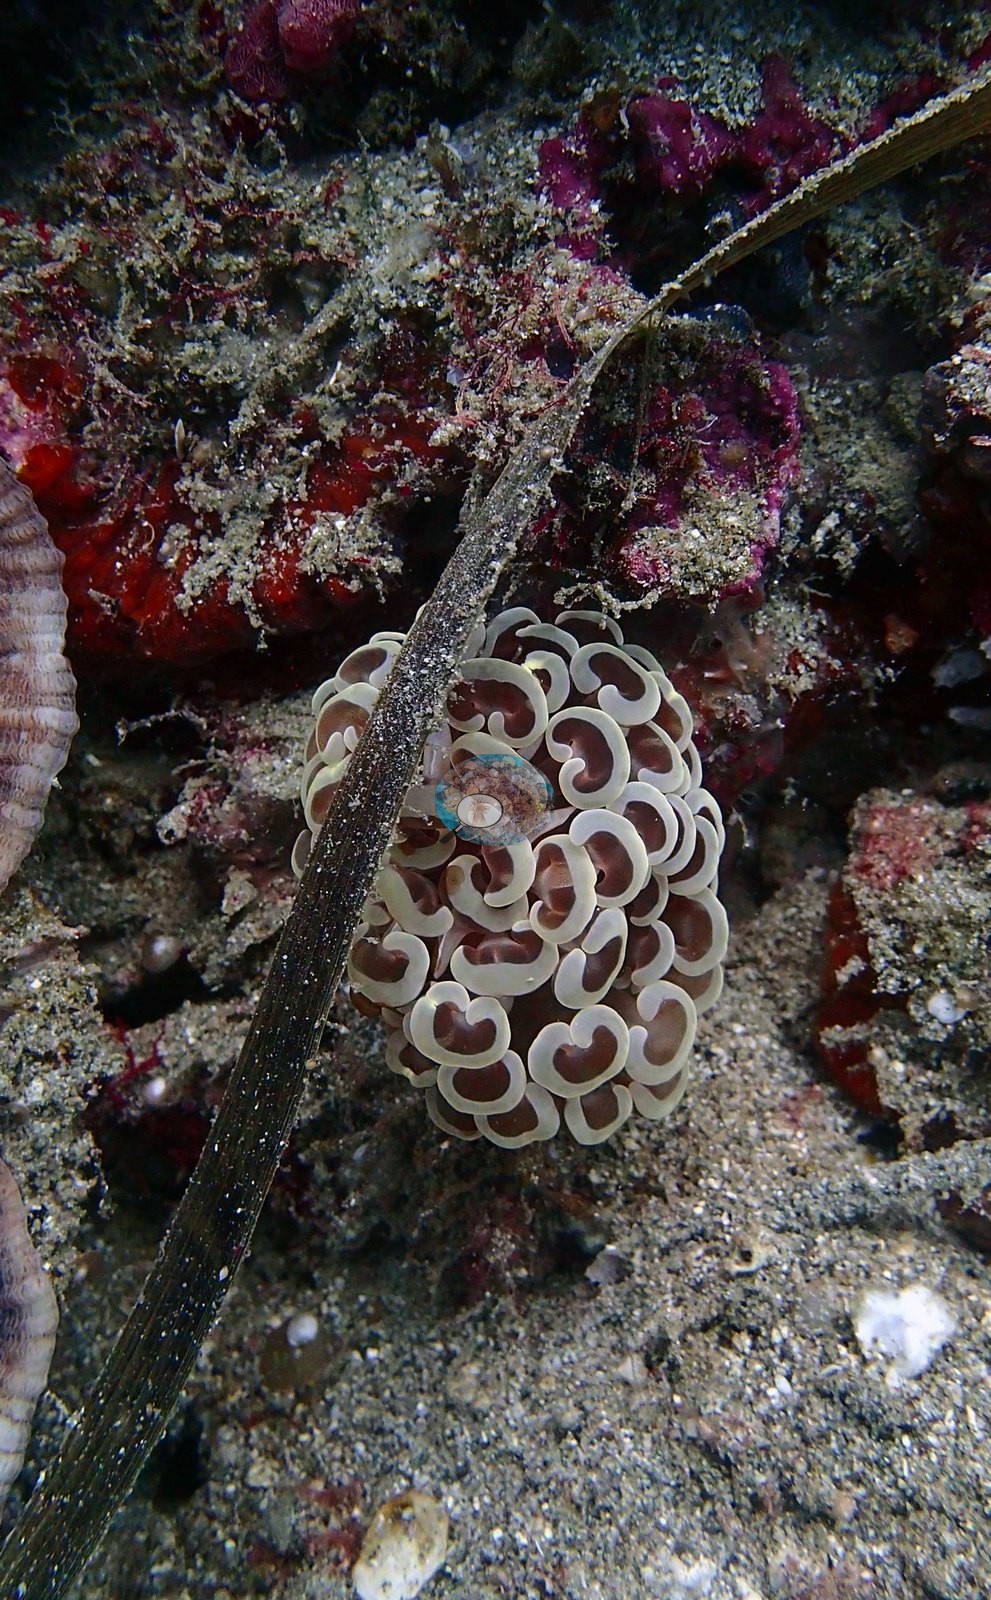
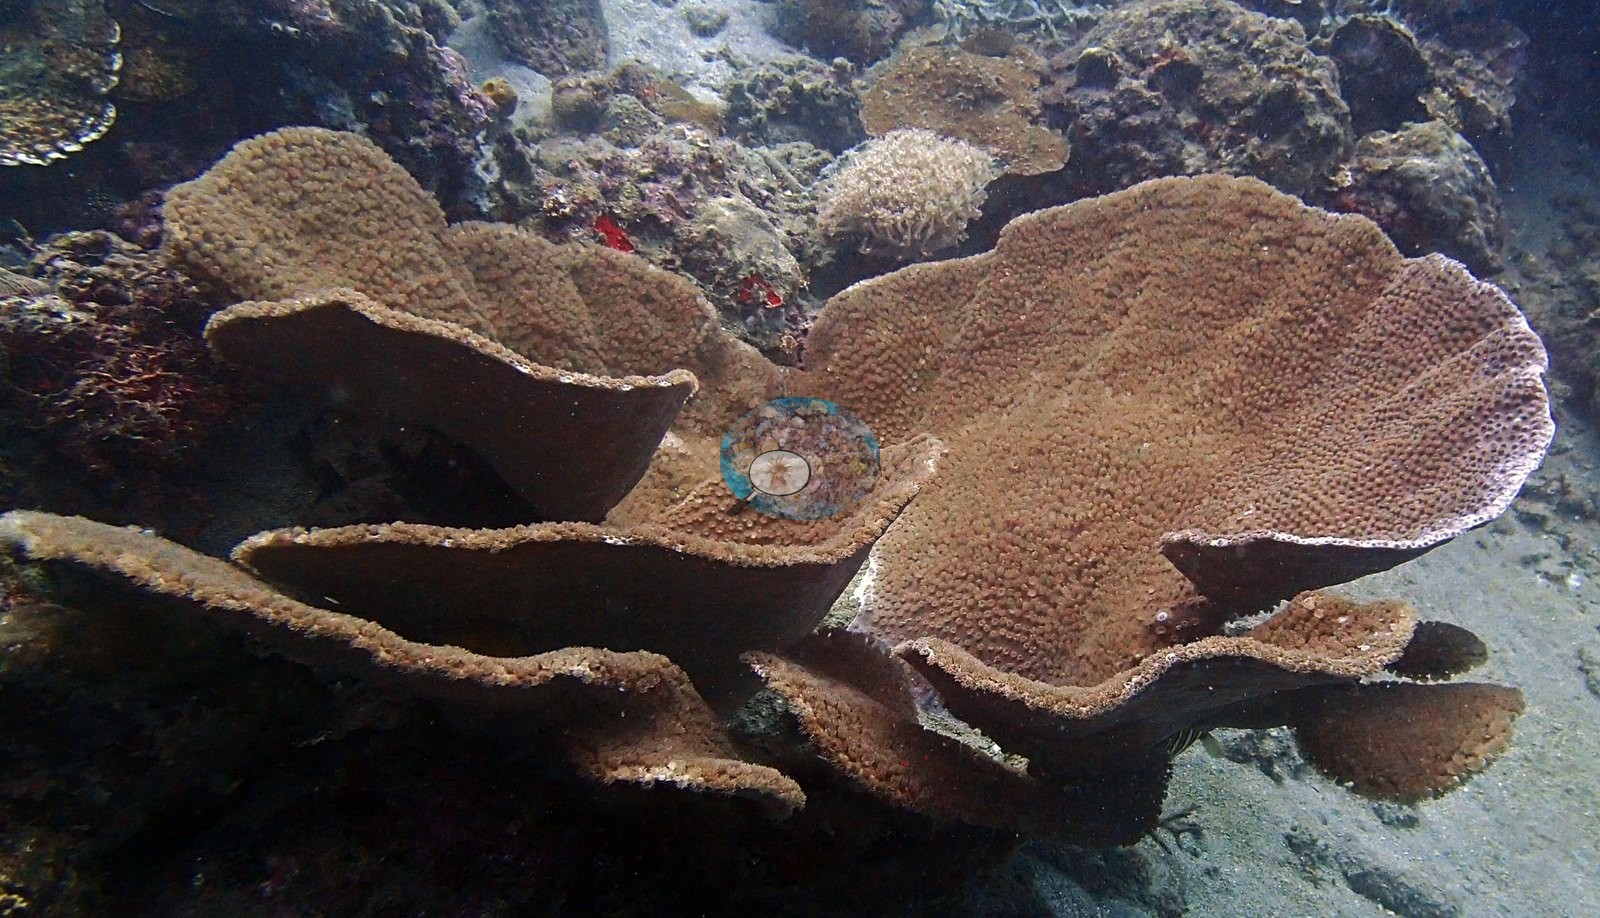
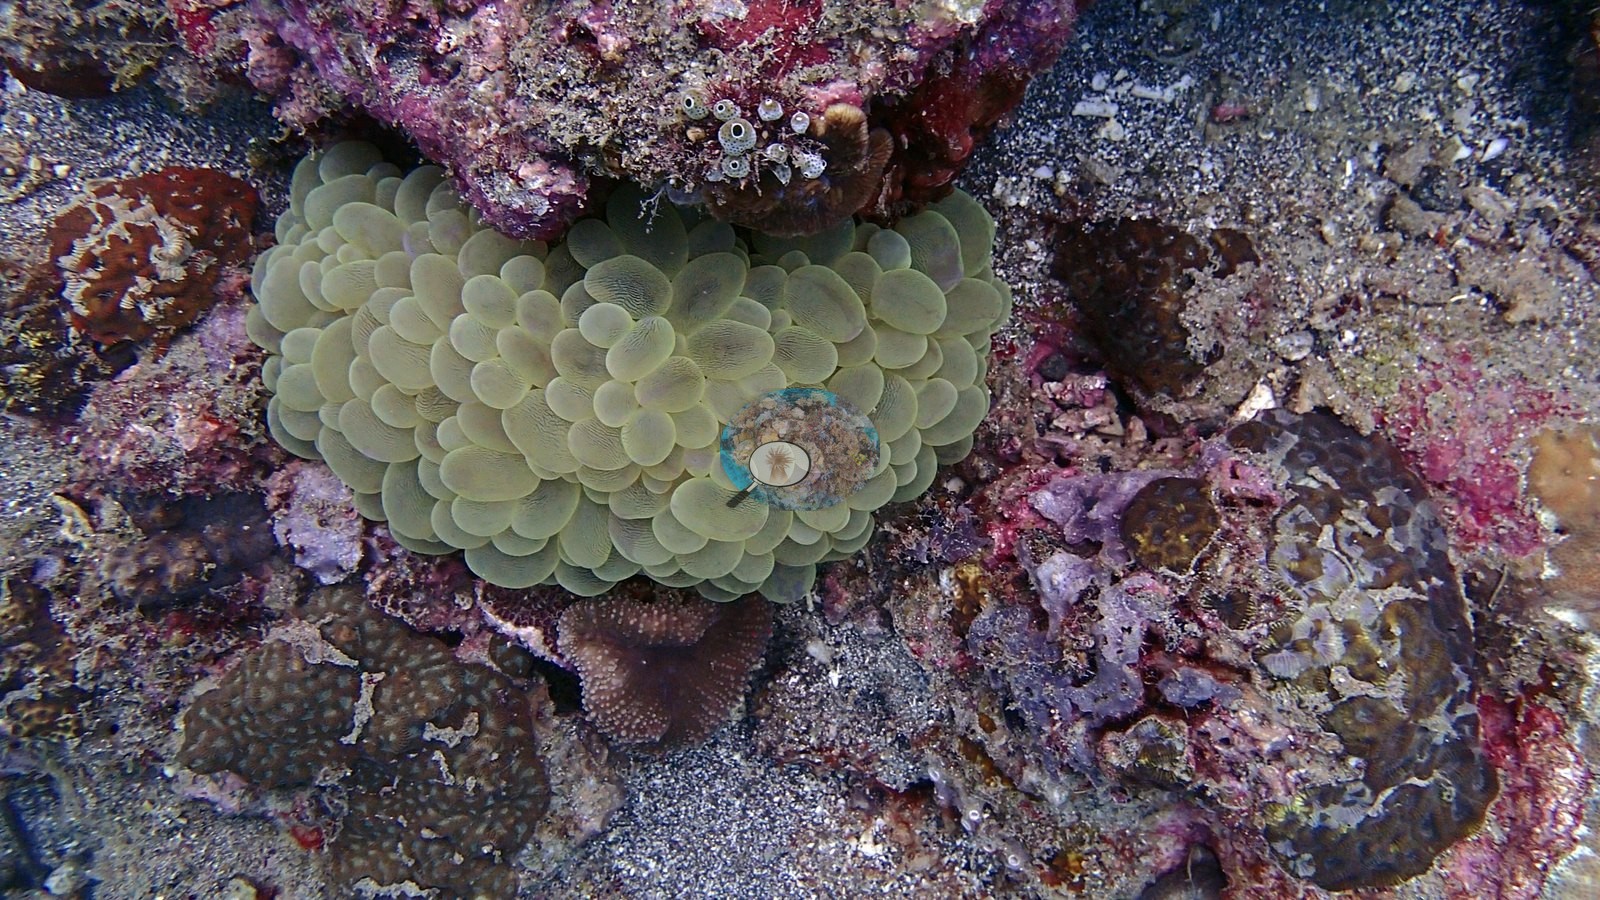
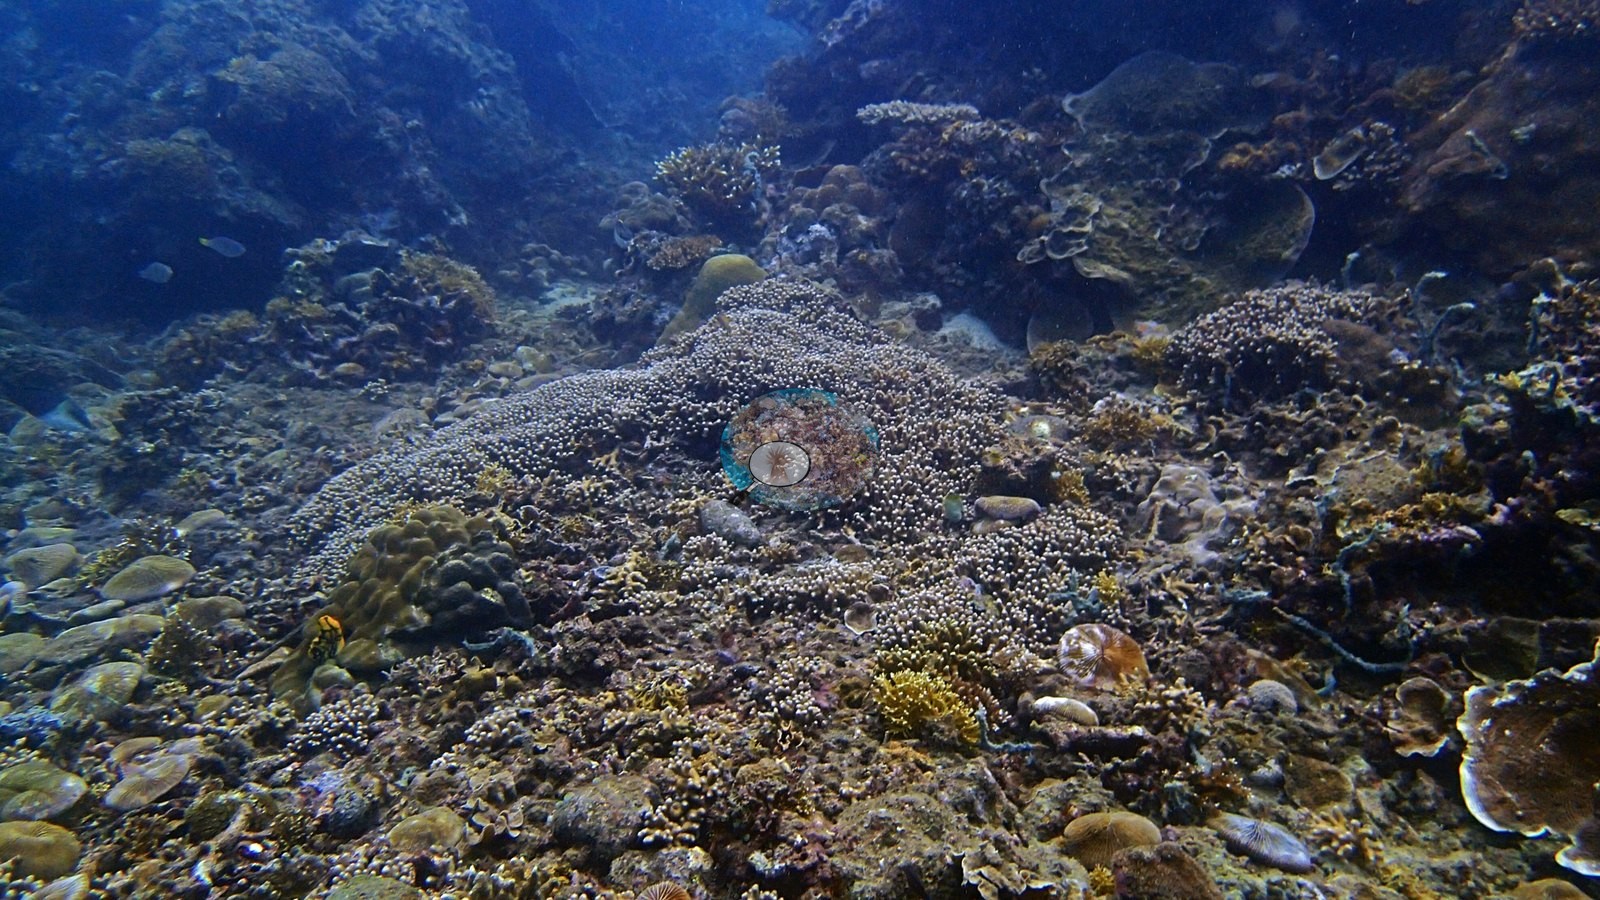
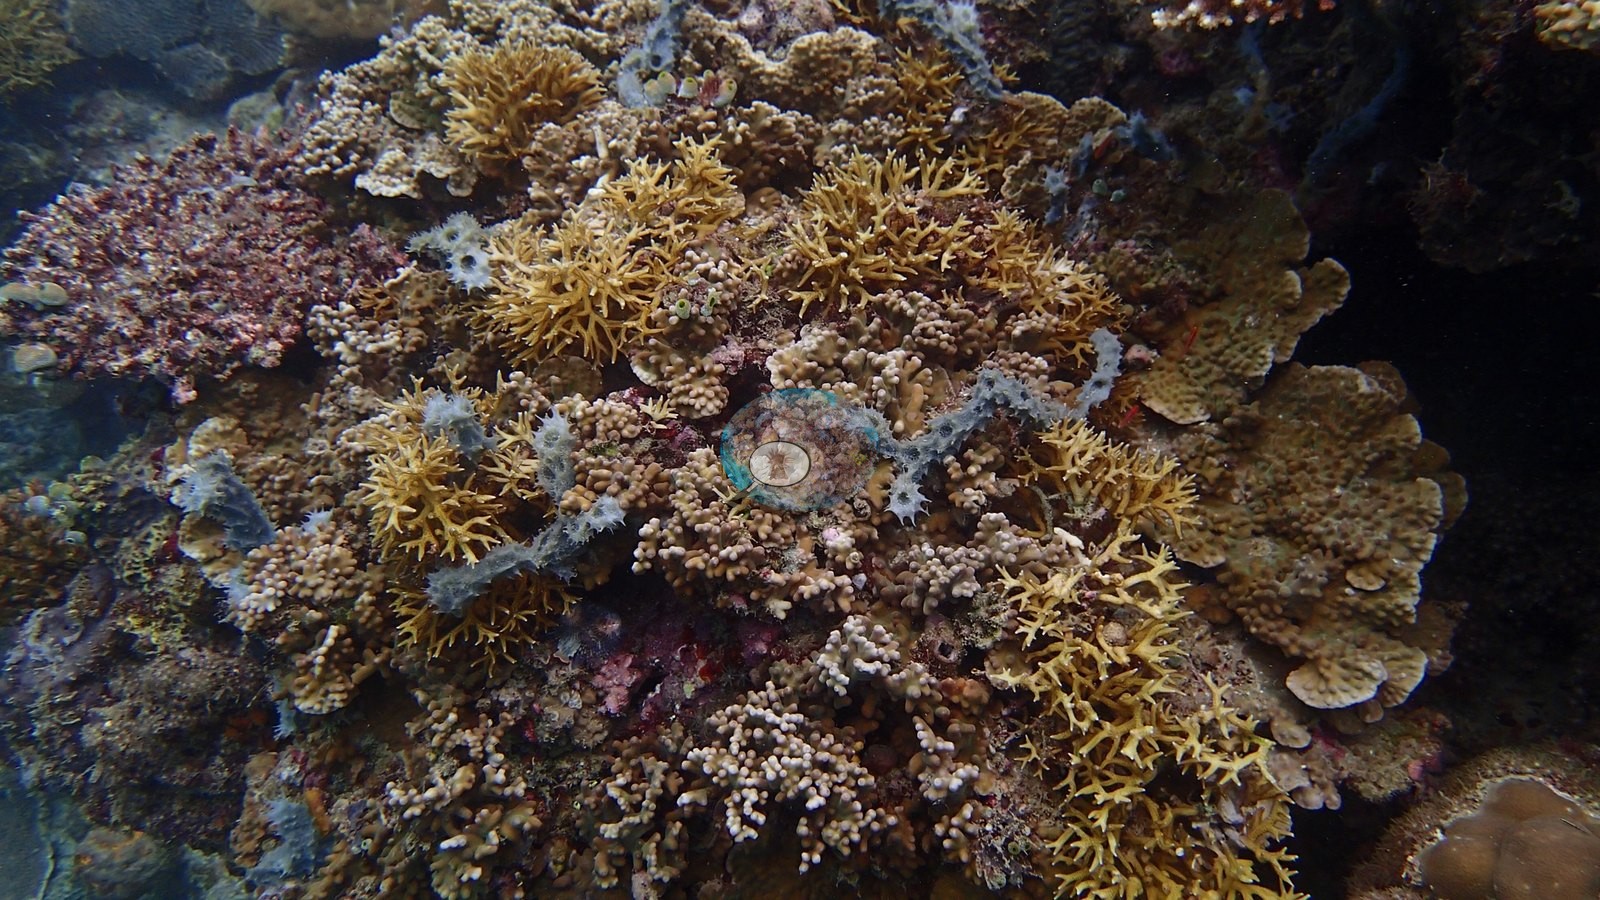
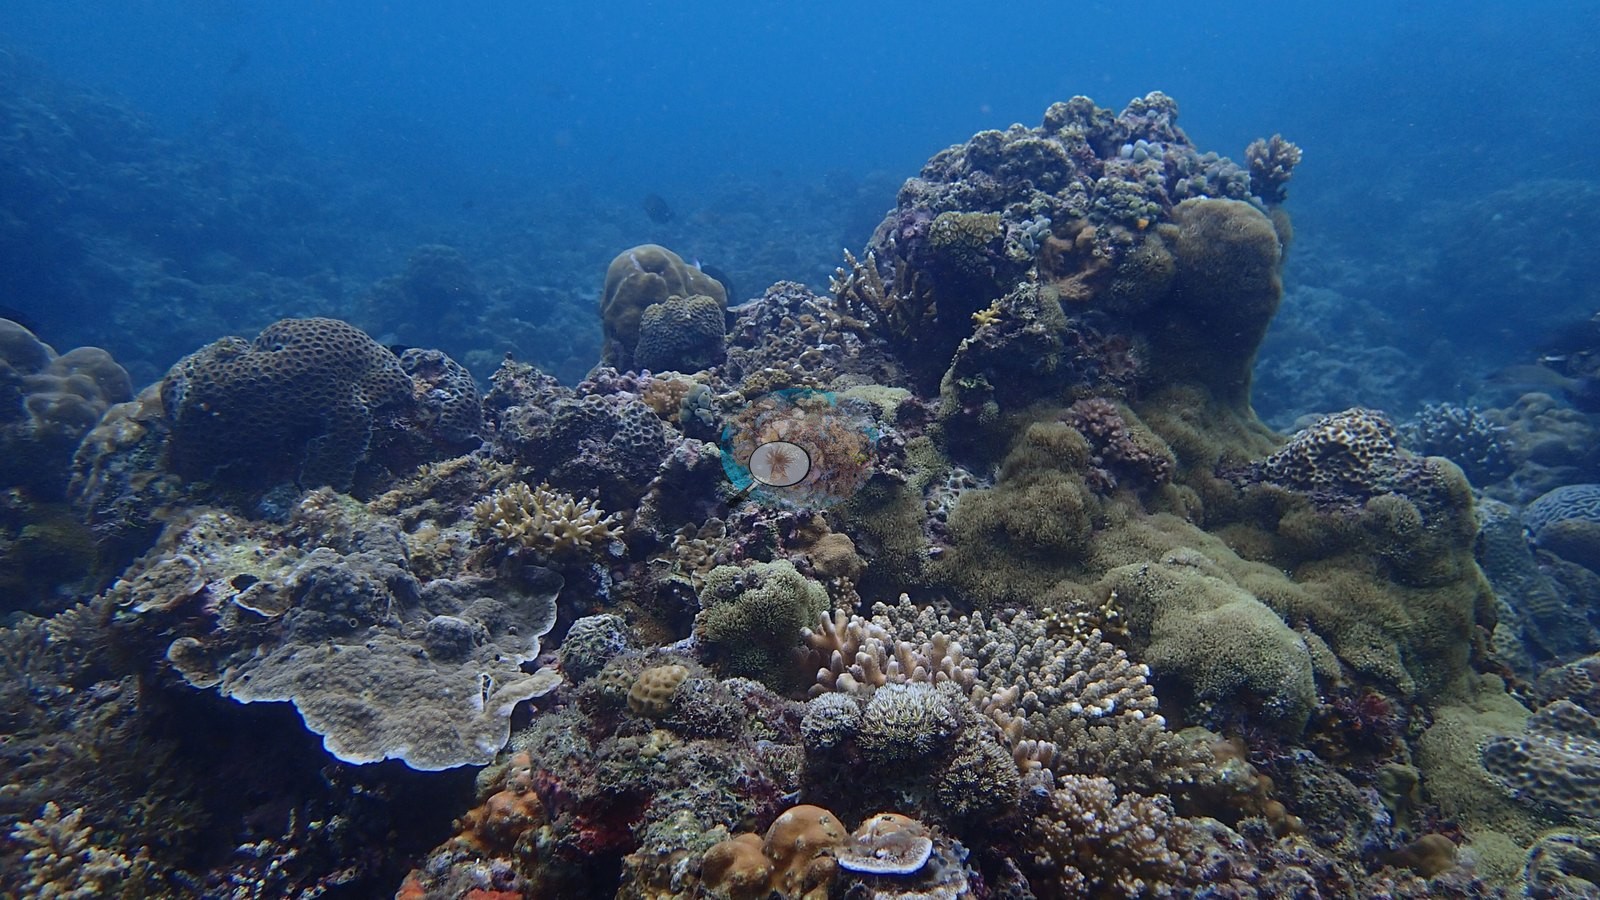
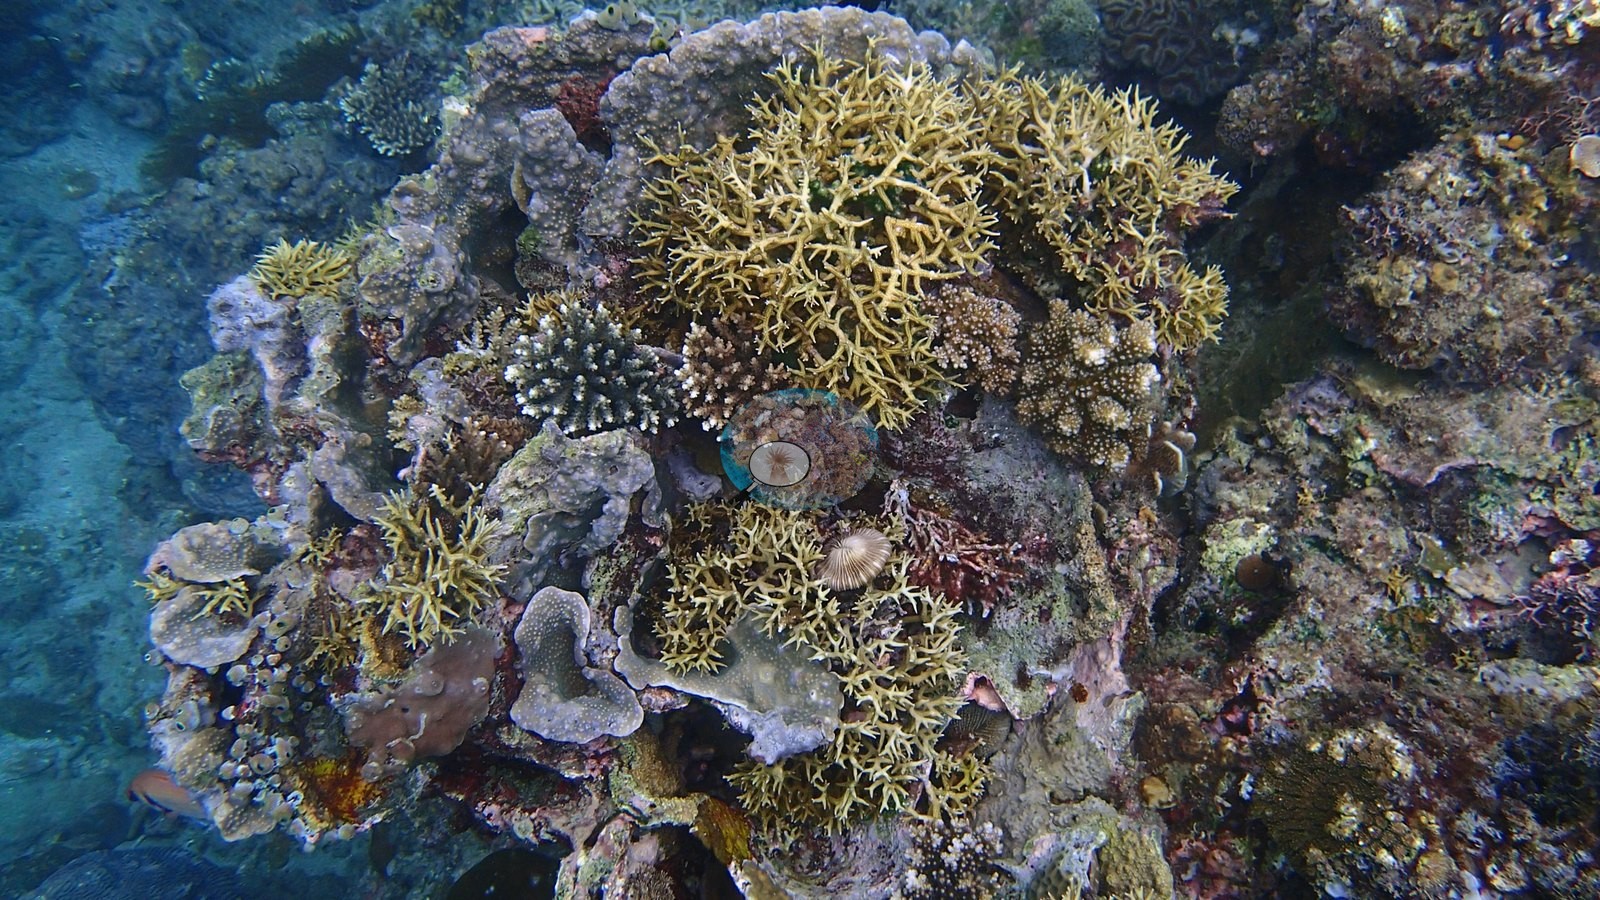
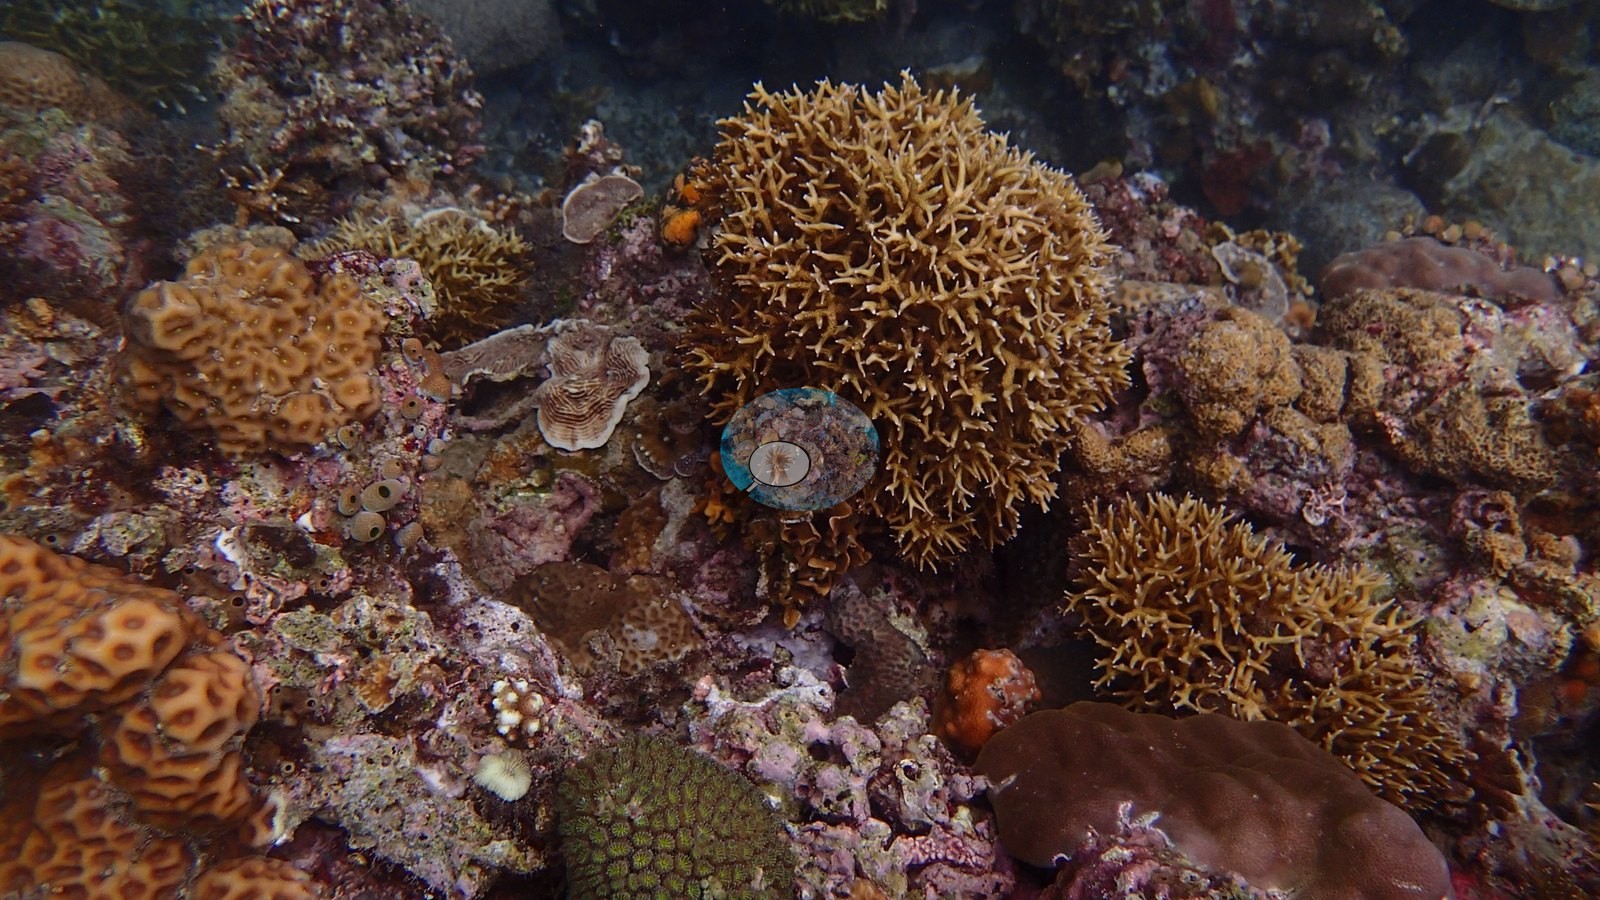
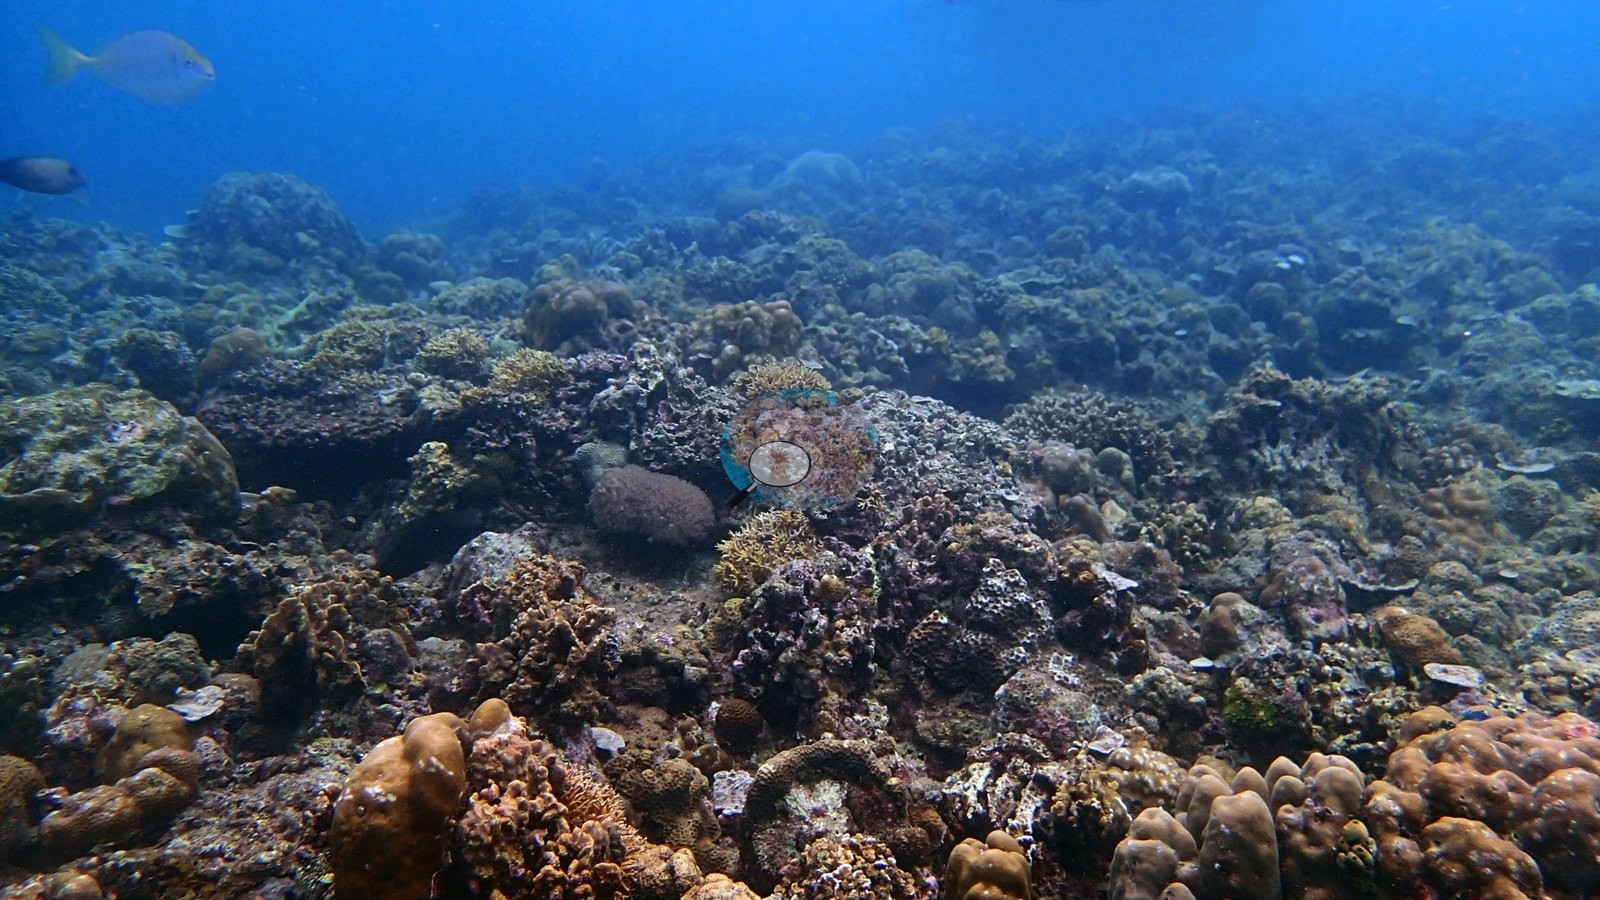
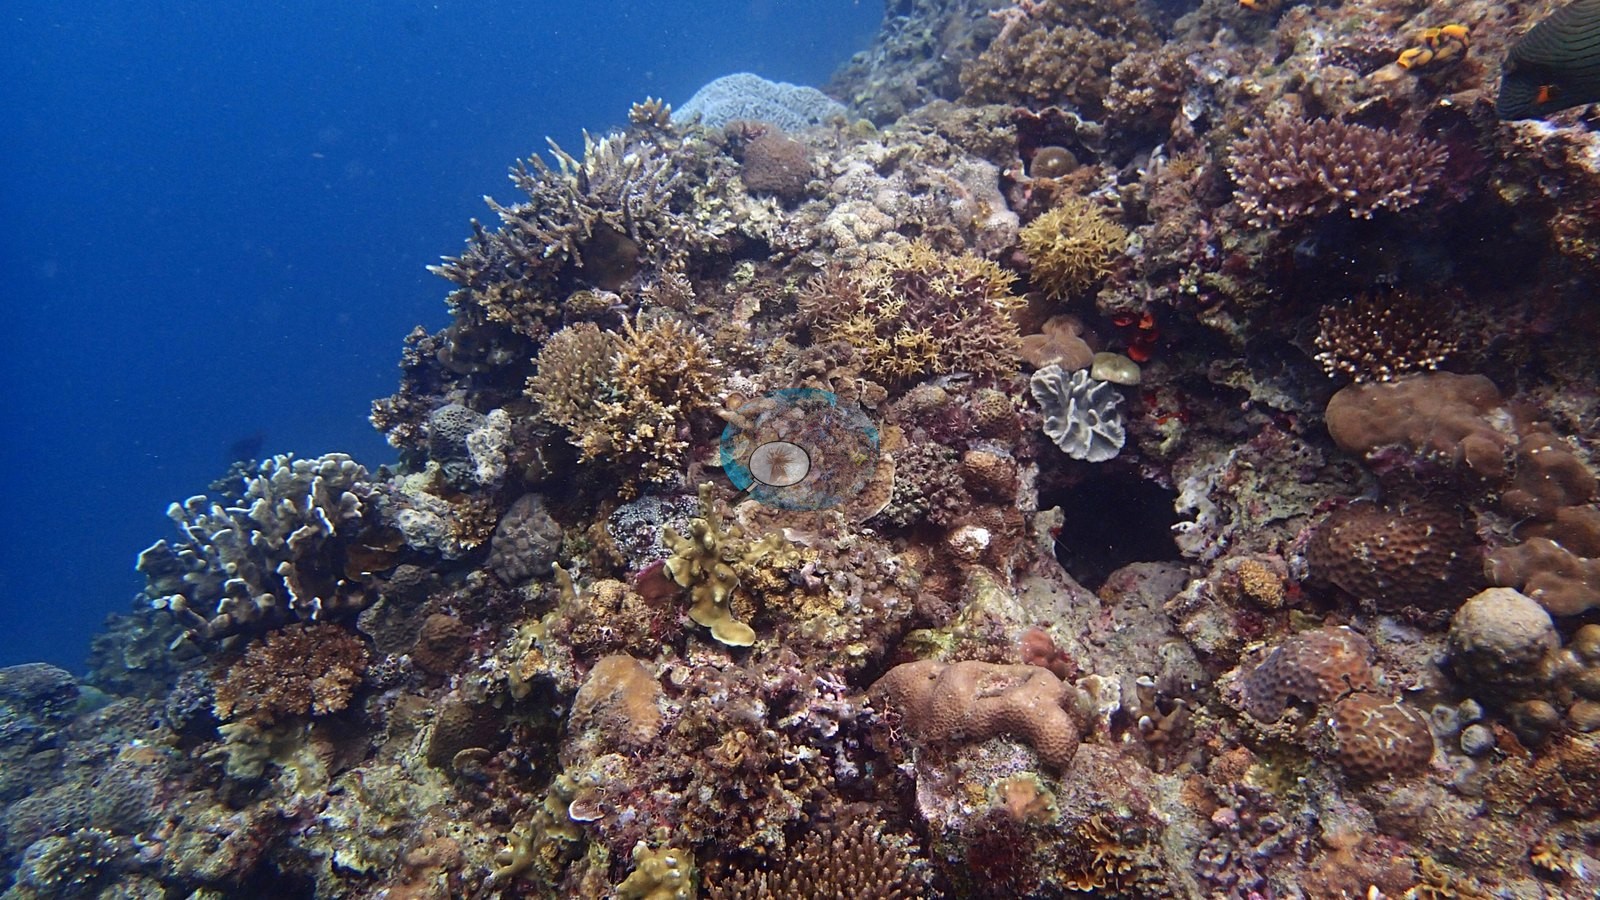
Hard coral cover is markedly higher here than at Ligpo, on a gentle to moderate slope of near-continuous framework: branching and corymbose Acropora, tabular plates, foliose lettuce corals compatible with Echinopora lamellosa and Merulina, plating Montipora, massive, and columnar Porites and Goniopora, brain corals, a Pachyseris-type mound, Seriatopora and Stylophora thickets, and bubble corals including a striking turquoise colony (e.g., Image 3, Image 5, Image 8, Image 9, Image 10, Image 13, Image 18, Image 20, Image 21, Image 22, Image 23, Image 24, Image 25).
Coral cover
Cover comes from two computer vision methods, neither preferred. DINOv3 point classification gives 27.3% hard coral (95% CI 24.2-30.4) from all 89 frames and 1,780 points. CoralSCOP computer vision, its full run now finished, gives 31.1% across all 89 frames (median=31.8%, bootstrap 95% CI 27.2-34.9), against the 29.7% from the 20-frame subset the map's 28.5% was built on. The published spread is 2.4 points and the completed run widens it only to 3.7; the two site means agree, but they agree for weak reasons - across the frames the two models correlate at only r = 0.49, and CoralSCOP's single highest frame, at 84.0%, is a giant-clam portrait, while the bleached-white Acropora stand is scored 59.1% because computer vision segments coral shape regardless of condition. The two models fail differently. CoralSCOP computer vision reads high on low-cover reefs - a median=1.68x a co-located Reef Check diver survey, 4.6x at worst. DINOv3 is strong in-domain (6-class macro-F1 0.62, hard coral recall 0.82) but collapses off-domain: cross-domain point accuracy 0.17-0.25, ceiling near 35-50%; on the five topside frames in this set it still returned 13-27% hard coral for photographs containing no benthos at all. Neither is a diver survey or a transect; both are provisional and a better model will supersede them. Coral cover: 29% — photo-derived, and the two methods broadly agree (27% vs 31%). Two independent computer vision passes over all 89 of Anderson's frames from this dive give a DINOv3 calibrated point classifier reading of 27.3% (95% CI 24–30%, block bootstrap) and a CoralSCOP computer vision of 31.0%, a spread of 3.7 percentage points. The map publishes their mean so sites can be ranked against one another, but the 27–31% range is the honest statement of what is known here: the two products have different denominators and should not be collapsed into one measurement. This number comes from CoralSCOP and DINOv3, which Anderson considers a stopgap; he is evaluating other models and will regenerate the figure once a better one is identified.
Stressors
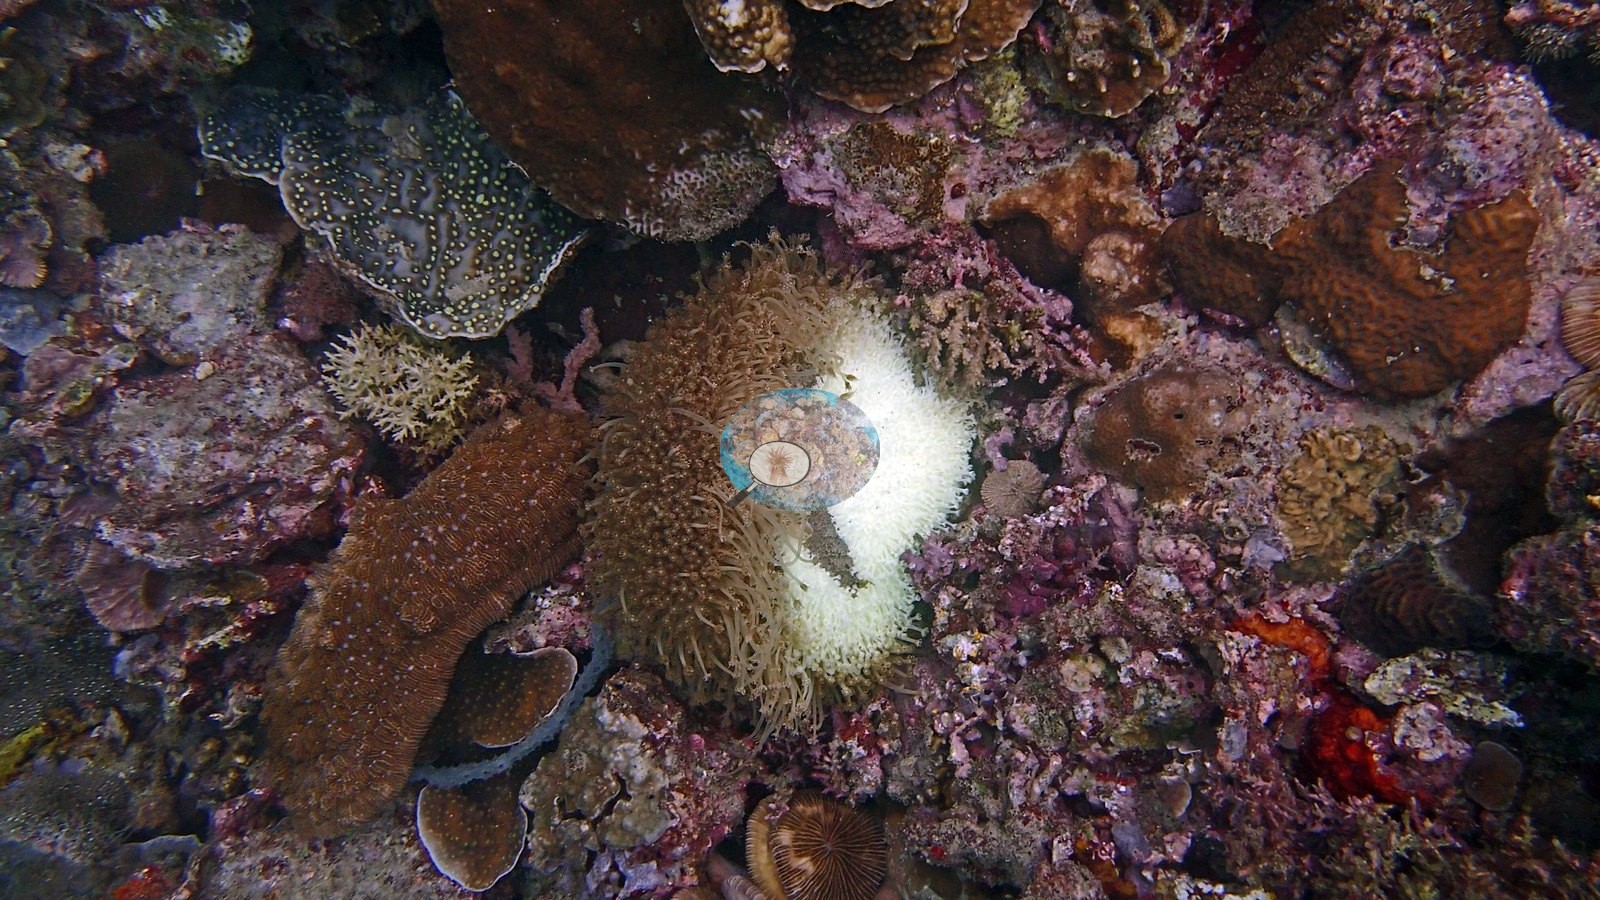
The reef reads healthy - high cover, little algal overgrowth - with one clear exception: a stand of stark-white branching Acropora, architecture still intact, indicating recent bleaching or very recent mortality.
Fish and other fauna
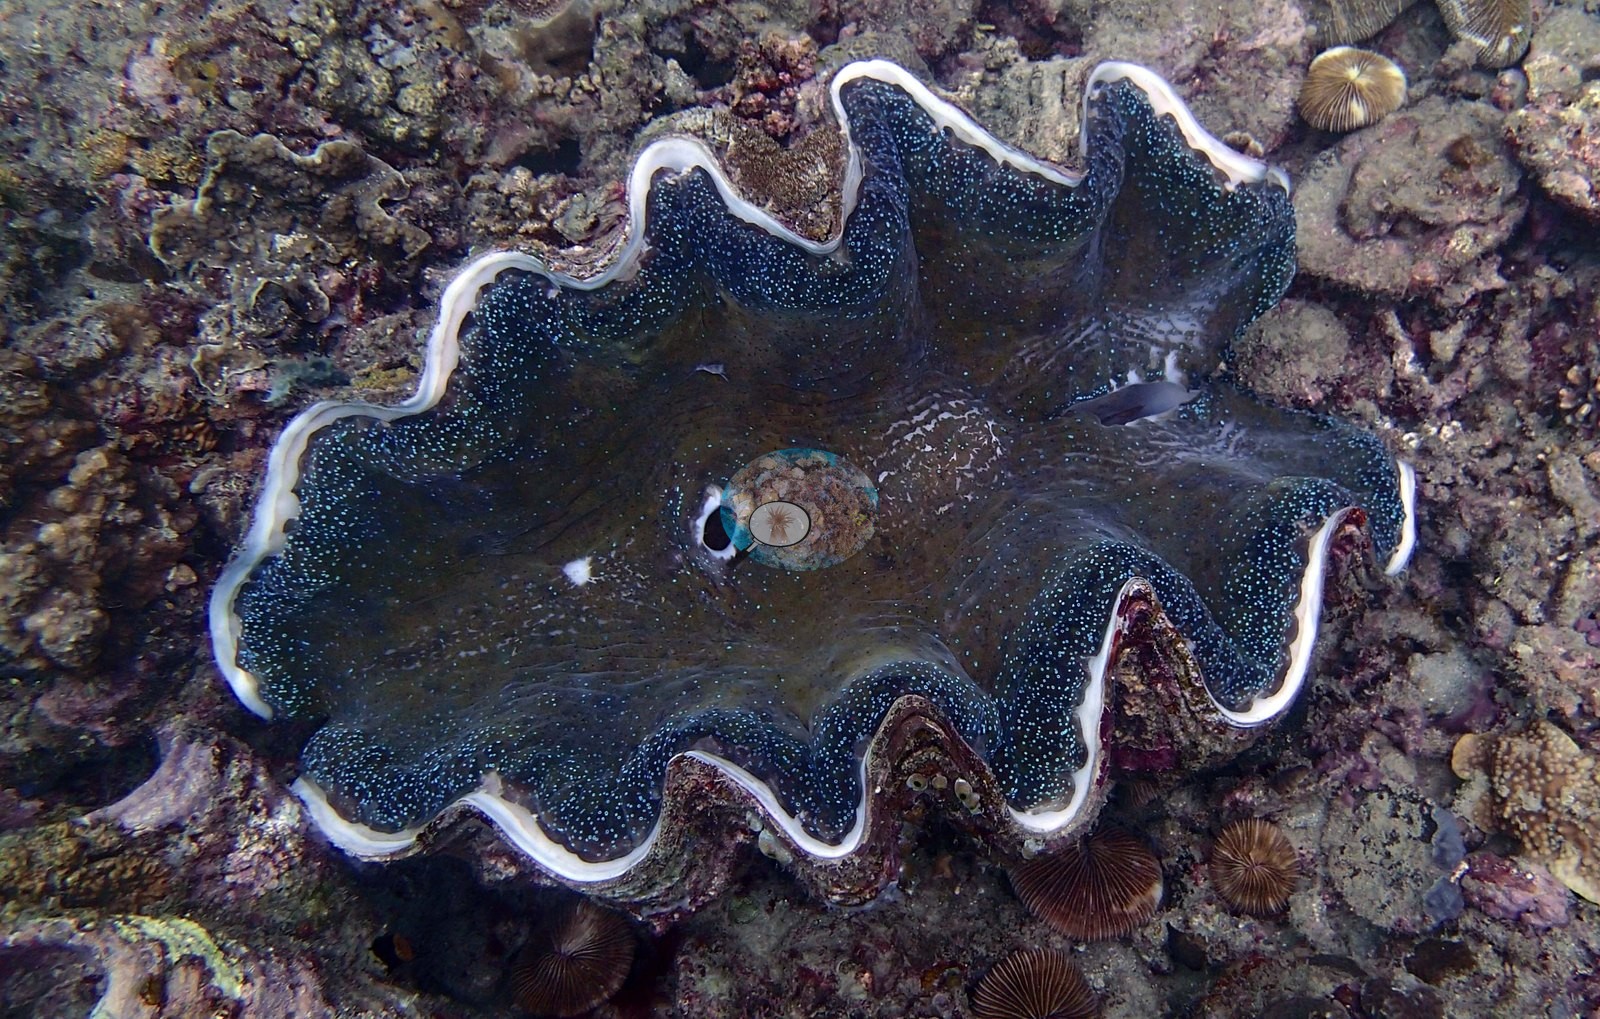
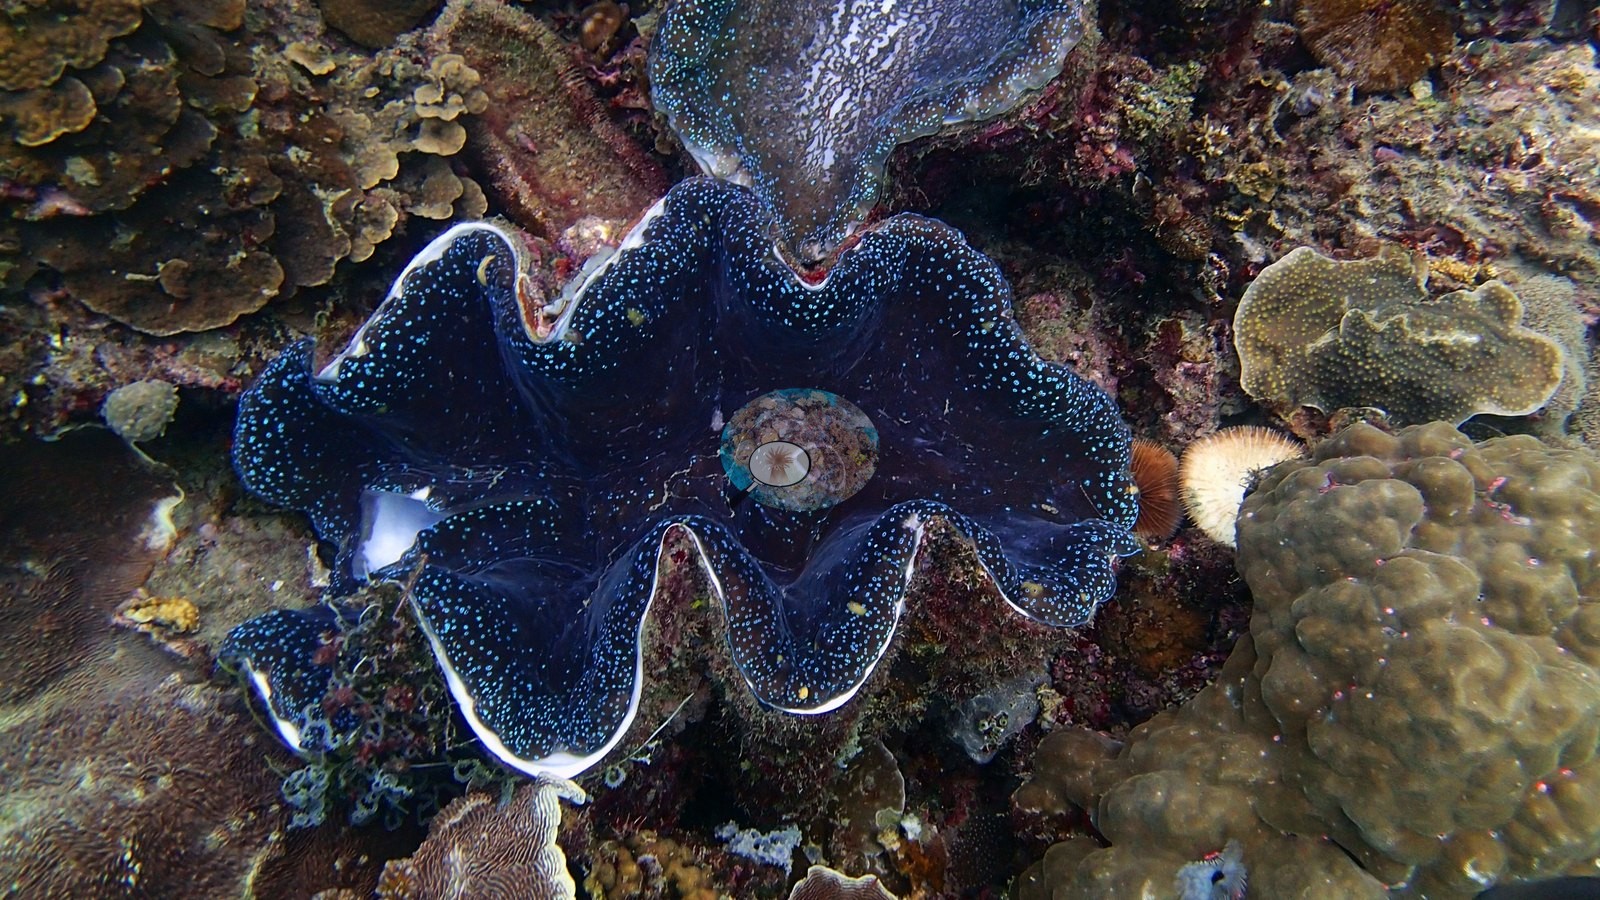
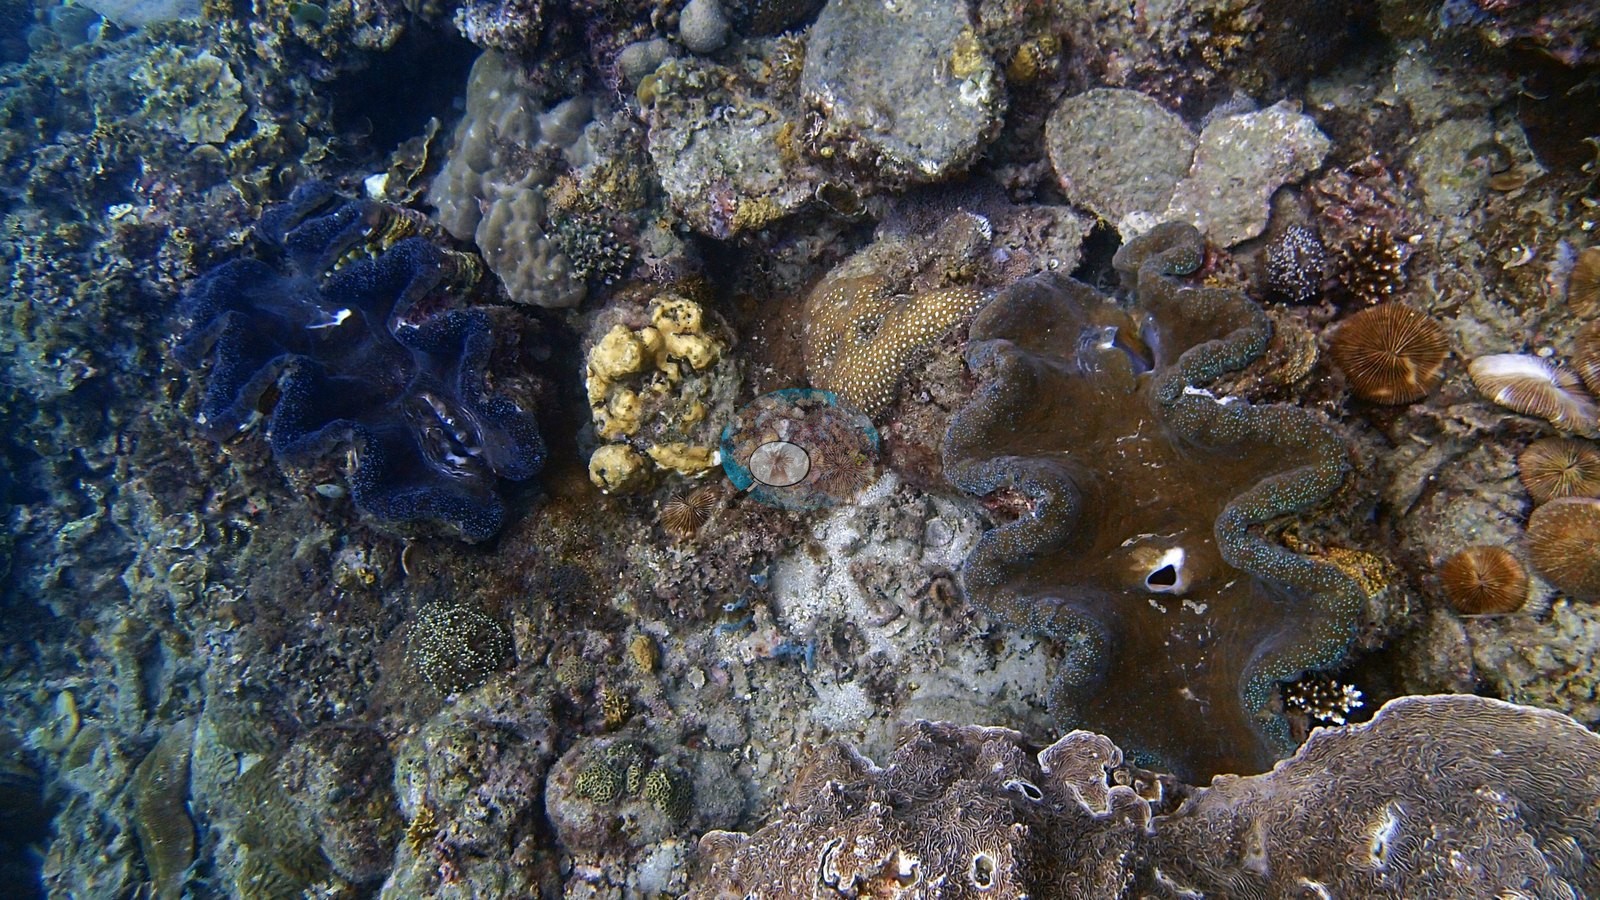
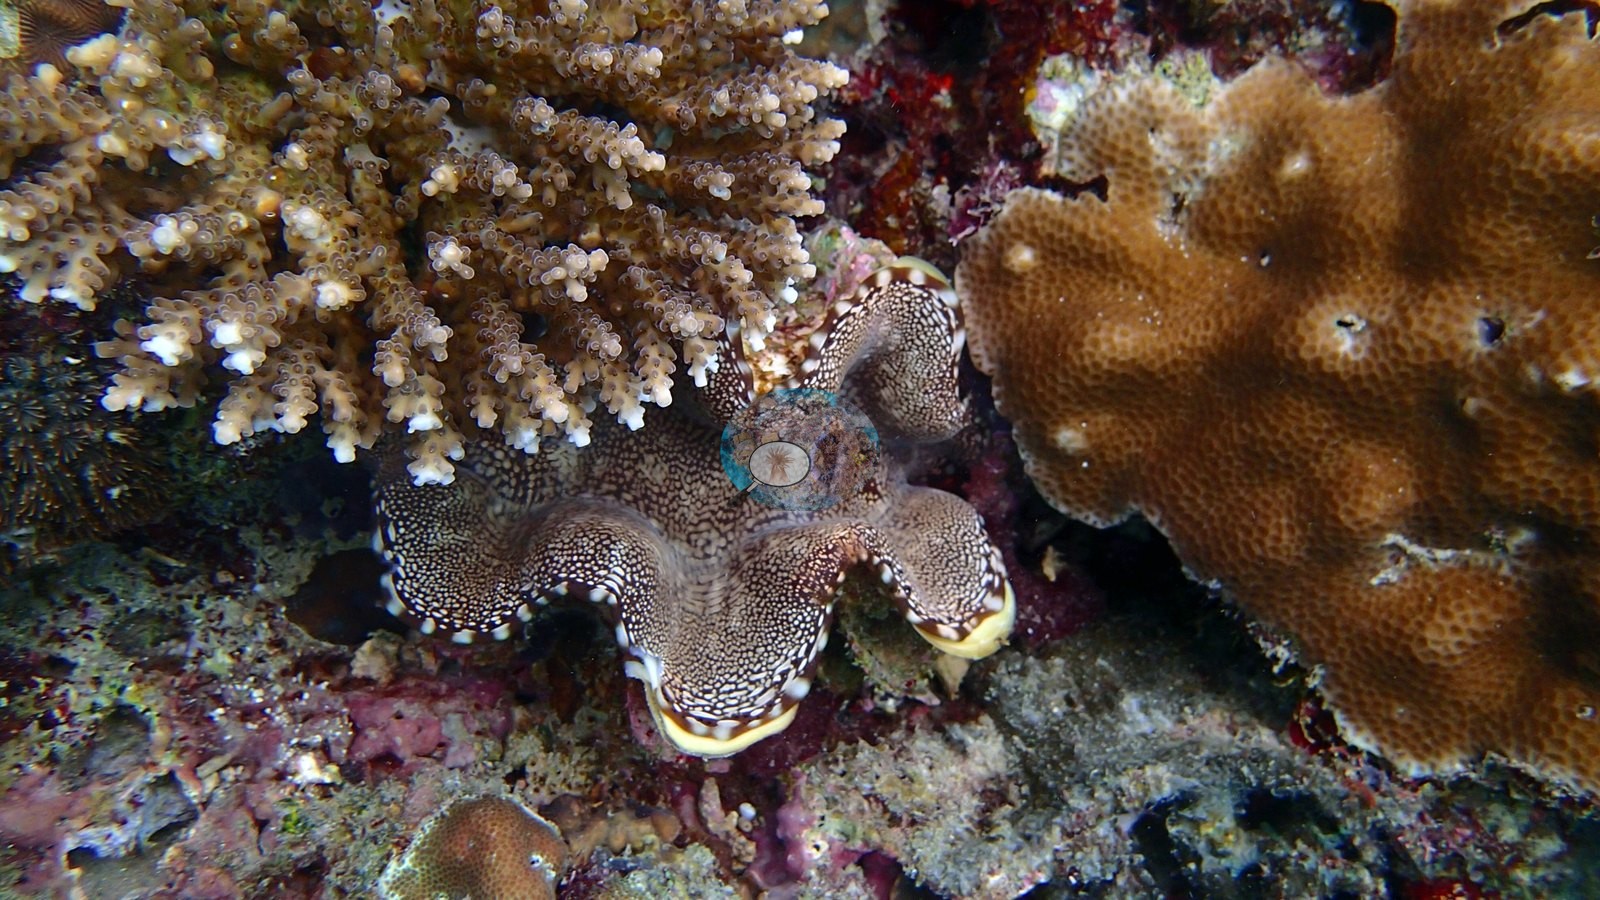
A giant clam garden is the site's strongest signal: numerous Tridacna across several size classes and species, mantles in iridescent blue, violet, green, and mottled brown, consistent with a restocking and protection program (e.g., Image 11, Image 14, Image 15, Image 19).
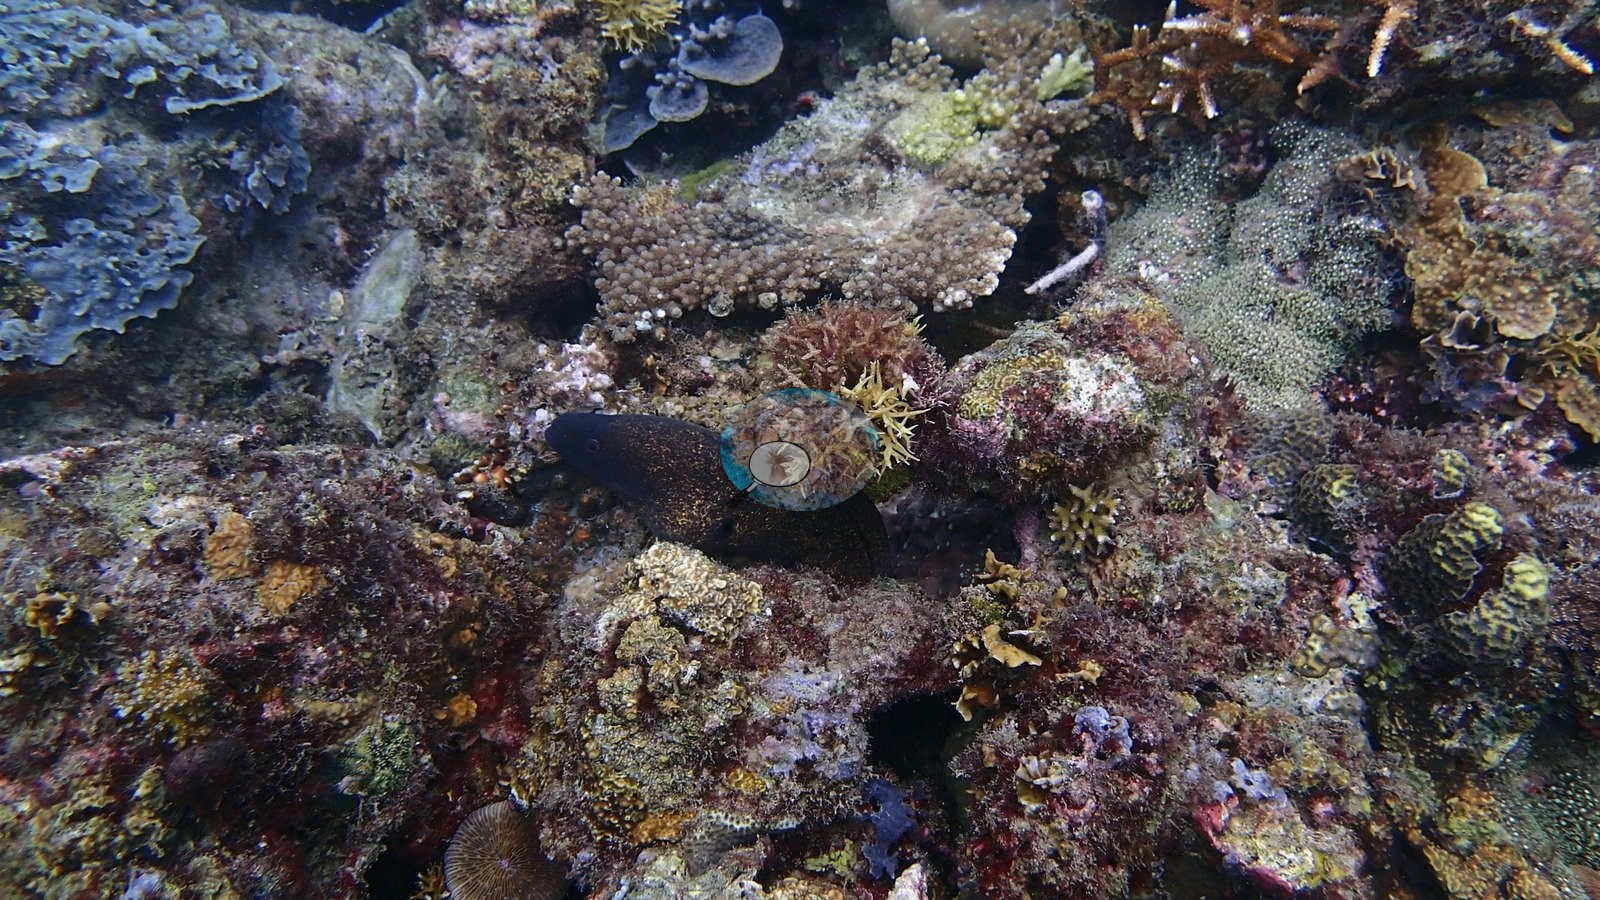
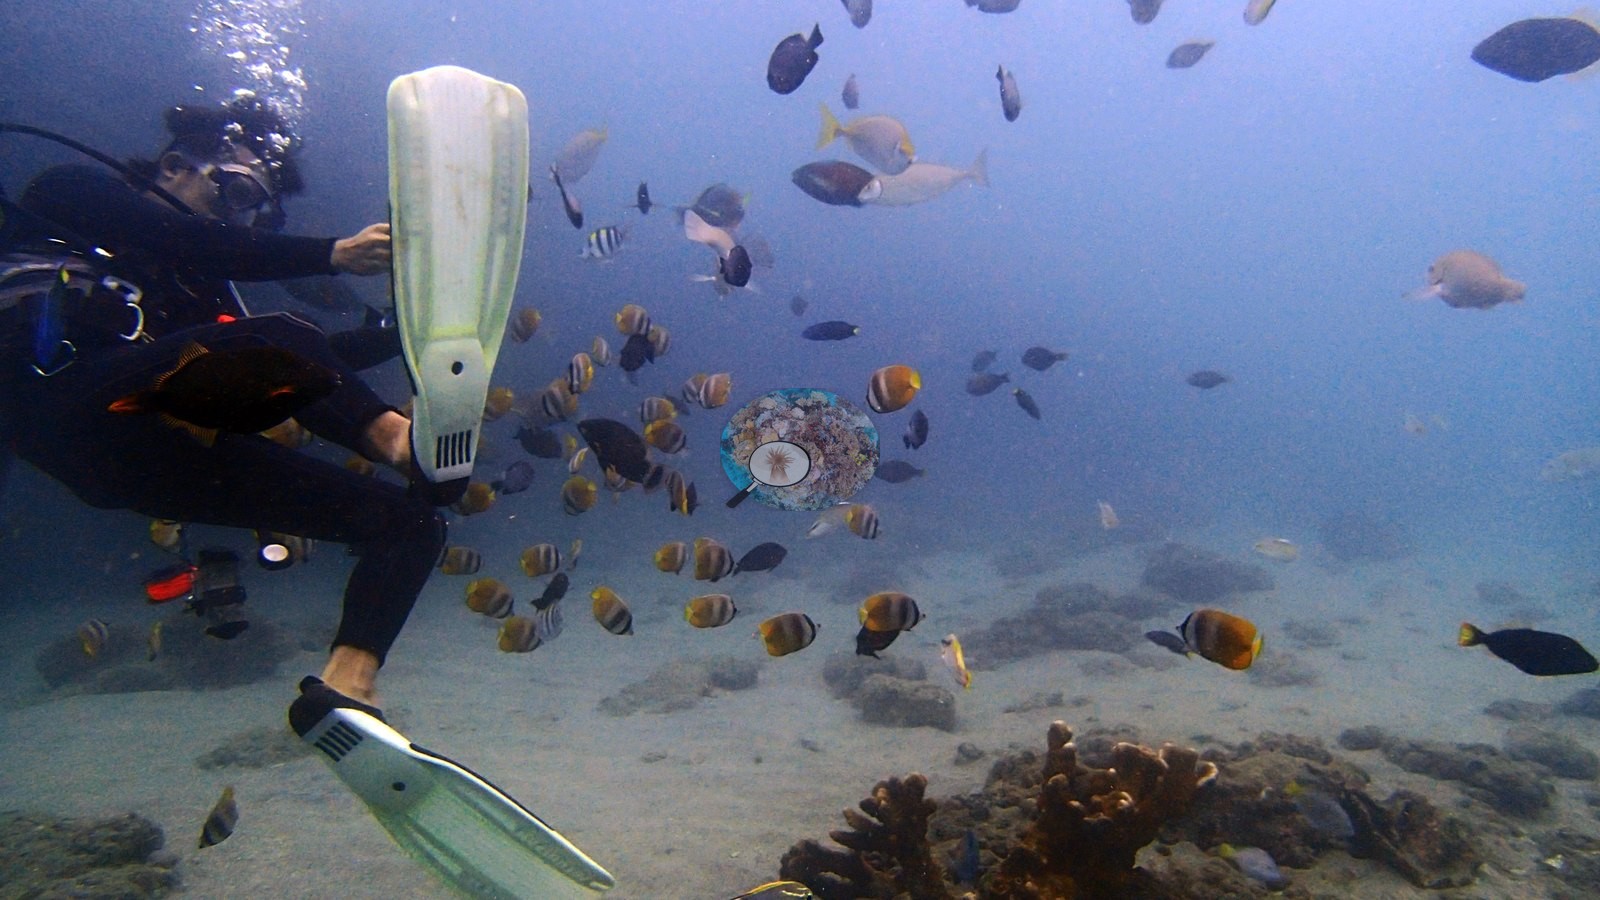
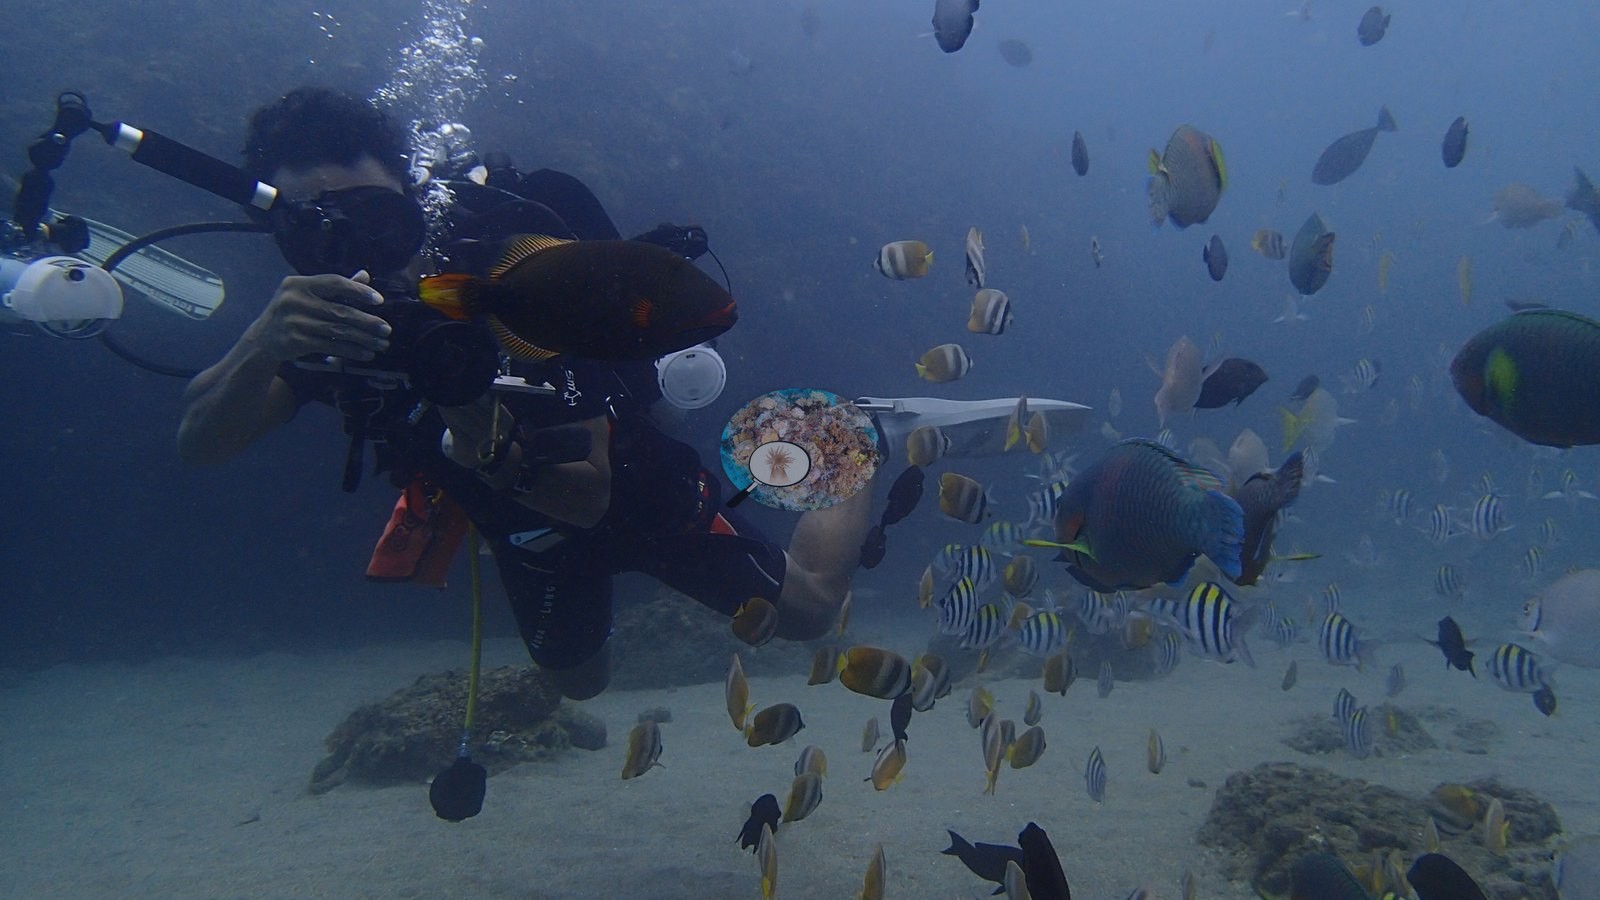
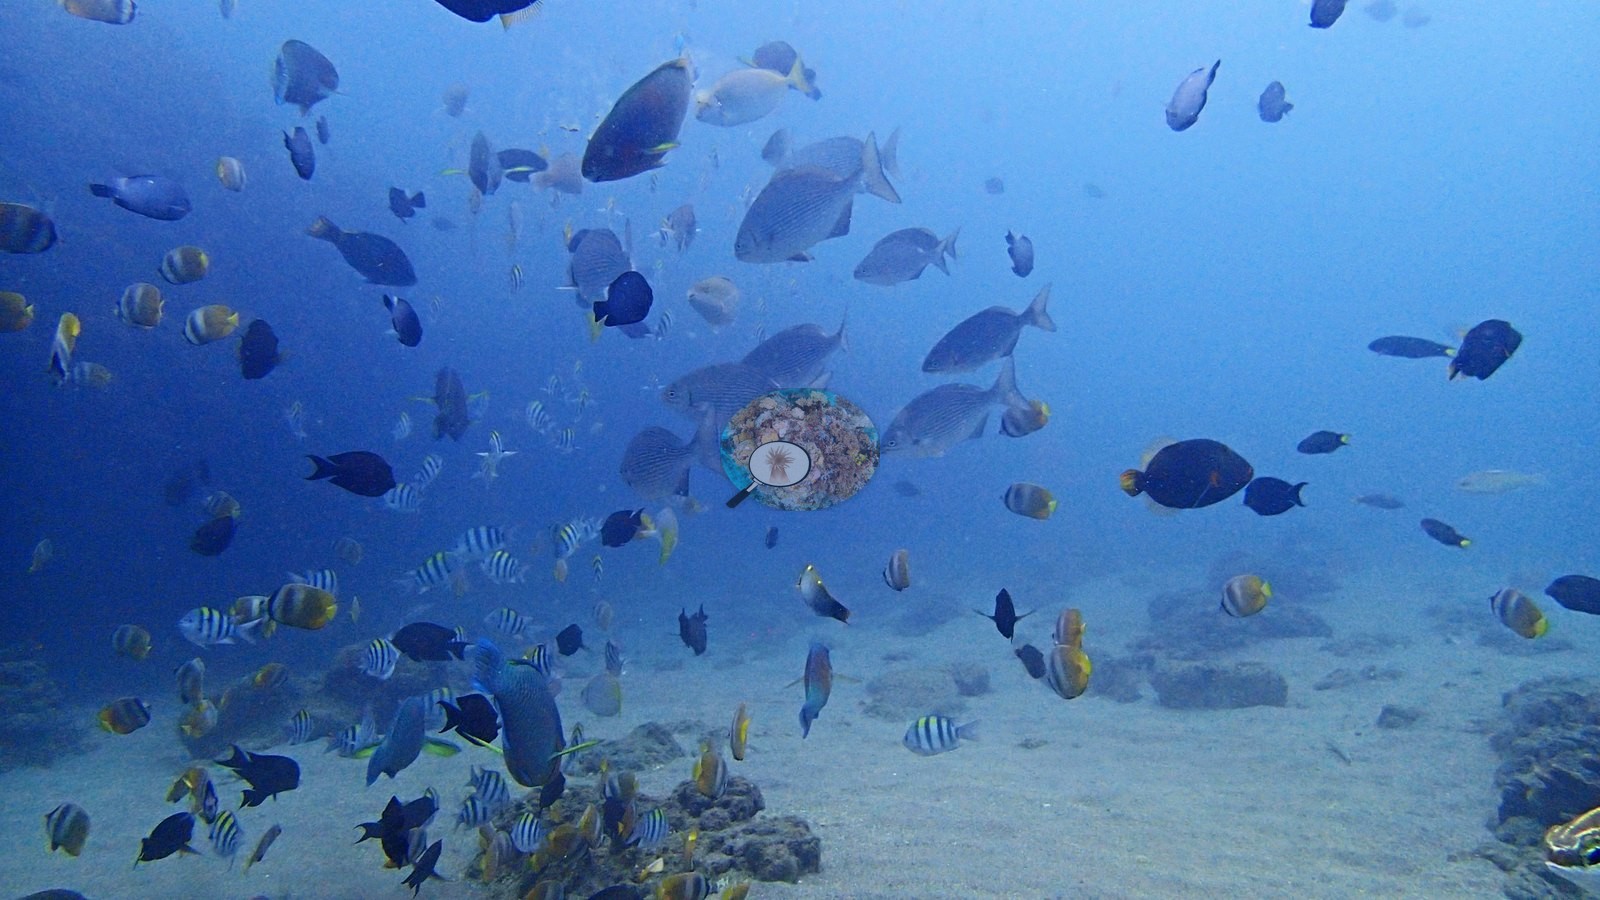
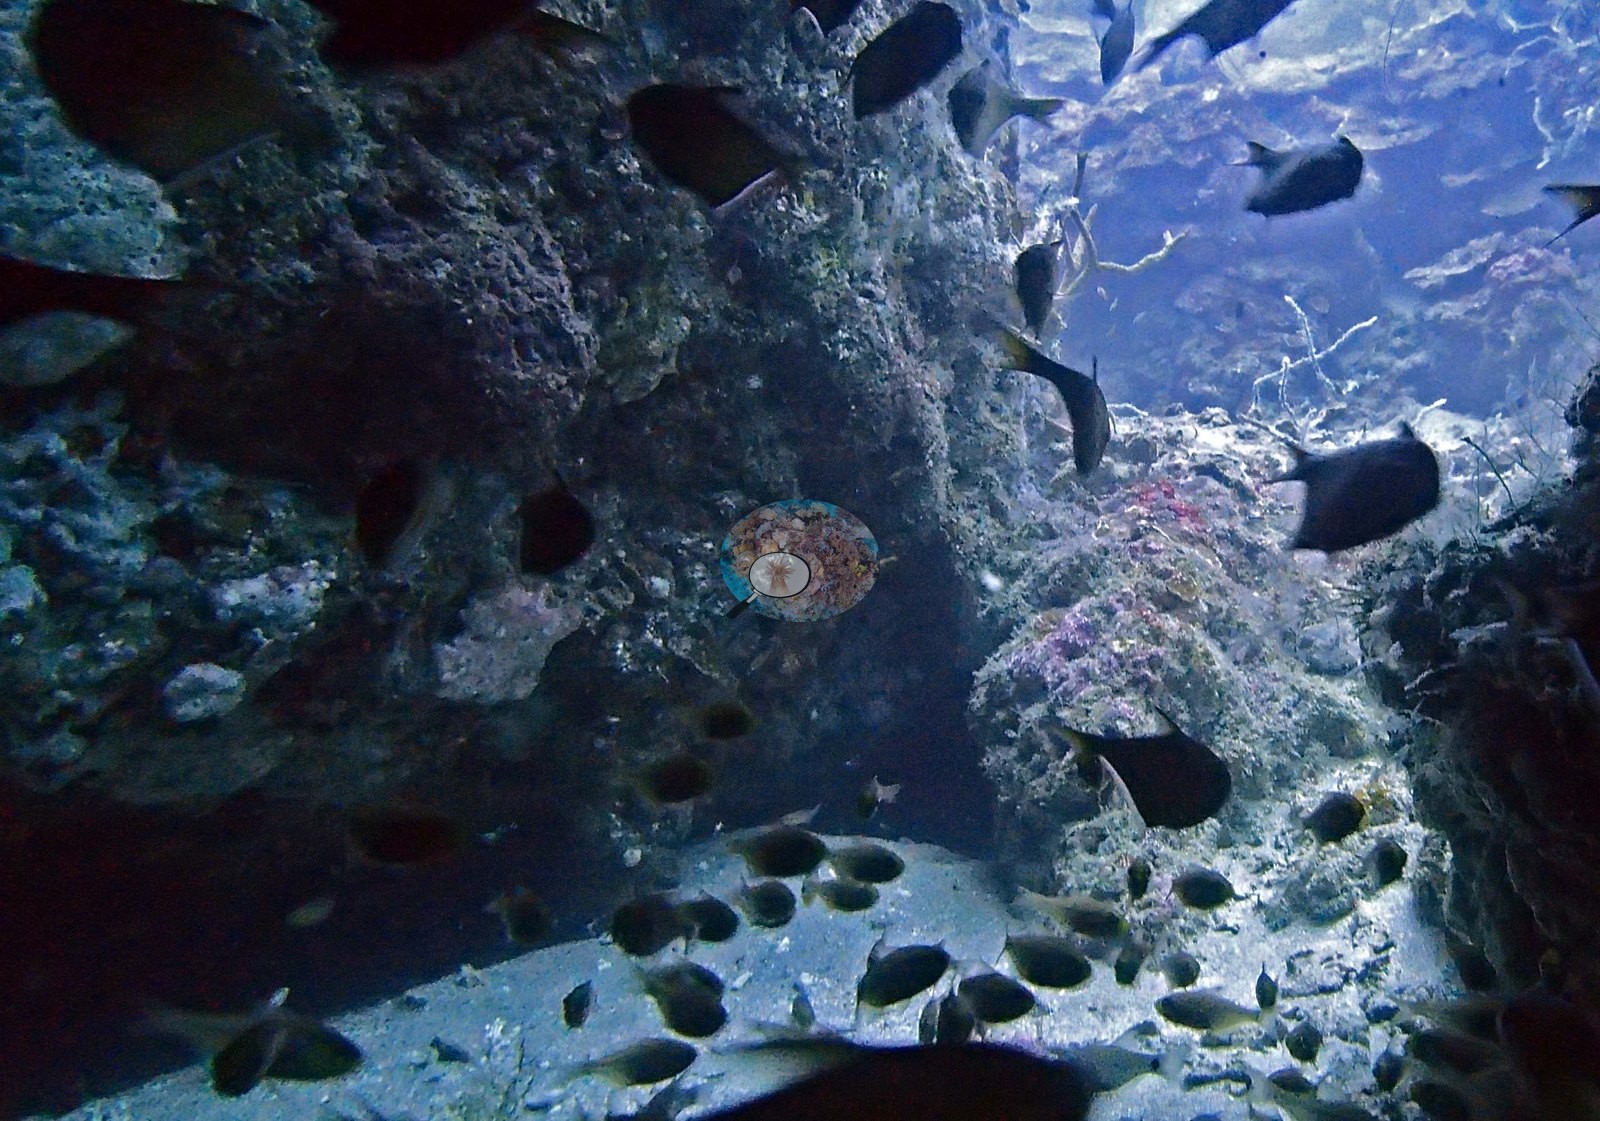
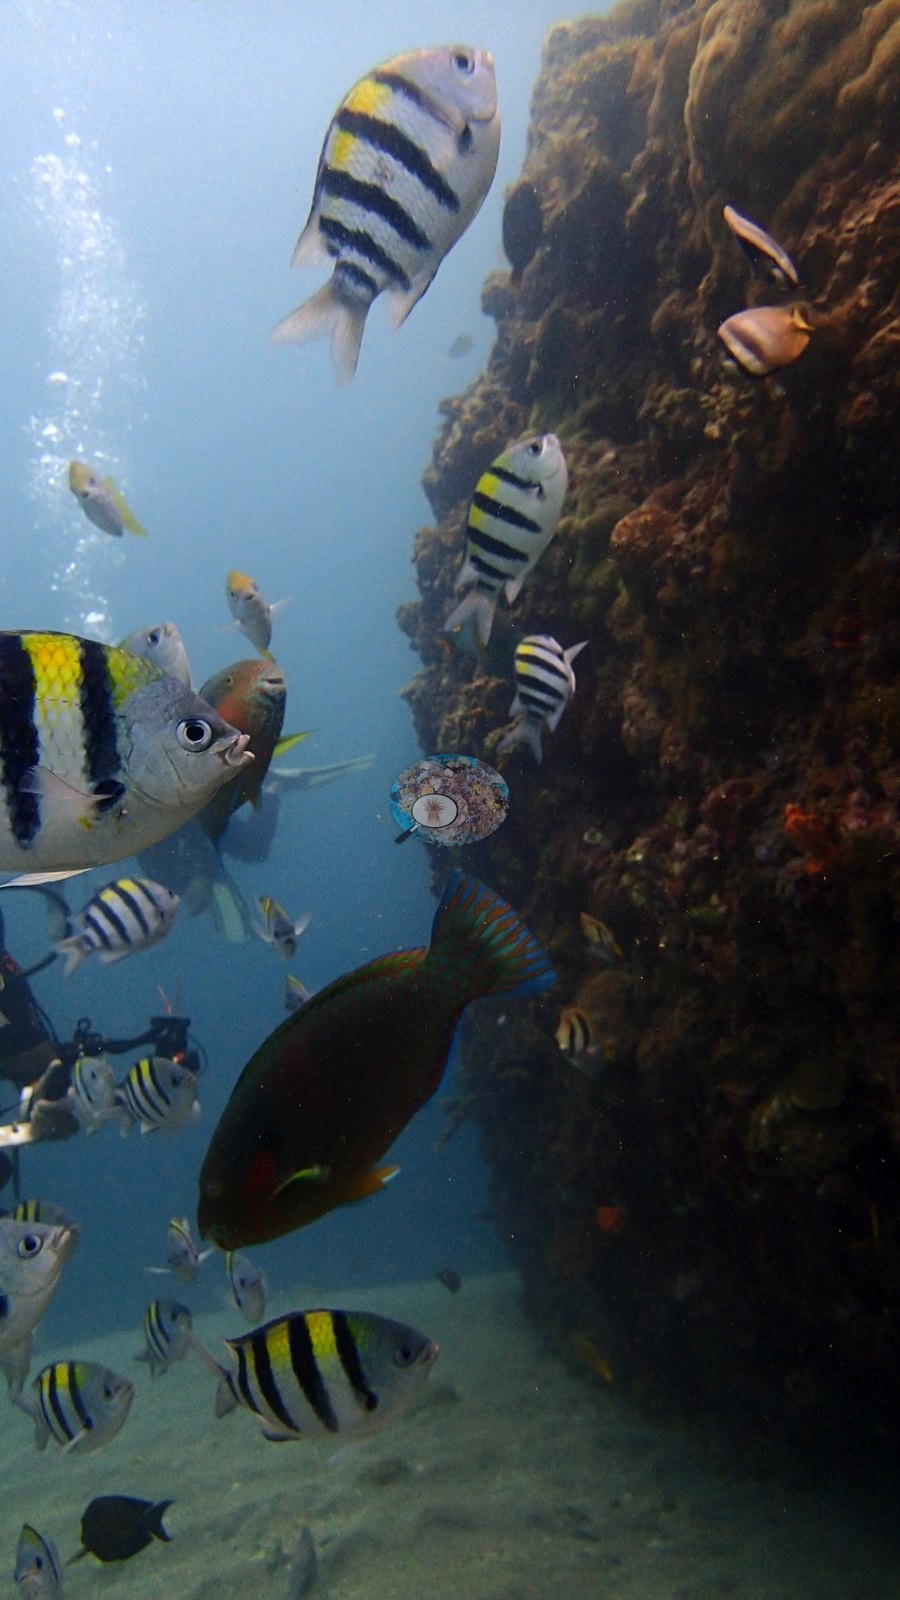
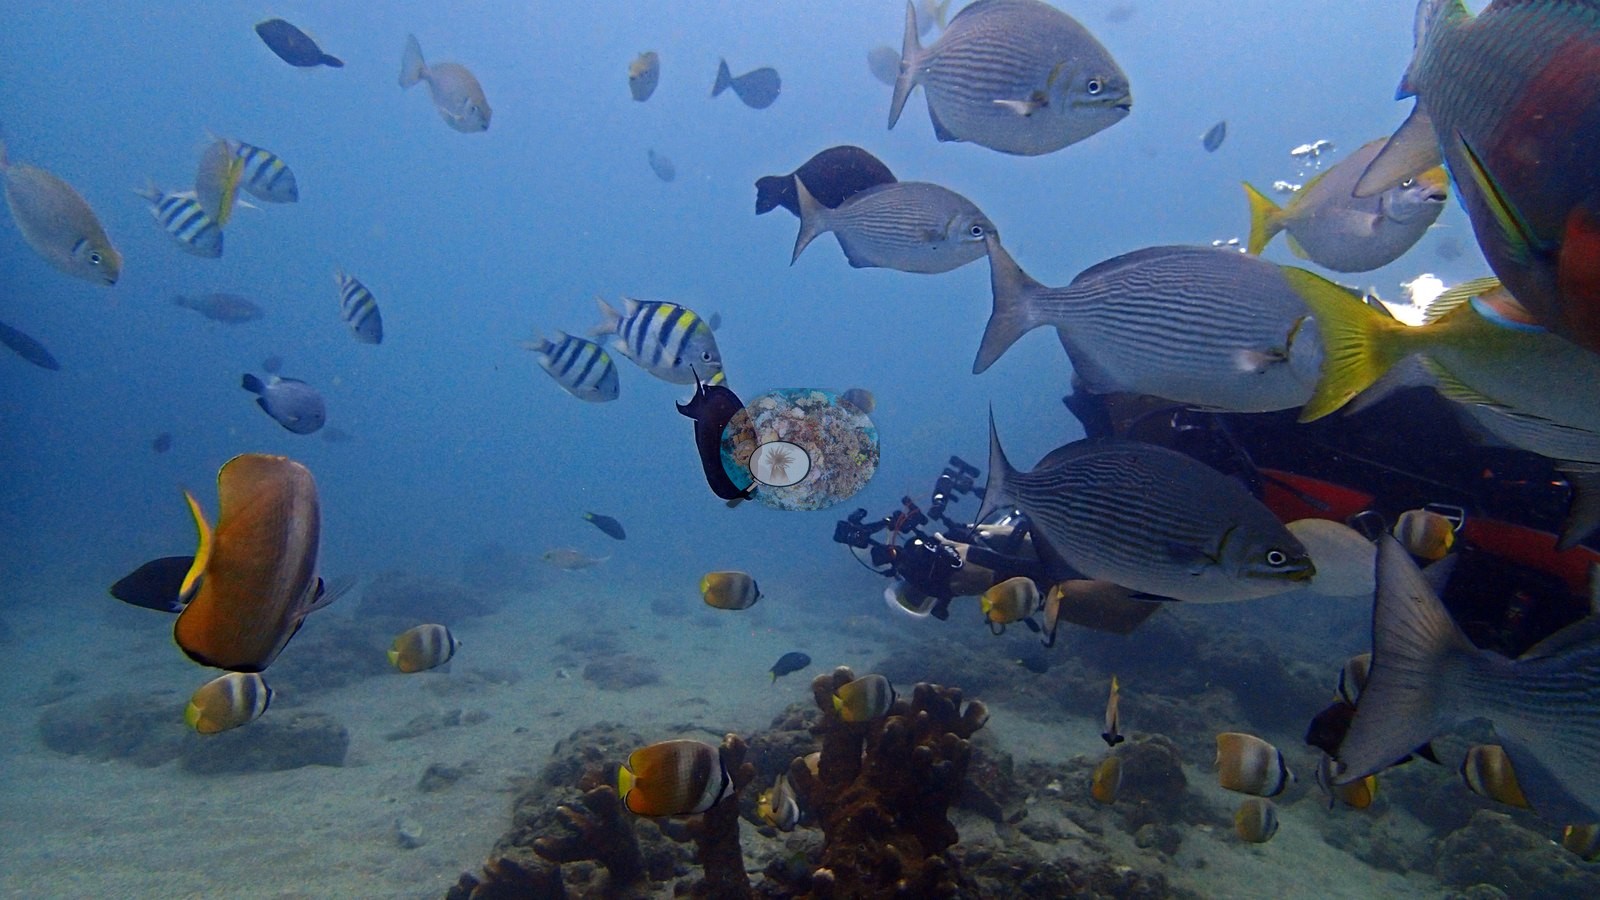
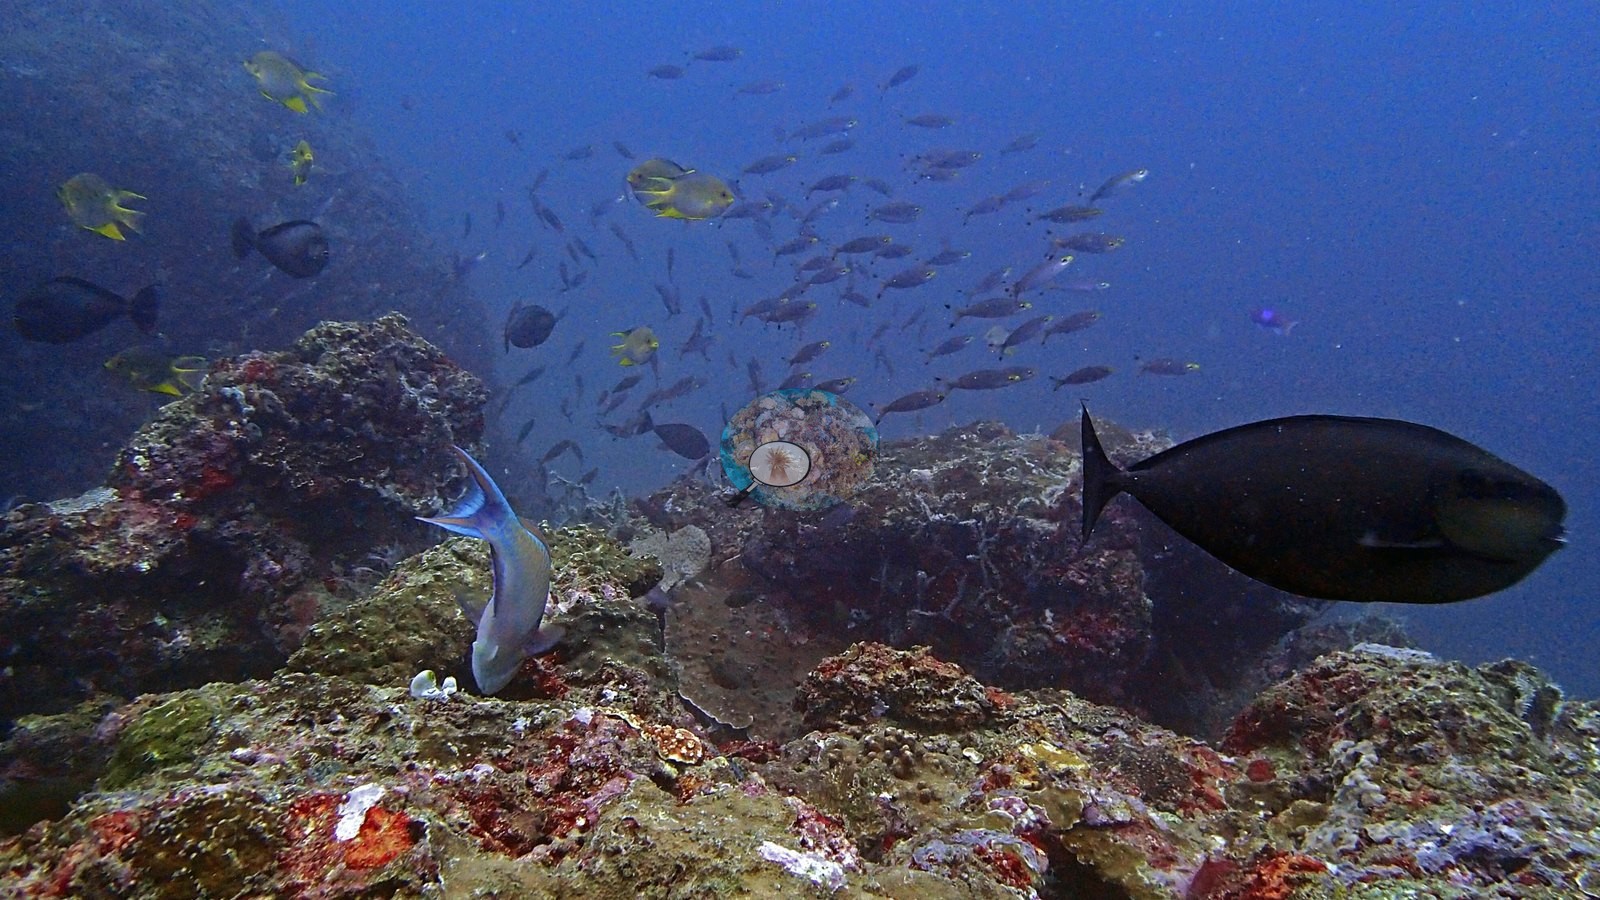
Habituated fish swarm divers - sergeant majors, butterflyfishes, surgeonfishes, and unicornfishes, moorish idols, redtooth triggerfish, and wrasses (e.g., Image 6).
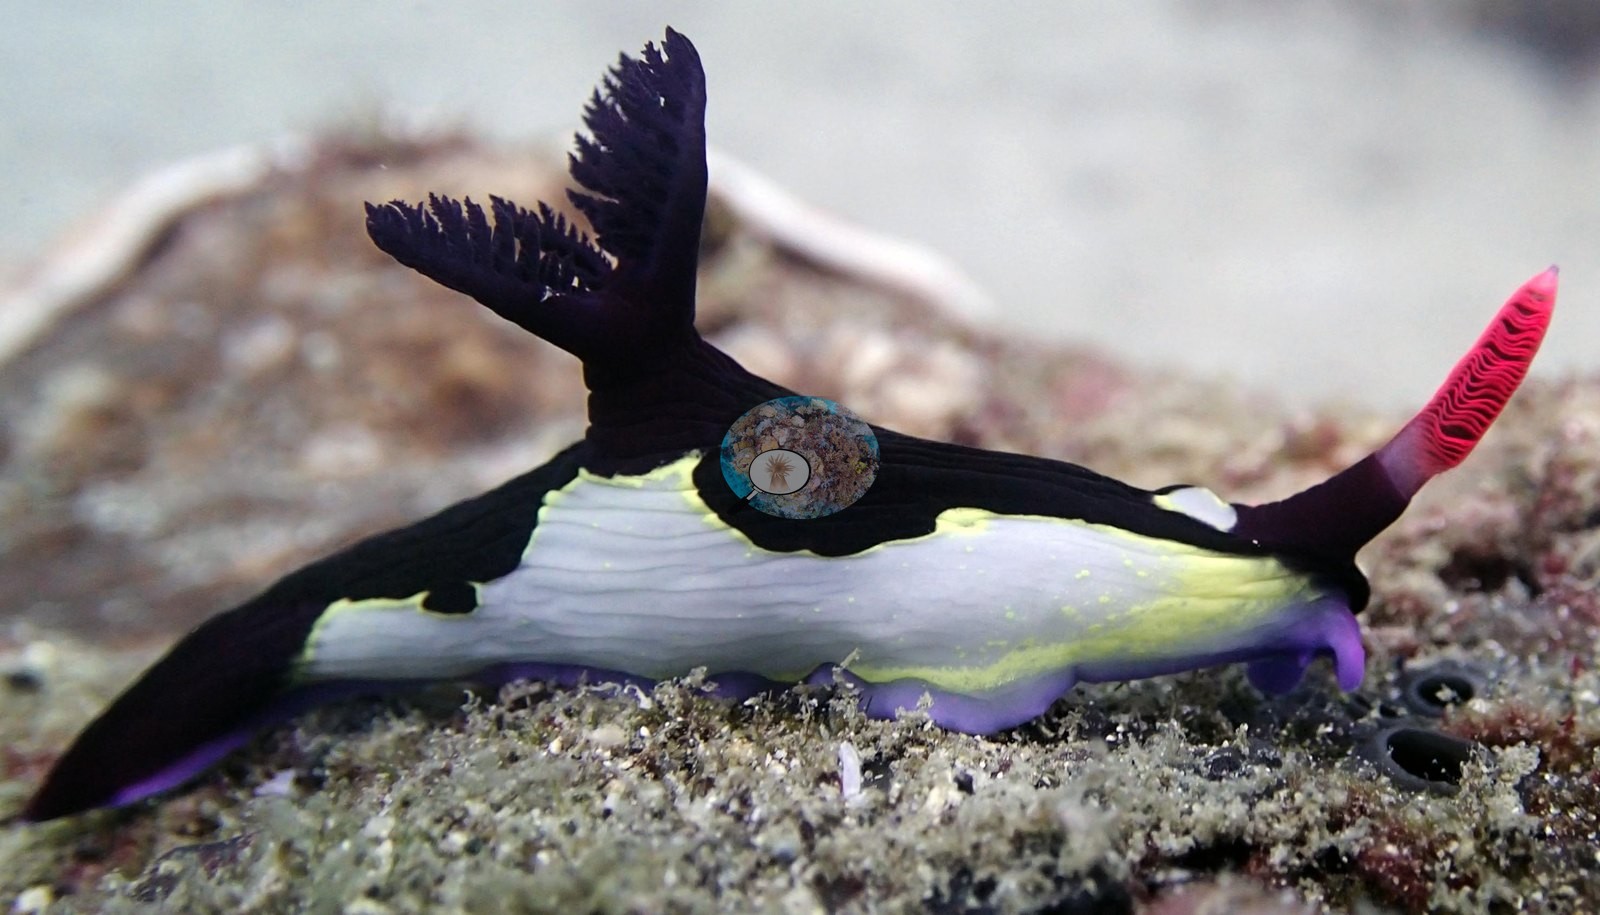
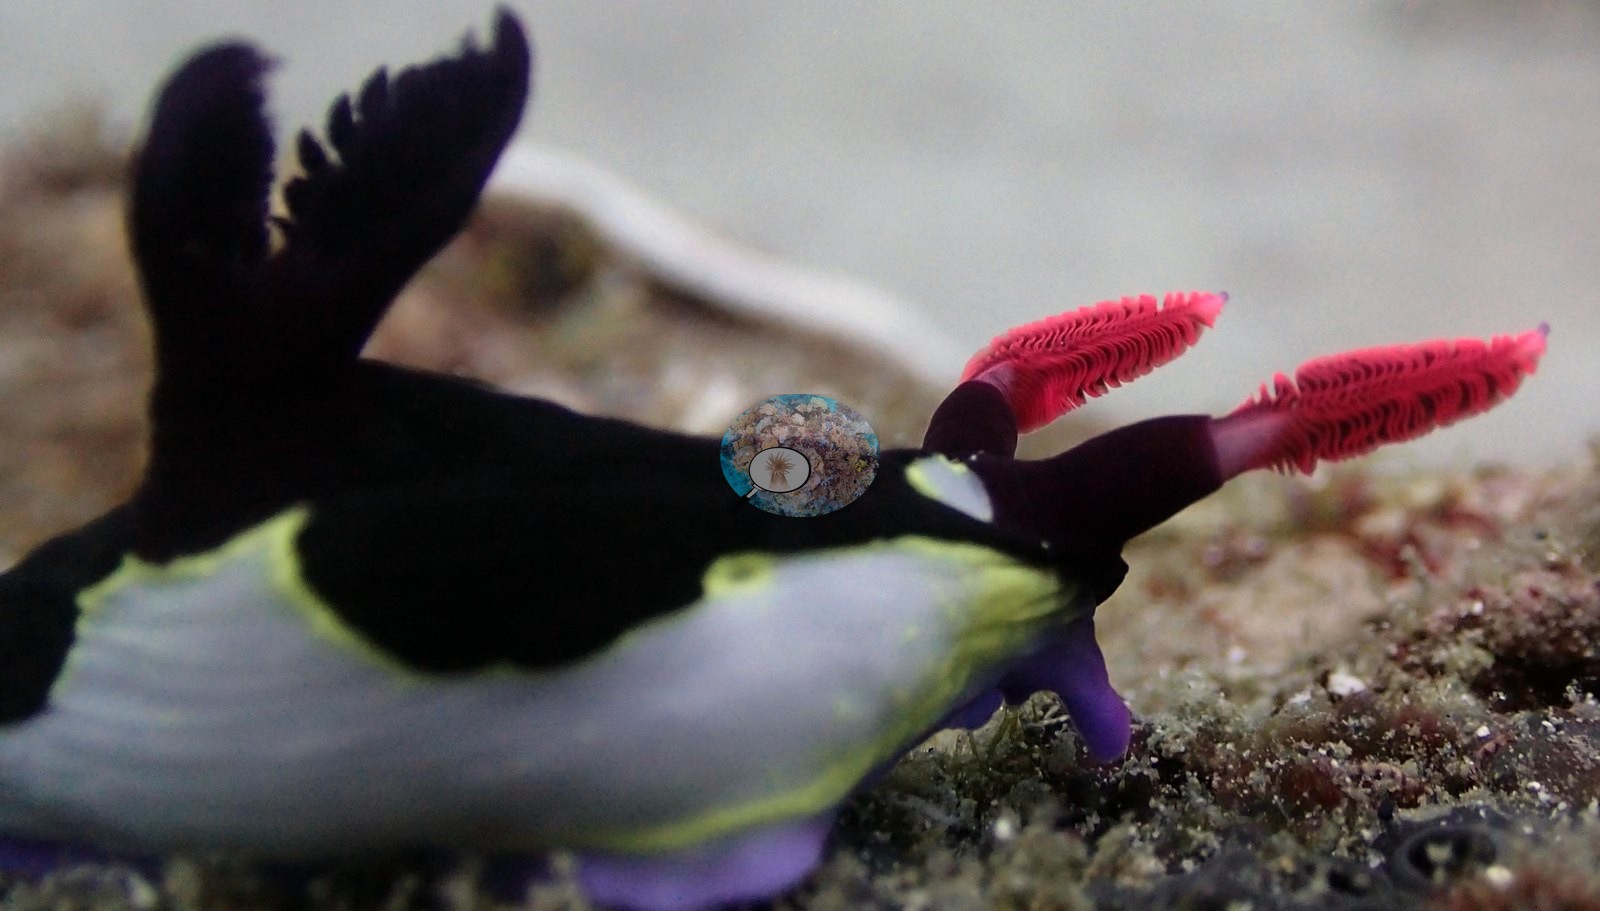
Anderson photographed two large dorid nudibranchs here, a cream animal boldly marked with black arches that he recorded as never before seen, and a black Nembrotha-type with crimson gills and a violet foot margin.
Comparisons with other data
No independent survey was made at this exact site; the nearest ones are listed in the table below.
CV model comparison
More info
As of September 2026 no computer-vision method estimates coral cover accurately on new images, so treat this as indicative rather than a measurement; it is revised as the methods improve.More info
The published figure is the mean of the two methods.| Method | Hard-coral cover (%) |
|---|---|
| In-house DINOv3 | 27.3 |
| CoralSCOP | 31.0 |
| Mean (± SD) | 29.1 ± 2.6 |
| Range | 27.3–31.0 |
Mean ± SD and range are across the computer-vision methods shown.
Independent surveys nearby
Within 5 km, 2 independent survey stations recorded hard coral cover in 2014. The most recent nearby survey is from 2014, so these values predate recent heat stress. This site's own estimate (29%) sits 27.8 points below the range of these surveys (57–70%); the methods differ, so the comparison is context, not a like-for-like test.
Collected by other programs using different methods (Reef Check uses point-intercept transects), so these are context for the figures above, not a like-for-like comparison. Where a station was surveyed more than once the range is shown. Station names are not dive-site names.
| Agency | Site / location | Date | Hard coral cover (%) | Distance | Link |
|---|---|---|---|---|---|
| Reef Check | Dive and Trek Marine Sanctuary | 2014 | 70% | 3.16 km | — |
| Reef Check | Portulano Marine Sanctuary | 2014 | 57% | 4.04 km | — |
Data & links
All images from Coral Reef Diagnostics. Data are from Coral Reef Diagnostics and the organizations named in the data-sources table above.
© Coral Reef Diagnostics.