
Philippines - Palawan

Regional summary of 12 dive sites. Figures are averages across the sites that report them (n = sites with a value); each site's own page has its individual values. Part of the Philippines overview.
⬇ Download this region as a report card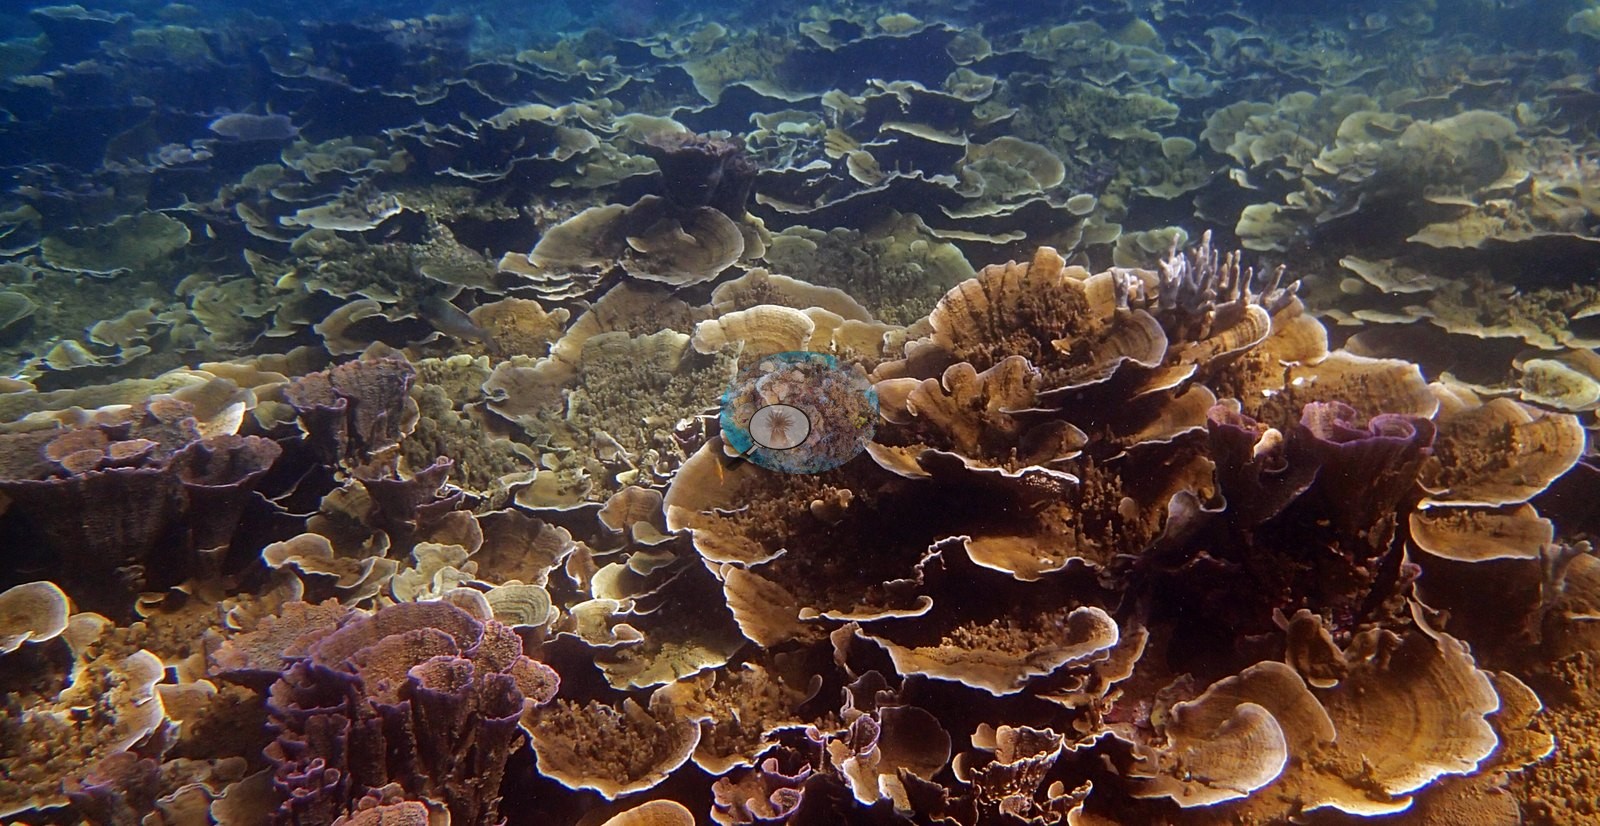

Palawan's reefs and WWII wrecks at Port Barton, El Nido, and Coron, visited in January 2017, feature vast staghorn and table-coral thickets and coral-colonized hulls. Condition was mostly good, though one Port Barton bay held extensive standing dead coral with new recruits growing on it.
Heat stress
Long-term record: 4 years since 1985 reached 8 or more °C-weeks at NOAA’s Western Philippines station. Download the annual DHW data (CSV).
12 sites in this region — click a marker to open that site.
Regional setting
Spalding et al. (2001) rank Palawan's reefs among the most fully developed in the Philippines, with fringing and patch reefs along most of its coast and live coral cover reported at 50-90% in places. Banks and shoals off the west coast are thought to belong to a long, submerged barrier reef, and the Sulu Sea holds two major atoll systems, the Cagayan Islands and Tubbataha, the latter made up of two atolls. At the time, Palawan, eastern Luzon, and the southern Sulu Sea were the only areas where the authors did not consider demersal fish stocks overfished, but they flag pooling, in which a hundred or more divers drive fish into nets with jets of compressed air, as possibly widespread off Palawan. Their protected-area list includes the Palawan Biosphere Reserve (11,508 km², 1990), El Nido Marine Reserve (950 km², 1992), and Tubbataha, a World Heritage Site since 1993. Nationally, they estimate about 25,060 km² of reef, with 421 coral species recorded and 577 estimated. Souter et al. (2021) place the Palawan/North Borneo ecoregion in the largest East Asian Seas subregion, 32,567 km², or 41.6% of the region's reef area.
In that subregion, Souter et al. (2021) found considerable swings in modeled hard coral cover and a substantial fall in algal cover, but the data come from 171 sites, none monitored for longer than 15 years. Region-wide, they tie coral losses to the 2010 and 2016 mass bleaching events and cite overfishing, coastal aquaculture, siltation, eutrophication, and marine plastics as the main local pressures. Wilkinson (2006) described reef condition in the Philippines as still declining in 2004, under heavy fishing pressure, including damaging methods, and sediment from coastal development.
Overview
The 12 Palawan sites were visited between 20 and 28 January 2017 in three areas: Port Barton, the Bacuit Archipelago off El Nido, and Busuanga and Coron Island. They mix natural reefs with three wrecks. At Port Barton these are the Alberguin wreck on silty sand, a shallow bay snorkel (Reef 1), and two island-hopping stops. In El Nido they are Nat Nat, Paglugaban Rocks (a gently rolling fore reef around an offshore rock outcrop), and Abdens. At Coron they are the WWII wrecks Akikushima and Taiei Maru, Coral Gardens, and snorkels in the karst lagoons of Twin Lagoon and Green Lagoon. Logged maximum depths on the scuba dives ran from 15.2 m at Coral Gardens to 34.4 m on the Akikushima wreck; Reef 1, the two Port Barton island-hopping stops, and the Coron lagoons were snorkels.
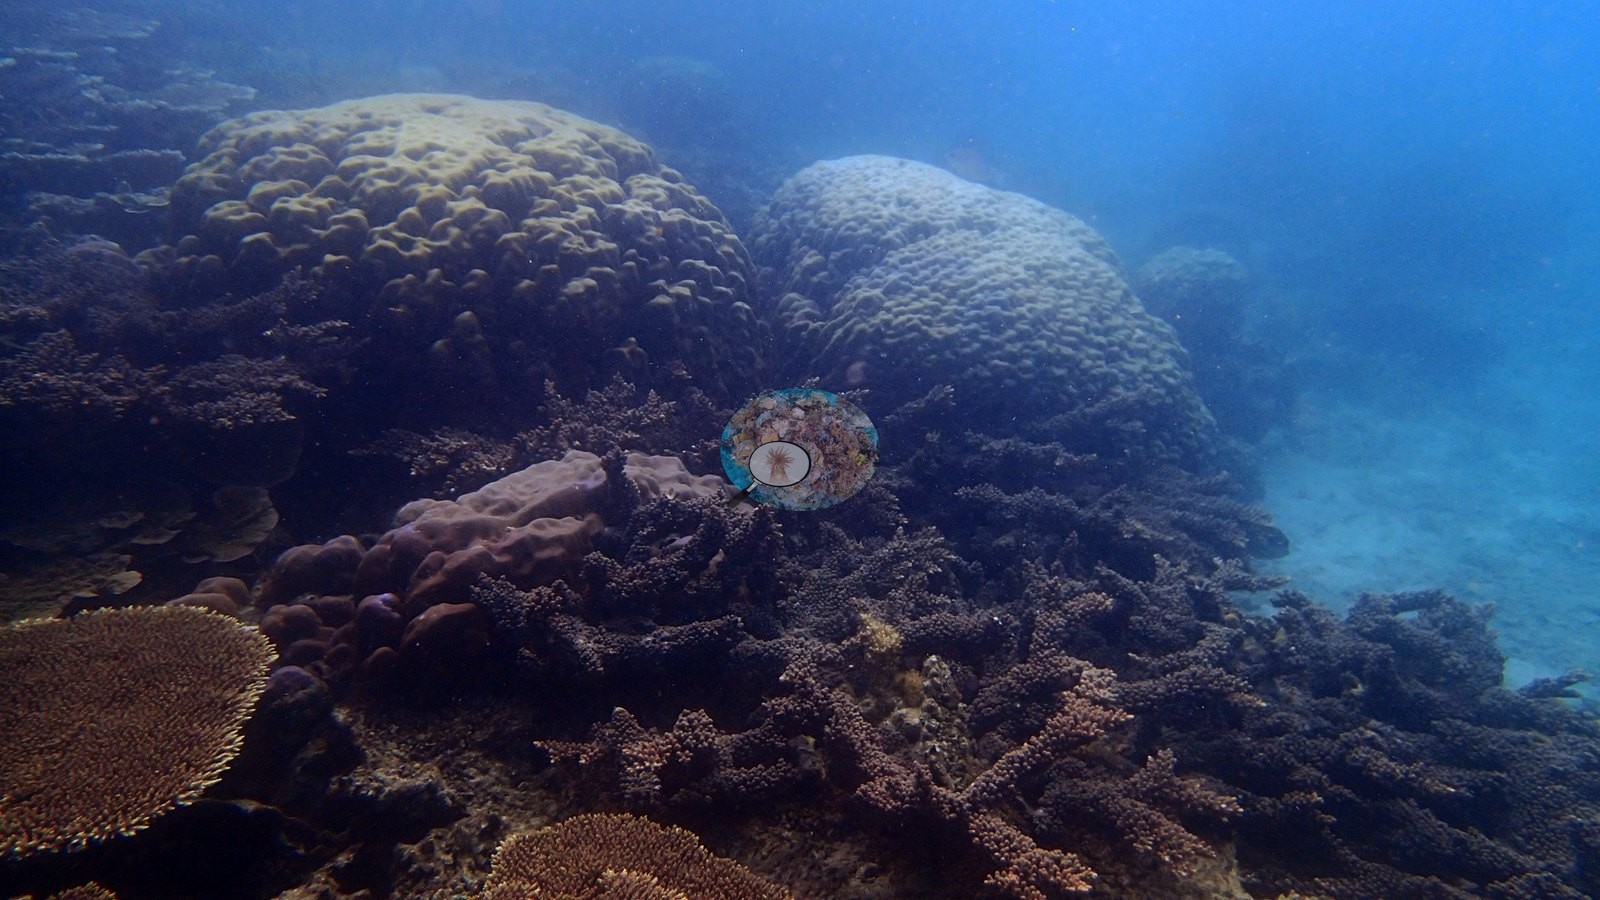
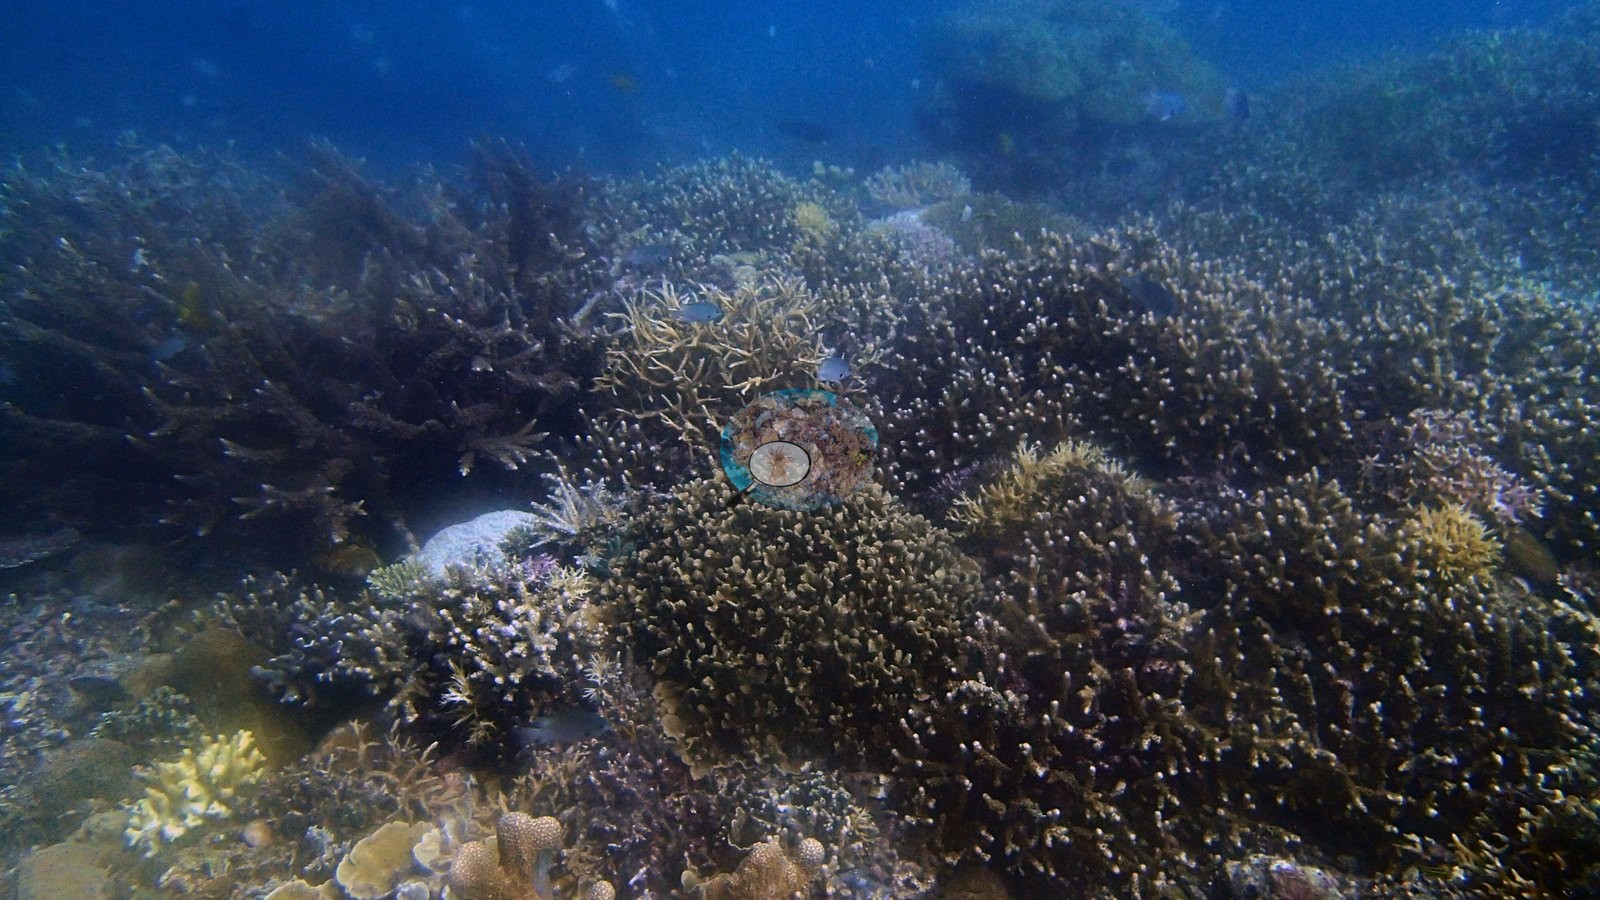
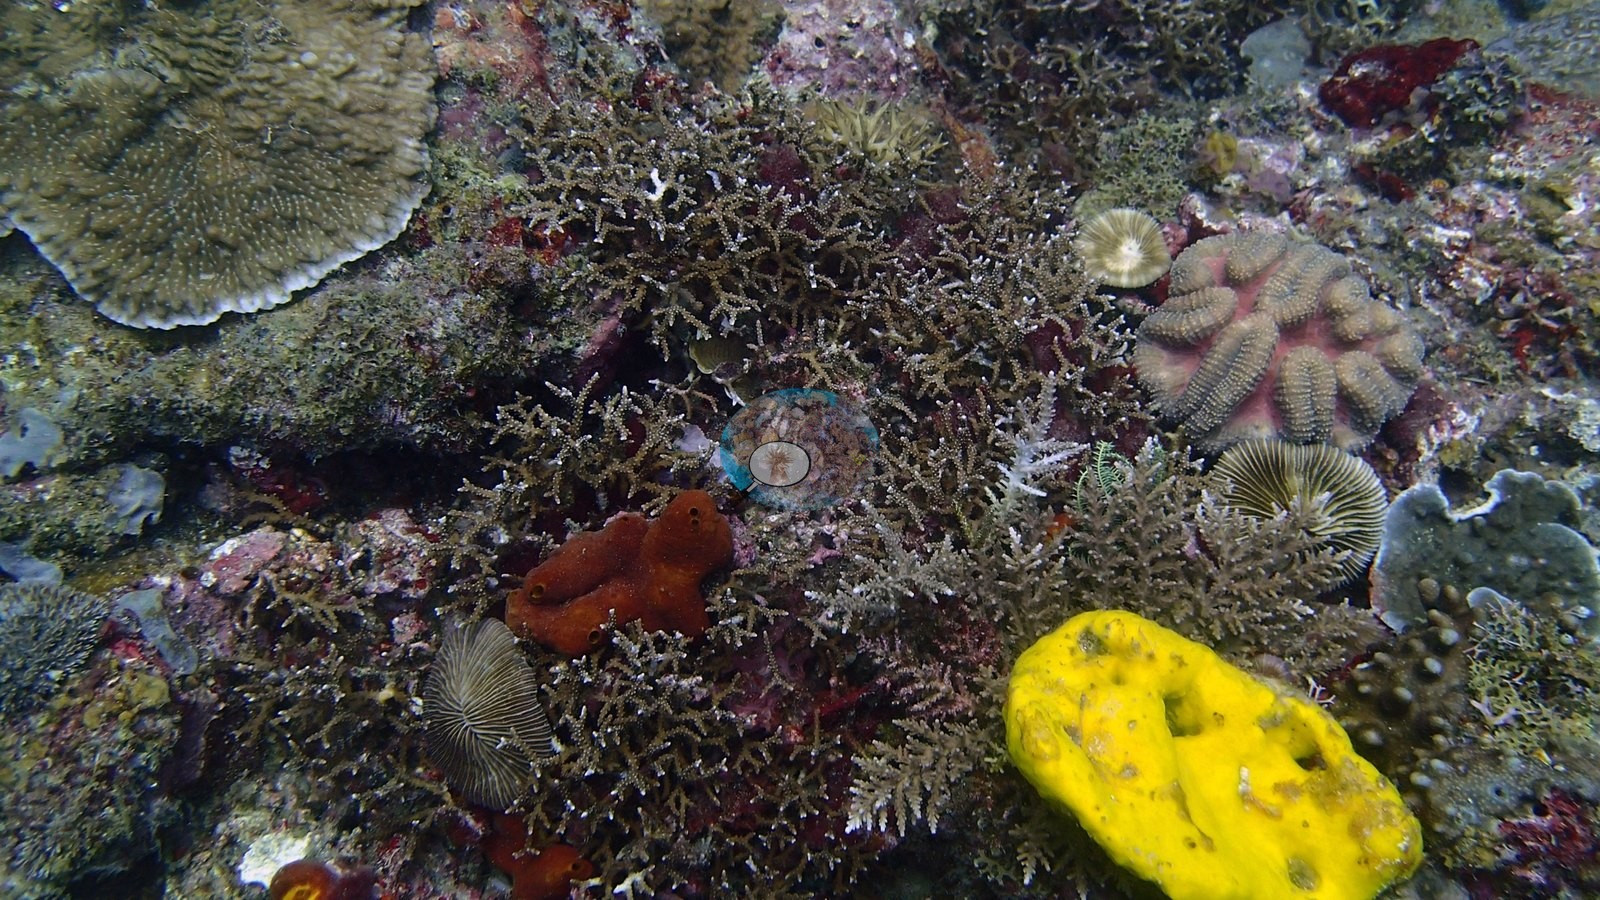
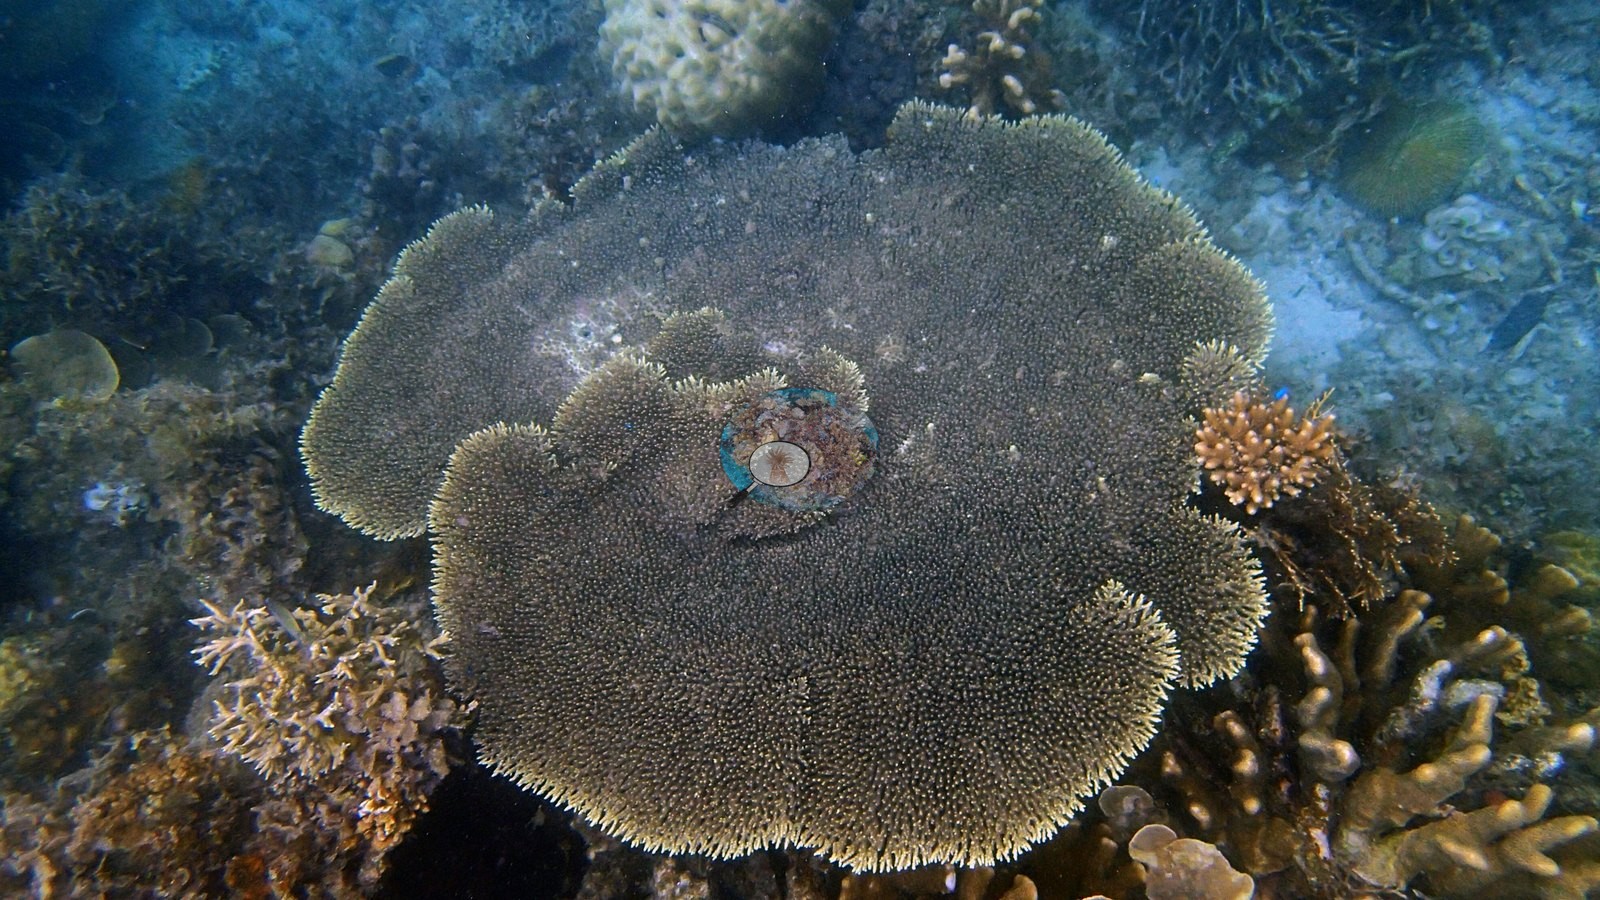
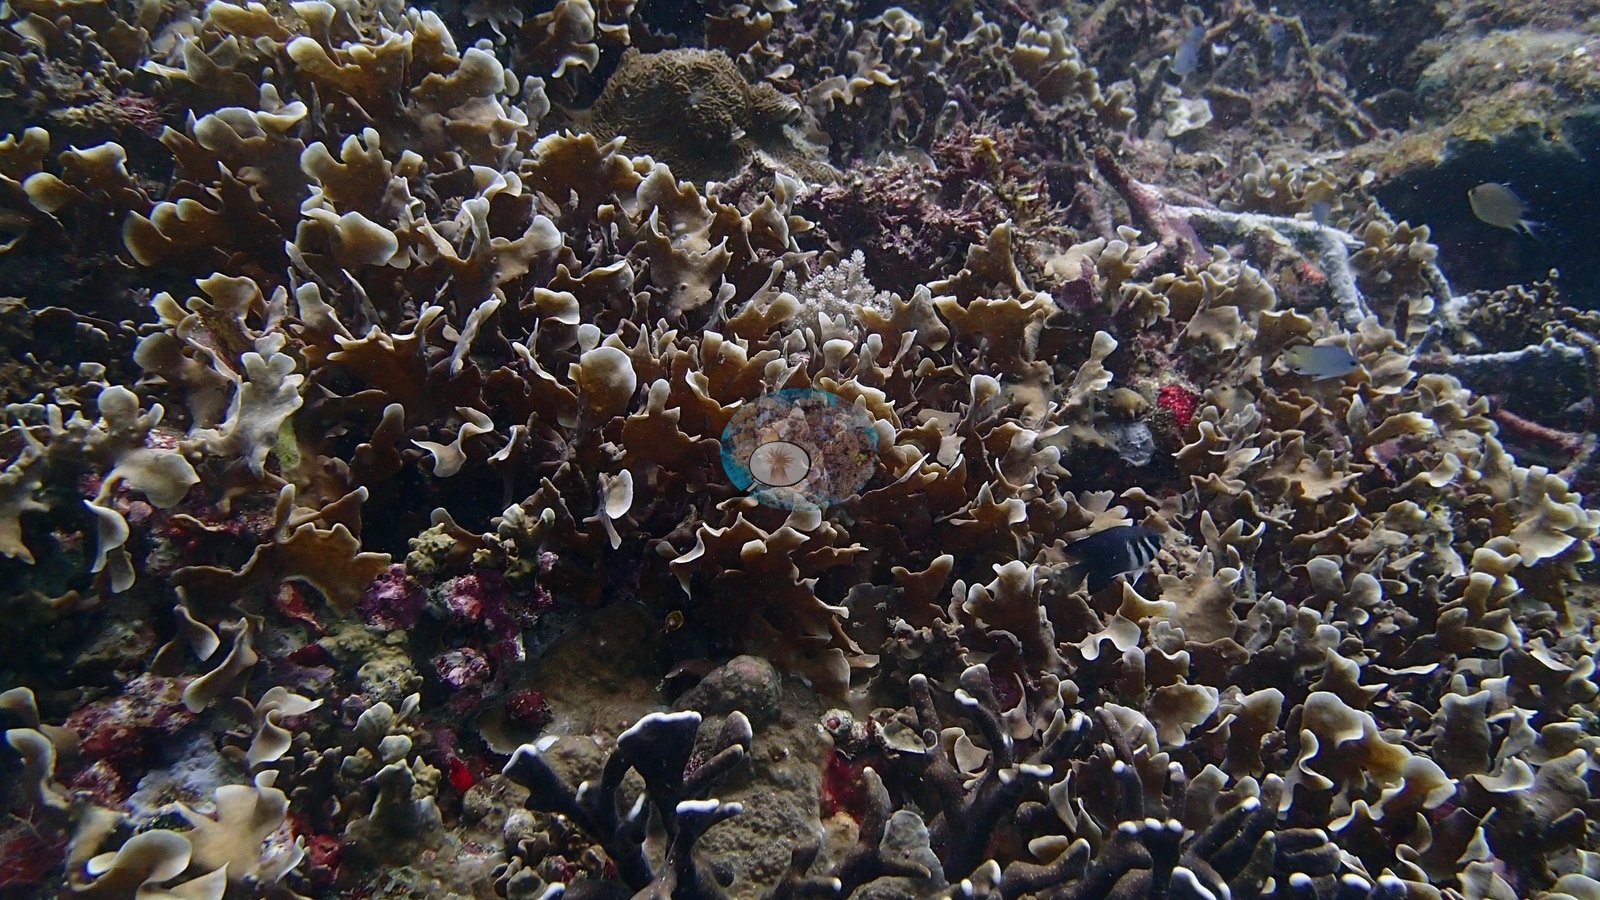
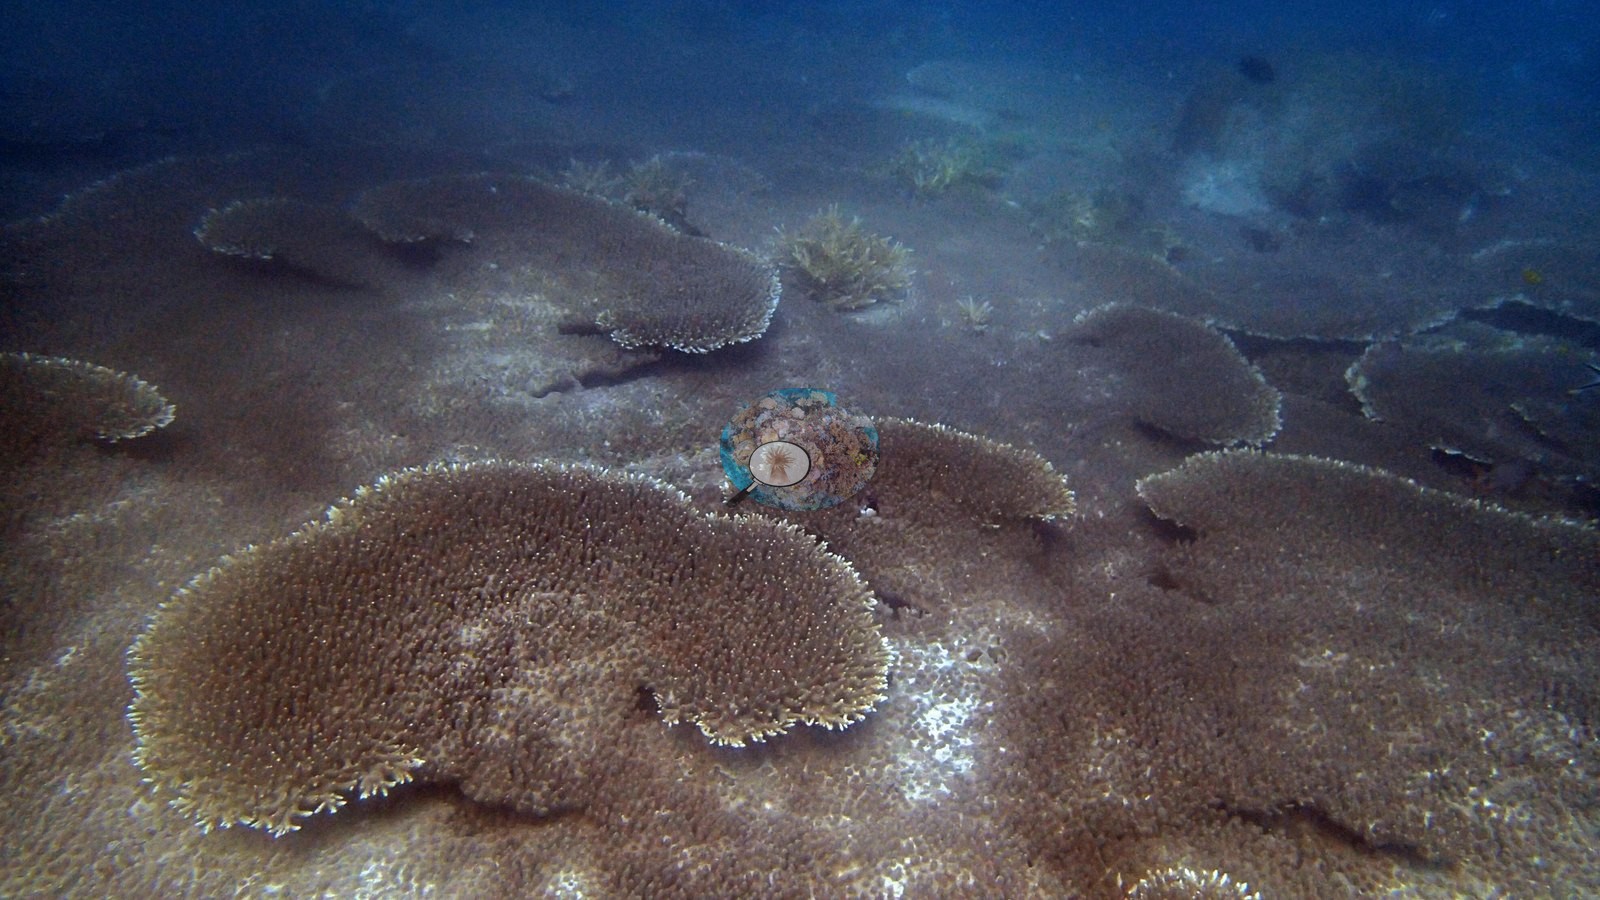
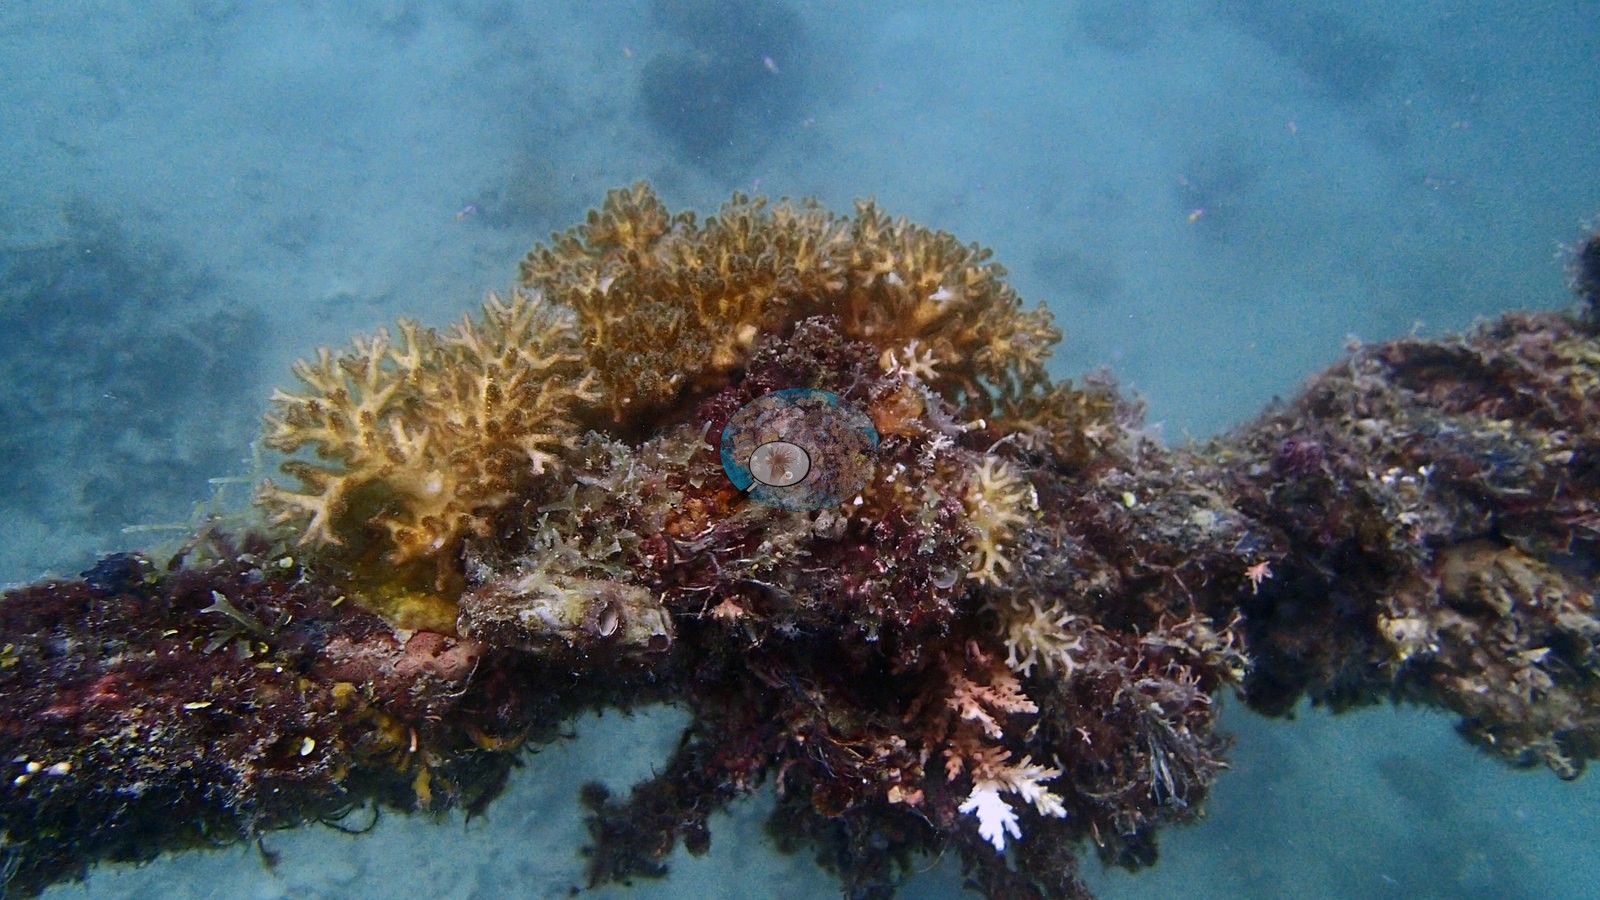
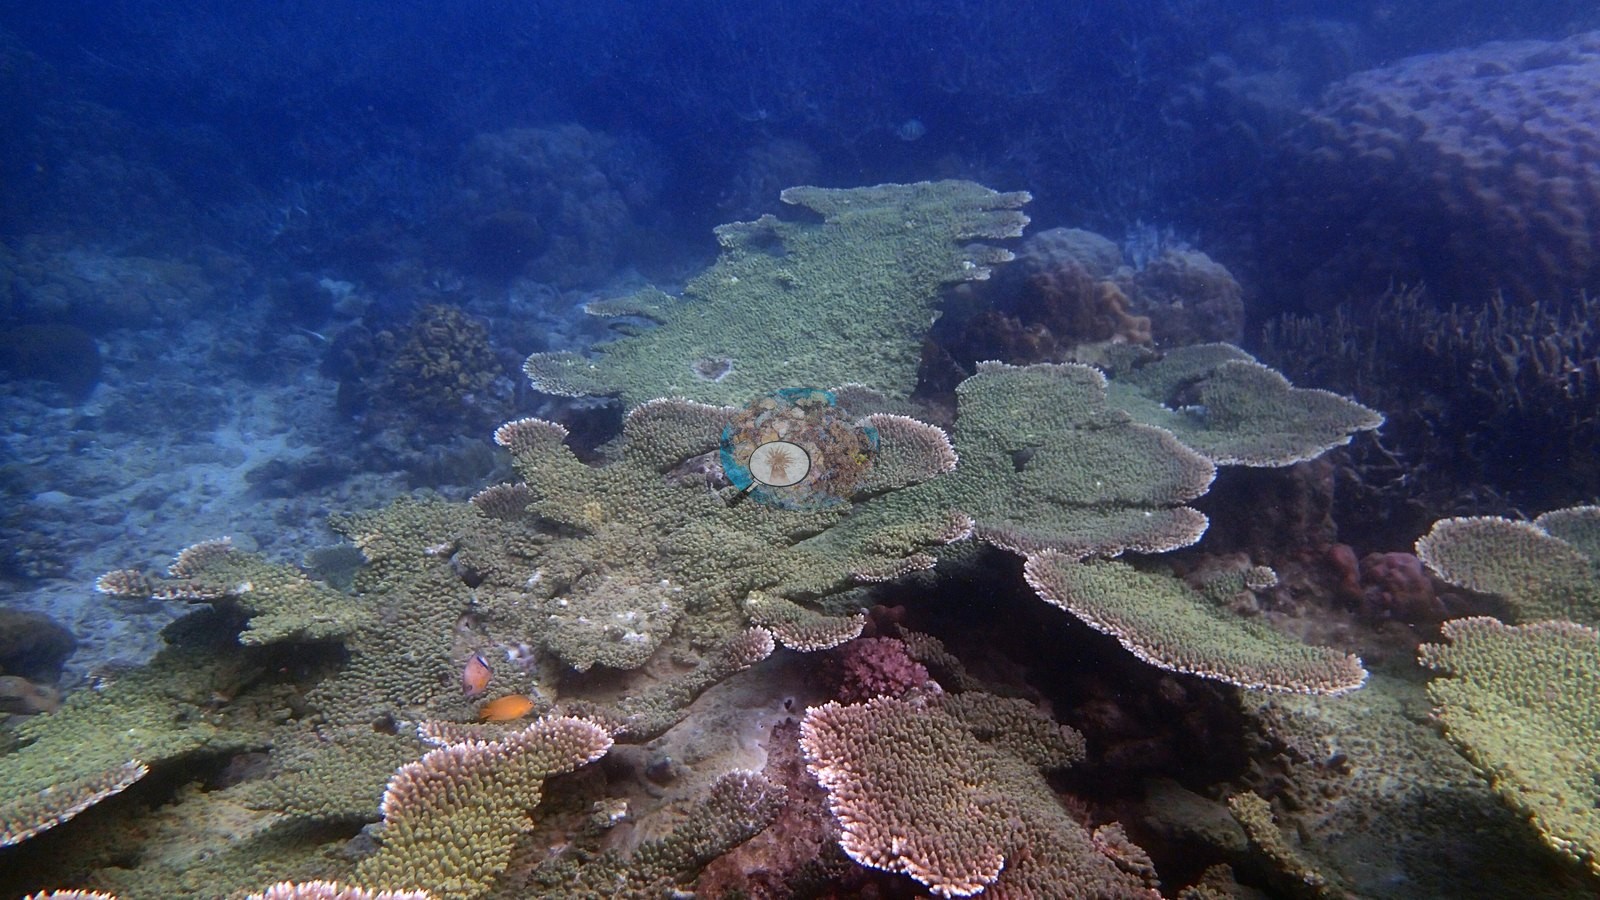
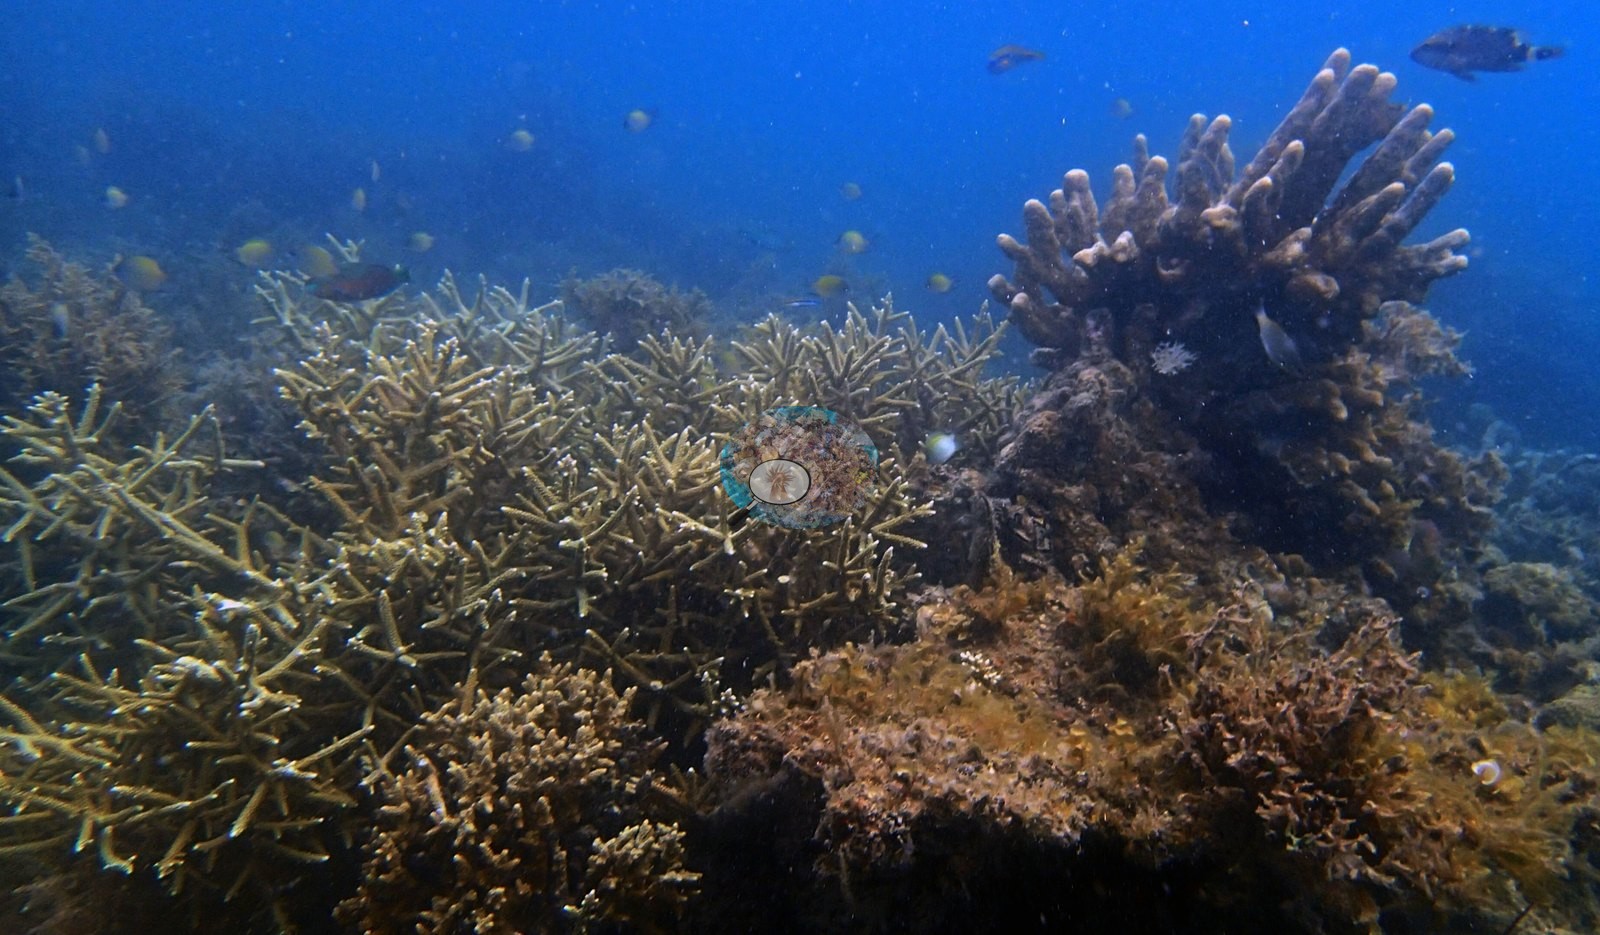
Acropora and plating corals define the best reefs. The first Port Barton island-hopping stop had vast monospecific staghorn and tabulate Acropora thickets beside an unbroken pavement of violet-edged foliose plating coral, with massive Porites bommies between them. Abdens had broad fields of tabular plates, one table several meters across, and Coral Gardens had overlapping foliose corals including Pachyseris interleaved with staghorn thickets. Paglugaban Rocks showed striking genus diversity, from Seriatopora and Pocillopora to Montipora, Porites, and brain corals. The wreck hulls were colonized by Euphyllia, Plerogyra, Turbinaria, soft corals, and at Taiei Maru an intact Acropora table on a beam.
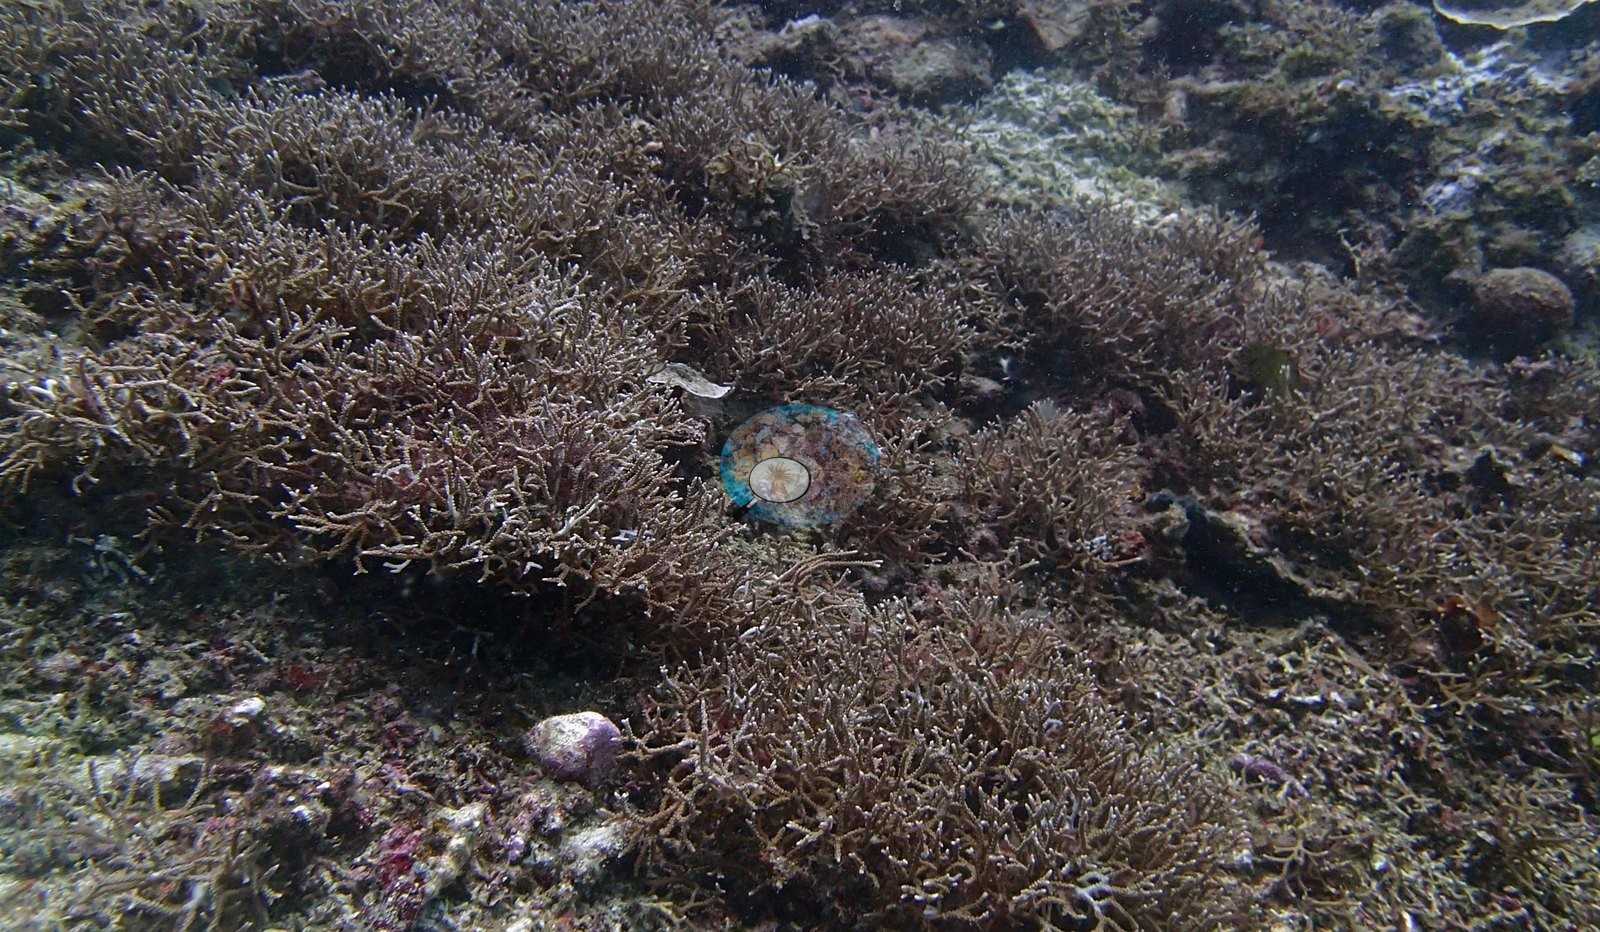
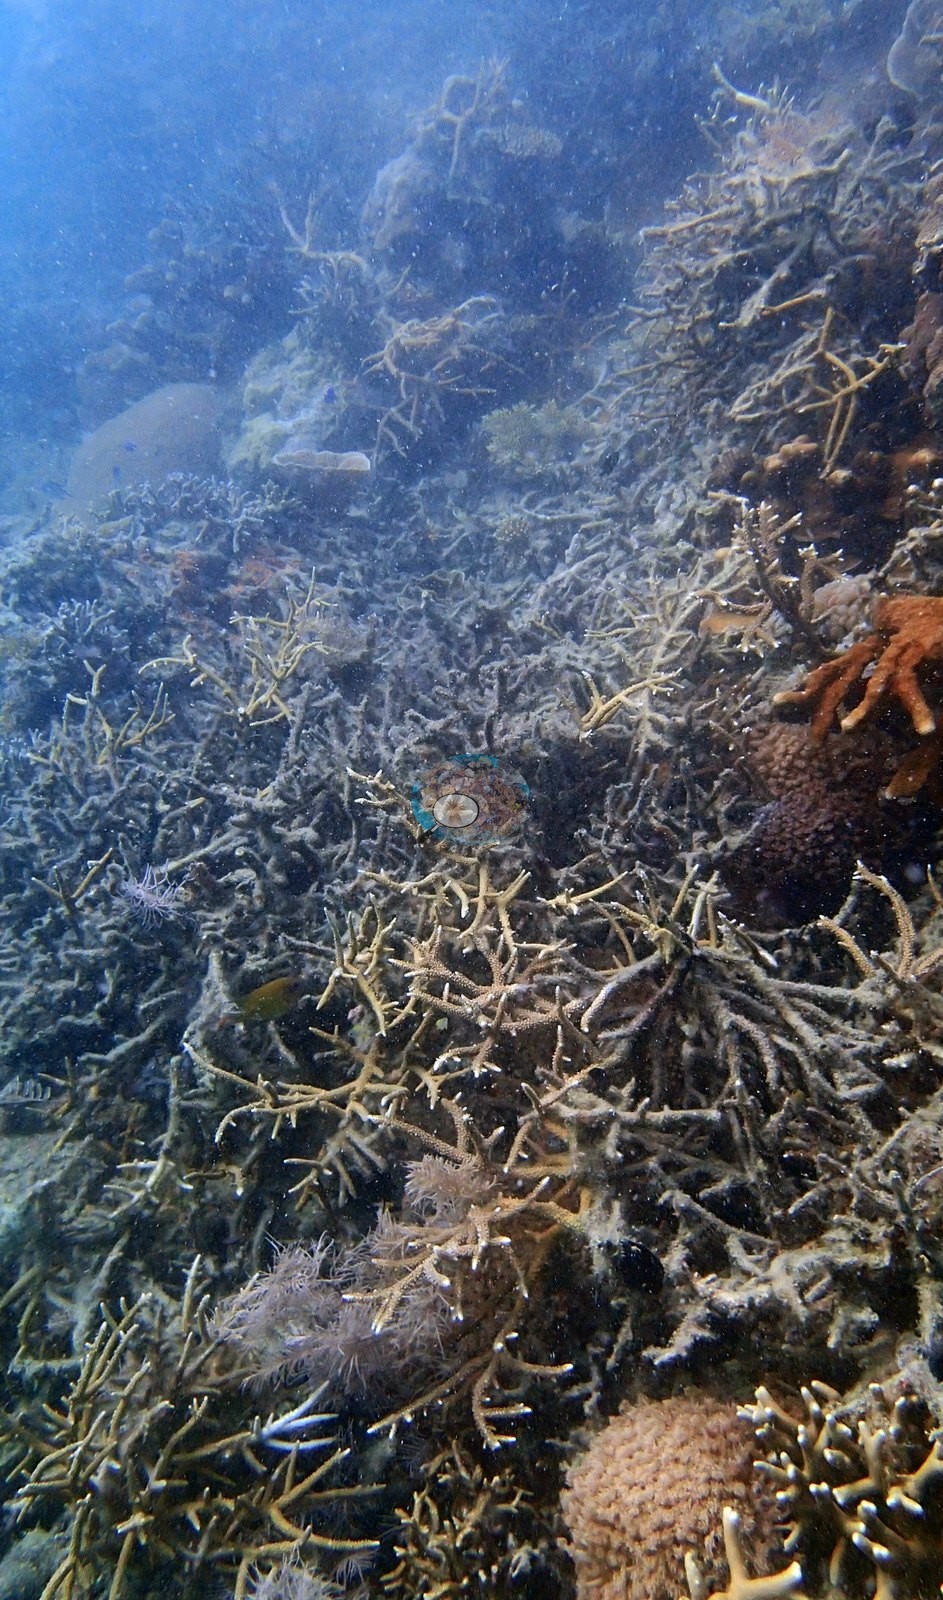
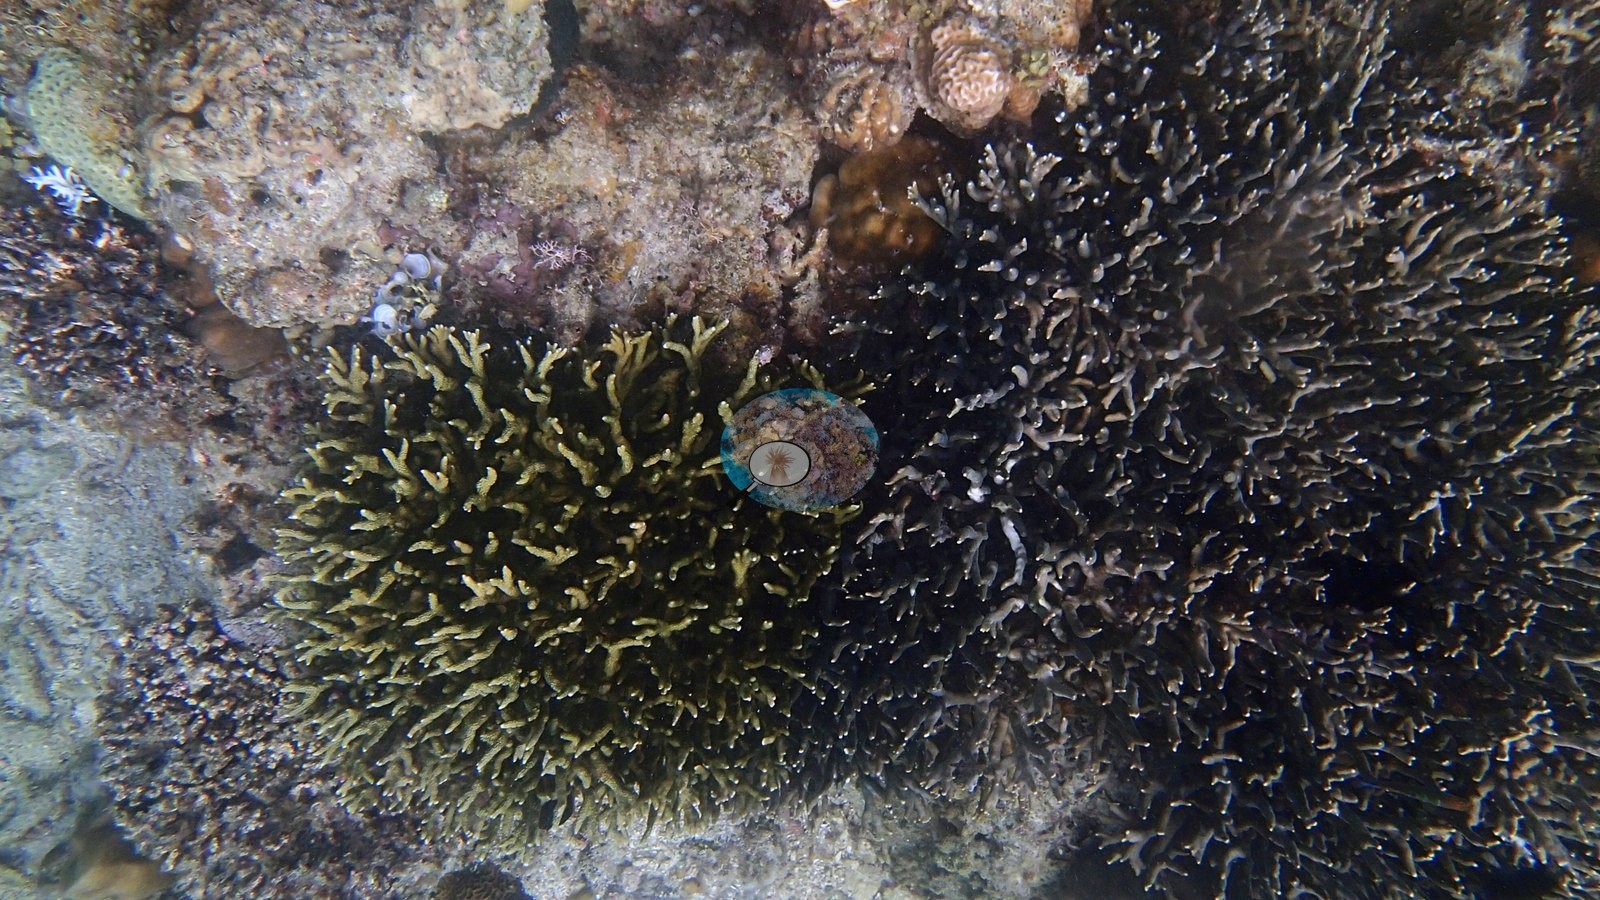
Photo-derived cover estimates on the natural reefs ranged from 17.2% at Nat Nat, with Abdens close behind at 17.5%, to 43.4% at the second Port Barton island-hopping stop. The first stop's 37.9% is likely an understatement given how much of it is solid living coral, and wreck values index hull colonization rather than reef cover. Condition was mostly good, with no site-wide bleaching. Flags were local: a partially bleached colony at the second island-hopping stop, where fleshy brown algae crowded rubble and dead framework, and scattered white patches or recent-mortality spots at Paglugaban Rocks and Coral Gardens. Reef 1 near Port Barton town was the clear exception, with extensive standing dead branching Acropora from an older mortality event. Small live recruits were growing on the dead branches there.
Visibility was poor on several dives, especially at Nat Nat and the Coron wrecks. Sightings include cuttlefish and a giant clam at Paglugaban Rocks, Culcita novaeguineae at Abdens, a batfish on the Taiei Maru, and a cluster of free-living mushroom corals at the second island-hopping stop.
Highlights
- 12 sites visited 20-28 January 2017 across Port Barton, El Nido, and Coron
- Port Barton island-hopping stop 1: vast staghorn and tabulate Acropora thickets beside an unbroken pavement of foliose plating coral
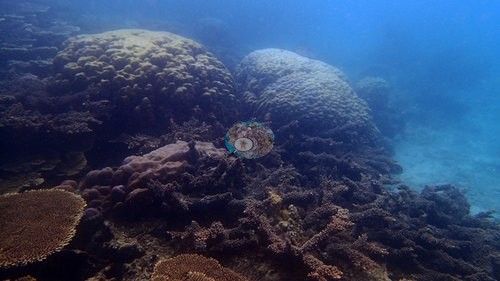 photo: Philippines - Port Barton, Palawan: island-hopping stop 1 (San Miguel area)
 - Abdens: continuous fields of tabular Acropora, one table several meters across
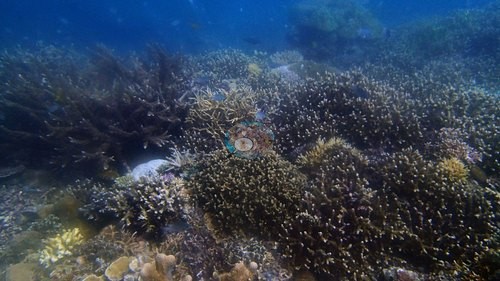 photo: Philippines - El Nido: Abdens (Bacuit Archipelago)
 - Paglugaban Rocks: striking genus diversity on a rocky fore reef, one of Anderson's favorite Philippine dives
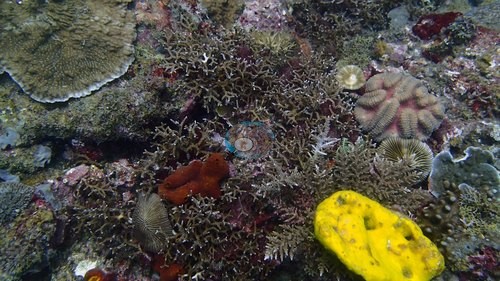 photo: Philippines - El Nido: Paglugaban Rocks (Bacuit Archipelago)
 - Two WWII wrecks at Coron (Akikushima and Taiei Maru) colonized by Euphyllia, Plerogyra, and foliose corals
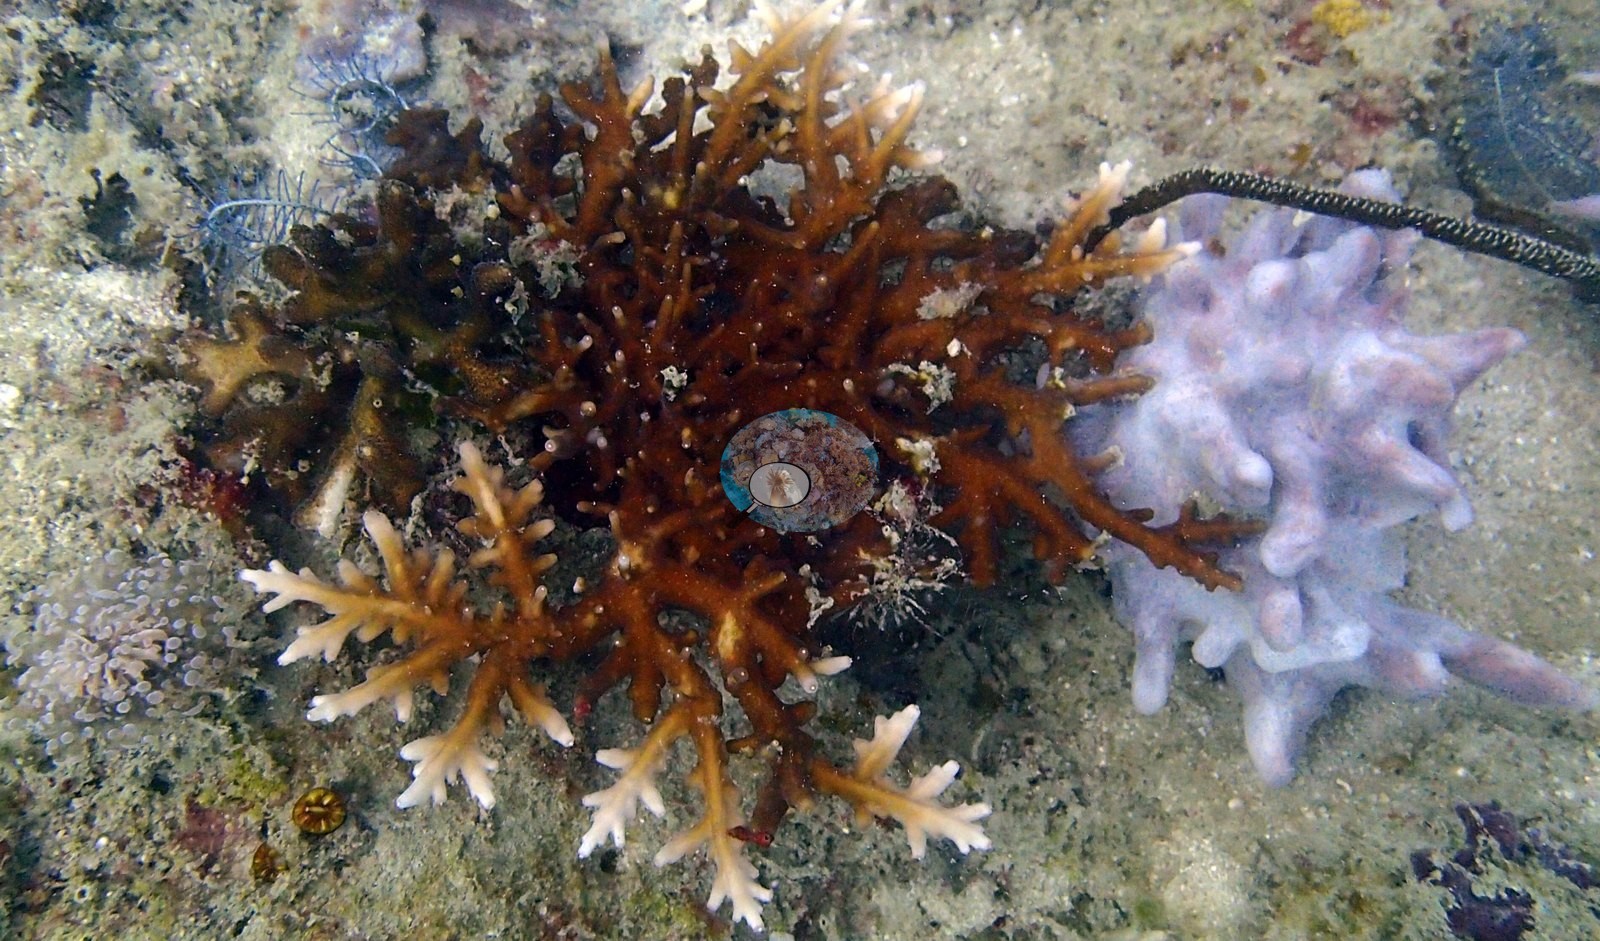
- Photo-derived cover on natural reefs from 17.2% (Nat Nat) to 43.4% (island-hopping stop 2)
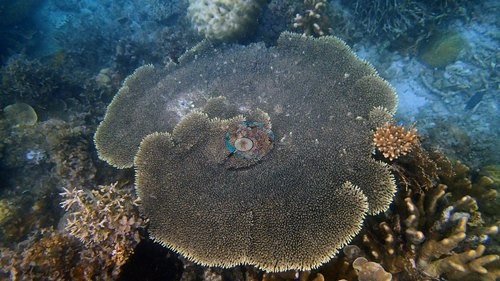 photo: Philippines - Port Barton, Palawan: island-hopping stop 2
Ito ay machine translation (salin ng makina) ng buod sa Ingles; ang tekstong Ingles ang may-awtoridad na bersyon. AI translation of this summary; the English is authoritative.
Regional setting
Inihahanay ng Spalding et al. (2001) ang mga bahura ng Palawan sa pinakaganap na nabuo sa Pilipinas, na may mga fringing reef at patch reef sa halos buong baybayin nito at live coral cover (sakop ng buhay na koral) na iniulat na 50-90% sa ilang lugar. Pinaniniwalaang bahagi ng isang mahaba at nakalubog na barrier reef ang mga bank at shoal sa labas ng kanlurang baybayin, at may dalawang pangunahing sistema ng atoll ang Sulu Sea, ang Cagayan Islands at Tubbataha, at ang huli ay binubuo ng dalawang atoll. Noong panahong iyon, ang Palawan, silangang Luzon, at timog Sulu Sea lamang ang mga lugar kung saan hindi itinuring ng mga awtor na labis nang nahuhuli ang mga demersal na isda, ngunit binabanggit nila na posibleng laganap sa karagatan ng Palawan ang pooling, kung saan isandaan o higit pang maninisid ang nagtataboy ng isda papunta sa lambat gamit ang buga ng compressed air. Kabilang sa kanilang listahan ng mga protected area ang Palawan Biosphere Reserve (11,508 km², 1990), El Nido Marine Reserve (950 km², 1992), at Tubbataha, isang World Heritage Site mula pa noong 1993. Sa buong bansa, tinatantya nilang mga 25,060 km² ang bahura, na may 421 uri (species) ng koral na naitala at 577 na tinatayang. Inilalagay ng Souter et al. (2021) ang ecoregion ng Palawan/North Borneo sa pinakamalaking subregion ng East Asian Seas, 32,567 km², o 41.6% ng lawak ng bahura ng rehiyon.
Sa subregion na iyon, natuklasan ng Souter et al. (2021) ang malalaking pagbabago-bago sa modeled na hard coral cover at malaking pagbaba ng algal cover, ngunit ang datos ay mula sa 171 site, at wala ni isa sa mga ito ang na-monitor nang mahigit 15 taon. Sa buong rehiyon, iniuugnay nila ang pagkawala ng koral sa mga mass bleaching event noong 2010 at 2016, at binabanggit nila ang labis na pangingisda, coastal aquaculture, siltation, eutrophication, at marine plastic bilang mga pangunahing lokal na panggigipit. Inilarawan ni Wilkinson (2006) ang kalagayan ng mga bahura sa Pilipinas noong 2004 bilang patuloy pa ring humihina, sa ilalim ng mabigat na panggigipit ng pangingisda, kabilang ang mga mapanirang paraan, at ng sediment mula sa pagpapaunlad ng baybayin.
Overview
Binisita ang 12 site sa Palawan sa pagitan ng 20 at 28 Enero 2017 sa tatlong lugar: Port Barton, ang Bacuit Archipelago sa labas ng El Nido, at Busuanga at Coron Island. Pinaghahalo nila ang mga likas na bahura at tatlong lumubog na barko (wreck). Sa Port Barton, ang mga ito ay ang Alberguin wreck sa maburak na buhangin, isang mababaw na snorkel sa look (Reef 1), at dalawang hintuan sa island-hopping. Sa El Nido, ang mga ito ay ang Nat Nat, Paglugaban Rocks (isang marahang umaalon na fore reef sa paligid ng isang batuhan sa laot), at Abdens. Sa Coron, ang mga ito ay ang mga WWII wreck na Akikushima at Taiei Maru, ang Coral Gardens, at mga snorkel sa mga karst lagoon ng Twin Lagoon at Green Lagoon.
Ang Acropora at mga plating coral ang tumutukoy sa pinakamahuhusay na bahura. Ang unang hintuan sa island-hopping sa Port Barton ay may malalawak na monospecific na kasukalan ng staghorn at tabulate na Acropora sa tabi ng walang-patid na pavement ng foliose plating coral na may lilang gilid, at may mga massive na bommie ng Porites sa pagitan ng mga ito. Ang Abdens ay may malalawak na parang ng mga tabular na plato, at ang isang mesa ay ilang metro ang lapad; ang Coral Gardens naman ay may nagpapatong-patong na foliose na koral, kabilang ang Pachyseris, na nakasingit sa mga kasukalan ng staghorn. Nagpakita ang Paglugaban Rocks ng kapansin-pansing diversity ng genus, mula Seriatopora at Pocillopora hanggang Montipora, Porites, at brain coral. Ang mga katawan (hull) ng mga wreck ay tinirhan ng Euphyllia, Plerogyra, Turbinaria, at mga soft coral, at sa Taiei Maru, ng isang buo pang mesa ng Acropora sa isang biga.
Ang mga pagtatantya ng cover mula sa larawan sa mga likas na bahura ay mula 19.2% sa Nat Nat hanggang 43.4% sa ikalawang hintuan sa island-hopping sa Port Barton. Malamang na kulang ang 37.9% ng unang hintuan, dahil napakalaking bahagi nito ay buo at buhay na koral, at ang mga halaga para sa mga wreck ay sukatan ng pagtira ng buhay sa katawan ng barko sa halip na cover ng bahura. Karamihan ay nasa mabuting kalagayan, at walang bleaching sa buong site. Lokal ang mga palatandaan: isang bahagyang pumuting kolonya sa ikalawang hintuan sa island-hopping, kung saan sinisiksik ng malamang brown algae ang rubble (durog na koral) at patay na balangkas ng bahura, at mga kalat-kalat na puting bahagi o bakas ng kamakailang pagkamatay sa Paglugaban Rocks at Coral Gardens. Ang Reef 1 malapit sa bayan ng Port Barton ang malinaw na eksepsiyon, na may malawak na nakatayong patay na branching Acropora mula sa isang mas lumang mortality event. May maliliit na buhay na recruit na tumutubo sa mga patay na sanga roon.
Mahina ang visibility sa ilang dive, lalo na sa Nat Nat at sa mga wreck ng Coron. Kabilang sa mga nakita ang cuttlefish at isang taklobo sa Paglugaban Rocks, Culcita novaeguineae sa Abdens, isang batfish sa Taiei Maru, at isang kumpol ng malayang nabubuhay na mushroom coral sa ikalawang hintuan sa island-hopping.
Highlights
- 12 site na binisita noong 20-28 Enero 2017 sa Port Barton, El Nido, at Coron
- Port Barton, hintuan 1 sa island-hopping: malalawak na kasukalan ng staghorn at tabulate na Acropora sa tabi ng walang-patid na pavement ng foliose plating coral
- Abdens: tuloy-tuloy na parang ng tabular na Acropora, at ang isang mesa ay ilang metro ang lapad
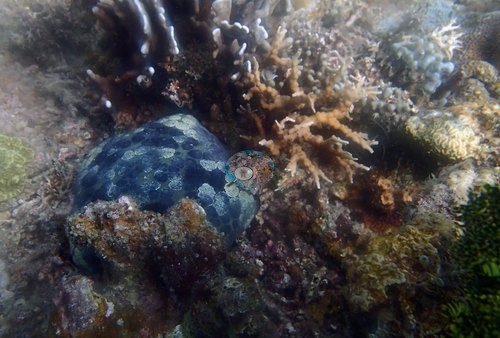 photo: Philippines - El Nido: Abdens (Bacuit Archipelago)
 - Paglugaban Rocks: kapansin-pansing diversity ng genus sa isang mabatong fore reef, isa sa mga paboritong dive ni Anderson sa Pilipinas
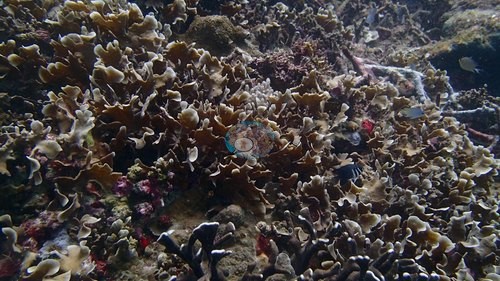 photo: Philippines - El Nido: Paglugaban Rocks (Bacuit Archipelago)
 - Dalawang WWII wreck sa Coron (Akikushima at Taiei Maru) na tinirhan ng Euphyllia, Plerogyra, at foliose na koral
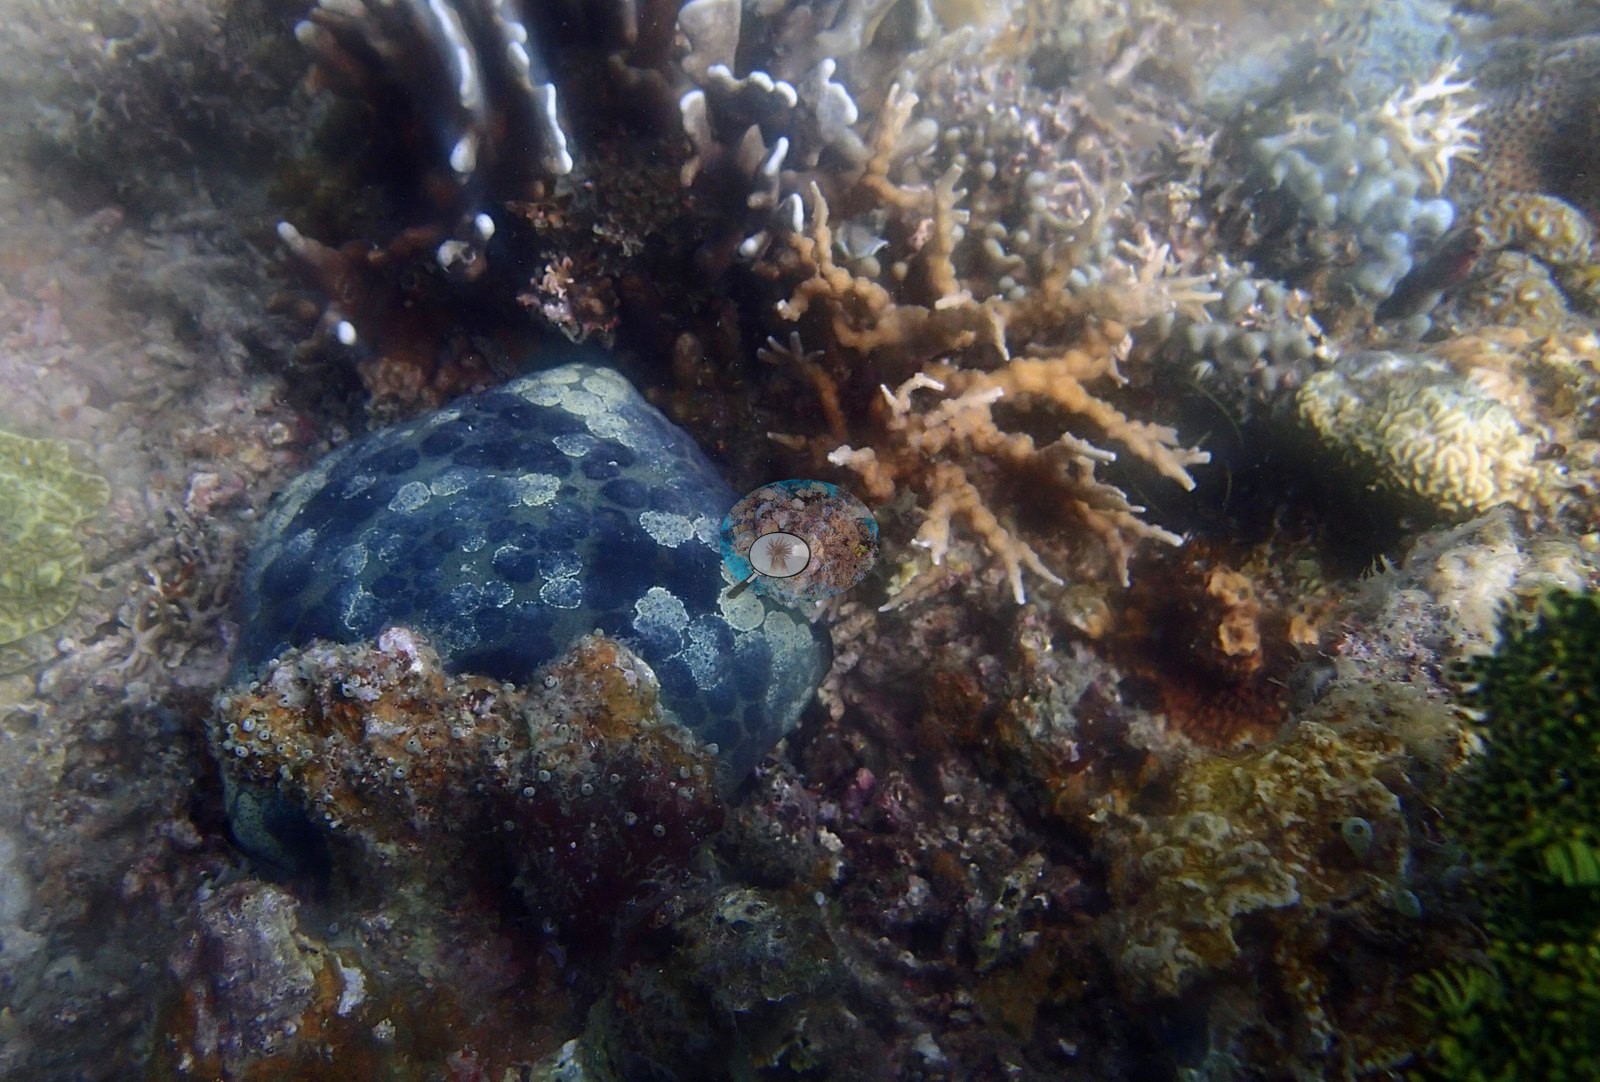
- Cover mula sa larawan sa mga likas na bahura: mula 19.2% (Nat Nat) hanggang 43.4% (hintuan 2 sa island-hopping)
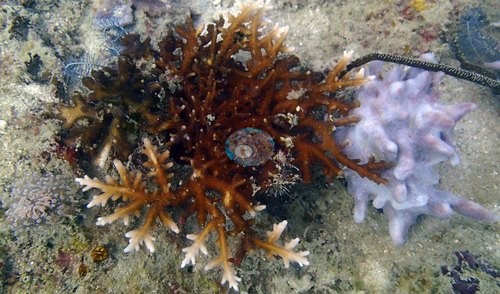 photo: Philippines - El Nido: Nat Nat (Bacuit Archipelago)
Notable observations
- Philippines - El Nido: Nat Nat (Bacuit Archipelago): A Seriatopora colony photographed and labeled dying
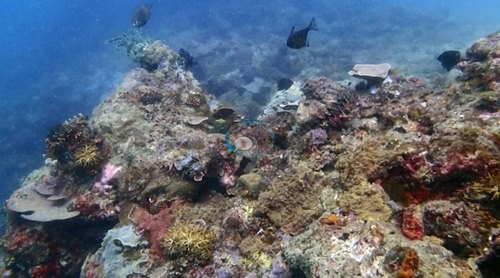
- Philippines - El Nido: Paglugaban Rocks (Bacuit Archipelago): Scattered stark-white patches on single colonies read as isolated recent-mortality spots; one large white plate consistent with recently dead skeleton; broken branching framework ('brittle reef') - physical breakage, not disease; no crown-of-thorns starfish (COTS)
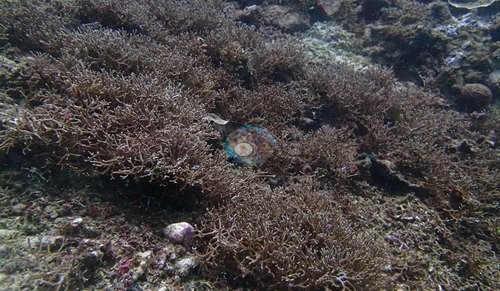
- Philippines - El Nido: Abdens (Bacuit Archipelago): One small white patch on a single colony, the only ambiguous spot; not a site-level signal
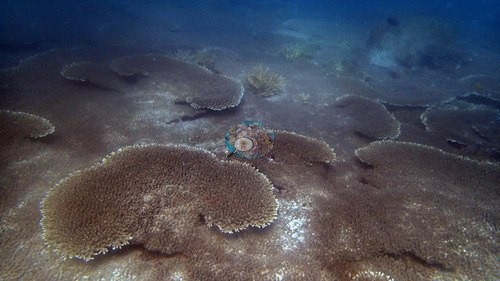
- Philippines - Coron: Coral Gardens, Busuanga: Four frames with localized white: a stark-white branch cluster, a pale lesion on one plate, two white pavement patches, and one bare Acropora skeleton; no site-wide bleaching
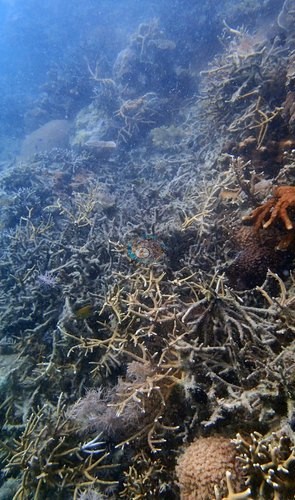
- Philippines - Port Barton, Palawan: Alberguin wreck: Several colonies conspicuously pale (cream pocilloporid, whitish Acropora, pale Favites); no lesions, tissue loss, or COTS
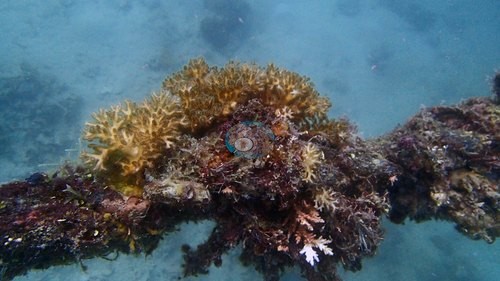
- Philippines - Port Barton, Palawan: Reef 1 (bay snorkel): Extensive standing dead branching Acropora, algal-colonized and breaking to rubble (old mortality); one frame captioned 'pollution damaged reef' by Anderson
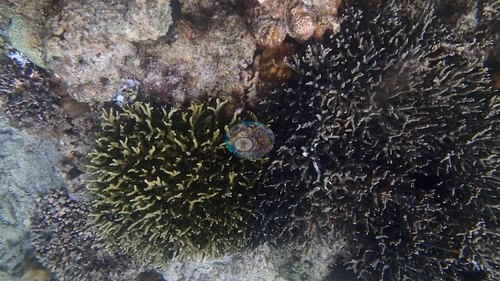
- Philippines - Port Barton, Palawan: island-hopping stop 1 (San Miguel area): Two frames with a small bright-white patch read as a recently broken or recently dead branch cluster, not a bleaching event
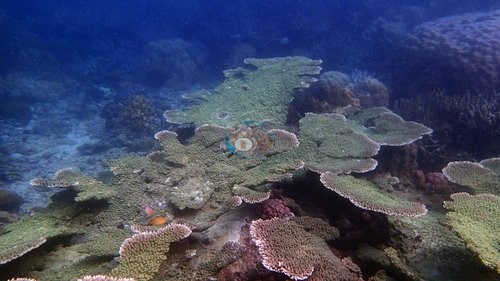
- Philippines - Port Barton, Palawan: island-hopping stop 2: One small coral colony showing partial, localized tissue bleaching - not reef-wide; fleshy brown macroalgae over rubble and dead framework
Coral cover over time (pooled)
Sites in this region (12)
- Philippines - Coron: Akikushima (seaplane tender wreck), Busuanga — 18% coral cover
- Philippines - Coron: Coral Gardens, Busuanga — 31% coral cover
- Philippines - Coron: Green Lagoon (island-hopping snorkel) — 36% coral cover
- Philippines - Coron: Taiei Maru (oil tanker wreck), Busuanga — 15% coral cover
- Philippines - Coron: Twin Lagoon (island-hopping snorkel) — 23% coral cover
- Philippines - El Nido: Abdens (Bacuit Archipelago) — 18% coral cover
- Philippines - El Nido: Nat Nat (Bacuit Archipelago) — 17% coral cover
- Philippines - El Nido: Paglugaban Rocks (Bacuit Archipelago) — 29% coral cover
- Philippines - Port Barton, Palawan: Alberguin wreck — 29% coral cover
- Philippines - Port Barton, Palawan: island-hopping stop 1 (San Miguel area) — 38% coral cover
- Philippines - Port Barton, Palawan: island-hopping stop 2 — 43% coral cover
- Philippines - Port Barton, Palawan: Reef 1 (bay snorkel) — 39% coral cover
Nearby external survey stations
32 independent survey records within 5 km of a site in this region (deduplicated across sites).
Show all 32 records
- Reef Check — 7th Comando Outside (2013): 4.4% hard coral cover, 1.65 km from Philippines - El Nido: Nat Nat (Bacuit Archipelago)
- Reef Check — 7th Comando Outside (2014): 7.5% hard coral cover, 1.65 km from Philippines - El Nido: Nat Nat (Bacuit Archipelago)
- Reef Check — 7th Comando Outside (2014): 5.9% hard coral cover, 1.65 km from Philippines - El Nido: Nat Nat (Bacuit Archipelago)
- Reef Check — Abdeen's Rock (2013): 42% hard coral cover, 2.69 km from Philippines - El Nido: Abdens (Bacuit Archipelago)
- Reef Check — Abdeen's Rock (2014): 61% hard coral cover, 2.69 km from Philippines - El Nido: Abdens (Bacuit Archipelago)
- Reef Check — Albaguen Island (1998): 24% hard coral cover, 1.40 km from Philippines - Port Barton, Palawan: Alberguin wreck
- Reef Check — Bukal (2013): 34% hard coral cover, 2.60 km from Philippines - El Nido: Nat Nat (Bacuit Archipelago)
- Reef Check — Bukal (2014): 34% hard coral cover, 2.60 km from Philippines - El Nido: Nat Nat (Bacuit Archipelago)
- Reef Check — CYC East Reef (2013): 73% hard coral cover, 3.30 km from Philippines - Coron: Green Lagoon (island-hopping snorkel)
- Reef Check — CYC East Reef (2014): 50% hard coral cover, 3.30 km from Philippines - Coron: Green Lagoon (island-hopping snorkel)
- Reef Check — CYC East Reef (2015): 34% hard coral cover, 3.30 km from Philippines - Coron: Green Lagoon (island-hopping snorkel)
- Reef Check — CYC West Reef (2013): 66% hard coral cover, 3.59 km from Philippines - Coron: Green Lagoon (island-hopping snorkel)
- Reef Check — CYC West Reef (2014): 30% hard coral cover, 3.59 km from Philippines - Coron: Green Lagoon (island-hopping snorkel)
- Reef Check — CYC West Reef (2015): 28% hard coral cover, 3.59 km from Philippines - Coron: Green Lagoon (island-hopping snorkel)
- Reef Check — Caalan marine protected area (MPA) A (2013): 36% hard coral cover, 1.79 km from Philippines - El Nido: Nat Nat (Bacuit Archipelago)
- Reef Check — Caalan MPA A (2013): 42% hard coral cover, 1.79 km from Philippines - El Nido: Nat Nat (Bacuit Archipelago)
- Reef Check — Caalan MPA A (2014): 49% hard coral cover, 1.79 km from Philippines - El Nido: Nat Nat (Bacuit Archipelago)
- Reef Check — Caalan MPA B (2013): 45% hard coral cover, 1.27 km from Philippines - El Nido: Nat Nat (Bacuit Archipelago)
- Reef Check — Caalan MPA B (2014): 29% hard coral cover, 1.27 km from Philippines - El Nido: Nat Nat (Bacuit Archipelago)
- Reef Check — Caalan MPA B (2014): 37% hard coral cover, 1.27 km from Philippines - El Nido: Nat Nat (Bacuit Archipelago)
- Reef Check — Exotic Island (2019): 33% hard coral cover, 0.90 km from Philippines - Port Barton, Palawan: Alberguin wreck
- Reef Check — German Island (2019): 16% hard coral cover, 4.05 km from Philippines - Port Barton, Palawan: Alberguin wreck
- Reef Check — Ipil MPA (Inside) Brgy. Buena Suerte (2013): 22% hard coral cover, 1.26 km from Philippines - El Nido: Nat Nat (Bacuit Archipelago)
- Reef Check — Ipil MPA (Inside) Brgy. Buena Suerte (2013): 23% hard coral cover, 1.26 km from Philippines - El Nido: Nat Nat (Bacuit Archipelago)
- Reef Check — Ipil MPA (Inside) Brgy. Buena Suerte (2014): 24% hard coral cover, 1.26 km from Philippines - El Nido: Nat Nat (Bacuit Archipelago)
- Reef Check — Maitre MPA (Inside) (2013): 28% hard coral cover, 4.86 km from Philippines - El Nido: Nat Nat (Bacuit Archipelago)
- Reef Check — Maitre MPA (Inside) (2014): 33% hard coral cover, 4.86 km from Philippines - El Nido: Nat Nat (Bacuit Archipelago)
- Reef Check — Maitre MPA (Inside) (2015): 24% hard coral cover, 4.86 km from Philippines - El Nido: Nat Nat (Bacuit Archipelago)
- Reef Check — Mantaray Reef (1998): 34% hard coral cover, 3.91 km from Philippines - Port Barton, Palawan: Alberguin wreck
- Reef Check — Paraiso Reef (1998): 31% hard coral cover, 0.88 km from Philippines - Port Barton, Palawan: Alberguin wreck
- Reef Check — Riddle Point (2018): 22% hard coral cover, 1.24 km from Philippines - Port Barton, Palawan: Alberguin wreck
- Reef Check — Siete Pecados Islands (2004): 46% hard coral cover, 2.99 km from Philippines - Coron: Coral Gardens, Busuanga
All images from Coral Reef Diagnostics. Data are from Coral Reef Diagnostics and Reef Check Foundation.
© Coral Reef Diagnostics.
References
- Souter D, et al. (eds) (2021) Status of Coral Reefs of the World: 2020. International Coral Reef Initiative / Global Coral Reef Monitoring Network. [PDF]
- Spalding MD, et al. (2001) World Atlas of Coral Reefs. University of California Press, Berkeley. [PDF]
- Wilkinson C (2006) Status of coral reefs of the world: summary of threats and remedial action. In: Côté IM, Reynolds JD (eds) Coral Reef Conservation. Cambridge University Press, Cambridge. [PDF]