
Philippines - Anilao: Ligpo Island

Part of the regional summaries: Philippines - Luzon and Philippines
More info
Central Philippines (NOAA CRW virtual station) · Eastern Philippines ecoregion mean=7.5°C-heating weeksLigpo Island is more a soft-coral, sponge, and gorgonian site than a stony-coral one, with dense Dendronephthya, Sarcophyton, pulsing Xenia fields, and standing barrel sponges over a moderate-relief rocky slope; stony corals present include tabular Acropora and Turbinaria. A bleached-white anemone sector and one stark-white branching colony are localized flags, not a site-wide signal. Cover estimate is roughly 21-34%, averaging 27.6%.
Ang Ligpo Island ay higit na isang lugar ng malalambot na koral, espongha, at gorgonian kaysa sa matigas na koral, na may masinsing Dendronephthya, Sarcophyton, mga latag ng pumipintig na Xenia, at nakatayong barrel sponge sa isang mabatong dalisdis na katamtaman ang taas; kabilang sa mga matigas na koral dito ang tabular na Acropora at Turbinaria. Isang sektor ng namuputing anemone at isang lantang-puting sumasangang kolonya ay mga lokal na palatandaan lamang, hindi senyales para sa buong lugar. Ang tantiya ng saklaw ay humigit-kumulang 21-34%, na may katamtamang 27.6%.
Salin ng buod na ito gamit ang AI; ang Ingles ang opisyal na bersyon.
Two independent survey stations shown with the program’s logo — click one to see how far it is from this site.
One other CRD dive site within 5 km shown in orange — click a marker to open its page.
23 of these 25 photographs are shown beside the text that discusses them under "Site description" below.
Site description
Setting
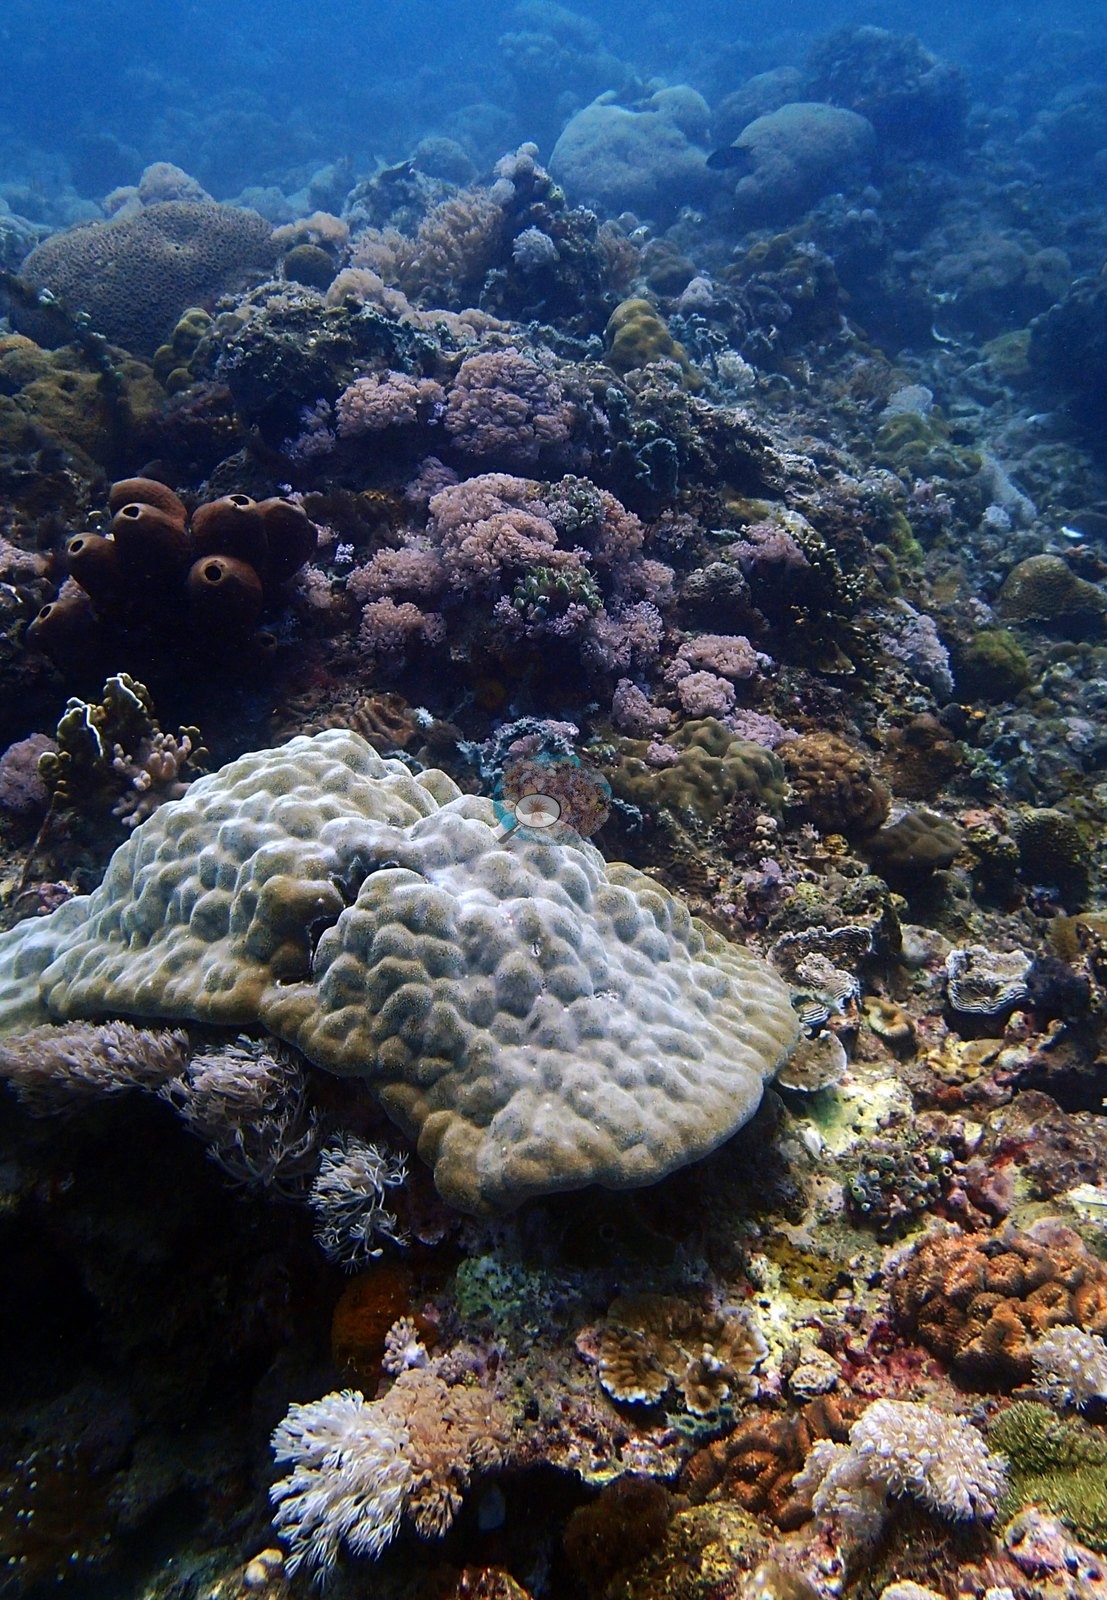
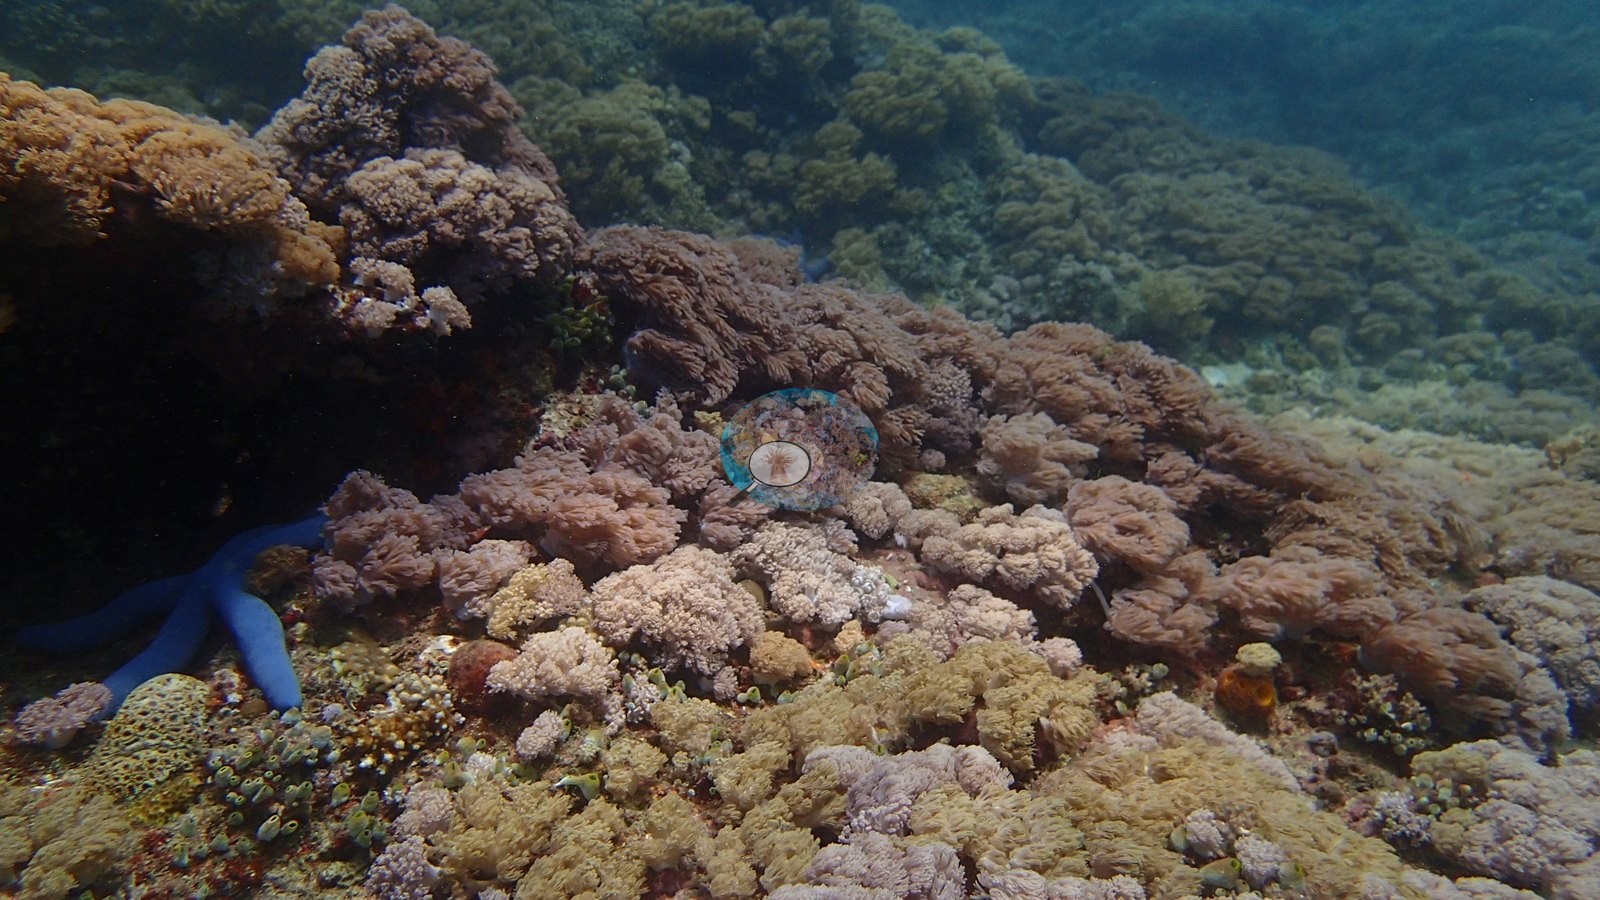
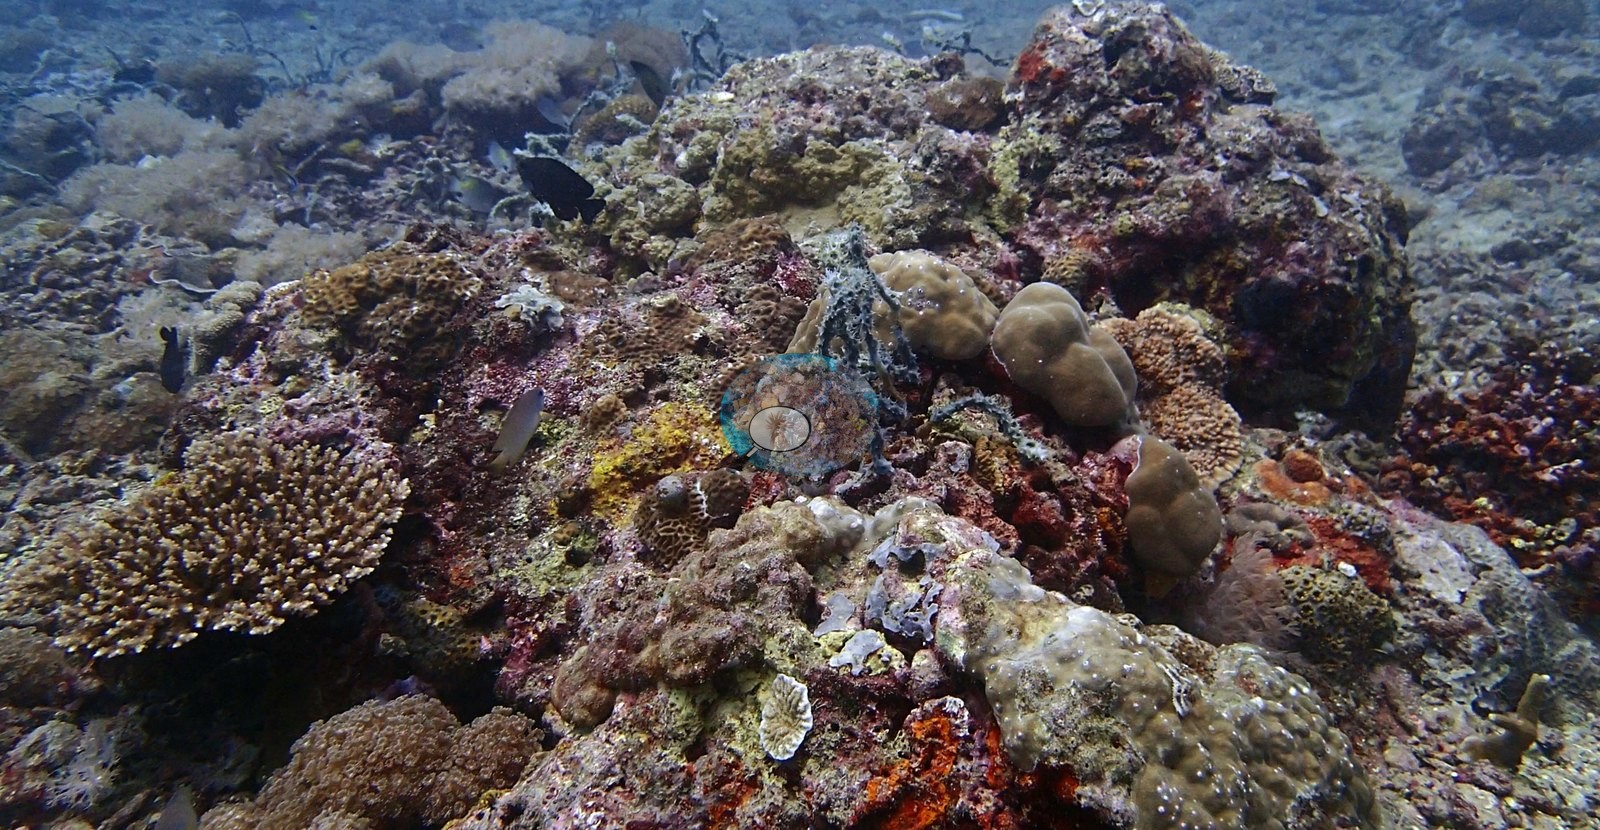
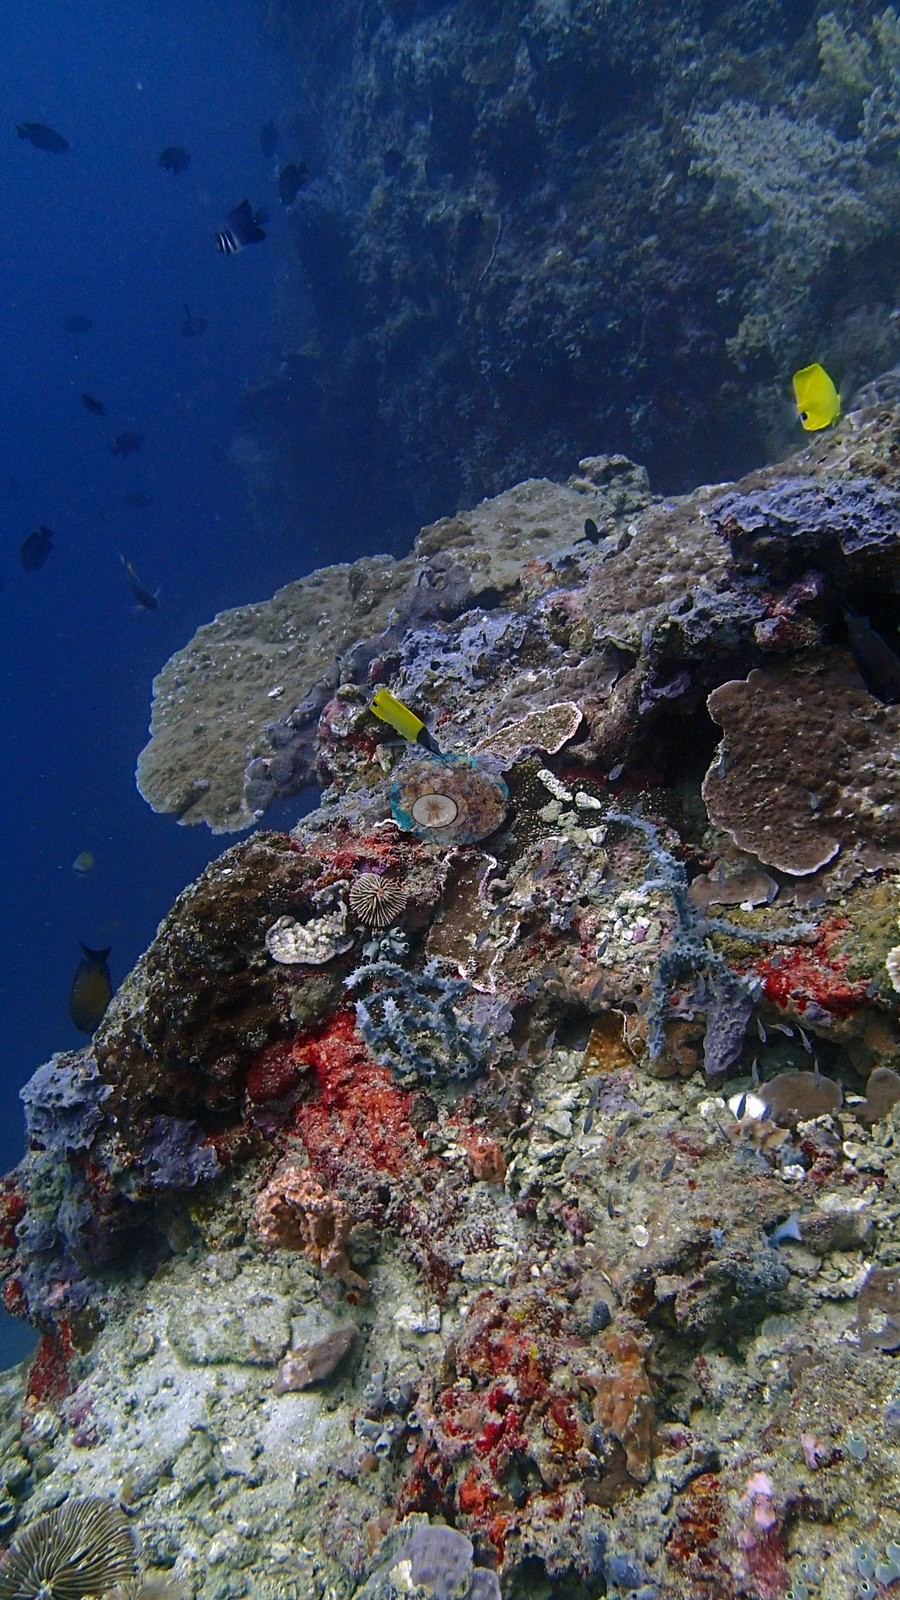
The photographs show a moderate-relief rocky slope of spurs and boulder faces falling into blue water, with sand and rubble aprons at its base and visibility varying from clear to distinctly green (e.g., Image 12, Image 24).
General benthic features
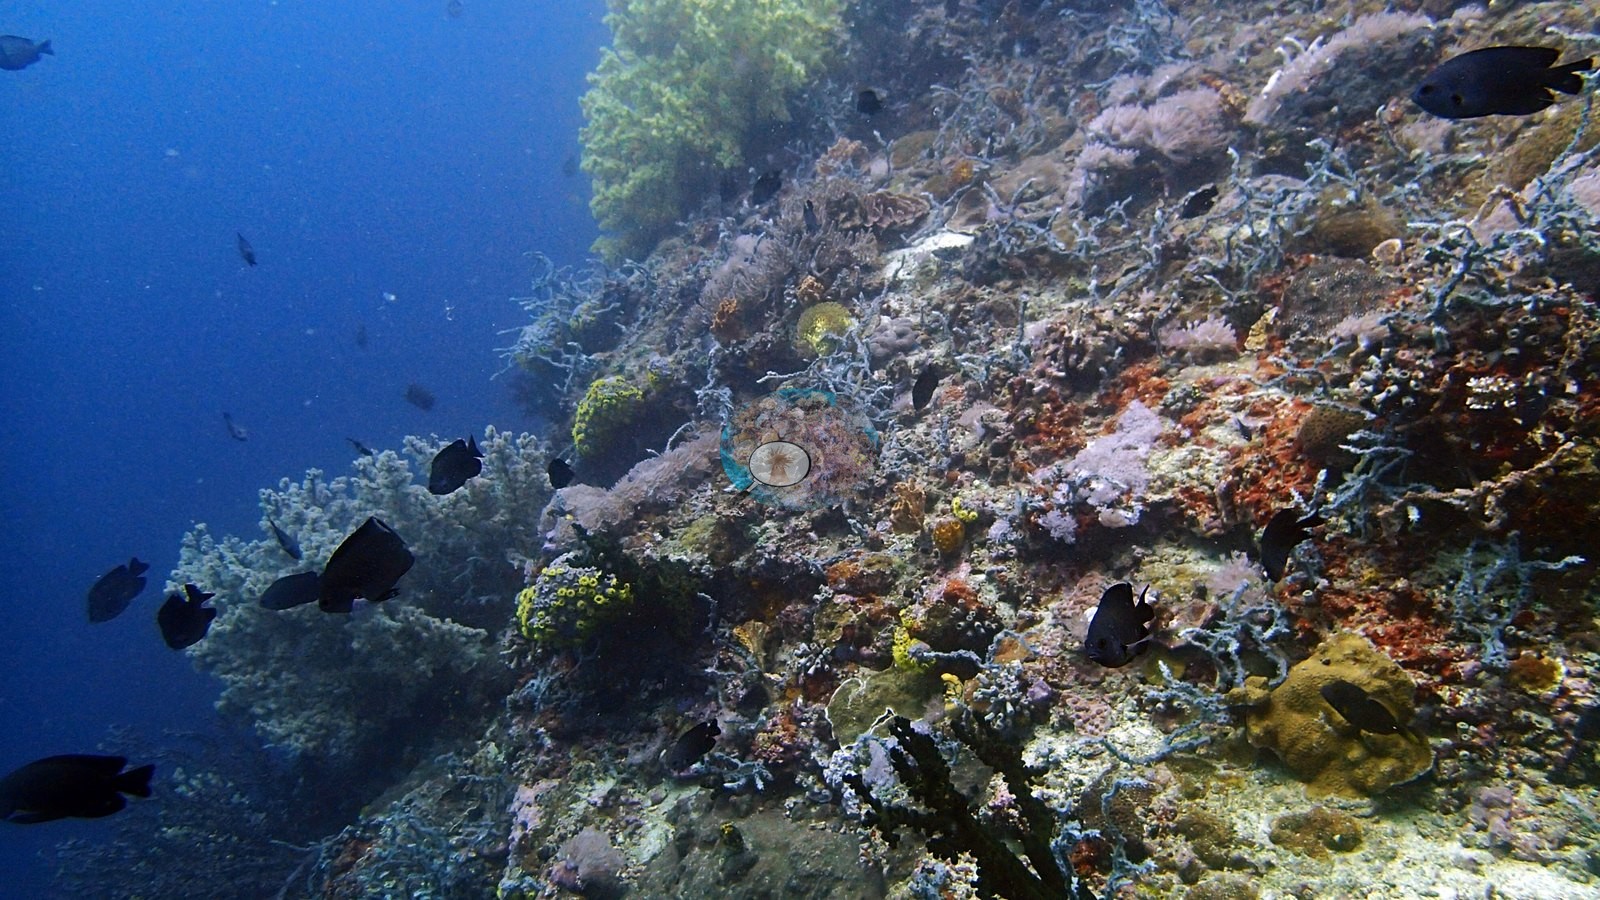
This is a soft-coral, sponge, and gorgonian site more than a stony-coral one: dense Dendronephthya in pink, cream, and white, leathery Sarcophyton, and Sinularia, pulsing Xenia fields, pale gorgonian sea fans, black coral bushes, and a run of large barrel sponges (Xestospongia testudinaria) standing off the slope, with Tubastraea sun corals crowding the shaded faces (e.g., Image 7, Image 8, Image 9, Image 10, Image 14, Image 20, Image 21, Image 22).
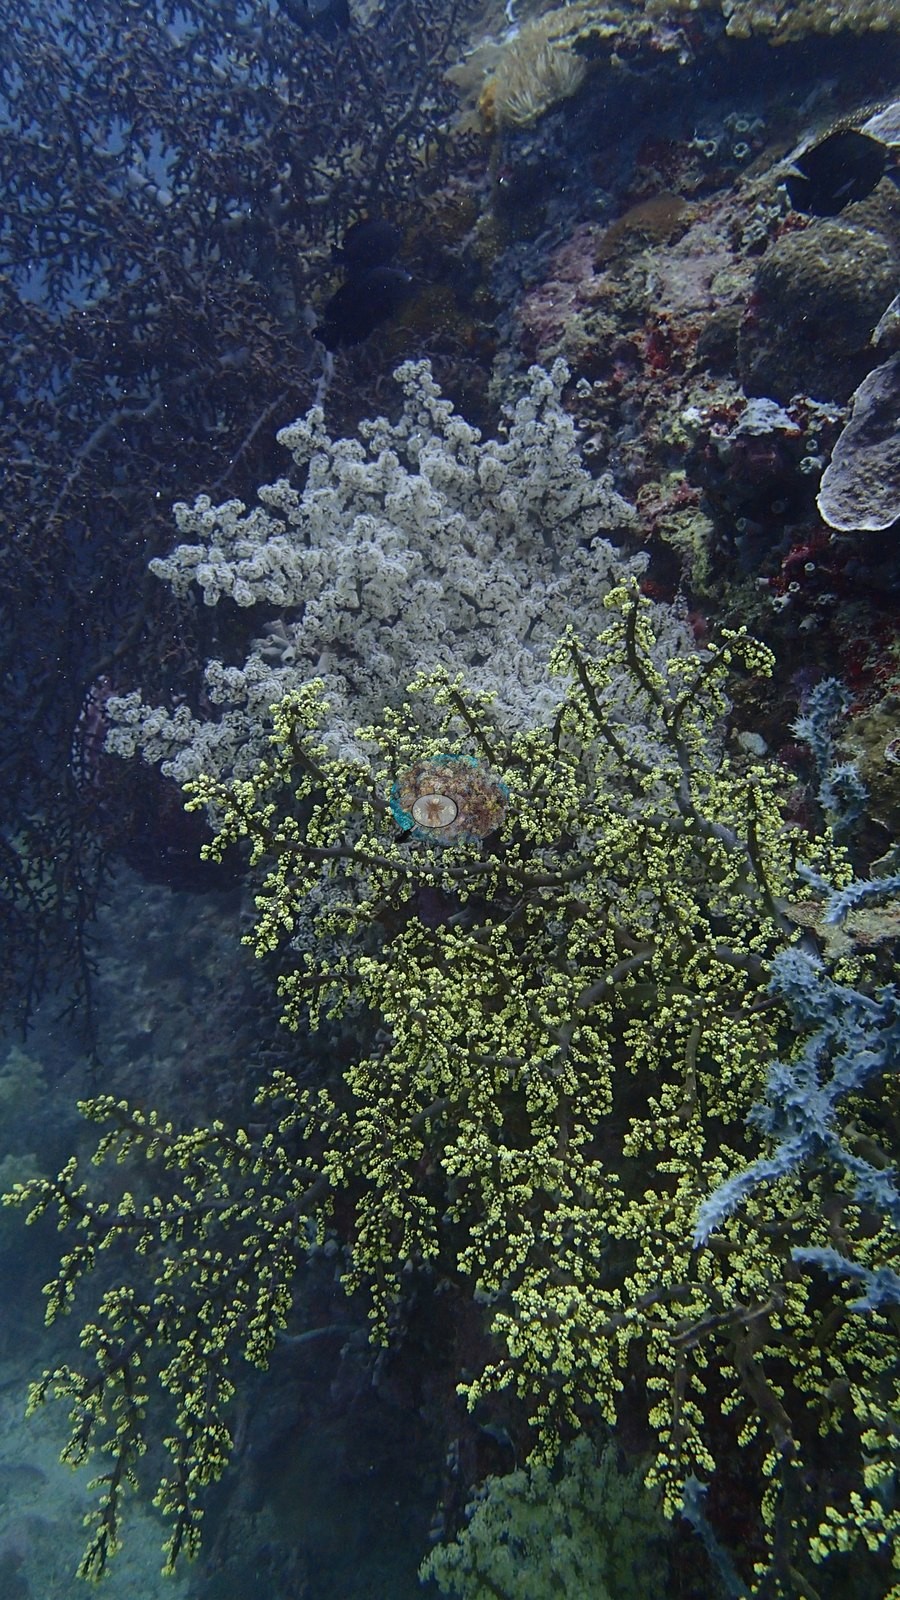
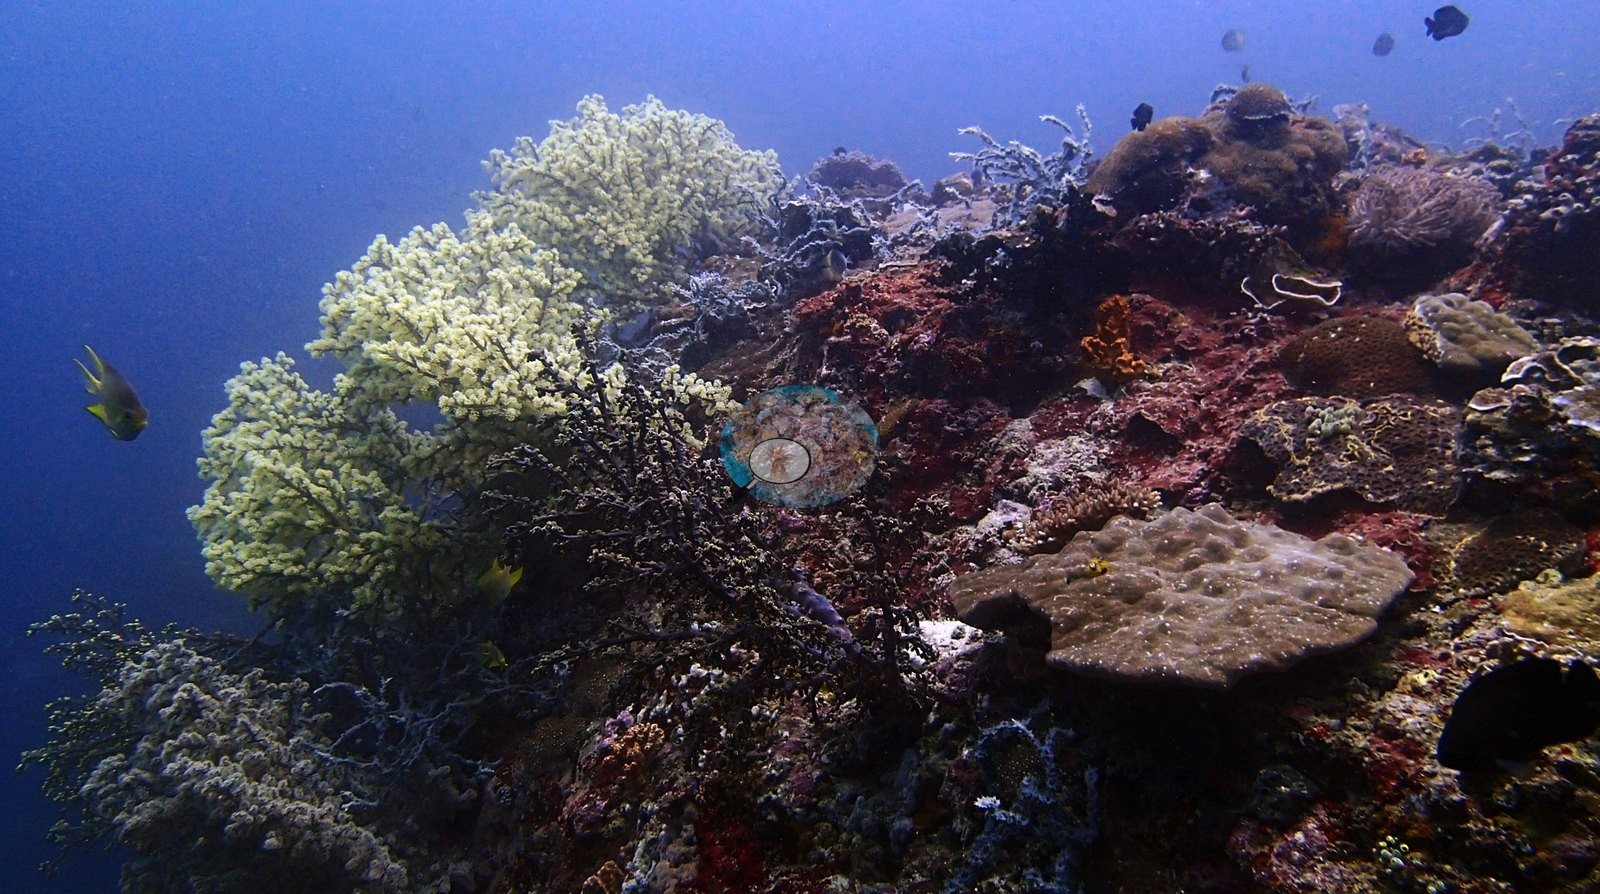
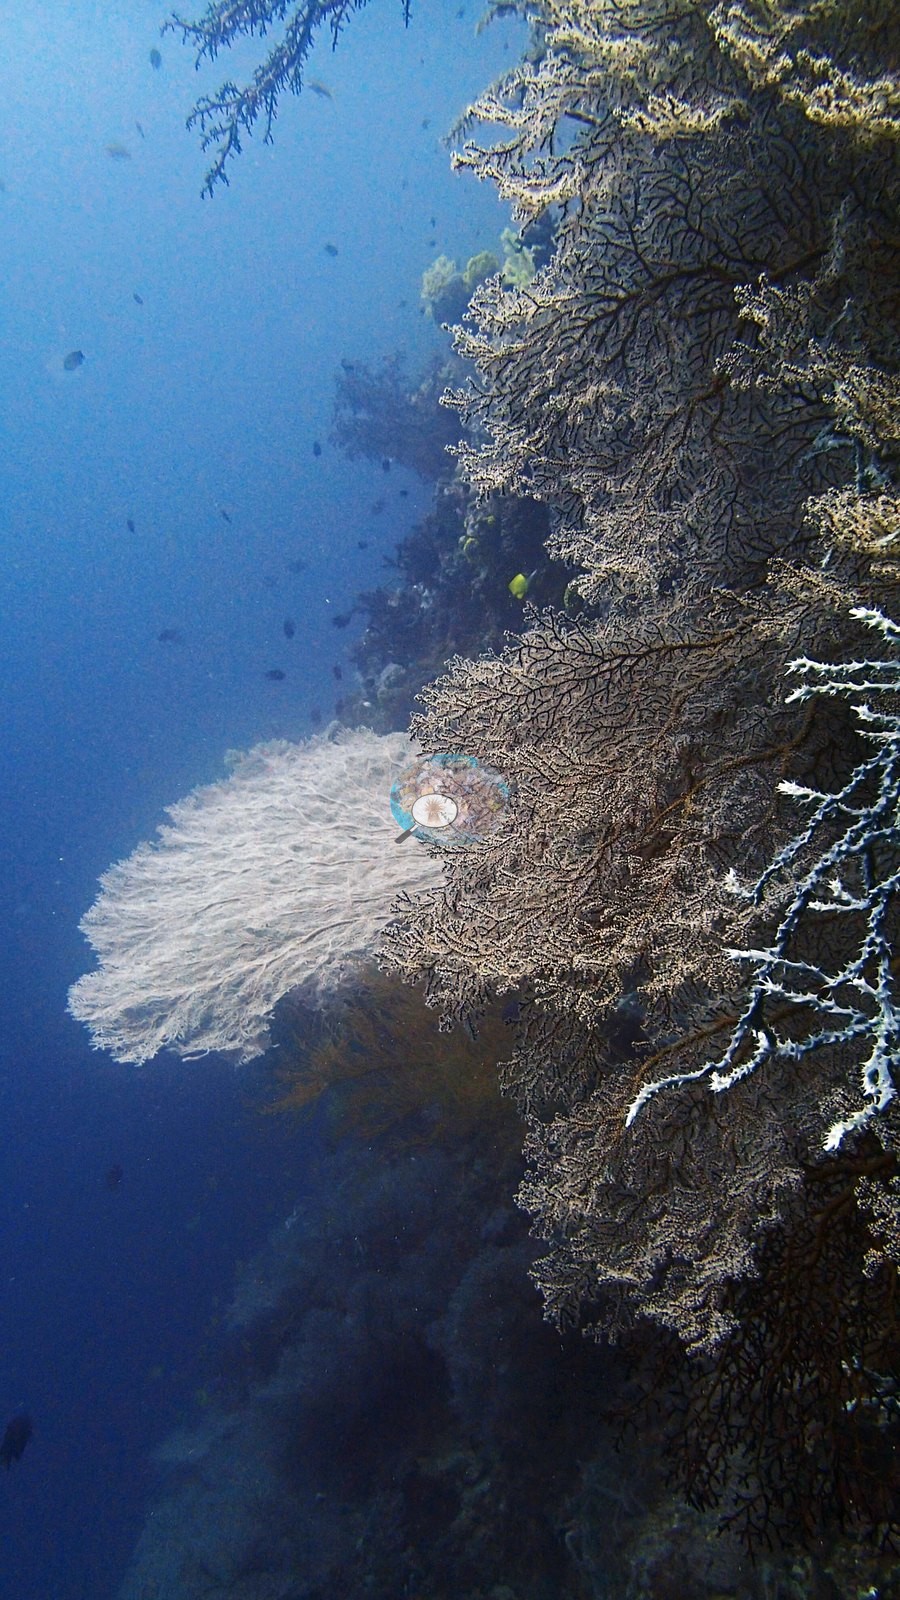
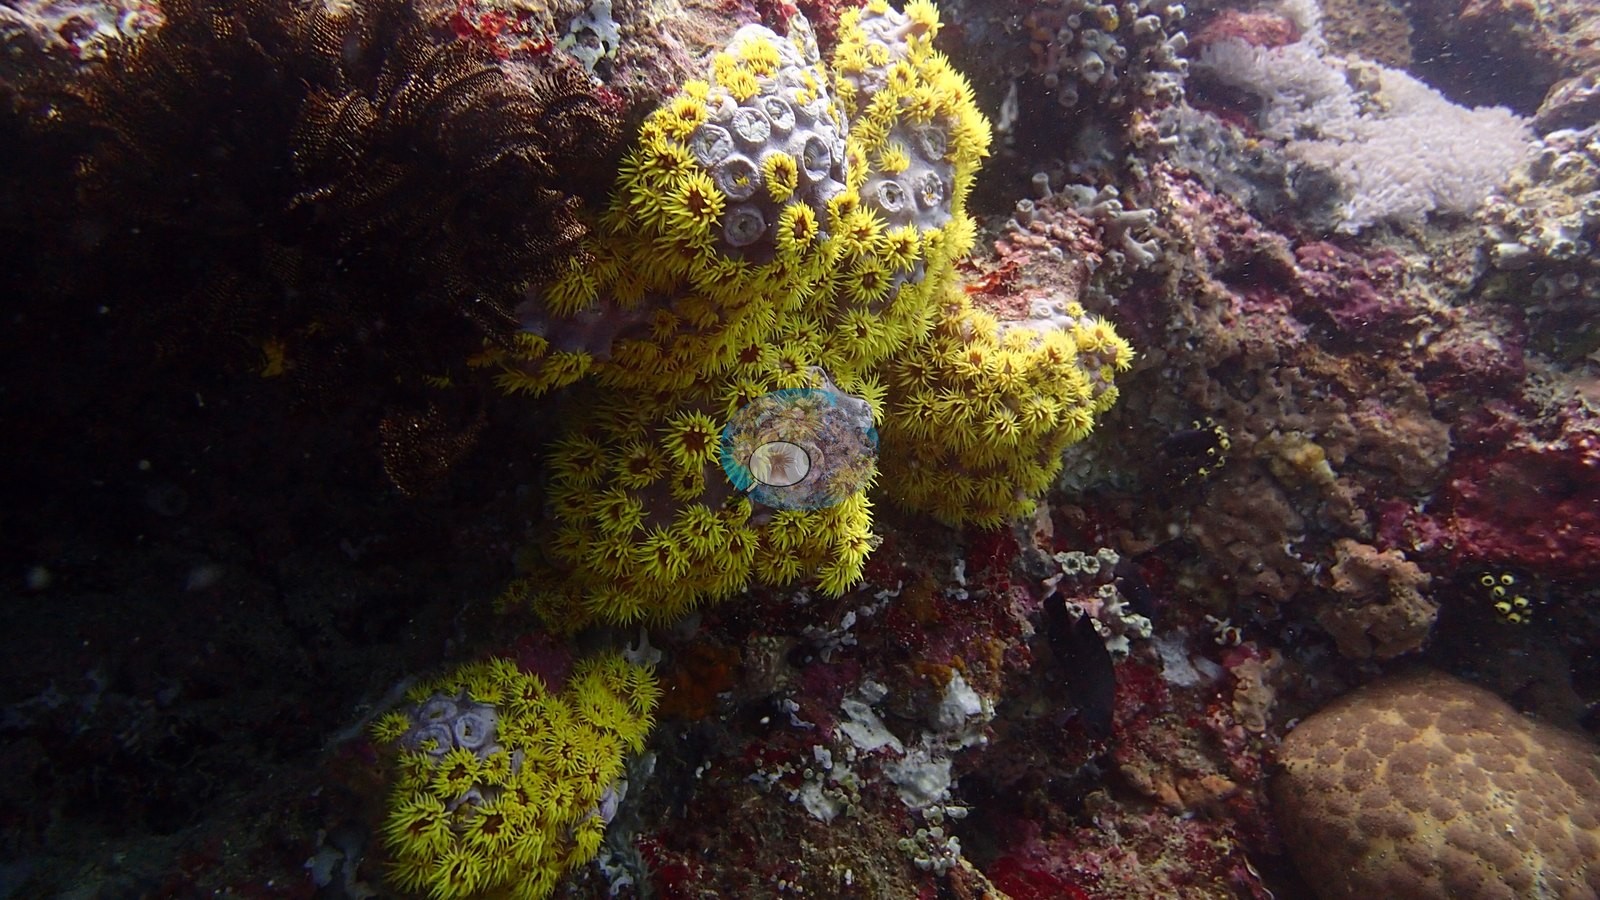
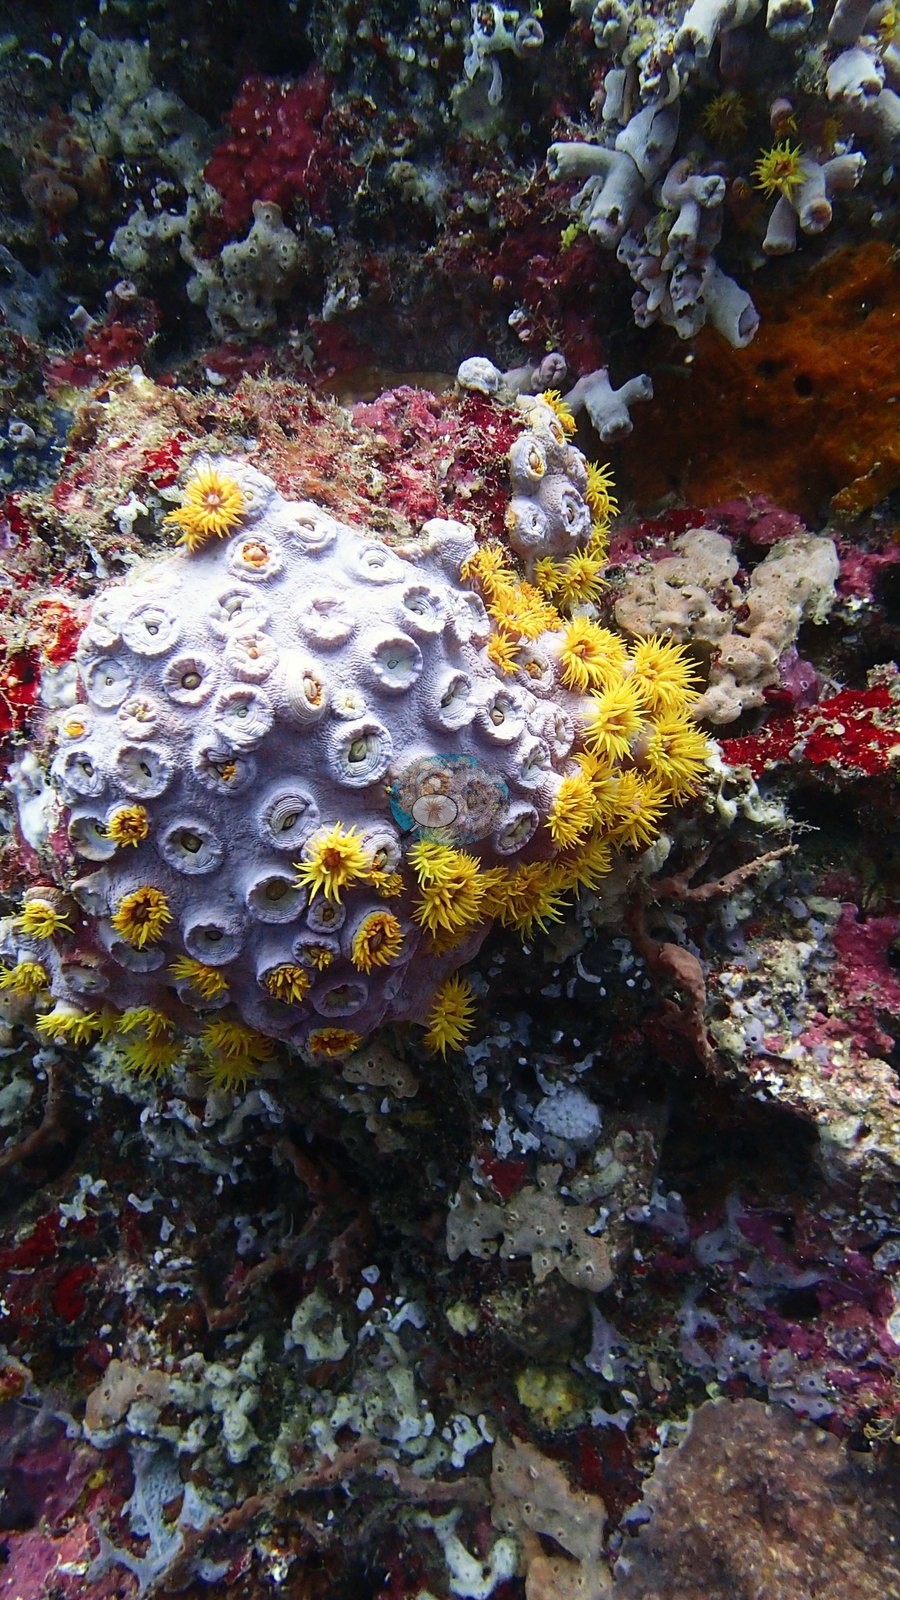
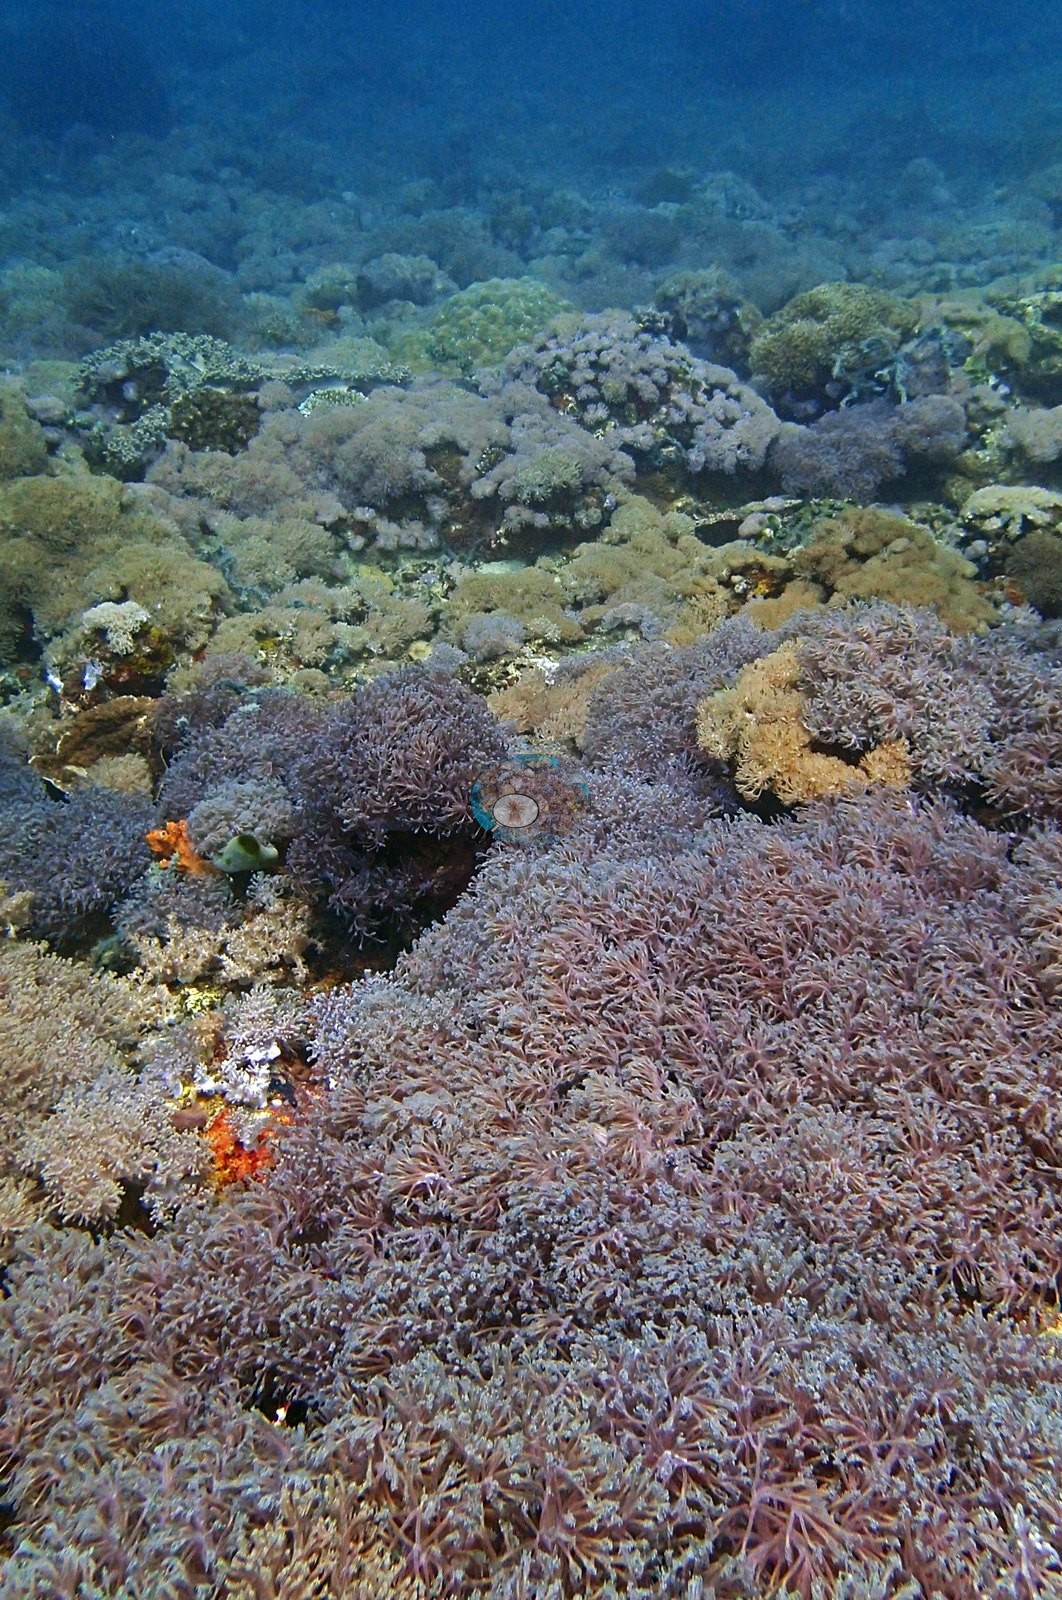
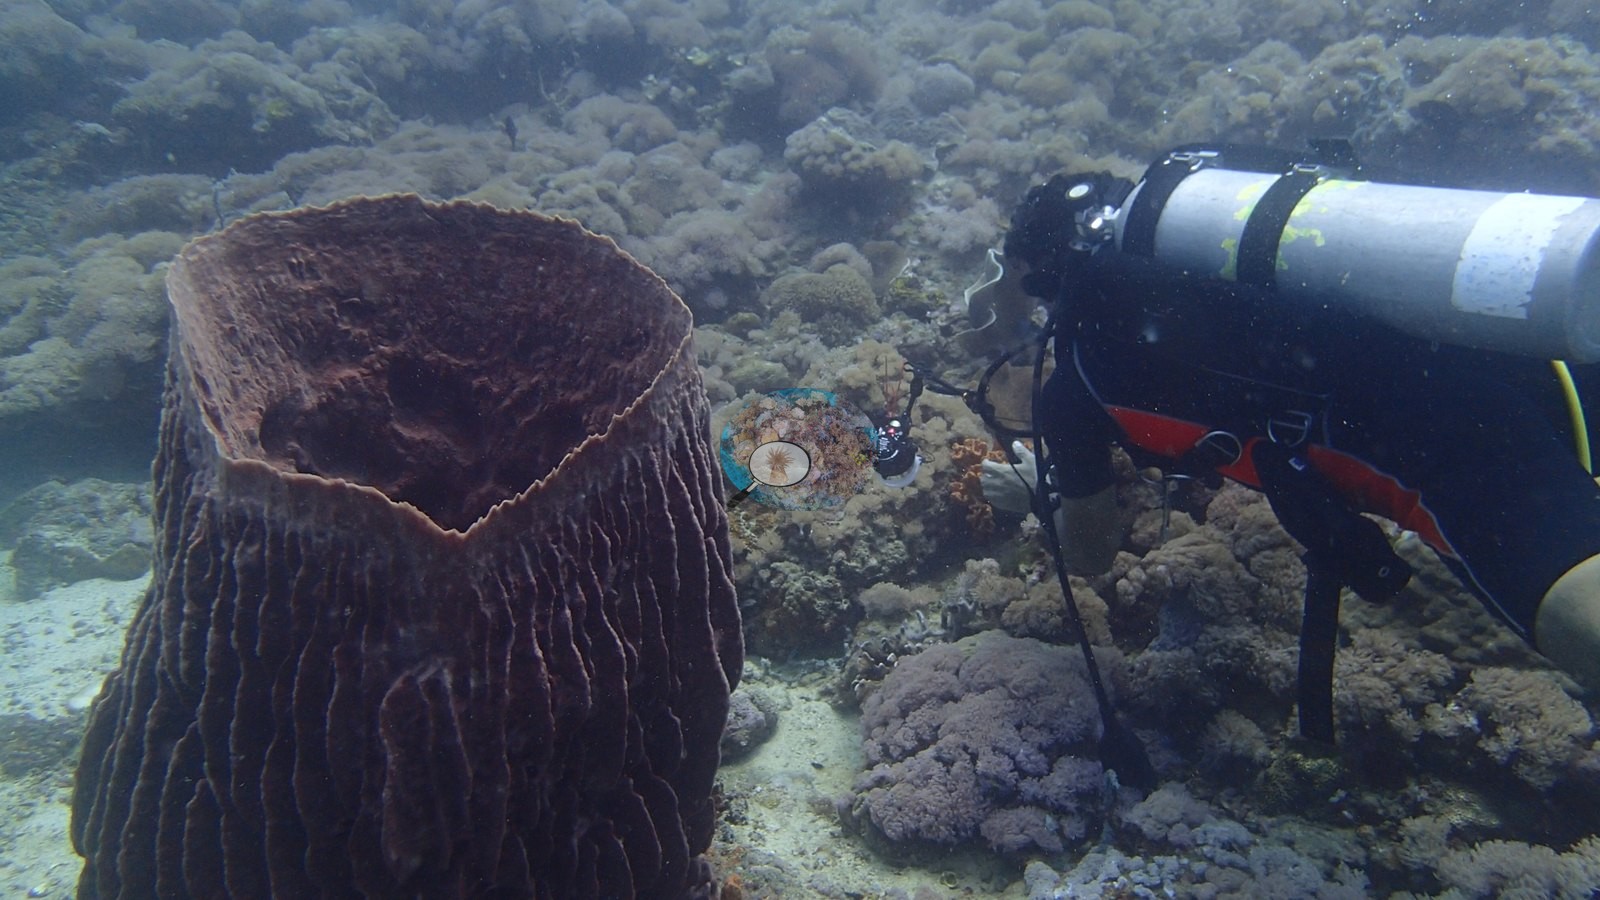
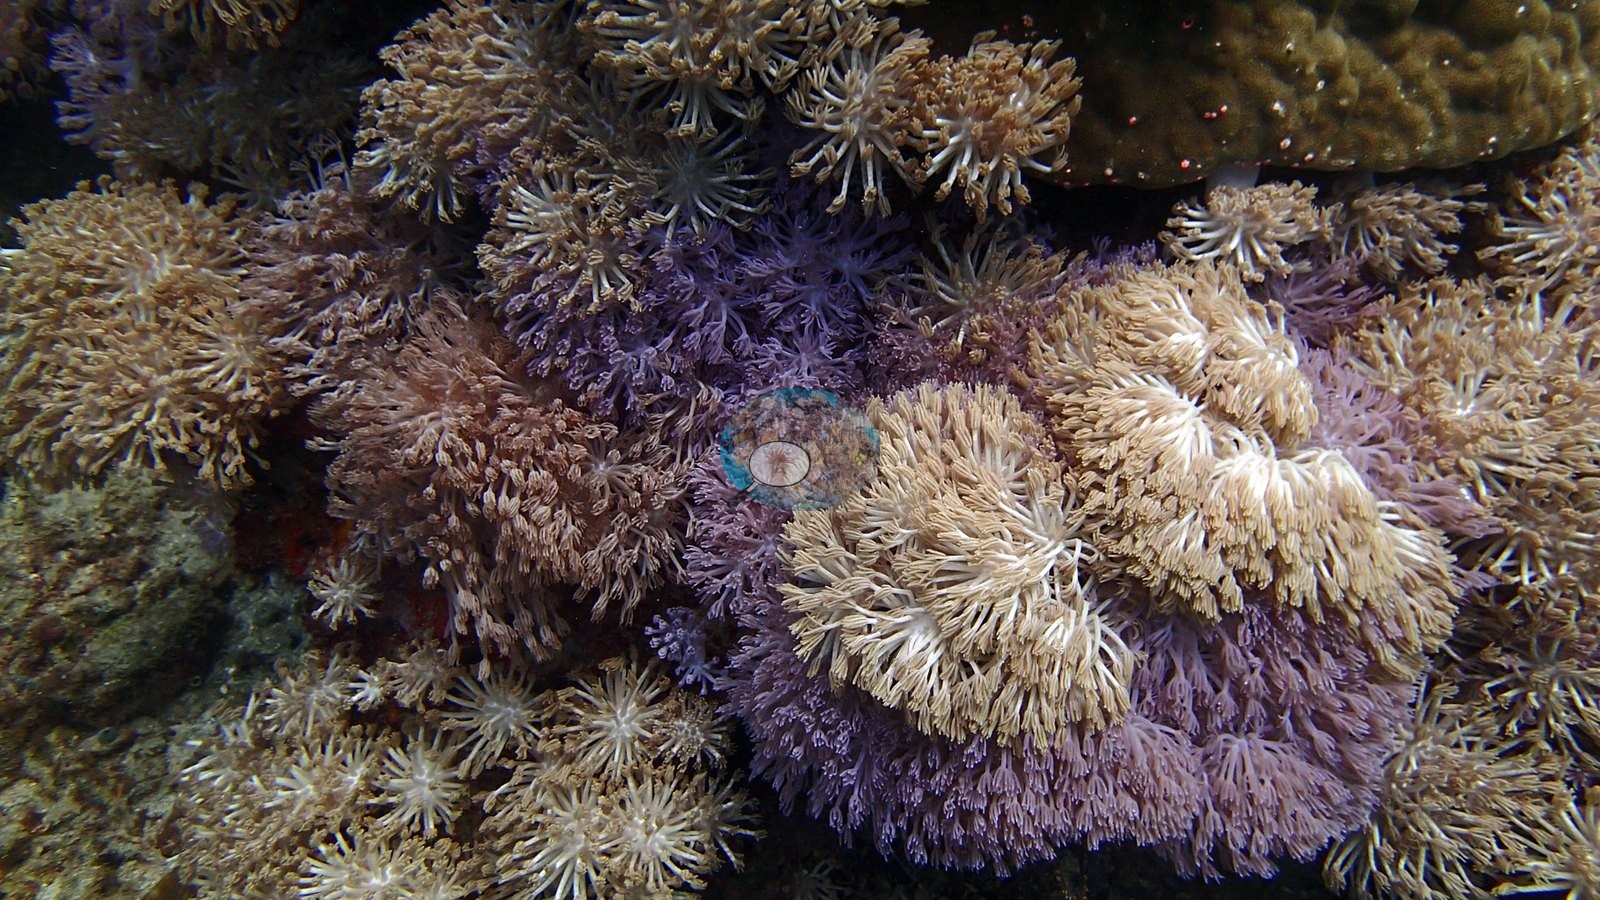
The deeper terrace is close to a continuous carpet of pale xeniid and nephtheid soft coral, the barrel sponges rising straight out of it (e.g., Image 13, Image 16, Image 17, Image 19).
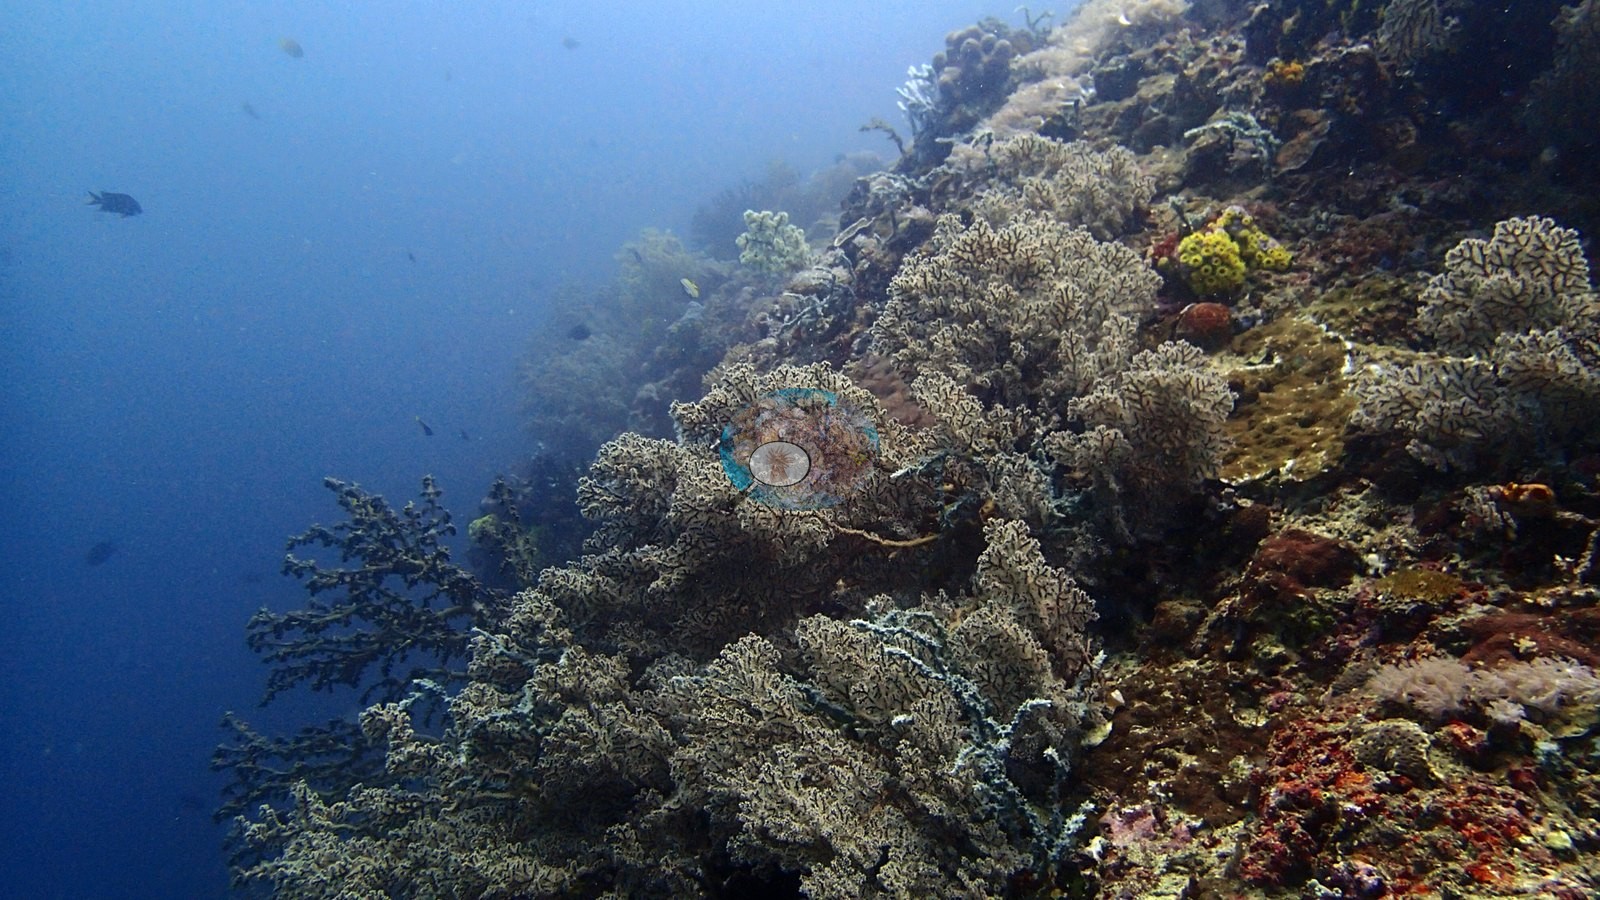
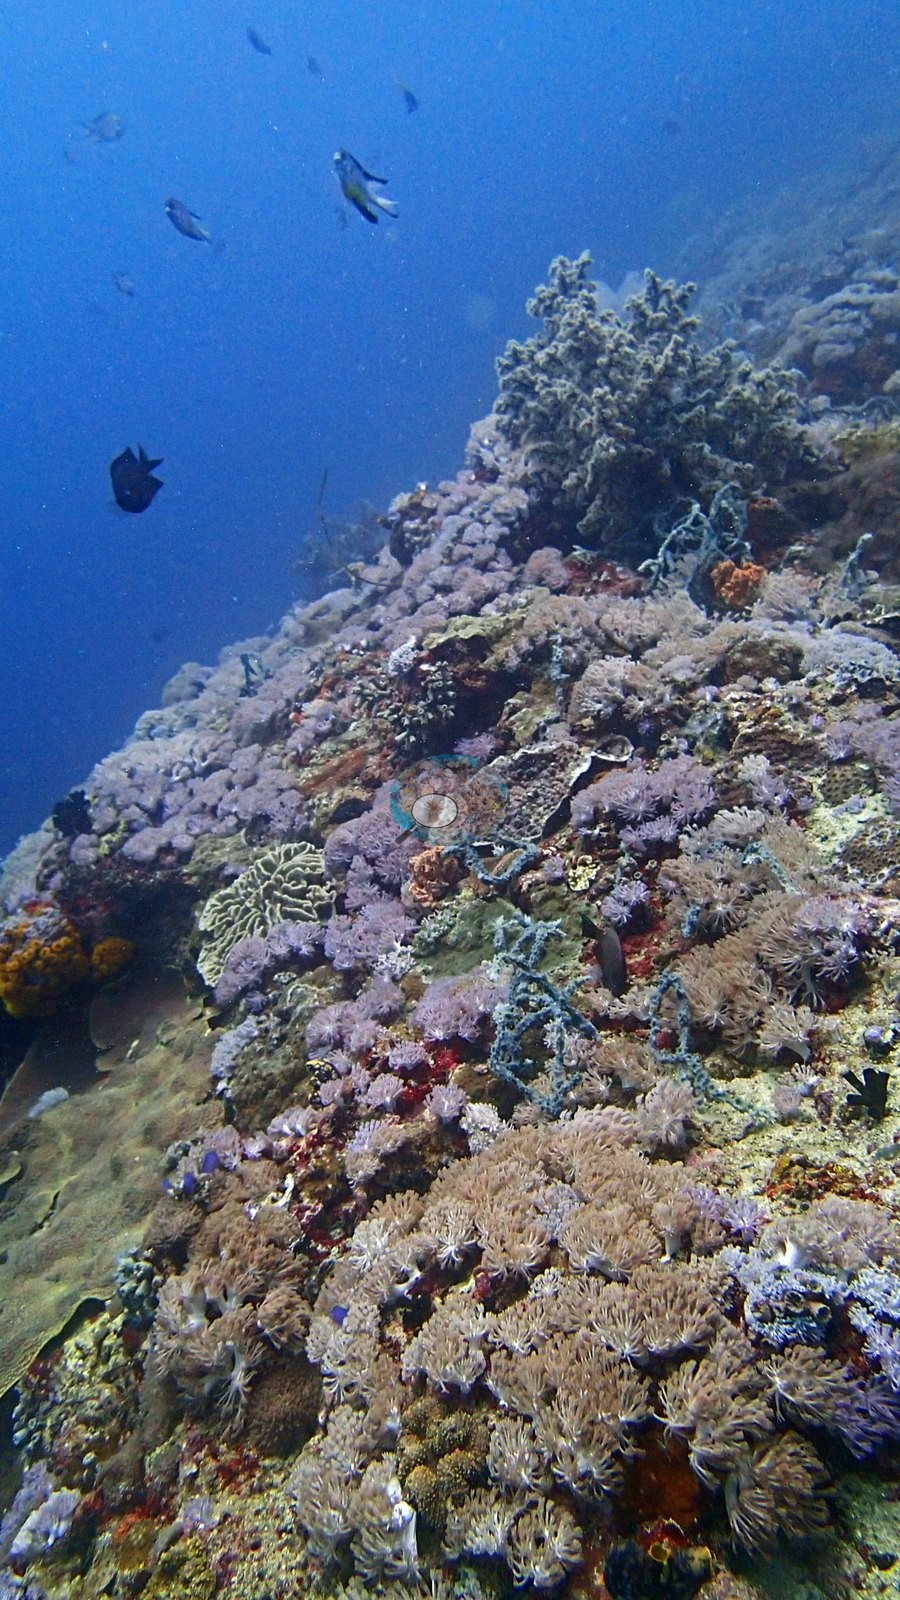
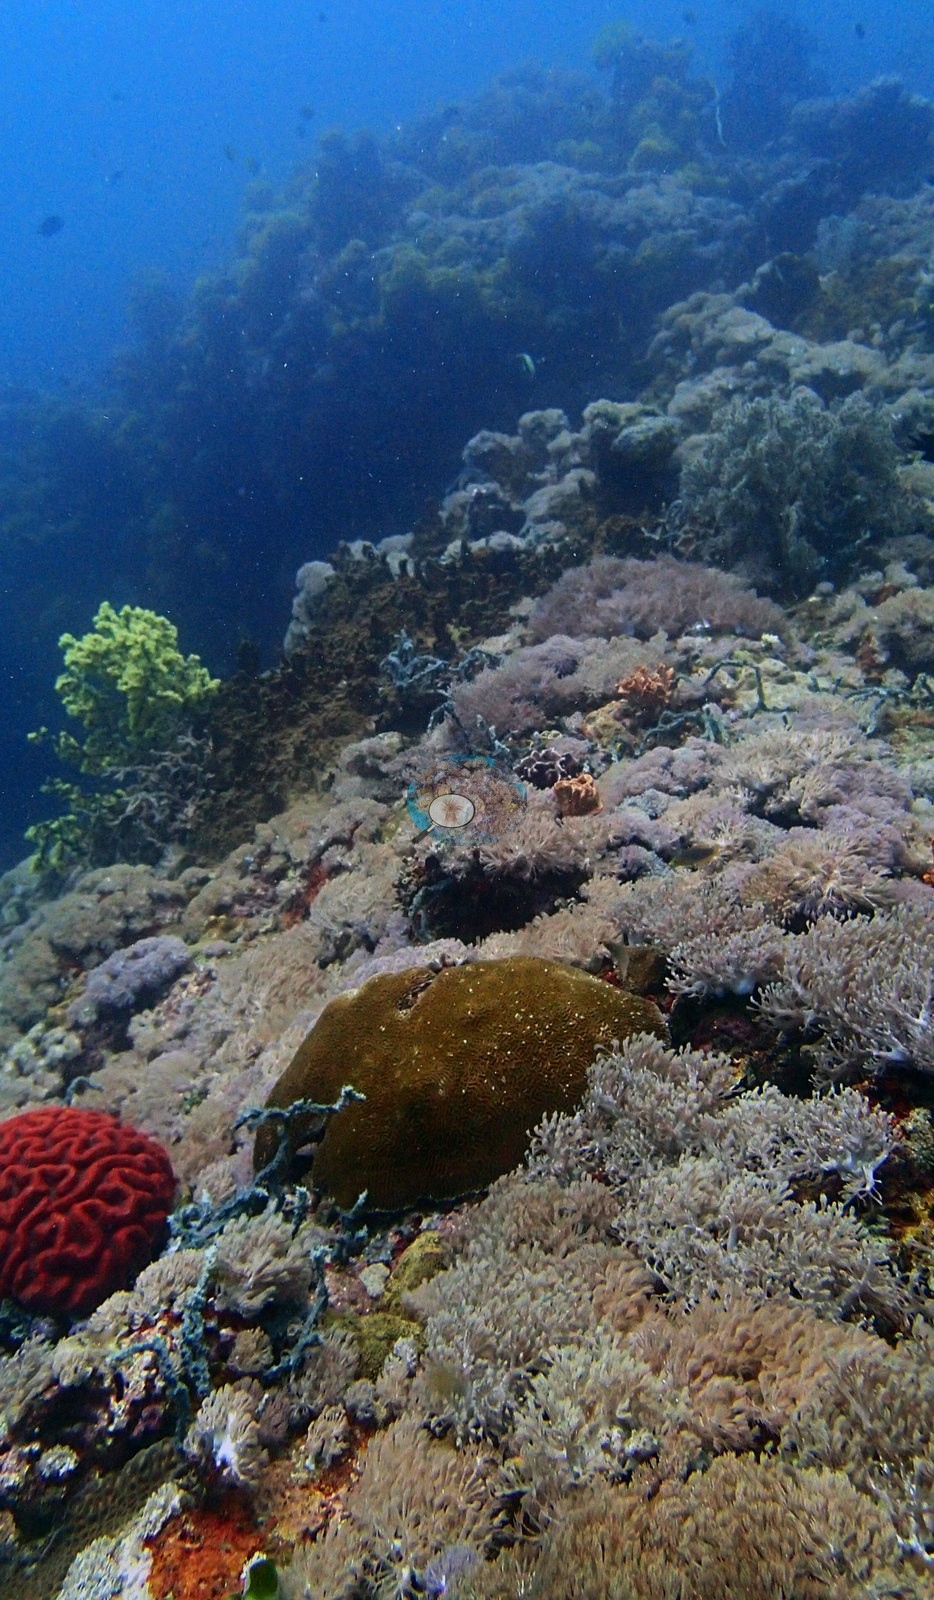
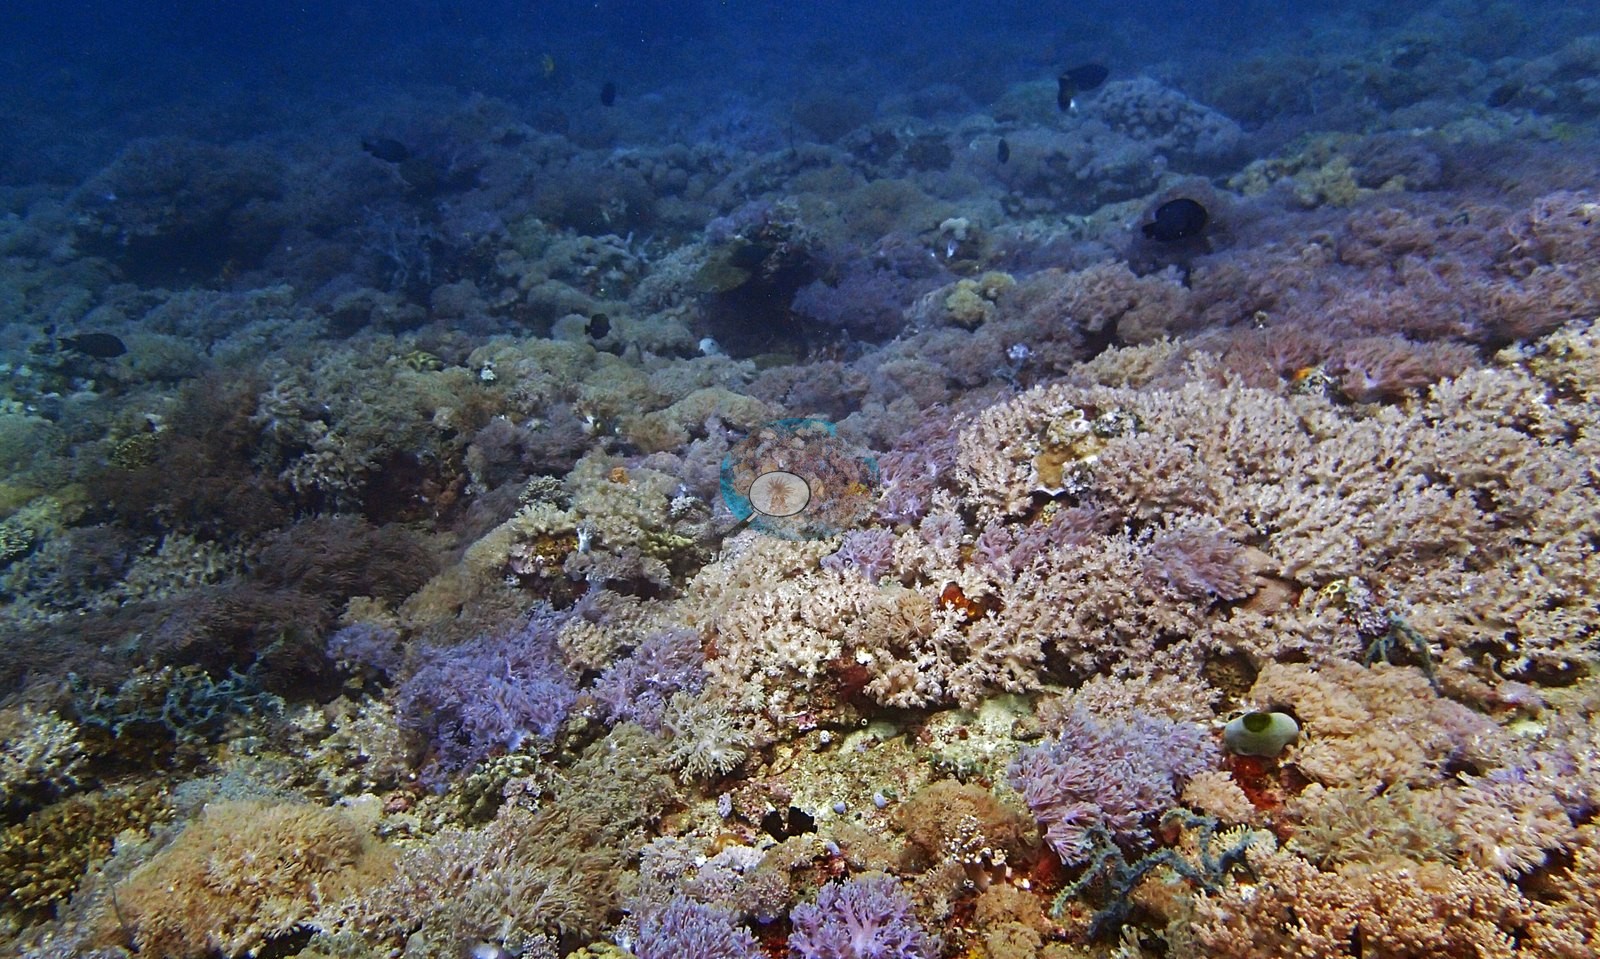
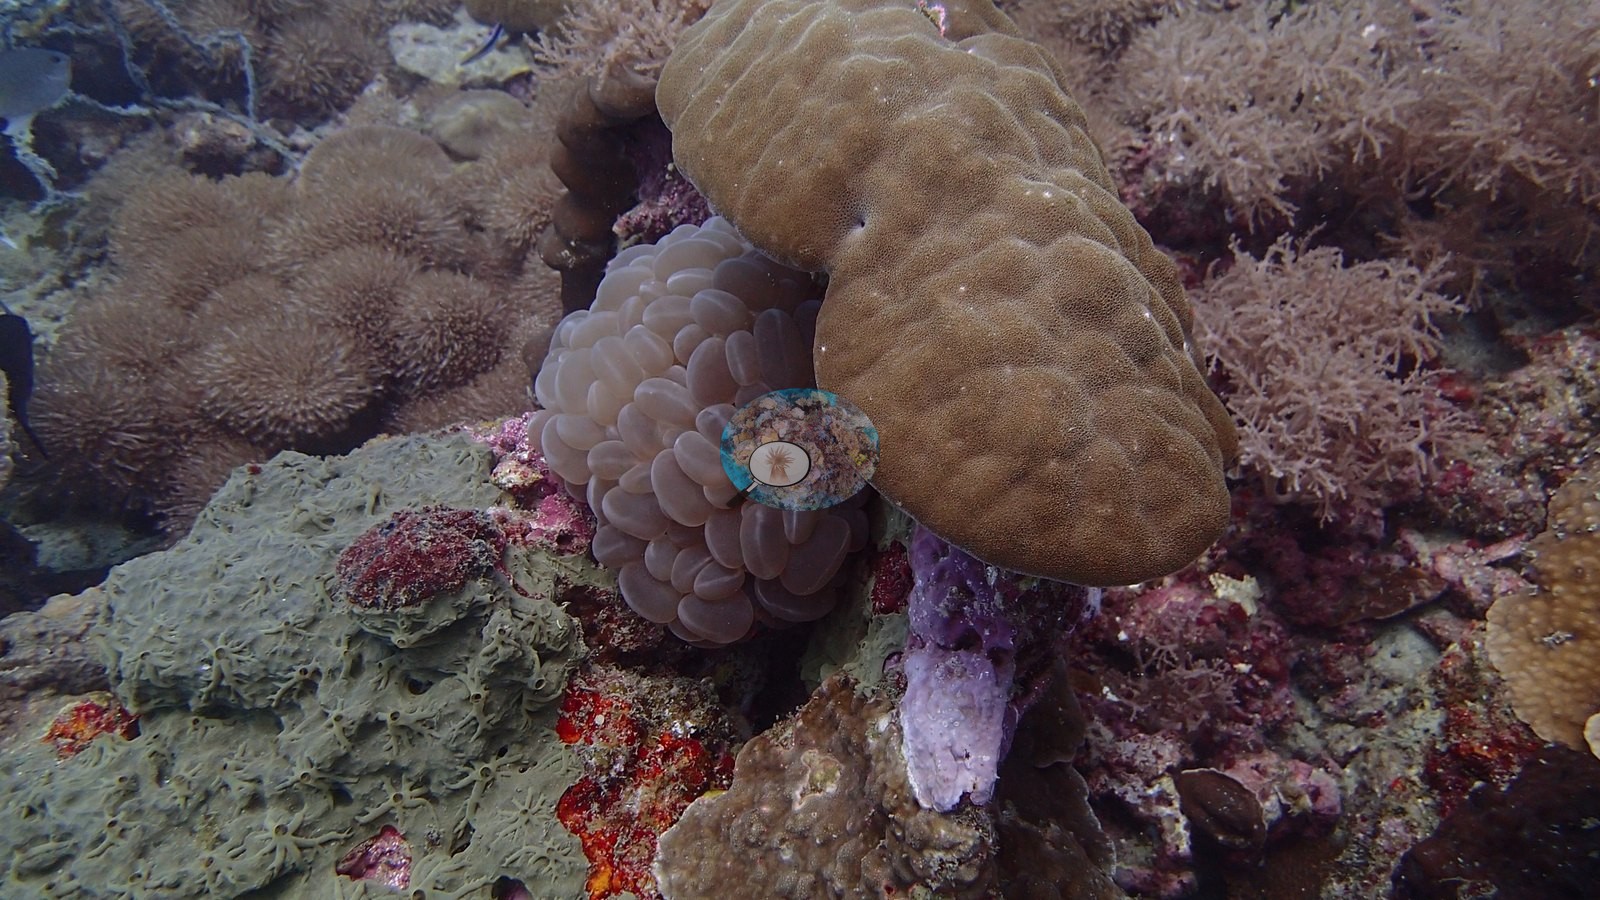
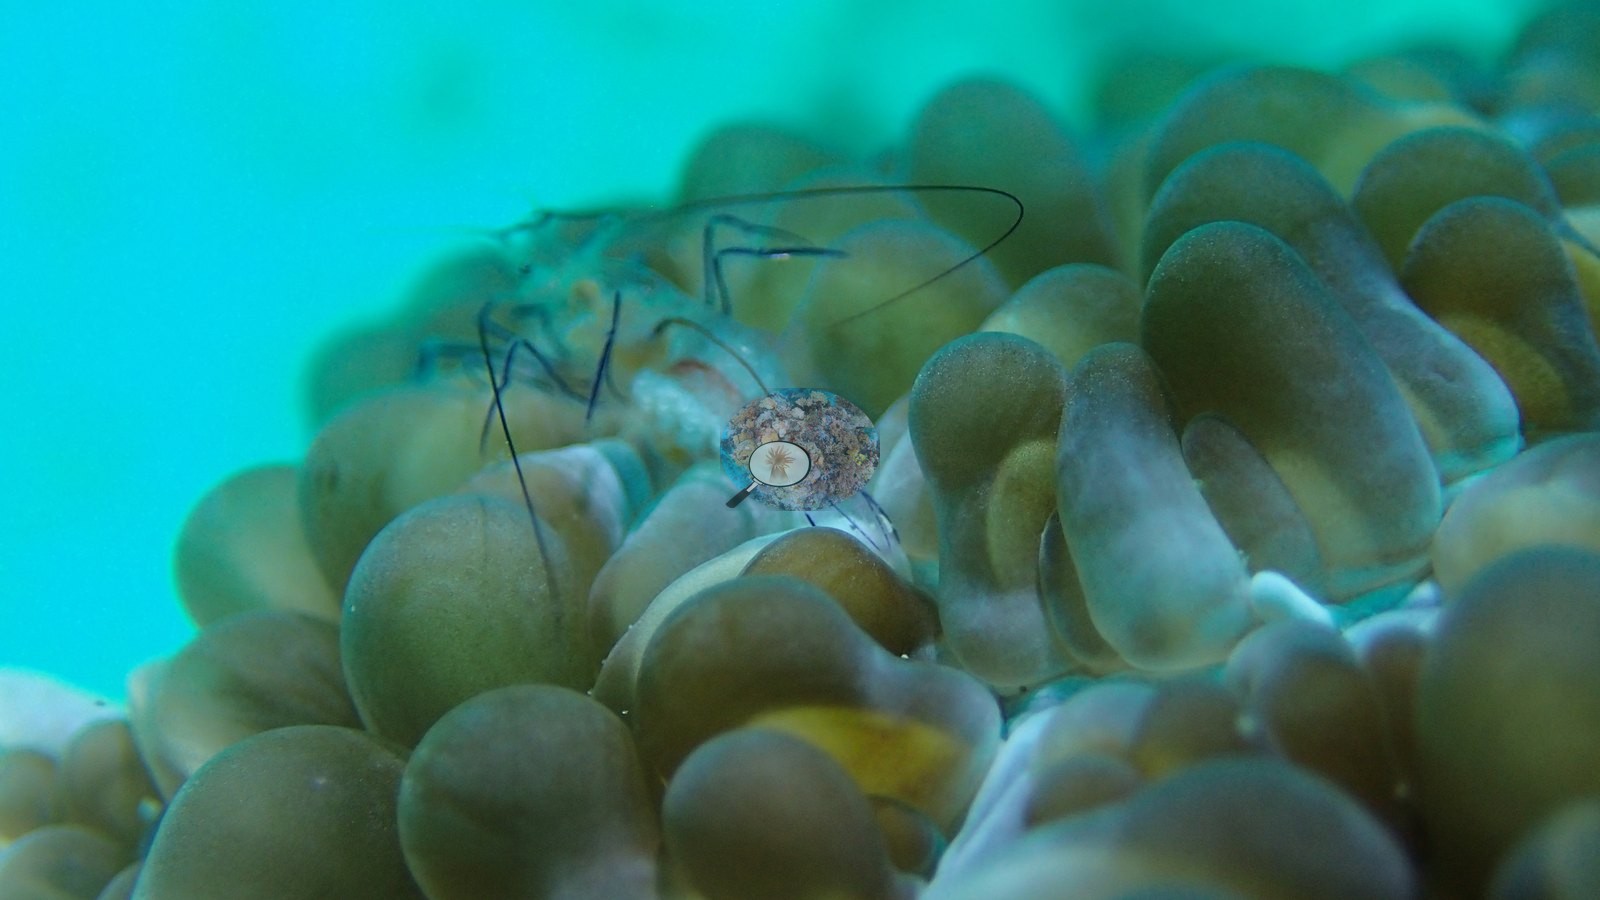
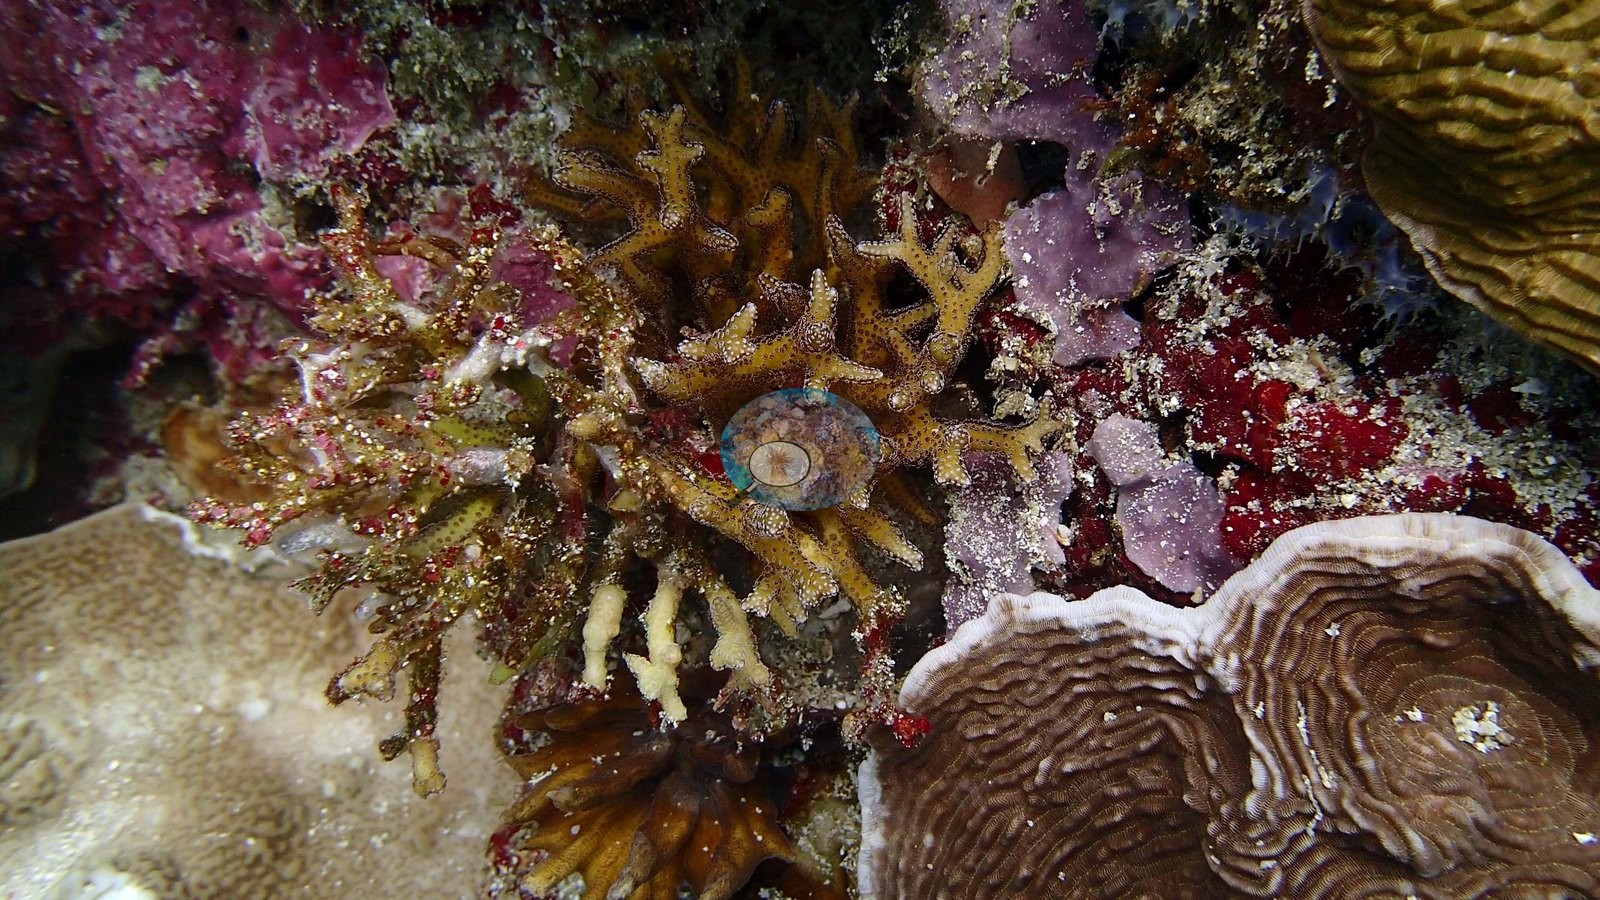
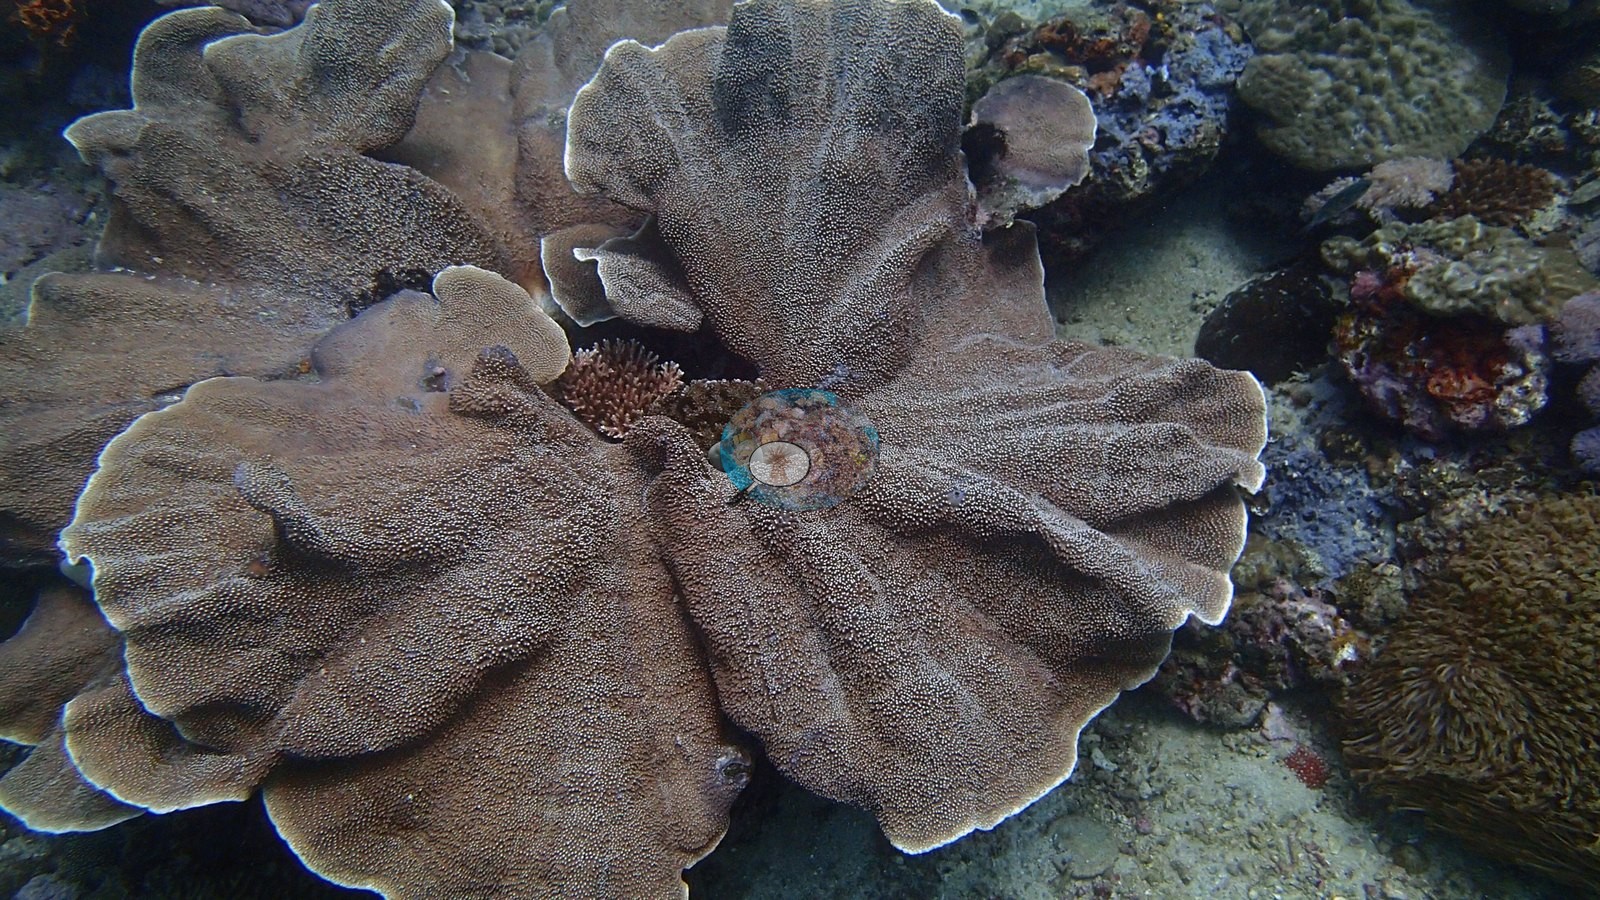
The stony corals are nonetheless varied in genus richness - tabular and plating Acropora in stacked stands, foliose Montipora shelves, big scroll, and vase Turbinaria, massive Porites - and Anderson's own filenames single out Plerogyra bubble coral with its commensal shrimp, Stylophora, and his first record of Seriatopora caliendrum (e.g., Image 1, Image 3, Image 6, Image 11, Image 23, Image 25).
Coral cover
Cover comes from two computer vision methods, neither preferred. DINOv3 point classification gives 21.0% hard coral (95% CI 19.1-23.0) from all 94 frames and 1,880 points. CoralSCOP computer vision, its full run now finished, gives 34.2% across all 94 frames (median=30.4%, bootstrap 95% CI 30.2-38.3), against the 40.2% from the 20-frame subset the map's 30.6% was built on. The published spread is 19.2 points; the completed run narrows it to 13.2, still the widest disagreement of the seven sites. The gap is visible frame by frame: CoralSCOP's top-scoring images are single-colony portraits, one returning 75.5% of the frame from one bubble-coral mask where DINOv3 reads 15.9%, and another returning 79.5% from a Turbinaria scroll. The two models fail differently. CoralSCOP computer vision reads high on low-cover reefs - a median=1.68x a co-located Reef Check diver survey, 4.6x at worst - and it masks soft coral and other coral-shaped objects. DINOv3 is strong in-domain (6-class macro-F1 0.62, hard coral recall 0.82) but collapses off-domain: cross-domain point accuracy 0.17-0.25, ceiling near 35-50%. Coral cover: 28% — photo-derived, and the two methods disagree by 13.2 pp; treat cover as a range (21–34%). Two independent computer vision passes over all 94 of Anderson's frames from this dive give a DINOv3 calibrated point classifier reading of 21.0% (95% CI 19–23%, block bootstrap) and a CoralSCOP computer vision of 34.2%, a spread of 13.2 percentage points. The map publishes their mean so sites can be ranked against one another, but the 21–34% range is the honest statement of what is known here: the two products have different denominators and should not be collapsed into one measurement. Both are provisional photo-derived indices, not a diver survey;
Stressors
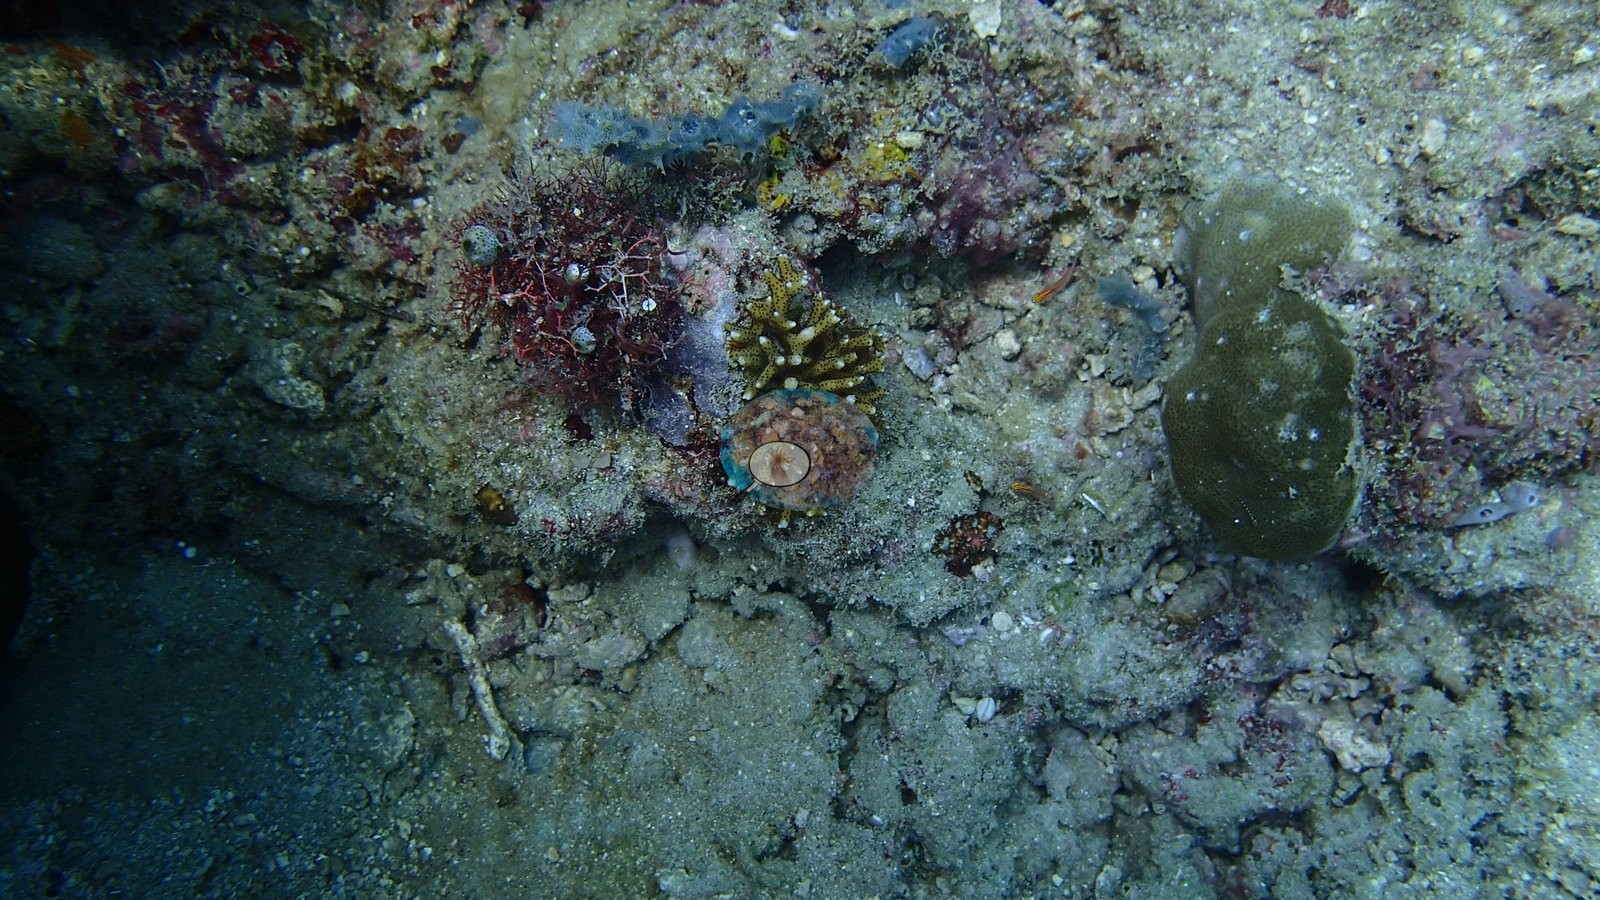
Two condition flags: a host anemone carrying a conspicuous bleached white sector, and one stark-white branching colony amid otherwise healthy growth. There is no site-wide bleaching signal, though localized old mortality, rubble, and algal turf run throughout (e.g., Image 2).
No crown-of-thorns starfish (COTS) or other corallivores evident.
Fish and other fauna
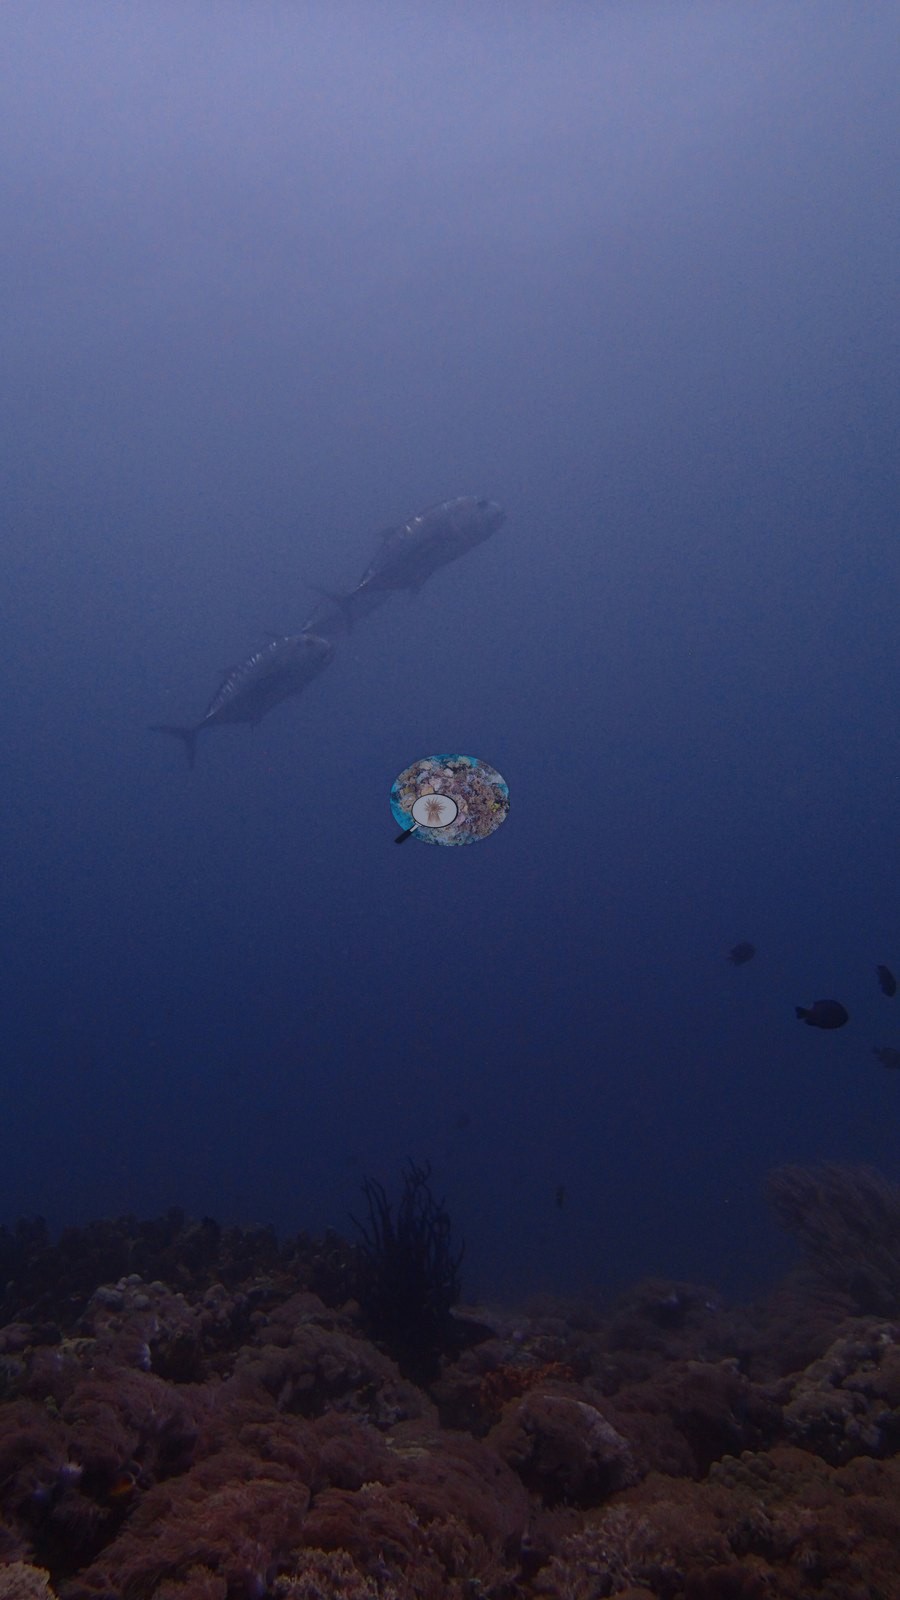
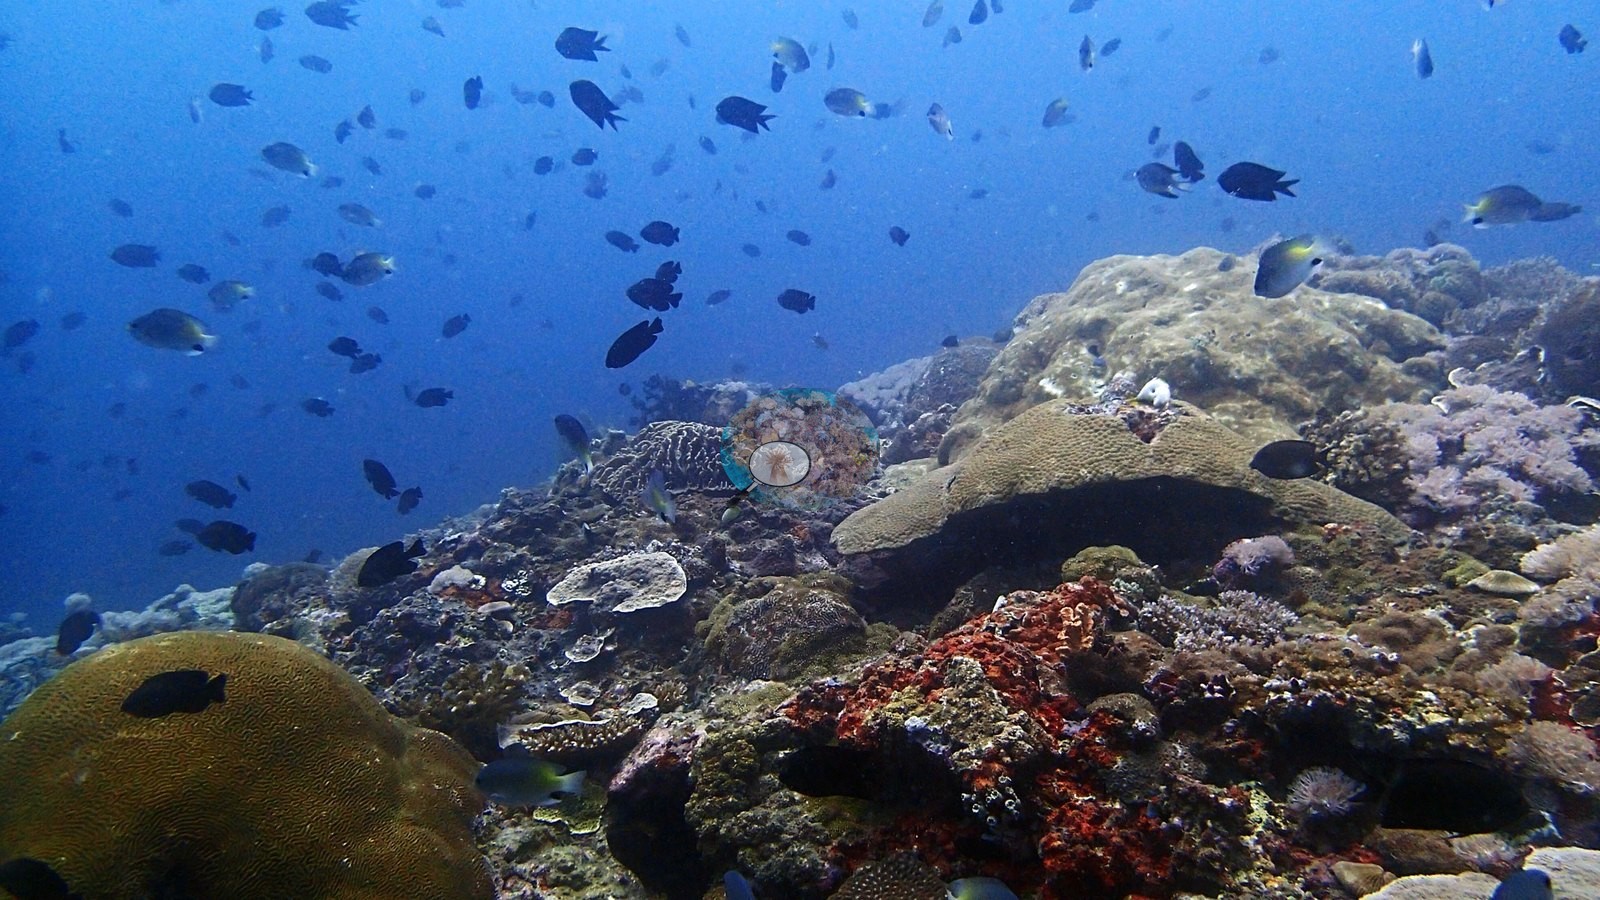
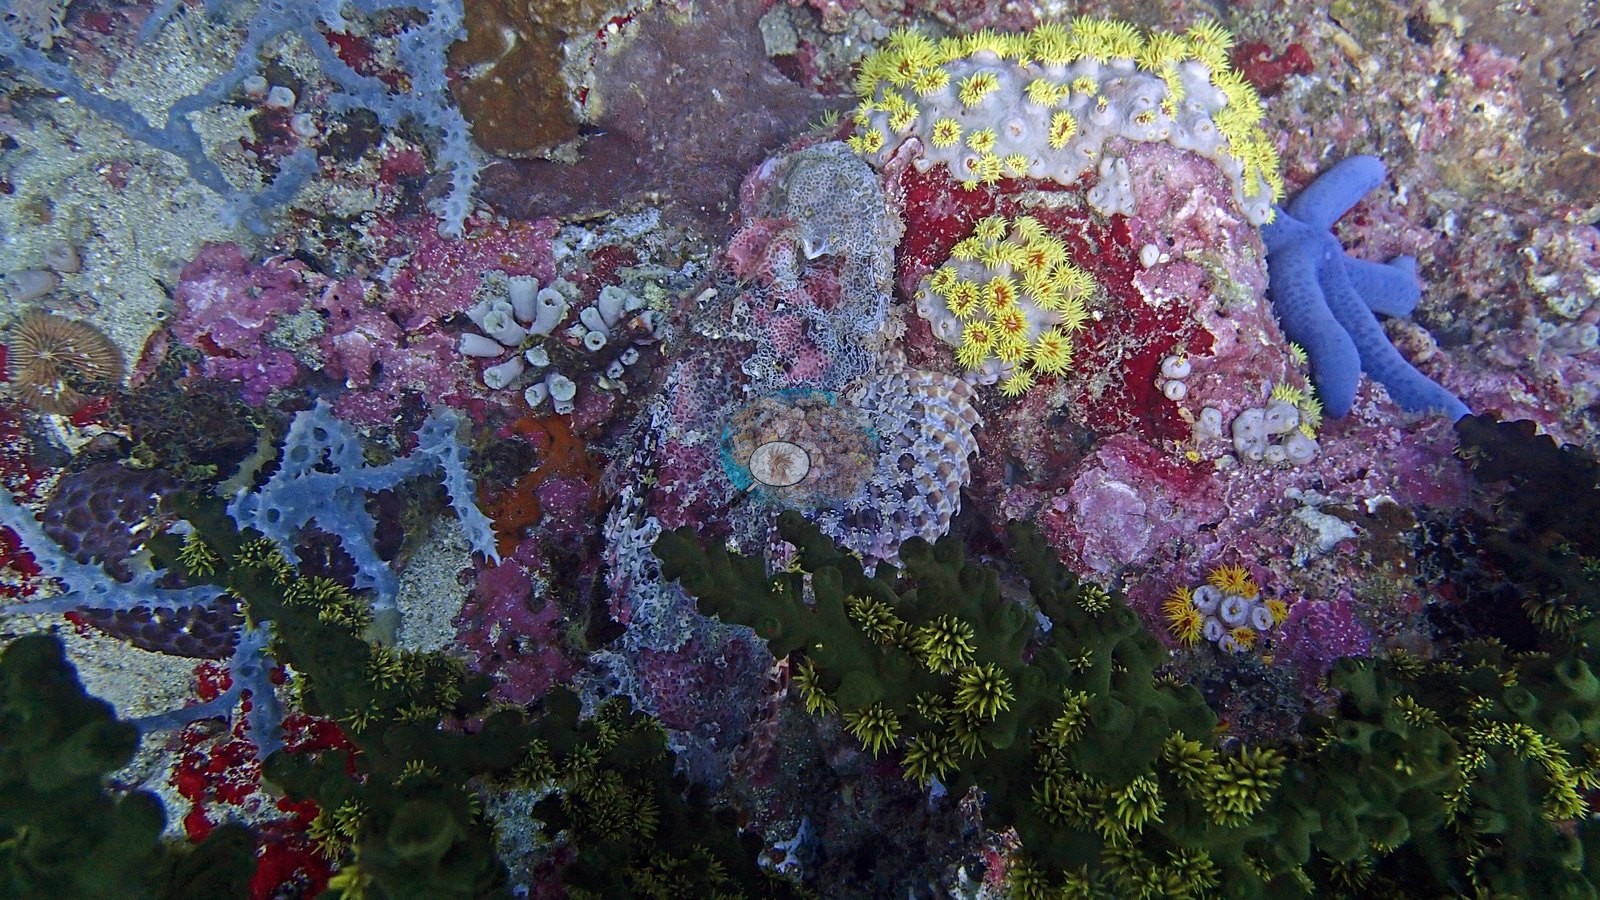
Blue Linckia sea stars are frequent, an orange sea star patterned with white ocelli appears twice, a scorpionfish sits camouflaged among the Tubastraea, and anthias and chromis fill the water column (e.g., Image 5, Image 15).
Comparisons with other data
No independent survey was made at this exact site; the nearest ones are listed in the table below.
Dive record
The first dive of the September 2016 Anilao trip, on the reef fringing Ligpo Island off Bauan at the north end of the Calumpan Peninsula; all 94 available frames were reviewed.
CV model comparison
More info
As of September 2026 no computer-vision method estimates coral cover accurately on new images, so treat this as indicative rather than a measurement; it is revised as the methods improve.More info
The published figure is the mean of the two methods.| Method | Hard-coral cover (%) |
|---|---|
| In-house DINOv3 | 21.0 |
| CoralSCOP | 34.2 |
| Mean (± SD) | 27.6 ± 9.3 |
| Range | 21.0–34.2 |
Mean ± SD and range are across the computer-vision methods shown.
Independent surveys nearby
Within 5 km, 2 independent survey stations recorded hard coral cover in 2014. The most recent nearby survey is from 2014, so these values predate recent heat stress. This site's own estimate (28%) sits 29.3 points below the range of these surveys (57–70%); the methods differ, so the comparison is context, not a like-for-like test.
Collected by other programs using different methods (Reef Check uses point-intercept transects), so these are context for the figures above, not a like-for-like comparison. Where a station was surveyed more than once the range is shown. Station names are not dive-site names.
| Agency | Site / location | Date | Hard coral cover (%) | Distance | Link |
|---|---|---|---|---|---|
| Reef Check | Portulano Marine Sanctuary | 2014 | 57% | 1.10 km | — |
| Reef Check | Dive and Trek Marine Sanctuary | 2014 | 70% | 2.22 km | — |
Data & links
All images from Coral Reef Diagnostics. Data are from Coral Reef Diagnostics and the organizations named in the data-sources table above.
© Coral Reef Diagnostics.