
Philippines - Anilao: Monte Carlo Hotel

Part of the regional summaries: Philippines - Luzon and Philippines
More info
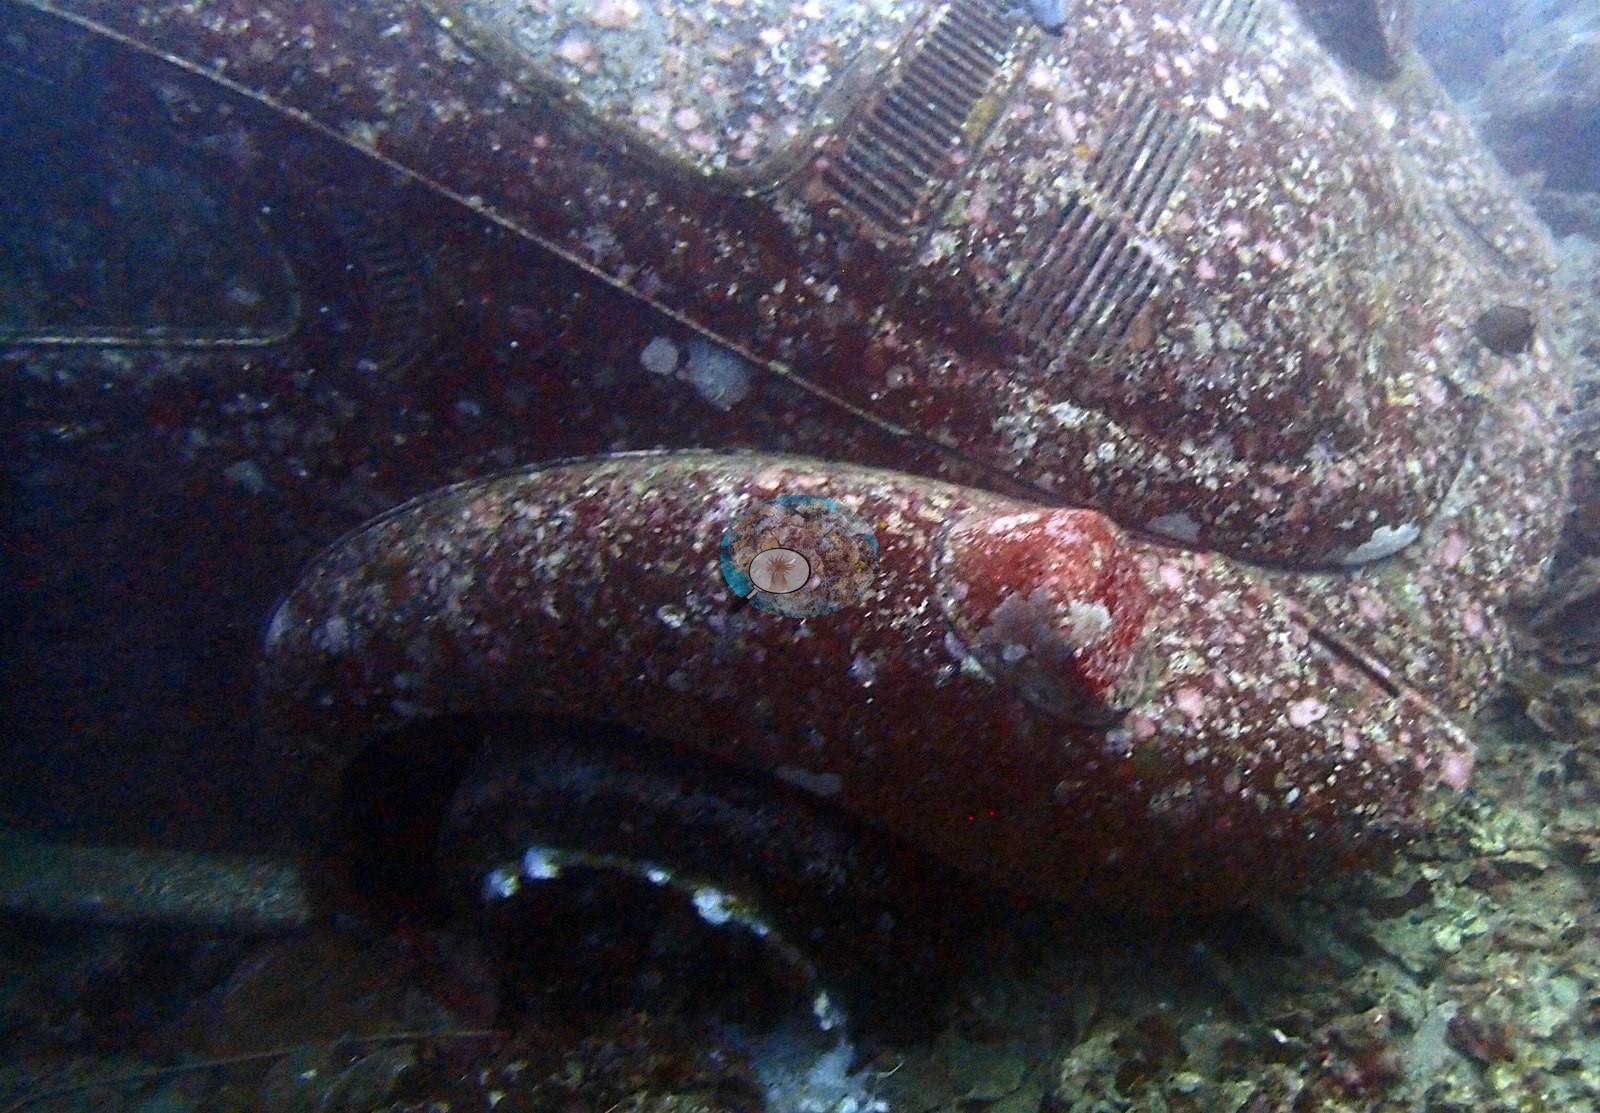
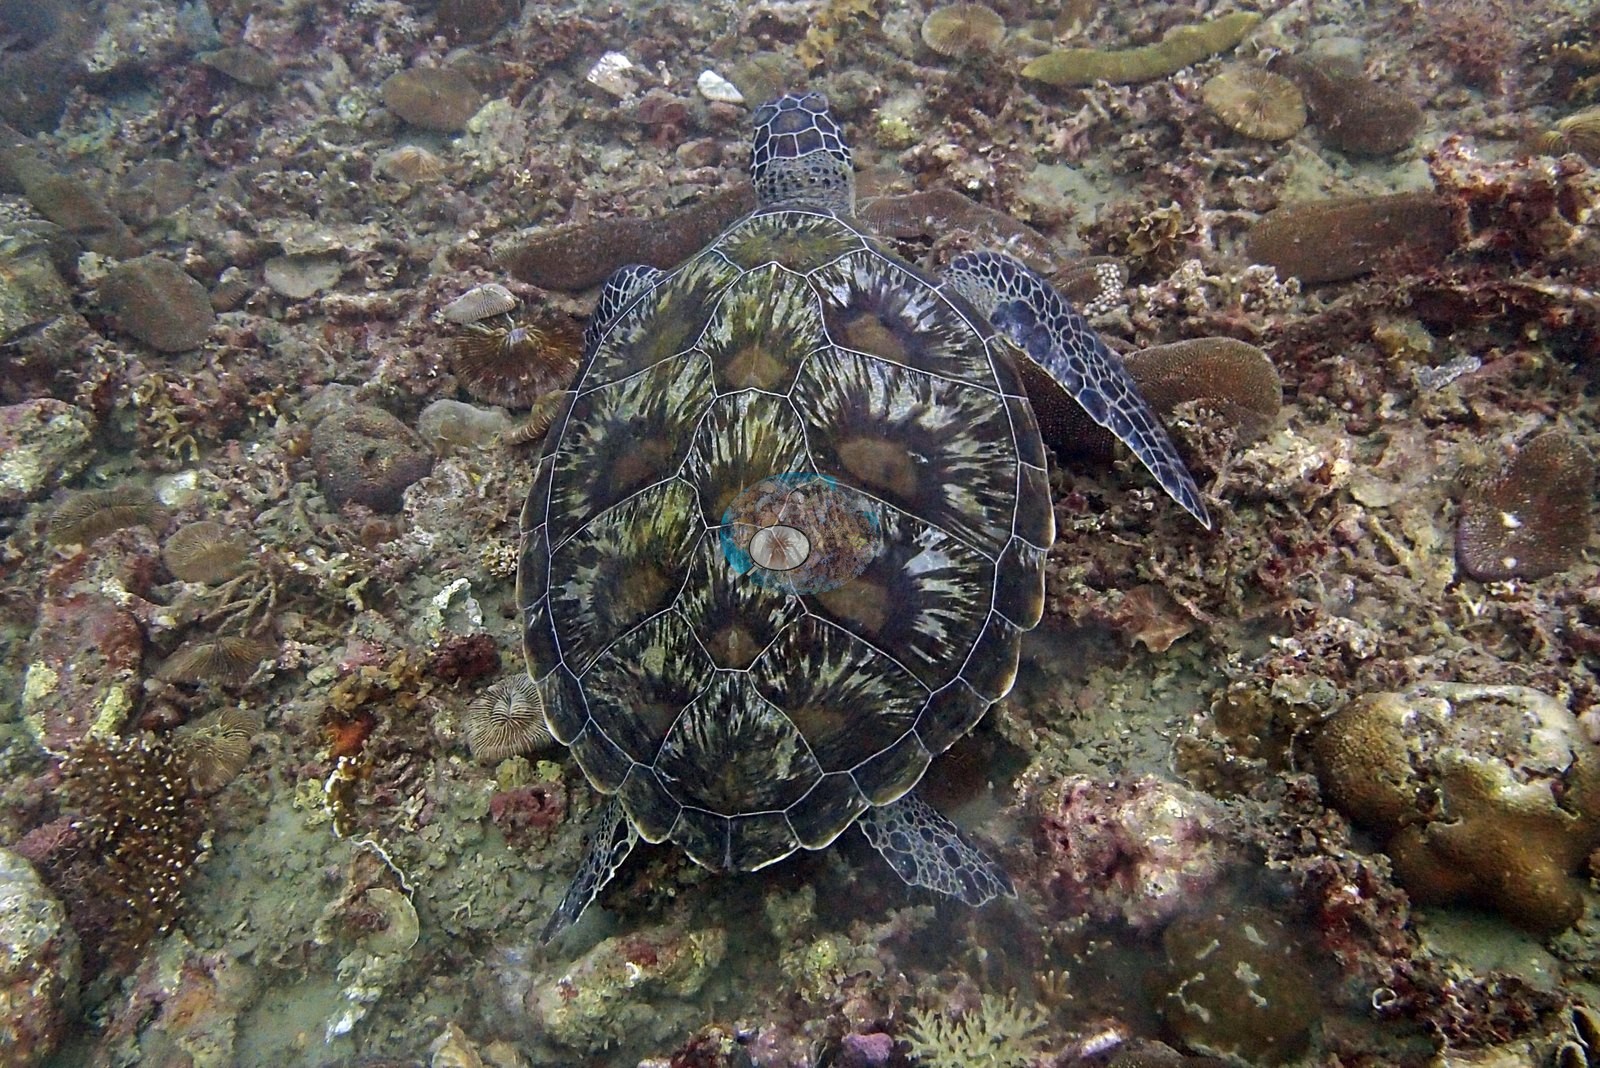
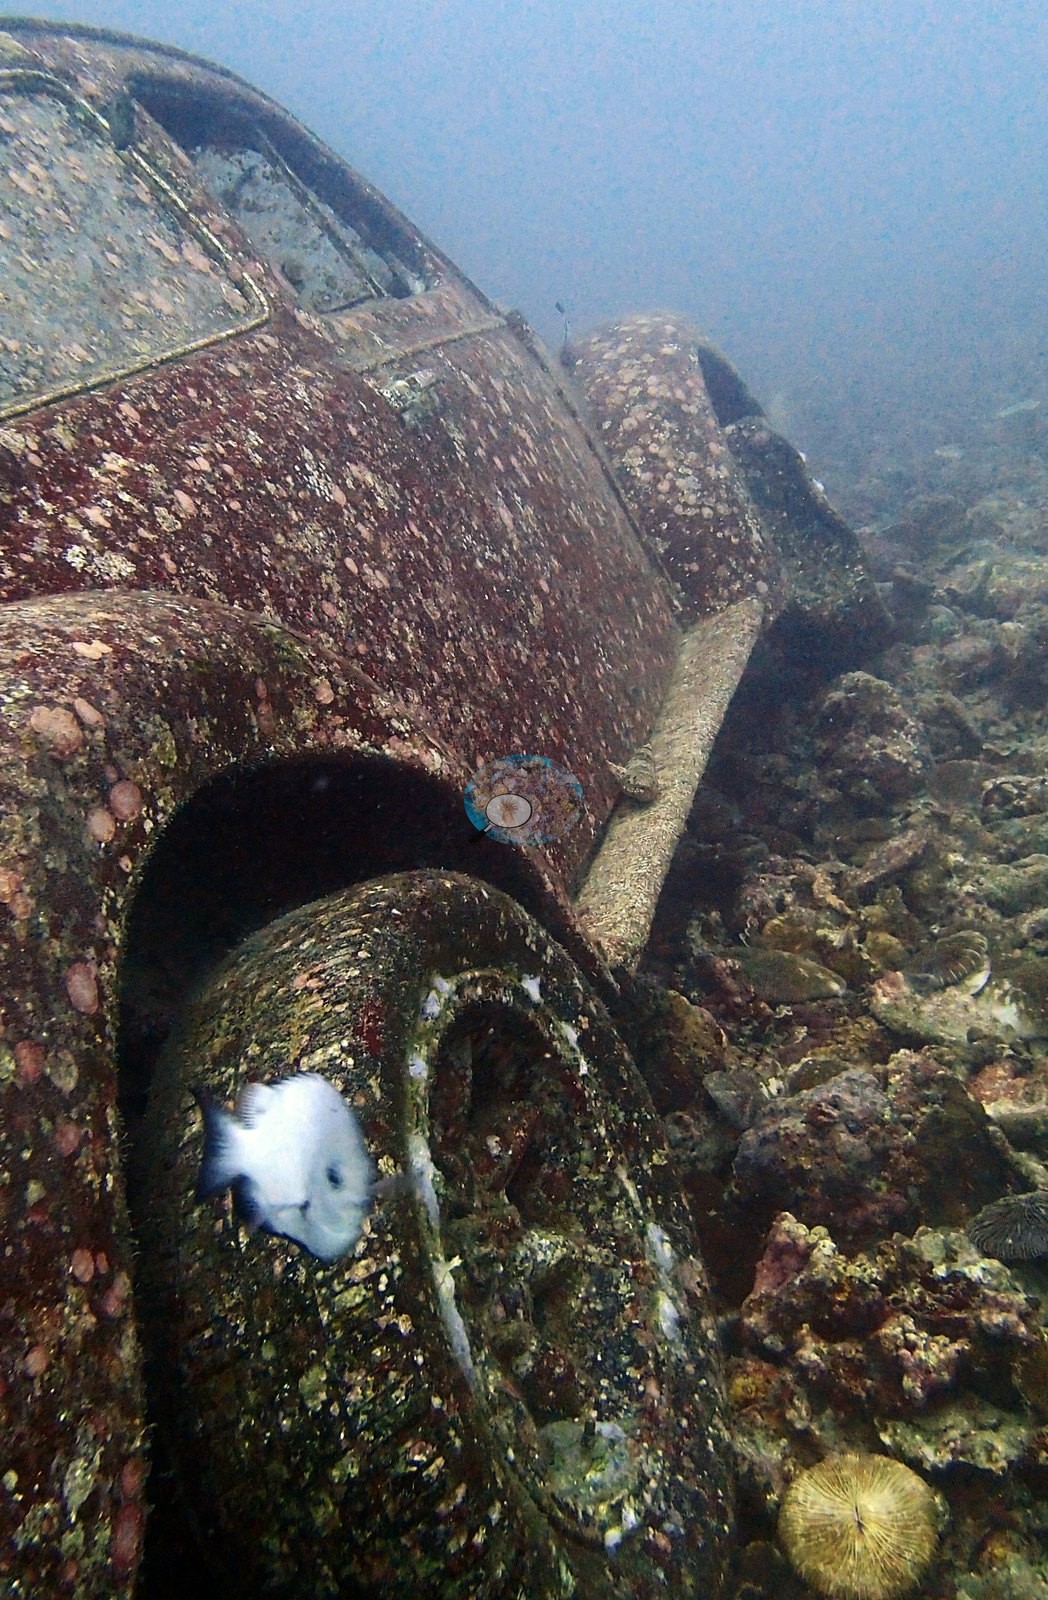
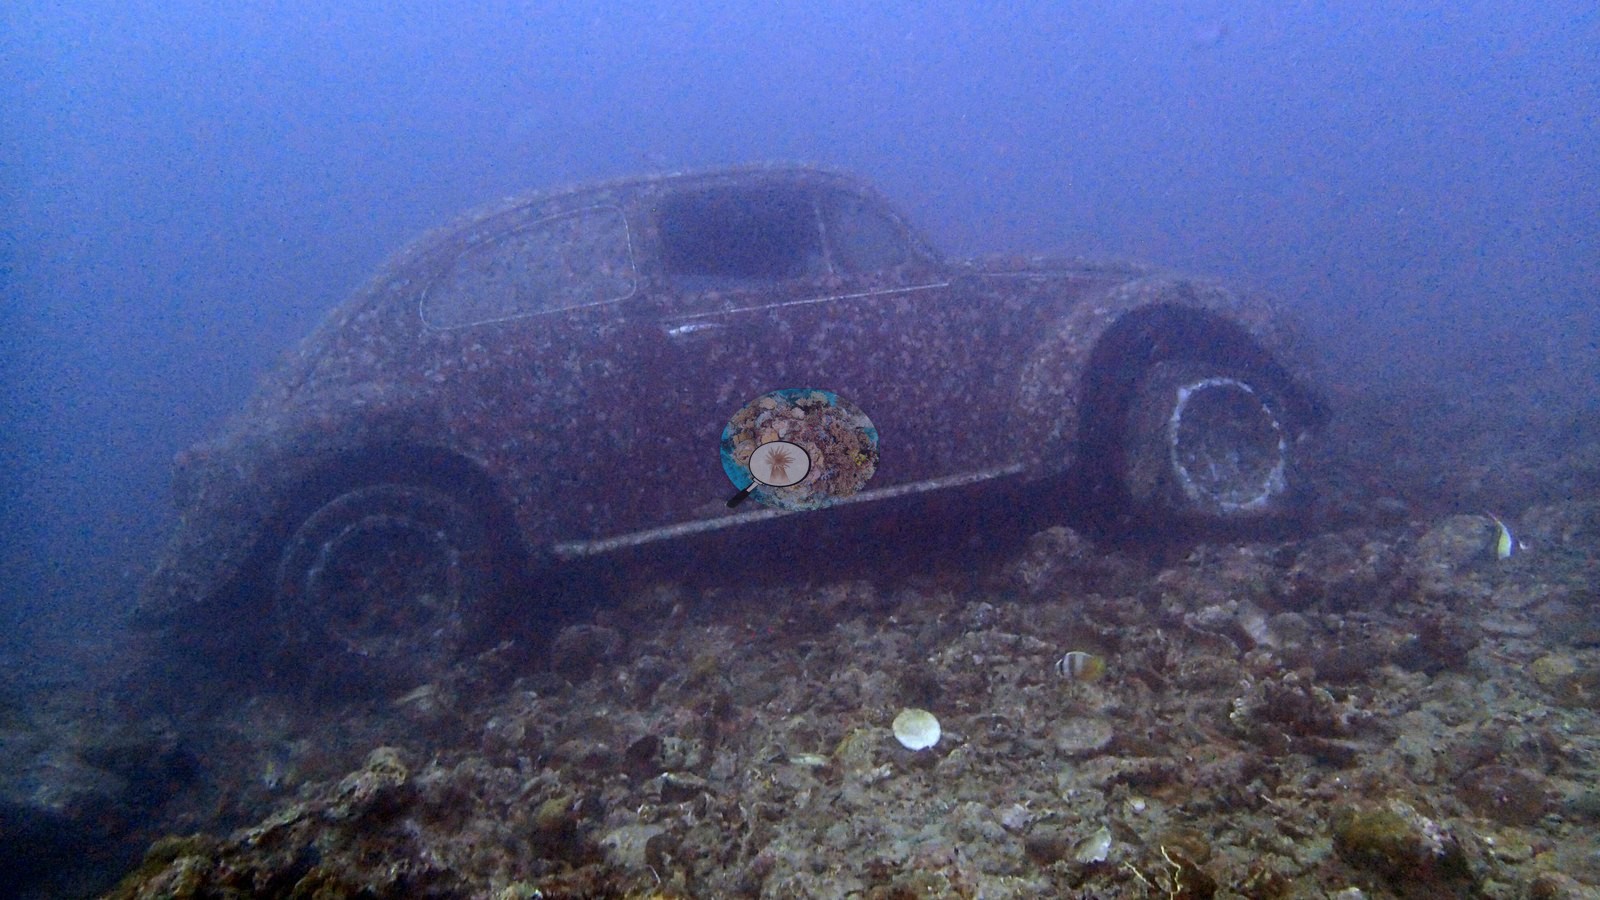
Central Philippines (NOAA CRW virtual station) · Eastern Philippines ecoregion mean=7.5°C-heating weeksAn unusual, substantially man-made house reef - a sunken Volkswagen Beetle, mermaid statue, and a deliberate tableau of bathtubs and toilets, one hosting a large coral colony - with genuine coral settlement tiles and near-continuous plating coral cover at 30-40 m. Green turtles were seen foraging over the rubble. Cover estimate is roughly 22%.
Isang pambihira at halos gawa ng tao na house reef - isang lubog na Volkswagen Beetle, estatwa ng sirena, at isang sinadyang tanawin ng mga bathtub at inodoro, na ang isa ay tinitirhan ng malaking kolonya ng koral - kasama ang tunay na mga tile para sa pagtira ng koral at halos tuloy-tuloy na saklaw ng plating coral sa 30-40 m. May nakitang mga pawikang berde na naghahanap ng pagkain sa ibabaw ng mga durog na koral. Ang tantiya ng saklaw ay humigit-kumulang 22%.
Salin ng buod na ito gamit ang AI; ang Ingles ang opisyal na bersyon.
Nine independent survey stations shown with the program’s logo — click one to see how far it is from this site.
Four other CRD dive sites within 5 km shown in orange — click a marker to open its page.
21 of these 50 photographs are shown beside the text that discusses them under "Site description" below.
Site description
General benthic features
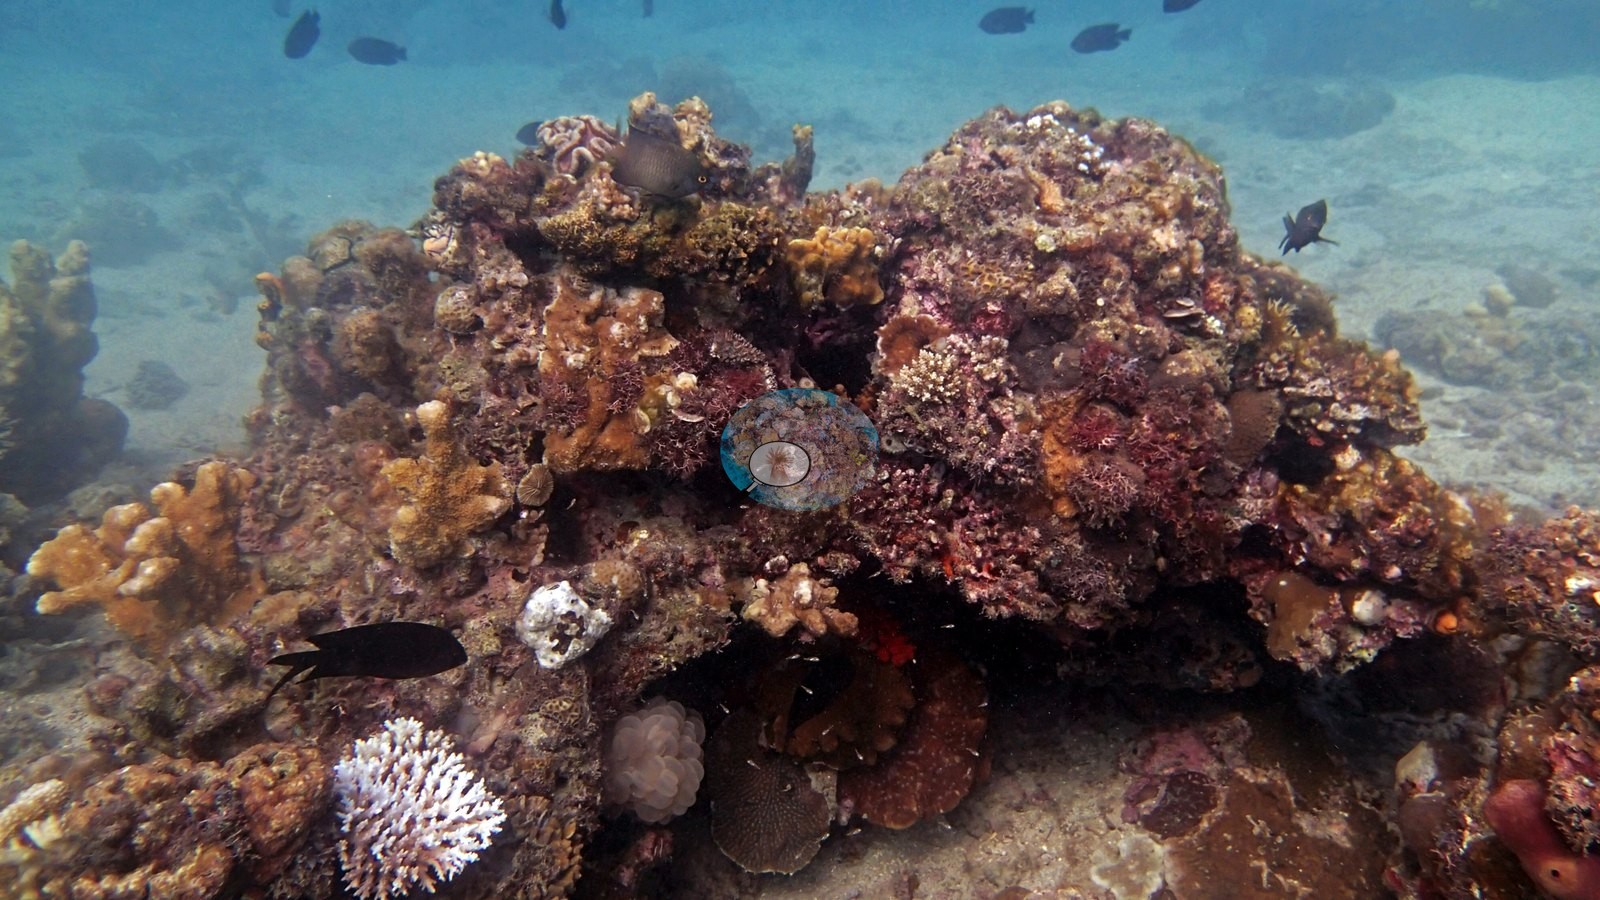
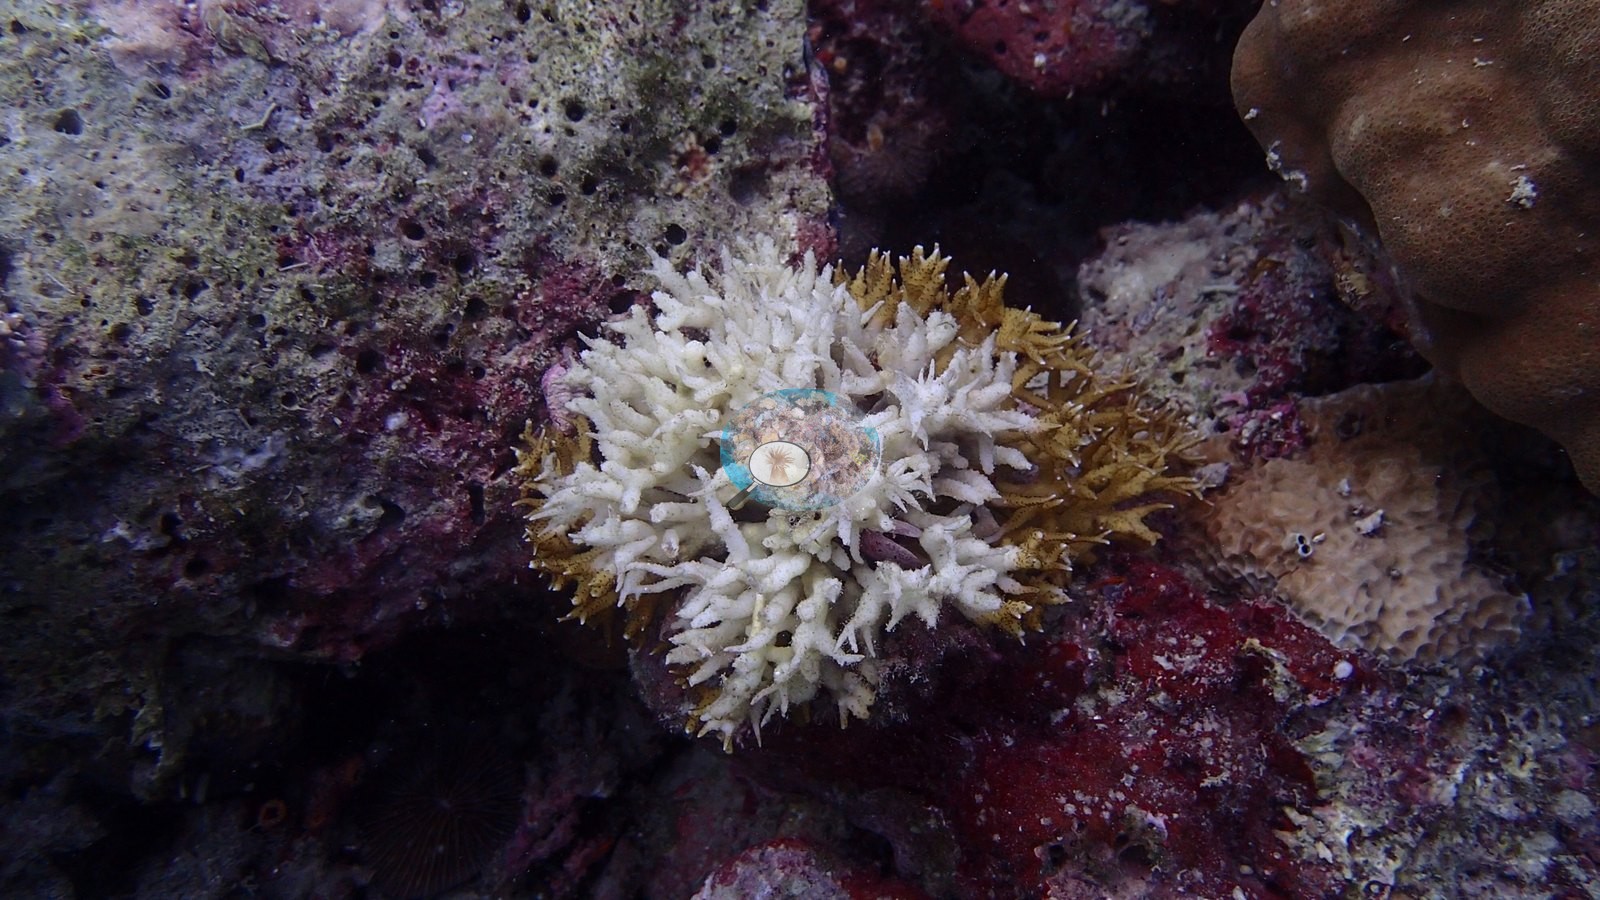
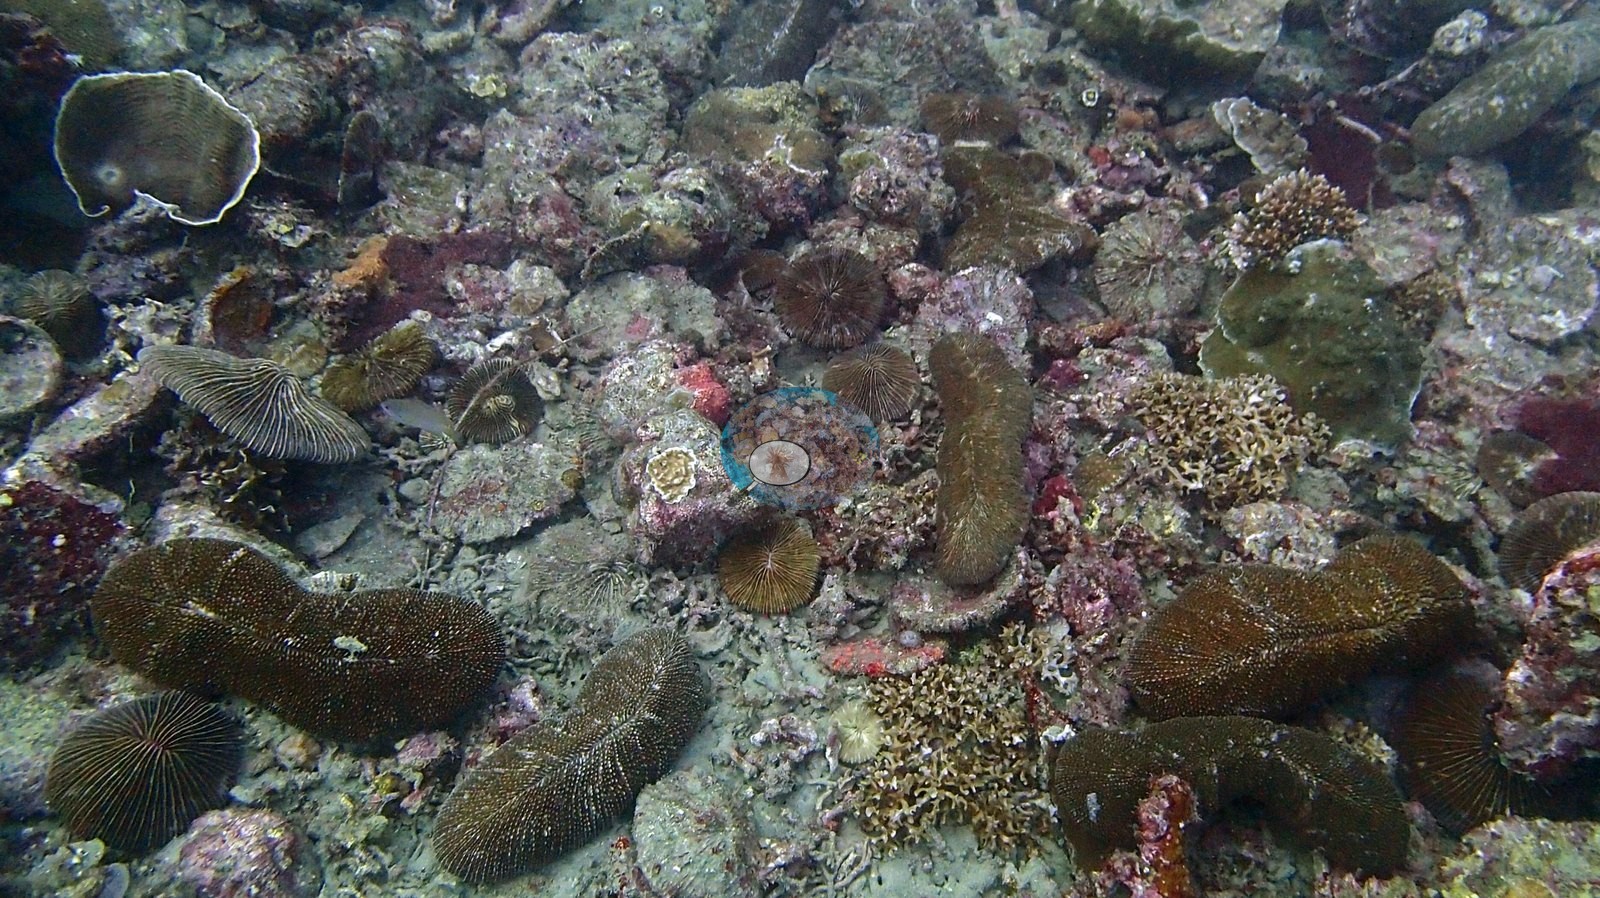
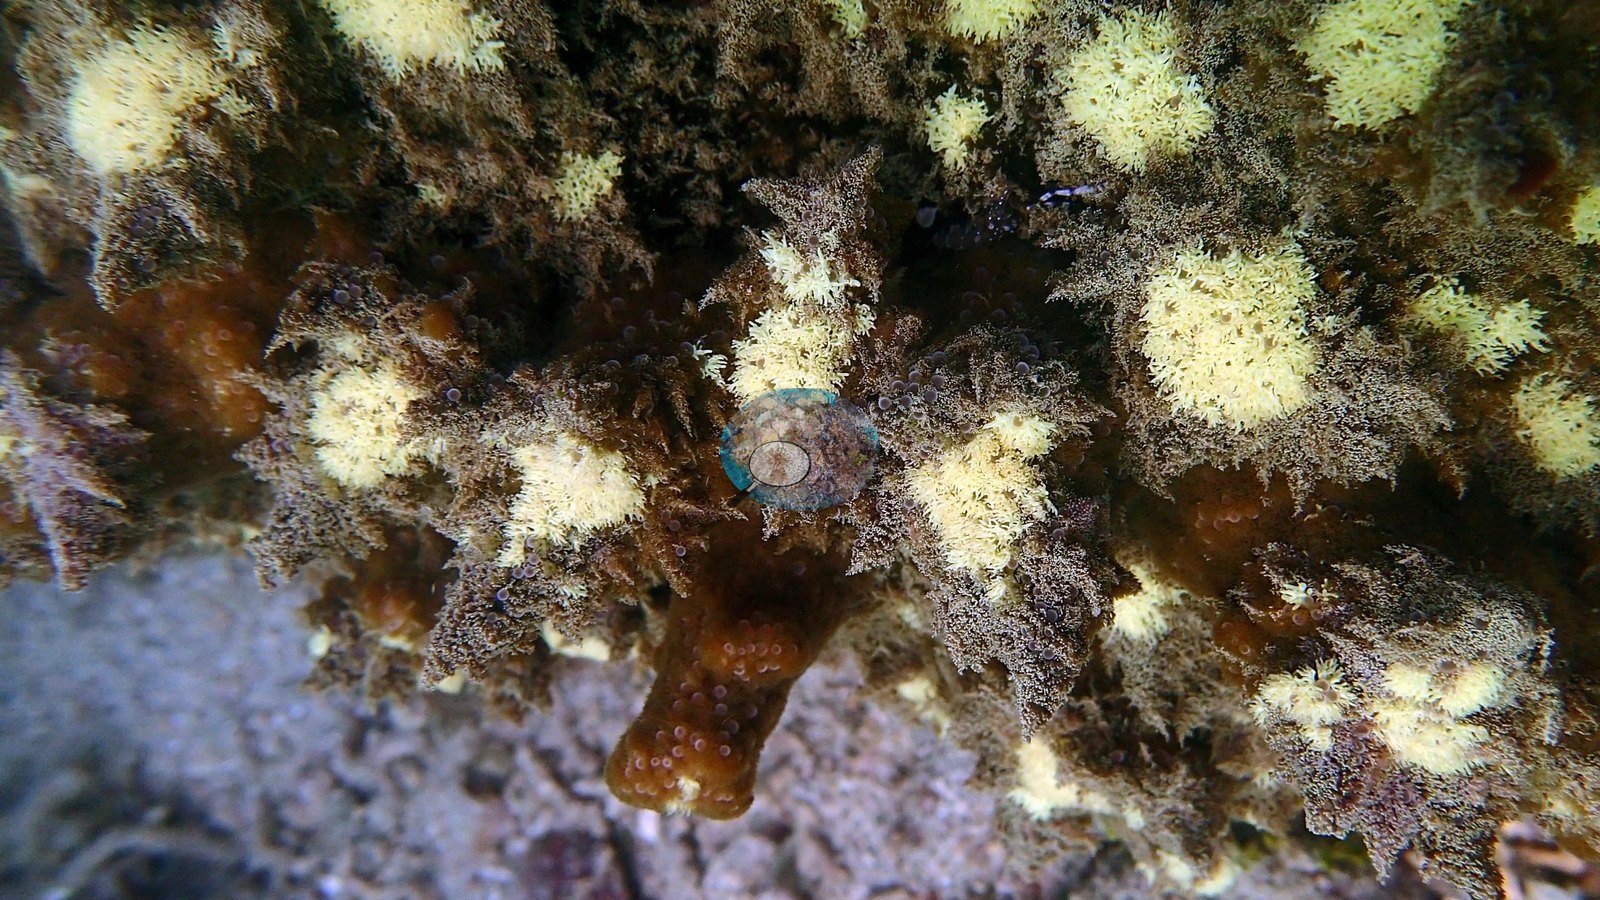
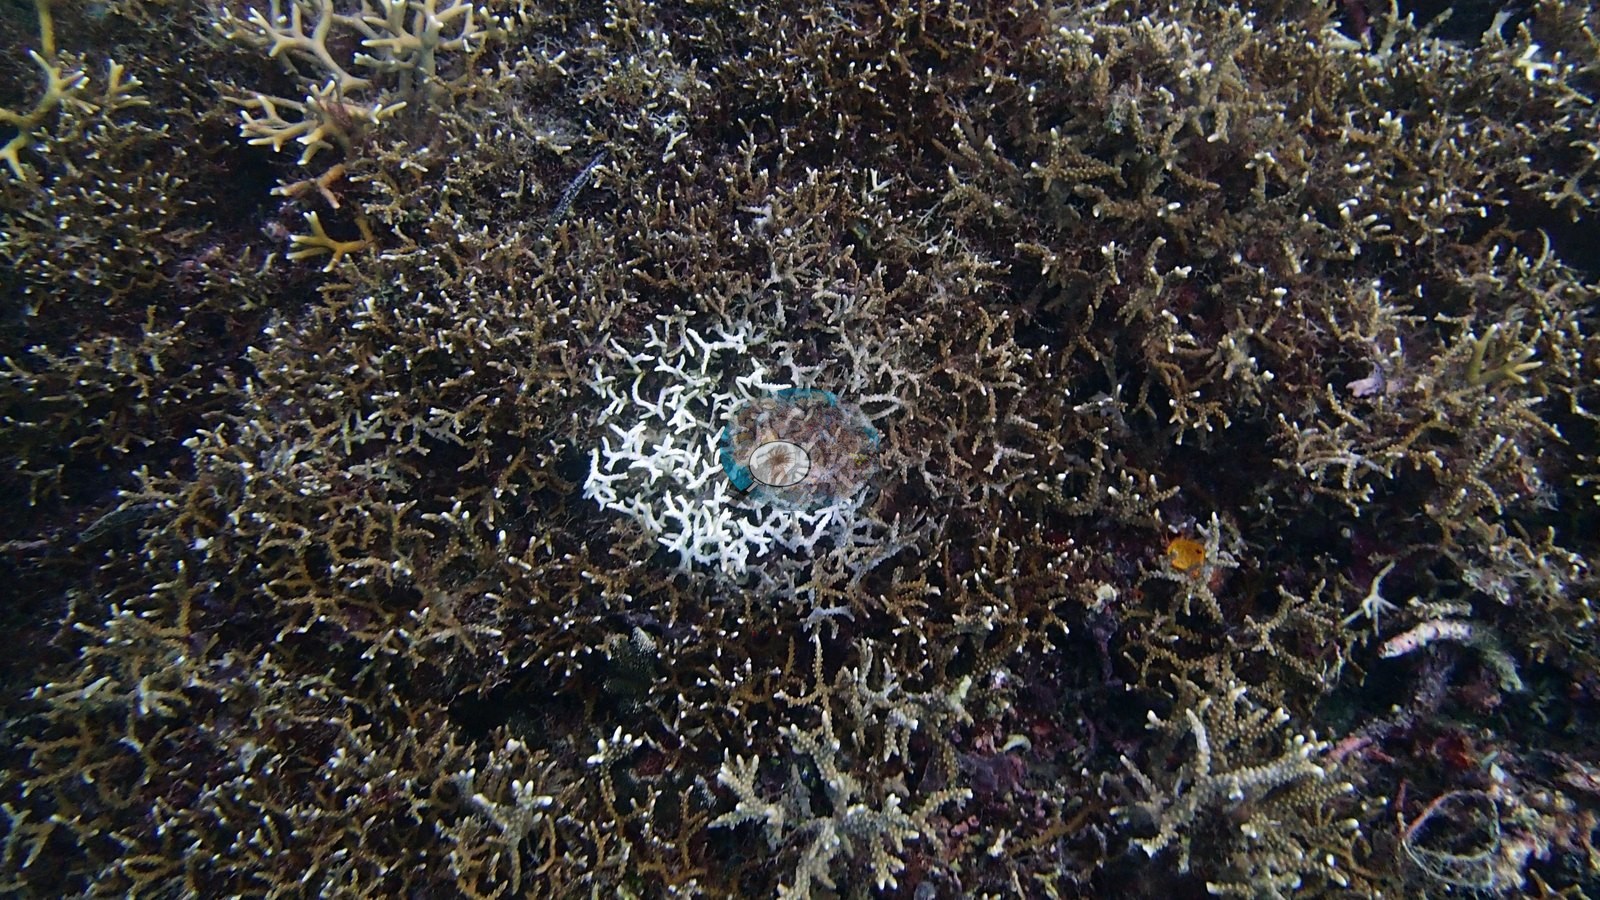
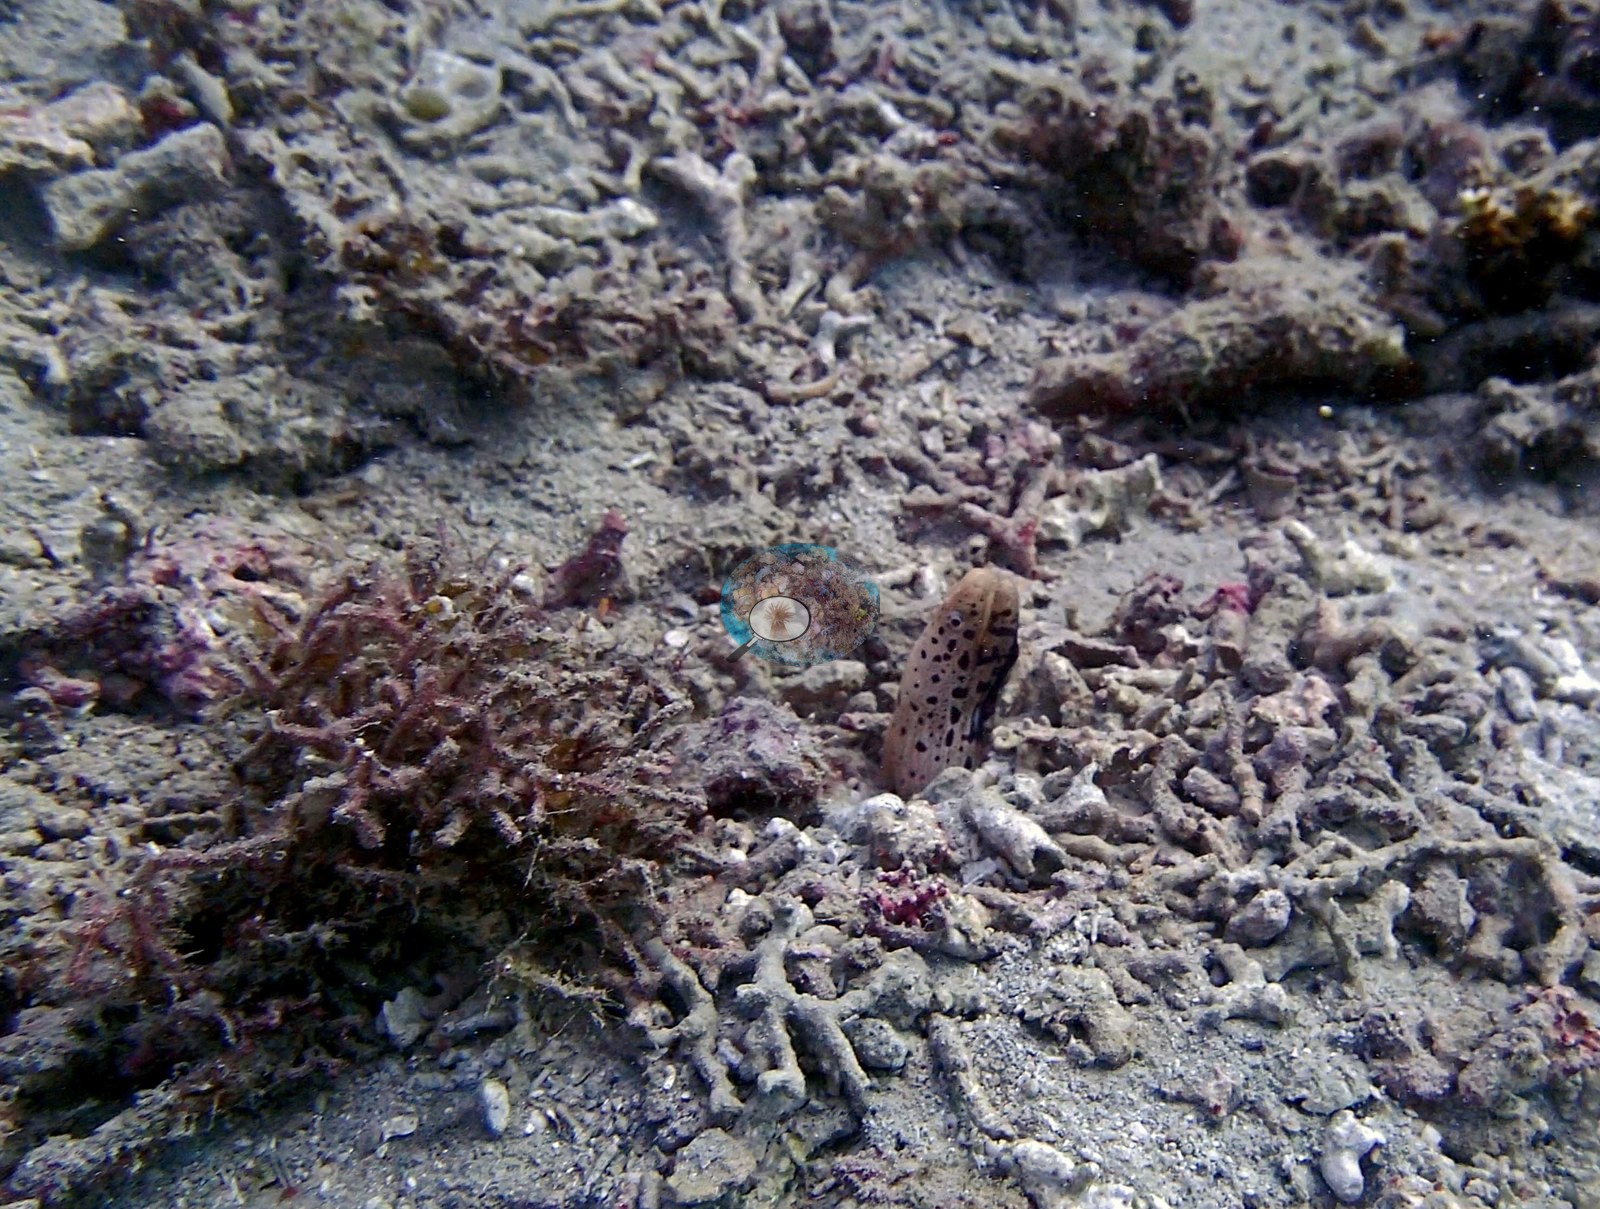
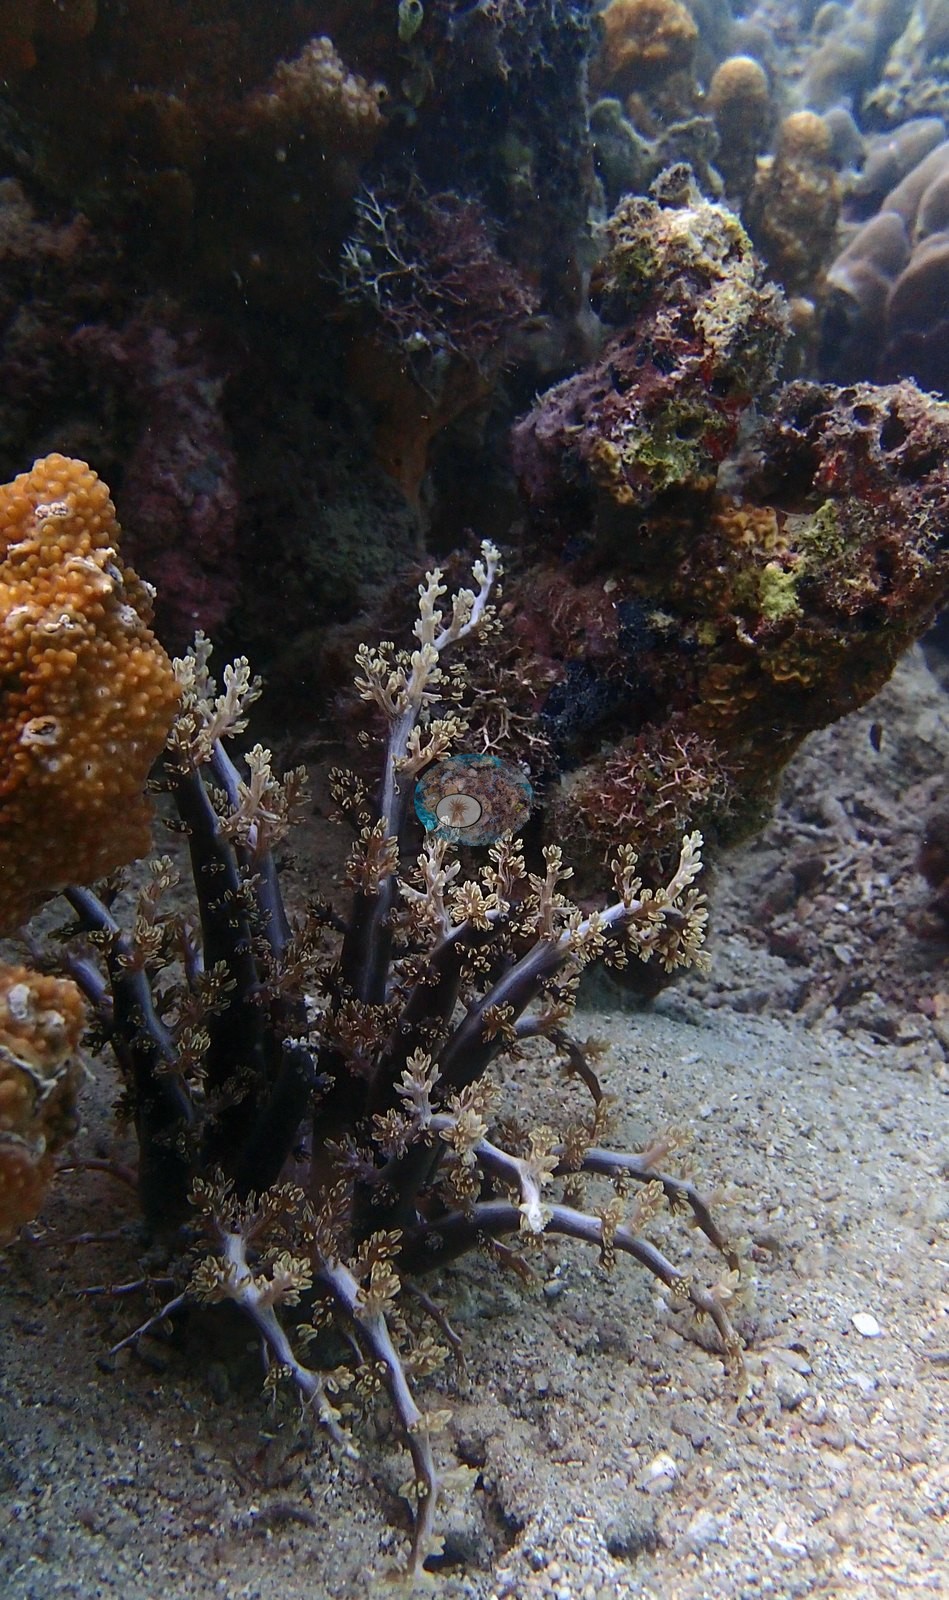
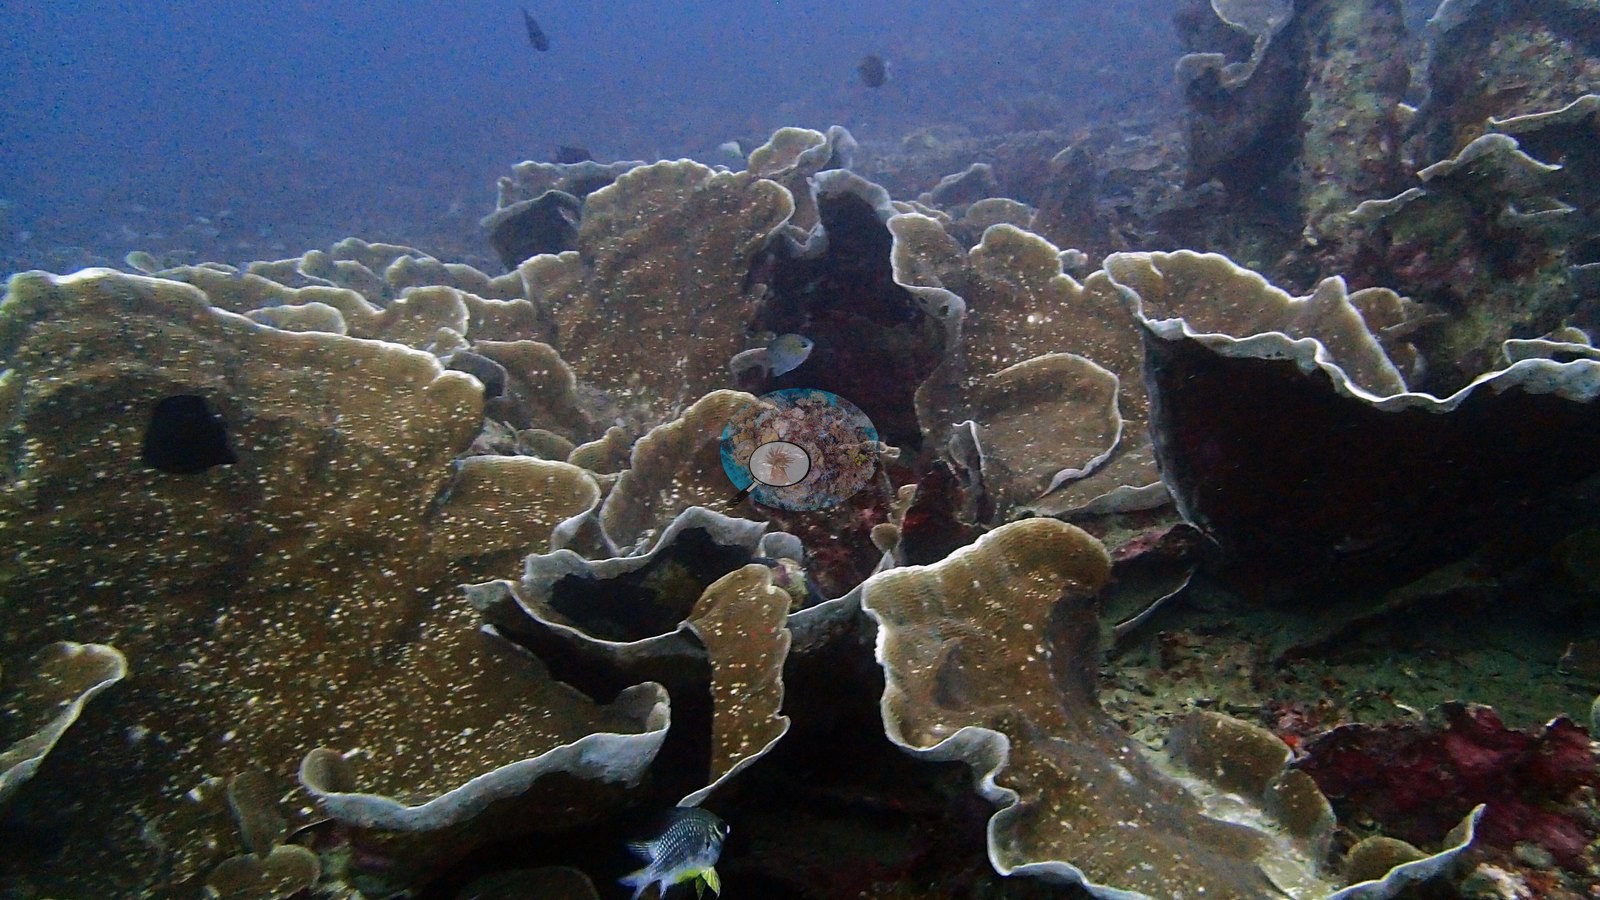
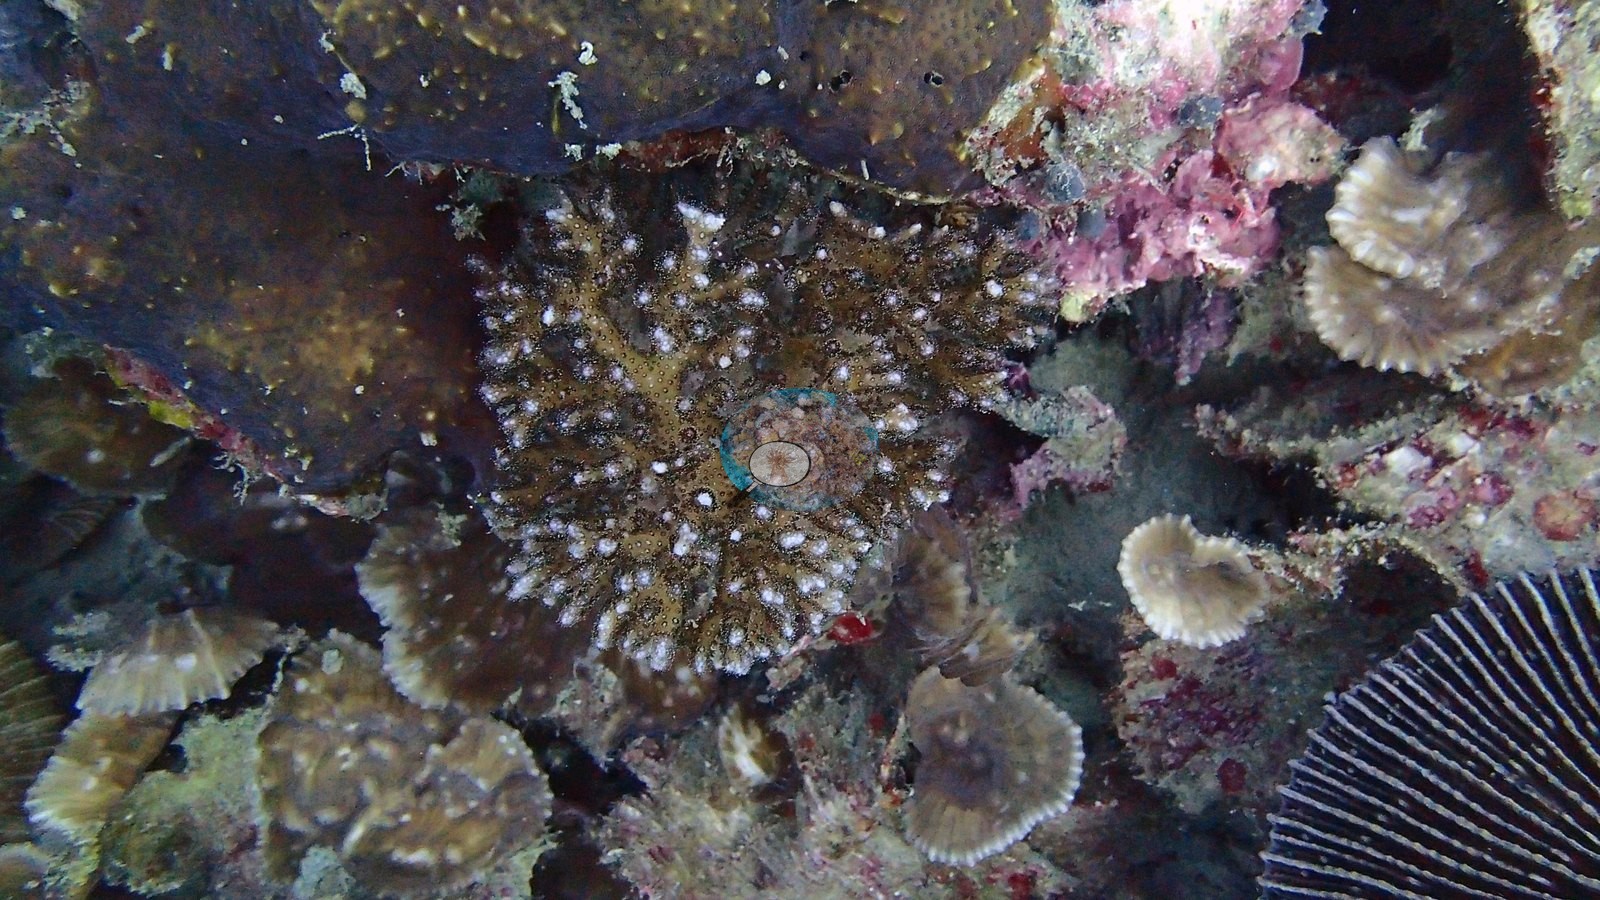
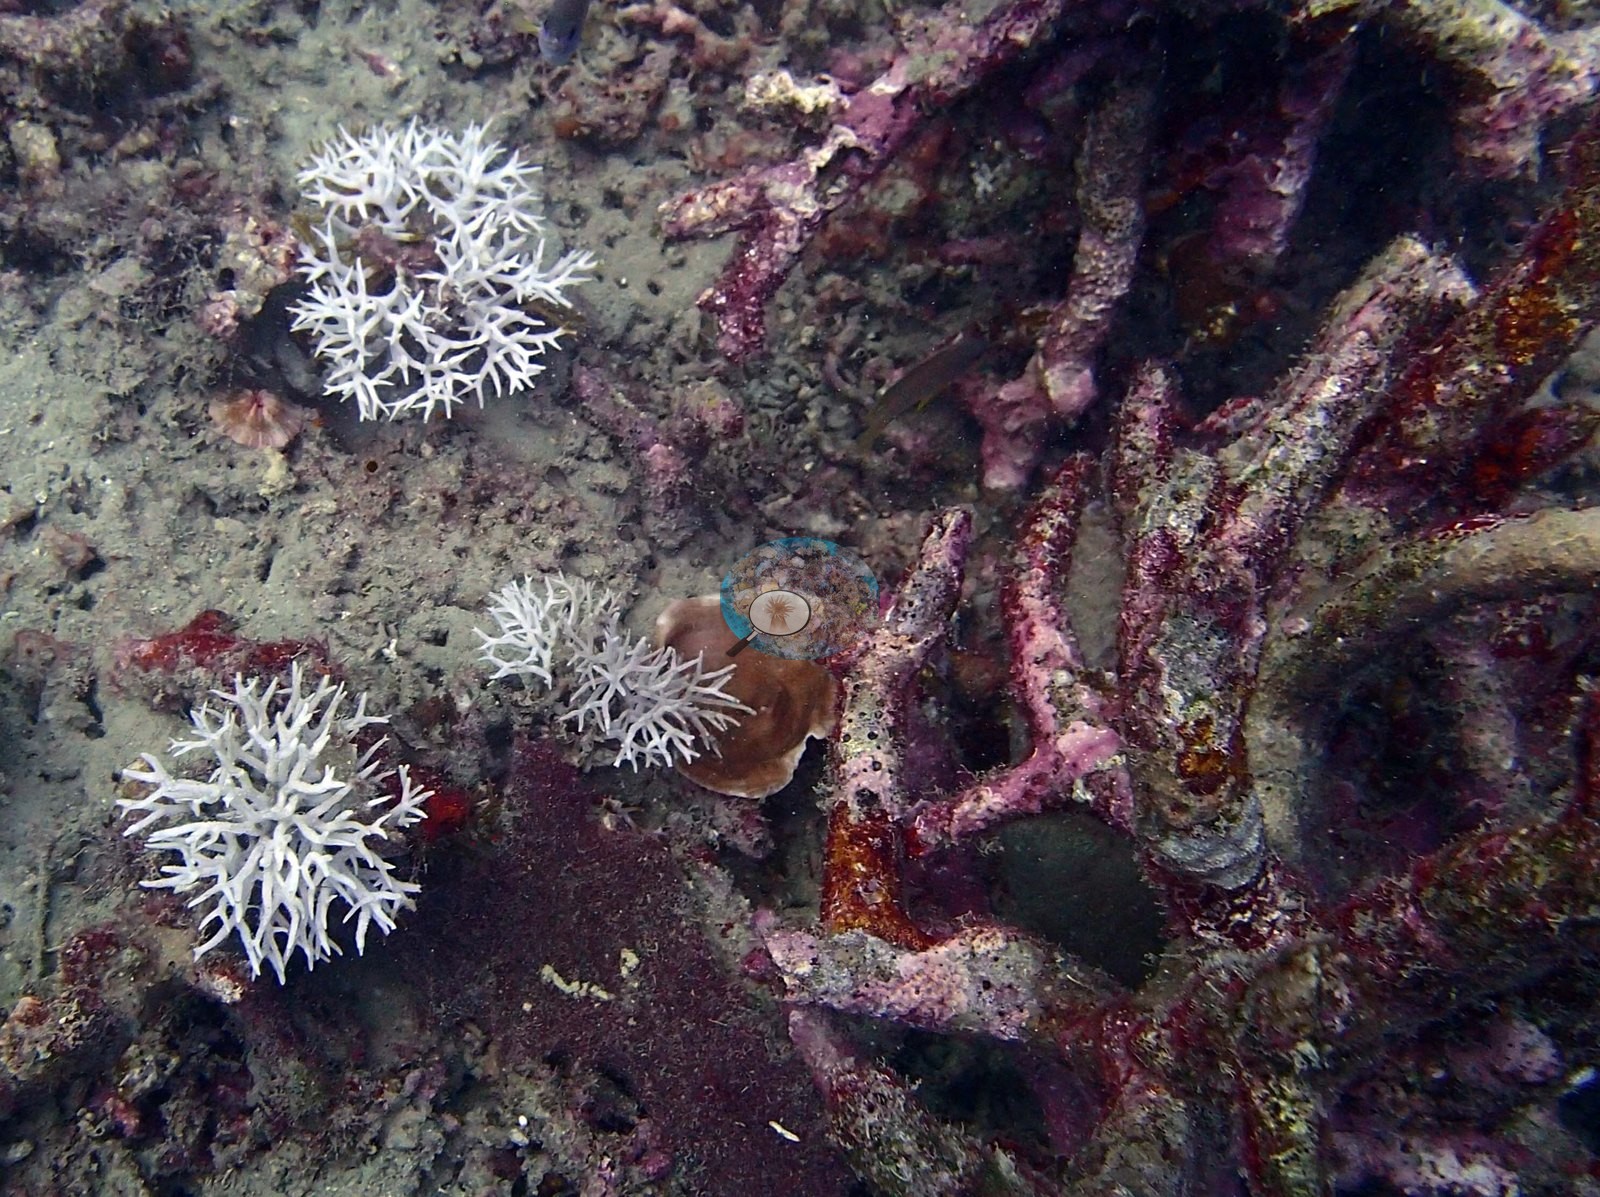
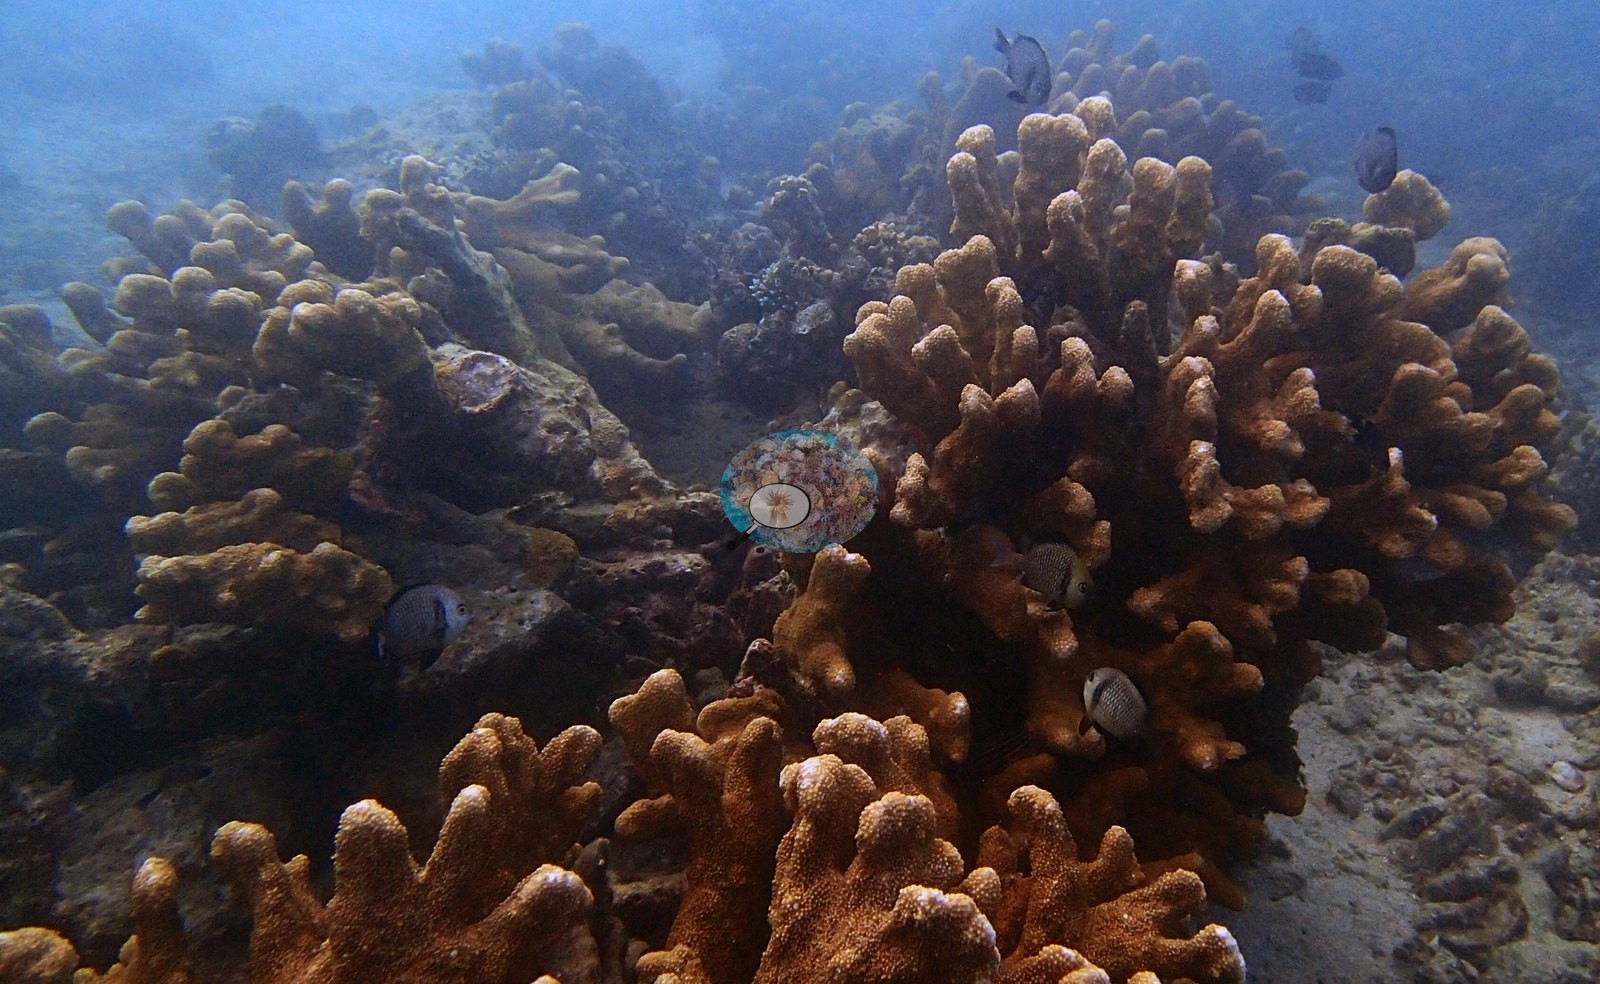
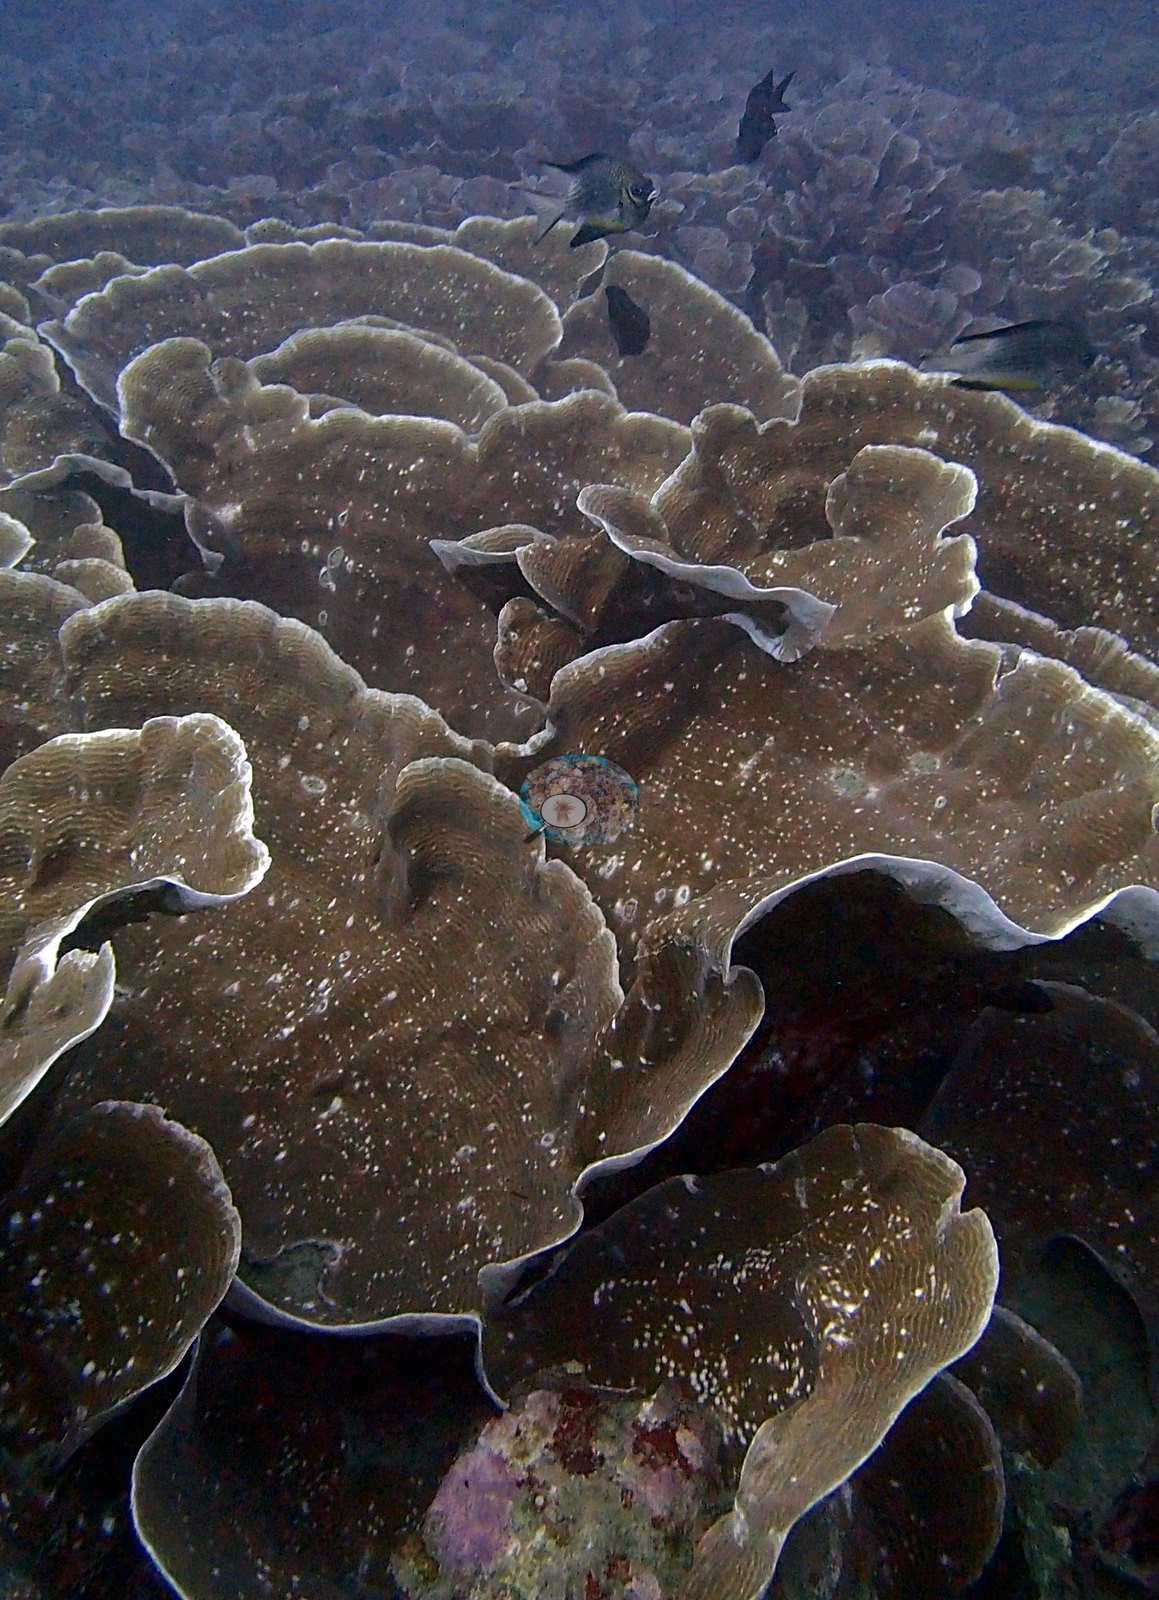
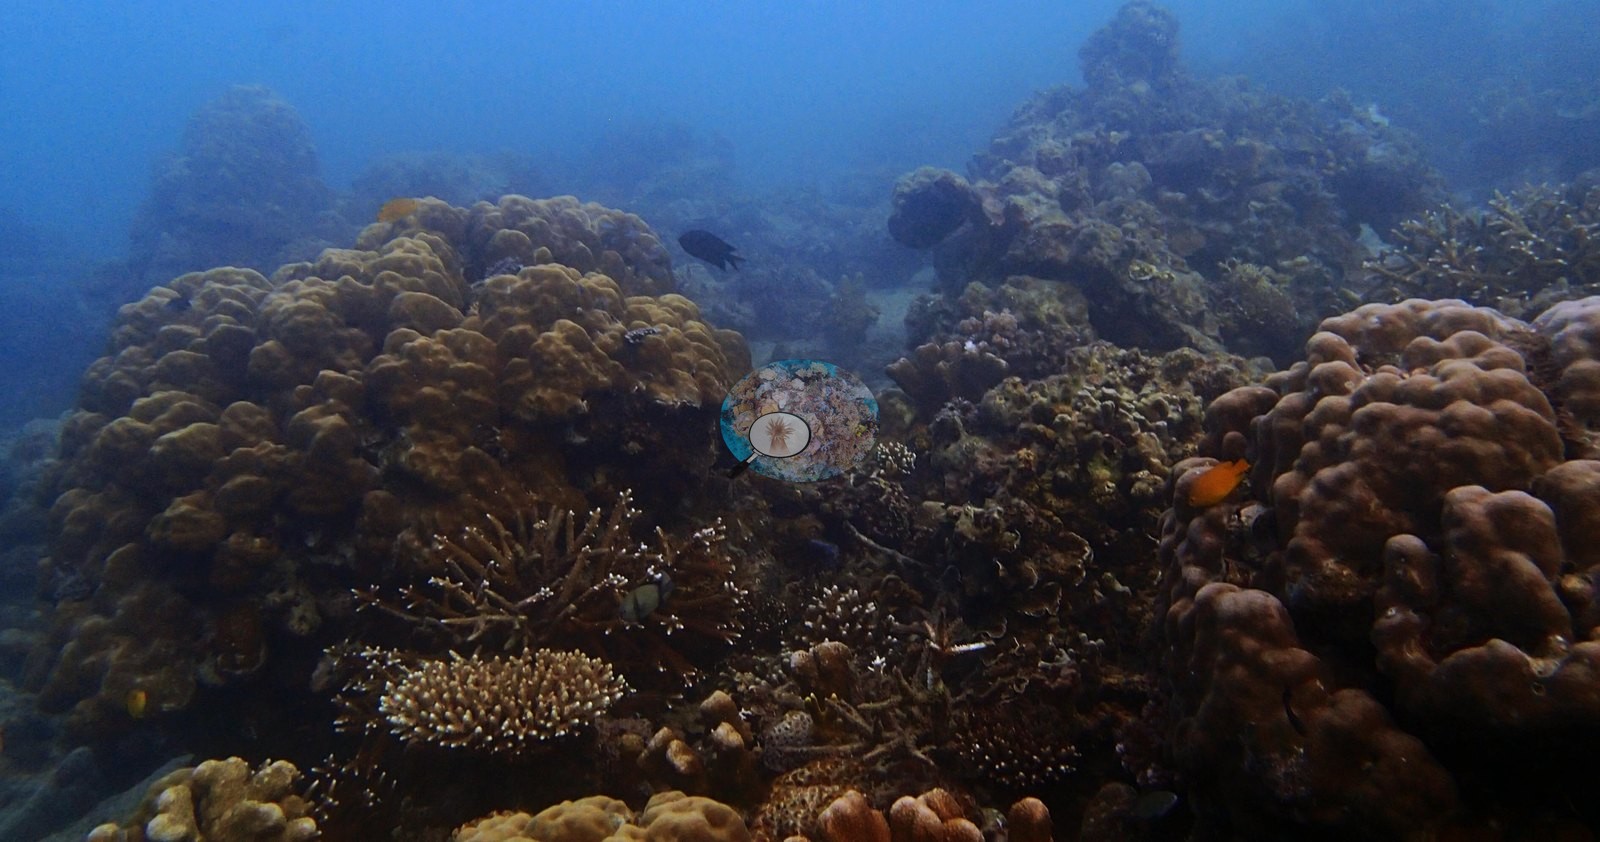
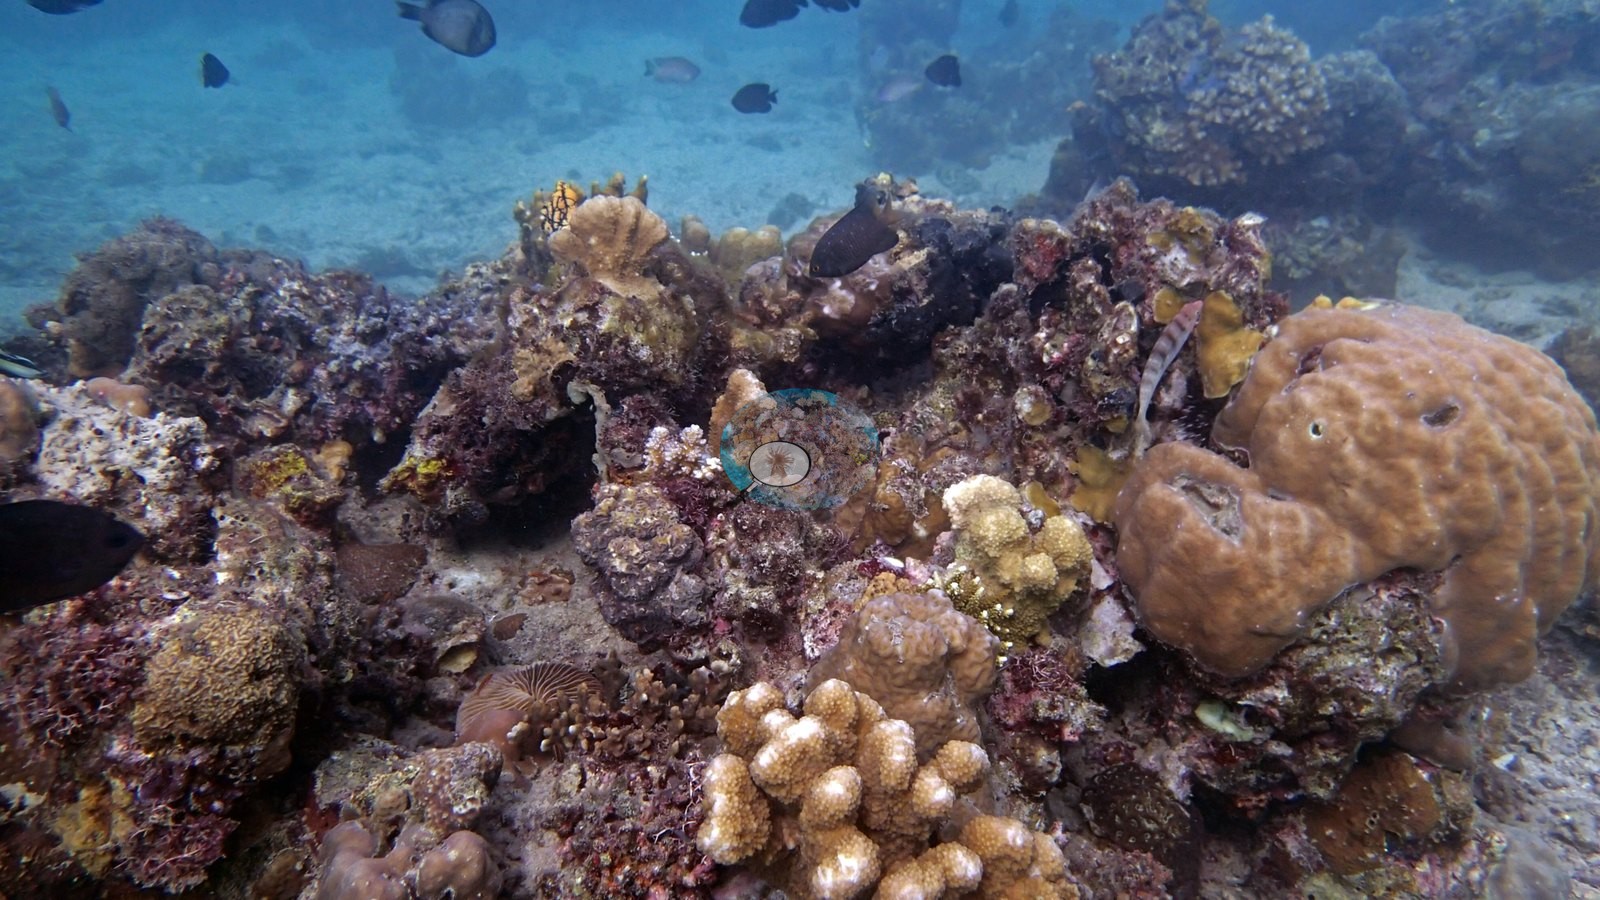
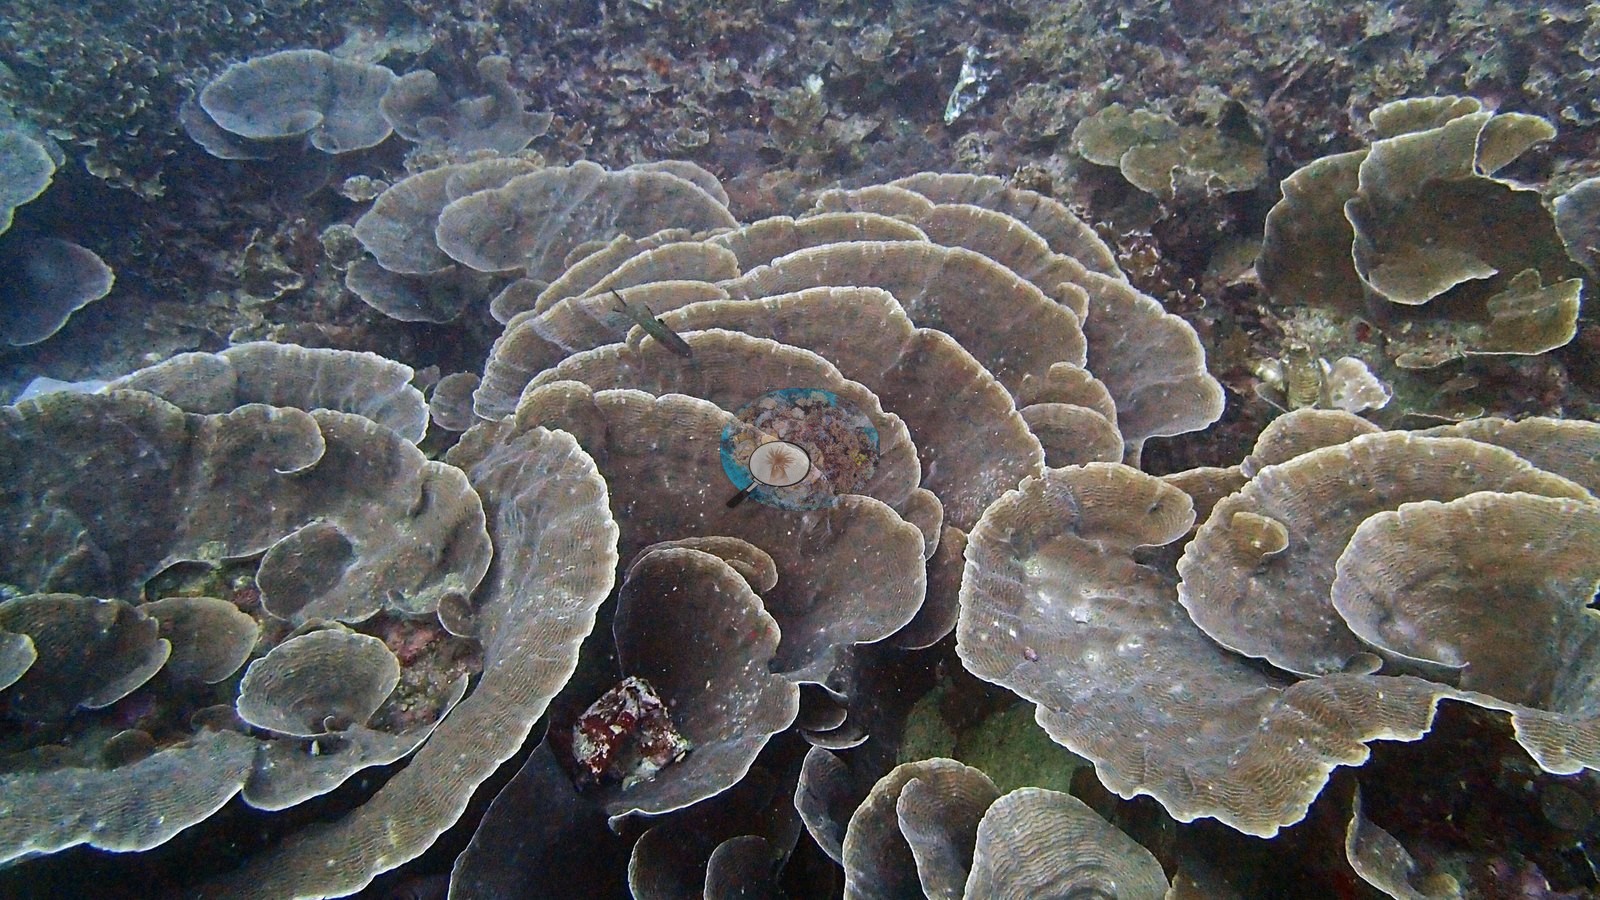
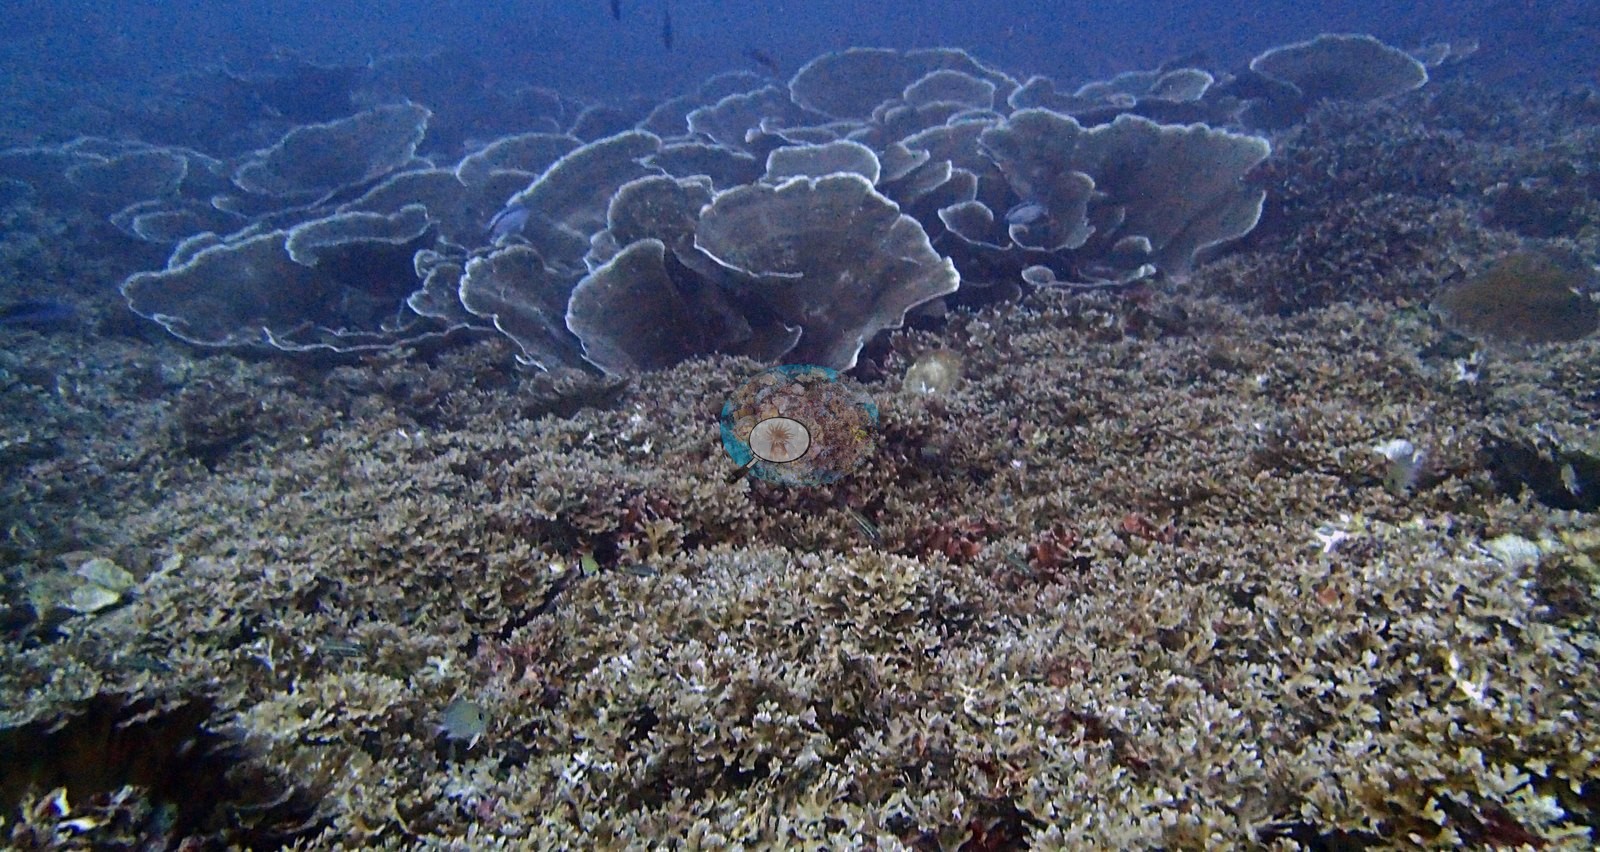
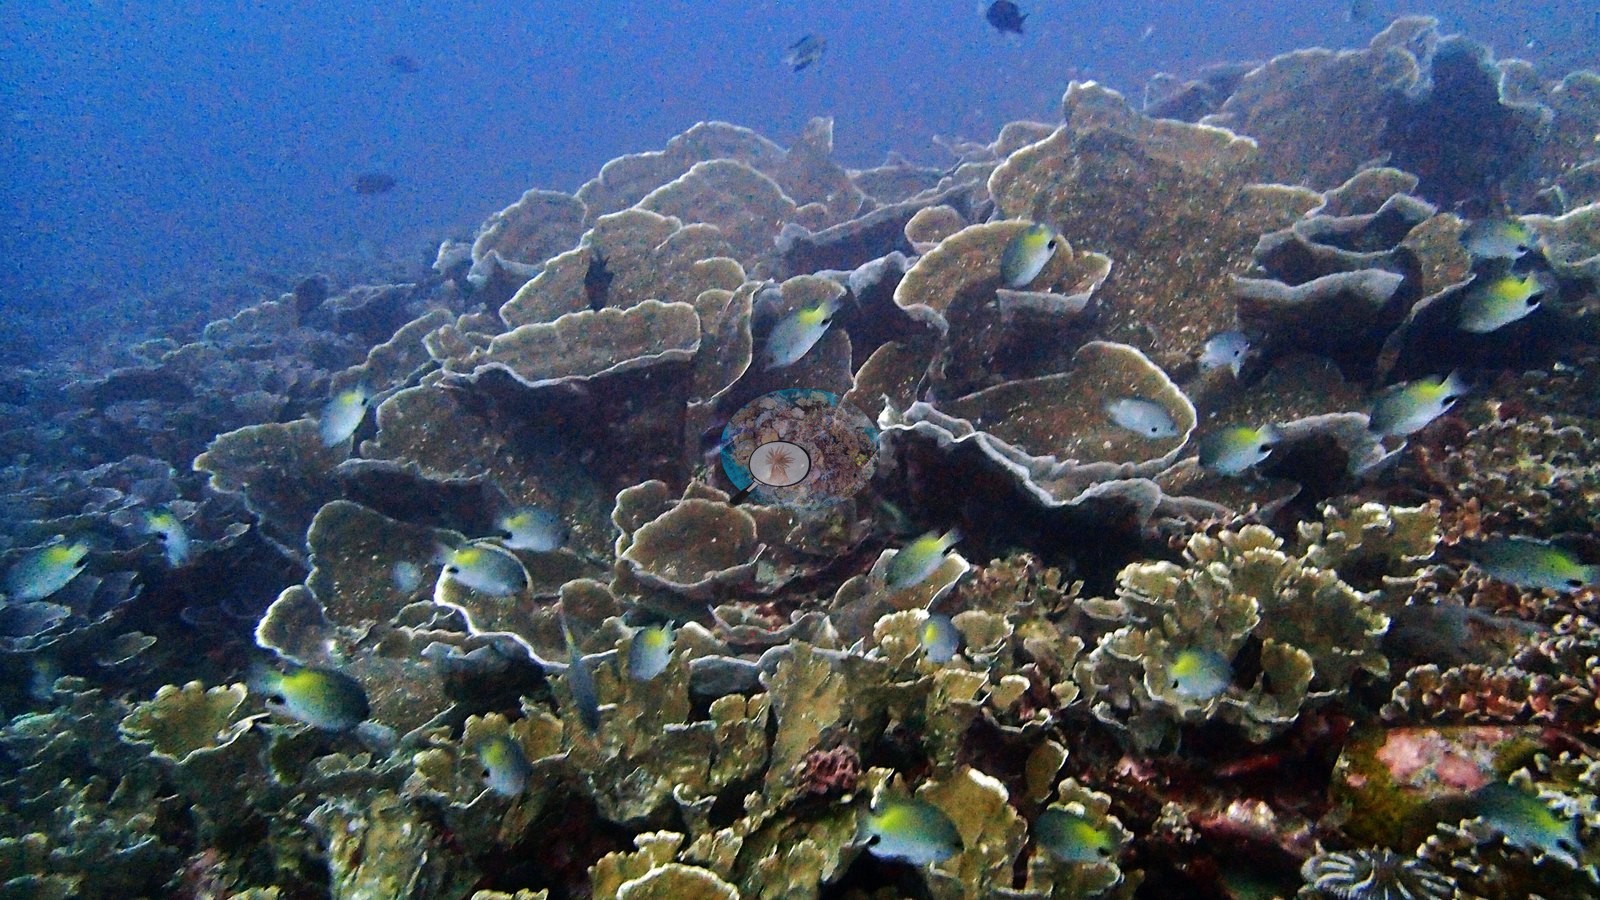
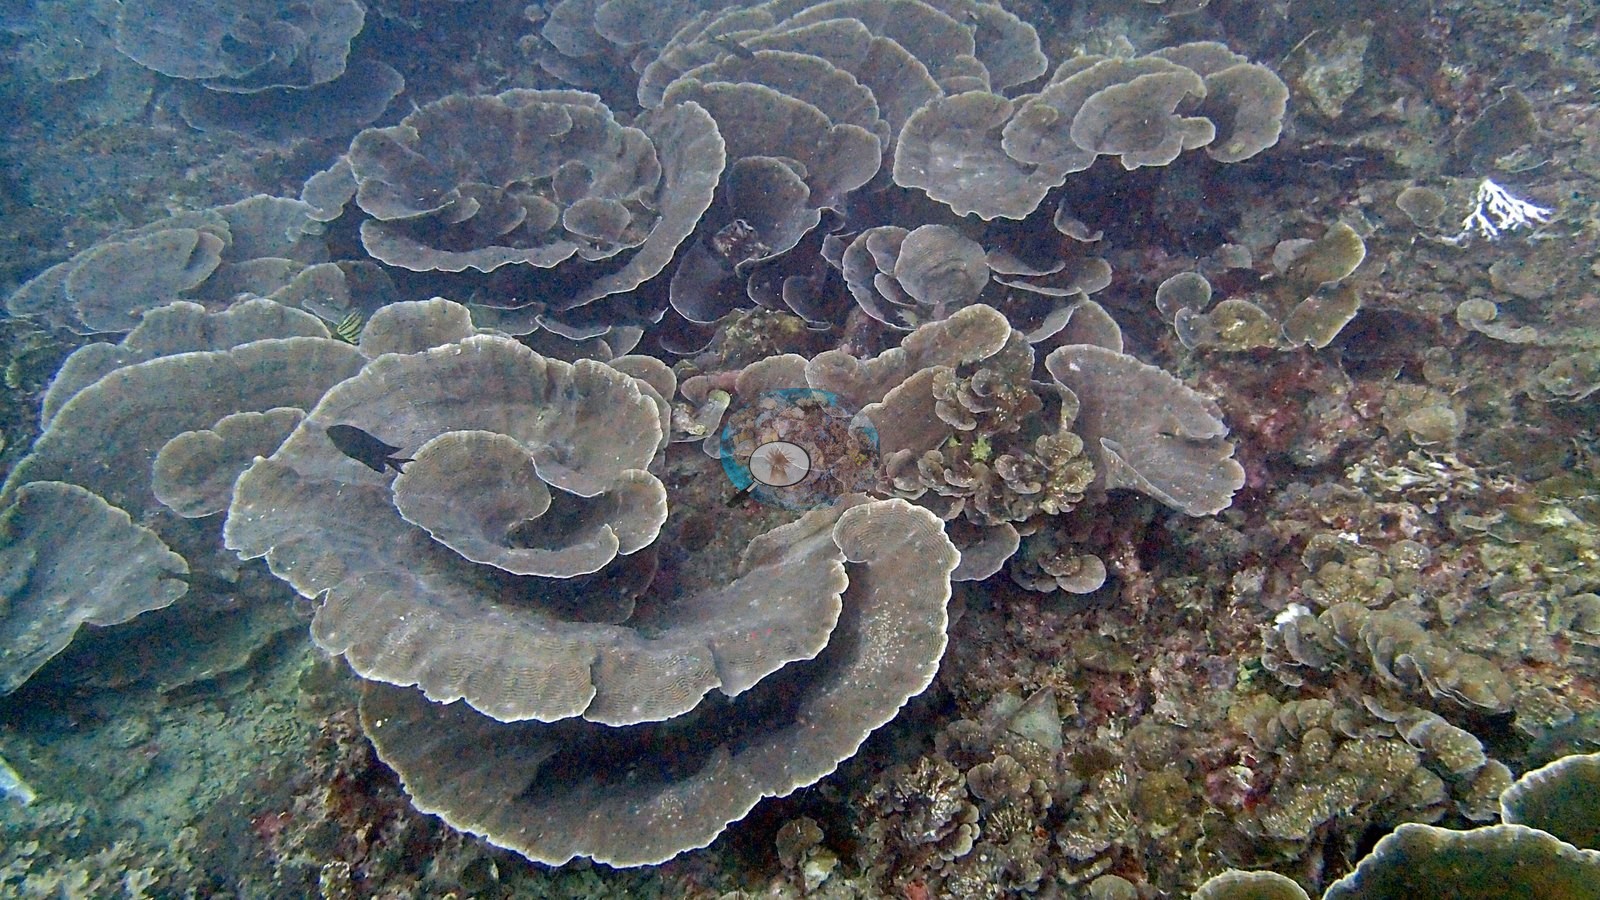
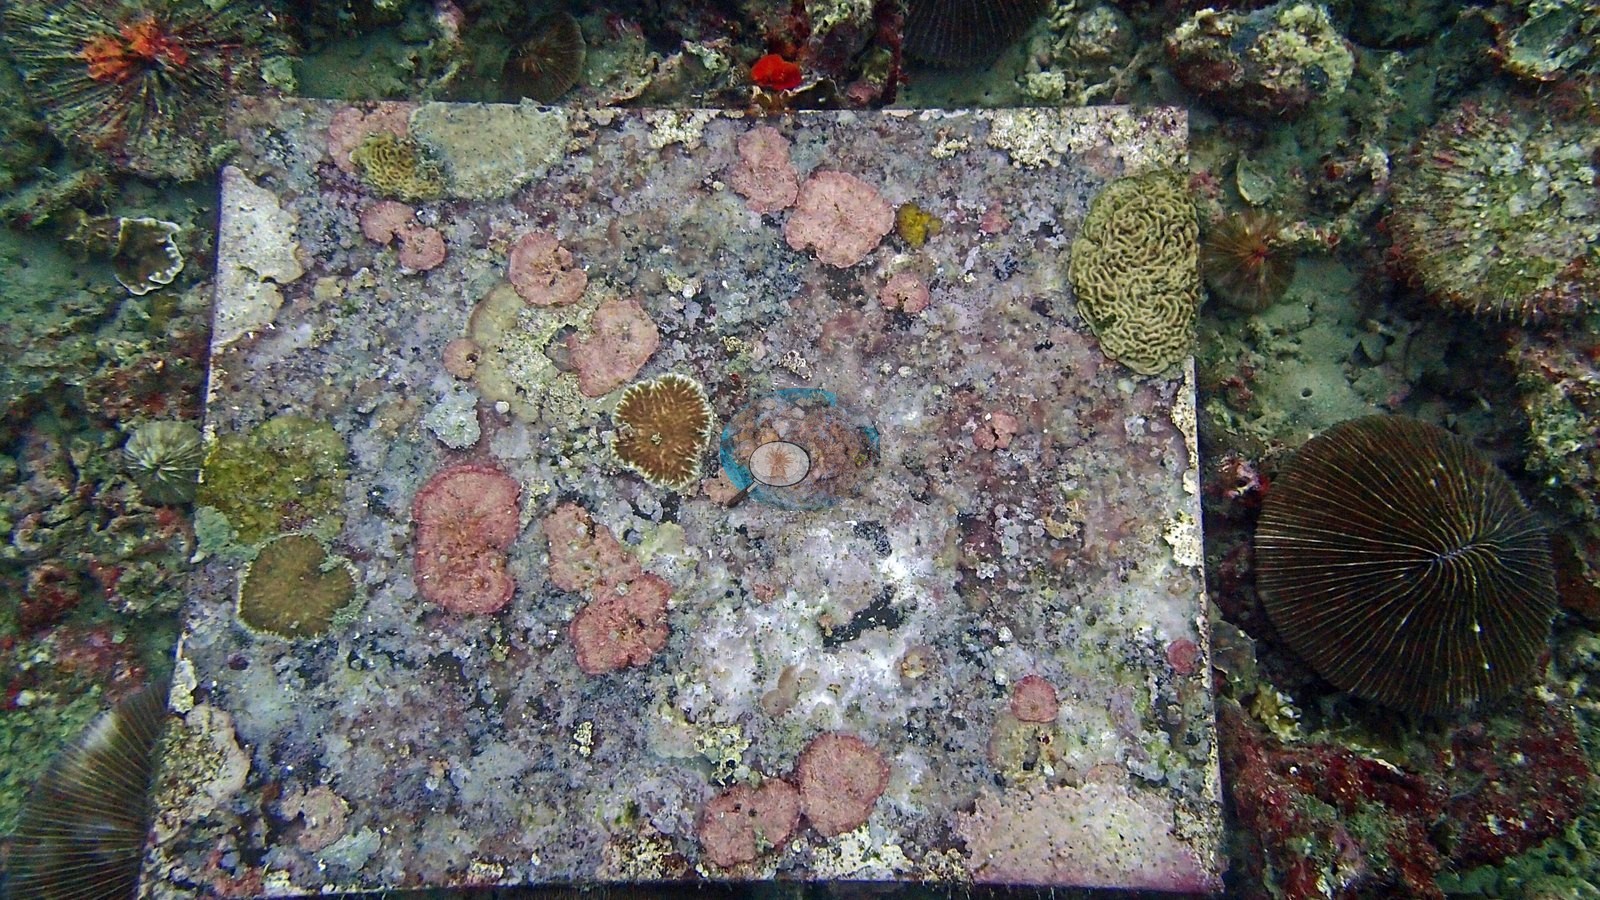
Anderson's own filenames set the depth structure - "Monte Carlo shallows", "view at 30 m", "30-40 m" - and the site is genuinely zoned, with a field of overlapping pale plating and foliose corals (Turbinaria, Echinopora lamellosa, and the Montipora group) forming near-continuous cover at roughly 30-40 m, a mid-slope of sunken objects, and shallows dominated by rubble and turf with only sparse recruits (e.g., Image 1, Image 2, Image 5, Image 6, Image 7, Image 25).
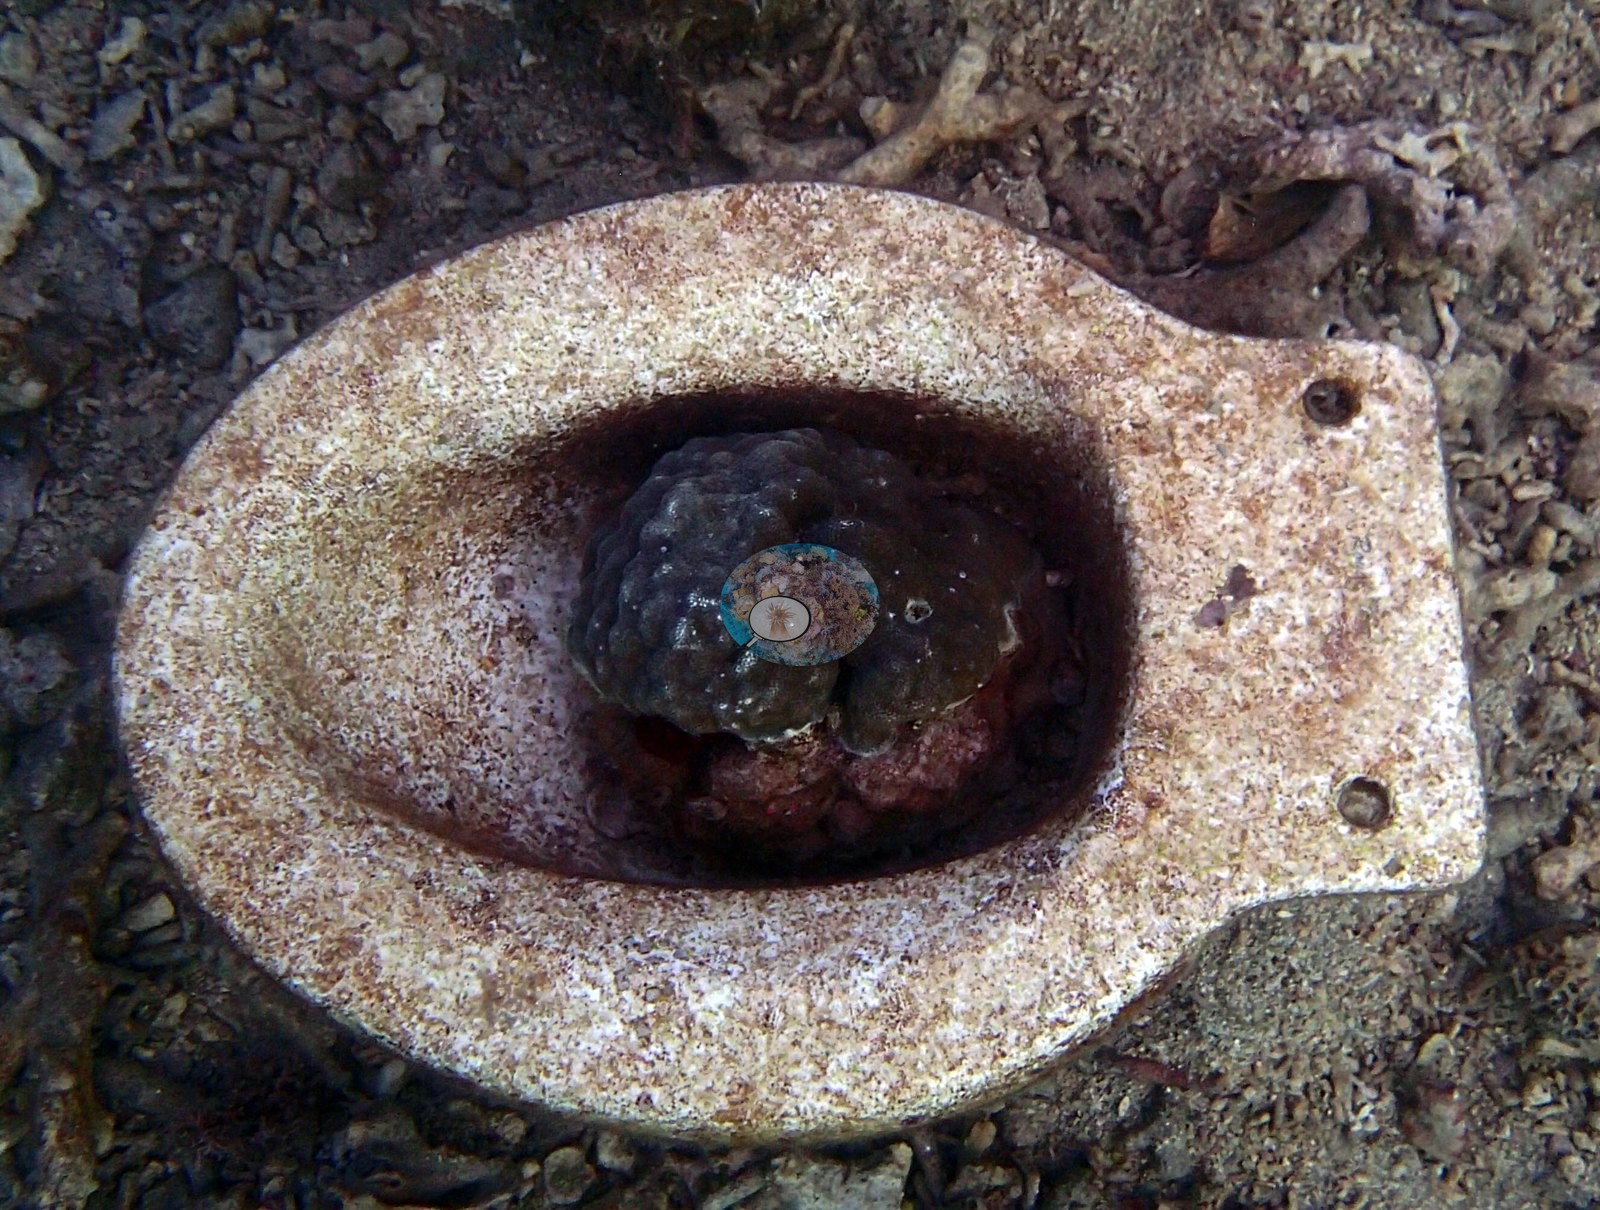
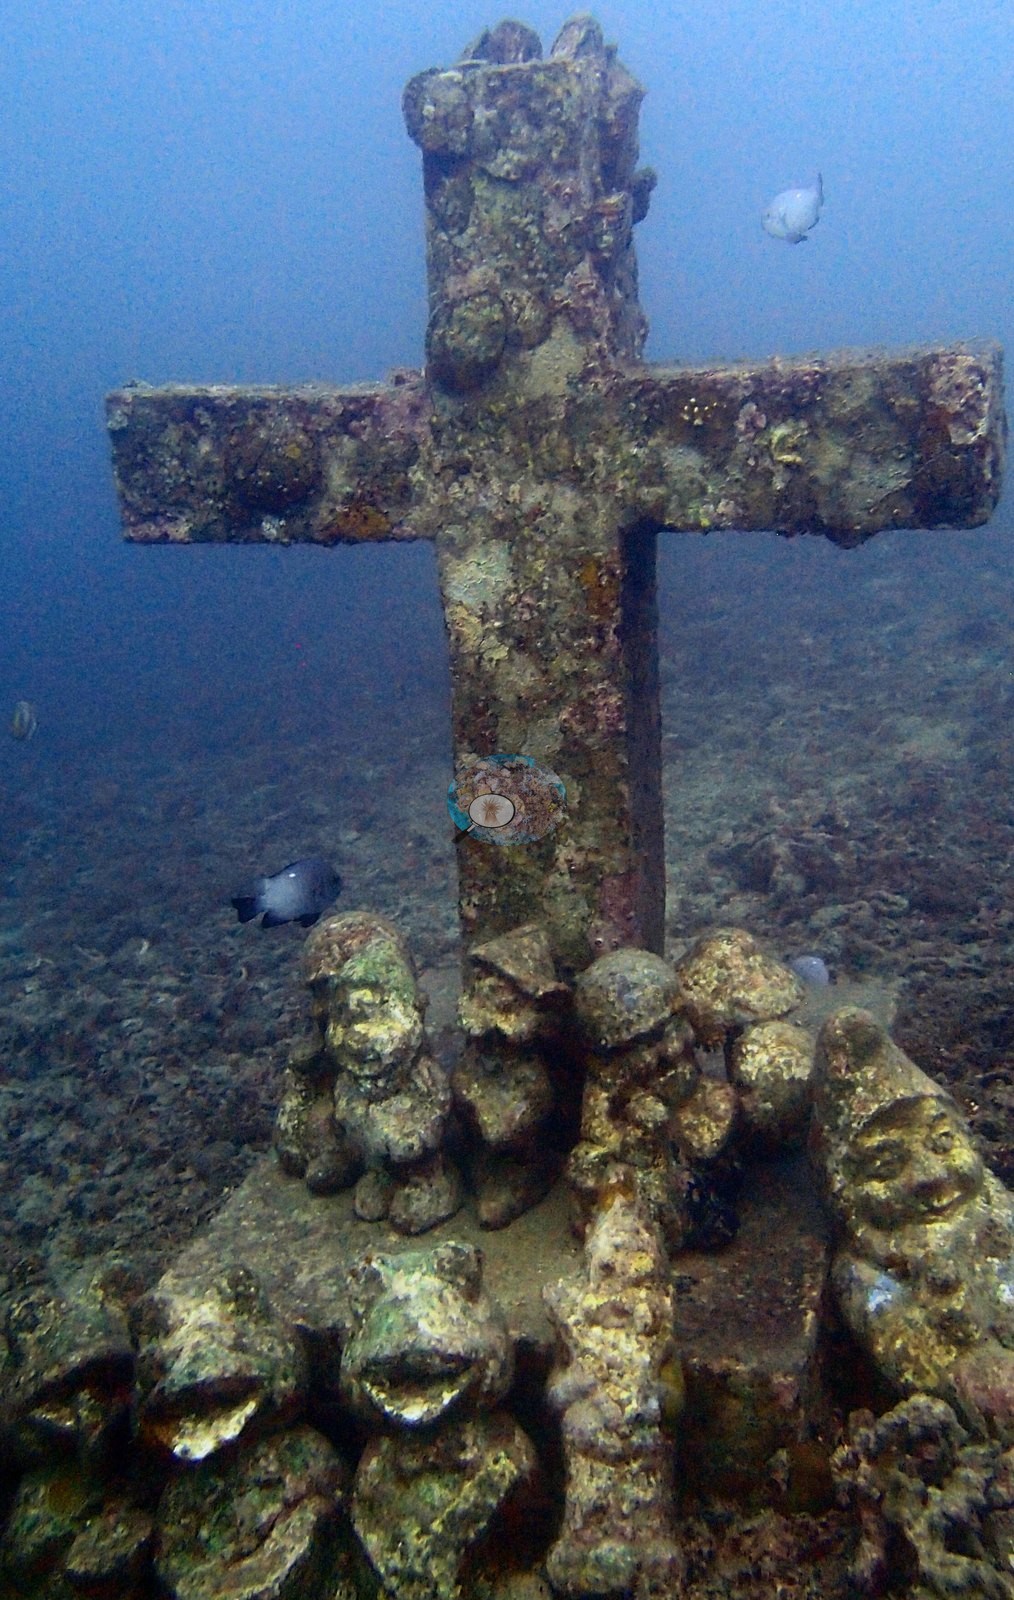
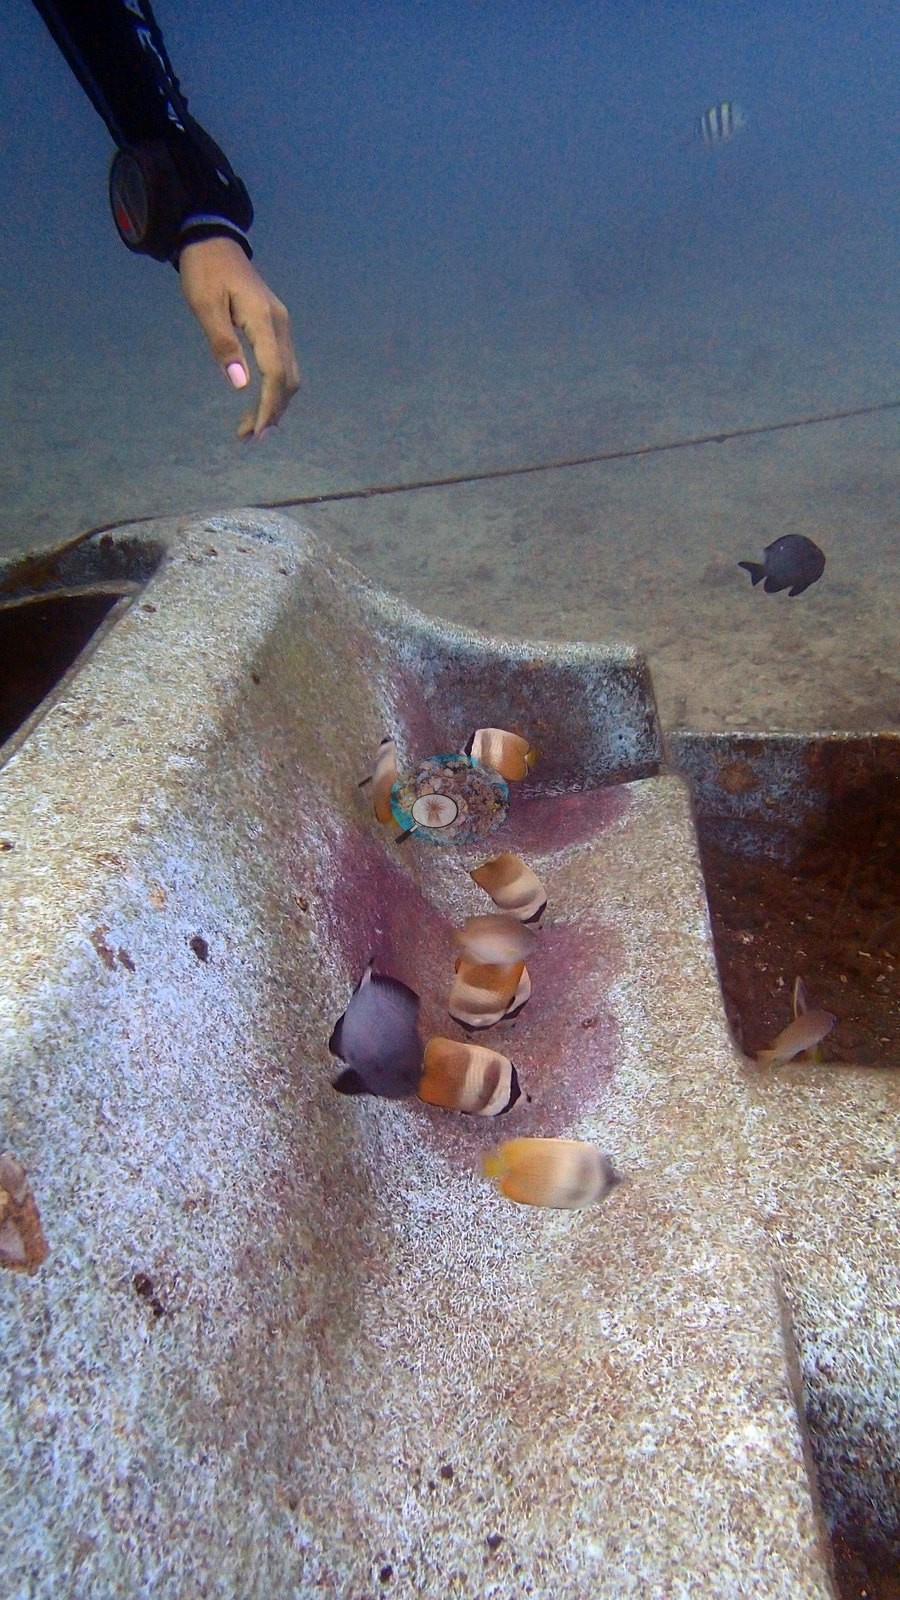
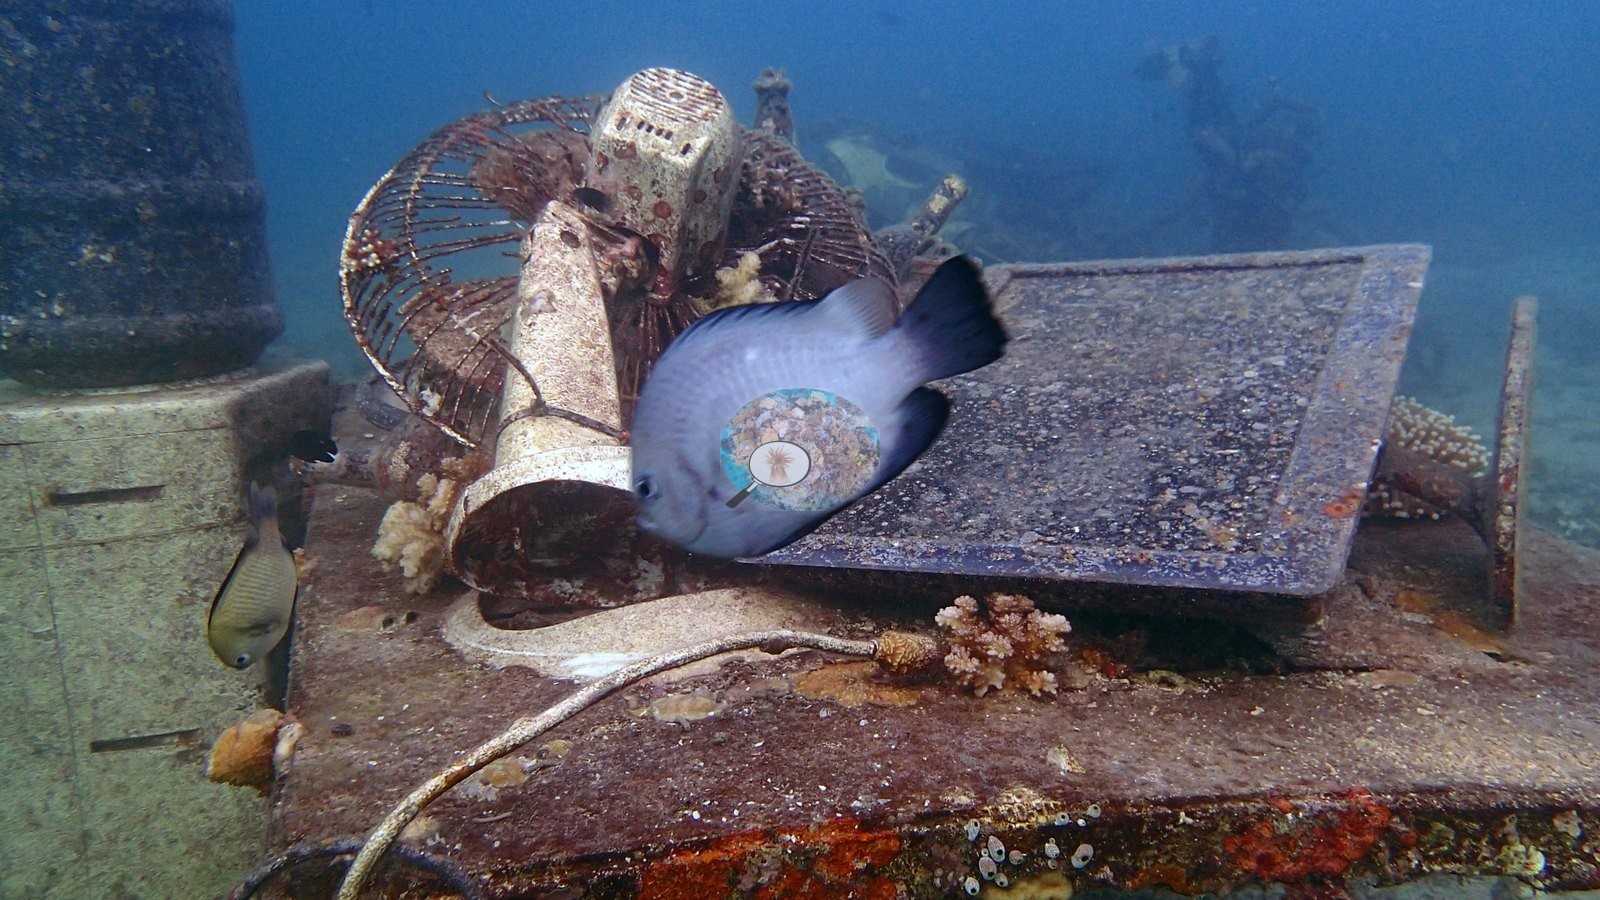
The artificial reef is the draw: an upright Volkswagen Beetle on sand, a mermaid statue, a large standing cross on a masonry base, and a deliberate tableau of household fixtures - bathtubs and sinks, a strongbox, a desk with a telephone, and toilets, one with a massive coral colony growing in the bowl (e.g., Image 13, Image 20, Image 21, Image 22, Image 23).
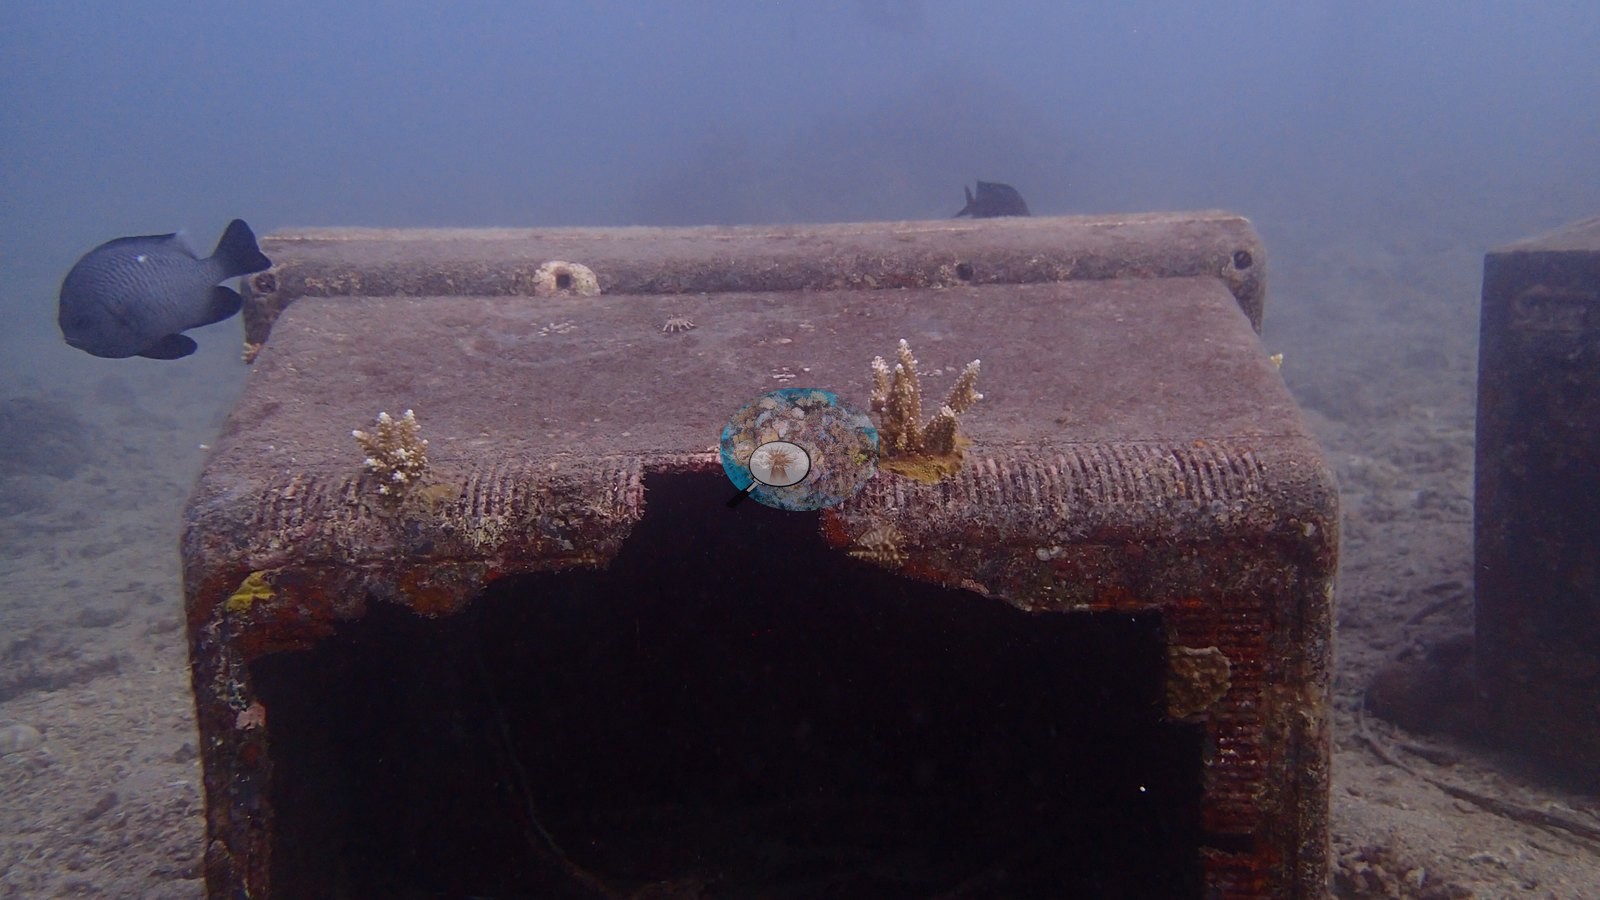
Deployed coral settlement tiles are also present, one carrying crustose coralline algae and small recruits, with Anderson pointing out a marked plate - a recruitment installation, not incidental debris (e.g., Image 8).
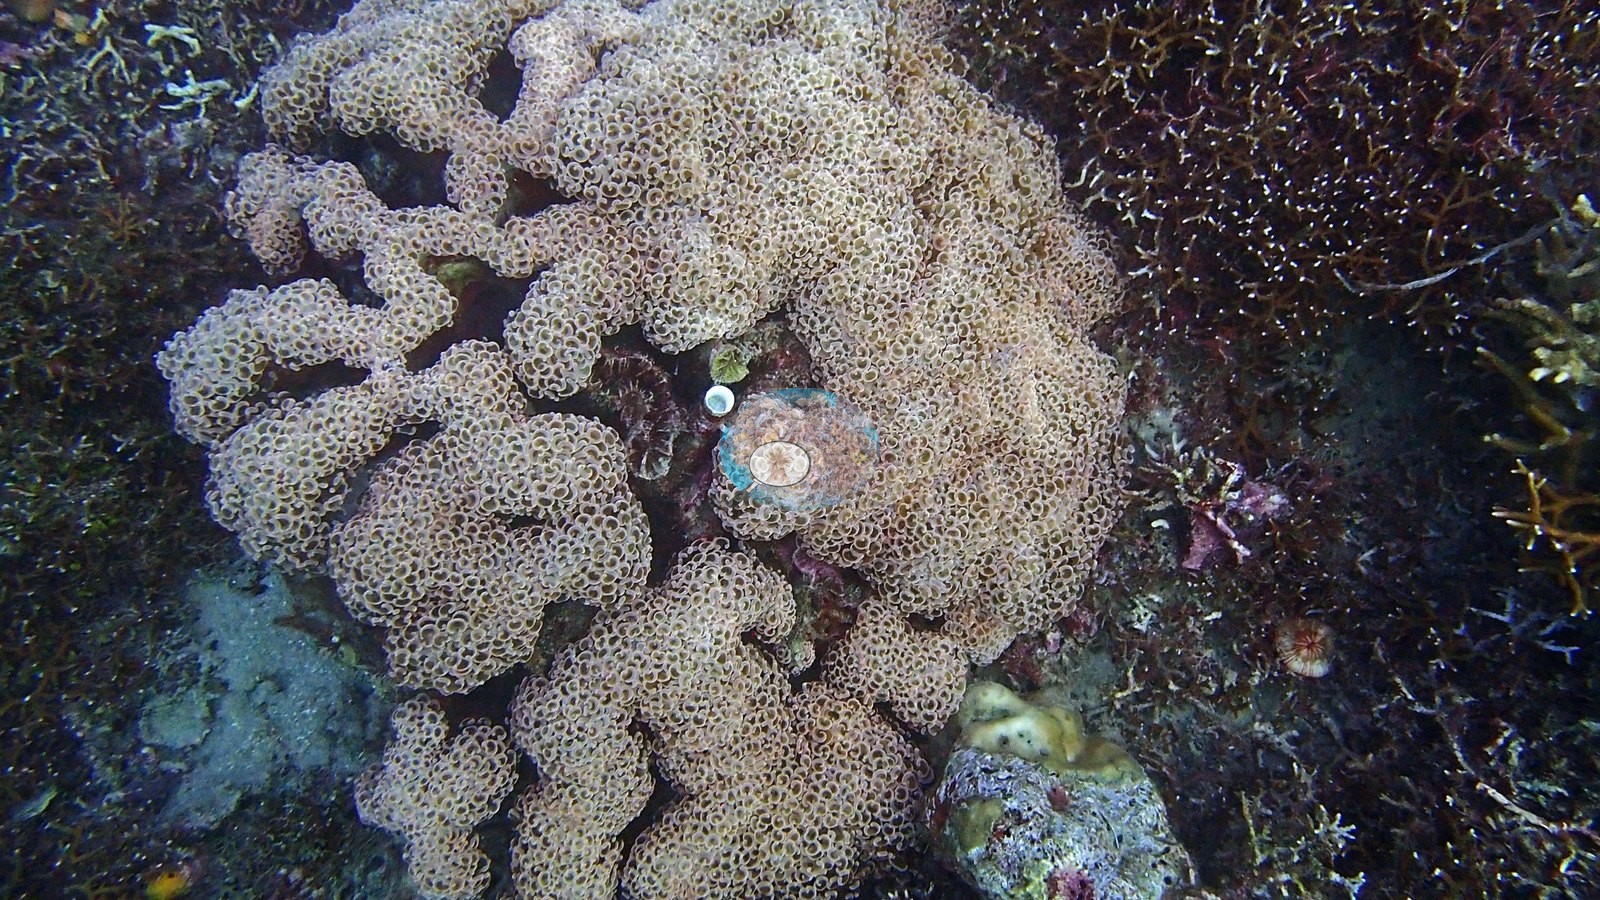
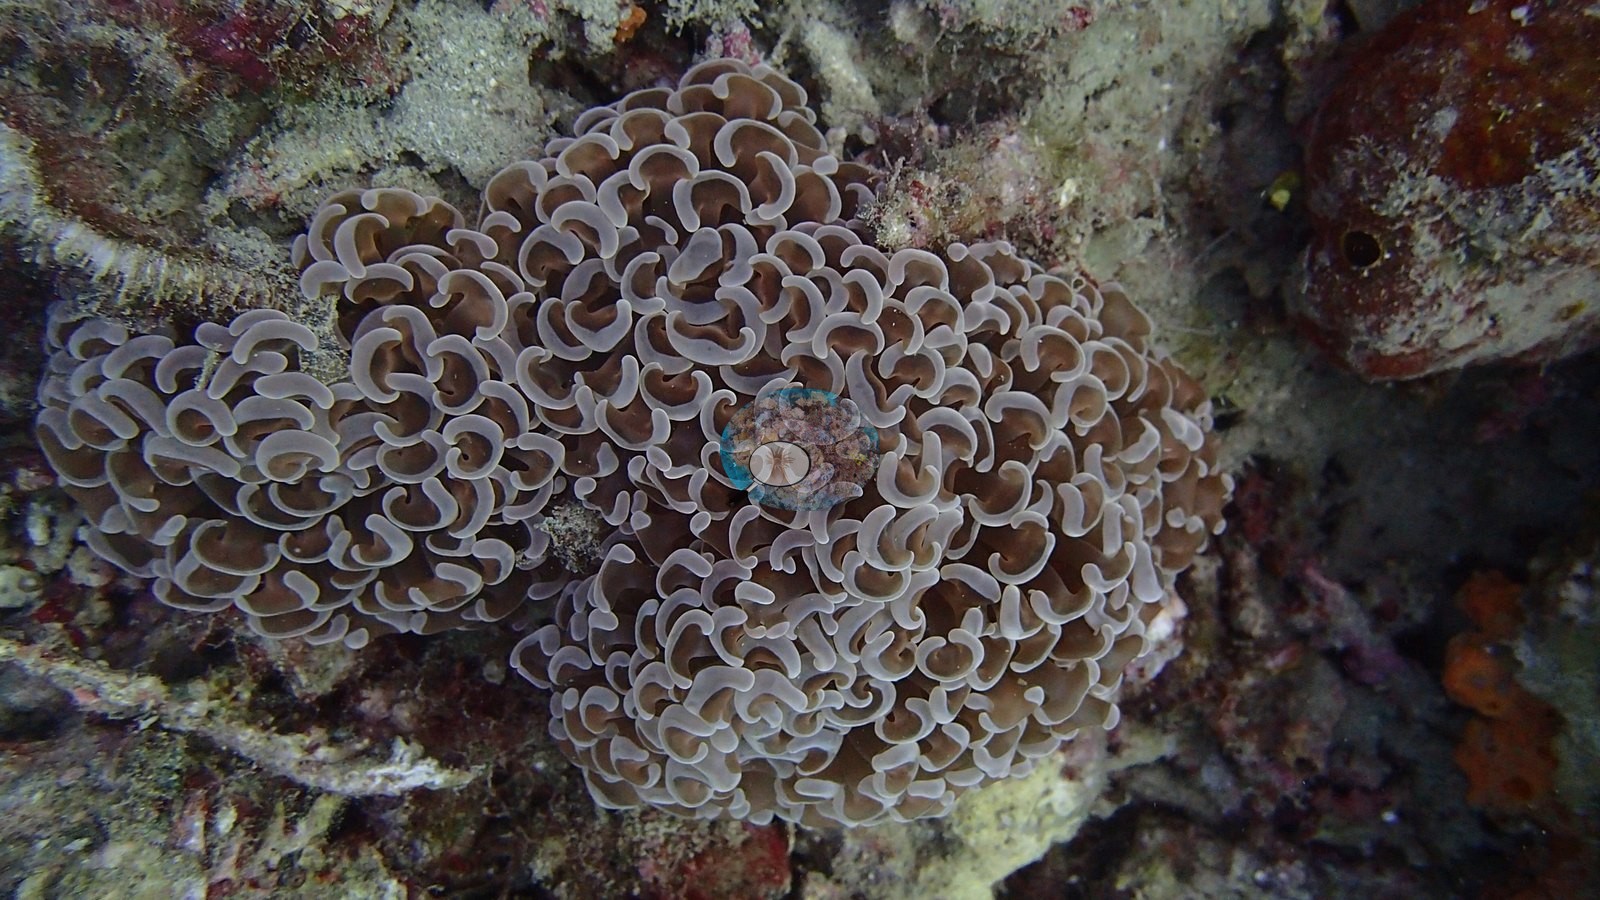
Large Euphyllia hammer-coral stands in cream and turquoise are the finest stony corals here (e.g., Image 18).
Coral cover
Cover comes from two computer vision methods, neither preferred. DINOv3 point classification gives 22.3% hard coral (95% CI 19.2-25.4) from all 82 frames and 1,640 points. CoralSCOP computer vision, its full run now finished, gives 22.0% across all 82 frames (median=18.3%, bootstrap 95% CI 18.2-26.0), against the 21.8% from the 20-frame subset the map's 22.1% was built on. The published spread is 0.6 points and the completed run closes it to 0.3 - the closest agreement of the seven sites, and the most misleading. The two models correlate at only r = 0.23 across these frames, the weakest of the set, and they reverse on exactly the frames that matter: on the two deep plating-field images DINOv3 reads 44.4% and 43.6% hard coral while CoralSCOP reads 8.2% and 13.9%, because instance segmentation cannot separate overlapping foliose plates and returned only seven masks for the 30-40 m frame. A single site figure here averages two very different habitats and hides that reversal. The two models fail differently. CoralSCOP computer vision reads high on low-cover reefs - a median=1.68x a co-located Reef Check diver survey, 4.6x at worst - yet under-reads dense plating fields. DINOv3 is strong in-domain (6-class macro-F1 0.62, hard coral recall 0.82) but collapses off-domain: cross-domain point accuracy 0.17-0.25, ceiling near 35-50%. Coral cover: 22% — photo-derived, and the two methods broadly agree (22% vs 22%). Two independent computer vision passes over all 82 of Anderson's frames from this dive give a DINOv3 calibrated point classifier reading of 22.3% (95% CI 19–26%, block bootstrap) and a CoralSCOP computer vision of 22.0%, a spread of 0.3 percentage points. The map publishes their mean so sites can be ranked against one another, but the 22–22% range is the honest statement of what is known here: the two products have different denominators and should not be collapsed into one measurement. He continues to test alternative CV models for this task and will rerun the CoralSCOP and DINOv3 number here if a more reliable option turns up.
Stressors
No crown-of-thorns starfish (COTS) or other corallivores evident.
Fish and other fauna
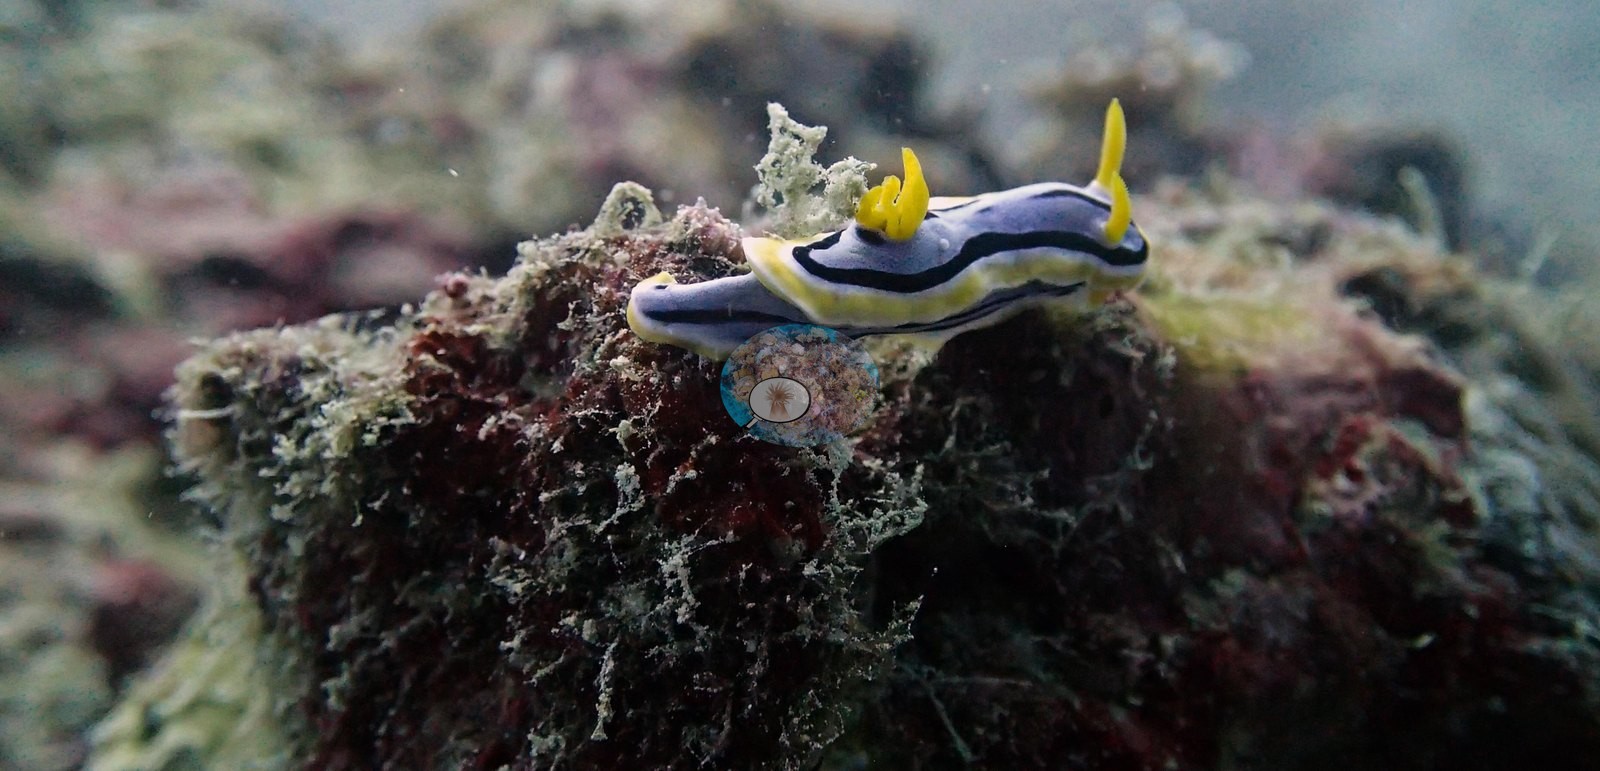
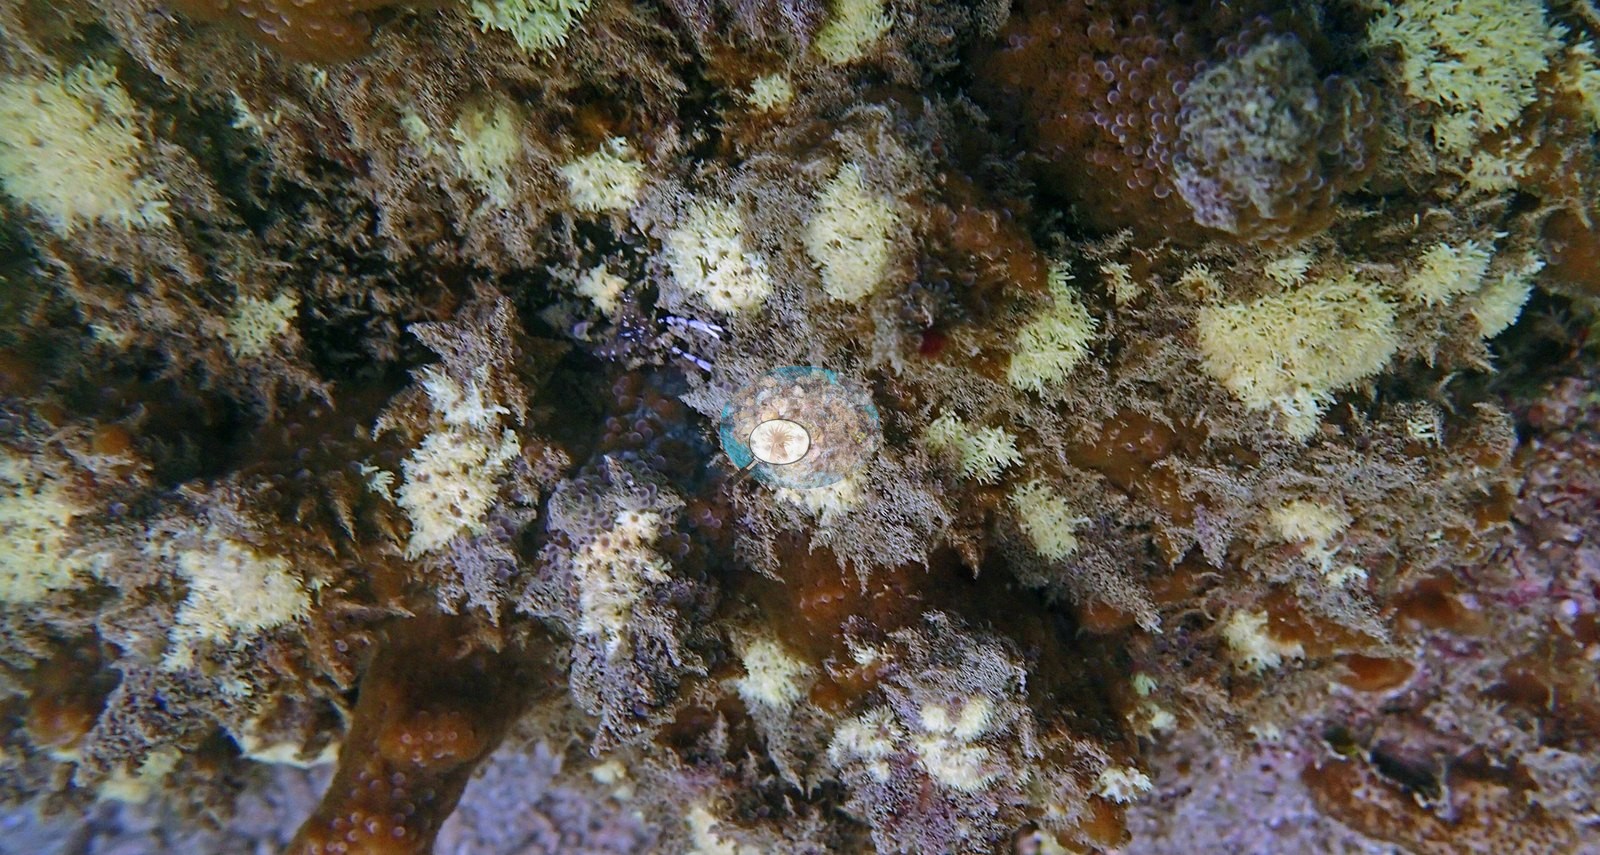
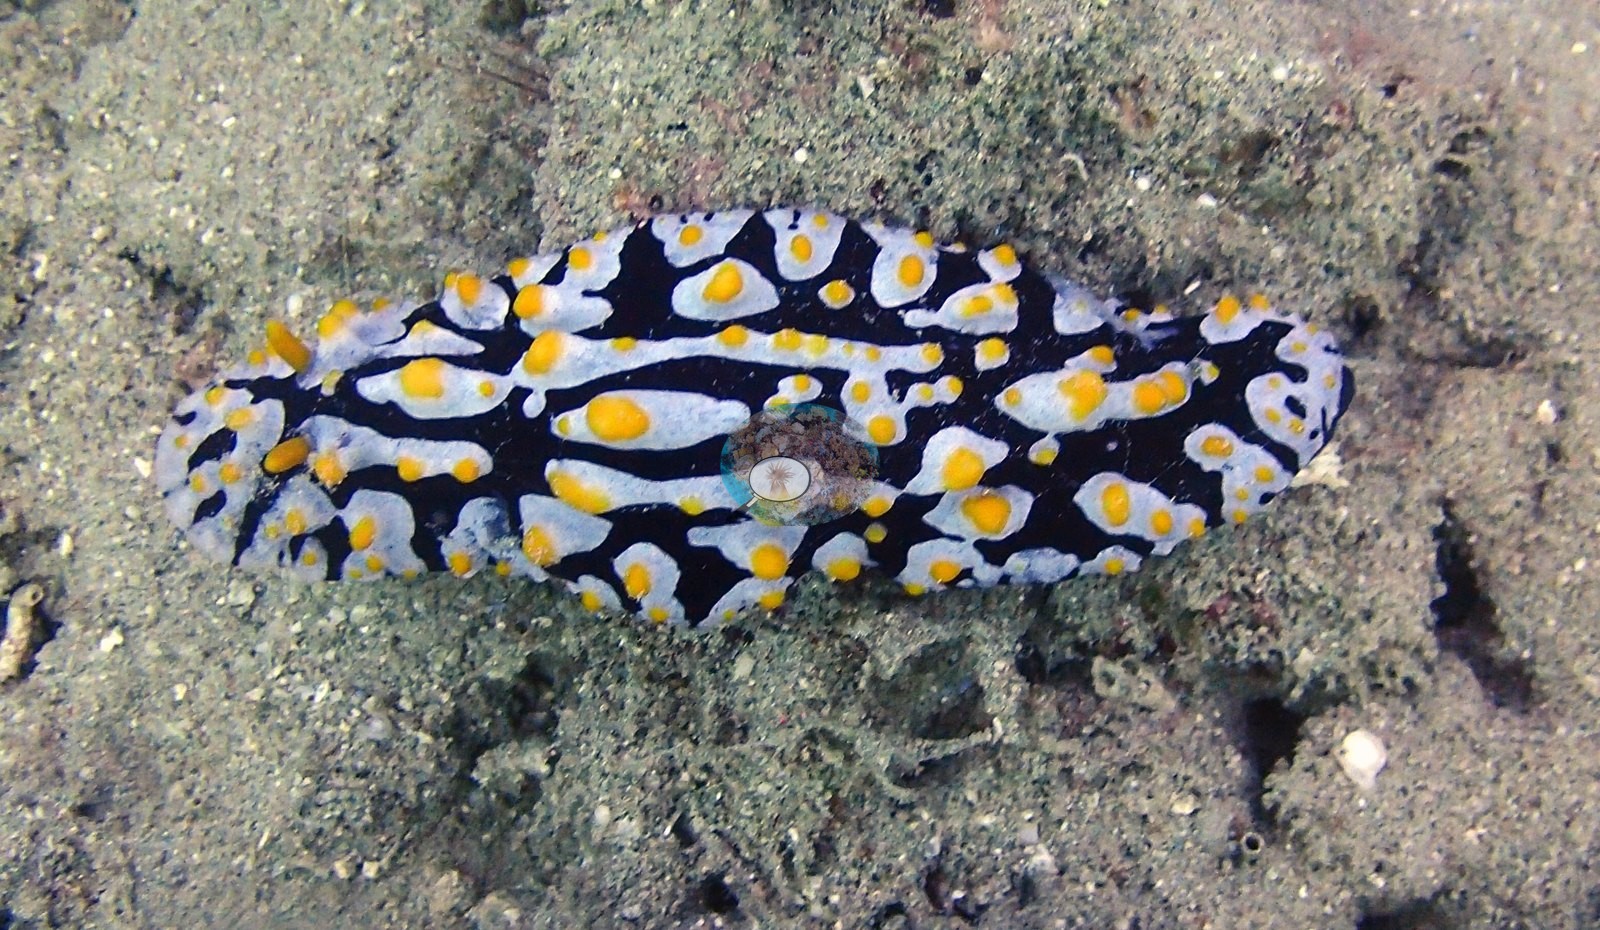
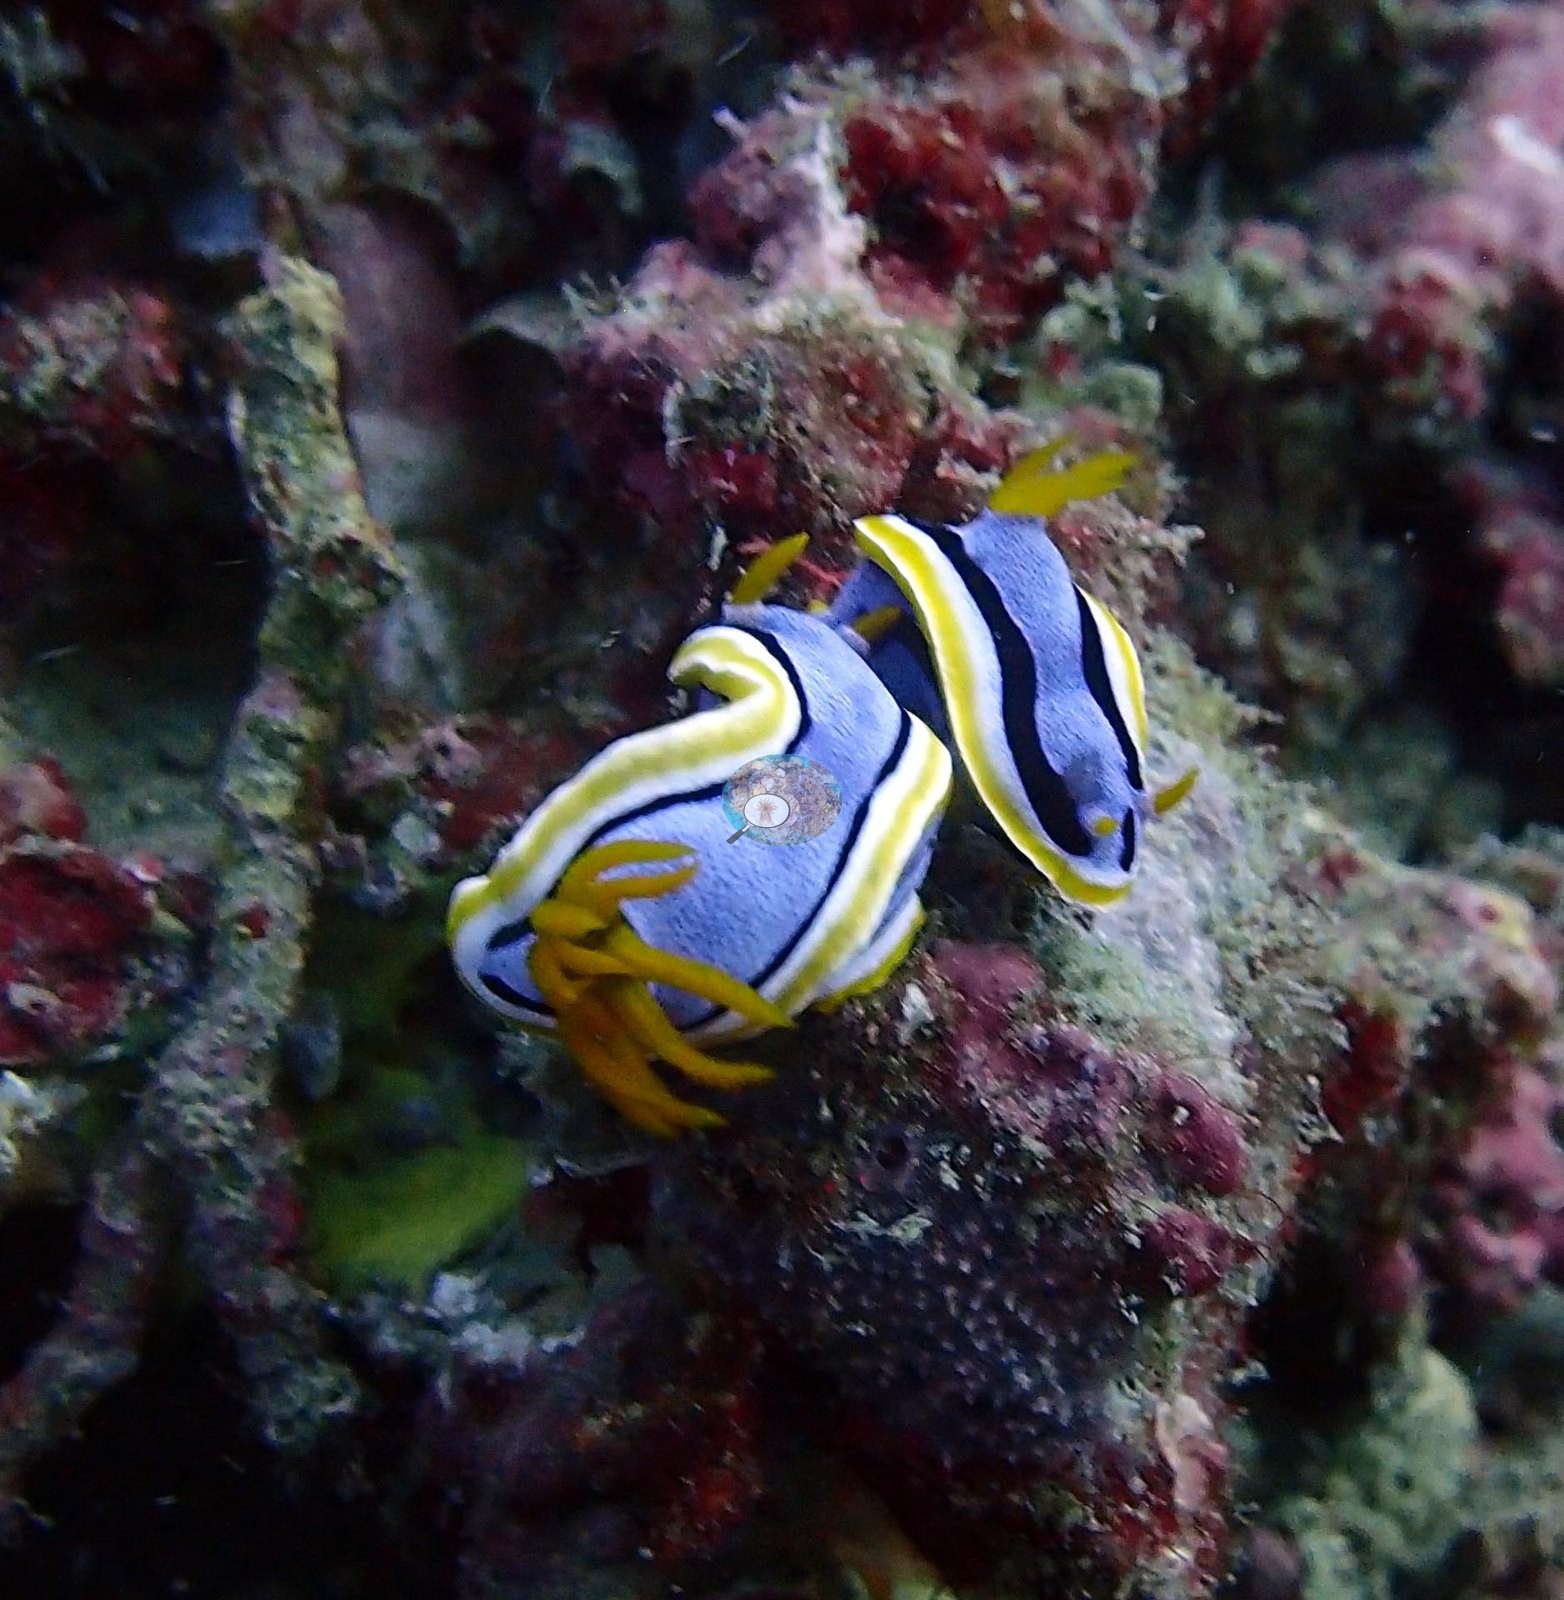
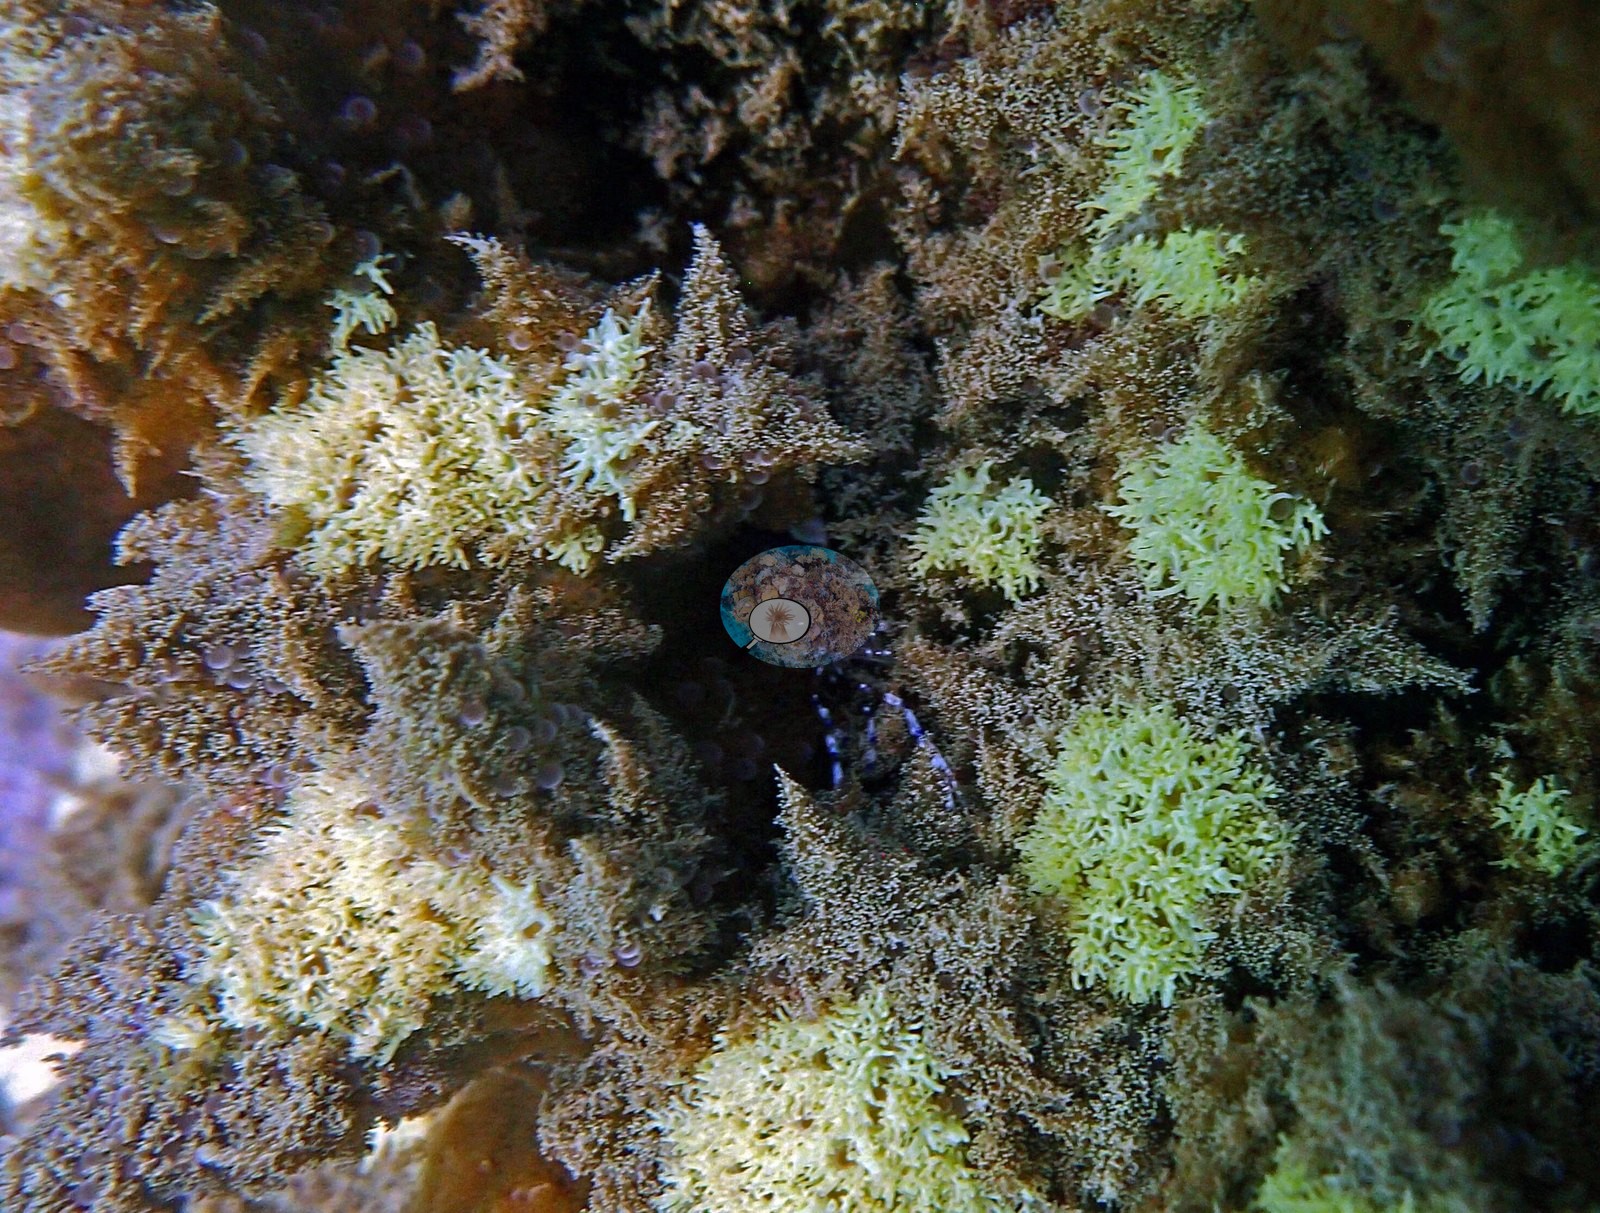
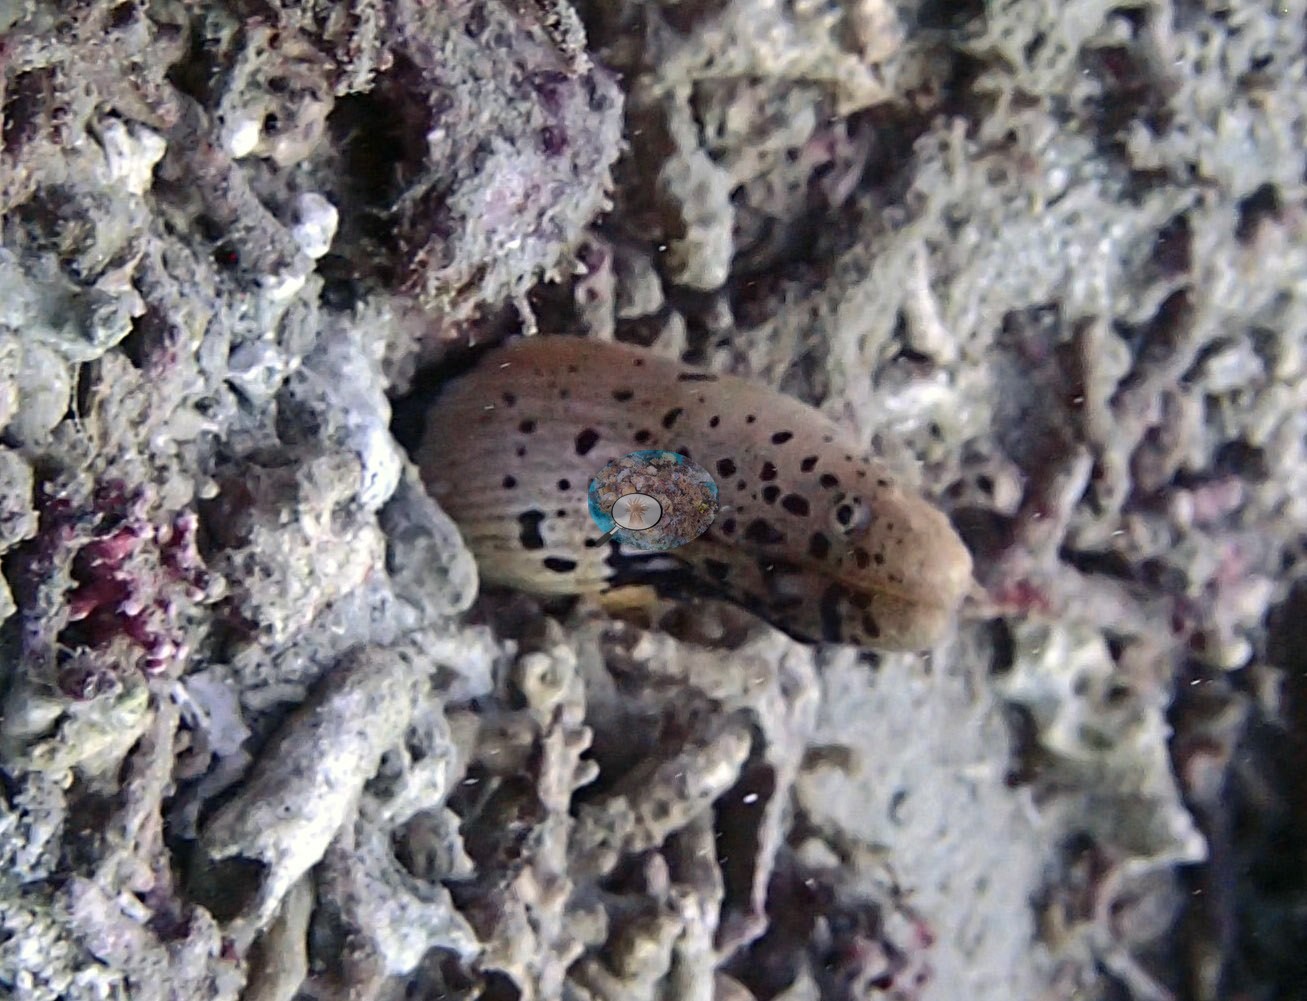
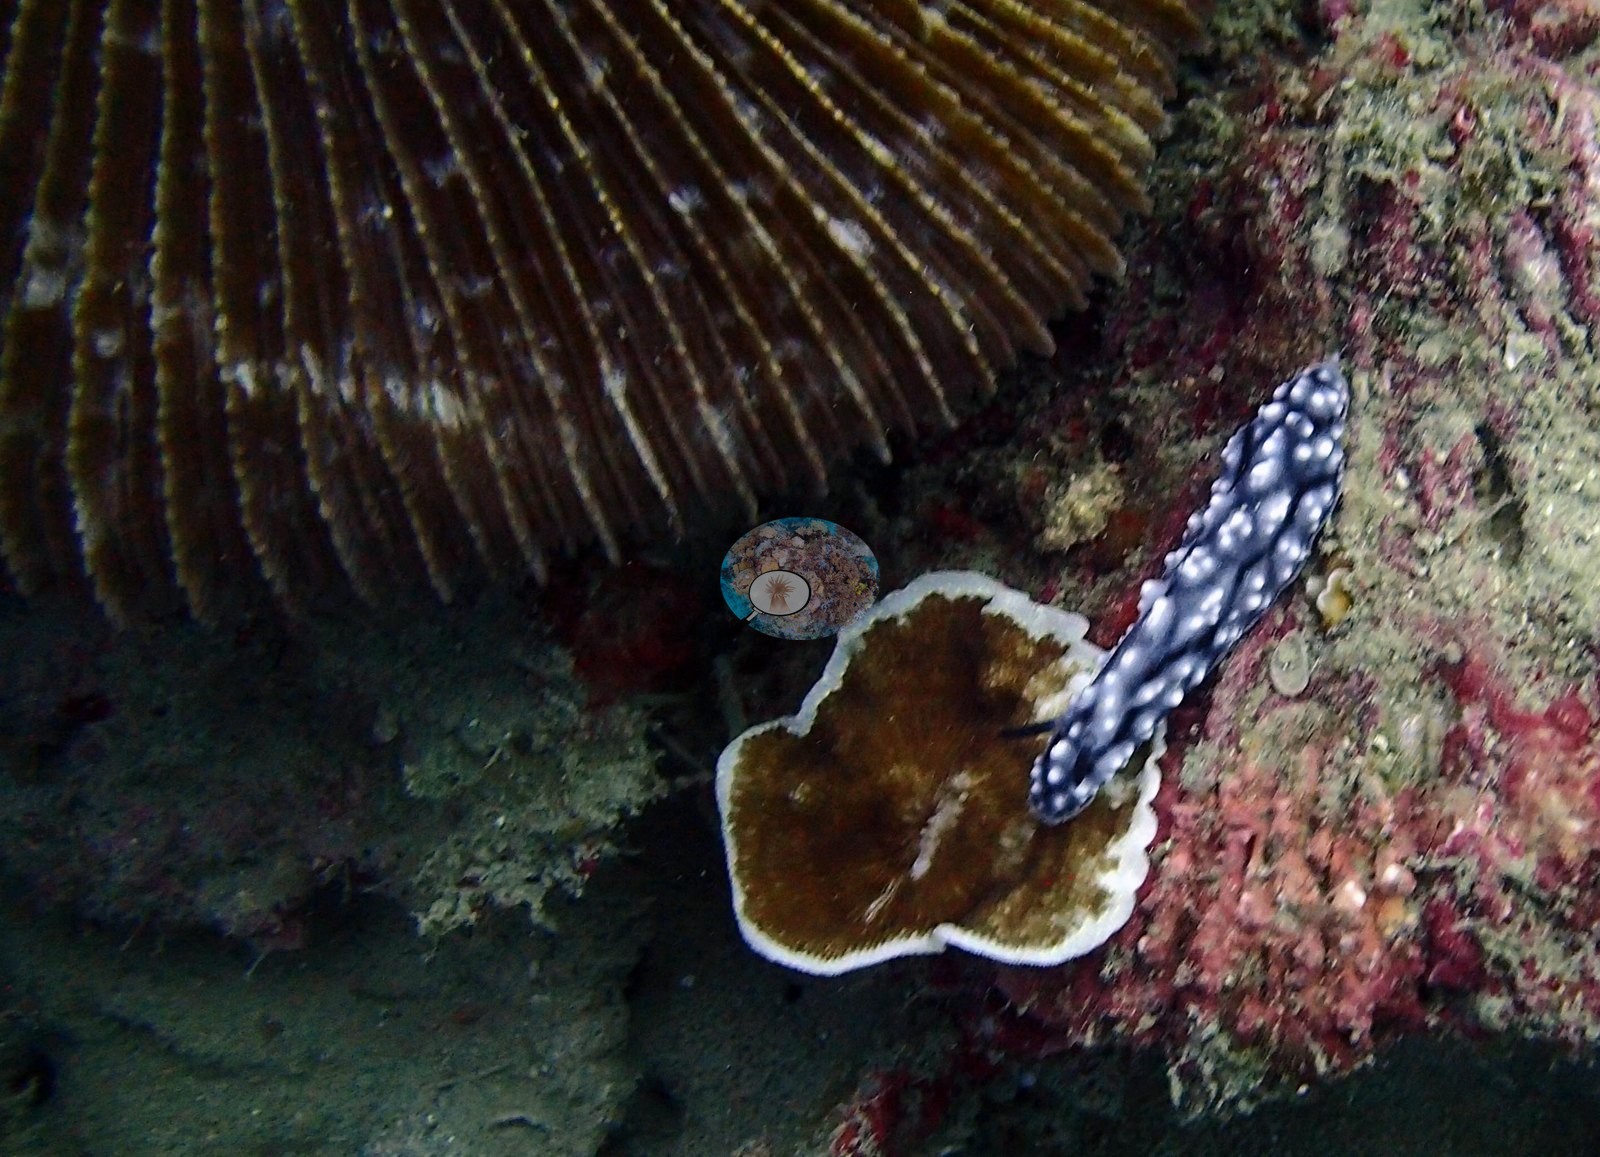
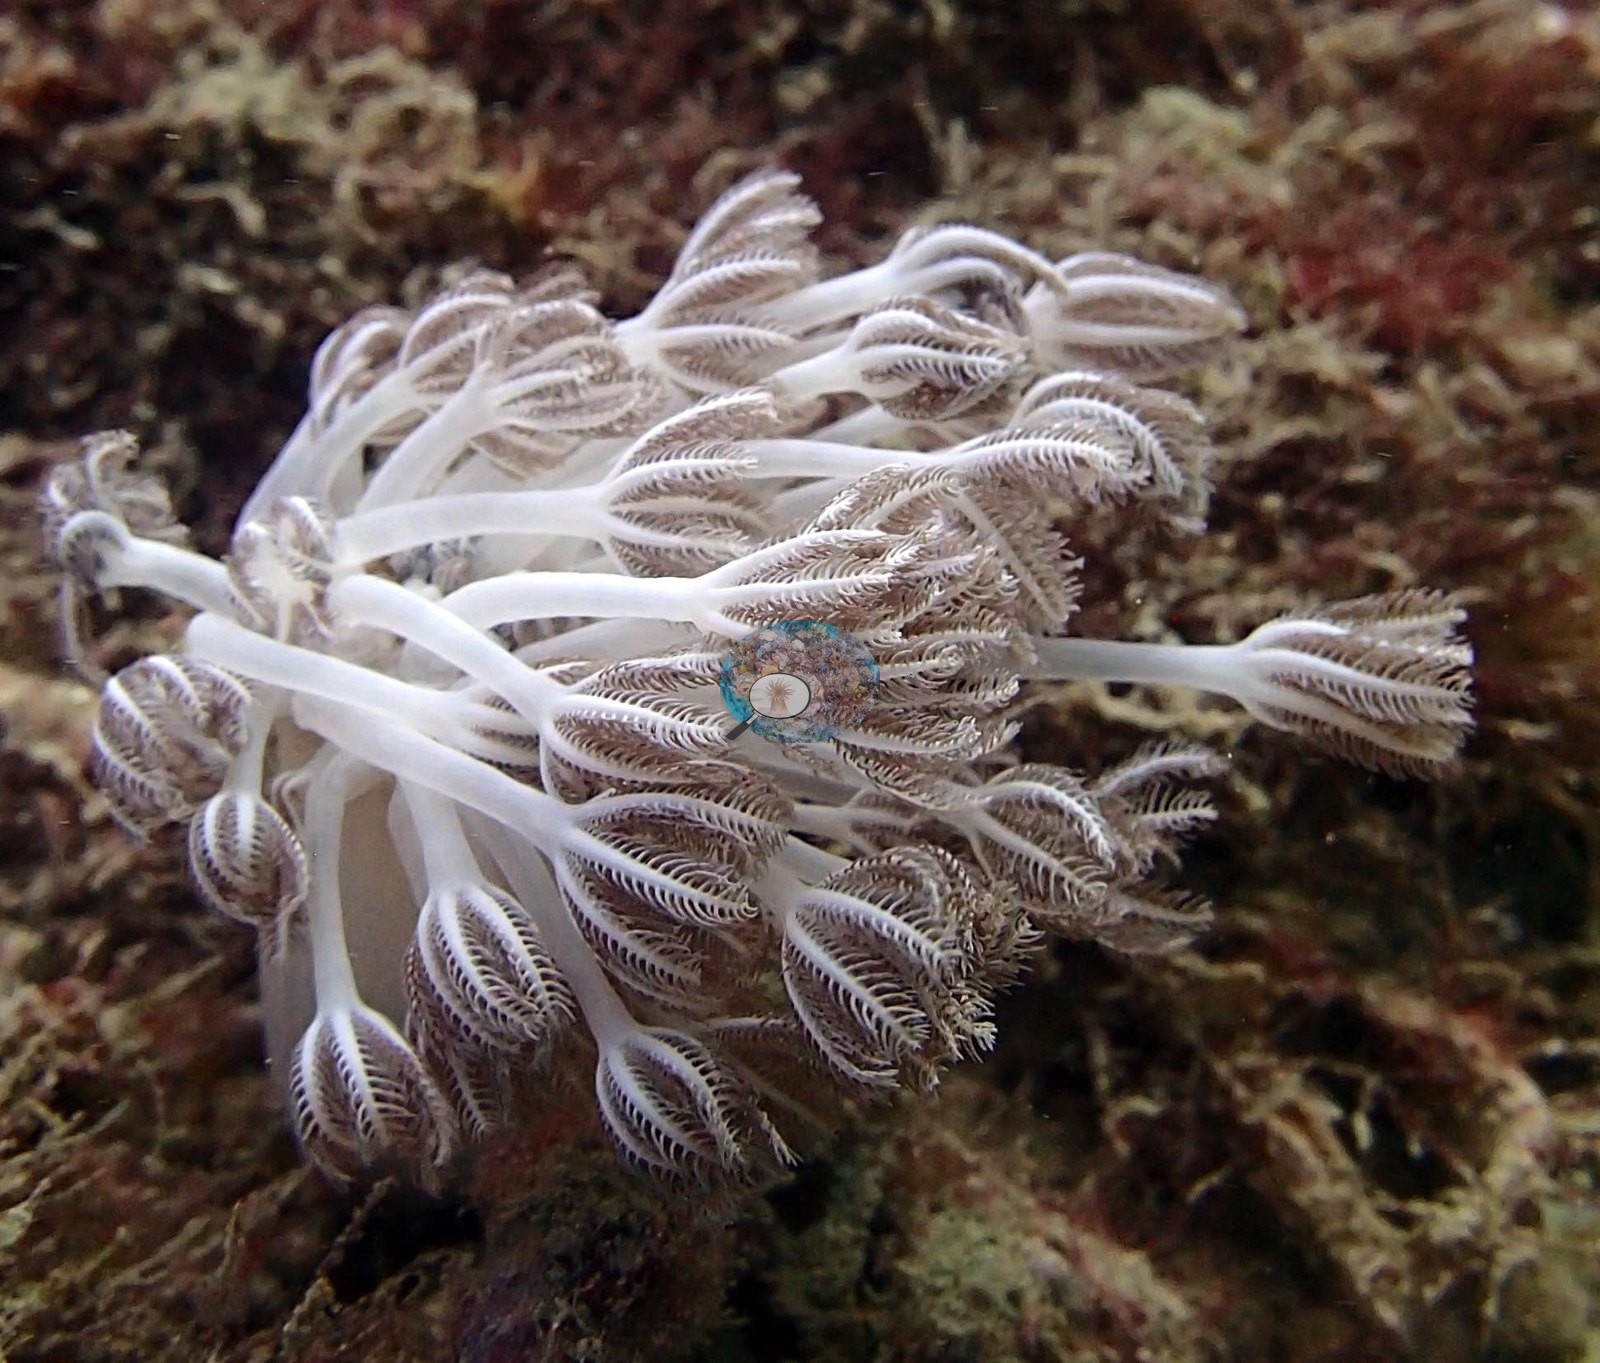
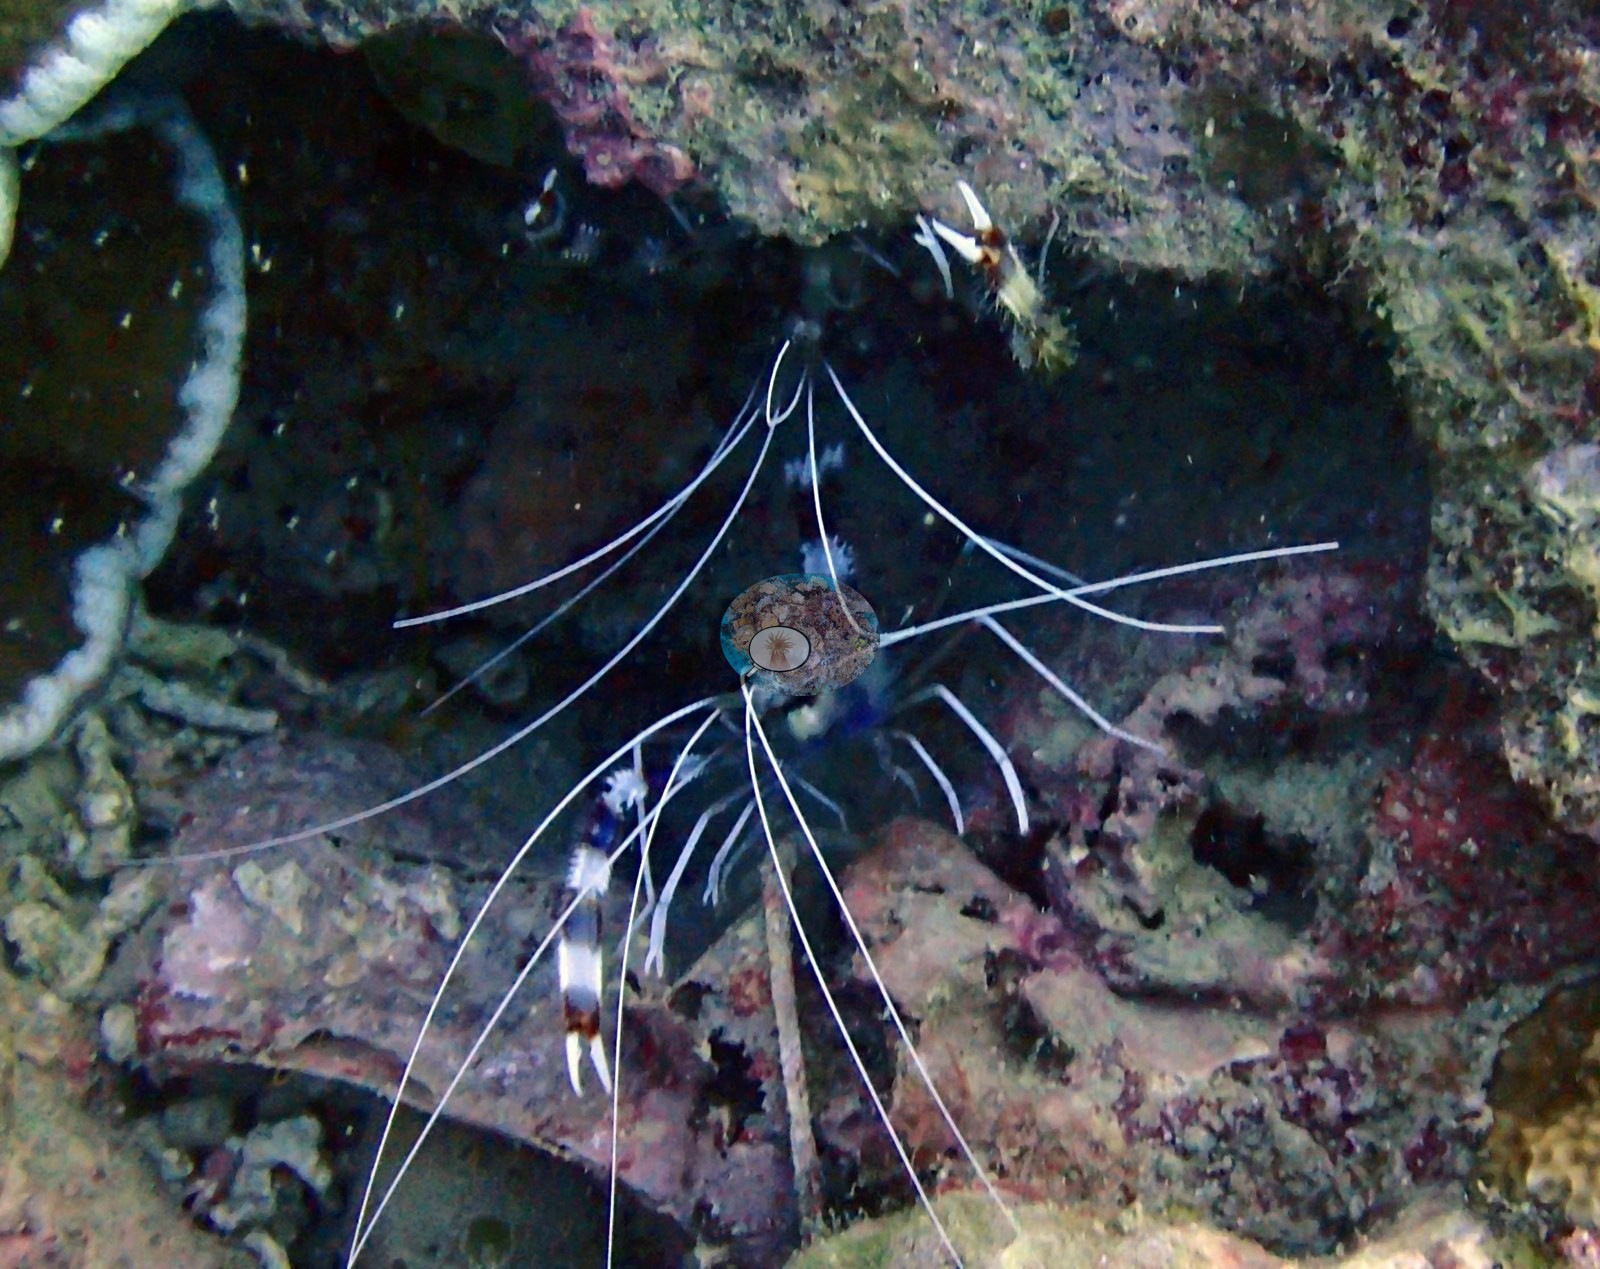
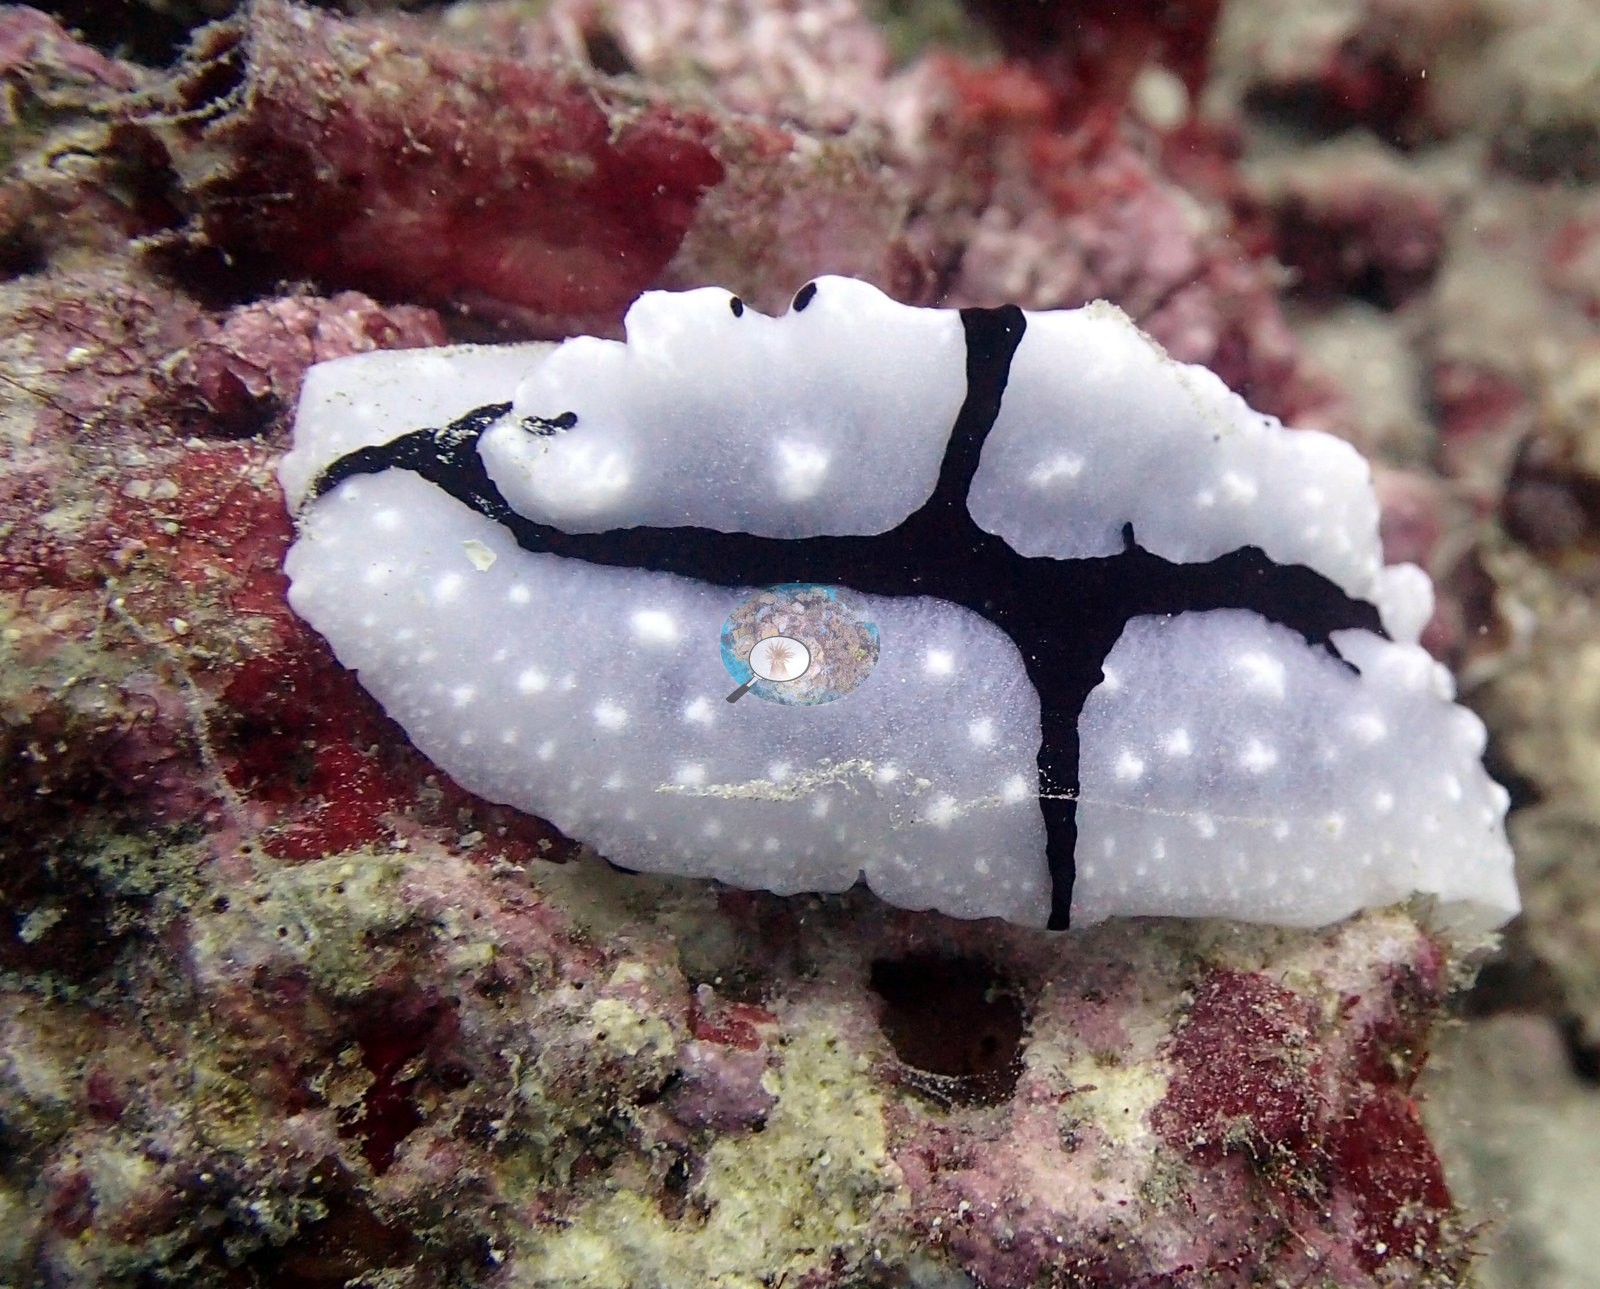
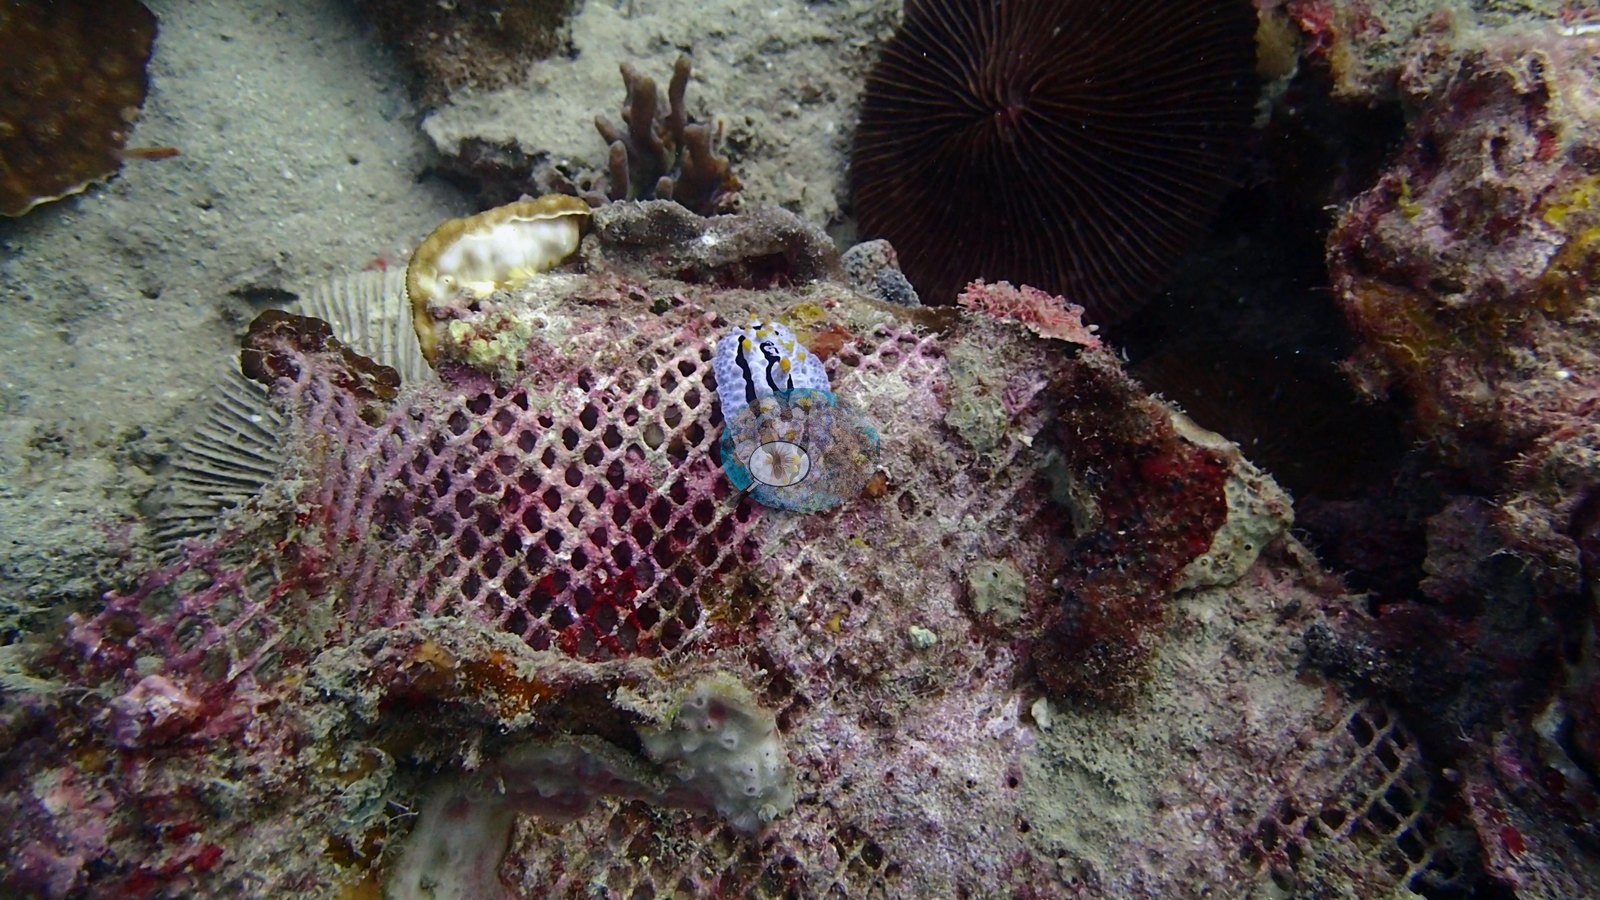
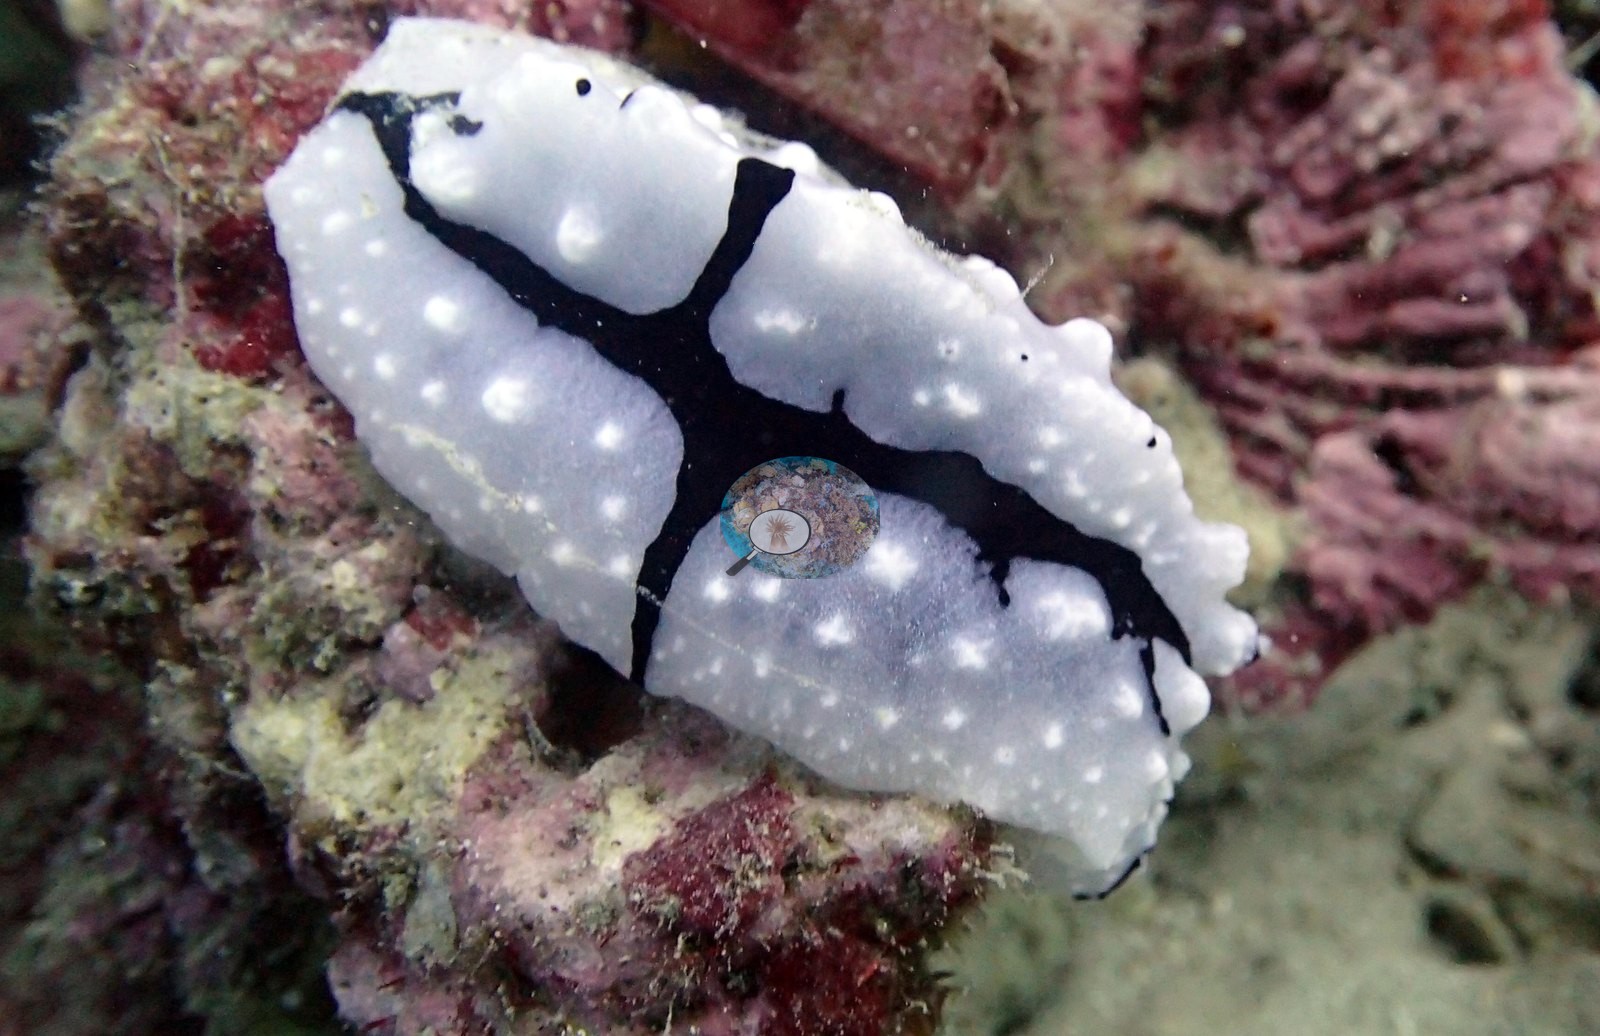
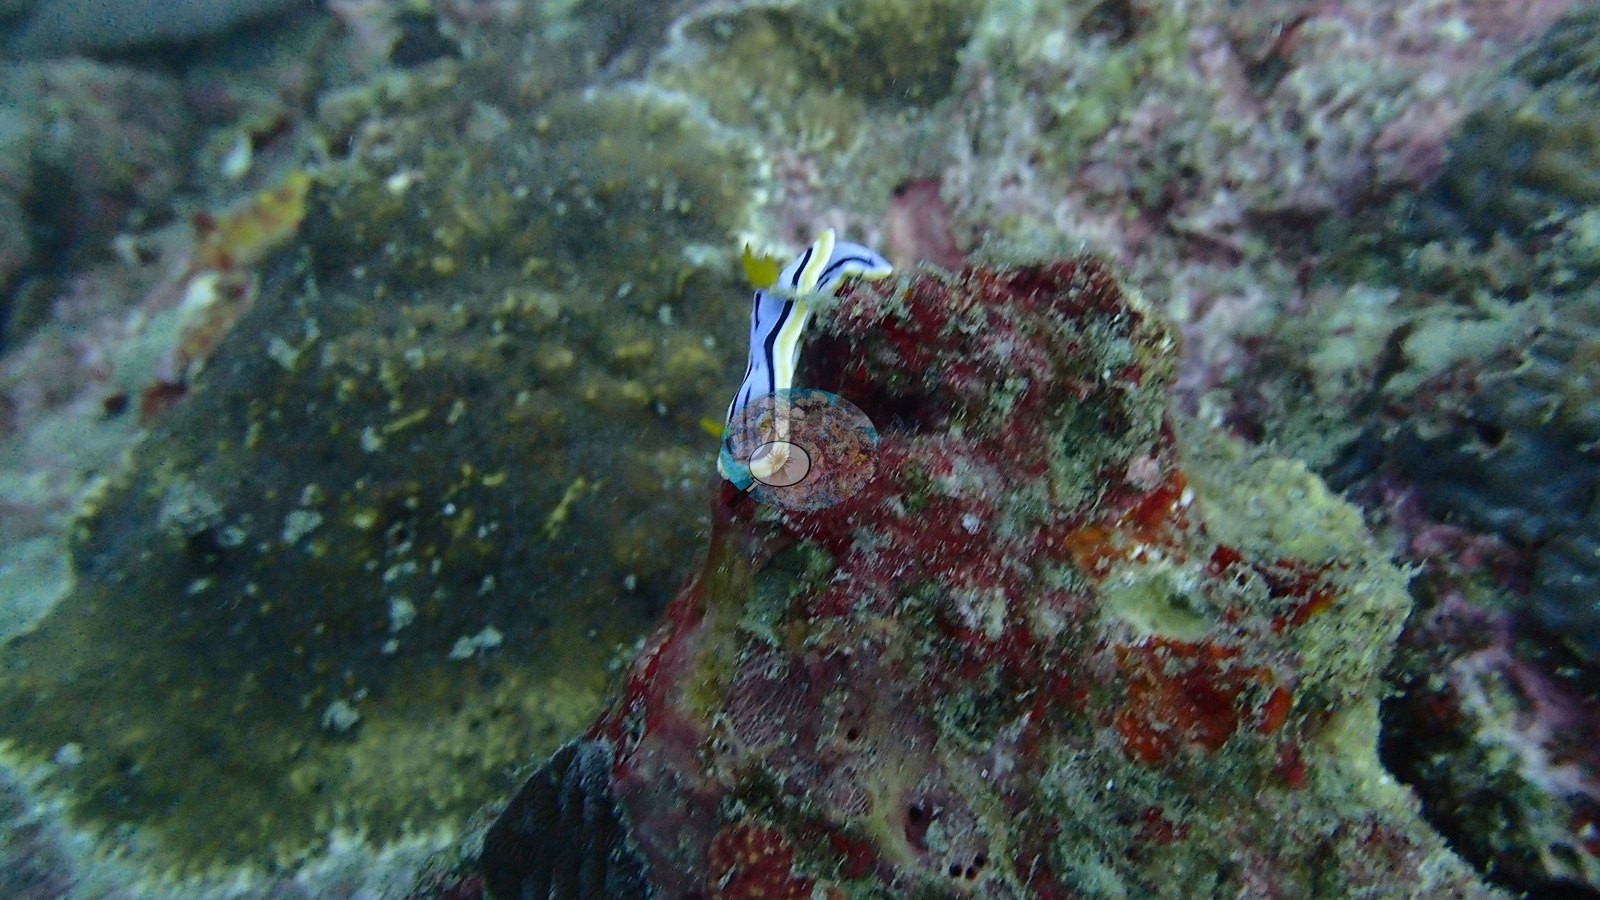
Damselfish and anemonefish have colonized all of it. The macrofauna is the most abundant and the most genus-rich of the Philippine archive: Phyllidia and Phyllidiella nudibranchs, several blue Chromodoris including an apparent mating pair, a tiger cowrie, cleaner shrimp in the crevices, and a granulated sea star (Choriaster) (e.g., Image 9, Image 10, Image 11, Image 12, Image 16, Image 17).
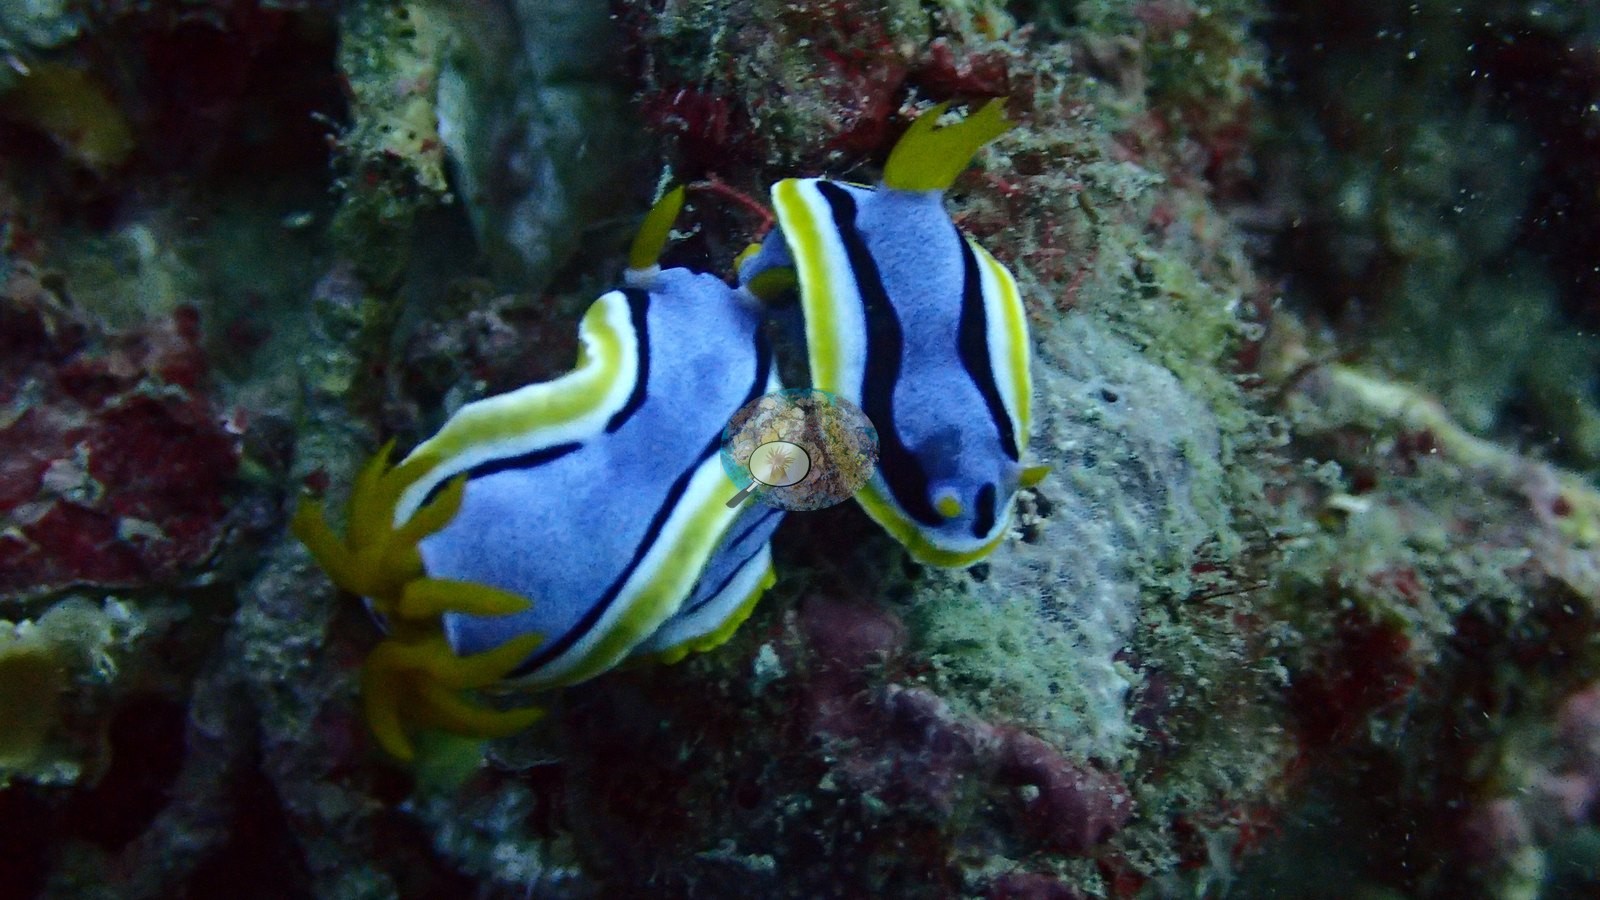
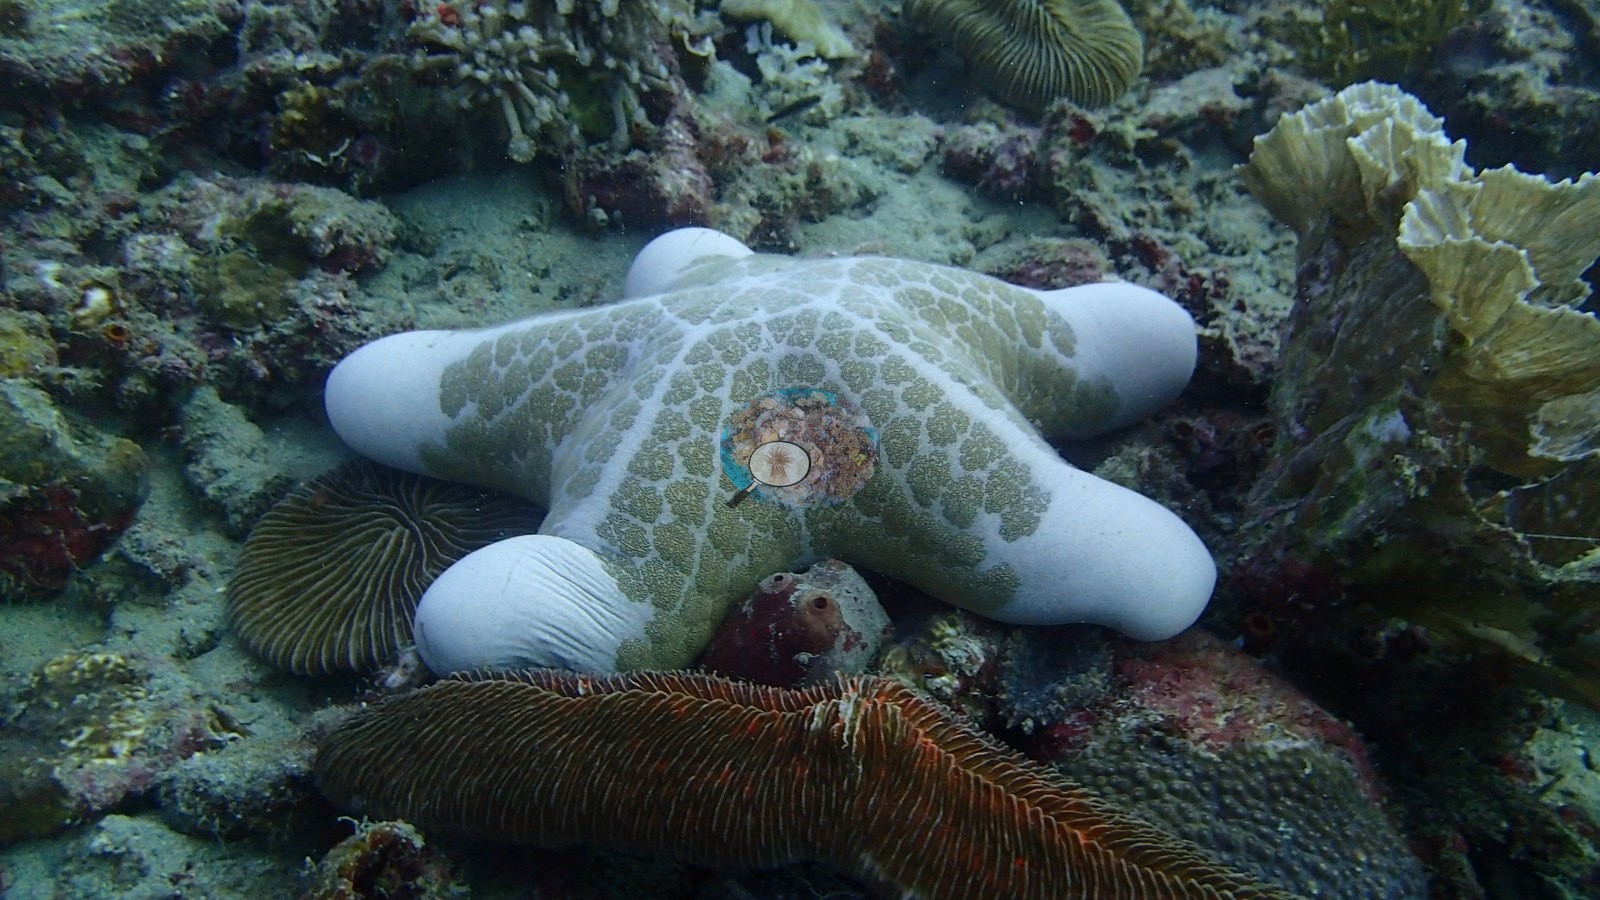
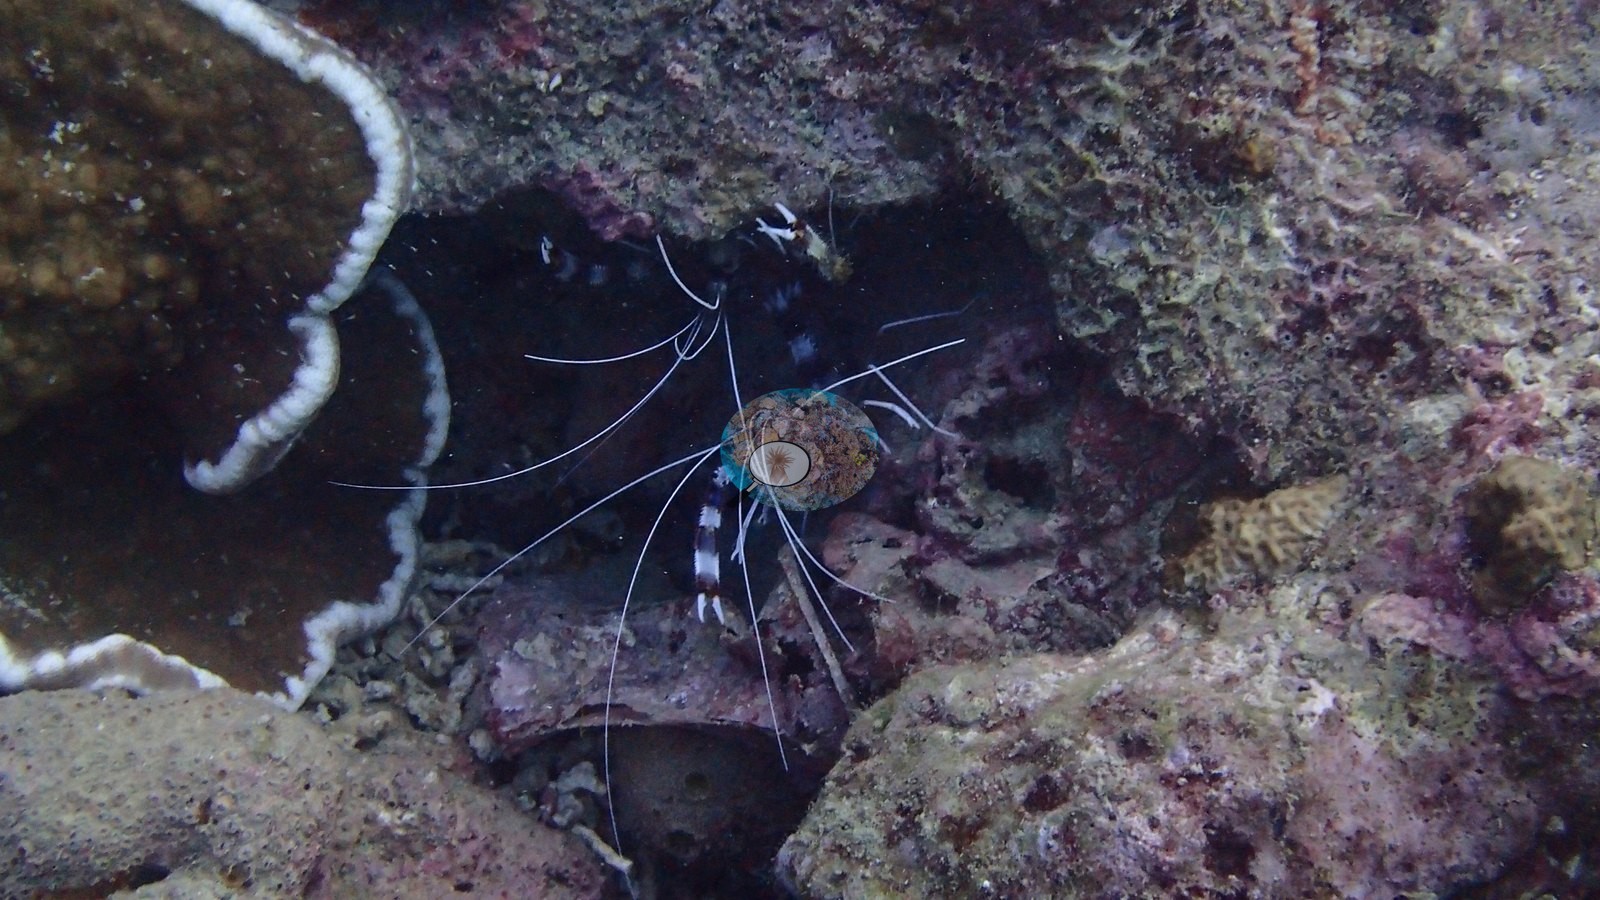
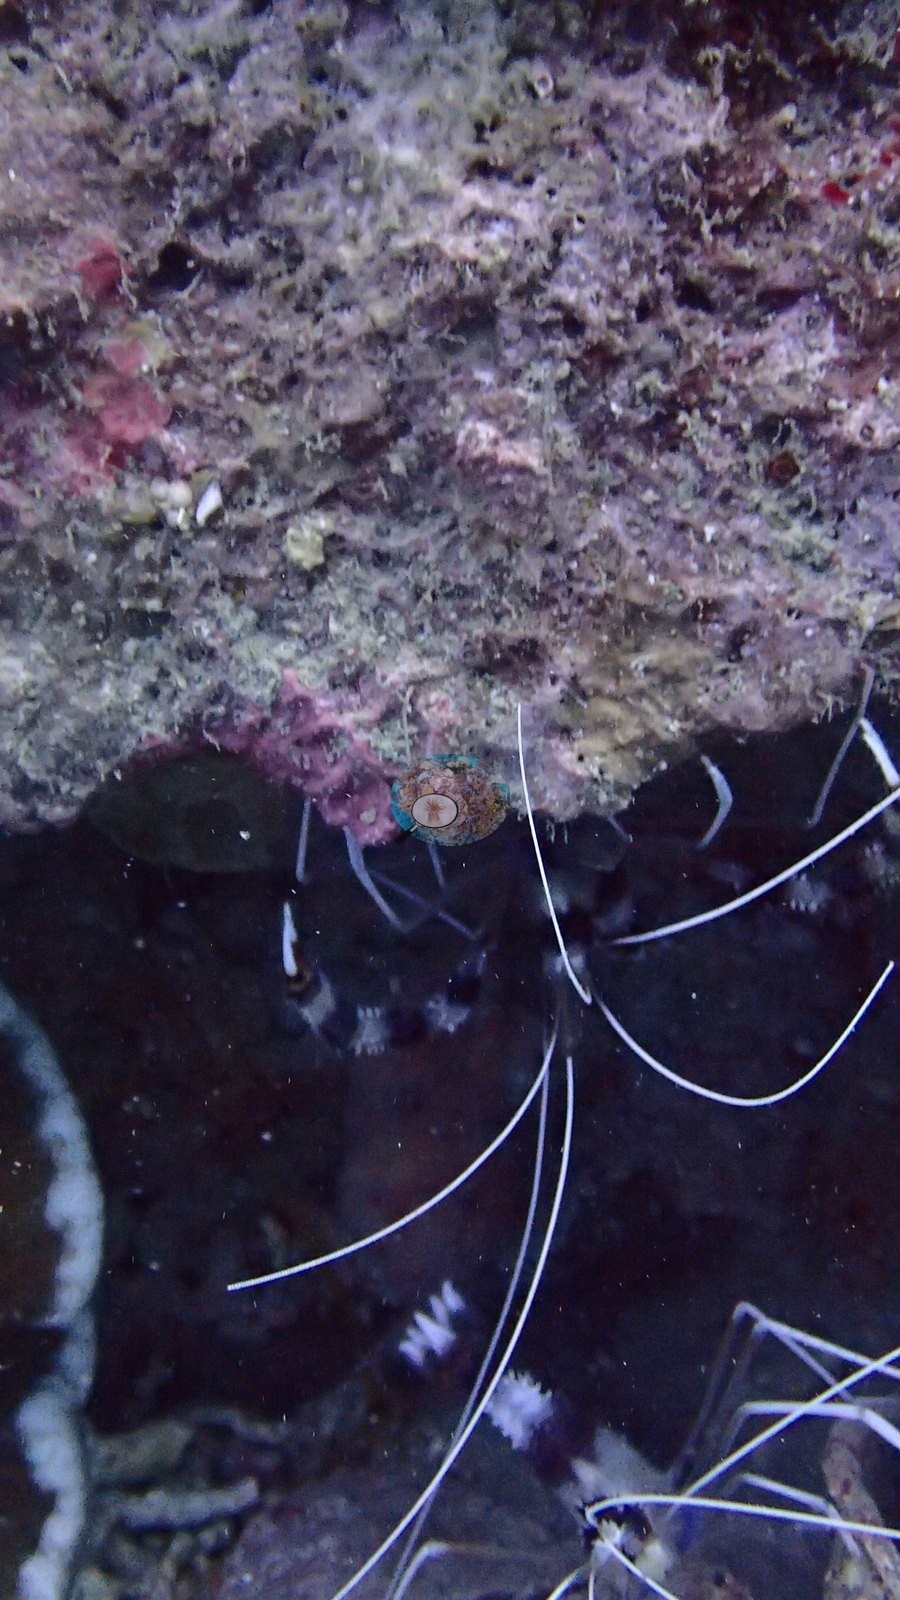
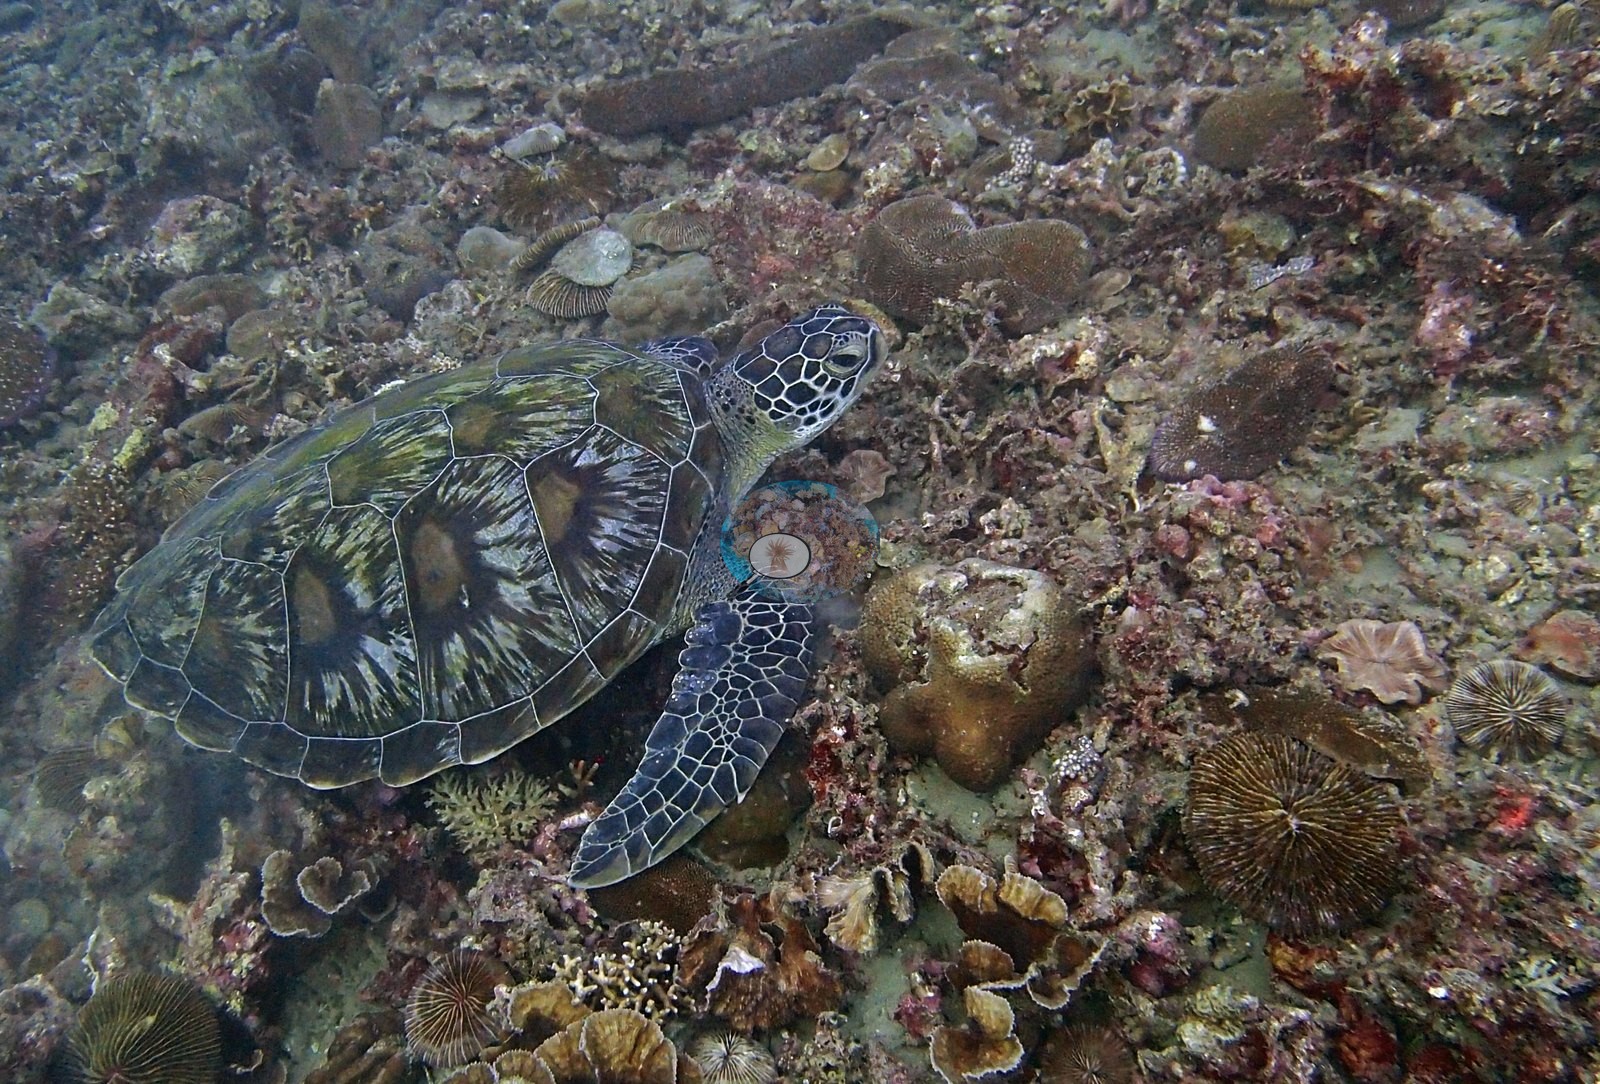
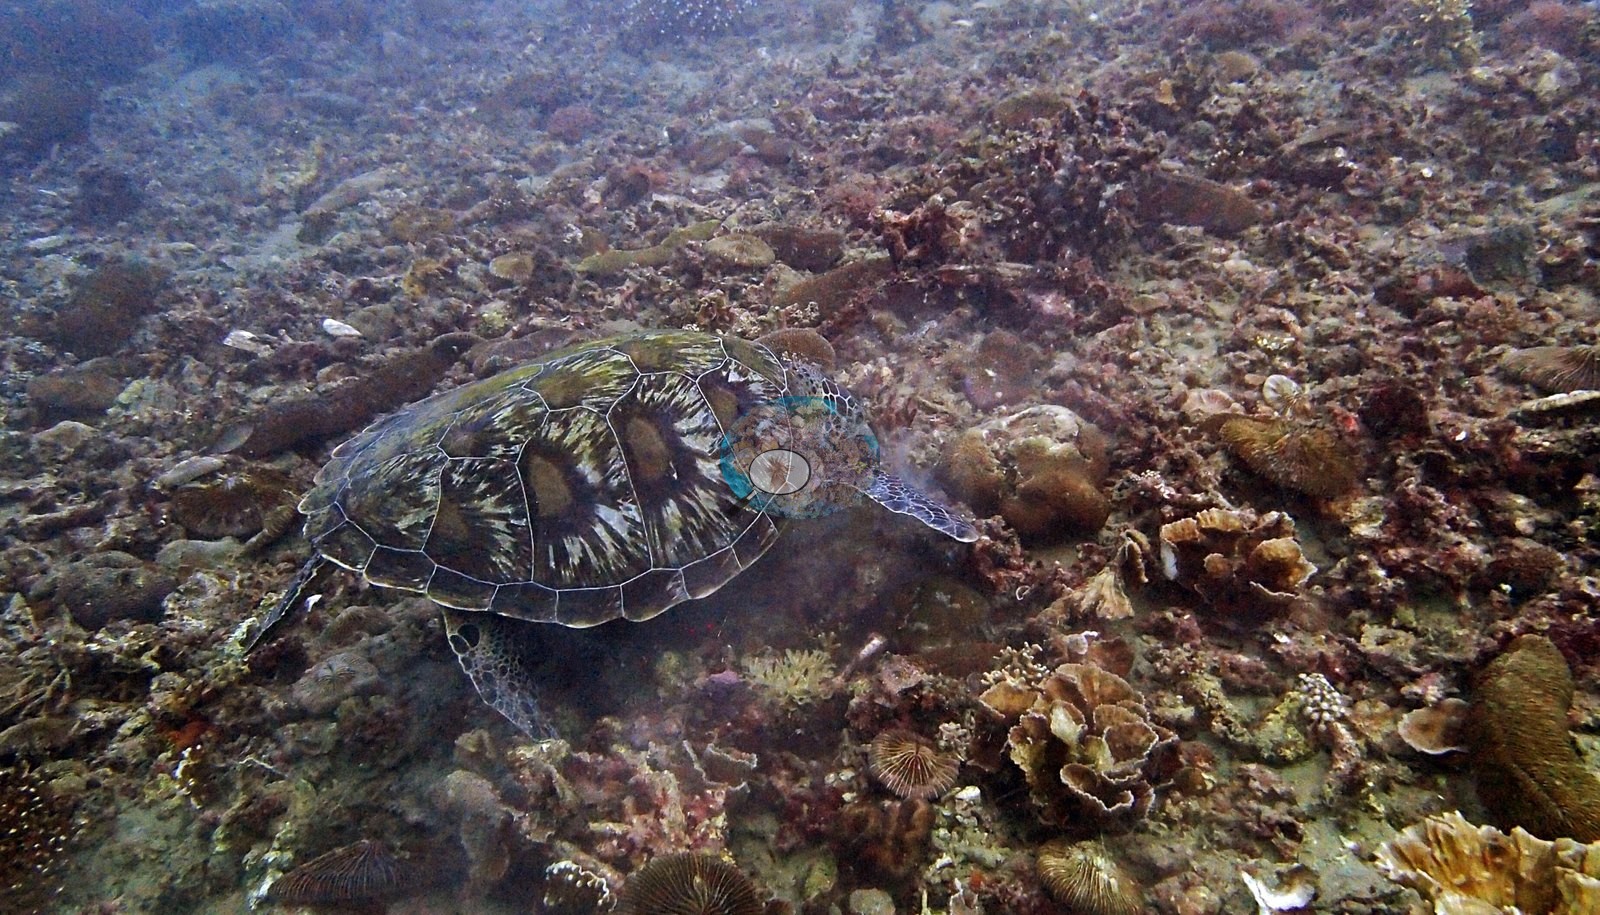
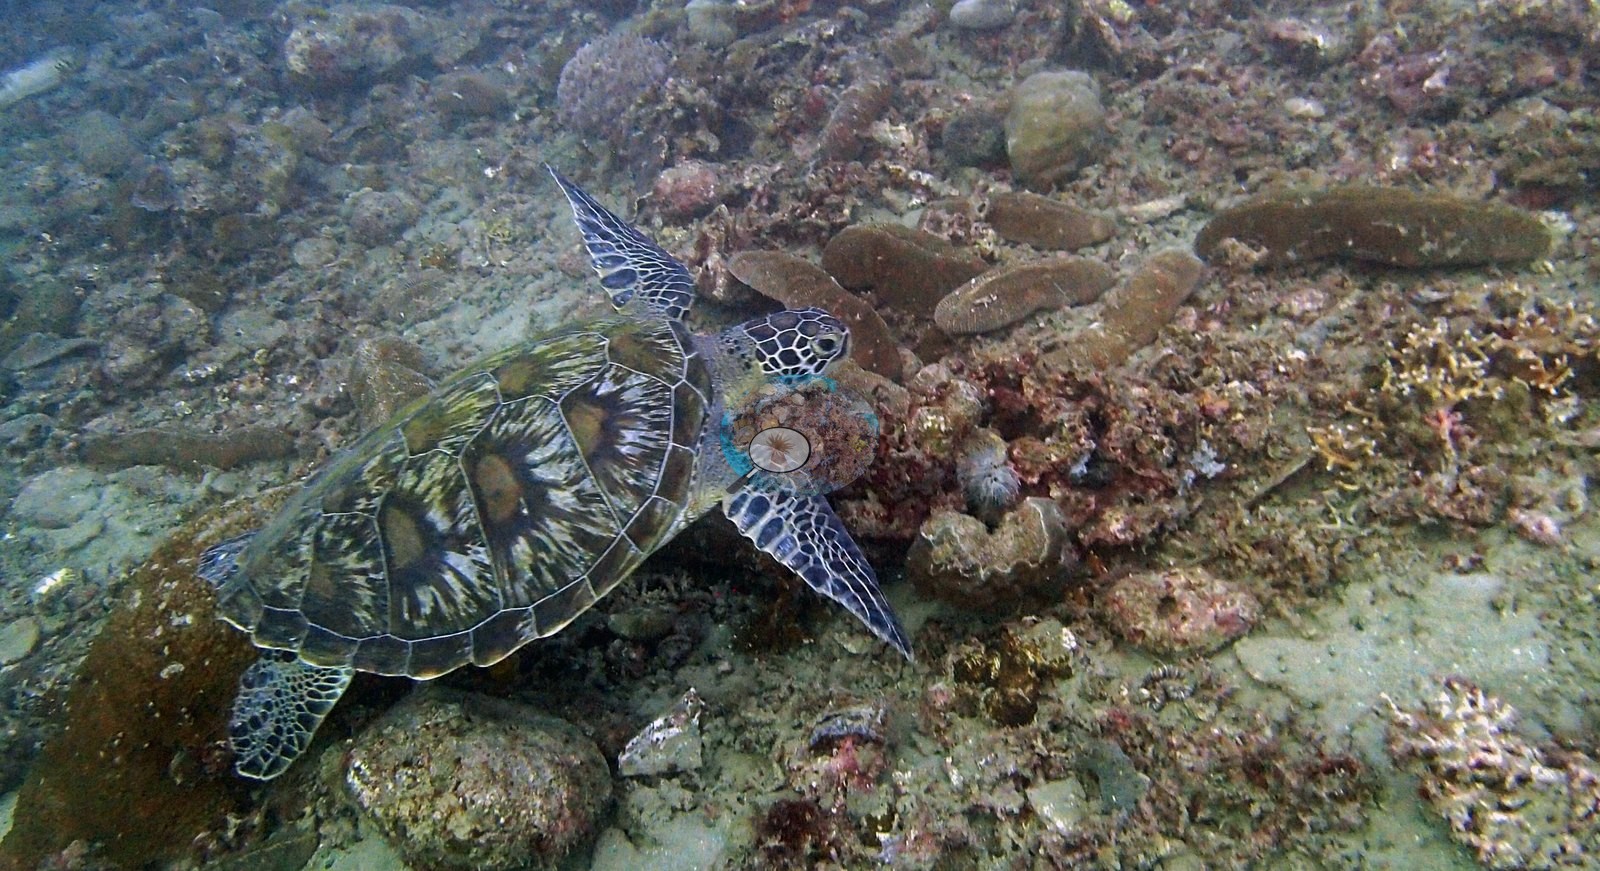
A run of five consecutive frames records green turtles foraging over the rubble; the sequence cannot establish how many individuals it shows (e.g., Image 14, Image 15).
Comparisons with other data
No independent survey was made at this exact site; the nearest ones are listed in the table below.
Dive record
The third dive of 30 September 2016, and the most unusual of the trip: a house reef that is substantially man-made. All 82 available frames were reviewed.
CV model comparison
More info
As of September 2026 no computer-vision method estimates coral cover accurately on new images, so treat this as indicative rather than a measurement; it is revised as the methods improve.More info
The published figure is the mean of the two methods.| Method | Hard-coral cover (%) |
|---|---|
| In-house DINOv3 | 22.3 |
| CoralSCOP | 22.2 |
| Mean (± SD) | 22.2 ± 0.1 |
| Range | 22.2–22.3 |
Mean ± SD and range are across the computer-vision methods shown.
Independent surveys nearby
 Dr. Coral (CRD)
Within 5 km, 9 independent survey stations recorded hard coral cover in 24 surveys between 2010 and 2017. Of the 3 stations surveyed in more than one year, 2 declined and 1 changed by less than 5 percentage points between their first and latest surveys. The longest record, Koala, Bagalangit (Reef Check, 2.40 km away), went from 70% in 2010 to 39% in 2017. The most recent nearby survey is from 2017, so these values predate recent heat stress. This site's own estimate (22%) sits within the range of these surveys (19–70%, excluding 2 best-patch values above 70% that are not a site mean); the methods differ, so the comparison is context, not a like-for-like test.
Collected by other programs using different methods (Reef Check uses point-intercept transects), so these are context for the figures above, not a like-for-like comparison. Where a station was surveyed more than once the range is shown. Station names are not dive-site names. Values marked best patch exceed 70%: surveyors usually chose the richest area, so they are not site means.
| Agency | Site / location | Date | Hard coral cover (%) | Distance | Link |
|---|---|---|---|---|---|
| Reef Check | San Teodoro | 2010 | 27% | 1.76 km | — |
| Reef Check | Bagalangit Koala | 2010 | 70% | 2.02 km | — |
| Reef Check | Koala, Bagalangit | 2010–2017 | 39–72% (9 surveys) best patch | 2.40 km | — |
| Reef Check | Twin Rocks | 2010–2017 | 19–34% (4 surveys) | 3.31 km | — |
| Reef Check | Acacia Resort and Dive Center | 2010–2017 | 49–58% (4 surveys) | 4.05 km | — |
| Reef Check | Arthur's Rock | 2013 | 36% (2 surveys) | 1.78 km | — |
| Reef Check | Inner Layag Layag Reef | 2014 | 64% | 2.41 km | — |
| Reef Check | Tingloy - Poblacion Reef | 2014 | 89% best patch | 4.09 km | — |
| Reef Check | Ligaya Bantong Buhay MPA | 2017 | 56% | 3.50 km | — |
Data & links
All images from Coral Reef Diagnostics. Data are from Coral Reef Diagnostics and the organizations named in the data-sources table above.
© Coral Reef Diagnostics.