
Regional summary of 21 dive sites. Figures are averages across the sites that report them (n = sites with a value); each site's own page has its individual values.
⬇ Download this region as a report card
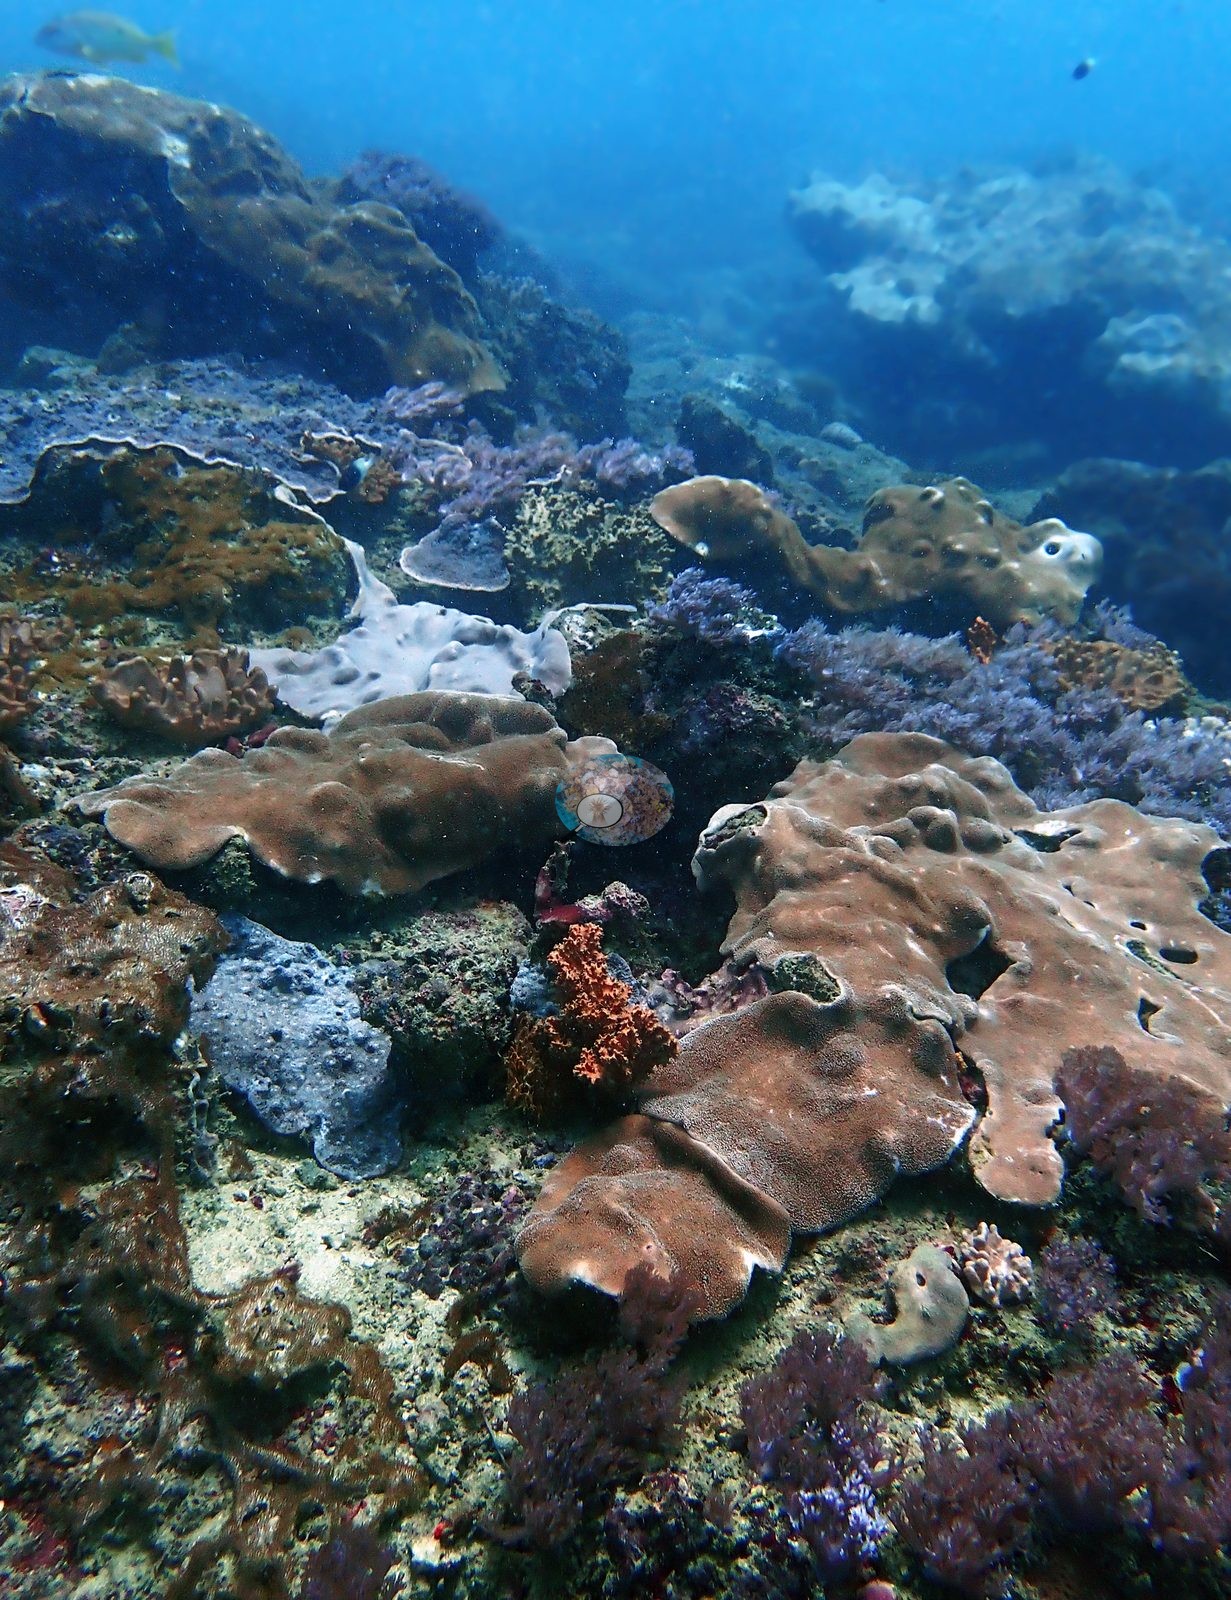

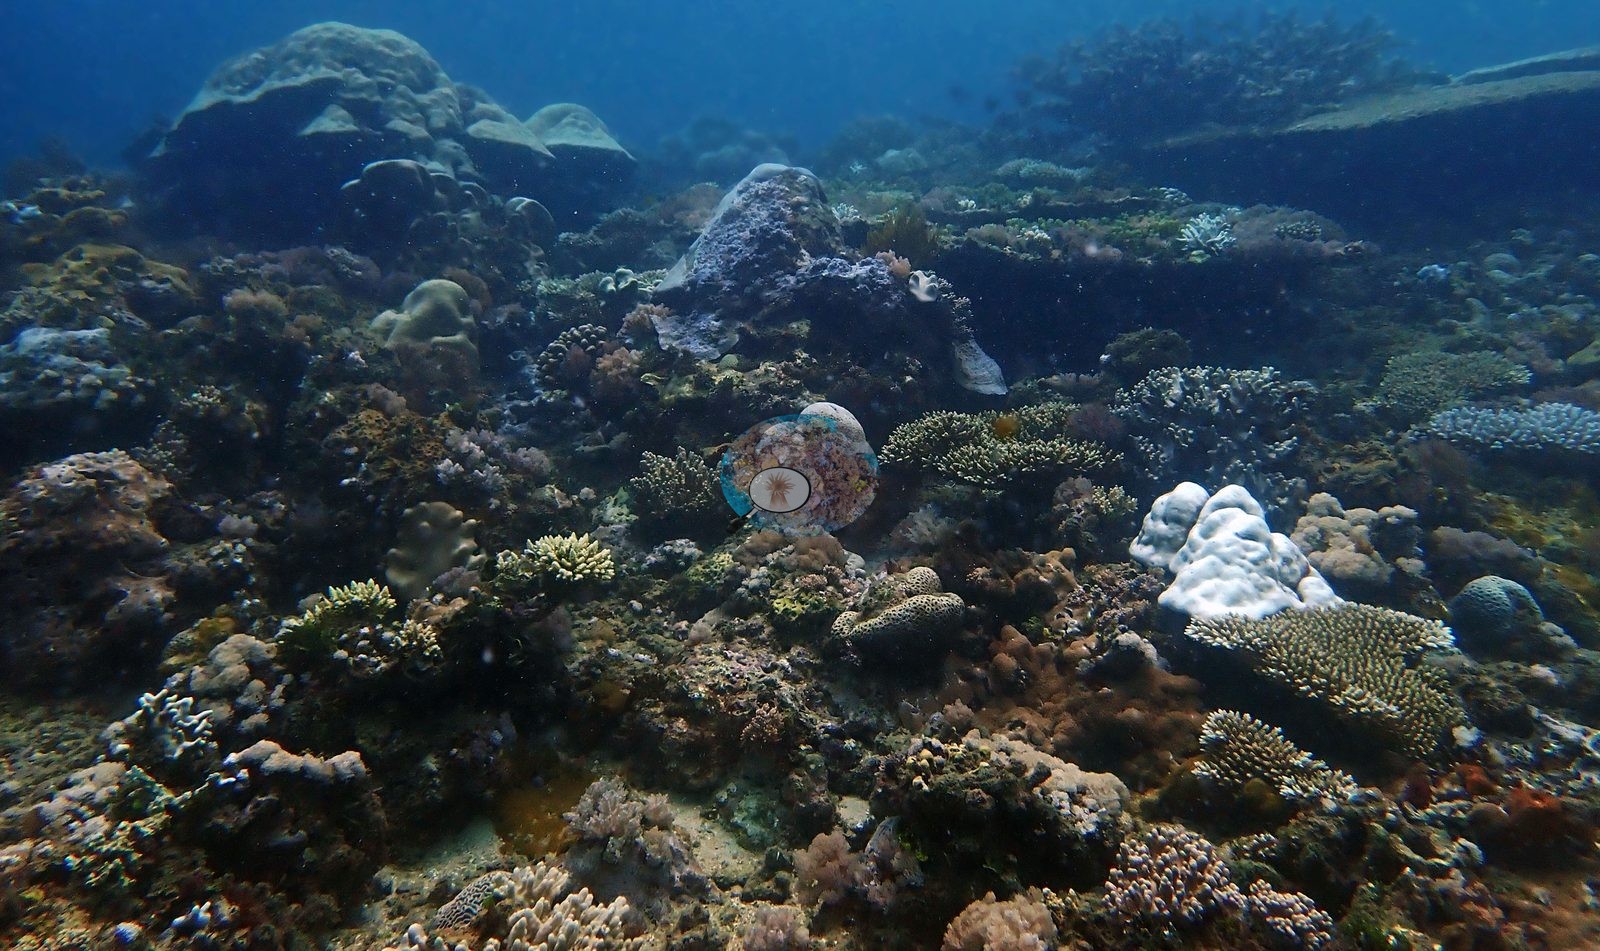
Kenya's shallow fringing reef flats, terraces, bommie fields, and restoration nurseries were surveyed in March-April 2024, during the Western Indian Ocean mass bleaching. Bleached tissue ranged from 45.4% to 95.4% of hard coral, and no coral growth form was reliably spared.
Heat stress
Long-term record: 4 years since 1985 reached 8 or more °C-weeks at NOAA’s Kenya, Tanzania stations. Download the annual DHW data (CSV).
21 sites in this region — click a marker to open that site.
Regional setting
Kenya's reefs are mostly fringing reefs, the predominant type along mainland East Africa (Spalding et al. 2001). South of Malindi, a narrow coastal plain is backed by raised Pleistocene reef platforms standing above today's intertidal platform, and the continental shelf extends only about 5 km offshore; north of Malindi it widens to about 60 km. Fringing reefs are best developed in the south. Farther north, loose sediment and fresh water from the Athi-Galana-Sabaki and Tana rivers hold back reef growth, although fringing reefs occur around the Lamu islands and along a chain of about 50 calcareous barrier islands near Kiunga. Diversity also tends to be higher in the south, and Kenya's recorded coral fauna runs to about 55 genera and as many as 200 species. Before 1998, live coral typically covered about 30% of hard substrate, interspersed with seagrass and algal beds. In 1998, 50–90% of corals appeared to bleach and many died, and soft corals fared even worse. Kenya's first marine parks, at Malindi and Watamu, date from 1968, followed by Kisite and Mpunguti in 1978, Mombasa in 1986, and the Diani reserve in 1993, and protection has brought more fish, greater diversity, and higher live coral cover. Spalding et al. (2001) estimate about 630 km² of coral reef for Kenya, and Souter et al. (2021) put the whole Western Indian Ocean at about 15,180 km², nearly 6% of the world total.
Recovery in East Africa after 1998 was significant but patchy, and better on well-managed reefs, according to Wilkinson's (2006) summary of the 2004 status report. It named the growing coastal population, with land-based pollution and rising fishing pressure, as the largest threat, and listed Kenya with Tanzania and the Great Barrier Reef as the places with the highest recent densities of crown-of-thorns starfish. Souter et al. (2021) identify 1998 and 2016 as the two region-wide bleaching events in the Western Indian Ocean, with smaller episodes in 2005, 2007, and 2010 that interacted with fishing and local stressors. After the 2016 event, citizen-science surveys found that one site in five had lost more than half of its corals. Other published studies cited in that report point to 1998 mortality of 45–70%, after which cover never climbed back to its earlier level.
Overview
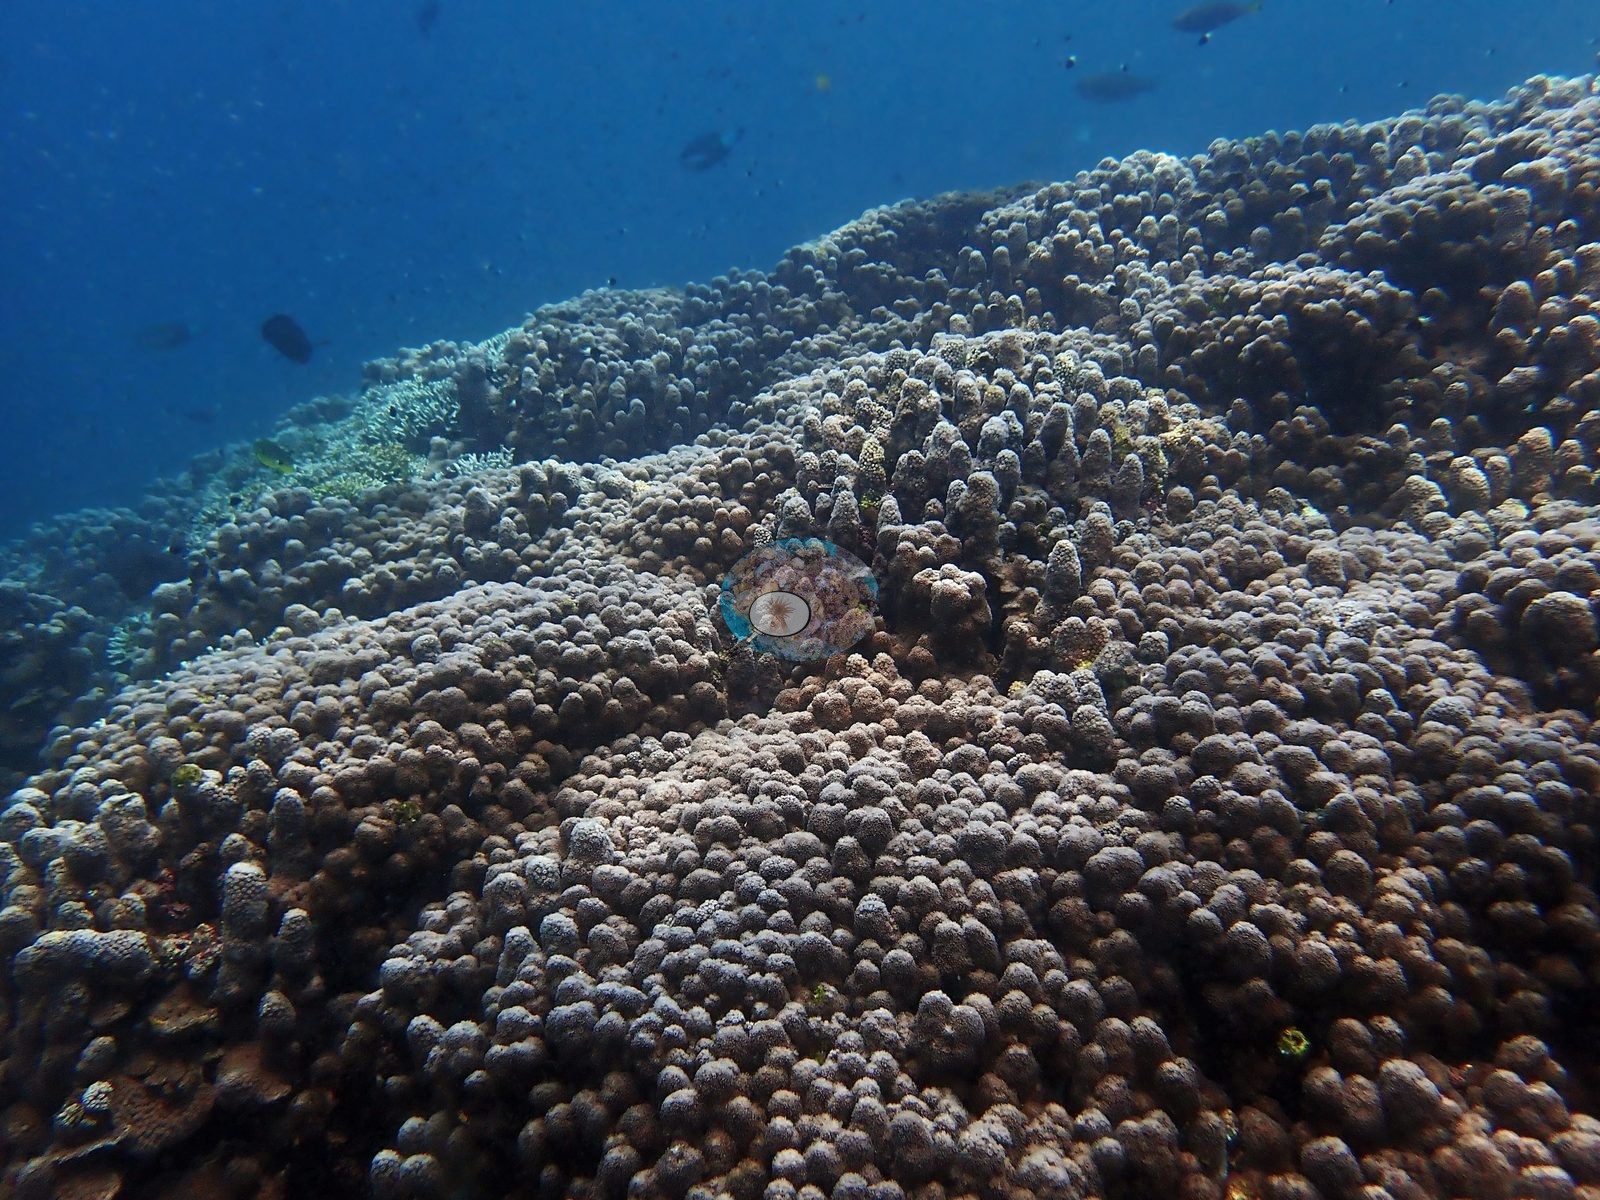
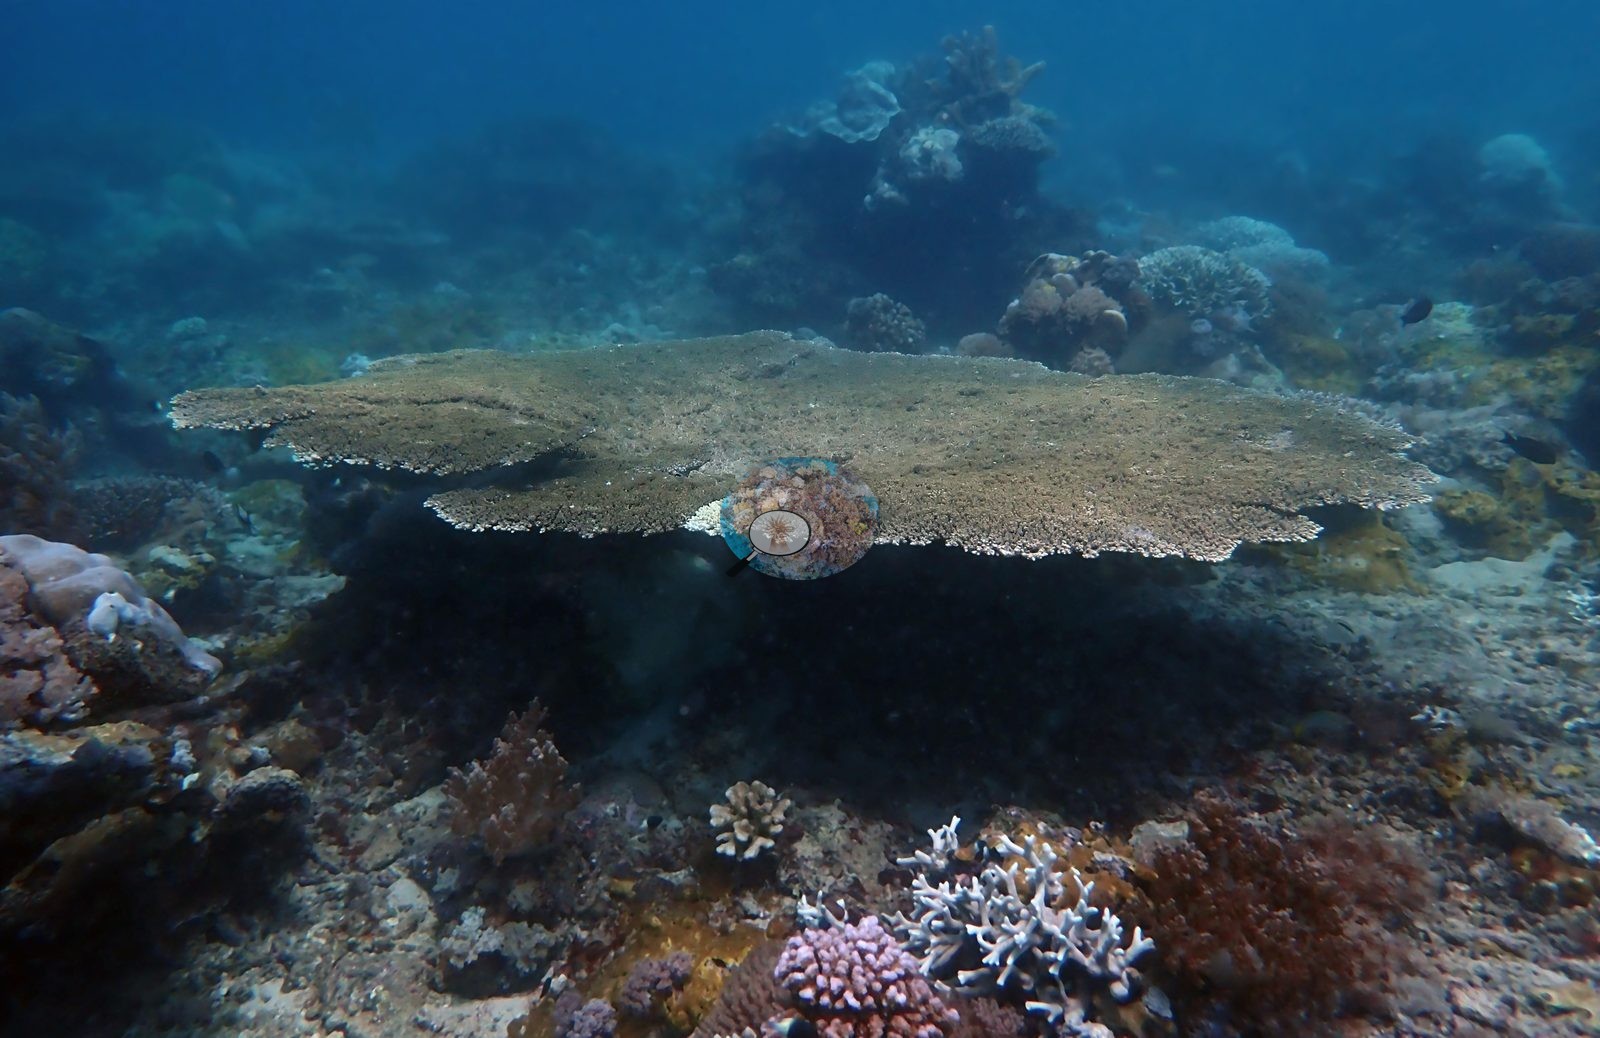
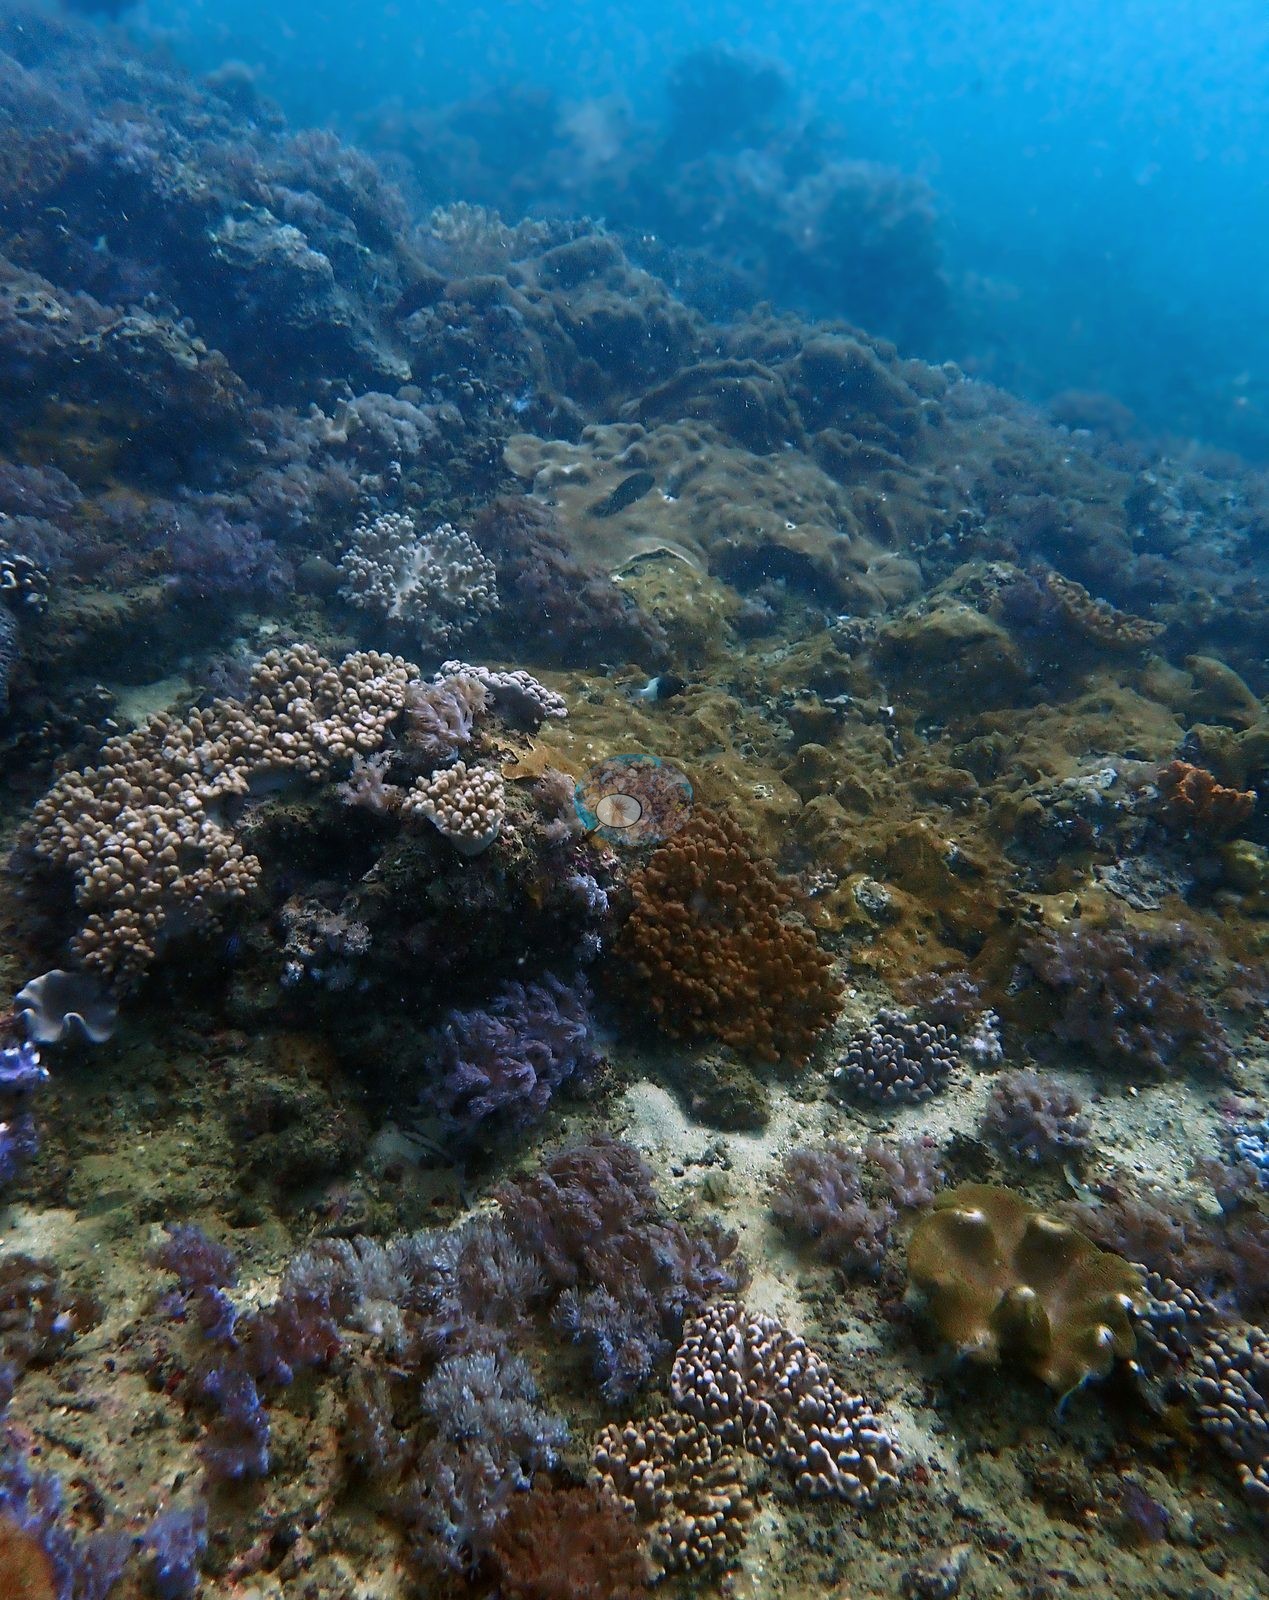
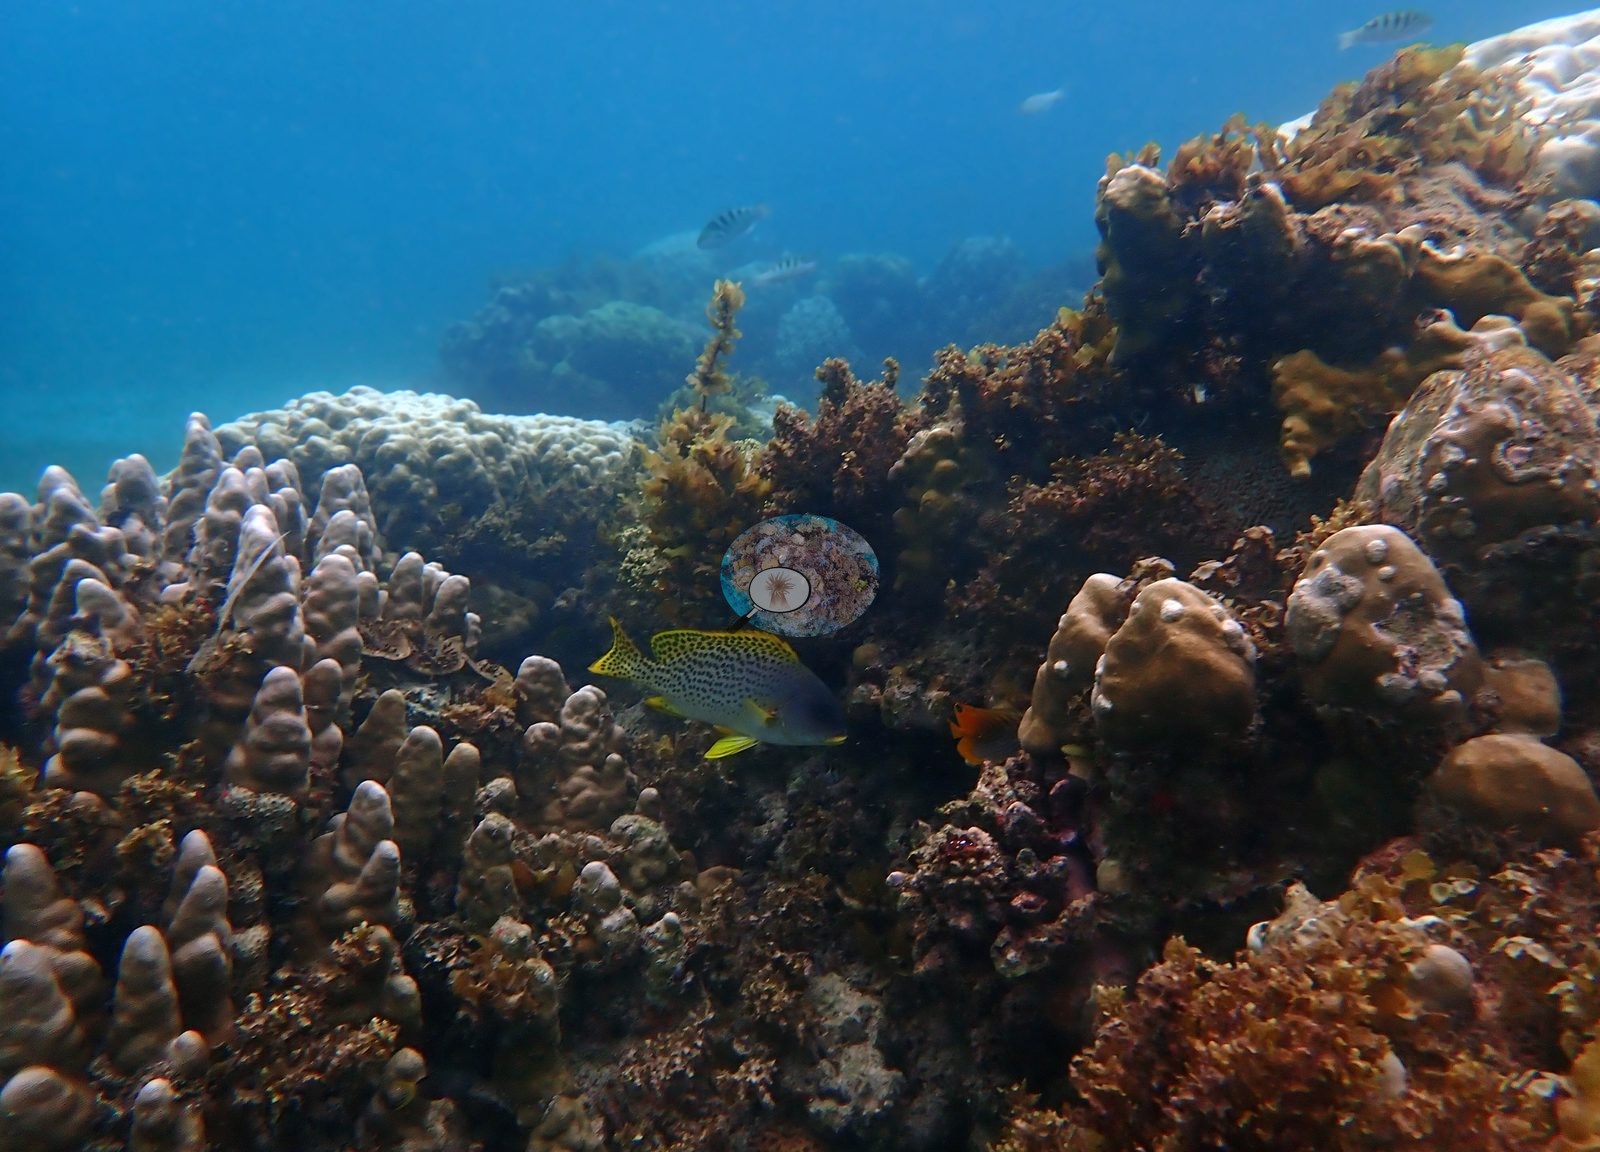
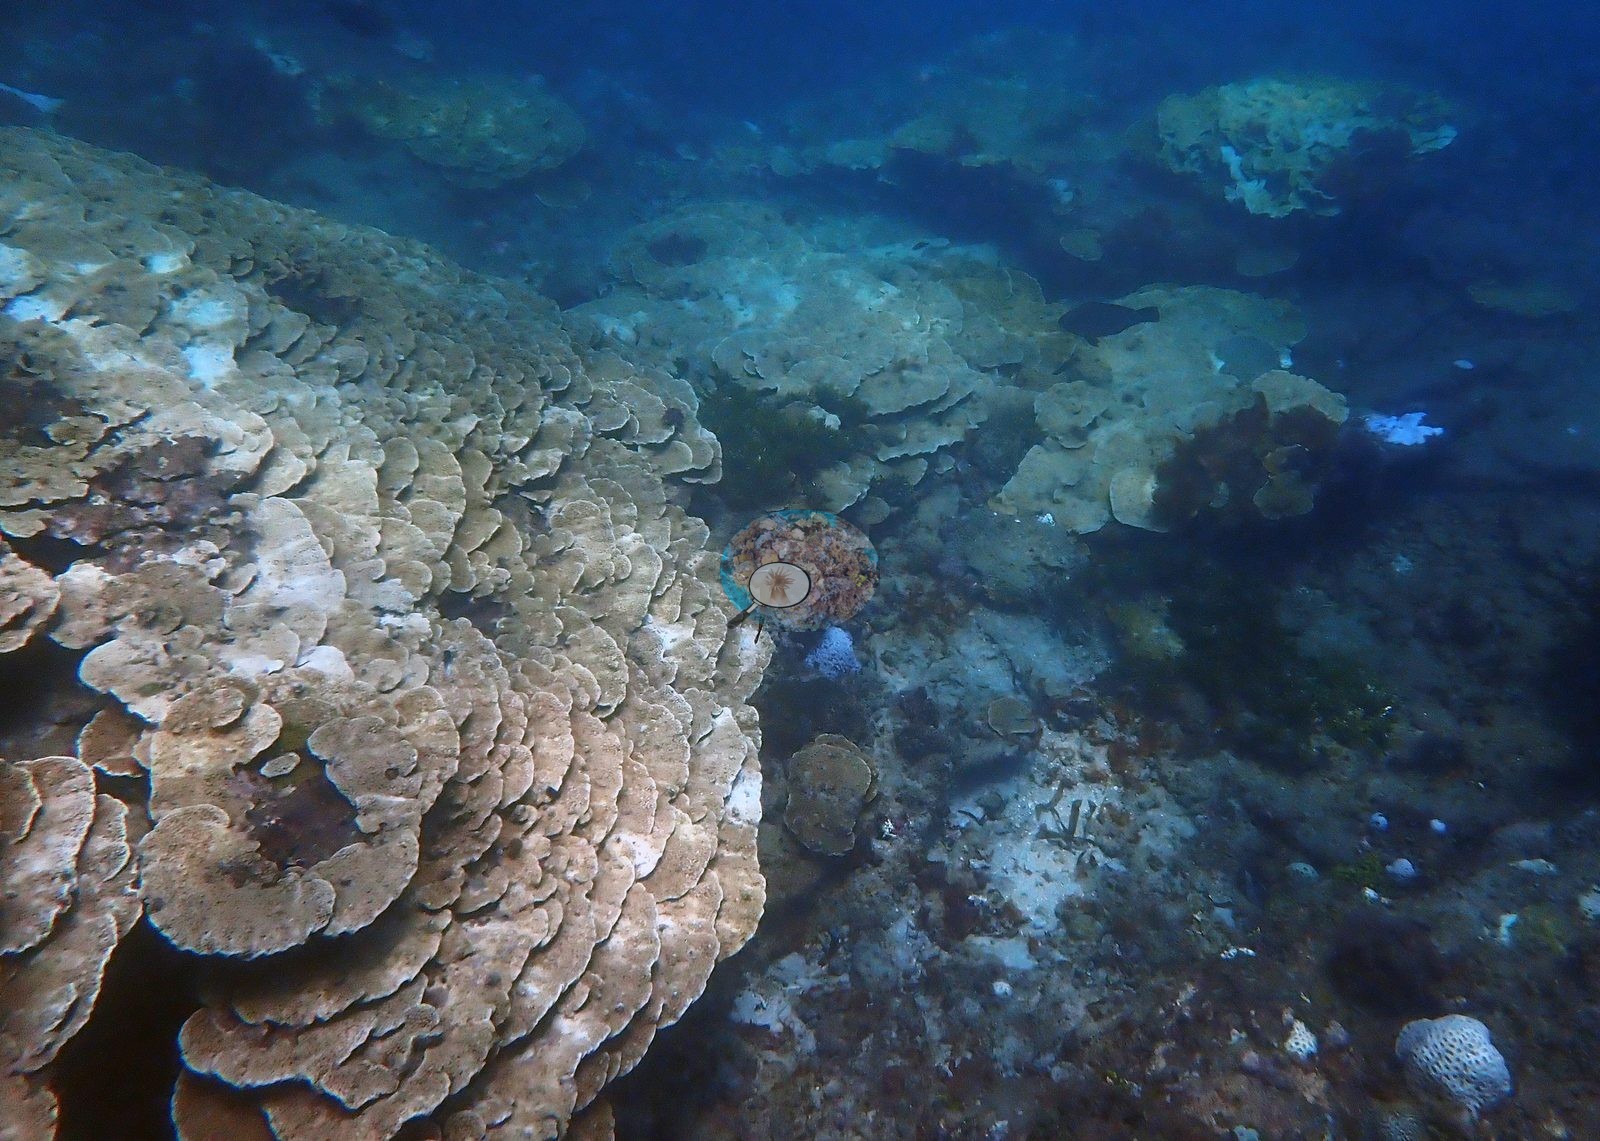
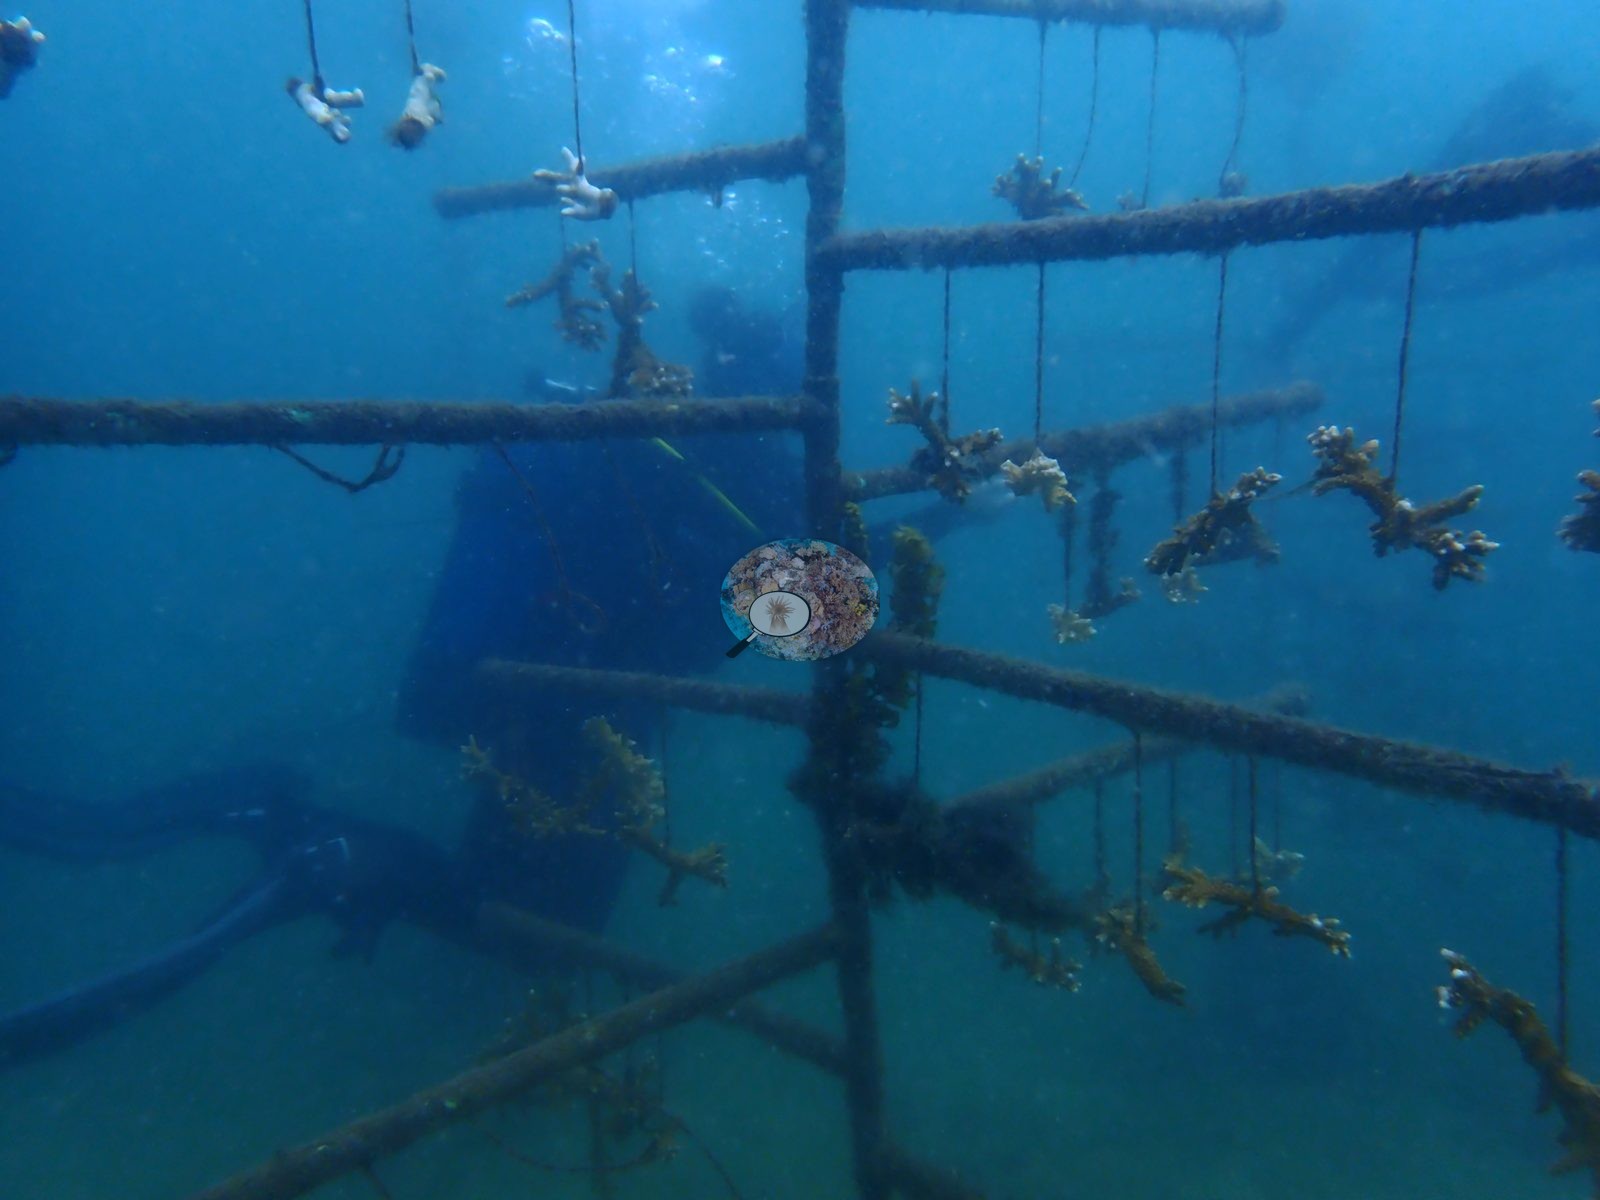
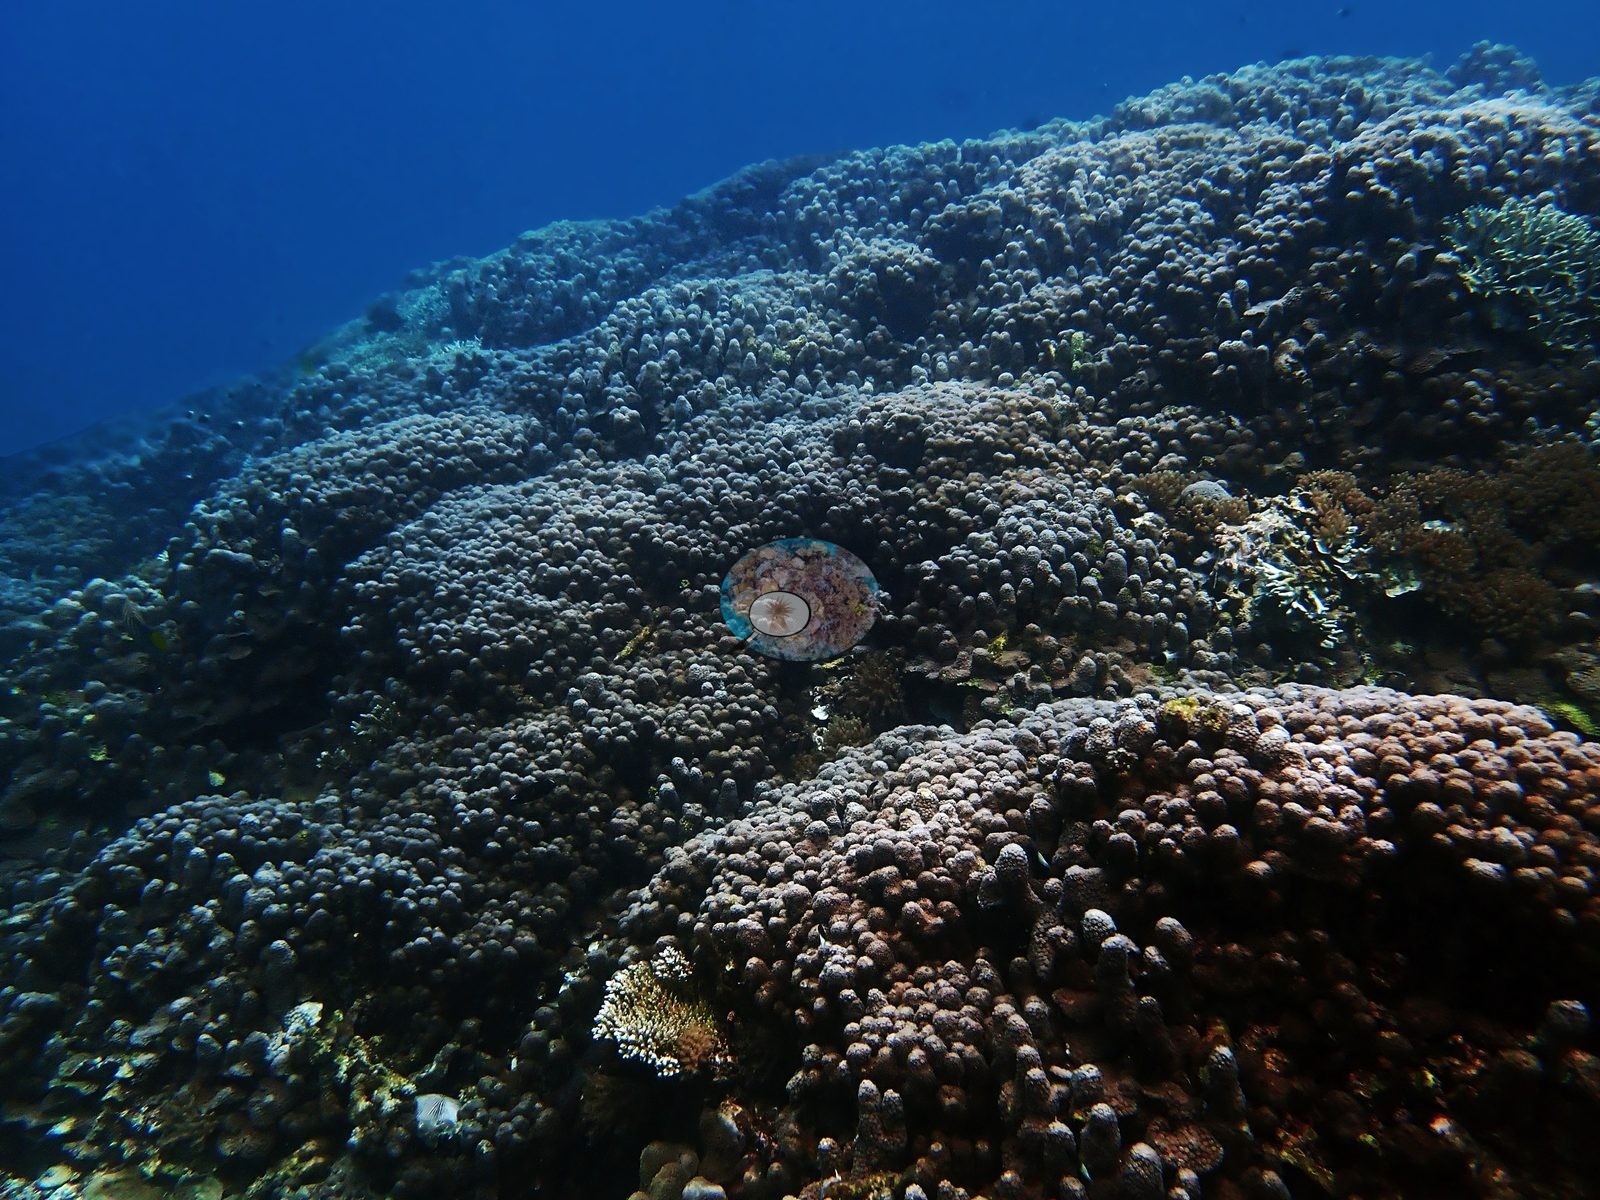
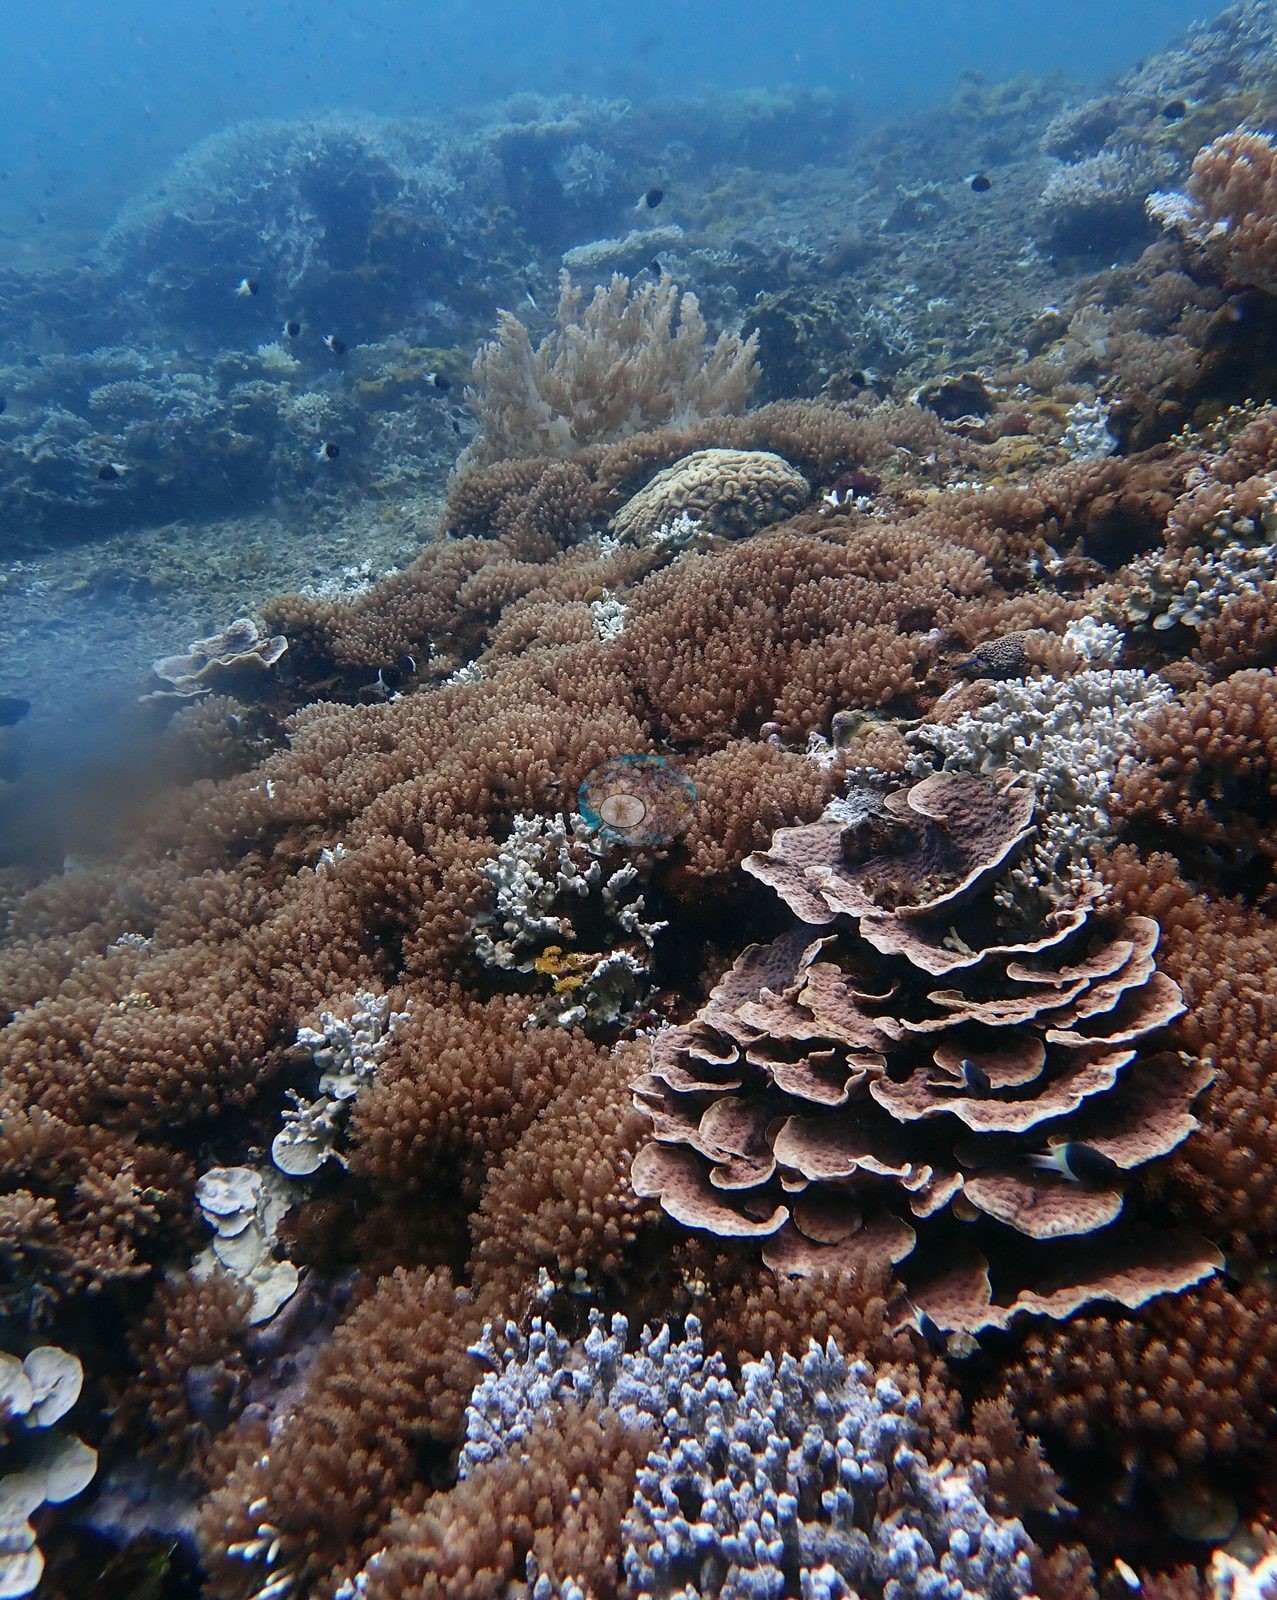
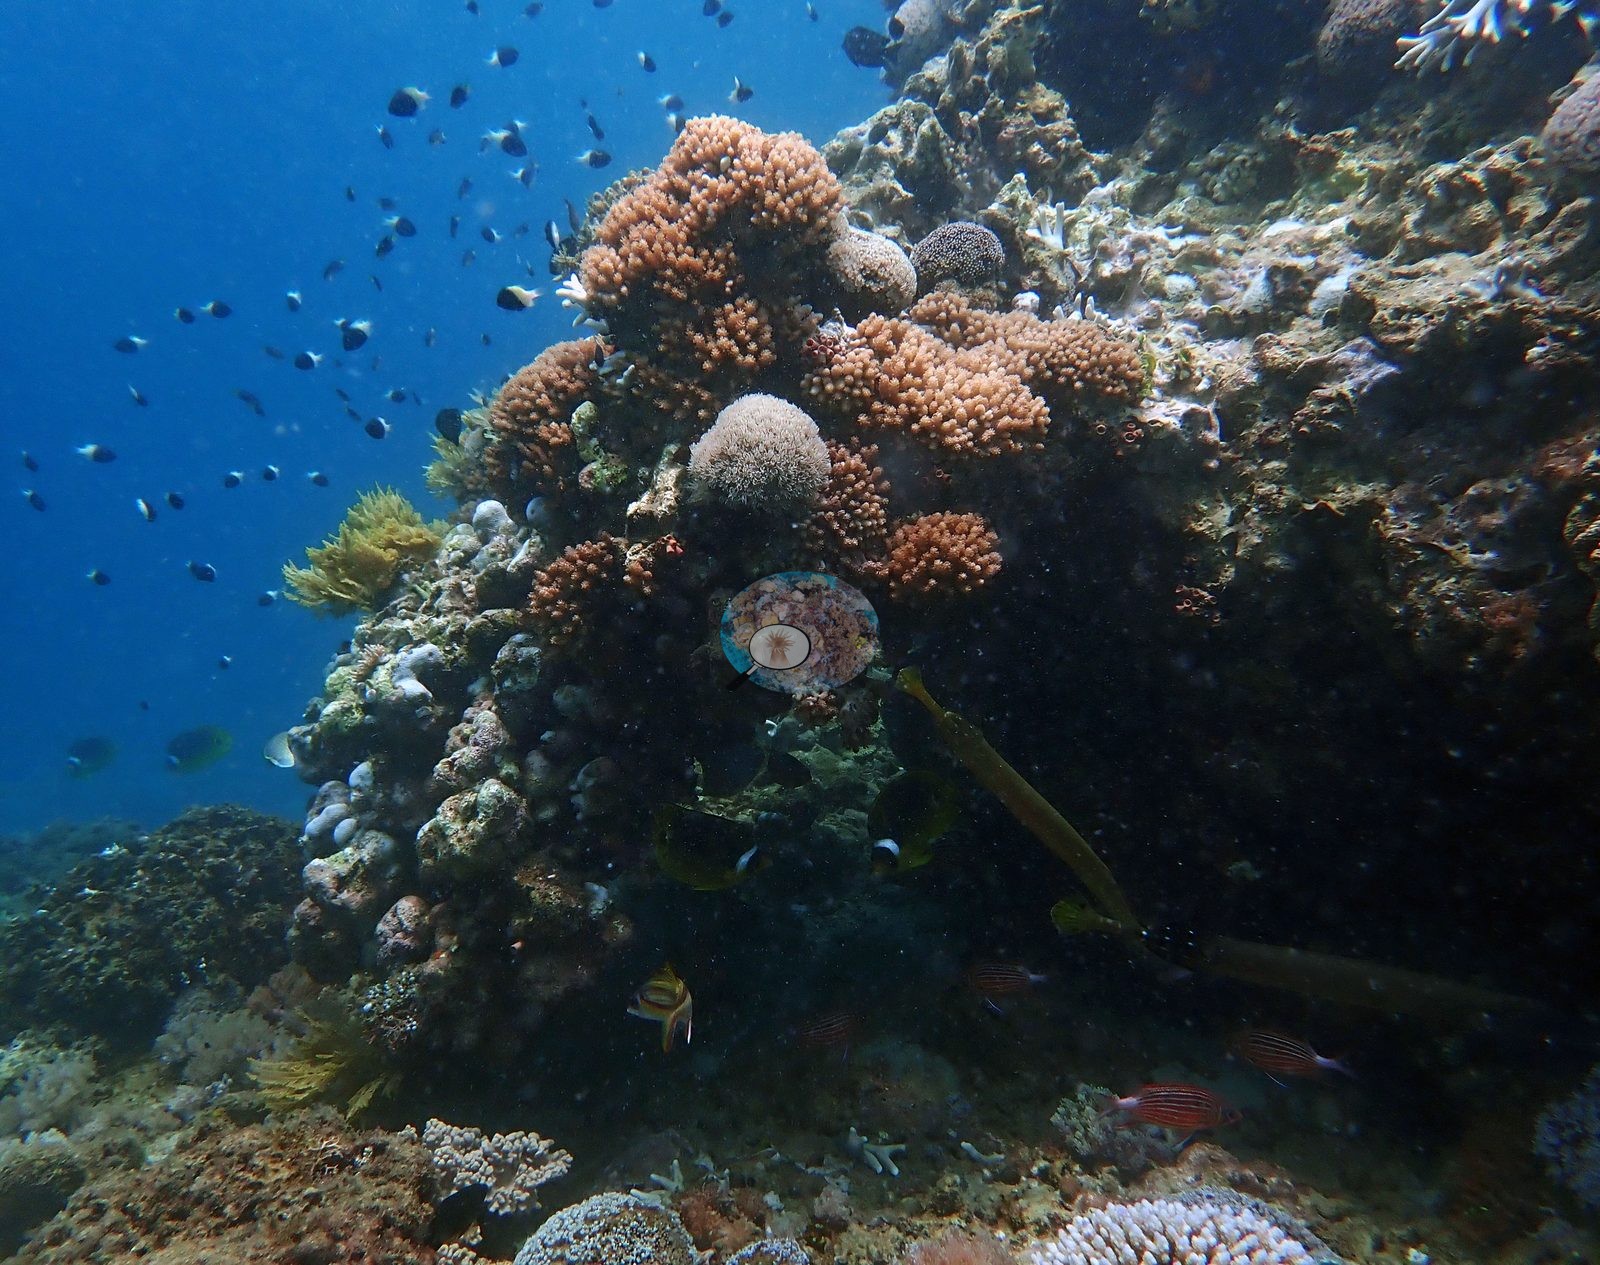
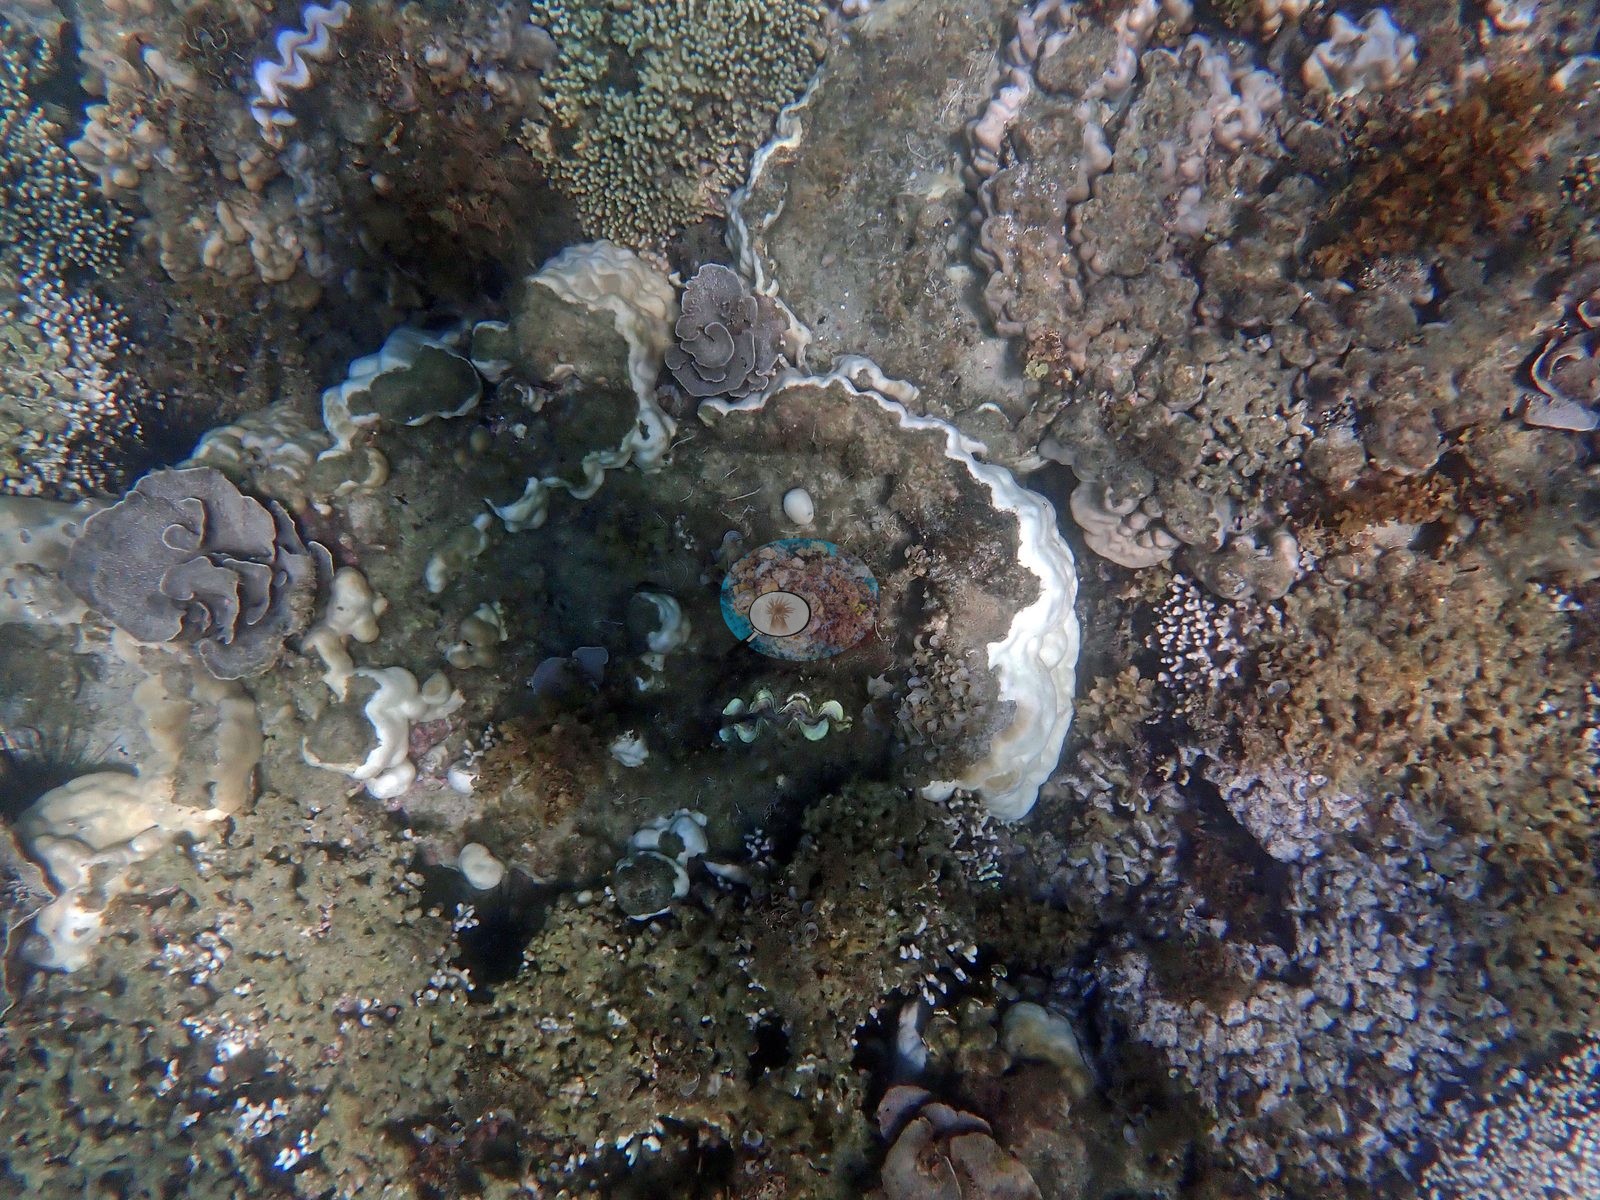
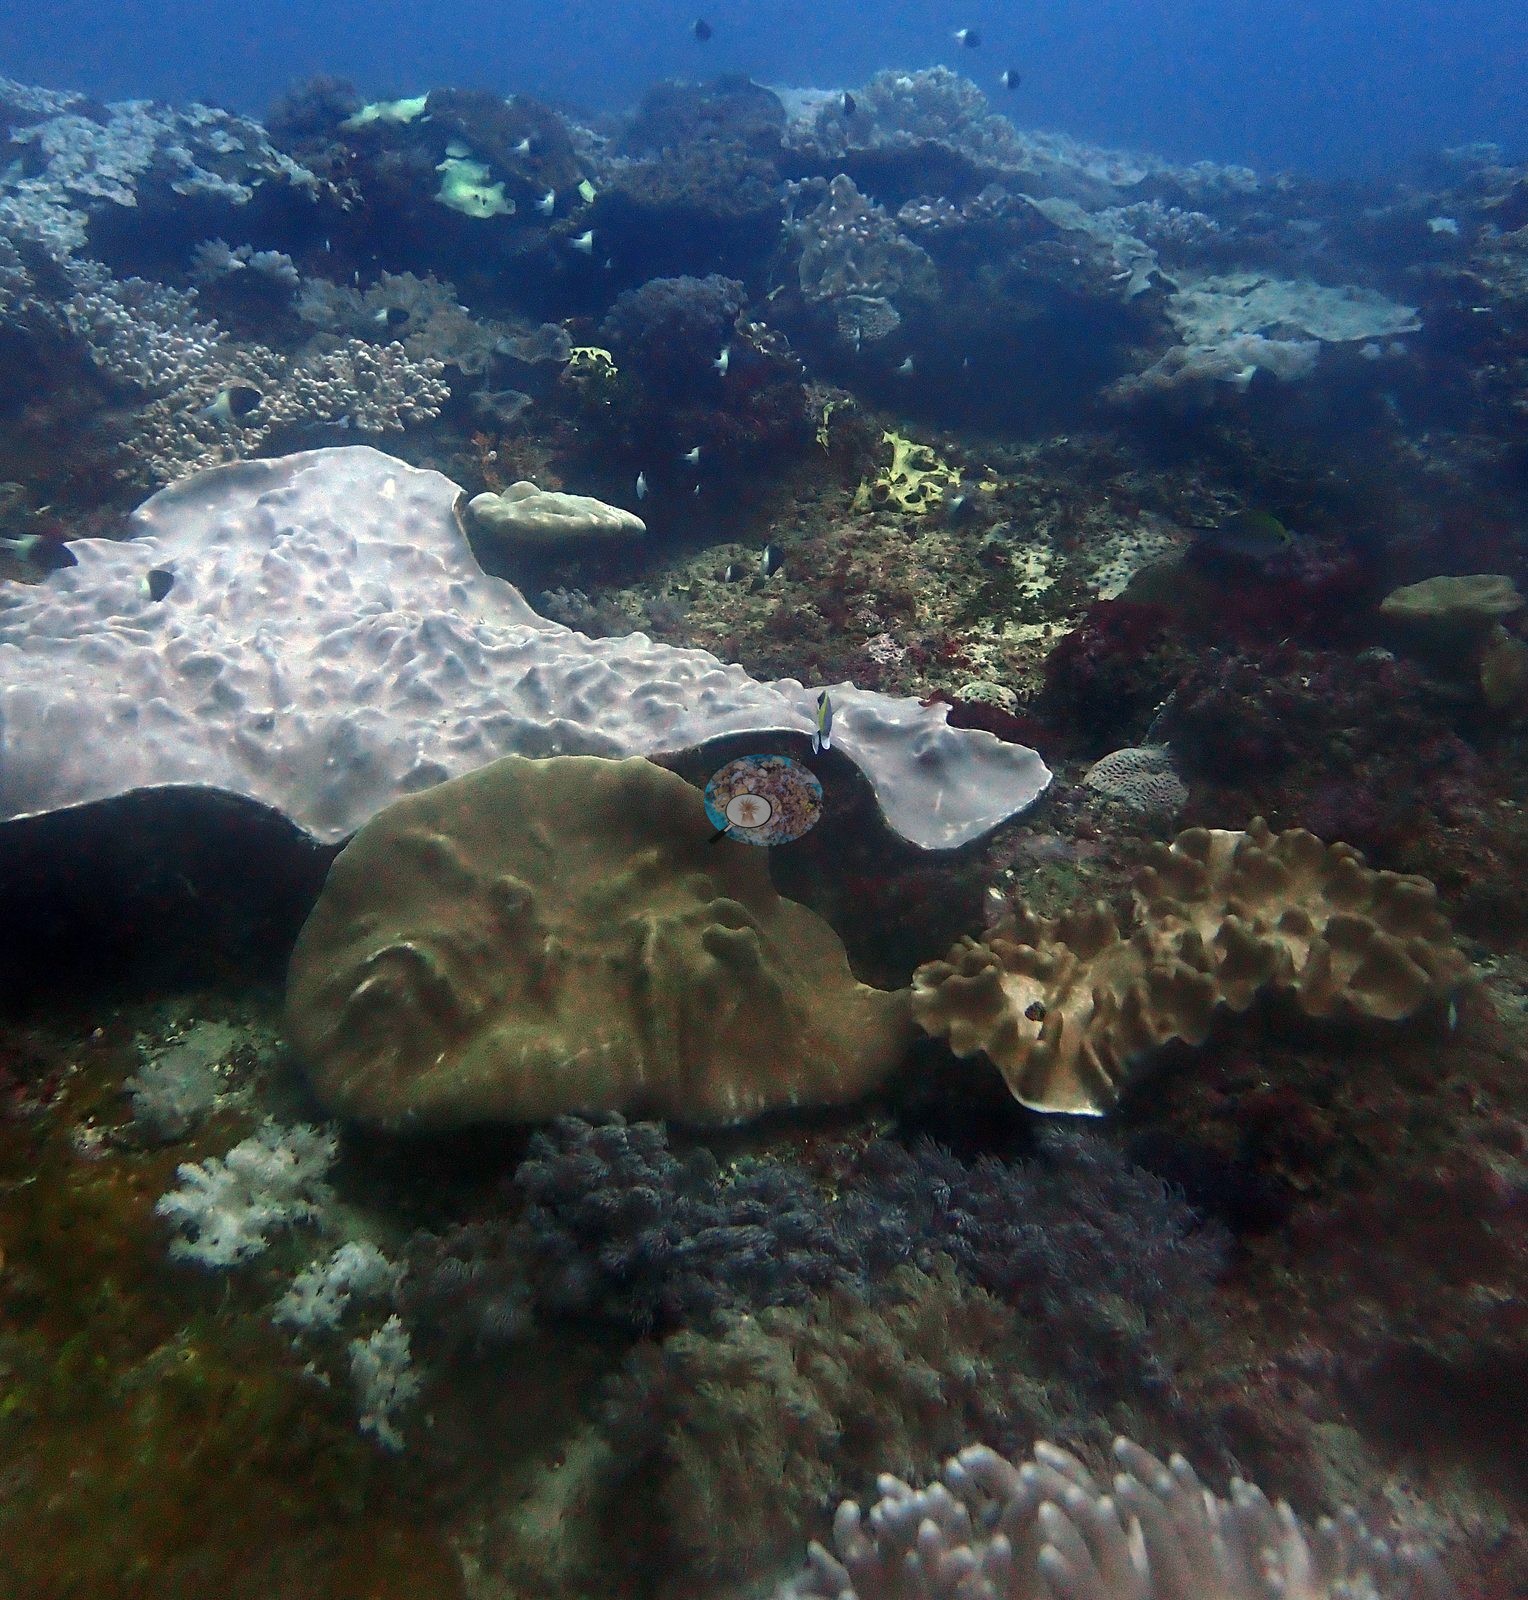
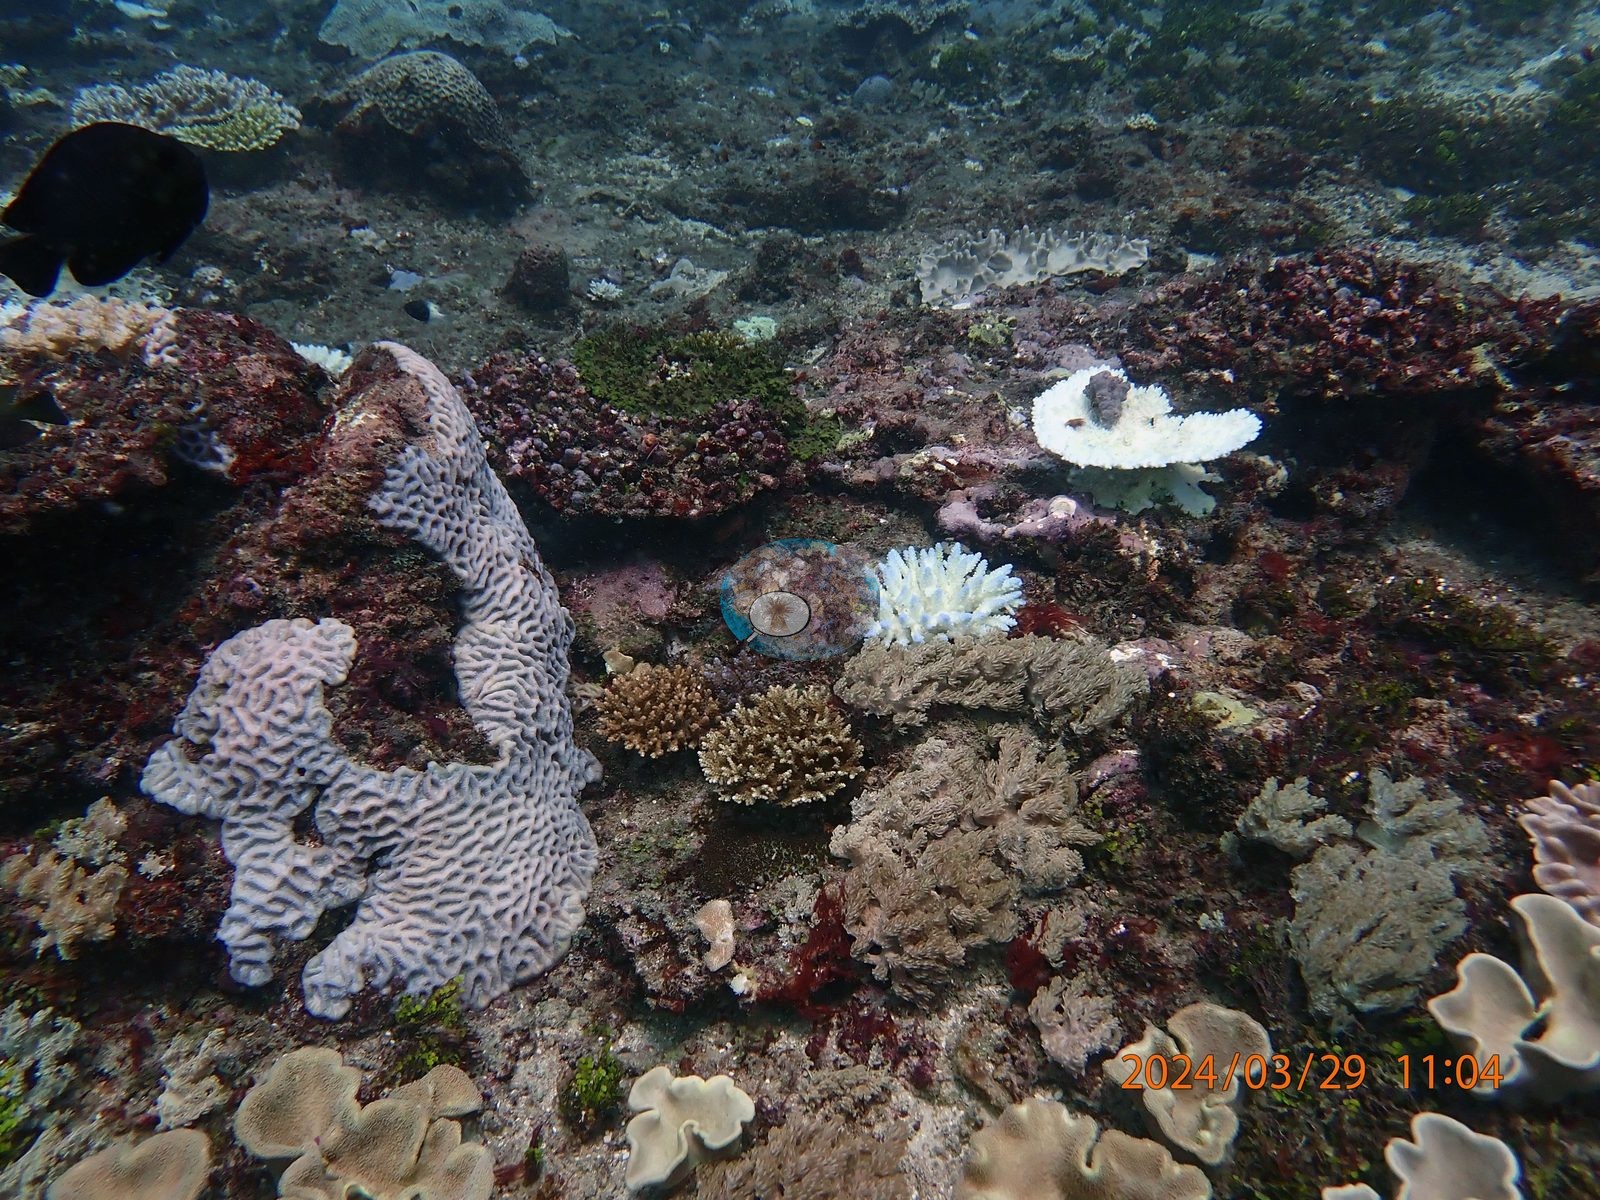
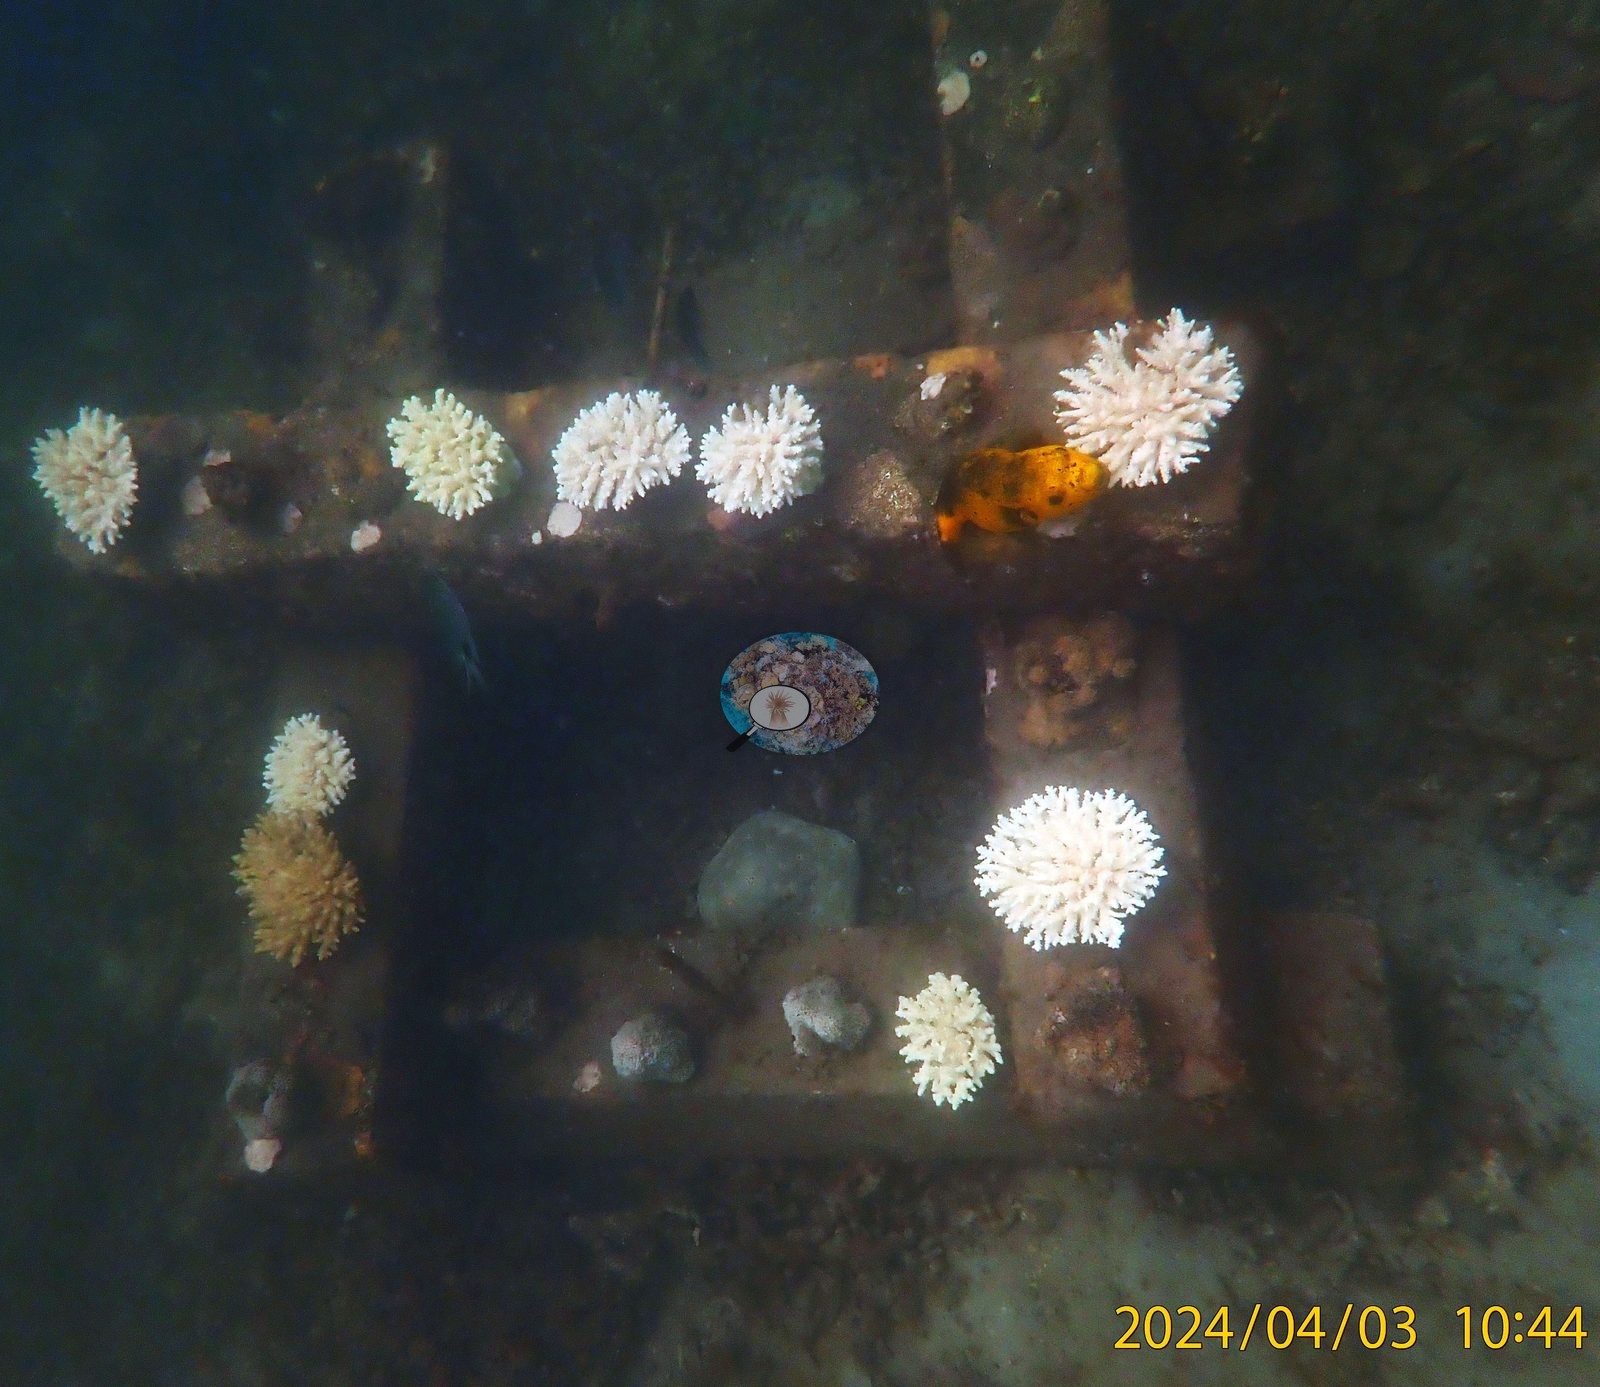
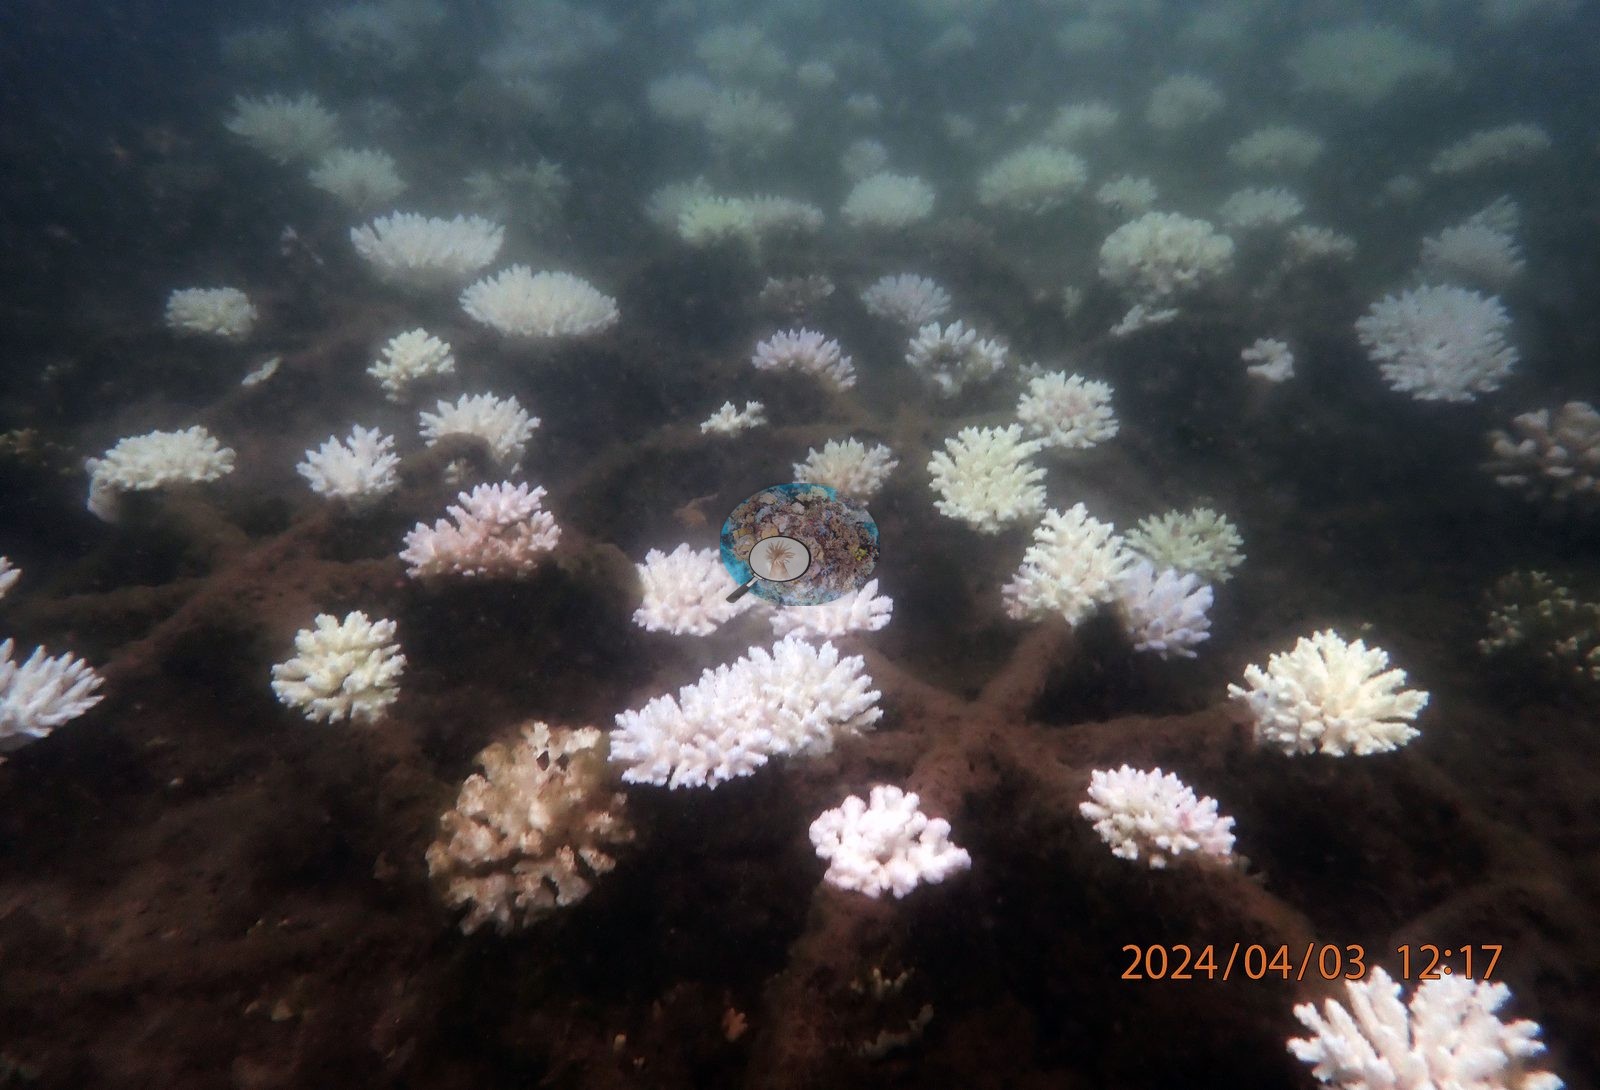
The 21 Kenya pins come from Anderson's survey of 11 March to 3 April 2024, during the Western Indian Ocean mass bleaching event. They run from Mombasa Marine Park south through Diani and the Shimoni-Wasini channel to Kisite-Mpunguti, and north through Kilifi and Watamu to Pate Island in the Lamu archipelago. All are shallow, from 0.5 m at Lower Mpunguti site 2 to 15 m at North Canyon: fringing reef flats, hardground terraces, bommie fields, and four restoration sites (the REEFolution nursery at Shimoni and three nurseries on Pate). The reef-building community changes along the coast. Foliose and laminar plates of Turbinaria, Montipora, and Echinopora type dominate at Sandy Patch and Diani, massive Porites bommies at the Mombasa Marine Park snorkel site, tabulate Acropora at Dolphin Point, and knobby Galaxea carpets cover Coral Garden and Kisite site 4.
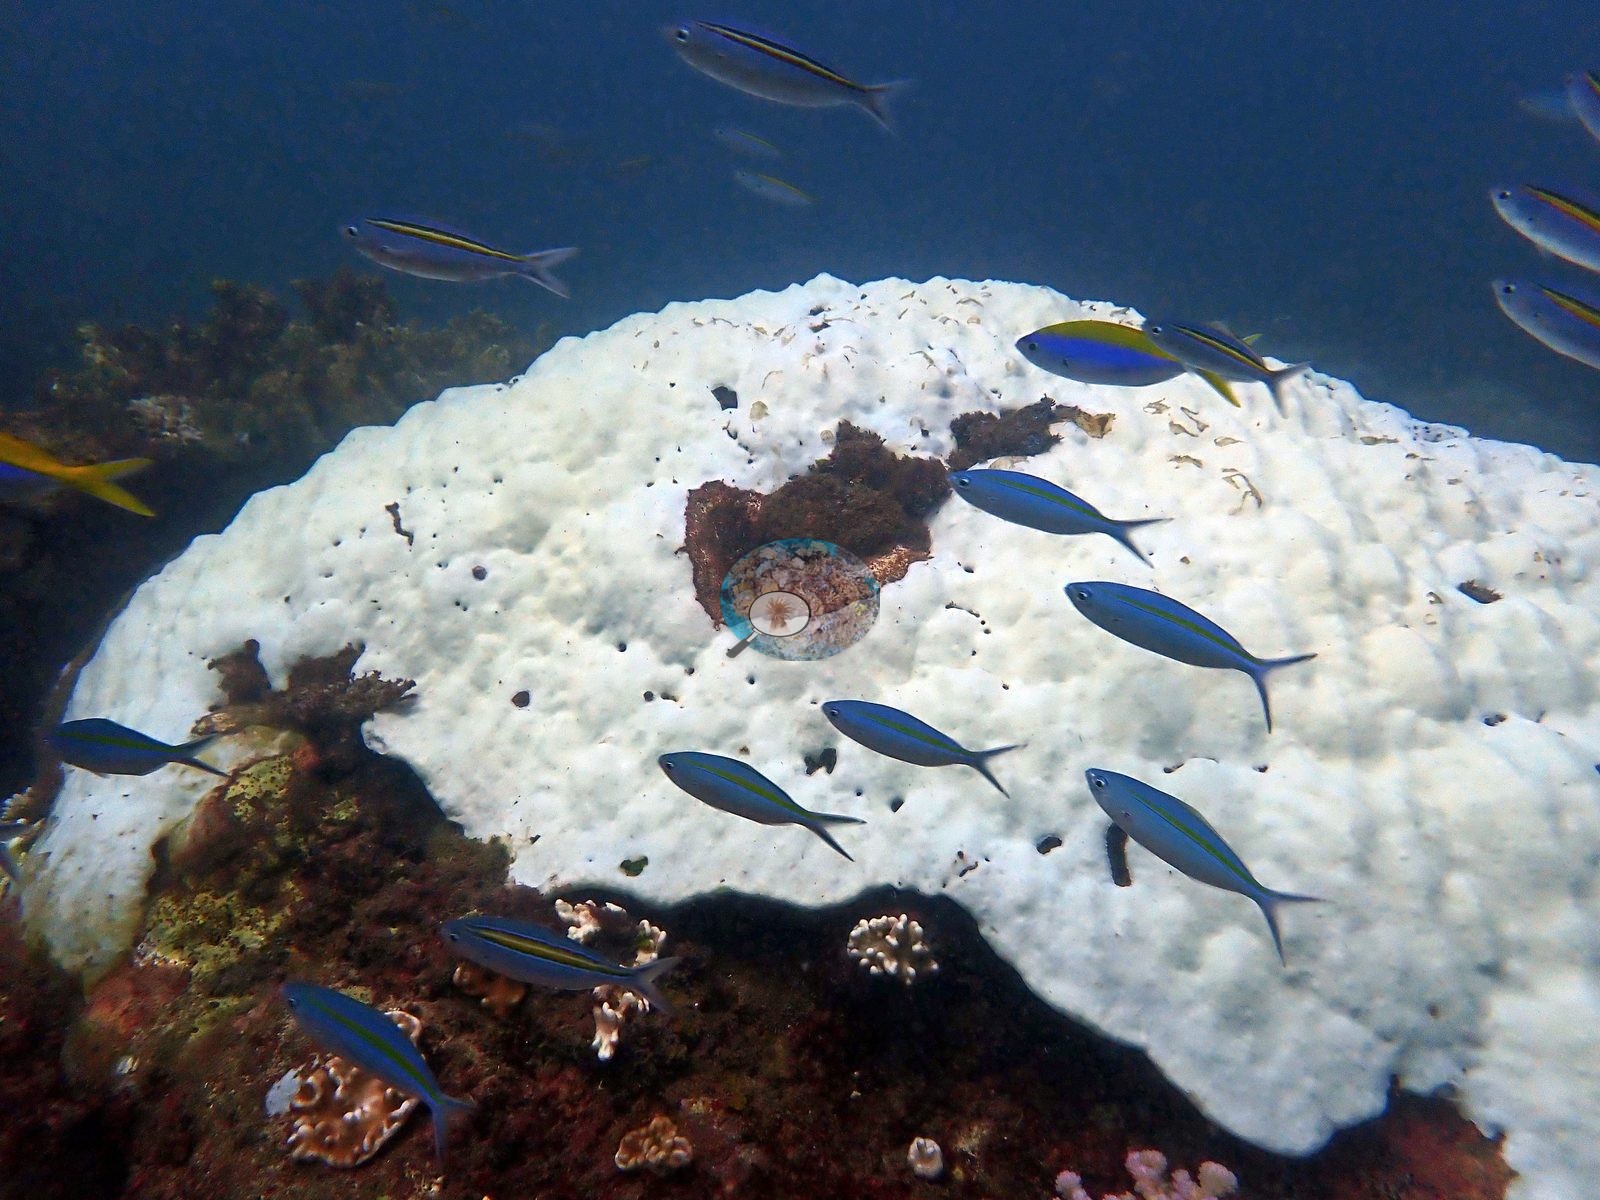
Published hard coral cover at the 20 scored sites ranged from 12.8% at Chipopo, a restoration site, to 55.0% at Coral Garden in Kisite, which is wall-to-wall coral in clear blue water. The share of hard coral tissue bleached ranged from 45.4% at Sandy Patch and 46.6% at Brain Coral, both in Mombasa, to 95.3% at North Canyon and 95.4% at Ocean Trust Nursery. Six of the nine Kilifi, Watamu, and Pate sites exceeded 80%. Bofa carries the unit's only Coral Health Index, 2.25, just below the 2.5 average.
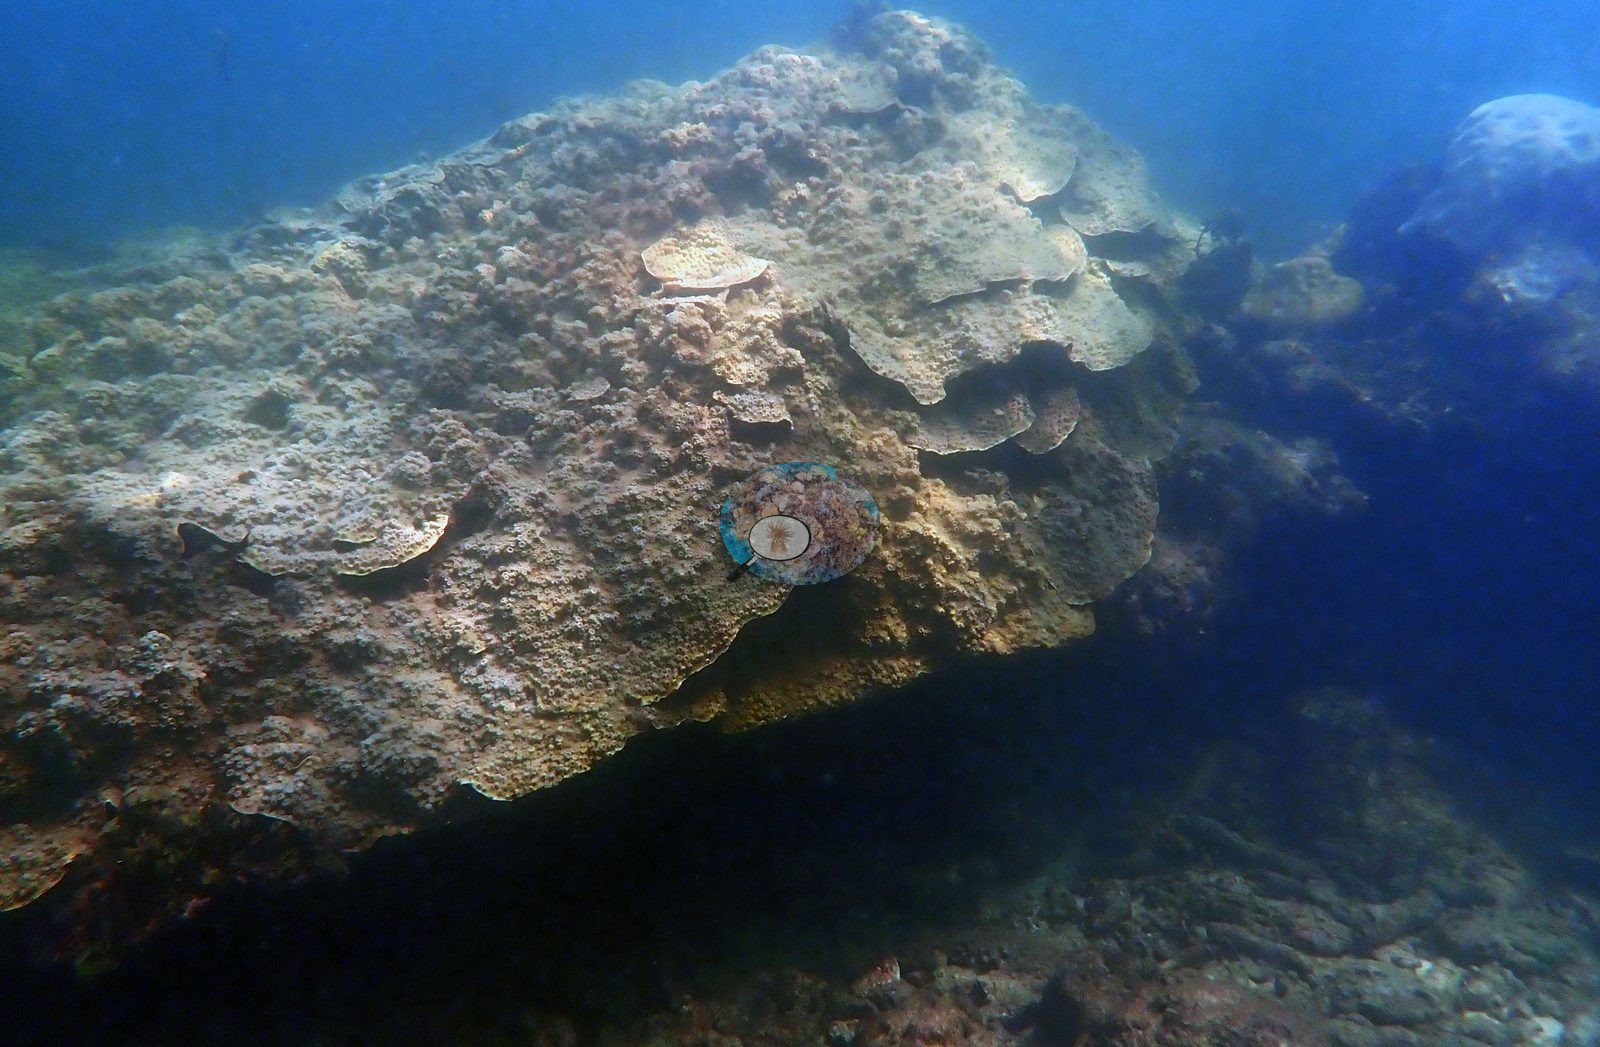
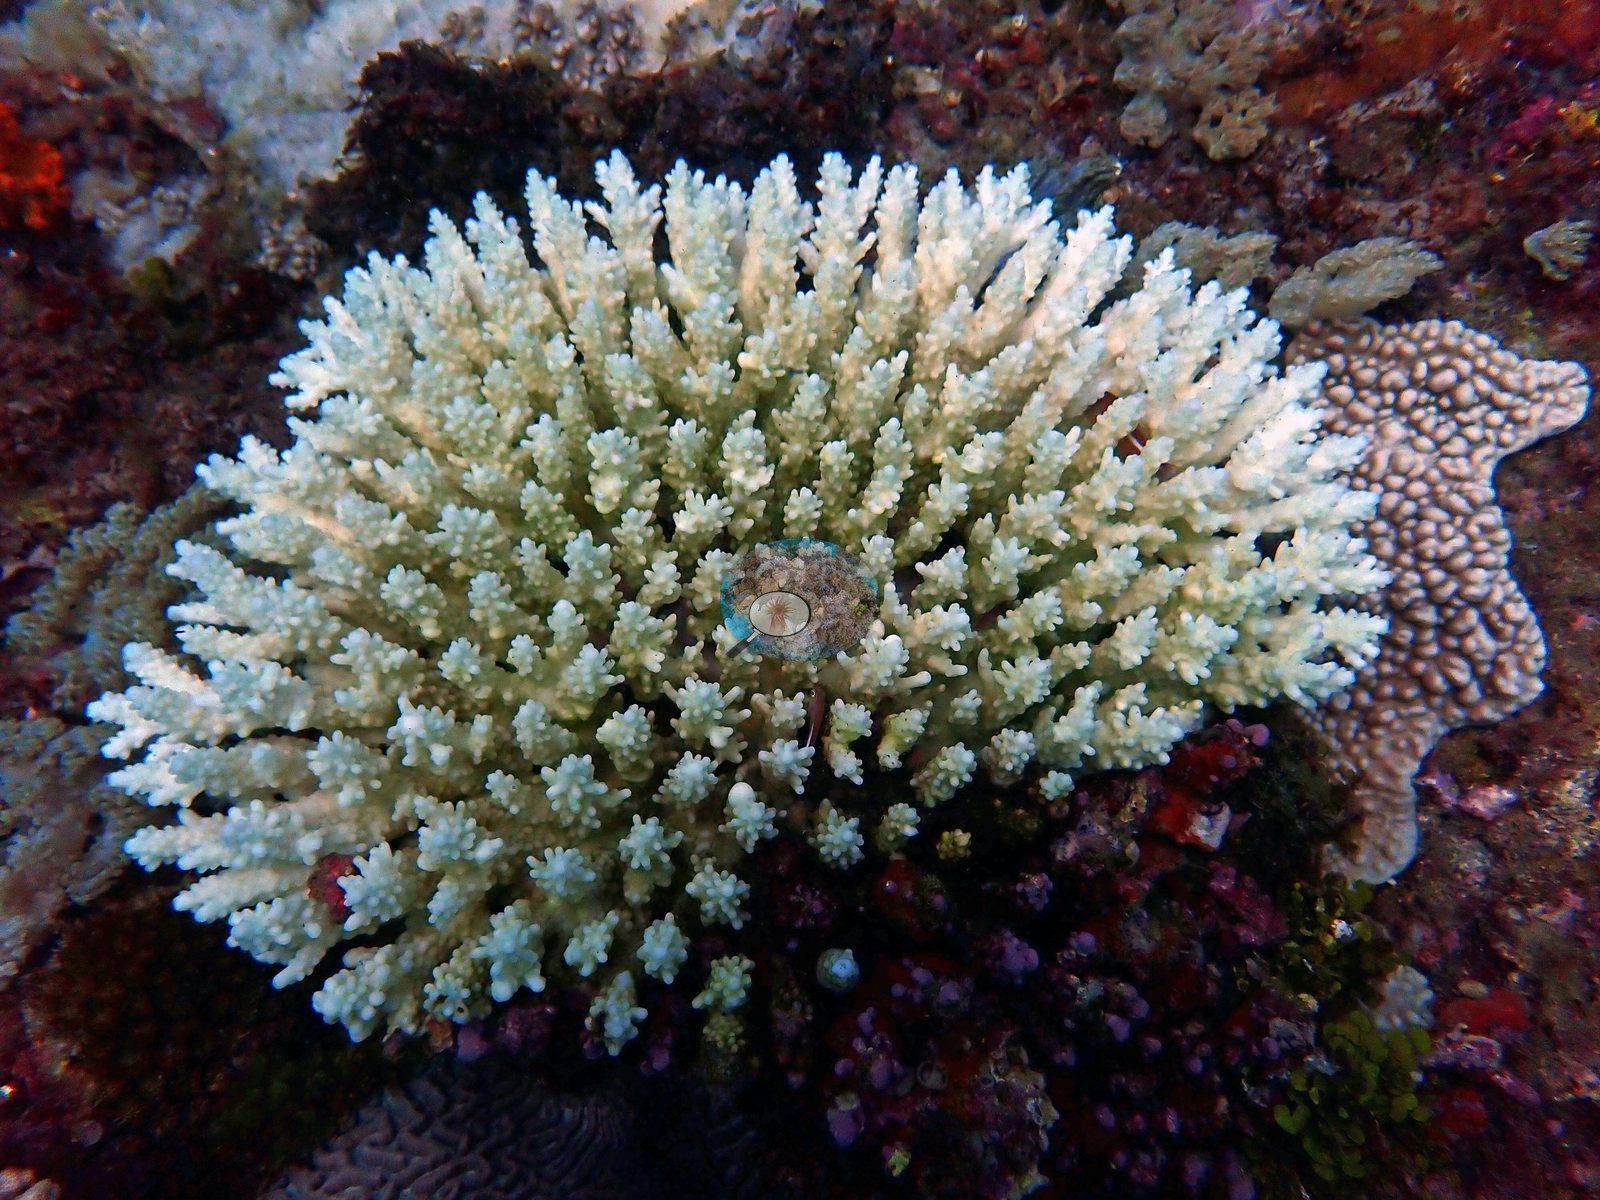
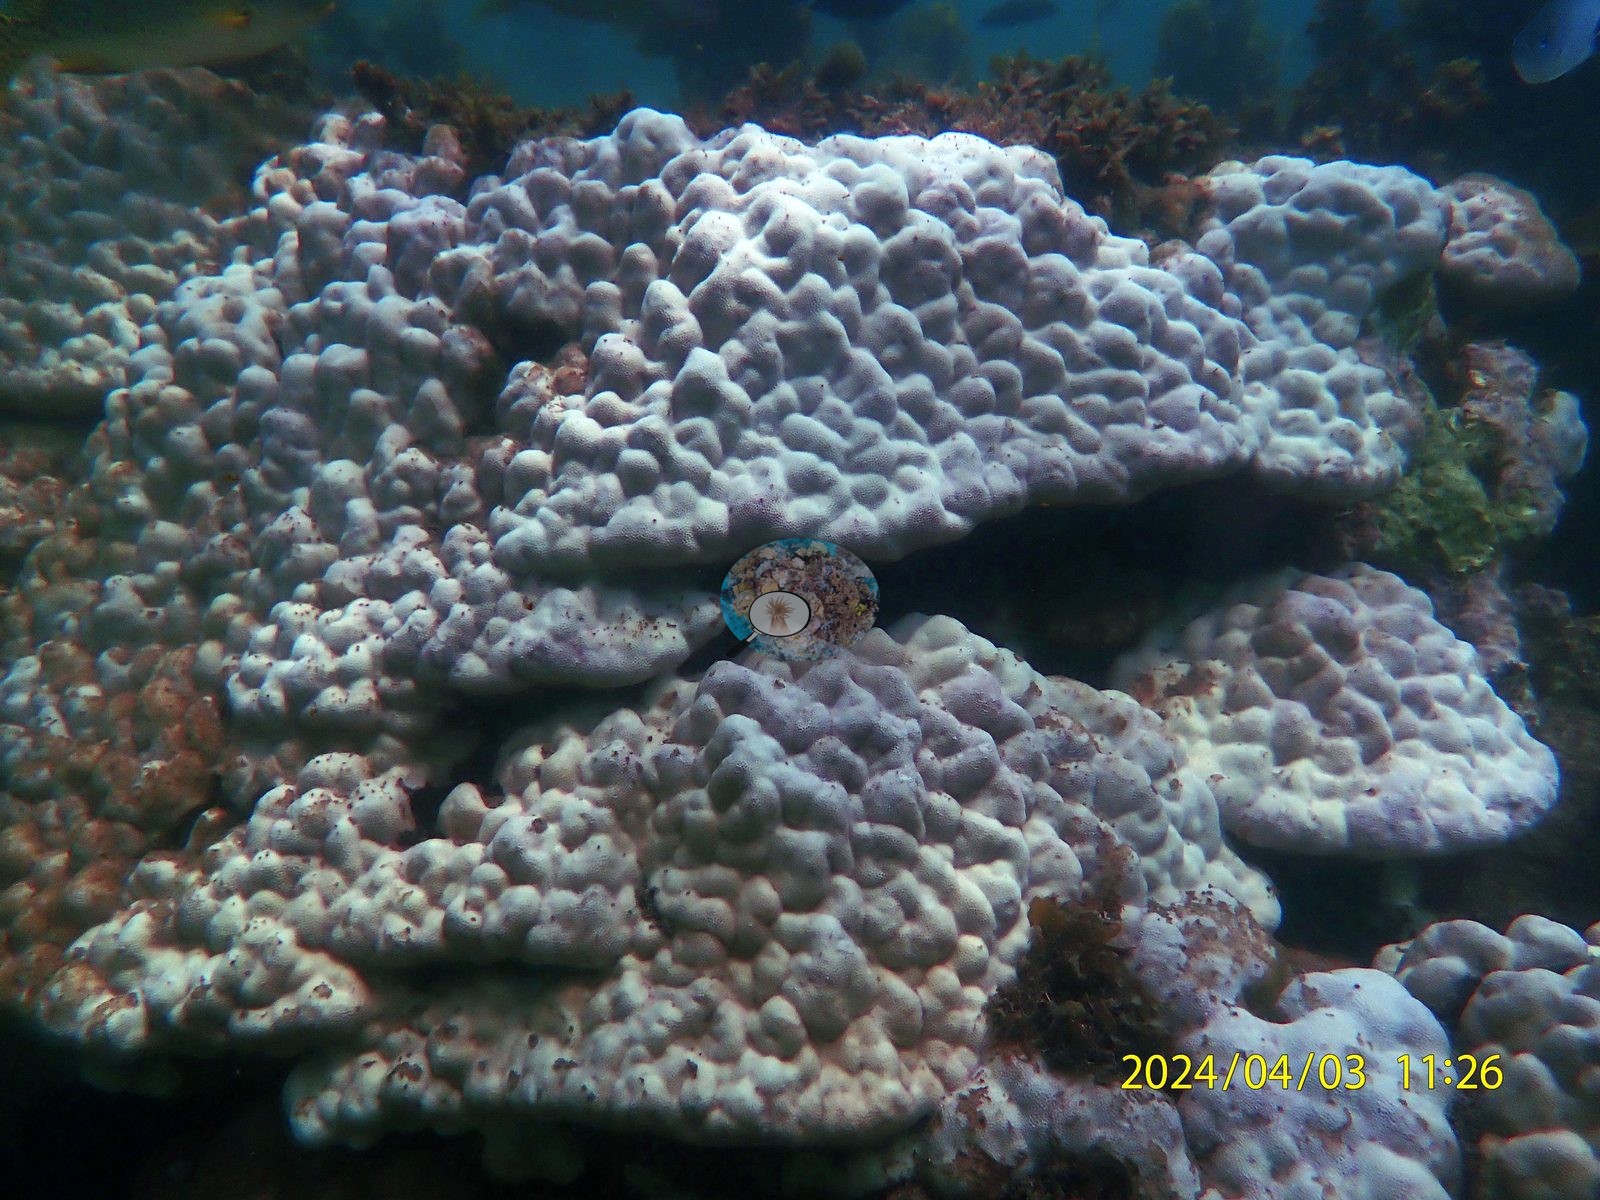
No single growth form was consistently spared. At Outer Kisite the branching Acropora thickets took the damage while massive Porites hillsides and plate terraces held pigment. At Bofa, Round Reef, and Uyombo the massive and brain corals were among the most completely bleached, and Turbinaria plates were the survivors at Bofa, Kilifi Bay, and Lower Mpunguti site 1. The Galaxea carpet held its color at Coral Garden but went white as a snowfield at Kisite site 4. Pink, mauve, violet, and chartreuse stress coloration recurred at Uyombo, North Canyon, and Kilifi Bay. Restoration stock was mixed, with pigmented and white fragments side by side on the same structures.
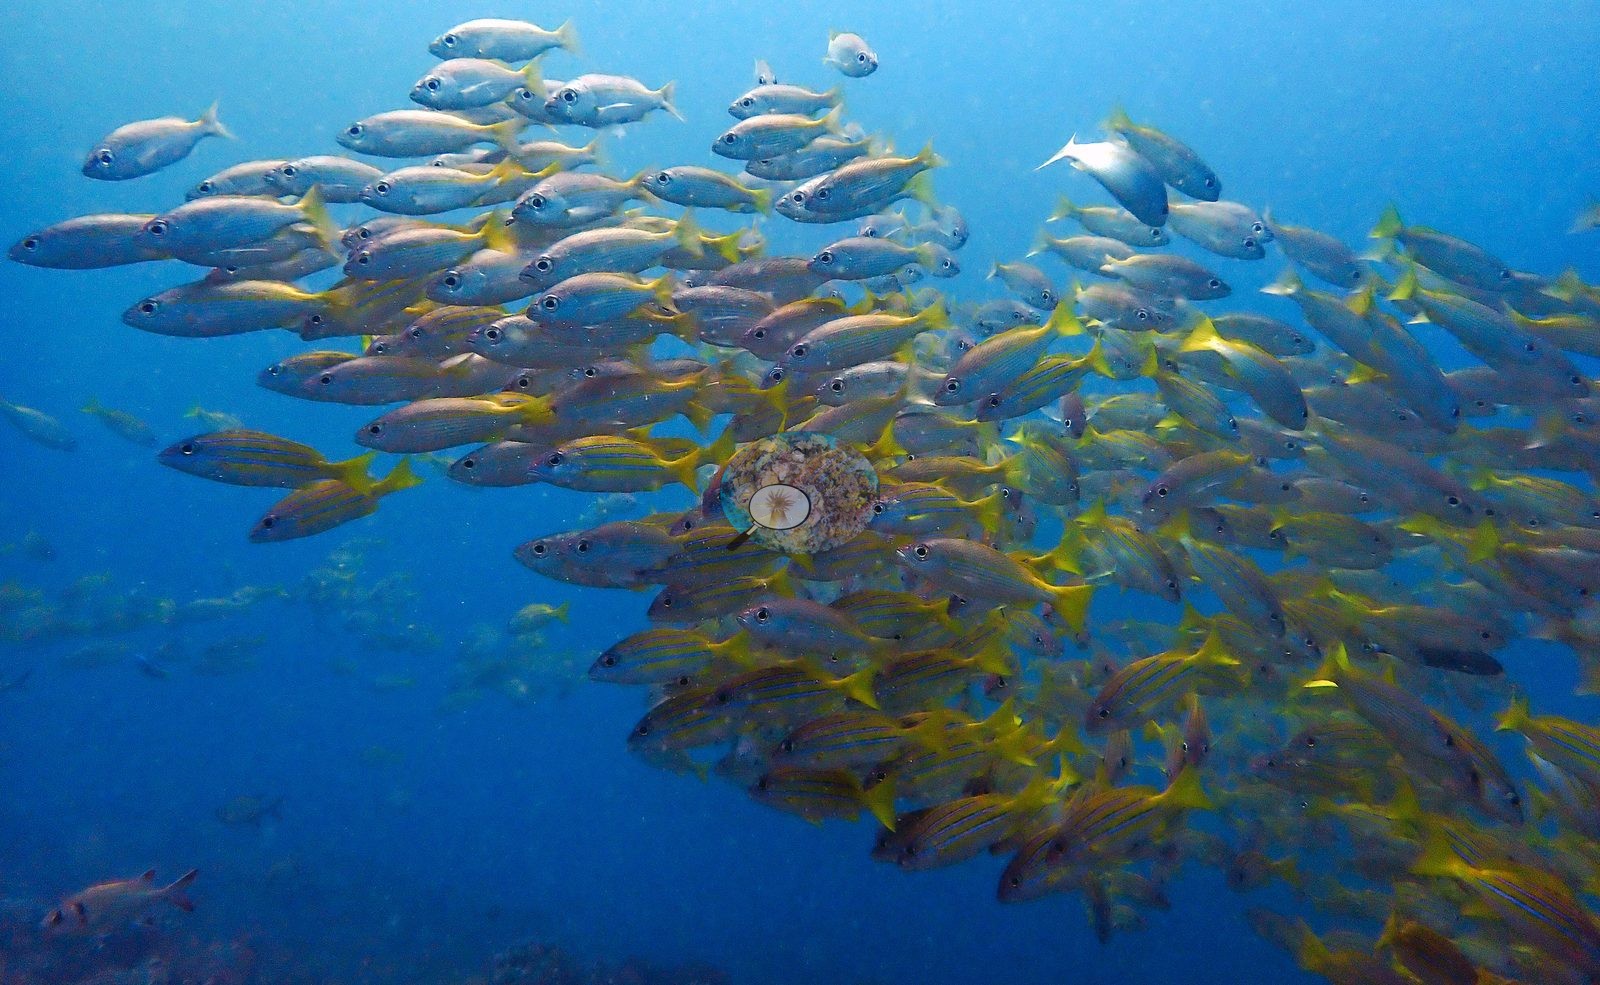
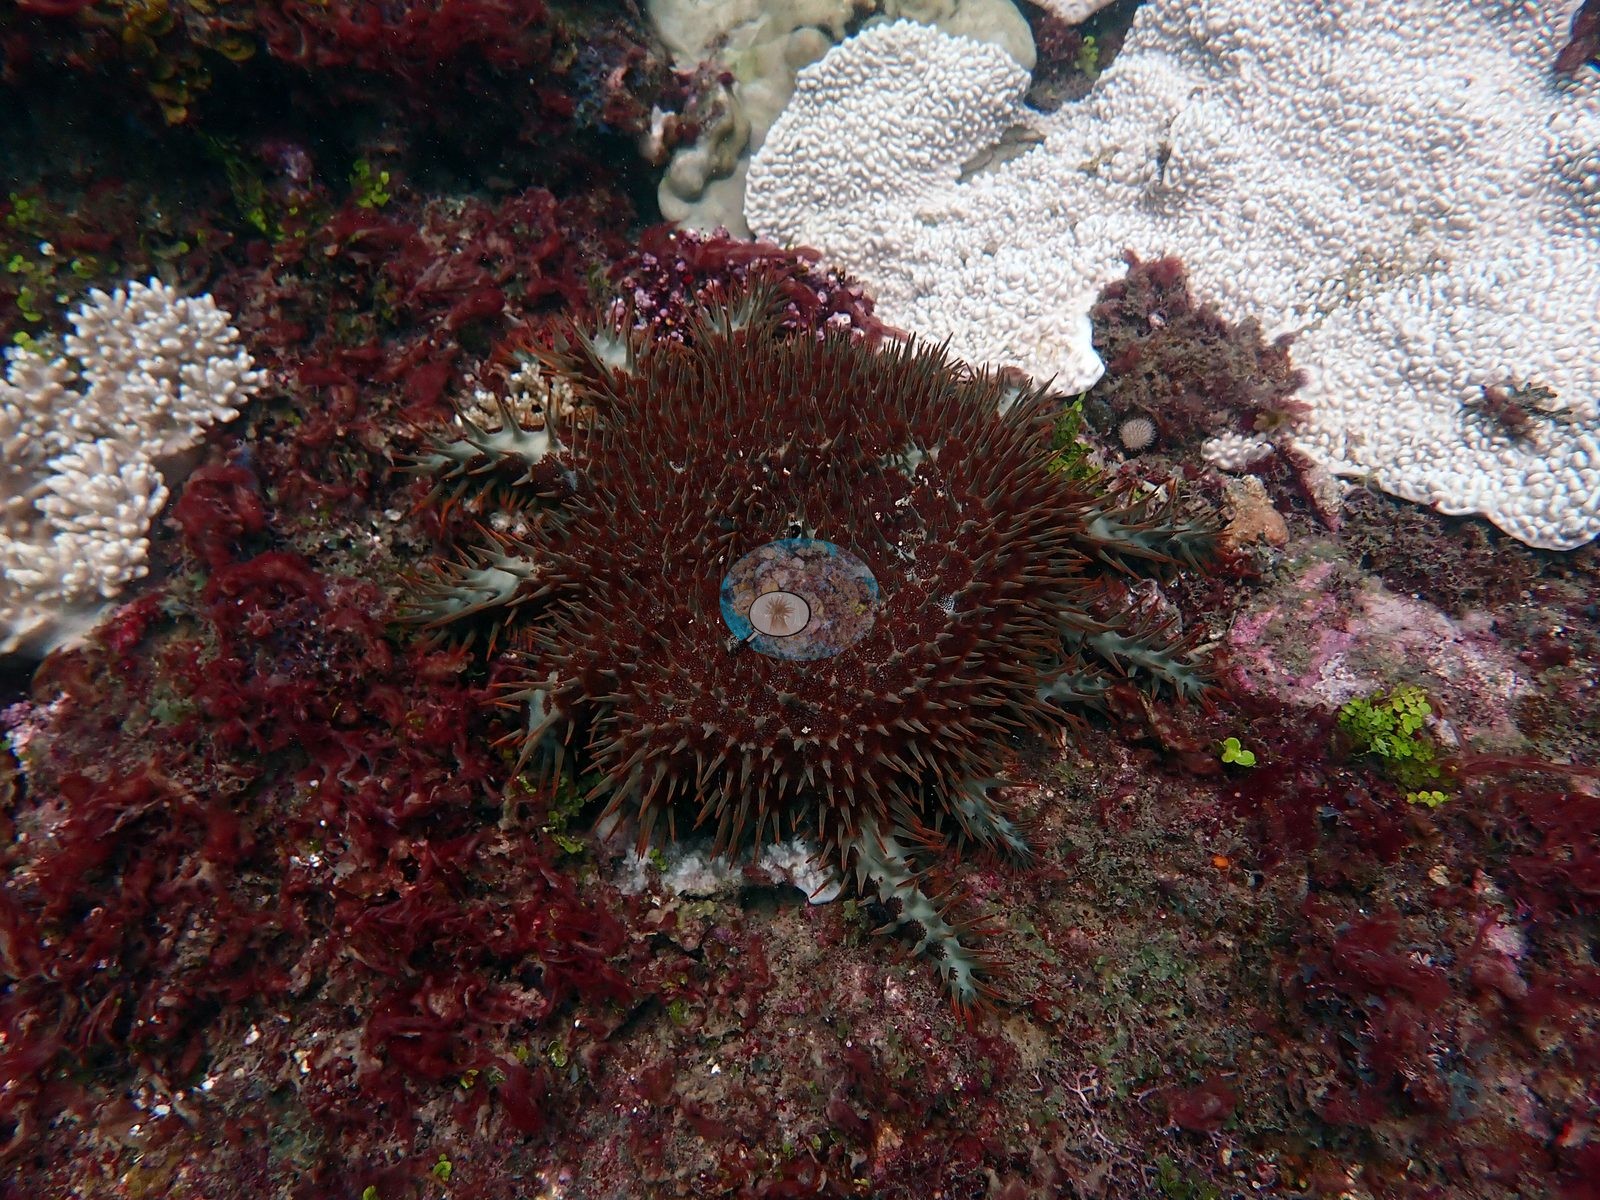
Crown-of-thorns predation was concentrated at Bofa, where at least nine individuals were found on already-bleached coral, with single or paired sightings at three other sites. Turtles, a trumpetfish aggregation, and a Spanish dancer on the Shimoni night dive stand out among the fauna.
Highlights
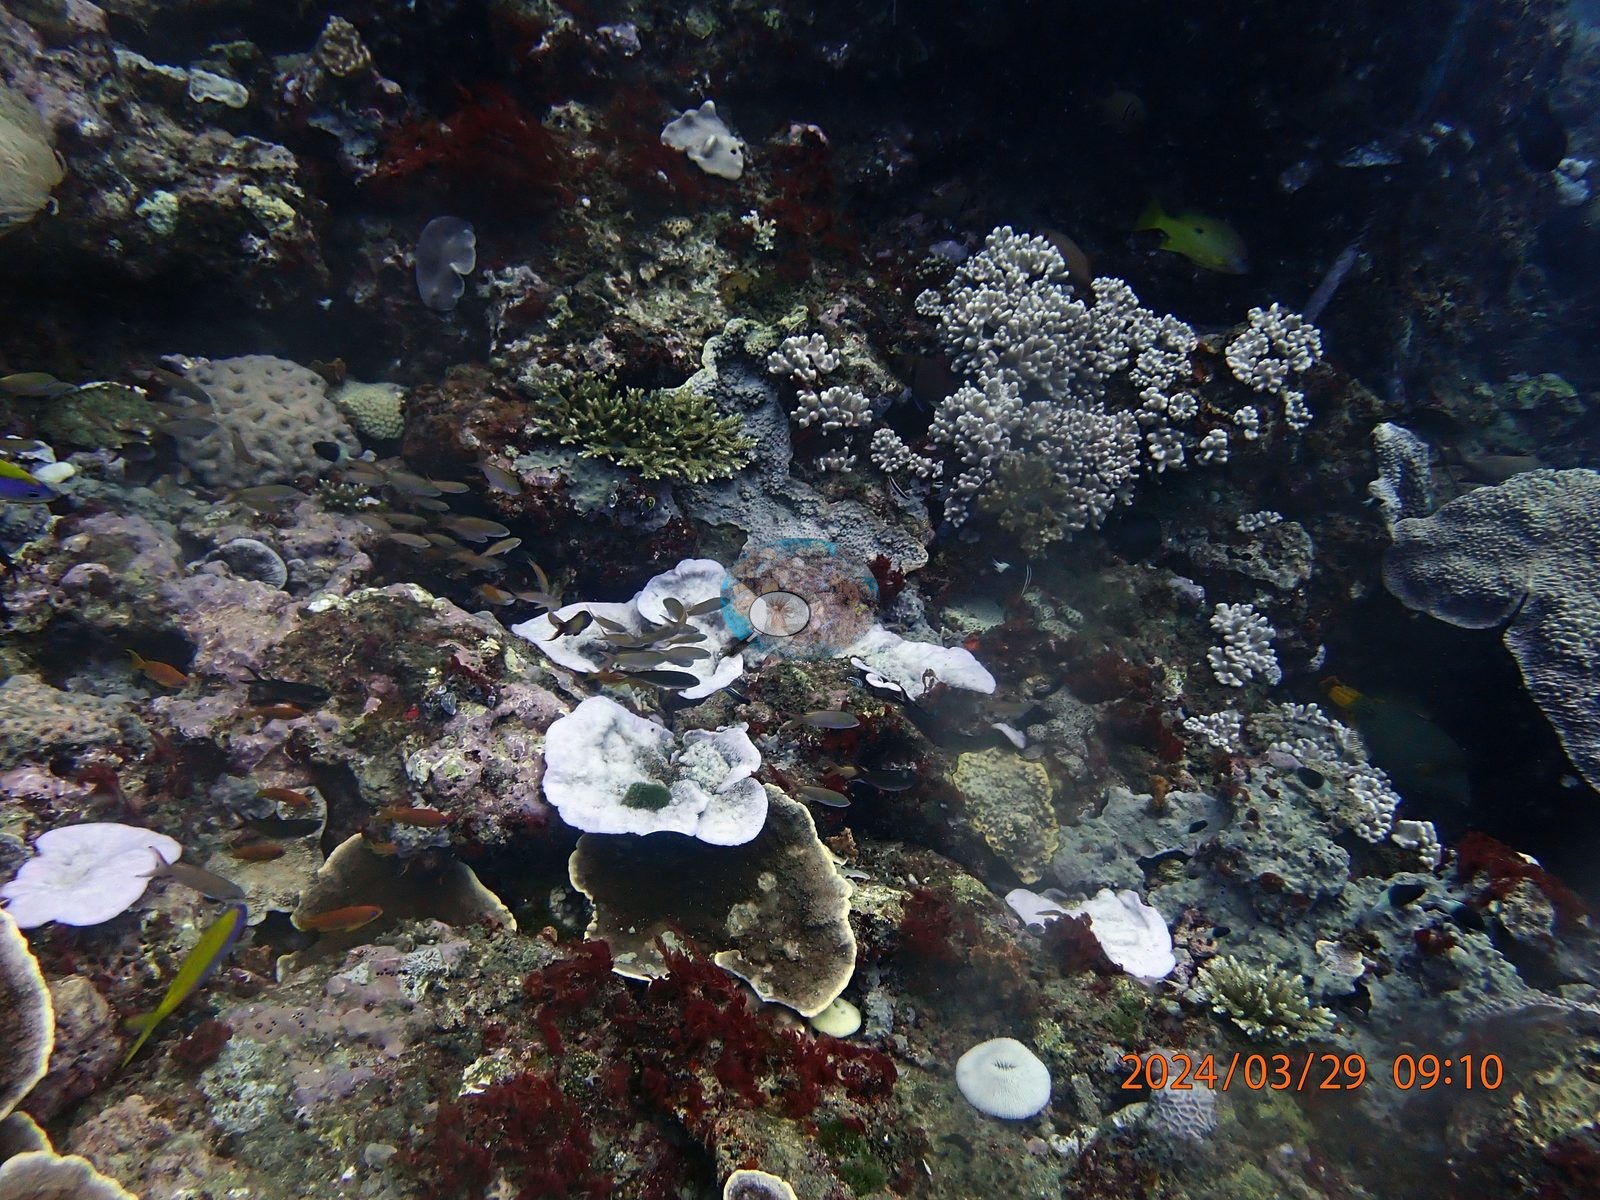
- Coral Garden (Kisite) had the highest cover of the 20 scored sites, 55.0%, with 58.9% of tissue bleached.
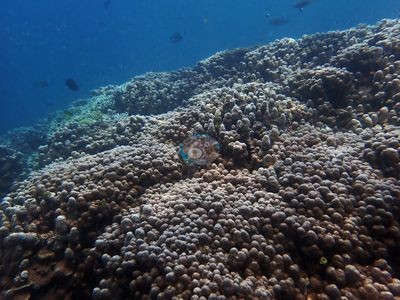 photo: Kenya - Coral Garden (Kisite National Park)
 - Bleaching ranged from 45.4% of tissue at Sandy Patch to 95.4% at Ocean Trust Nursery.
- Bofa recorded at least nine crown-of-thorns starfish, repeatedly on already-bleached coral.
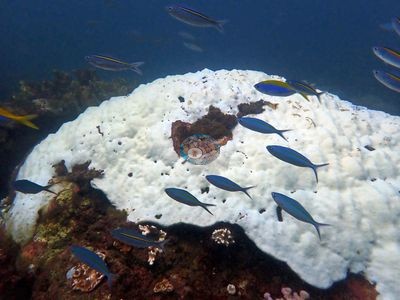 photo: Kenya - Bofa (Kilifi)
 - Which growth forms held pigment differed from site to site; no group was reliably spared.
- Four restoration sites document mixed outcomes for nursery and outplanted stock.
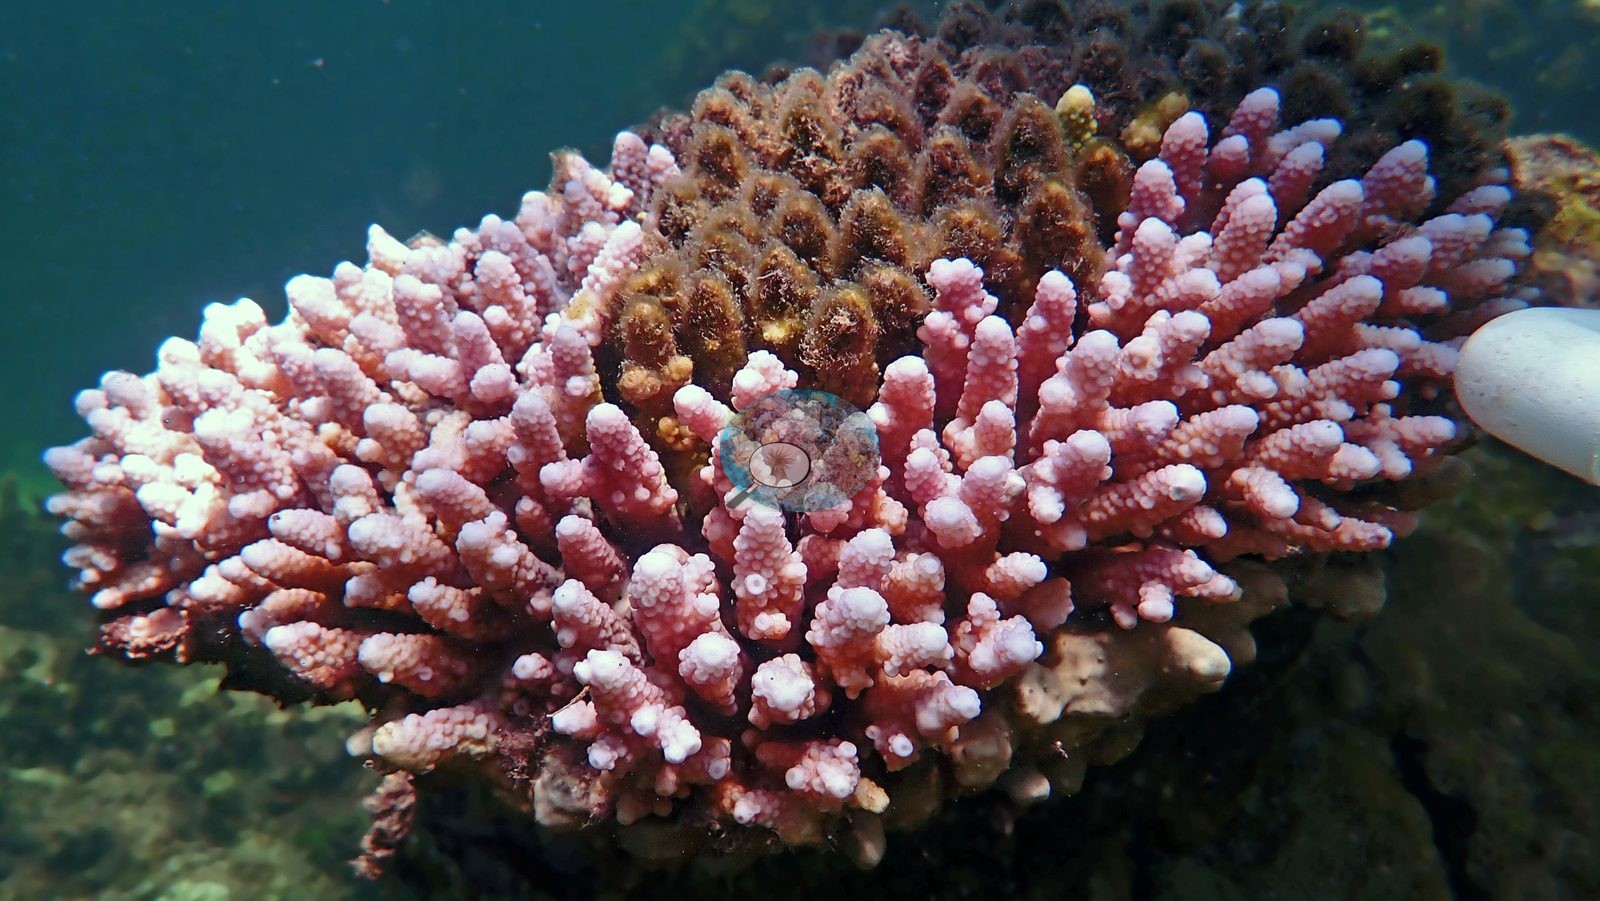
- Round Reef (Watamu): a 15-quadrat transect caught fully pigmented Acropora beside bone-white colonies of the same growth form.
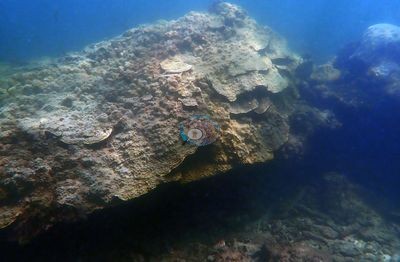 photo: Kenya - Round Reef (Watamu)
Hii ni tafsiri ya mashine ya muhtasari wa Kiingereza; maandishi ya Kiingereza ndiyo toleo rasmi linalotegemewa. AI translation of this summary; the English is authoritative.
Regional setting
Miamba ya matumbawe ya Kenya kwa kiasi kikubwa ni miamba ya pwani (fringing reefs), aina inayotawala kando ya pwani ya bara la Afrika Mashariki (Spalding et al. 2001). Kusini mwa Malindi, uwanda mwembamba wa pwani una nyuma yake majukwaa ya miamba ya enzi ya Pleistocene yaliyoinuka juu ya jukwaa la sasa la eneo la maji kujaa na kupwa, na rafu ya bara inaenea takriban 5 km tu kutoka pwani; kaskazini mwa Malindi inapanuka hadi takriban 60 km. Miamba ya pwani imestawi zaidi upande wa kusini. Kaskazini zaidi, mashapo yaliyolegea na maji yasiyo ya chumvi kutoka mito ya Athi-Galana-Sabaki na Tana huzuia ukuaji wa miamba, ingawa miamba ya pwani ipo kuzunguka visiwa vya Lamu na kando ya mnyororo wa takriban visiwa 50 vya kizuizi vya chokaa karibu na Kiunga. Bioanuwai pia huwa kubwa zaidi upande wa kusini, na matumbawe yaliyorekodiwa nchini Kenya yanafikia takriban jenasi 55 na hadi spishi 200. Kabla ya 1998, matumbawe hai kwa kawaida yalifunika takriban 30% ya sakafu ngumu, yakichanganyika na maeneo ya nyasi bahari na mwani. Mwaka 1998, 50–90% ya matumbawe yalionekana kupauka na mengi yalikufa, na matumbawe laini (soft corals) yaliathirika hata zaidi. Hifadhi za kwanza za bahari za Kenya, huko Malindi na Watamu, zilianzishwa mwaka 1968, zikifuatiwa na Kisite na Mpunguti mwaka 1978, Mombasa mwaka 1986, na hifadhi ya Diani mwaka 1993, na ulinzi umeleta samaki wengi zaidi, bioanuwai kubwa zaidi, na kiwango cha juu zaidi cha matumbawe hai. Spalding et al. (2001) wanakadiria takriban 630 km² za miamba ya matumbawe kwa Kenya, na Souter et al. (2021) wanakadiria eneo lote la Bahari ya Hindi Magharibi (Western Indian Ocean) kuwa takriban 15,180 km², karibu 6% ya jumla ya dunia.
Kwa mujibu wa muhtasari wa Wilkinson (2006) wa ripoti ya hali ya miamba ya mwaka 2004, urejeaji wa matumbawe Afrika Mashariki baada ya 1998 ulikuwa mkubwa lakini haukuwa sawa kila mahali, na ulikuwa bora zaidi kwenye miamba iliyosimamiwa vizuri. Ripoti hiyo ilitaja ongezeko la idadi ya watu wa pwani, pamoja na uchafuzi kutoka nchi kavu na shinikizo linaloongezeka la uvuvi, kuwa tishio kubwa zaidi, na iliorodhesha Kenya pamoja na Tanzania na Great Barrier Reef kama maeneo yenye msongamano mkubwa zaidi wa hivi karibuni wa nyota wa bahari aina ya crown-of-thorns. Souter et al. (2021) wanatambua 1998 na 2016 kuwa matukio mawili ya kupauka kwa matumbawe yaliyoenea kanda nzima ya Bahari ya Hindi Magharibi, pamoja na matukio madogo mwaka 2005, 2007, na 2010 yaliyoingiliana na uvuvi na mikazo mingine ya kienyeji. Baada ya tukio la 2016, tafiti za sayansi ya wananchi (citizen science) ziligundua kwamba eneo moja kati ya matano lilikuwa limepoteza zaidi ya nusu ya matumbawe yake. Tafiti nyingine zilizochapishwa zinazonukuliwa katika ripoti hiyo zinaonyesha vifo vya 45–70% mwaka 1998, na baada ya hapo kiwango cha matumbawe hakikurudi tena katika kiwango chake cha awali.
Overview
Pini 21 za Kenya zinatokana na utafiti wa Anderson wa Machi-Aprili 2024 wakati wa tukio la kupauka kwa matumbawe kwa wingi (mass bleaching) katika Bahari ya Hindi Magharibi. Zinaanzia Mombasa Marine Park kuelekea kusini kupitia Diani na mfereji wa Shimoni-Wasini hadi Kisite-Mpunguti, na kaskazini kupitia Kilifi na Watamu hadi Kisiwa cha Pate (Pate Island) katika funguvisiwa la Lamu. Nyingi ni za kina kifupi, kati ya 0.5 m na 15 m: tambarare za miamba ya pwani, matuta ya sakafu ngumu, maeneo ya bommie (vichuguu vya matumbawe), na maeneo manne ya urejeshaji (kitalu cha REEFolution huko Shimoni na vitalu vitatu huko Pate). Jamii ya matumbawe yanayojenga miamba hubadilika kando ya pwani. Mabamba yenye umbo la majani na tabaka ya aina ya Turbinaria, Montipora, na Echinopora yanatawala Sandy Patch na Diani, bommie kubwa za Porites zinatawala eneo la snorkel la Mombasa Marine Park, Acropora yenye umbo la meza inatawala Dolphin Point, na mazulia ya Galaxea yenye vifundo yanafunika Coral Garden na Kisite site 4.
Kiwango cha matumbawe magumu kilichochapishwa kilianzia 12.8% huko Chipopo, eneo la urejeshaji, hadi 55.0% katika Coral Garden huko Kisite, ambayo imejaa matumbawe kila upande katika maji safi ya buluu. Sehemu ya tishu za matumbawe magumu iliyopauka ilianzia 45.4% huko Sandy Patch na 46.6% huko Brain Coral, zote mbili Mombasa, hadi 95.3% huko North Canyon na 95.4% huko Ocean Trust Nursery. Maeneo mengi ya Kilifi, Watamu, na Pate yalizidi 80%.
Hakuna umbo moja la ukuaji lililonusurika kila mara. Huko Outer Kisite, vichaka vya Acropora vyenye matawi ndivyo vilivyopata madhara, huku miteremko ya Porites mikubwa na matuta ya mabamba yakibaki na rangi. Huko Bofa, Round Reef, na Uyombo, matumbawe makubwa (massive) na matumbawe ya ubongo (brain corals) yalikuwa miongoni mwa yaliyopauka kabisa zaidi, na mabamba ya Turbinaria ndiyo yaliyonusurika huko Bofa, Kilifi Bay, na Lower Mpunguti site 1. Zulia la Galaxea lilidumisha rangi yake katika Coral Garden lakini likawa jeupe kama uwanja wa theluji huko Kisite site 4. Rangi za msongo za waridi, zambarau hafifu, urujuani, na kijani-manjano zilijitokeza tena na tena huko Uyombo, North Canyon, na Kilifi Bay. Hali ya matumbawe ya urejeshaji ilikuwa mchanganyiko, vipande vyenye rangi na vyeupe vikiwa kando kwa kando kwenye miundo ile ile.
Uwindaji wa nyota wa bahari aina ya crown-of-thorns ulijikita huko Bofa, ambako angalau nyota tisa walipatikana juu ya matumbawe yaliyokwisha kupauka, na walionekana mmoja mmoja au wawili wawili katika maeneo mengine matatu. Kasa, kundi la samaki trumpetfish, na Spanish dancer (koa wa bahari) katika uzamiaji wa usiku huko Shimoni wanajitokeza miongoni mwa wanyama.
Highlights
- Coral Garden (Kisite) ilikuwa miamba tajiri zaidi iliyofanyiwa utafiti, ikiwa na kiwango cha matumbawe cha 55.0% na 58.9% ya tishu iliyopauka.
 photo: Kenya - Coral Garden (Kisite National Park)
 - Kupauka kulianzia 45.4% ya tishu huko Sandy Patch hadi 95.4% huko Ocean Trust Nursery.
- Bofa ilirekodi angalau nyota wa bahari tisa aina ya crown-of-thorns, mara kwa mara wakiwa juu ya matumbawe yaliyokwisha kupauka.
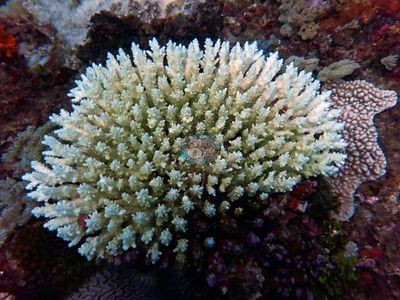 photo: Kenya - Bofa (Kilifi)
 - Maumbo ya ukuaji yaliyobaki na rangi yalitofautiana kutoka eneo moja hadi jingine; hakuna kundi lililonusurika kwa uhakika.
- Maeneo manne ya urejeshaji yanaonyesha matokeo mchanganyiko kwa matumbawe ya vitalu na yale yaliyopandikizwa.
Notable observations (21)
- Kenya - Sandy Patch/Point (Mombasa): Bleaching: 45.4% of hard coral tissue bleached (published, March-April 2024)
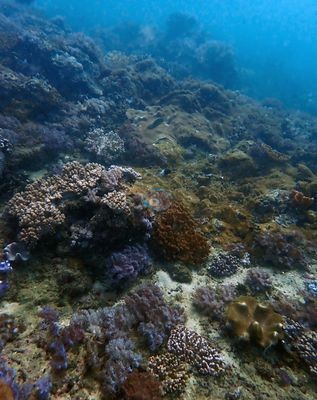
- Kenya - Brain Coral (Mombasa): Bleaching: 46.6% of hard coral tissue bleached (published, March-April 2024)
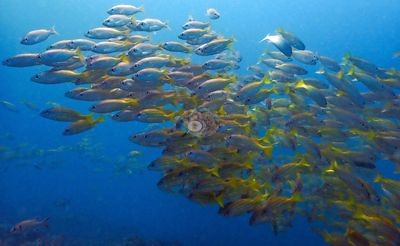
- Kenya - MMP snorkel site (Mombasa): crown-of-thorns starfish (COTS): two crown-of-thorns starfish photographed on one tabular Acropora, not repeated elsewhere; Bleaching: 89.9% of hard coral tissue bleached (published, March-April 2024)
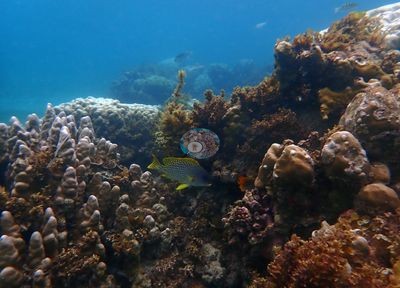
- Kenya - Diani Beach (Diani): Bleaching: 75.4% of hard coral tissue bleached (published, March-April 2024)
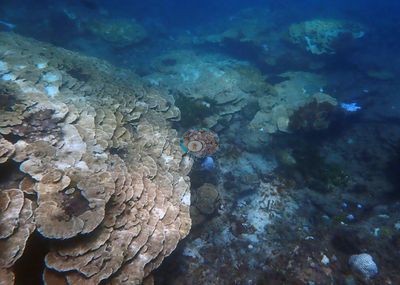
- Kenya - Reefolution nursery (Shimoni-Wasini): Bleaching: 72.7% of hard coral tissue bleached (published, March-April 2024)
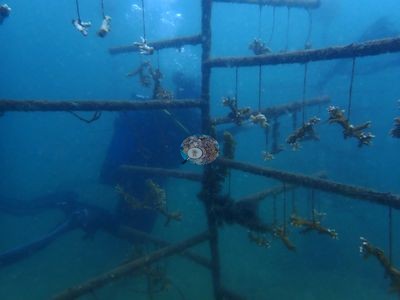
- Kenya - Coral Garden (Kisite National Park): Bleaching: 58.9% of hard coral tissue bleached (published, March-April 2024)
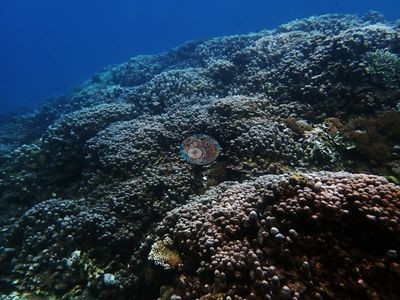
- Kenya - Outer Kisite (Kisite National Park): Bleaching: 66.2% of hard coral tissue bleached (published, March-April 2024)
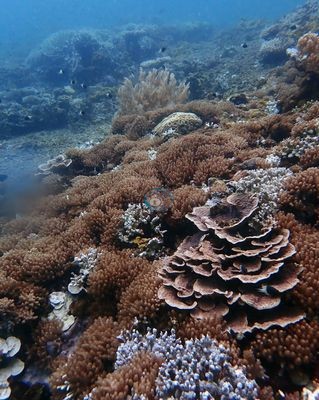
- Kenya - Dolphin Point (Kisite National Park): Bleaching: 61.9% of hard coral tissue bleached (published, March-April 2024)
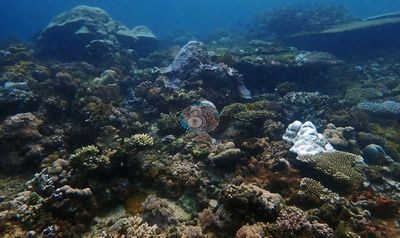
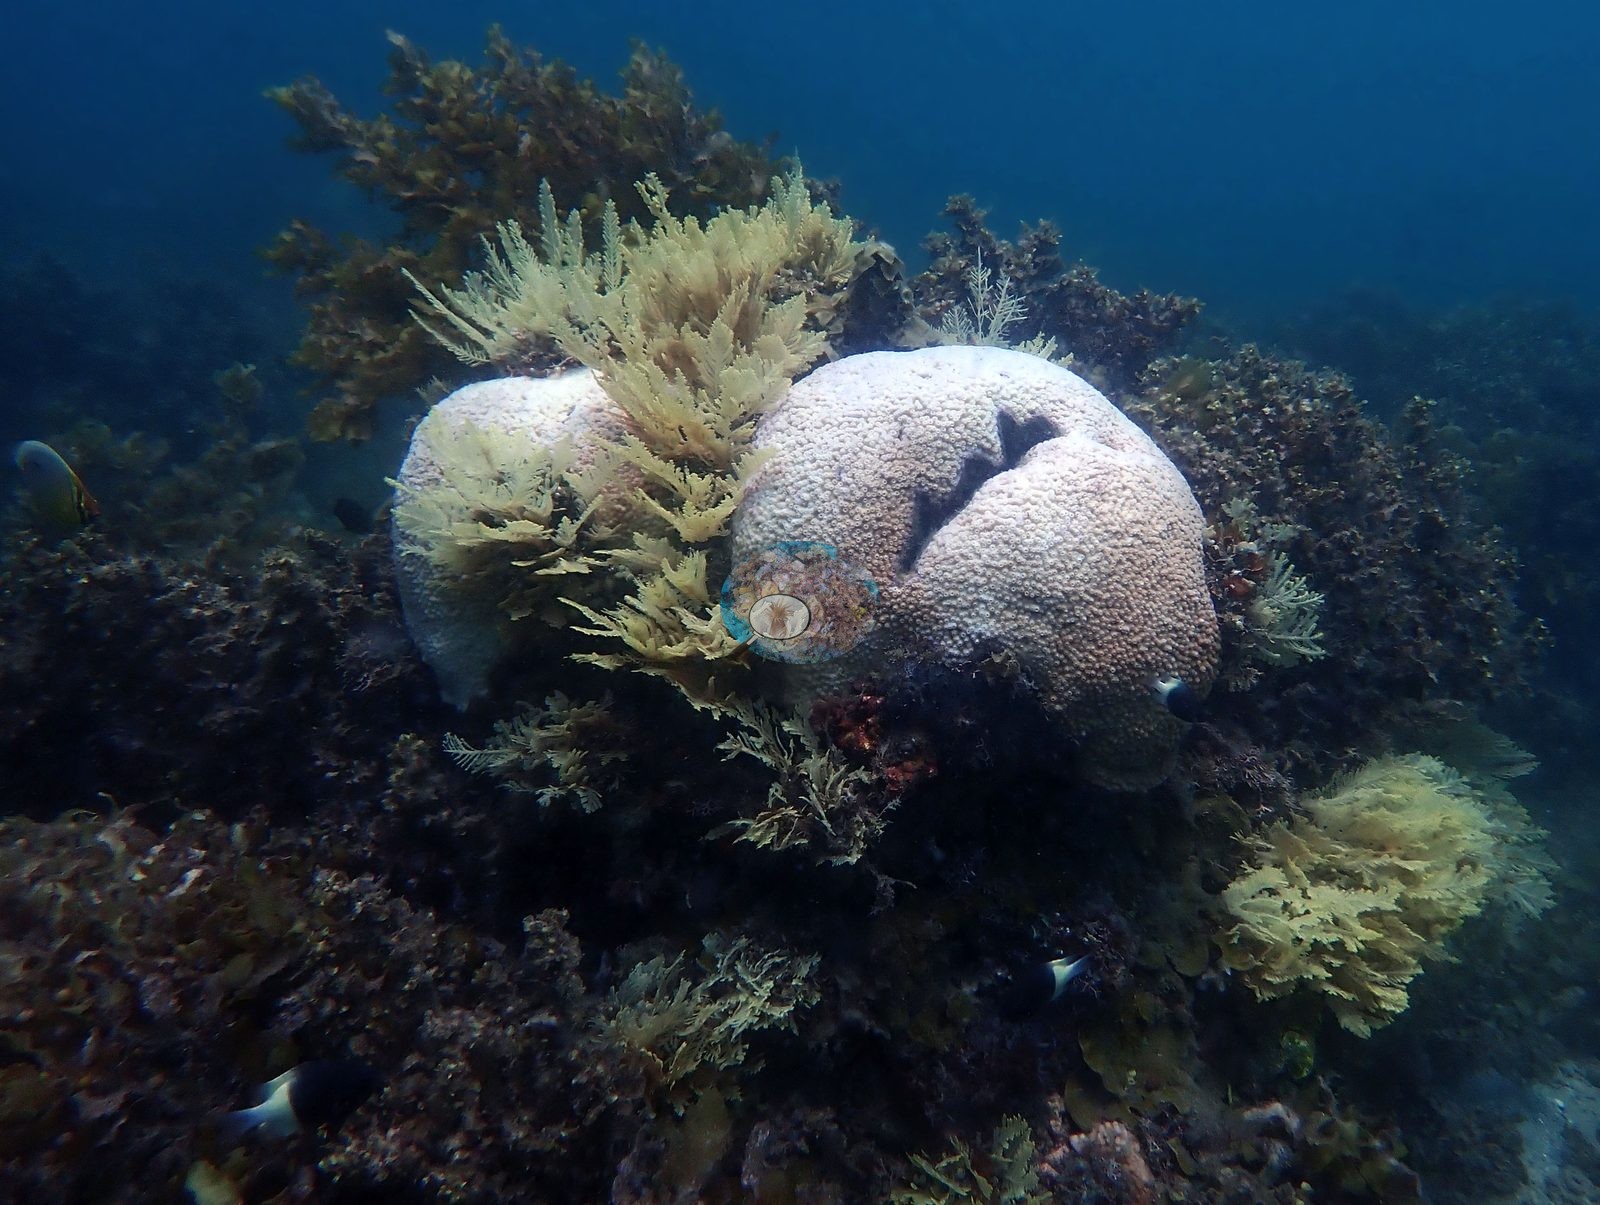
- Kenya - Kisite National Park-site 4 (Kisite National Park): COTS: a crown-of-thorns starfish photographed directly on bleached coral (from the wider photo set, not the published frames); Bleaching: 89.2% of hard coral tissue bleached (published, March-April 2024); a bleached Platygyra dome with dead eroded depressions opening
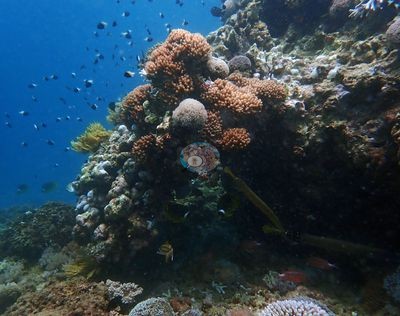
- Kenya - Lower Mpunguti-site 1 (Kisite National Park): Bleaching: 79.7% of hard coral tissue bleached (published, March-April 2024)
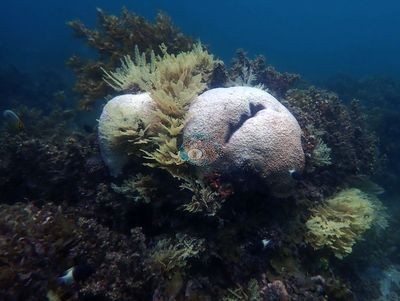
- Kenya - Lower Mpunguti-site 2 (Kisite National Park): Bleaching: 81.9% of hard coral tissue bleached (published, March-April 2024)
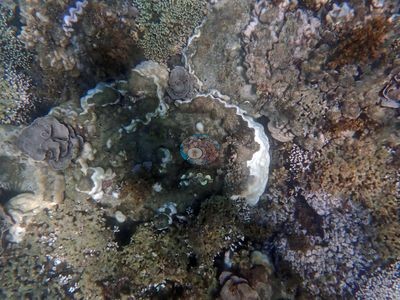
- Kenya - Kilifi Bay (Kilifi): COTS: one crown-of-thorns starfish across 131 photographs, reported feeding on bleached branching coral (from the wider photo set); Bleaching: 87.0% of hard coral tissue bleached (published, March-April 2024); one bleached dome already eroded and colonized (mortality)
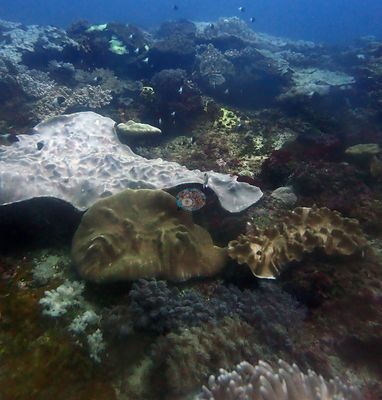
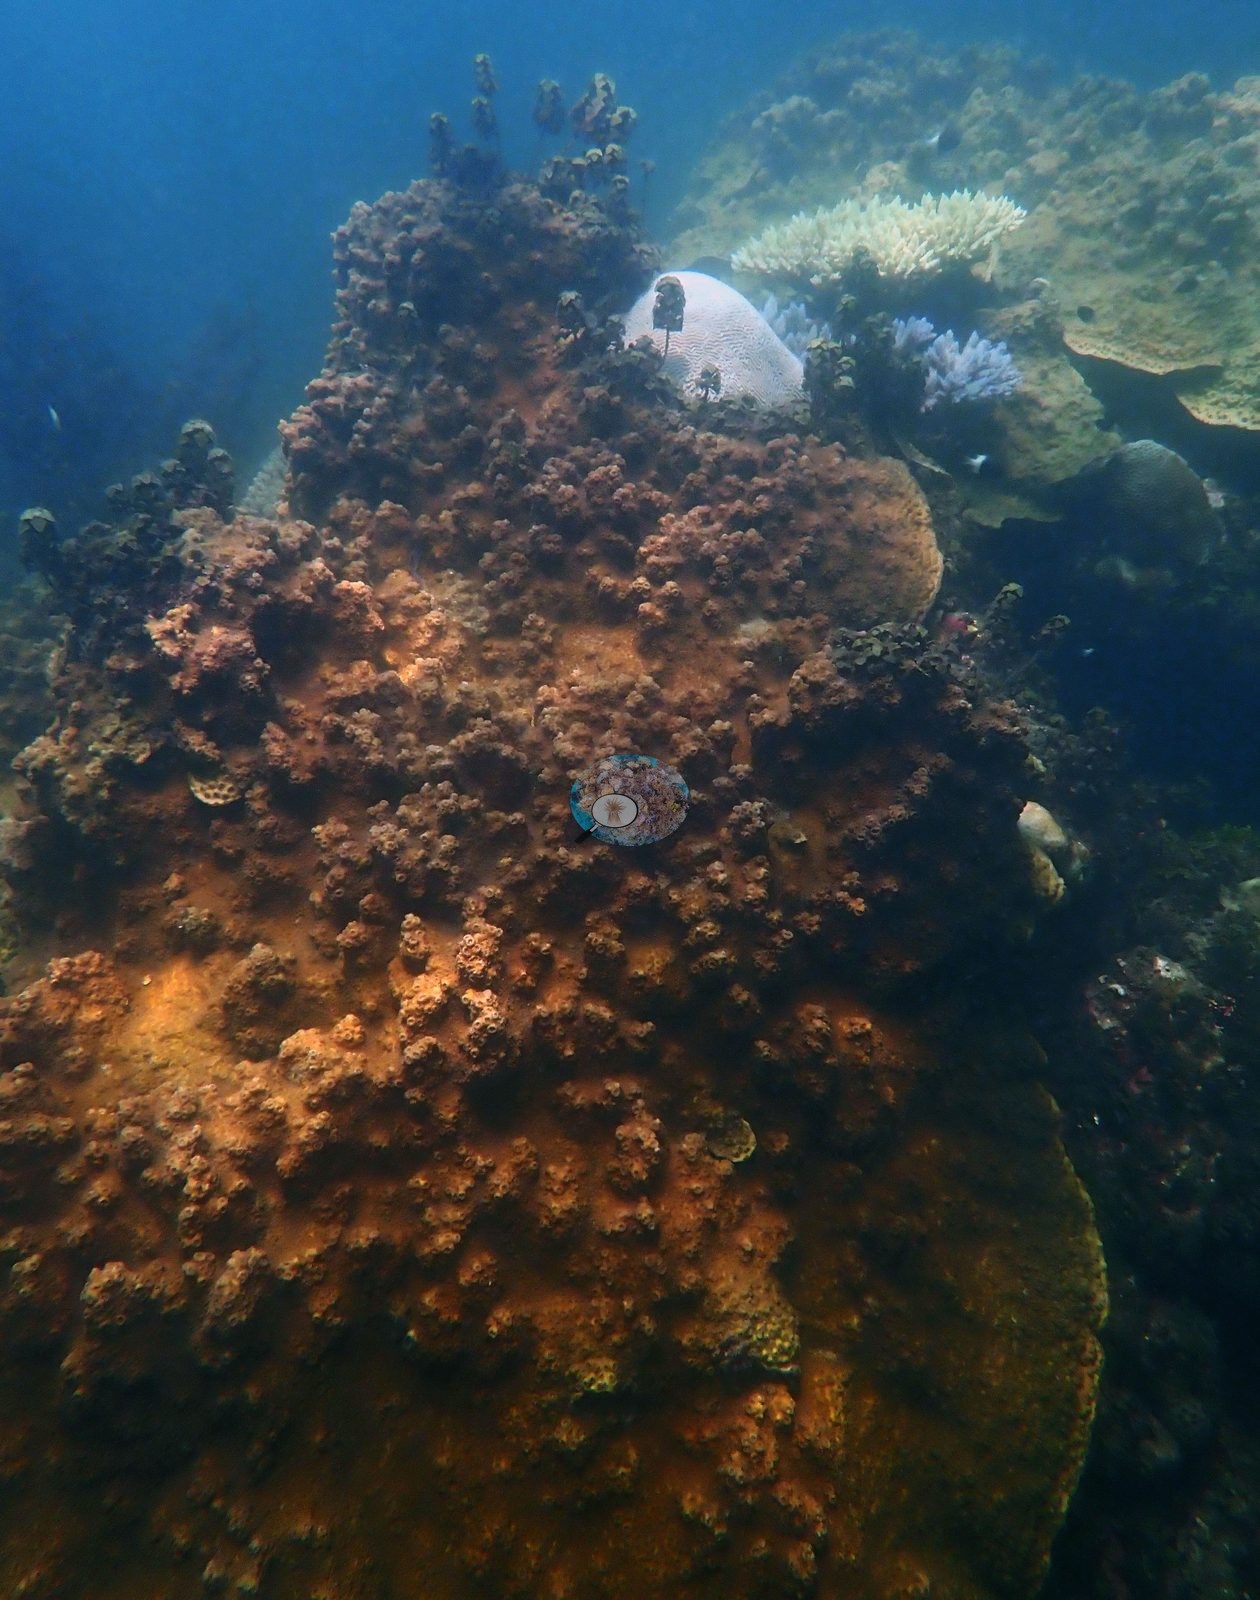
- Kenya - Bofa (Kilifi): COTS: Acanthaster in 14 of 95 frames reviewed, at least nine distinct individuals (probably ten), repeatedly draped directly onto already-bleached coral; Bleaching: 88.3% of hard coral tissue bleached (published, March-April 2024); a meter-plus Porites dome with patches where tissue is already gone
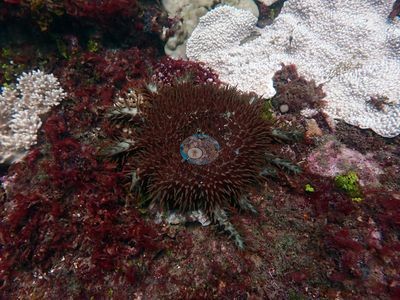
- Kenya - Round Reef (Watamu): Bleaching: 70.3% of hard coral tissue bleached (published, March-April 2024)
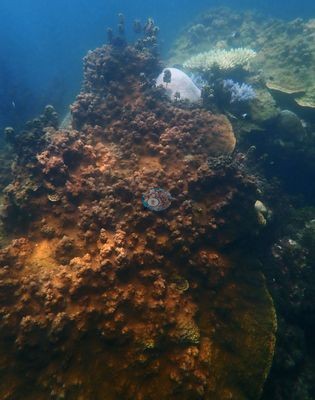
- Kenya - Uyombo (Watamu): Bleaching: 82.0% of hard coral tissue bleached (published, March-April 2024)
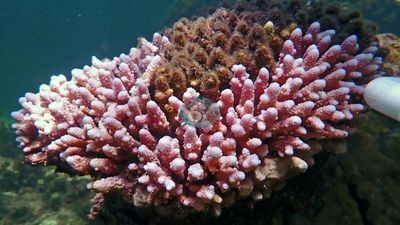
- Kenya - North Canyon (Watamu): Bleaching: 95.3% of hard coral tissue bleached (published, March-April 2024)
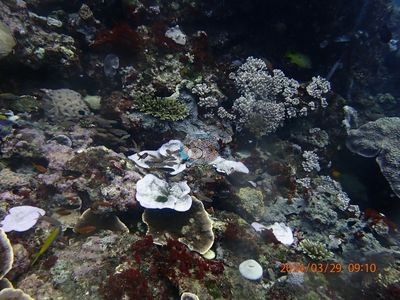
- Kenya - Trumpet Area (Watamu): Bleaching: 85.8% of hard coral tissue bleached (published, March-April 2024); bleached leathery soft corals; partial mortality on the largest colonies
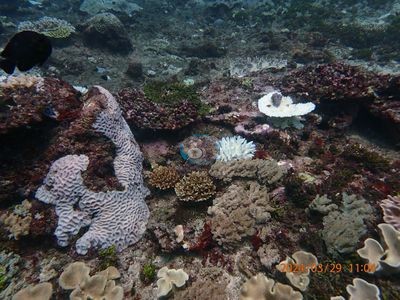
- Kenya - Chipopo (Pate [Lamu]): Bleaching: 76.0% of hard coral tissue bleached (published, March-April 2024); most nursery fragments chalk-white, early tissue loss on a few massive colonies
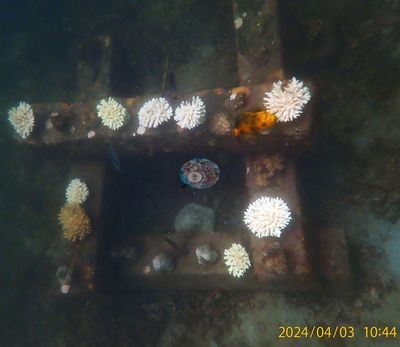
- Kenya - Pilot Nursery (Pate [Lamu]): Bleaching: 93.6% of hard coral tissue bleached (published, March-April 2024); Porites pavement with dark patches where tissue has gone and algae taken the skeleton; a meter-scale Platygyra recorded by Anderson as dead
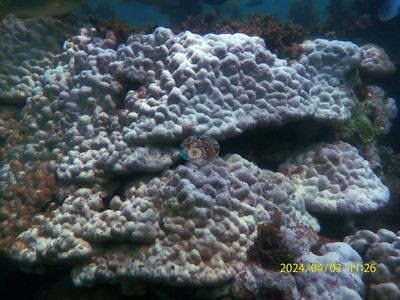
- Kenya - Ocean Trust Nursery (Pate [Lamu]): Bleaching: 95.4% of hard coral tissue bleached (published, March-April 2024); some apparently tan fragments are dead, turf-covered skeleton per Anderson's own 'looks alive but is dead' frame
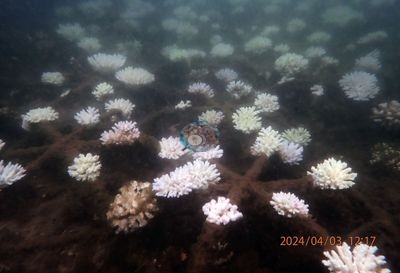
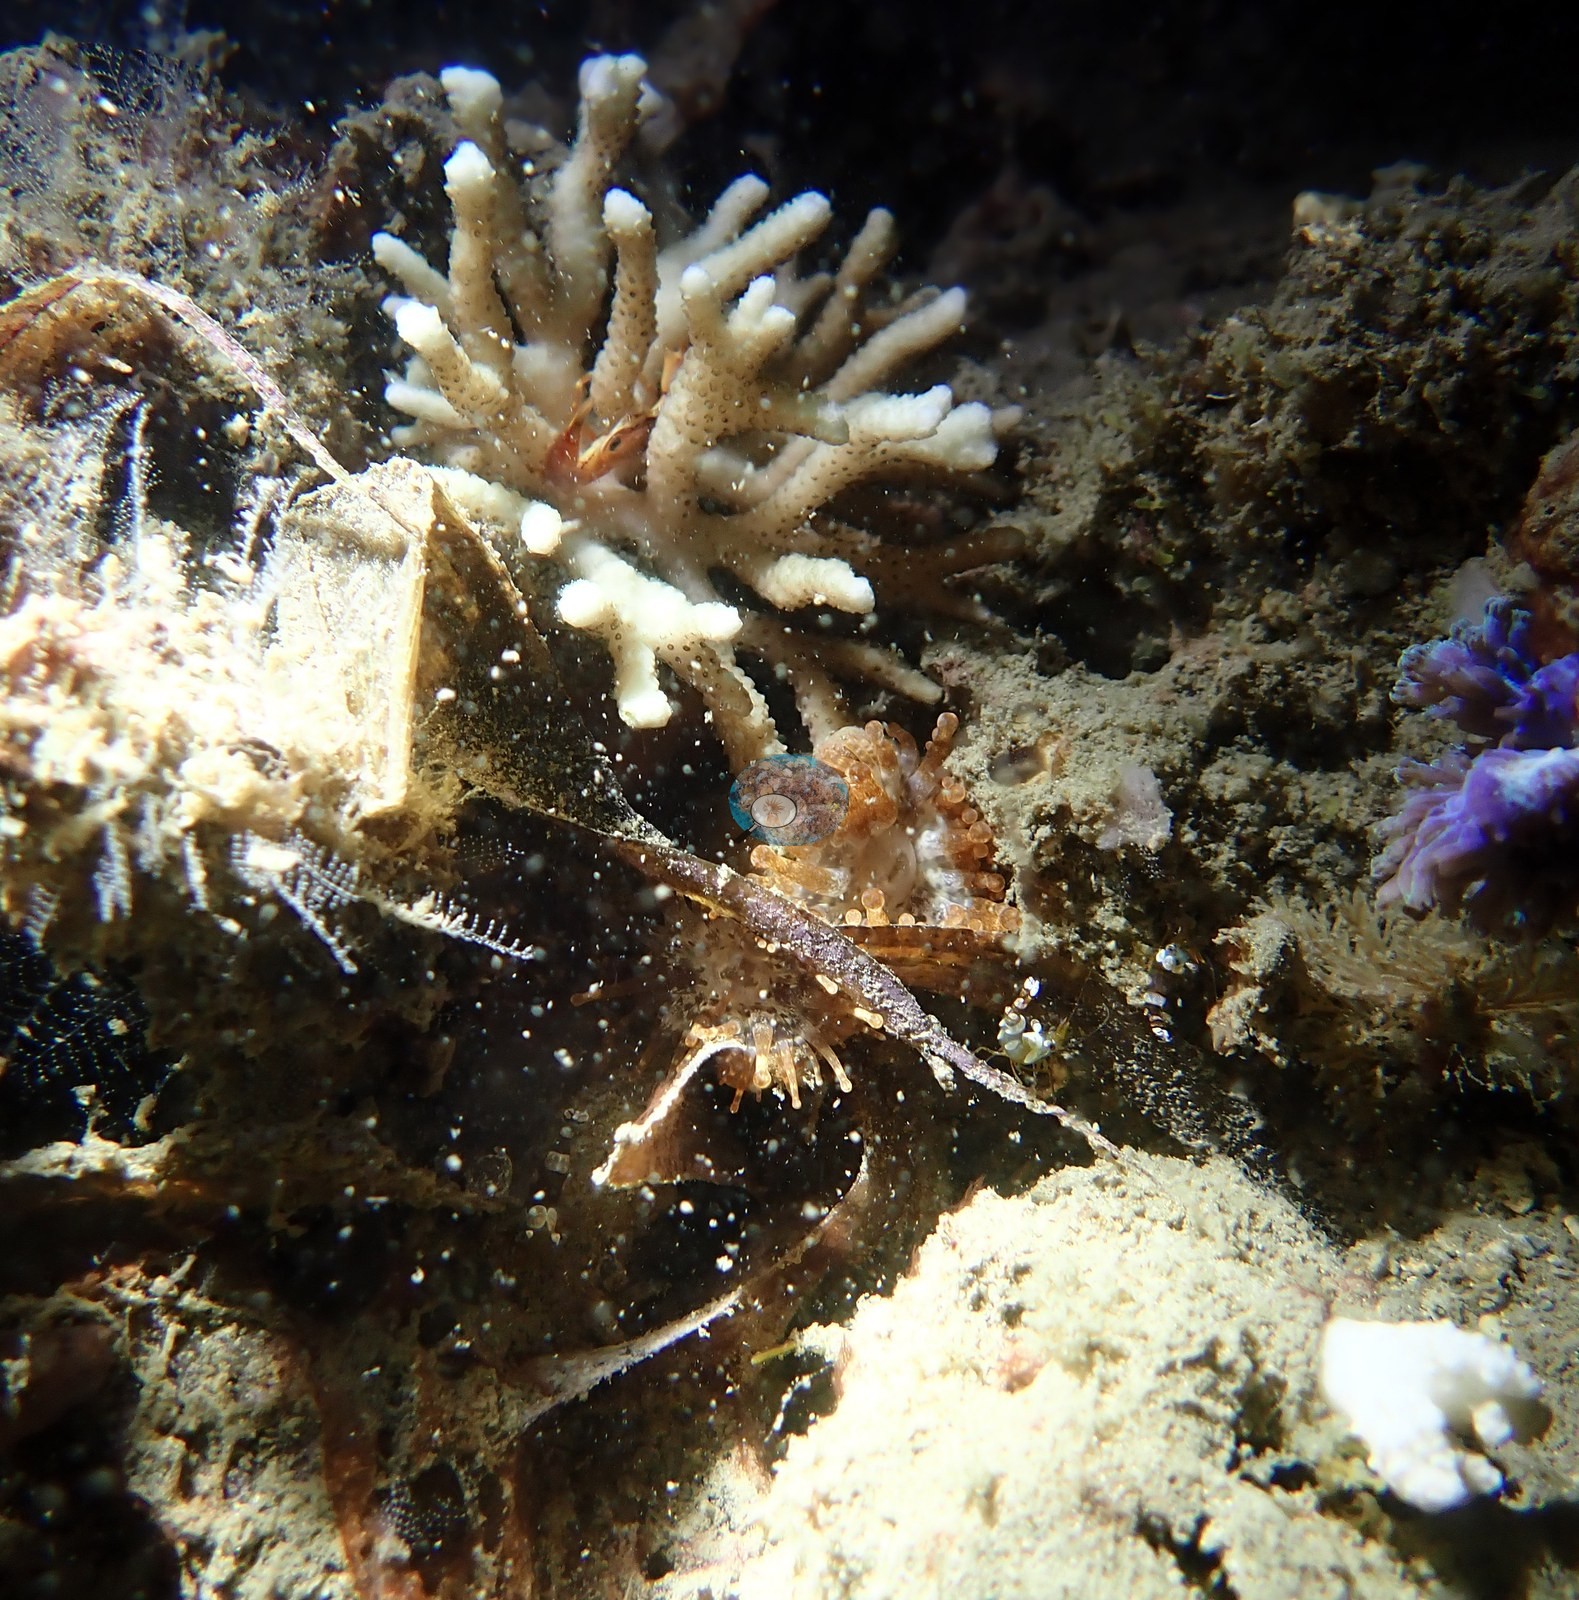
- Kenya - Shimoni night dive (Shimoni-Wasini): Bleaching noted only from Anderson's field captions and regional context; extended nocturnal polyps are naturally pale, so the photographs alone cannot confirm it; sedimentation (partially buried Acropora)
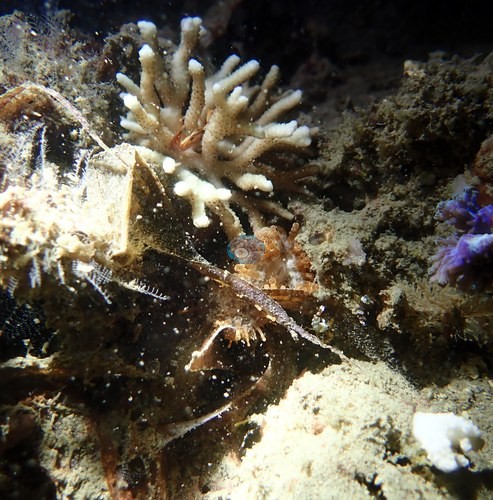
Coral cover over time (pooled)
Sites in this region (21)
- Kenya - Bofa (Kilifi) — 32% coral cover
- Kenya - Brain Coral (Mombasa) — 27% coral cover
- Kenya - Chipopo (Pate [Lamu]) — 13% coral cover
- Kenya - Coral Garden (Kisite National Park) — 55% coral cover
- Kenya - Diani Beach (Diani) — 35% coral cover
- Kenya - Dolphin Point (Kisite National Park) — 40% coral cover
- Kenya - Kilifi Bay (Kilifi) — 25% coral cover
- Kenya - Kisite National Park-site 4 (Kisite National Park) — 46% coral cover
- Kenya - Lower Mpunguti-site 1 (Kisite National Park) — 18% coral cover
- Kenya - Lower Mpunguti-site 2 (Kisite National Park) — 34% coral cover
- Kenya - MMP snorkel site (Mombasa) — 40% coral cover
- Kenya - North Canyon (Watamu) — 22% coral cover
- Kenya - Ocean Trust Nursery (Pate [Lamu]) — 29% coral cover
- Kenya - Outer Kisite (Kisite National Park) — 37% coral cover
- Kenya - Pilot Nursery (Pate [Lamu]) — 14% coral cover
- Kenya - Reefolution nursery (Shimoni-Wasini) — 40% coral cover
- Kenya - Round Reef (Watamu) — 18% coral cover
- Kenya - Sandy Patch/Point (Mombasa) — 29% coral cover
- Kenya - Shimoni night dive (Shimoni-Wasini)
- Kenya - Trumpet Area (Watamu) — 21% coral cover
- Kenya - Uyombo (Watamu) — 25% coral cover
% coral cover by method
Pooled across 8 dive sites
| Method | Mean % coral cover | Std. dev. between dive sites | n dive sites | Note |
|---|---|---|---|---|
| Manual point count (author) | 25.1% | ±14 | 8 | frame-weighted 28.8% over 1,004 frames |
| manual_like_for_like | 22.6% | ±11 | 8 | frame-weighted 20.2% over 50 frames |
| CoralNet automated point classifier | 19.9% | ±17 | 8 | frame-weighted 19.2% over 50 frames; 8 of these dive sites are the SAME MEASUREMENT as the reference and are excluded from the ranking |
| CoralSCOP (SAM-based mask-sum), unedited photos | 26.4% | ±12 | 8 | frame-weighted 24.4% over 50 frames |
| Claude (Anthropic), blind point count | 20.4% | ±11 | 8 | frame-weighted 17.0% over 50 frames |
| In-house DINOv3 point classifier | 11.8% | ±6.3 | 8 | frame-weighted 11.0% over 50 frames |
The mean is an UNWEIGHTED mean of the dive site values — each dive site counts once, whatever its photo count — which is the convention of the published tables and of every other figure on this page. The frame-weighted alternative is given per method in the Note column; where the two differ, the difference is a photo-count imbalance, not a coral-cover finding.
By dive site
| Dive site | Manual point count | Manual, same frames | CoralNet | CoralSCOP (unedited) | Claude | DINOv3 |
|---|---|---|---|---|---|---|
| Coral Garden | 55.0% n=178 | 45.0% n=2 | 50.0%⚠ n=2 | 39.3% n=2 | 40.0% n=2 | 20.0% n=2 |
| Chipopo | 12.8% n=40 | 26.7% n=2 | 31.7%⚠ n=2 | 22.5% n=2 | 30.0% n=2 | 6.7% n=2 |
| Ocean Trust Nursery | 28.9% n=62 | 26.7% n=2 | 28.3%⚠ n=2 | 11.8% n=2 | 26.7% n=2 | 1.7% n=2 |
| Uyombo (UYQ quadrats) | 24.8% n=375 | 21.7% n=24 | 23.5%⚠ n=24 | 29.1% n=24 | 17.5% n=24 | 12.6% n=24 |
| Lower Mpunguti-site 1 | 18.1% n=36 | 20.0% n=1 | 0.0%⚠ n=1 | 16.8% n=1 | 16.7% n=1 | 13.3% n=1 |
| Round Reef (RRQ quadrats) | 17.8% n=175 | 14.4% n=16 | 8.8%⚠ n=16 | 15.7% n=16 | 11.9% n=16 | 8.3% n=16 |
| Pilot Nursery | 14.0% n=21 | 13.3% n=2 | 16.7%⚠ n=2 | 28.8% n=2 | 10.0% n=2 | 11.7% n=2 |
| Sandy Point | 29.3% n=117 | 13.3% n=1 | 0.0%⚠ n=1 | 47.2% n=1 | 10.0% n=1 | 20.0% n=1 |
n under each value is the number of photographs that method scored at that dive site. ⚠ marks a cell that is not an independent check.
Reference: point-count on the photographs (a human scoring the same pixels the models see). Denominator: coral points / (30 − WATER − FISH); `Unk` is IN the denominator (Mayfield 2025 convention). Source: published verbatim (Mayfield 2025, Environments 12:276, Appendix A) ⚠ The published manual column and the four computer vision (CV) columns are on DIFFERENT FRAME SETS: the manual covers the site's full photo set (21–375 frames), the CV arms ran only on the 50-frame blind batch, which supplies 1–24 frames per site. The like-for-like row is the recomputed manual, not the published one. ⚠ The CV columns are on the OLD all-30 denominator while the published manual is on the settled rule; on these frames that understates cover by ~3.0 pp. The 50-frame batch is 6.3 pp poorer in cover than the survey average, so the CV columns are subset-distorted as well as denominator-shifted. Round Reef and Uyombo roll up 15 and 16 quadrat codes respectively.
Nearby external survey stations
82 independent survey records within 5 km of a site in this region (deduplicated across sites).
Show all 82 records
- MERMAID project “KenyaBleachingSurveys_2024”* — Mji wa Kale 1 (Mkwiro) (2024): 36% hard coral cover, 0.73 km from Kenya - Shimoni night dive (Shimoni-Wasini)
- Mangubhai et al. (2007) — Coral Gardens (2003): 22% hard coral cover, 1.13 km from Kenya - Brain Coral (Mombasa)
- McClanahan et al. (1996) — Kisite Island (1996): 24% hard coral cover, 0.62 km from Kenya - Coral Garden (Kisite National Park)
- McClanahan et al. (1996) — Kisite Island (1996): 27% hard coral cover, 4.79 km from Kenya - Lower Mpunguti-site 2 (Kisite National Park)
- McClanahan et al. (1996) — — (1994): 27% hard coral cover, 3.90 km from Kenya - MMP snorkel site (Mombasa)
- McClanahan et al. 2016 — Mradi tengefu (Kenya) (2016): 52% hard coral cover, 4.11 km from Kenya - Sandy Patch/Point (Mombasa)
- McClanahan et al. 2016 — RasIwatine (Kenya) (2016): 22% hard coral cover, 2.91 km from Kenya - MMP snorkel site (Mombasa)
- McClanahan et al. 2016 — Watamu South (Kenya) (2016): 23% hard coral cover, 0.08 km from Kenya - Round Reef (Watamu)
- McClanahan et al. 2016 — Watamu north (Kenya) (2016): 24% hard coral cover, 0.10 km from Kenya - Round Reef (Watamu)
- McClanahan et al. 2016 — Watamu south (Kenya) (2016): 28% hard coral cover, 0.08 km from Kenya - Round Reef (Watamu)
- REEFolution Foundation — Dolphin Point (2017): 20% hard coral cover, 0.40 km from Kenya - Dolphin Point (Kisite National Park)
- REEFolution Foundation — Dolphin Point (2018): 39% hard coral cover, 0.40 km from Kenya - Dolphin Point (Kisite National Park)
- REEFolution Foundation — Dolphin Point (2019): 42% hard coral cover, 0.40 km from Kenya - Dolphin Point (Kisite National Park)
- REEFolution Foundation — House Reef Firefly (2017): 39% hard coral cover, 1.25 km from Kenya - Reefolution nursery (Shimoni-Wasini)
- REEFolution Foundation — House Reef Firefly (2018): 49% hard coral cover, 1.25 km from Kenya - Reefolution nursery (Shimoni-Wasini)
- REEFolution Foundation — House Reef Firefly (2019): 50% hard coral cover, 1.25 km from Kenya - Reefolution nursery (Shimoni-Wasini)
- REEFolution Foundation — House Reef Firefly (2021): 66% hard coral cover, 1.25 km from Kenya - Reefolution nursery (Shimoni-Wasini)
- REEFolution Foundation — Kikuyu House (2018): 32% hard coral cover, 0.39 km from Kenya - Shimoni night dive (Shimoni-Wasini)
- REEFolution Foundation — Kikuyu House (2019): 27% hard coral cover, 0.39 km from Kenya - Shimoni night dive (Shimoni-Wasini)
- REEFolution Foundation — Kikuyu House (2020): 25% hard coral cover, 0.39 km from Kenya - Shimoni night dive (Shimoni-Wasini)
- REEFolution Foundation — Kikuyu House (2022): 23% hard coral cover, 0.39 km from Kenya - Shimoni night dive (Shimoni-Wasini)
- REEFolution Foundation — Kikuyu House (2023): 23% hard coral cover, 0.39 km from Kenya - Shimoni night dive (Shimoni-Wasini)
- REEFolution Foundation — Kisite 2 (2017): 29% hard coral cover, 0.26 km from Kenya - Coral Garden (Kisite National Park)
- REEFolution Foundation — Kisite 2 (2018): 48% hard coral cover, 0.26 km from Kenya - Coral Garden (Kisite National Park)
- REEFolution Foundation — Kisite Edge 2 (2013): 21% hard coral cover, 0.69 km from Kenya - Coral Garden (Kisite National Park)
- REEFolution Foundation — Kisite Edge 2 (2017): 15% hard coral cover, 0.69 km from Kenya - Coral Garden (Kisite National Park)
- REEFolution Foundation — Lower Mpunguti (2017): 2.4% hard coral cover, 0.59 km from Kenya - Lower Mpunguti-site 2 (Kisite National Park)
- REEFolution Foundation — Lower Mpunguti (2018): 8.0% hard coral cover, 0.59 km from Kenya - Lower Mpunguti-site 2 (Kisite National Park)
- REEFolution Foundation — Lower Mpunguti (2019): 0.0% hard coral cover, 0.59 km from Kenya - Lower Mpunguti-site 2 (Kisite National Park)
- REEFolution Foundation — Lower Mpunguti (mean of 15 surveys, 2017–2019) (2019): 7.1% hard coral cover, 0.59 km from Kenya - Lower Mpunguti-site 2 (Kisite National Park)
- REEFolution Foundation — Mkwiro CMA (2018): 37% hard coral cover, 1.06 km from Kenya - Shimoni night dive (Shimoni-Wasini)
- REEFolution Foundation — Mkwiro CMA (2019): 34% hard coral cover, 1.06 km from Kenya - Shimoni night dive (Shimoni-Wasini)
- REEFolution Foundation — Mkwiro CMA (2023): 29% hard coral cover, 1.06 km from Kenya - Shimoni night dive (Shimoni-Wasini)
- REEFolution Foundation — Outer Kisite (2017): 39% hard coral cover, 0.43 km from Kenya - Outer Kisite (Kisite National Park)
- REEFolution Foundation — Outer Kisite (2018): 53% hard coral cover, 0.43 km from Kenya - Outer Kisite (Kisite National Park)
- REEFolution Foundation — Outer Kisite (2019): 40% hard coral cover, 0.43 km from Kenya - Outer Kisite (Kisite National Park)
- REEFolution Foundation — Pilli Pipa Restaurant (2018): 28% hard coral cover, 0.24 km from Kenya - Reefolution nursery (Shimoni-Wasini)
- REEFolution Foundation — Pilli Pipa Restaurant (2019): 21% hard coral cover, 0.24 km from Kenya - Reefolution nursery (Shimoni-Wasini)
- REEFolution Foundation — Pilli Pipa Restaurant (2020): 18% hard coral cover, 0.24 km from Kenya - Reefolution nursery (Shimoni-Wasini)
- REEFolution Foundation — Pilli Pipa Restaurant (2022): 56% hard coral cover, 0.24 km from Kenya - Reefolution nursery (Shimoni-Wasini)
- REEFolution Foundation — Pilli Pipa Restaurant (2023): 4.9% hard coral cover, 0.24 km from Kenya - Reefolution nursery (Shimoni-Wasini)
- REEFolution Foundation — Wasini Tengefu (2018): 52% hard coral cover, 2.17 km from Kenya - Reefolution nursery (Shimoni-Wasini)
- REEFolution Foundation — Wasini Tengefu (2019): 59% hard coral cover, 2.17 km from Kenya - Reefolution nursery (Shimoni-Wasini)
- WCS Kenya / WCS Tanzania via MERMAID — Mkwiro (2020): 29% hard coral cover, 0.57 km from Kenya - Kisite National Park-site 4 (Kisite National Park)
- WCS Kenya / WCS Tanzania via MERMAID — Watamu (2024): 15% hard coral cover, 0.50 km from Kenya - North Canyon (Watamu)
- WCS Kenya via MERMAID — Bamburi Wreck (2010): 10% hard coral cover, 0.94 km from Kenya - MMP snorkel site (Mombasa)
- WCS Kenya via MERMAID — Chale-Makonde (2014): 14% hard coral cover, 1.29 km from Kenya - Diani Beach (Diani)
- WCS Kenya via MERMAID — Chale-Mwaromba (2014): 21% hard coral cover, 0.58 km from Kenya - Diani Beach (Diani)
- WCS Kenya via MERMAID — Jiwe la kale East (2014): 25% hard coral cover, 0.58 km from Kenya - Shimoni night dive (Shimoni-Wasini)
- WCS Kenya via MERMAID — Kanamai (Mradi) (2018): 29% hard coral cover, 4.12 km from Kenya - Sandy Patch/Point (Mombasa)
- WCS Kenya via MERMAID — Kasa_Mombasa (mean of 4 surveys, 2009–2010) (2010): 19% hard coral cover, 0.36 km from Kenya - Brain Coral (Mombasa)
- WCS Kenya via MERMAID — Kinondo (2014): 13% hard coral cover, 1.06 km from Kenya - Diani Beach (Diani)
- WCS Kenya via MERMAID — Kisite (mean of 2 surveys, 2008–2009) (2009): 42% hard coral cover, 0.85 km from Kenya - Coral Garden (Kisite National Park)
- WCS Kenya via MERMAID — Kisite 1 (mean of 3 surveys, 2012–2016) (2016): 46% hard coral cover, 0.85 km from Kenya - Coral Garden (Kisite National Park)
- WCS Kenya via MERMAID — Kisite 2 (mean of 2 surveys, 2012–2015) (2015): 48% hard coral cover, 0.26 km from Kenya - Coral Garden (Kisite National Park)
- WCS Kenya via MERMAID — Kisite Edge 1 (2013): 42% hard coral cover, 0.30 km from Kenya - Outer Kisite (Kisite National Park)
- WCS Kenya via MERMAID — Kisite Edge 2 (2013): 21% hard coral cover, 0.69 km from Kenya - Coral Garden (Kisite National Park)
- WCS Kenya via MERMAID — Kisite South of Site 1 (2010): 56% hard coral cover, 0.95 km from Kenya - Coral Garden (Kisite National Park)
- WCS Kenya via MERMAID — Kisite corner (2016): 50% hard coral cover, 0.30 km from Kenya - Outer Kisite (Kisite National Park)
- WCS Kenya via MERMAID — Mji wa Kale 1 (Mkwiro) (mean of 2 surveys, 2015–2019) (2019): 26% hard coral cover, 0.29 km from Kenya - Shimoni night dive (Shimoni-Wasini)
- WCS Kenya via MERMAID — Mji wa Kale 2 (Mkwiro) (mean of 2 surveys, 2015–2019) (2019): 22% hard coral cover, 0.58 km from Kenya - Shimoni night dive (Shimoni-Wasini)
- WCS Kenya via MERMAID — Mombasa (2013): 20% hard coral cover, 0.86 km from Kenya - MMP snorkel site (Mombasa)
- WCS Kenya via MERMAID — Mombasa (2022): 20% hard coral cover, 0.80 km from Kenya - Brain Coral (Mombasa)
- WCS Kenya via MERMAID — Mombasa 2 (2016): 18% hard coral cover, 0.54 km from Kenya - MMP snorkel site (Mombasa)
- WCS Kenya via MERMAID — Mombasa 3 (2016): 15% hard coral cover, 0.52 km from Kenya - MMP snorkel site (Mombasa)
- WCS Kenya via MERMAID — Mombasa Braincoral (2009): 14% hard coral cover, 0.46 km from Kenya - Sandy Patch/Point (Mombasa)
- WCS Kenya via MERMAID — Mombasa Coral Gardens (mean of 6 surveys, 2009–2017) (2017): 21% hard coral cover, 0.86 km from Kenya - MMP snorkel site (Mombasa)
- WCS Kenya via MERMAID — Mombasa Coral Gardens 2 (2016): 23% hard coral cover, 0.86 km from Kenya - MMP snorkel site (Mombasa)
- WCS Kenya via MERMAID — Mombasa Coral Gardens 3 (2016): 23% hard coral cover, 0.86 km from Kenya - MMP snorkel site (Mombasa)
- WCS Kenya via MERMAID — Mombasa Green turtle (2017): 54% hard coral cover, 0.36 km from Kenya - Brain Coral (Mombasa)
- WCS Kenya via MERMAID — Mombasa Mushroom (mean of 2 surveys, 2009–2016) (2016): 23% hard coral cover, 0.55 km from Kenya - Brain Coral (Mombasa)
- WCS Kenya via MERMAID — Mombasa Starfish (2009): 24% hard coral cover, 0.86 km from Kenya - MMP snorkel site (Mombasa)
- WCS Kenya via MERMAID — Mpunguti (2016): 32% hard coral cover, 0.81 km from Kenya - Kisite National Park-site 4 (Kisite National Park)
- WCS Kenya via MERMAID — Nzidzani (2014): 16% hard coral cover, 0.57 km from Kenya - Diani Beach (Diani)
- WCS Kenya via MERMAID — Shark Point 2 (2009): 9.7% hard coral cover, 0.63 km from Kenya - Sandy Patch/Point (Mombasa)
- WCS Kenya via MERMAID — Taa (2009): 14% hard coral cover, 0.43 km from Kenya - Sandy Patch/Point (Mombasa)
- WCS Kenya via MERMAID — Waga (2011): 25% hard coral cover, 1.76 km from Kenya - Shimoni night dive (Shimoni-Wasini)
- WCS Kenya via MERMAID — Waga 2 (2011): 25% hard coral cover, 1.76 km from Kenya - Shimoni night dive (Shimoni-Wasini)
- WCS Kenya via MERMAID — Watamu (2022): 8.8% hard coral cover, 0.36 km from Kenya - Round Reef (Watamu)
- WCS Kenya via MERMAID — Watamu (mean of 6 surveys, 2008–2024) (2024): 16% hard coral cover, 0.50 km from Kenya - North Canyon (Watamu)
- WCS Kenya via MERMAID — Watamu Canyon (2014): 19% hard coral cover, 1.64 km from Kenya - North Canyon (Watamu)
- WCS Kenya via MERMAID — Watamu Tewa (2014): 20% hard coral cover, 0.66 km from Kenya - North Canyon (Watamu)
All images from Coral Reef Diagnostics. Data are from Coral Reef Diagnostics.
© Coral Reef Diagnostics.
References
- Souter D, et al. (eds) (2021) Status of Coral Reefs of the World: 2020. International Coral Reef Initiative / Global Coral Reef Monitoring Network. [PDF]
- Spalding MD, et al. (2001) World Atlas of Coral Reefs. University of California Press, Berkeley. [PDF]
- Wilkinson C (2006) Status of coral reefs of the world: summary of threats and remedial action. In: Côté IM, Reynolds JD (eds) Coral Reef Conservation. Cambridge University Press, Cambridge. [PDF]
- Mayfield AB (2025). A Citizen Science Approach for Documenting Mass Coral Bleaching in the Western Indian Ocean. Environments 12:276. PDF
- Mangubhai S, Harrison P, Obura D (2007). Patterns of coral larval settlement on lagoon reefs in the Mombasa Marine National Park and Reserve, Kenya. Marine Ecology Progress Series 348:149-159. PDF
- McClanahan TR, Kamukuru AT, Muthiga NA, Yebio MG, Obura D (1996). Effect of Sea Urchin Reductions on Algae, Coral, and Fish Populations. Conservation Biology 10:136-154. DOI