
Kenya - Coral Garden (Kisite National Park)

Part of the regional summary: Kenya
More info
Tanzania (NOAA CRW virtual station) · East African Coral Coast ecoregion mean=4.1°C-heating weeksCoral Garden, in Kisite Marine National Park, was both the richest reef in the entire 20-site Kenya survey (55% cover, wall-to-wall coral in many frames) and among the least bleached (58.9% of tissue, versus a 77.1% Kenya-wide average) - an enormous carpet of knobby Galaxea coral held its color well, while the acroporid thickets growing on and around it took most of the damage, producing some of the clearest side-by-side healthy-versus-bleached imagery in the whole study. A green turtle, batfish, and streaming anthias rounded out the site, and no crown-of-thorns starfish were seen, a contrast with reefs further north.
Eneo lenye kiwango cha juu zaidi cha matumbawe katika utafiti wa Kenya na lenye maji safi zaidi: matumbawe hai upande hadi upande ndani ya Hifadhi ya Taifa ya Bahari ya Kisite. Tandiko la Galaxea lenye rangi linafunika eneo kubwa zaidi moja na hufanya picha pana zionekane na afya kuliko asilimia 58.9 ya upaukaji iliyochapishwa, na kidonda cha upotevu wa tishu kilichothibitishwa juu ya koloni yenye rangi kamili ndicho…
Tafsiri ya muhtasari huu kwa AI; Kiingereza ndicho kinachotumika rasmi. Translated from the site’s shorter map summary.
Thirteen independent survey stations shown with the program’s logo — click one to see how far it is from this site.
Three other CRD dive sites within 5 km shown in orange — click a marker to open its page.
Site description
Setting
The full 161-frame set confirms what the four published frames suggested and then some: this is the clearest water of the Kenya survey, deep open blue above the reef in almost every wide frame, and it is genuinely rail-to-rail coral.
General benthic features
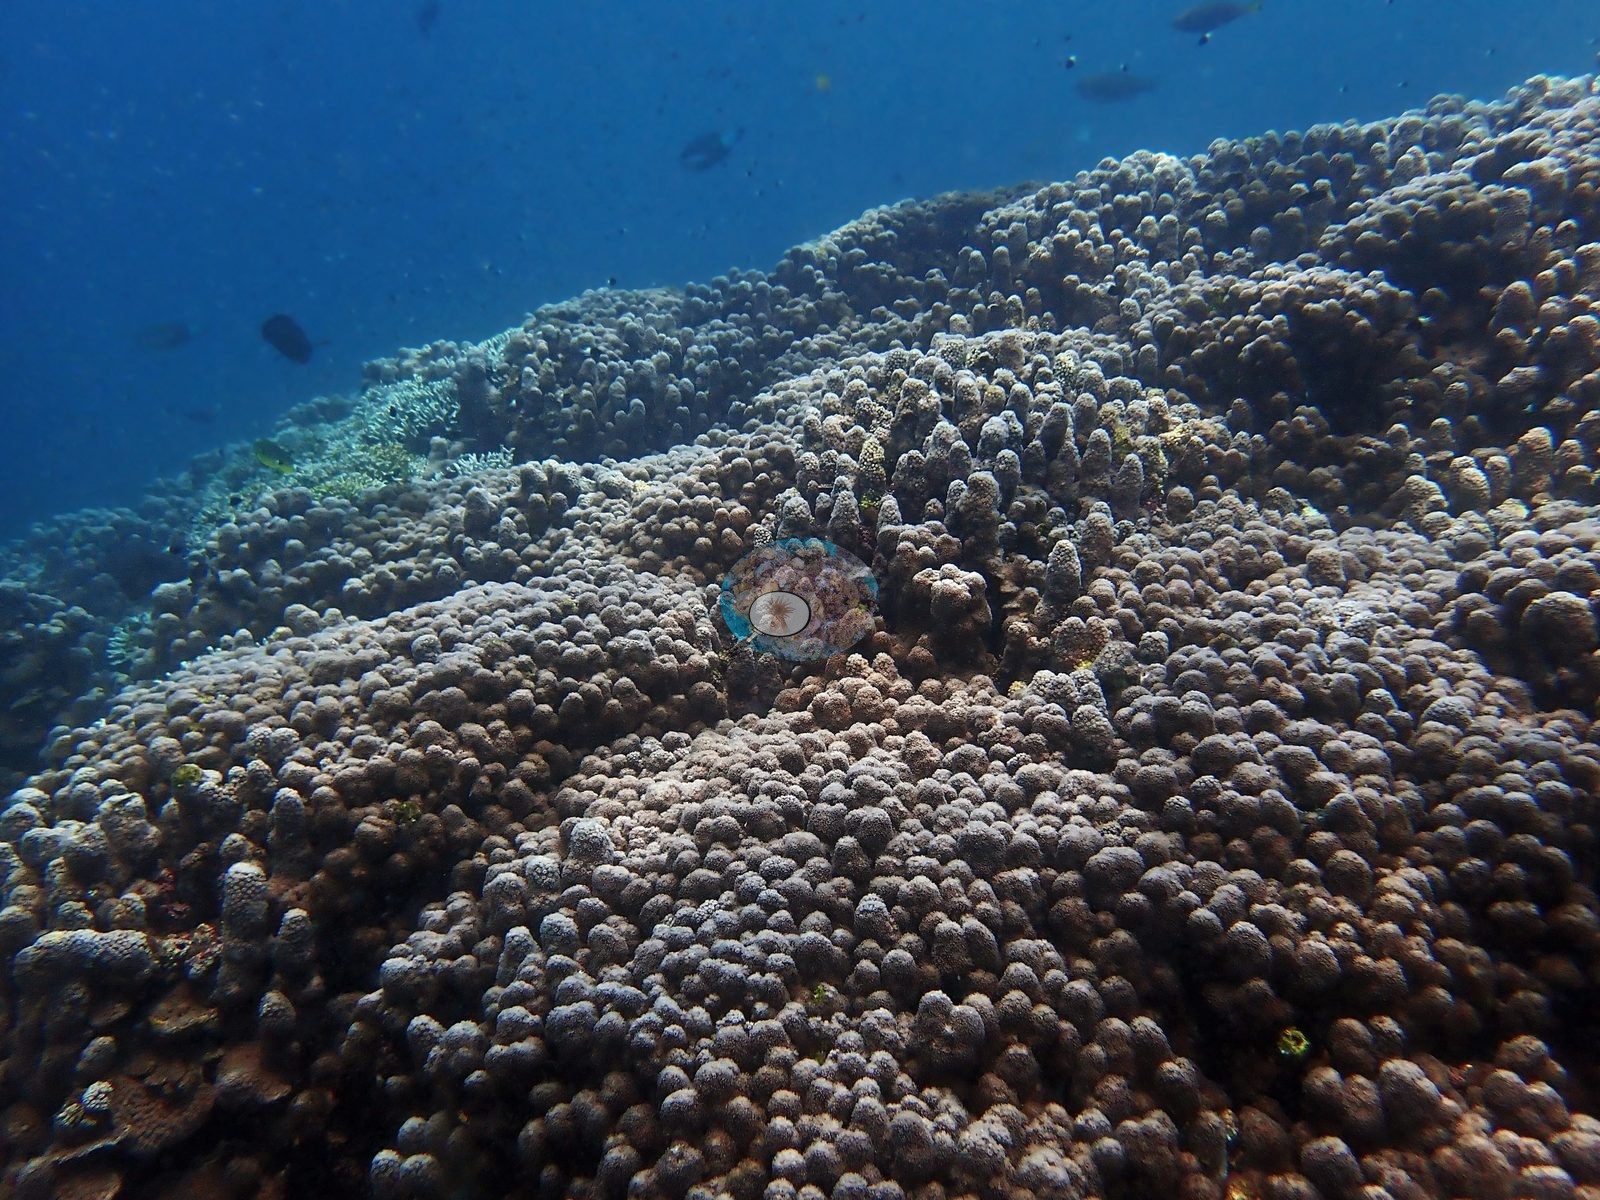
Frame after frame is wall-to-wall living colony with no bare substrate in view at all. The feature the site is named for is real and it is enormous. Two of Anderson's own frames are both wide views of a single unbroken hillside of knobby, nodular columnar Galaxea running out of frame in every direction -- hundreds of square meters of one growth form, gray-mauve on the high ground grading to tan and chocolate-brown in the hollows, with only a handful of small white colonies dotted across it (e.g., Image 1, Image 3).
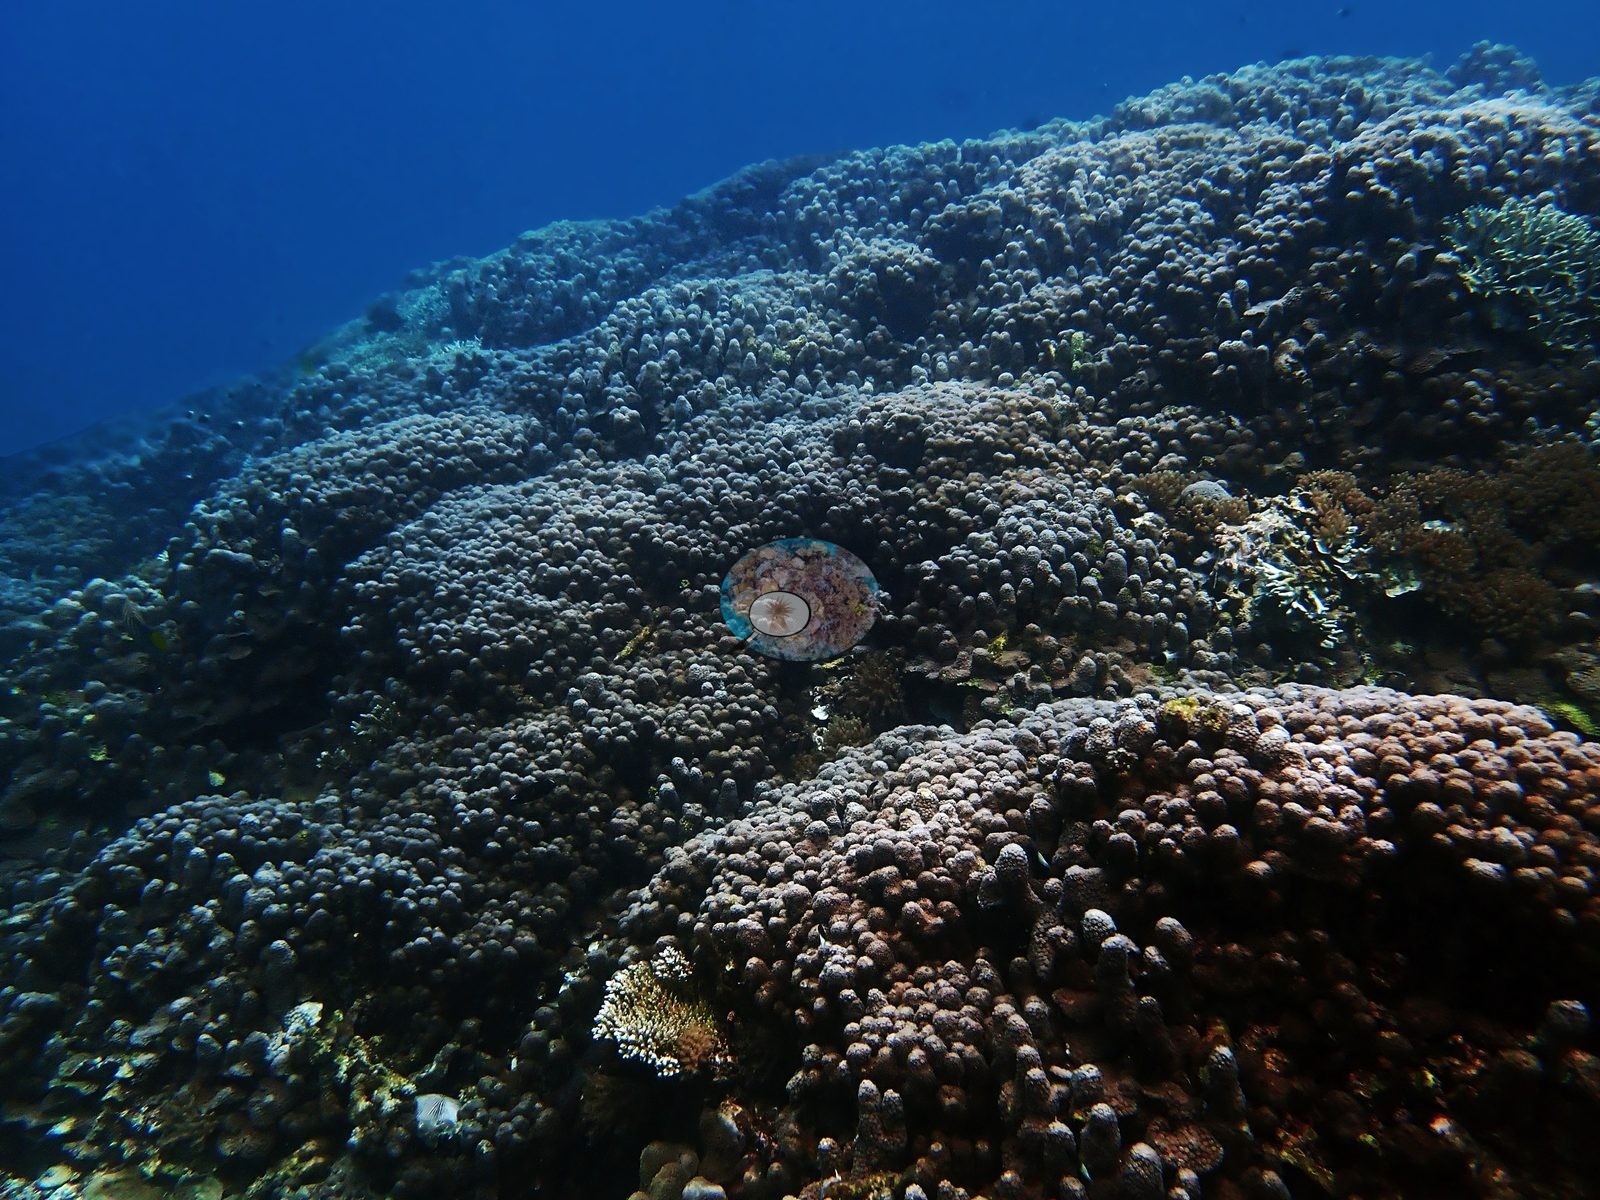
Another frame is a third view of the same carpet at closer range, a broad pinkish-mauve knuckled field filling the frame. Around and above it the reef is acroporid: multi-tiered stacked Acropora tables, corymbose bushes, digitate stands, and dense staghorn thickets that run for whole frames at a time (e.g., Image 2).
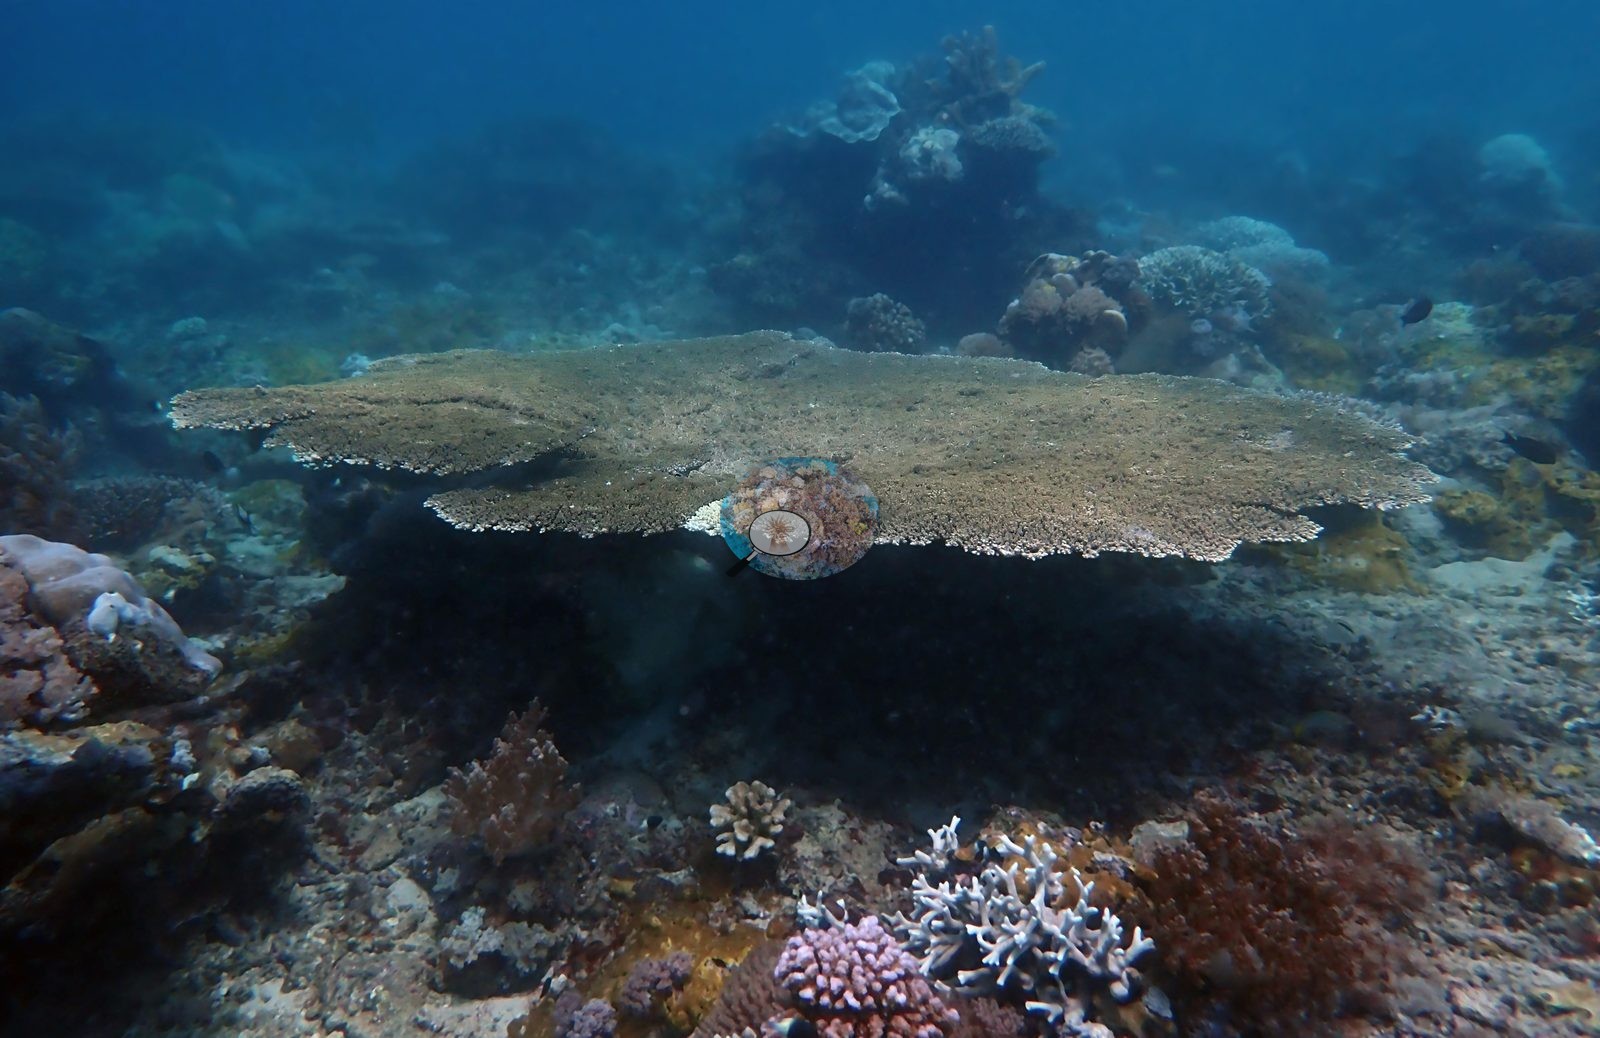
Other taxa and fauna across the set: broad yellow-green foliose Turbinaria stands; cream and tan lobed Sarcophyton leathers; a large tan-orange Dendronephthya-type soft coral bush standing clear of the reef; orange encrusting sponges; a green turtle resting in the shade of a boulder overhang draped in pink soft corals; a batfish (Platax) over a maroon thicket; a ray on the reef top; yellow-and-blue snappers; anthias and fusiliers streaming over the crest; and clouds of chromis in most wide frames. The one thing the wide set adds against the earlier text is that the reef is not gapless everywhere. The carpet and the thickets are continuous across the reef top, but the base of the structure meets clean sand and coral-rubble aprons in six frames, and two large rock outcrops rise clear of the coral into open blue in two more frames.
Coral cover
This is what 55% cover looks like, and it is the richest site in the whole Kenya set. Coral cover 55% -- and 58.9% of hard coral tissue bleached (March-April 2024). Measured from 178 white-balanced photographs taken at this site during the 2024 Western Indian Ocean mass bleaching event and point-annotated in CoralNet, published in Mayfield, A.B. (2025) A Citizen Science Approach for Documenting Mass Coral Bleaching in the Western Indian Ocean. Environments 12(8):276. doi:10.3390/environments12080276. This is a published diver-photograph point-annotation value, not a computer vision estimate.
Stressors
This is the site where the healthy-versus-bleached contrast is most legible, because both states sit side by side in the same frame over and over. One frame has a brilliant white corymbose Acropora at center with a chocolate-tan digitate colony directly above it and a pastel lavender massive colony immediately right (e.g., Image 4).
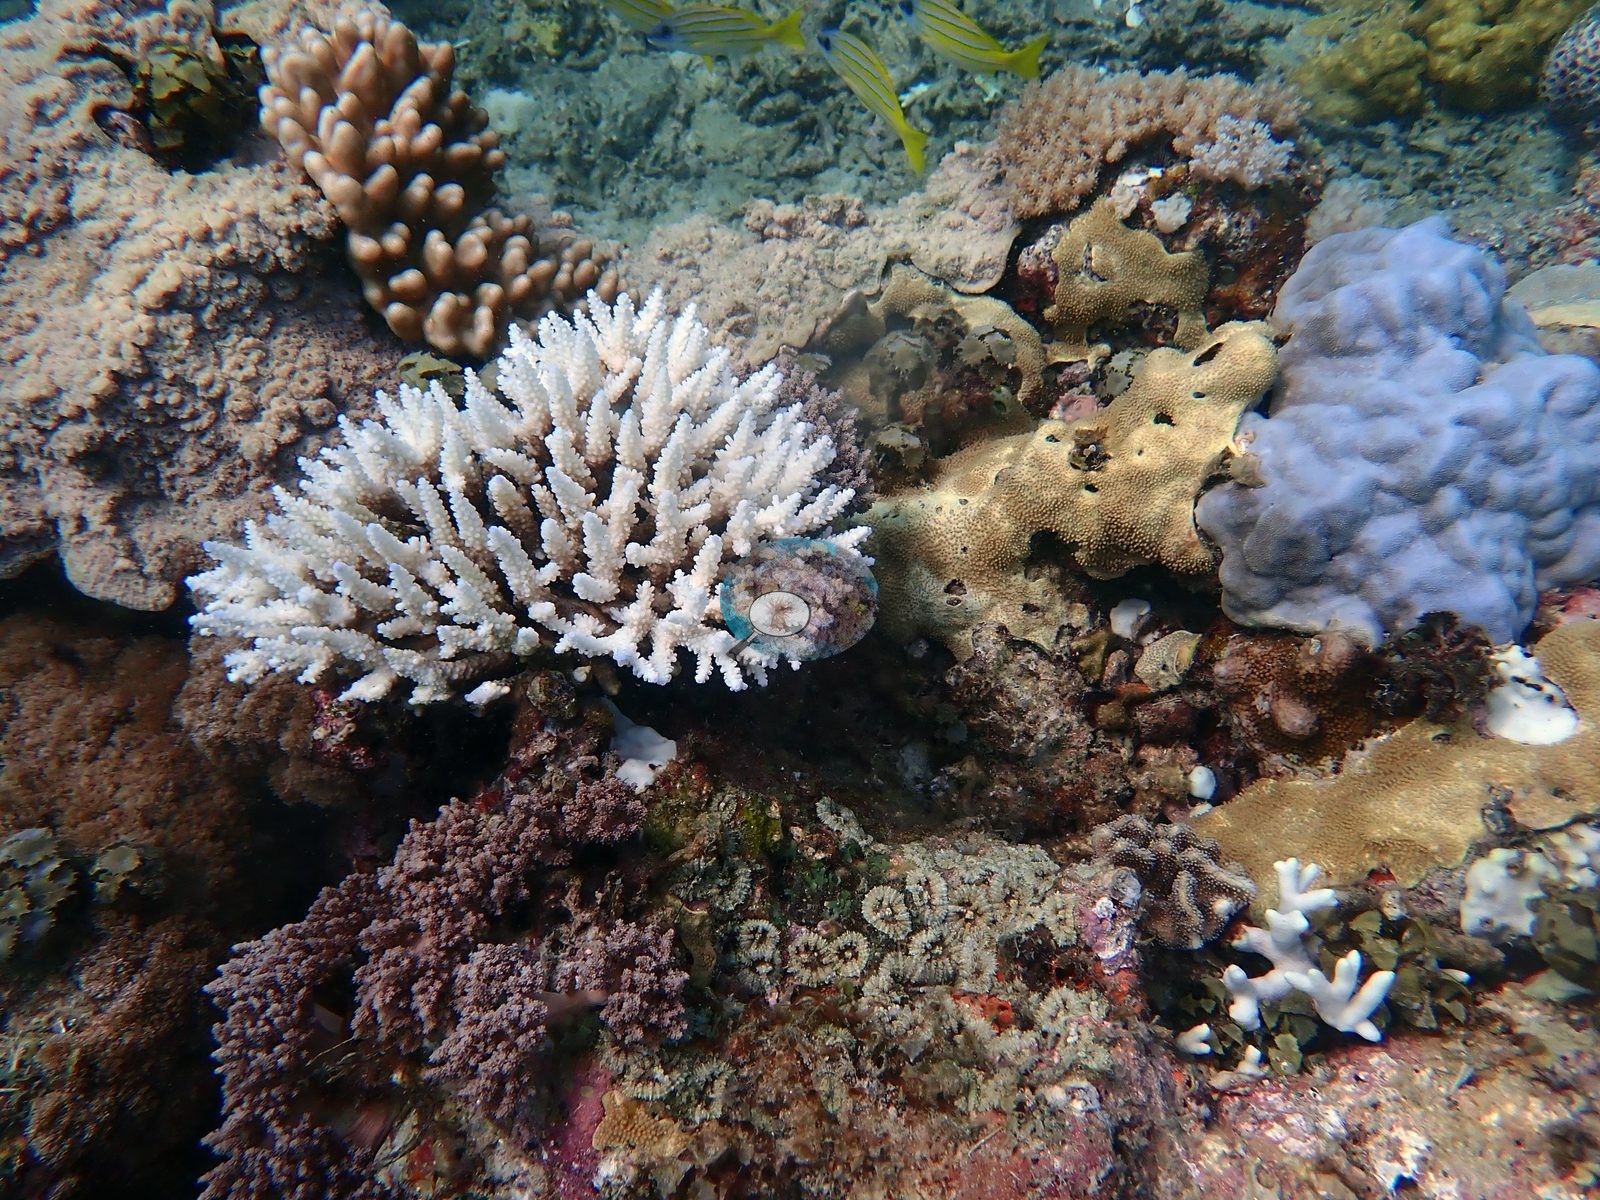
Two frames put one large bone-white corymbose bush in the middle of an otherwise pigmented tan-brown field. The starkest single image in the set shows a meter-scale massive dome bleached to flat porcelain white, ringed on all sides by fully pigmented brown fine-branched acroporid, with two white meandroid brains beside it. The same within-frame split runs through five more frames -- white branching colonies pressed against olive, gold, and maroon neighbors. On which groups held pigment, the full set corrects the earlier reading. Massive Porites and the brains did NOT largely keep their color here. Several of the most completely white colonies in the set are massives: the porcelain dome described above, a row of massive domes bleached white on rubble, a large lobate Porites gone cream-white across its whole surface, more white domes in another frame, and a large Platygyra brain bleached to pale cream. A pale cream massive Porites also anchors the left of one frame. A minority of massives did hold pigment and are worth naming as the exception: a mauve-brown brain and a green massive colony together in one frame, a tan-brown dome, and the brown lobate colonies of two more frames. The group that most conspicuously retained pigment at Coral Garden is the Galaxea carpet itself, together with the dark maroon and red-brown branching fields -- one is an entire frame of deep maroon branching coral with barely a pale tip in it, and three more frames are the same story. Because that carpet is also the single largest area of coral at the site, the reef reads far healthier in wide shot than the 58.9% bleached figure implies; the bleaching is concentrated in the acroporids on top of and around it. The acroporid tier took the damage: two frames are close-ups of branching Acropora bleached to bare white with only a faint pink blush left at the tips, and a consecutive run of frames shows whole staghorn fields gone gray-white above still-brown columnar coral beneath. A third condition state is present and should not be read as bleaching. One of Anderson's frames is a close-up of a pigmented brown massive colony crossed by bands of bare skeleton carrying a green algal film, with a sharp white advancing margin where tissue is being lost against otherwise fully colored tissue -- a tissue-loss lesion on a colony that never bleached. His frame of an acroporid with partial mortality shows a discrete white patch set inside a continuous brown pigmented acroporid thicket. Three frames show broader gray-white areas that read as recently dead skeleton under a fine algal film rather than as live bleached tissue. Stress coloration is well represented: a vivid lavender-blue verrucose Pocillopora beside a brown-mantled Tridacna, and lilac and violet colonies in three more frames. These are pastel rather than white and, given the color-adjusted frames, are called as probable stress coloration rather than asserted. No crown-of-thorns seastar appears anywhere in the 161 frames reviewed -- a real contrast with the Kilifi sites. Typical recent thermal stress: mean annual maximum of 4.1 degree heating weeks (2021-2025, NOAA CRW; East African Coral Coast ecoregion). Seawater here measured 31.5°C during the survey (the Kenya survey-wide mean of 32.0°C matched the 1998 event), and NOAA recorded a peak of 13.5 degree-heating weeks on 18 April 2024, the highest for Kenya since records began in 1985. In situ temperatures ran 1.3 degrees C above NOAA's estimates, so the true heat stress was likely nearer 22 DHWs.
Comparisons with other data
This site publishes 55.0%.
Dive record
Dived 21 Mar 2024 at about 6 m in Kisite Marine National Park during the 2024 Western Indian Ocean mass bleaching event. Surveys were run with REEFolution.
Other notes
REEFolution divers appear in three frames, one of which shows two divers above a bank of stacked acroporid tables.
CV model comparison
More info
The like-for-like row is the recomputed manual, not the published one. ⚠ The CV columns are on the OLD all-30 denominator while the published manual is on the settled rule; on these frames that understates cover by ~3.0 pp. The 50-frame batch is 6.3 pp poorer in cover than the survey average, so the CV columns are subset-distorted as well as denominator-shifted. Round Reef and Uyombo roll up 15 and 16 quadrat codes respectively. CoralSCOP (SAM-based mask-sum), edited photos: n/a — CoralSCOP was never run on Kenya edited copies; owner's ruling 2026-09-17: 'for kenya, it's only on unedited'| Method | Hard-coral cover (%) |
|---|---|
| Manual (published) | 55.0 |
| CoralNet | 46.4 |
| In-house DINOv3 | 46.0 |
| CoralSCOP unedited | 20.9 |
| Claude | 40.0 |
Independent surveys nearby
| Agency / program | Year(s) | Stations / distance | Link |
|---|---|---|---|
| Global bleaching + environmental database | 2016 | 1 station, 0.72 km | Records ↓ |
| Kenyan reef survey compilation (source not identified) | — | 3 stations, 0.09–1.34 km | Records ↓ |
| McClanahan et al. (1996) | 1996 | 1 station, 0.62 km | Records ↓ |
| McClanahan et al. (2007) | 1998 | 1 station, 0.95 km | Records ↓ |
| REEFolution Foundation | 2013–2019 | 5 stations, 0.26–4.57 km | Records ↓ |
| WCS Kenya / WCS Tanzania via MERMAID | 2020 | 1 station, 4.19 km | Records ↓ |
| WCS Kenya via MERMAID | 2009–2016 | 6 stations, 0.26–1.73 km | Records ↓ |
 Dr. Coral (CRD)Year-average (no detectable trend)
Within 5 km, 15 independent survey stations recorded hard coral cover in 77 records between 1996 and 2020. Of the 4 stations surveyed in more than one year, 1 declined, 1 increased, and 2 changed by less than 5 percentage points between their first and latest surveys. The longest record, Kisite Edge 2 (REEFolution Foundation, 0.69 km away), went from 21% in 2013 to 15% in 2017. The most recent nearby survey is from 2020, so these values predate recent heat stress. This site's own estimate (55%) sits within the range of these surveys (0.0–56%); the methods differ, so the comparison is context, not a like-for-like test. 3 further rows in the table have no survey date, so they are listed but not part of this summary.
Collected by other programs using different methods (MERMAID is a data platform: each MERMAID row names the organization that did the survey, and its method is in the row's hover text), so these are context for the figures above, not a like-for-like comparison. Where a station was surveyed more than once the range is shown. Station names are not dive-site names.
Show all 19 independent survey records
| Agency | Site / location | Date | Hard coral cover (%) | Distance | Link |
|---|---|---|---|---|---|
| McClanahan et al. (1996) | Kisite Island | 1996 | 24% (3 surveys) | 0.62 km | HeatCRD database |
| McClanahan et al. (2007) | Kisite, Kenya (KN) | post-1998 | 10% | 0.95 km | — |
| McClanahan et al. (2007) | Kisite, Kenya (KN) | pre-1998 | 22% | 0.95 km | — |
| WCS Kenya via MERMAID | Kisite (mean of 2 surveys, 2008–2009) | 2009 | 42% (4 images) | 0.85 km | Darling E. 2018. Kenya CRCP legacy. MERMAID |
| WCS Kenya via MERMAID | Kisite South of Site 1 | 2010 | 56% (2 images) | 0.95 km | Darling E. 2018. Kenya CRCP legacy. MERMAID |
| REEFolution Foundation | Kisite Edge 2 | 2013–2017 | 15–21% (2 surveys) | 0.69 km | 2023. REEFolution Kenya. MERMAID |
| WCS Kenya via MERMAID | Kisite Edge 1 | 2013 | 42% (2 images) | 1.73 km | Darling E. 2018. Kenya CRCP legacy. MERMAID |
| WCS Kenya via MERMAID | Kisite 2 (mean of 2 surveys, 2012–2015) | 2015 | 48% (4 images) | 0.26 km | Darling E. 2018. Kenya CRCP legacy. MERMAID |
| WCS Kenya via MERMAID | Kisite 1 (mean of 3 surveys, 2012–2016) | 2016 | 46% (6 images) | 0.85 km | Darling E. 2018. Kenya CRCP legacy. MERMAID |
| WCS Kenya via MERMAID | Kisite corner | 2016 | 50% (2 images) | 1.73 km | Darling E. 2018. Kenya CRCP legacy. MERMAID |
| Global bleaching + environmental database | Kisite 1 Tempgauge | 2016-05-23 | 47% | 0.72 km | — |
| REEFolution Foundation | Kisite 2 | 2017–2018 | 29–48% (3 surveys) | 0.26 km | 2023. REEFolution Kenya. MERMAID |
| REEFolution Foundation | Outer Kisite | 2017–2019 | 39–53% (13 surveys) | 1.48 km | 2023. REEFolution Kenya. MERMAID |
| REEFolution Foundation | Lower Mpunguti | 2017–2019 | 0.0–8.0% (15 surveys) | 4.57 km | 2023. REEFolution Kenya. MERMAID |
| REEFolution Foundation | Lower Mpunguti (mean of 15 surveys, 2017–2019) | 2019 | 7.1% (15 surveys) | 4.57 km | 2023. REEFolution Kenya. MERMAID |
| WCS Kenya / WCS Tanzania via MERMAID | Mkwiro | 2020 | 29% (3 surveys) | 4.19 km | Darling E, Mensa J, O'Leary J, Schwarz A. 2020. BAF 1 - 2020. MERMAID |
| Kenyan reef survey compilation (source not identified) | Kisite Leeward (site code S_KL’14), South zone | — | 12% | 0.09 km | — |
| Kenyan reef survey compilation (source not identified) | Kisite Deep (site code S_KD’14), South zone | — | 12% | 0.91 km | — |
| Kenyan reef survey compilation (source not identified) | Kisite Seaward (site code S_KS’14), South zone | — | 16% | 1.34 km | — |
Data & links
- CoralNet image repository for this region ↗
- HeatCRD database ↗
- (reference) ↗
- Photo portfolio ↗
- Coral Reef Diagnostics page for this area ↗
All images from Coral Reef Diagnostics. Data are from Coral Reef Diagnostics and the organizations named in the data-sources table above.
© Coral Reef Diagnostics.
References
- McClanahan TR, Kamukuru AT, Muthiga NA, Yebio MG, Obura D (1996). Effect of Sea Urchin Reductions on Algae, Coral, and Fish Populations. Conservation Biology 10:136-154. DOI
- Mayfield AB (2025). A Citizen Science Approach for Documenting Mass Coral Bleaching in the Western Indian Ocean. Environments 12:276. PDF
- McClanahan TR, Ateweberhan M, Muhando CA, Maina J, Mohammed MS (2007). EFFECTS OF CLIMATE AND SEAWATER TEMPERATURE VARIATION ON CORAL BLEACHING AND MORTALITY. Ecological Monographs 77:503-525. DOI