
Kenya - Dolphin Point (Kisite National Park)

Part of the regional summary: Kenya
More info
Tanzania (NOAA CRW virtual station) · East African Coral Coast ecoregion mean=4.1°C-heating weeksDolphin Point is unambiguously a tabulate Acropora reef - meter-plus plate colonies sitting edge to edge across a sloping terrace, some wider than a diver is tall - with massive corals and soft corals as secondary elements. Bleaching here was severe and cut across growth forms rather than sparing any one group: many of the big tables read pale cream to mustard rather than brown, though pockets of deep tan, pink, and lilac pigment survive throughout. Published cover was 40% with 61.9% of coral tissue bleached, up from 29.2% at a nearby 2020 survey; no dolphins appear in the photographs despite the name.
Mwamba wa Acropora yenye umbo la meza katika Hifadhi ya Taifa ya Bahari ya Kisite, ambapo takriban nusu ya picha zinaonyesha sahani zenye upana wa mita moja, zikirundikana tatu juu ya nyingine mahali pengine, na vitobo vya Porites makubwa vikiwa kipengele cha pili. Upaukaji ni mkali lakini wa mchanganyiko, na koloni kubwa zilipigwa vilevile kama zile za meza.
Tafsiri ya muhtasari huu kwa AI; Kiingereza ndicho kinachotumika rasmi. Translated from the site’s shorter map summary.
Eleven independent survey stations shown with the program’s logo — click one to see how far it is from this site.
Four other CRD dive sites within 5 km shown in orange — click a marker to open its page.
Site description
Setting
Habitat. A gently sloping hardground terrace at roughly 5-12 m, broken by low ledges, rubble aprons, and sand pockets, with open blue water off the drop.
General benthic features
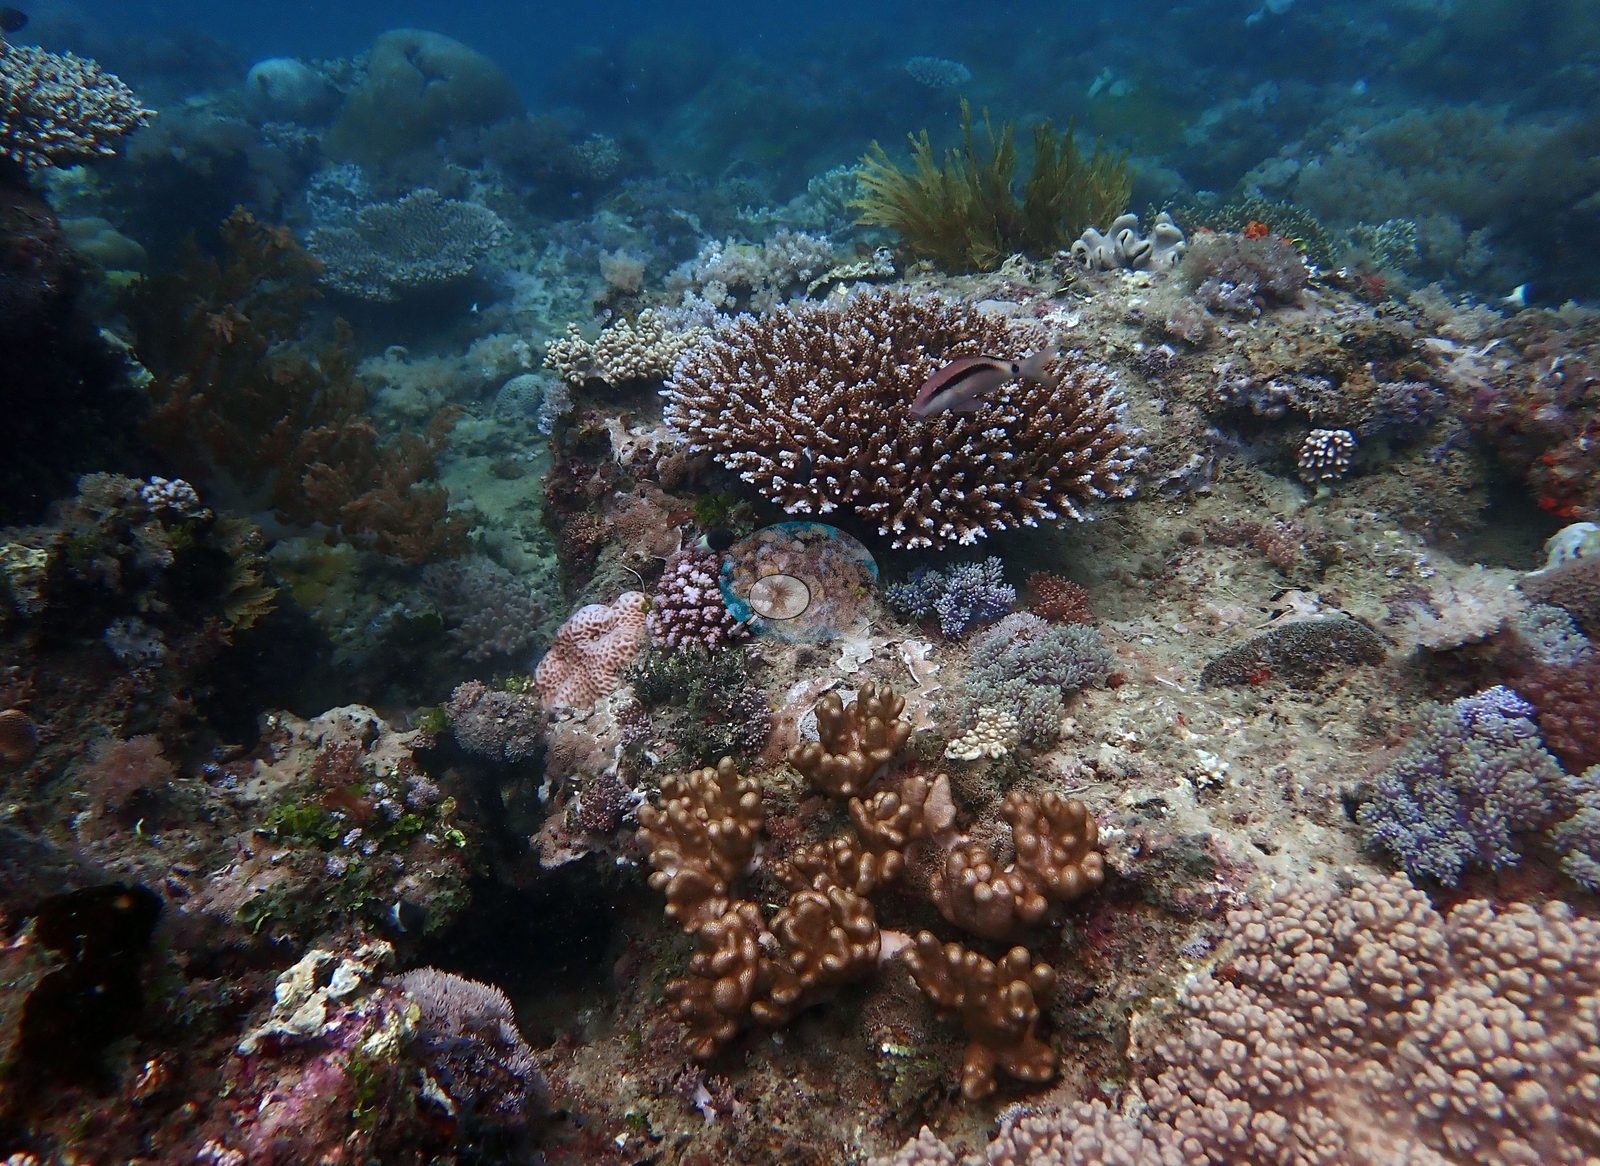
This is, unambiguously, a tabulate Acropora reef. Something close to half the set is given over to plate colonies a meter and more across -- two frames open the dive with them, and long runs of frames later in the dive are almost nothing else. The tables sit edge to edge across the terrace so that the middle-distance skyline becomes a horizon of overlapping discs, and one frame catches three plates stacked on a single stalk above a staghorn tangle, one of the best structural frames in the whole Kenya run. Divers appear in seven frames and give the scale: the largest tables are wider than a diver is tall. Community. Branching and corymbose acroporids fill the space between and beneath the tables -- a chest-high tan bush, a dense pink-and-tan corymbose thicket, tight corymbose heads, and a stiff, thick-branched orange-brown colony that is the most saturated coral in the set (e.g., Image 3).
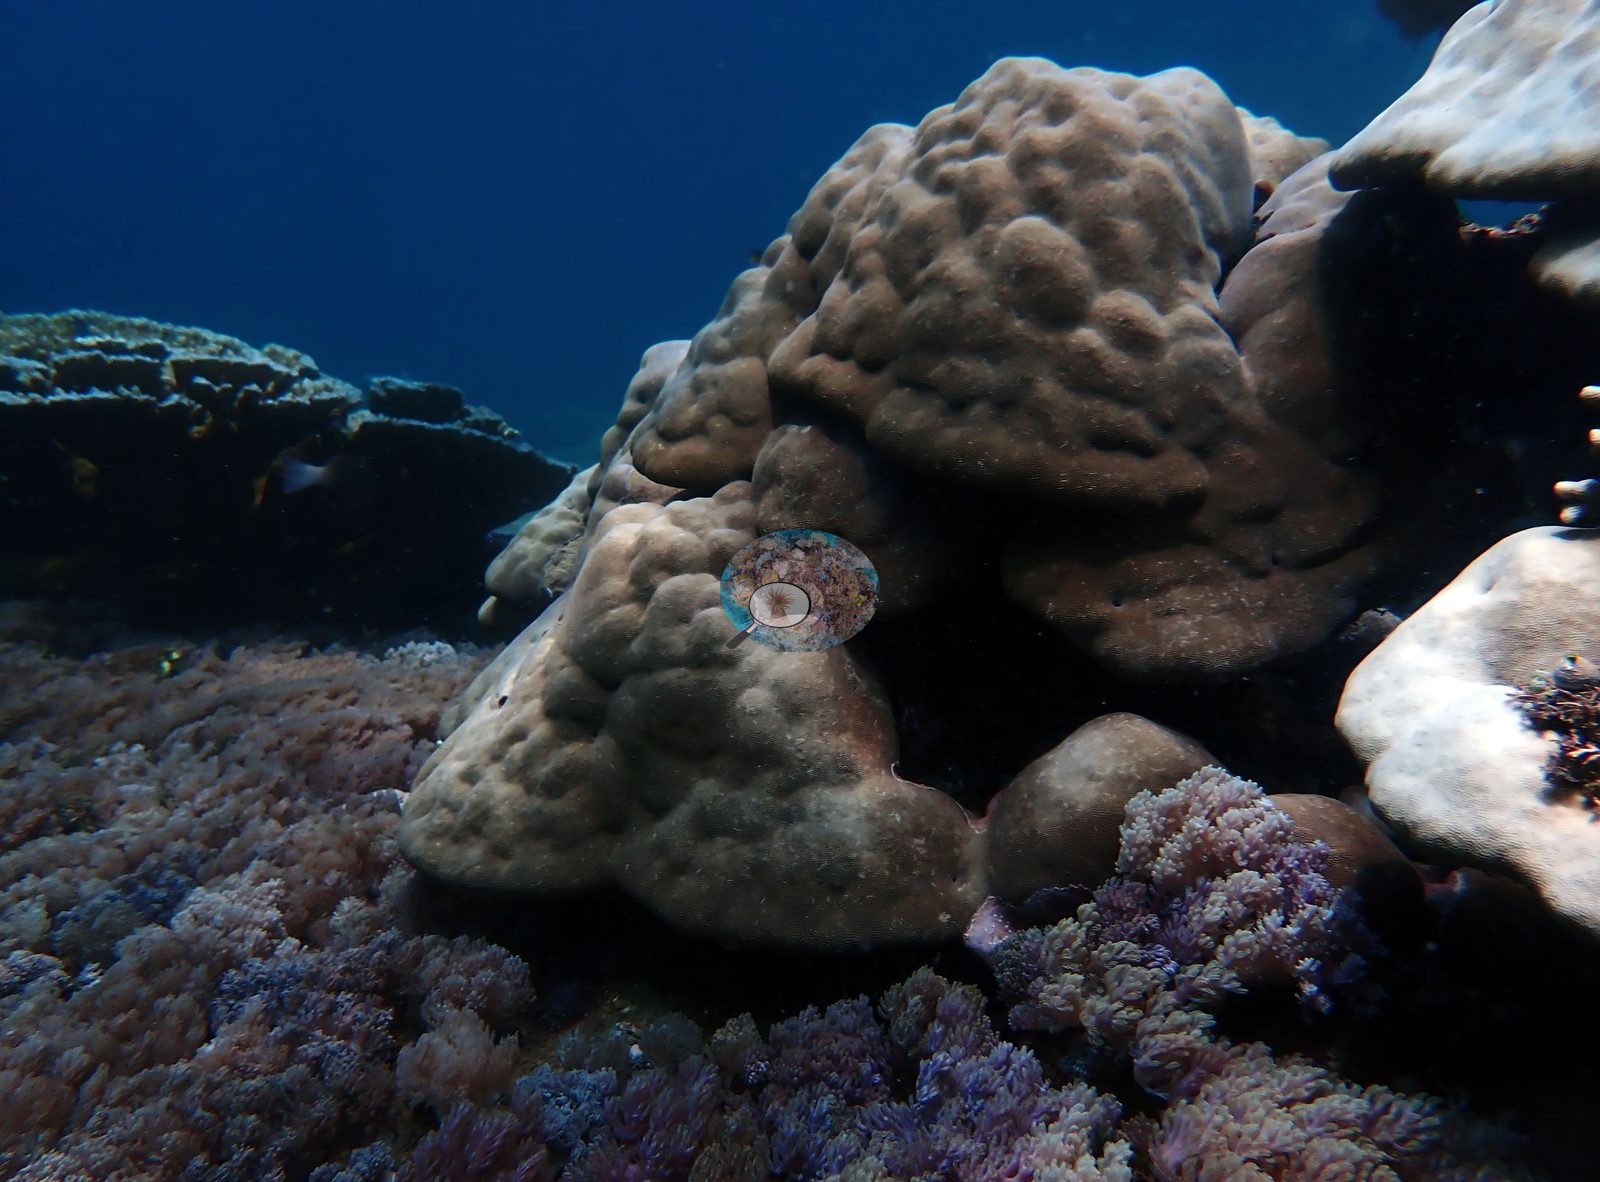
Five frames show mixed acroporid thickets running to the frame edges in tan, dusty pink, and lilac. Massive corals are the second element rather than the first: a brown lobed Porites-type dome, a meter-plus tan dome carrying an old linear scar, pale cream lobed mounds, gray domes, a large brown foliose/laminar colony, and one striking meandroid brain with violet-blue walls and green valleys (e.g., Image 2).
Soft corals are a real presence -- pink and mauve Dendronephthya-type trees in three frames, and a ruffled yellow Sarcophyton-type toadstool in two frames. Anemones cluster in numbers in two frames, with an anemonefish alongside the Acropora bush. Crinoids perch on the tables in three frames; a sand-and-rubble patch is carpeted with blue Linckia-type seastars; brown fleshy macroalgae runs along several ledge tops.
Coral cover
Coral cover 40% -- and 61.9% of hard coral tissue bleached (March-April 2024). Measured from 108 white-balanced photographs taken at this site during the 2024 Western Indian Ocean mass bleaching event and point-annotated in CoralNet, published in Mayfield, A.B. (2025) A Citizen Science Approach for Documenting Mass Coral Bleaching in the Western Indian Ocean. Environments 12(8):276. doi:10.3390/environments12080276. This is a published diver-photograph point-annotation value, not a computer vision estimate, and it is not recomputed here. Across the 20 Kenyan sites the mean was 30% coral cover and 77.1% of tissue bleached.
Stressors
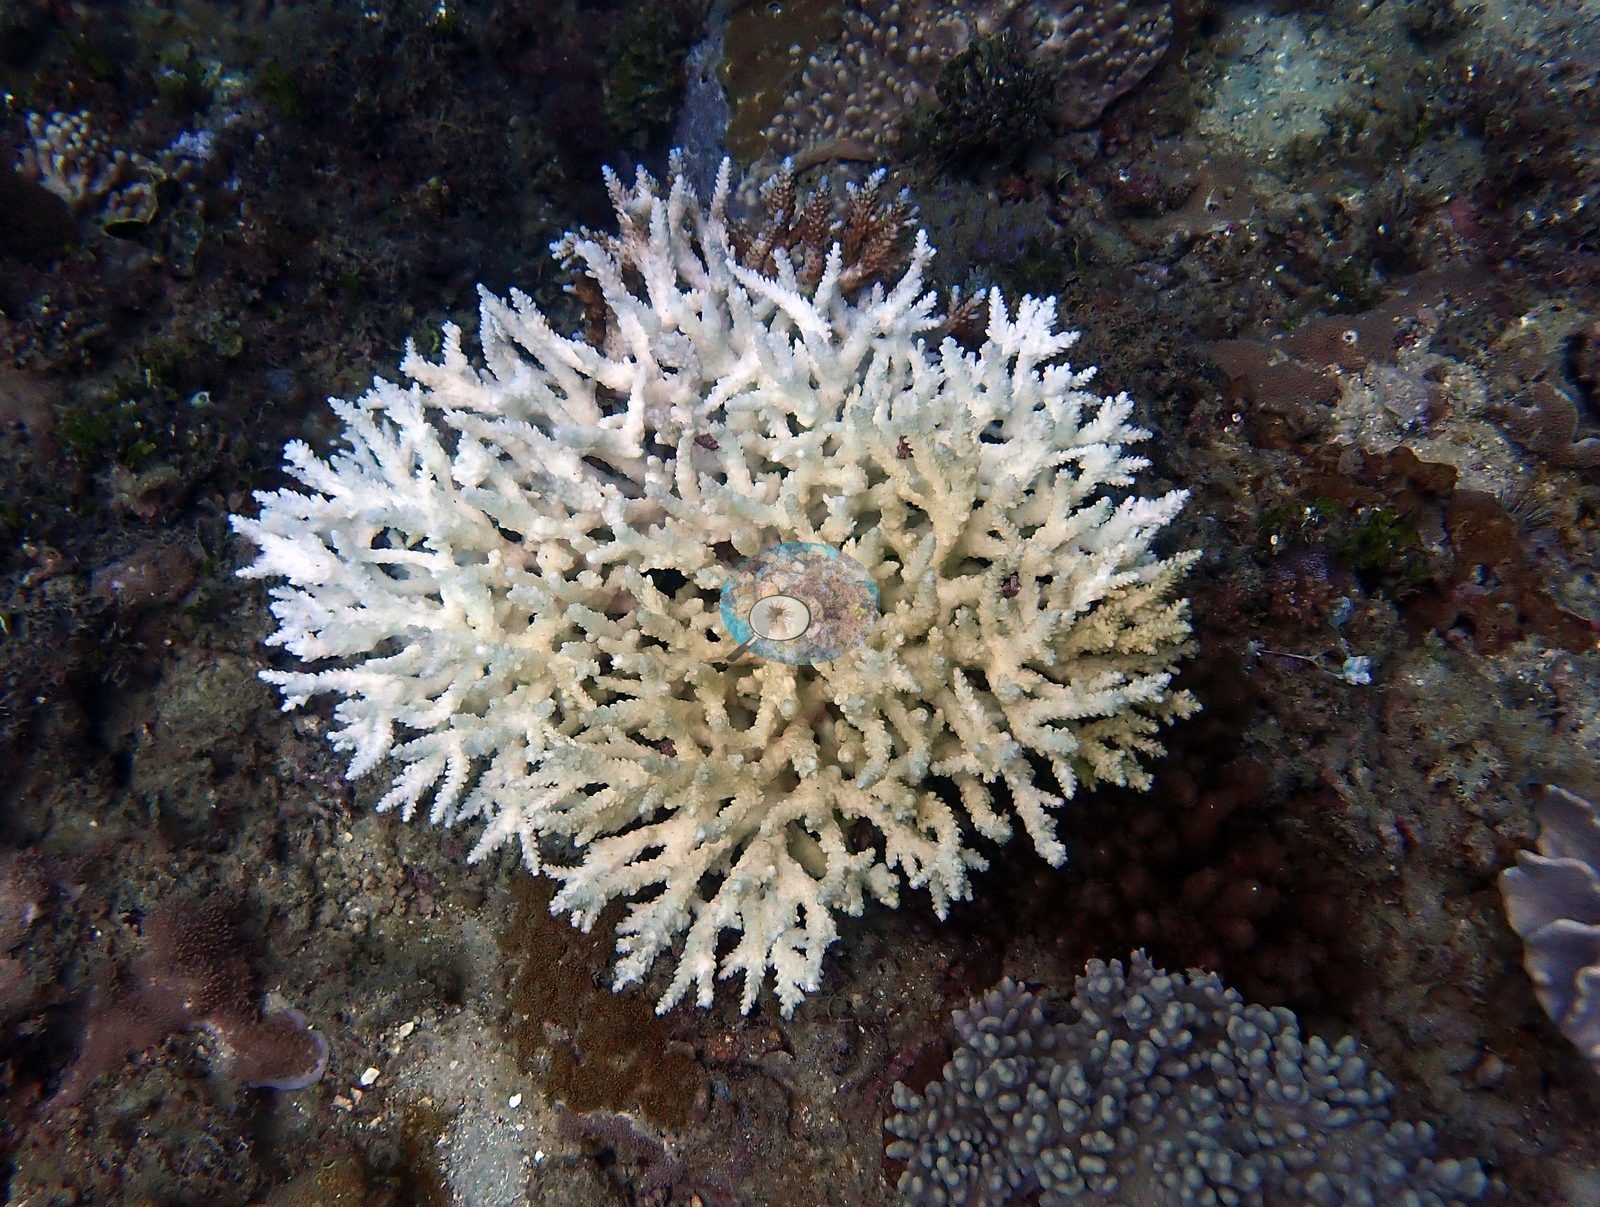
Condition. Bleaching is severe and it is emphatically not confined to one growth form. The frames are color-adjusted (see below), so paling has been read from structure rather than absolute tone: the calls below are colonies that are bare white with corallite detail intact, sharp margins against dark pavement, and no algal turf on the skeleton. One frame is an entire branching thicket bleached bone-white; two others each set a brilliant white massive lobed colony beside fully pigmented neighbors; another has white plating fragments in otherwise tan pavement; three more carry white colonies scattered through wide shots; one is a cluster of eight or more bone-white branching and corymbose colonies in a single frame; another puts a stark white branching colony against a dark chocolate massive; one more is a large white foliose colony under a yellow soft coral. The three frames Anderson named himself close the set and make the point directly -- a bleached table lying pale on the flat, a bone-white branching colony, and, in "severe bleaching", a bright white massive Porites lobe immediately beside an equally white branching Acropora (e.g., Image 4).
Beyond those unambiguous cases, most of the big tables read pale cream to mustard rather than brown, which is what a 61.9% tissue-bleaching figure looks like across a table-dominated reef. Pigment is far from gone: four frames hold deep tan, pink, and lilac acroporids, and the massive domes in three others are solidly brown. The reef reads as a mosaic, but a pale one (e.g., Image 1).
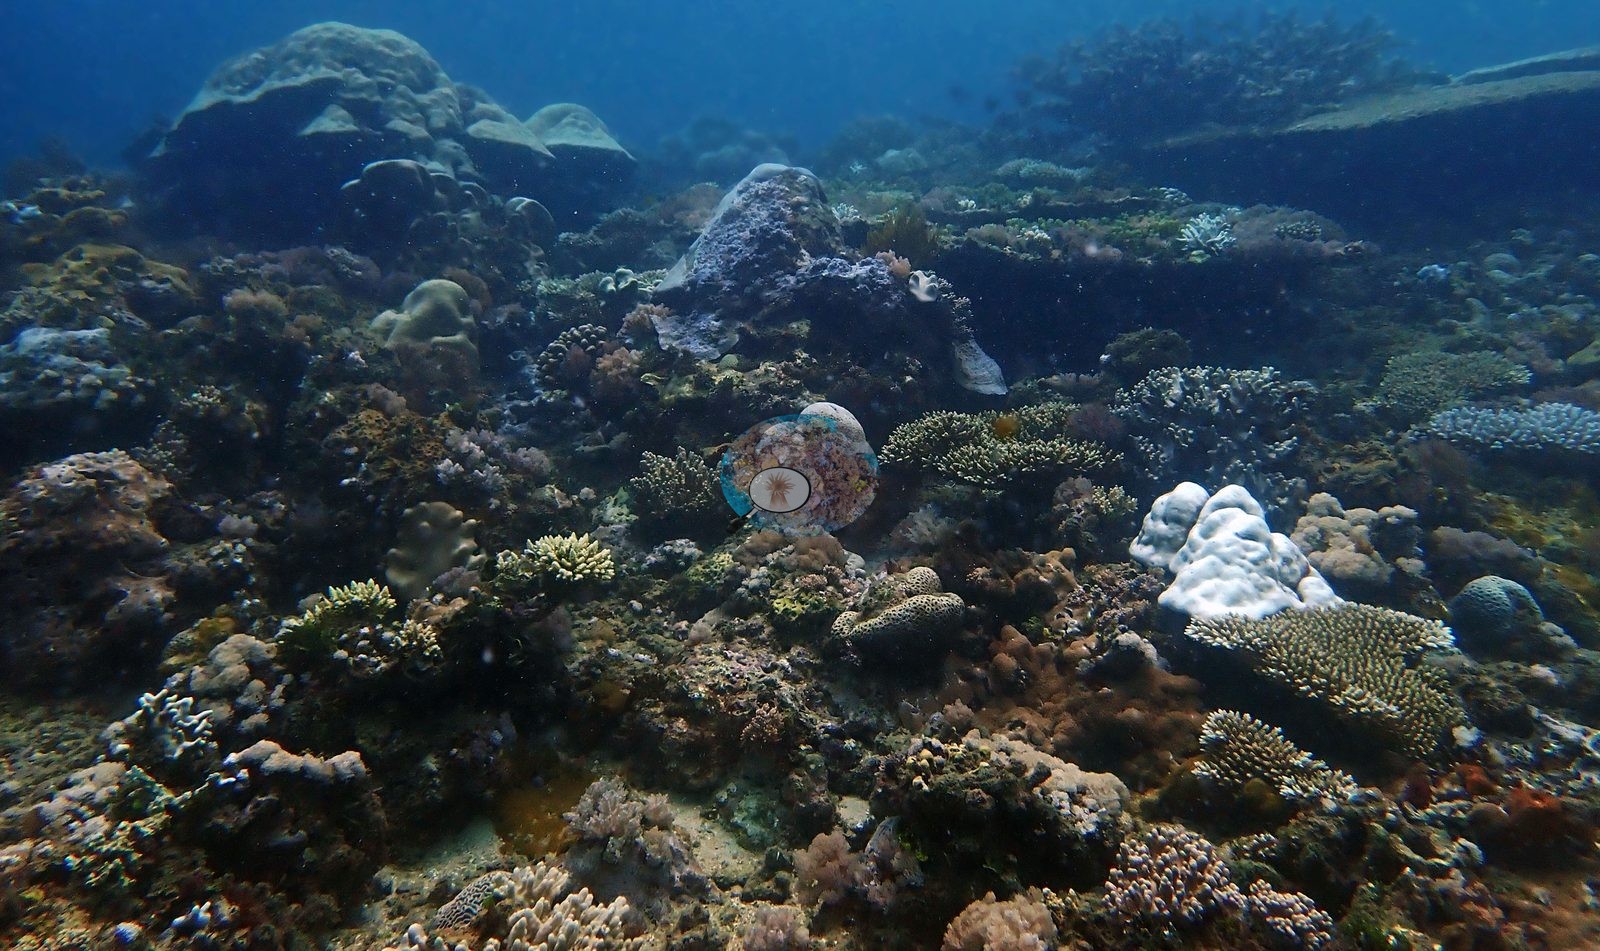
No crown-of-thorns seastar appears in any of the 99 frames reviewed, and no unambiguous disease lesion is visible. Typical recent thermal stress: mean annual maximum of 4.1 degree heating weeks (2021-2025, NOAA CRW; East African Coral Coast ecoregion). Also on record for this site: Seawater here measured 31.4°C during the survey (the Kenya survey-wide mean of 32.0°C matched the 1998 event), and NOAA recorded a peak of 13.5 degree-heating weeks on 18 April 2024, the highest for Kenya since records began in 1985. In situ temperatures ran 1.3°C above NOAA's estimates, so the true heat stress was likely nearer 22 DHWs.
Fish and other fauna
Fish are inconspicuous -- a yellow snapper, a fusilier over a table, scattered damsels and anthias. No dolphins appear in the set, despite the name.
Comparisons with other data
No independent survey was made at this exact site; the nearest ones are listed in the table below.
Dive record
Dived 21 Mar 2024 at about 7 m in Kisite Marine National Park, during the 2024 Western Indian Ocean mass bleaching event. Surveys were run with REEFolution.
Other notes
This account is written from the site's full photographic record rather than the four frames published to the map: all 99 photographs were opened and read one by one across 9 contact sheets.
CV model comparison
| Method | Hard-coral cover (%) |
|---|---|
| Manual (published) | 39.9 |
| CoralNet | 39.8 |
| In-house DINOv3 | 42.5 |
| CoralSCOP unedited | 27.0 |
Independent surveys nearby
| Agency / program | Year(s) | Stations / distance | Link |
|---|---|---|---|
| Global bleaching + environmental database | 2016 | 2 stations, 0.51–0.74 km | Records ↓ |
| Kenyan reef survey compilation (source not identified) | — | 2 stations, 0.73–0.89 km | Records ↓ |
| REEFolution Foundation | 2017–2019 | 4 stations, 0.40–3.99 km | Records ↓ |
| WCS Kenya / WCS Tanzania via MERMAID | 2020 | 1 station, 1.27 km | Records ↓ |
| WCS Kenya via MERMAID | 2009–2016 | 6 stations, 0.89–4.85 km | Records ↓ |
 Dr. Coral (CRD)Year-average (no detectable trend)
Within 5 km, 13 independent survey stations recorded hard coral cover in 81 records between 2009 and 2020. Of the 3 stations surveyed in more than one year, 1 increased and 2 changed by less than 5 percentage points between their first and latest surveys. The longest record, Dolphin Point (REEFolution Foundation, 0.40 km away), went from 20% in 2017 to 42% in 2019. The most recent nearby survey is from 2020, so these values predate recent heat stress. This site's own estimate (40%) sits within the range of these surveys (0.0–56%); the methods differ, so the comparison is context, not a like-for-like test. 2 further rows in the table have no survey date, so they are listed but not part of this summary.
Collected by other programs using different methods (MERMAID is a data platform: each MERMAID row names the organization that did the survey, and its method is in the row's hover text), so these are context for the figures above, not a like-for-like comparison. Where a station was surveyed more than once the range is shown. Station names are not dive-site names.
Show all 15 independent survey records
| Agency | Site / location | Date | Hard coral cover (%) | Distance | Link |
|---|---|---|---|---|---|
| WCS Kenya via MERMAID | Kisite (mean of 2 surveys, 2008–2009) | 2009 | 42% (4 images) | 4.61 km | Darling E. 2018. Kenya CRCP legacy. MERMAID |
| WCS Kenya via MERMAID | Kisite South of Site 1 | 2010 | 56% (2 images) | 4.85 km | Darling E. 2018. Kenya CRCP legacy. MERMAID |
| WCS Kenya via MERMAID | Kisite Edge 1 | 2013 | 42% (2 images) | 3.87 km | Darling E. 2018. Kenya CRCP legacy. MERMAID |
| WCS Kenya via MERMAID | Mpunguti | 2016 | 32% (3 images) | 0.89 km | Darling E. 2018. Kenya CRCP legacy. MERMAID |
| WCS Kenya via MERMAID | Kisite corner | 2016 | 50% (2 images) | 3.87 km | Darling E. 2018. Kenya CRCP legacy. MERMAID |
| WCS Kenya via MERMAID | Kisite 1 (mean of 3 surveys, 2012–2016) | 2016 | 46% (6 images) | 4.61 km | Darling E. 2018. Kenya CRCP legacy. MERMAID |
| Global bleaching + environmental database | Mpunguti bleach east | 2016-04-18 | 18% | 0.51 km | — |
| Global bleaching + environmental database | Mpunguti Bleach West | 2016-04-18 | 42% | 0.74 km | — |
| REEFolution Foundation | Dolphin Point | 2017–2019 | 20–42% (14 surveys) | 0.40 km | 2023. REEFolution Kenya. MERMAID |
| REEFolution Foundation | Lower Mpunguti | 2017–2019 | 0.0–8.0% (15 surveys) | 2.58 km | 2023. REEFolution Kenya. MERMAID |
| REEFolution Foundation | Outer Kisite | 2017–2019 | 39–53% (13 surveys) | 3.99 km | 2023. REEFolution Kenya. MERMAID |
| REEFolution Foundation | Lower Mpunguti (mean of 15 surveys, 2017–2019) | 2019 | 7.1% (15 surveys) | 2.58 km | 2023. REEFolution Kenya. MERMAID |
| WCS Kenya / WCS Tanzania via MERMAID | Mkwiro | 2020 | 29% (3 surveys) | 1.27 km | Darling E, Mensa J, O'Leary J, Schwarz A. 2020. BAF 1 - 2020. MERMAID |
| Kenyan reef survey compilation (source not identified) | Upper Mpunguti Seaward (site code S_UPS’14), South zone | — | 12% | 0.73 km | — |
| Kenyan reef survey compilation (source not identified) | Upper Mpunguti Leeward (site code S_UPL’14), South zone | — | 12% | 0.89 km | — |
Data & links
- CoralNet image repository for this region ↗
- Photo portfolio ↗
- Coral Reef Diagnostics page for this area ↗
All images from Coral Reef Diagnostics. Data are from Coral Reef Diagnostics and the organizations named in the data-sources table above.
© Coral Reef Diagnostics.