
Kenya - Lower Mpunguti-site 2 (Kisite National Park)

Part of the regional summary: Kenya
More info
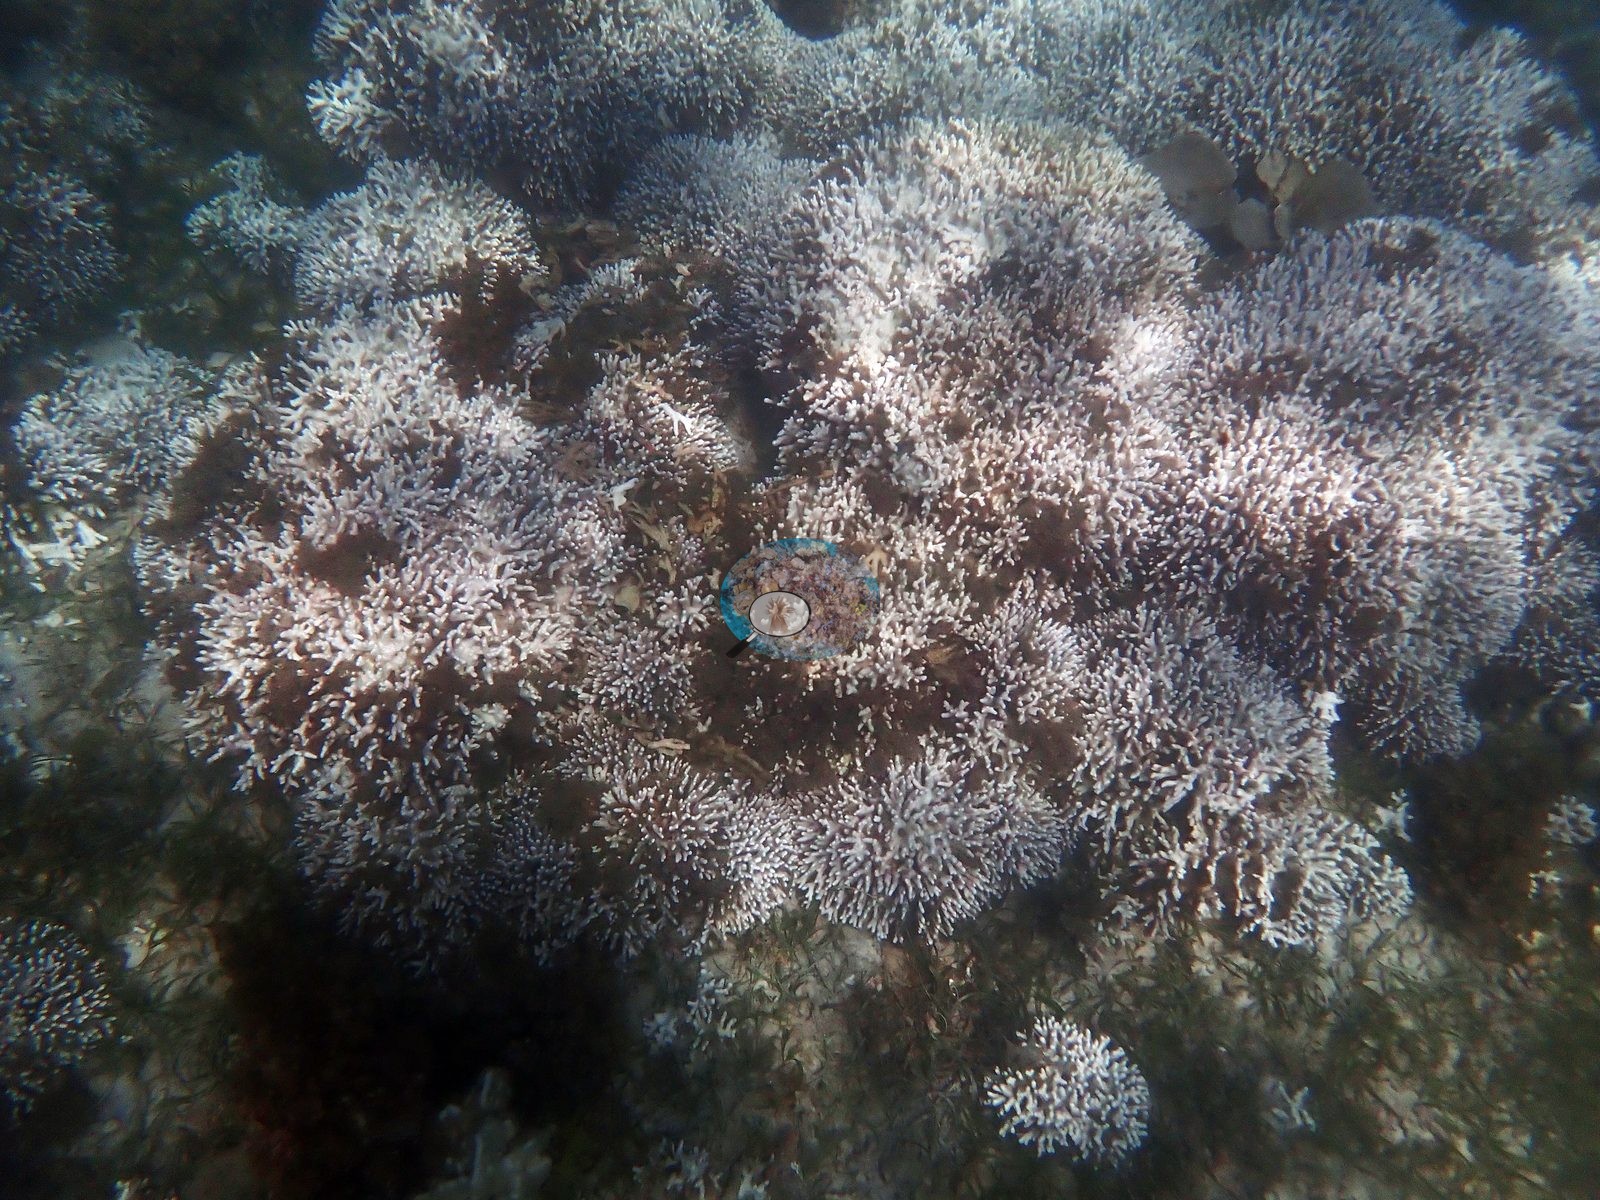
Kenya (NOAA CRW virtual station) · East African Coral Coast ecoregion mean=4.1°C-heating weeksLower Mpunguti-site 2 is a densely covered reef flat where nearly everything was found bleached at once - continuous corymbose Acropora thickets gone bone-white to the branch tips, and even massive Porites domes (normally the growth form that holds on best) whitened over their entire surface. A mound of ruffled leather soft corals was found paling too, alongside two giant clams set into the rock. Published cover was 34%, above the Kenya-wide average, with 81.9% of coral tissue bleached, also above the 77.1% survey mean.
Mwamba wa nane na wa mwisho wa mkondo wa Shimoni, uliopigwa picha kwa dakika 22 mwanzo hadi mwisho mara tu baada ya Lower Mpunguti eneo la 1. Picha nne mfululizo zinaonyesha kichaka kinachoendelea cha Acropora ya umbo la kishada kilichopauka takriban kabisa, na vitobo vya Porites makubwa navyo vimepauka kwa ukamilifu.
Tafsiri ya muhtasari huu kwa AI; Kiingereza ndicho kinachotumika rasmi. Translated from the site’s shorter map summary.
25 independent survey stations shown with the program’s logo — click one to see how far it is from this site.
Seven other CRD dive sites within 5 km shown in orange — click a marker to open its page.
Site description
Setting
The set is a shallow, sunlit reef flat, and most frames are shot straight down or at a low oblique onto it -- sun banding is visible across the pavement in a third of them and there is no blue-water horizon anywhere in the sequence. Water is green-tinged and visibility moderate, well short of the clear blue at Coral Garden or Kisite site 4.
General benthic features
Frame by frame, this is a genuinely dense flat and an almost completely bleached one. The signature of the site is fine-branched corymbose Acropora growing as continuous multi-colony thickets rather than scattered heads: four consecutive frames near the end of the run are filled corner to corner with such thickets, every colony blanched to a uniform bone-white or pale lilac-white down to the branch tips, the individual rosettes still structurally intact with no algal overgrowth yet -- recent bleaching, not old mortality (e.g., Image 4).
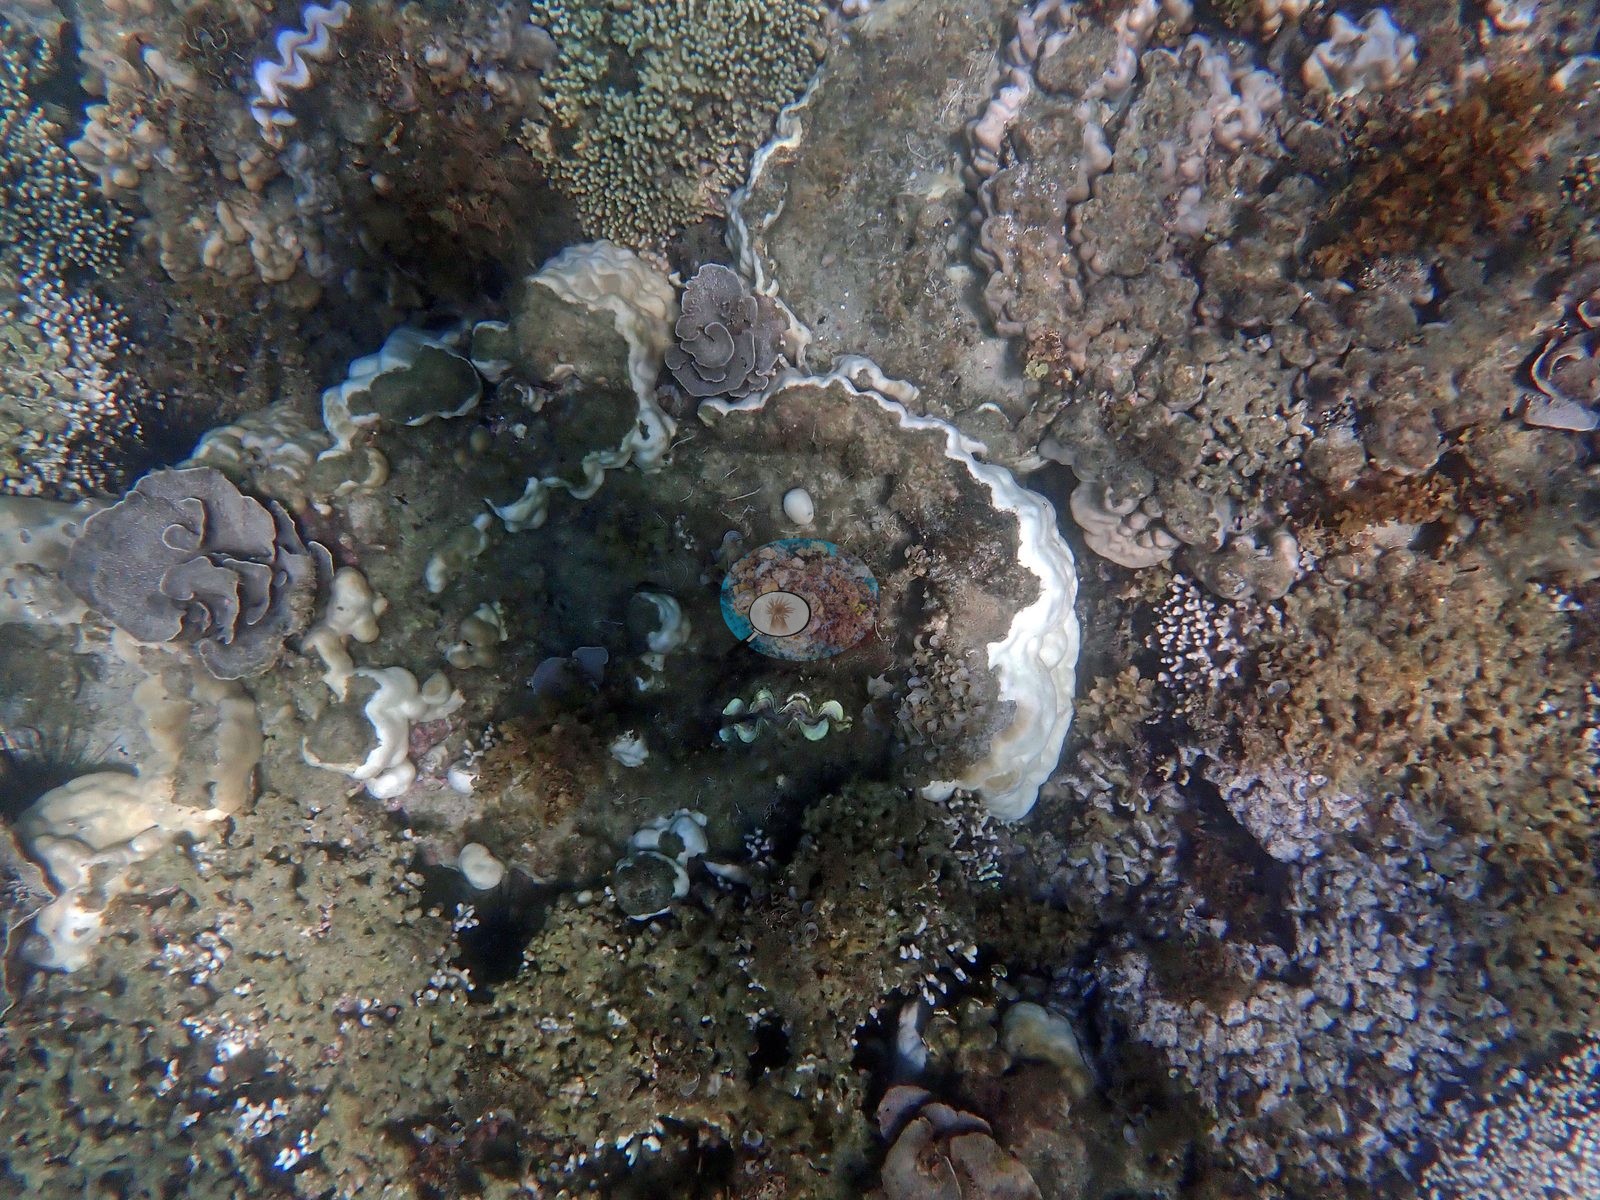
One frame is the best overhead record of the flat itself: near-total substrate occupancy, with mauve-purple foliose and encrusting plate colonies whose lobed margins have blanched white, yellow-green pocilloporid and small knobby colonies packed between them, coralline-crusted pavement filling the gaps -- and at least two giant clams (Tridacna) set into the rock, the larger showing a thick, brilliant white fluted shell margin around a dark gape, a smaller one showing a green-mottled, apparently pigmented mantle (e.g., Image 1).
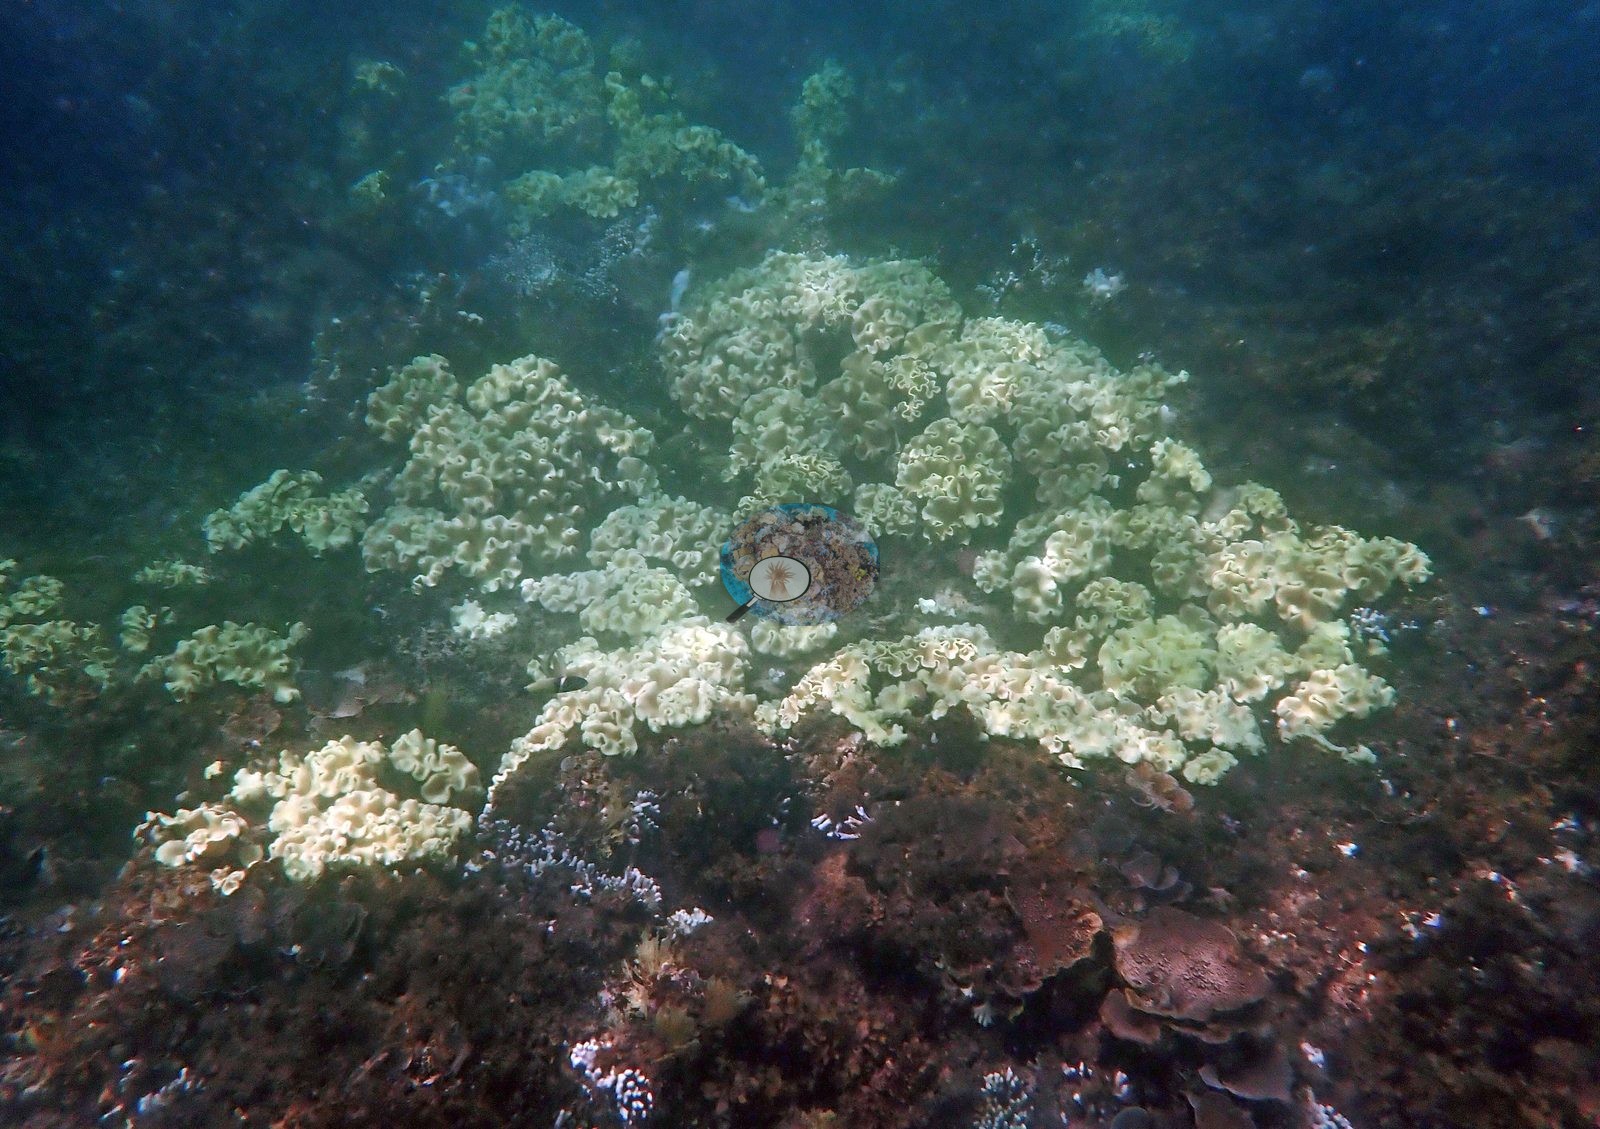
One frame stands apart. It is a low mound carpeted almost entirely in ruffled, cabbage-like leather soft corals (Sarcophyton/Lobophytum type) -- dozens of colonies packed shoulder to shoulder across the whole rise, all a uniform pale cream-yellow rather than the usual olive-khaki -- sitting over a dark rust-red algal turf, with small white branching Acropora dotted on the rock below (e.g., Image 3).
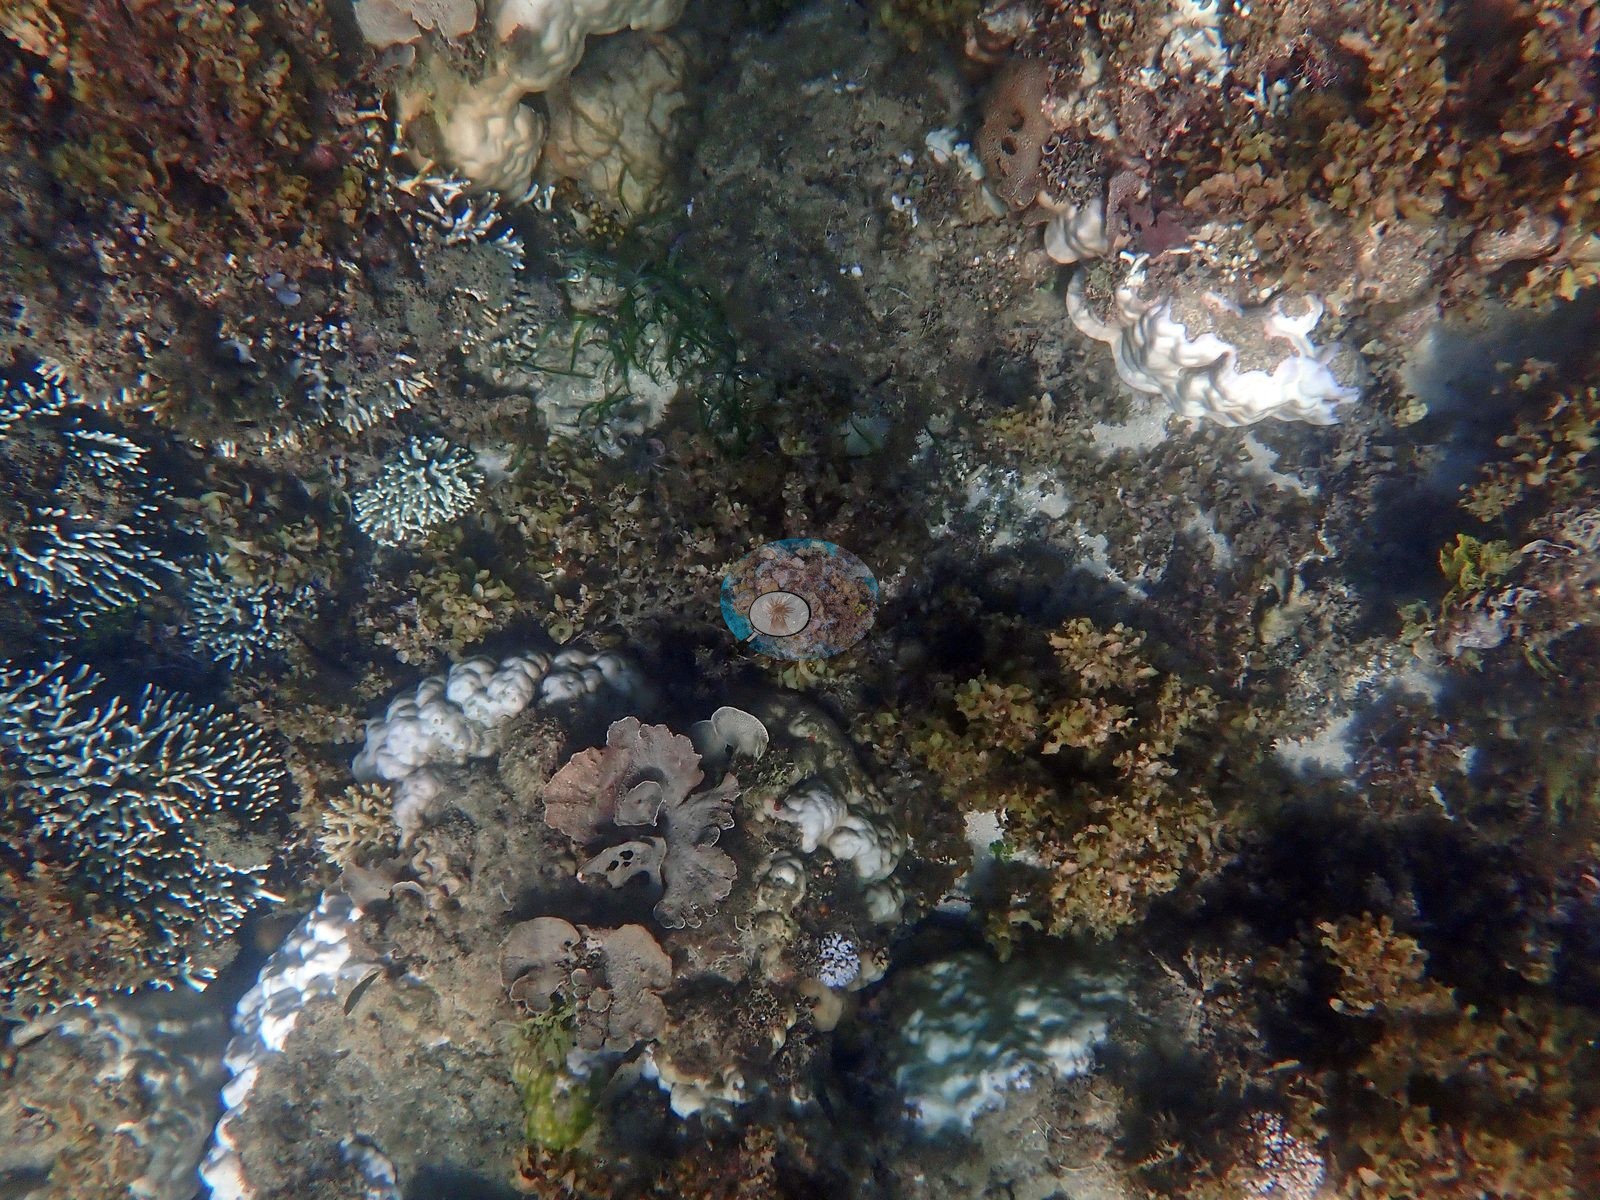
Algae are the other constant. Rust-red and olive fleshy fronds and dense filamentous green canopy blanket the pavement between coral stands in most frames, and one is almost nothing but that canopy over pale rock.
Coral cover
Coral cover 34% -- and 81.9% of hard coral tissue bleached (March-April 2024). Measured from 27 white-balanced photographs taken at this site during the 2024 Western Indian Ocean mass bleaching event and point-annotated in CoralNet, published in Mayfield, A.B. (2025) A Citizen Science Approach for Documenting Mass Coral Bleaching in the Western Indian Ocean. Environments 12(8):276. doi:10.3390/environments12080276. This is a published diver-photograph point-annotation value, not a computer vision estimate. Across the 20 Kenyan sites the mean was 30% coral cover and 77.1% of tissue bleached, so this reef held above-average structure while bleaching above the survey average. The full photographic set is consistent with that: the flat is well covered, and nearly everything on it is white.
Stressors
In one of them a single small pinkish-brown pigmented colony sits in the middle of that white field and is the only colored thing in the frame. Another frame shows the same growth form at wider scale: several distinct corymbose and tabular stands separated by sand and turf channels, grading from olive-yellow (pigmented) through pale gray-lilac to white across a few meters of reef. The massive corals -- normally the growth form that holds on -- did not here. Two frames capture the same pair of large nodular Porites-type domes, each roughly a meter across, one chalk-white and the other pale lilac-pink, both whitened over the entire colony surface with no pigmented margin left, standing on sand and green turf. Another frame has a second such pair overhead: a cream-white ridged dome beside a pale lavender one whose meandering valleys have gone dark where turf has taken the skeleton, the clearest tissue-loss signal in the set. Further pale nodular domes recur in two frames. One frame is the exception and the most informative single image on pattern: a large olive-brown digitate Acropora bommie that has kept most of its pigment but carries a stark snow-white bleached patch across its crown -- partial-colony bleaching within one stand, alongside a cream-tan massive dome and pale gray digitate colonies. Another frame repeats that mosaic with the pale lilac-white and cream colonies dominant and olive-brown patches surviving between them (e.g., Image 2).
Soft corals were paling here alongside the stony corals, and they are not counted in the hard coral figure. Typical recent thermal stress: mean annual maximum of 4.1 degree heating weeks (2021-2025, NOAA CRW; East African Coral Coast ecoregion).
Fish and other fauna
Fish are sparse: a pair of sergeant majors over a bleached tabular colony in one frame, scattered damselfish, small dark fish working the thickets. No large aggregation, no turtle, no ray, no crown-of-thorns, and no lesion or band suggesting disease anywhere in the 27 frames reviewed.
Comparisons with other data
No independent survey was made at this exact site; the nearest ones are listed in the table below.
Dive record
Surveyed 21 Mar 2024 in Kisite-Mpunguti Marine Protected Area during the 2024 Western Indian Ocean mass bleaching event -- the eighth and last reef of the Shimoni run, shot 22 minutes end to end immediately after the neighboring Lower Mpunguti site (camera clock 19:55-20:17 UTC, a continuous roll). Surveys were run with REEFolution.
Other notes
This account is written from all 27 in-water frames, not a four-frame select.
CV model comparison
| Method | Hard-coral cover (%) |
|---|---|
| Manual (published) | 34.2 |
| CoralNet | 34.2 |
| In-house DINOv3 | 42.6 |
| CoralSCOP unedited | 16.9 |
Independent surveys nearby
| Agency / program | Year(s) | Stations / distance | Link |
|---|---|---|---|
| McClanahan et al. (1996) | 1996 | 1 station, 4.79 km | Records ↓ |
| MERMAID project “KenyaBleachingSurveys_2024”* | 2024 | 1 station, 2.86 km | Records ↓ |
| REEFolution Foundation | 2017–2023 | 10 stations, 0.59–4.91 km | Records ↓ |
| WCS Kenya / WCS Tanzania via MERMAID | 2020 | 1 station, 2.61 km | Records ↓ |
| WCS Kenya via MERMAID | 2009–2019 | 12 stations, 2.26–4.53 km | Records ↓ |
 Dr. Coral (CRD)Year-average (no detectable trend)
Within 5 km, 25 independent survey stations recorded hard coral cover in 202 records between 1996 and 2024. Of the 9 stations surveyed in more than one year, 3 declined, 4 increased, and 2 changed by less than 5 percentage points between their first and latest surveys. The longest record, Kikuyu House (REEFolution Foundation, 2.92 km away), went from 32% in 2018 to 23% in 2023. Surveys since 2021 average 34% (range 4.9–66%, n=7). This site's own estimate (34%) sits within the recent range (4.9–66%); the methods differ, so the comparison is context, not a like-for-like test.
Collected by other programs using different methods (MERMAID is a data platform: each MERMAID row names the organization that did the survey, and its method is in the row's hover text. *Conducted by citizen scientists), so these are context for the figures above, not a like-for-like comparison. Where a station was surveyed more than once the range is shown. Station names are not dive-site names.
Show all 26 independent survey records
Data & links
- CoralNet image repository for this region ↗
- HeatCRD database ↗
- (reference) ↗
- Photo portfolio ↗
- Coral Reef Diagnostics page for this area ↗
All images from Coral Reef Diagnostics. Data are from Coral Reef Diagnostics and the organizations named in the data-sources table above.
© Coral Reef Diagnostics.
References
- McClanahan TR, Kamukuru AT, Muthiga NA, Yebio MG, Obura D (1996). Effect of Sea Urchin Reductions on Algae, Coral, and Fish Populations. Conservation Biology 10:136-154. DOI
- Mayfield AB (2025). A Citizen Science Approach for Documenting Mass Coral Bleaching in the Western Indian Ocean. Environments 12:276. PDF