
Kenya - Kisite National Park-site 4 (Kisite National Park)

Part of the regional summary: Kenya
More info
Tanzania (NOAA CRW virtual station) · East African Coral Coast ecoregion mean=4.1°C-heating weeksKisite site 4 combined the highest coral cover of any Kenya site in this study (45.5%) with near-total bleaching (89.2% of tissue) - a shallow coral garden dominated by dense knobby Galaxea sheets that read as a white 'snowfield' across entire hillsides, though close-up frames show some colonies retain pigmented polyp centers even when they look fully white from a distance. A crown-of-thorns starfish was photographed directly on bleached coral here, and a scattering of colonies - an olive-and-gold branching bommie, salmon-orange knobby corals - held full color as clear exceptions.
Bustani ya matumbawe yenye kina kifupi na kiwango kikubwa cha matumbawe, ya Galaxea yenye nguzo za matuta karibu inayoendelea bila kukatika, katika Hifadhi ya Taifa ya Bahari ya Kisite, iliyopigwa picha wakati karibu yote ilikuwa nyeupe. Nyota za bahari zenye miiba zilithibitishwa zikila moja kwa moja matumbawe yaliyopauka katika picha nne.
Tafsiri ya muhtasari huu kwa AI; Kiingereza ndicho kinachotumika rasmi. Translated from the site’s shorter map summary.
Twenty independent survey stations shown with the program’s logo — click one to see how far it is from this site.
Six other CRD dive sites within 5 km shown in orange — click a marker to open its page.
Site description
Setting
The setting first. Water is clear and blue in the deeper wide frames and hazier and green-cast over the shallow reef flat. Relief is real: discrete bommies rising off sand with fish clouds over them, and between them broad low-relief hardground of turf, rubble, and coralline pavement.
General benthic features
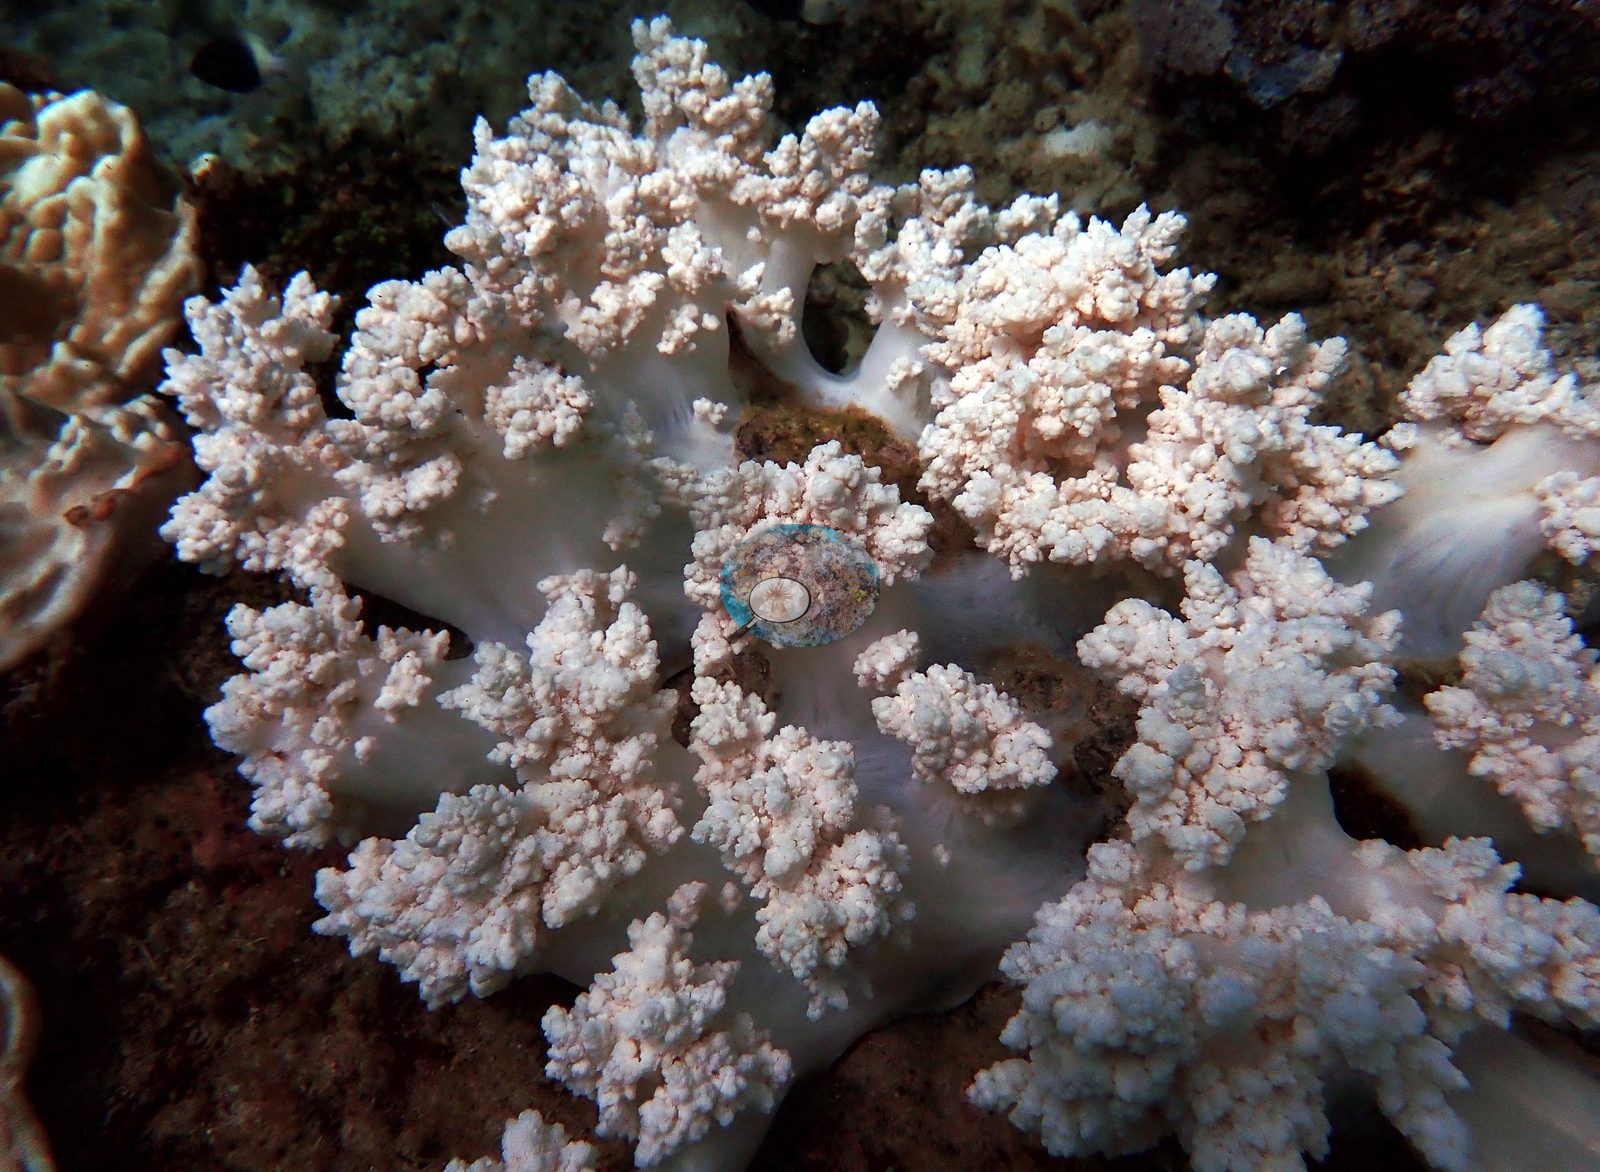
The full 72-frame set is a very different document from the four published frames: it is not a handful of bleached colonies on a mixed reef, it is a shallow, high-cover coral garden of almost continuous knobby columnar coral, photographed while nearly all of it was white. The reef itself is dominated to an unusual degree by one growth form: dense, knobby-to-columnar coral in continuous hummocked sheets that run out of frame in every direction. Roughly half the set is this one habitat (21 frames). Anderson's own frame labels identify this coral as Galaxea: one is a wide shot of exactly this field, and another is a single colony of it in close-up with the polyps still extended (e.g., Image 4).
Massive Porites is present as discrete lobate boulders rather than as the matrix, and meandroid Platygyra brains appear as isolated domes. Corymbose and digitate Acropora sit on the pavement between the Galaxea sheets, cauliflower-form Pocillopora is woven through, and Plerogyra bubble coral, foliose plate corals, and cream leather corals round out the assemblage. Three frames are the most colorful in the set, with pink and tan soft corals, red and yellow sponges, and gold crinoids among the pale coral. Between the coral, the pavement carries heavy turf and dark red fleshy macroalgae.
Coral cover
Coral cover 46% -- and 89.2% of hard coral tissue bleached (March-April 2024). Measured from 71 white-balanced photographs taken at this site during the 2024 Western Indian Ocean mass bleaching event and point-annotated in CoralNet, published in Mayfield, A.B. (2025) A Citizen Science Approach for Documenting Mass Coral Bleaching in the Western Indian Ocean. Environments 12(8):276. doi:10.3390/environments12080276. This is a published diver-photograph point-annotation value, not a computer vision estimate.
Stressors
On bleaching the set is emphatic, and it is emphatic on structure, not just on color. One frame is a whole hillside of columnar coral gone uniformly white from the bottom of the frame to the ridgeline against open blue -- a snowfield (e.g., Image 2).
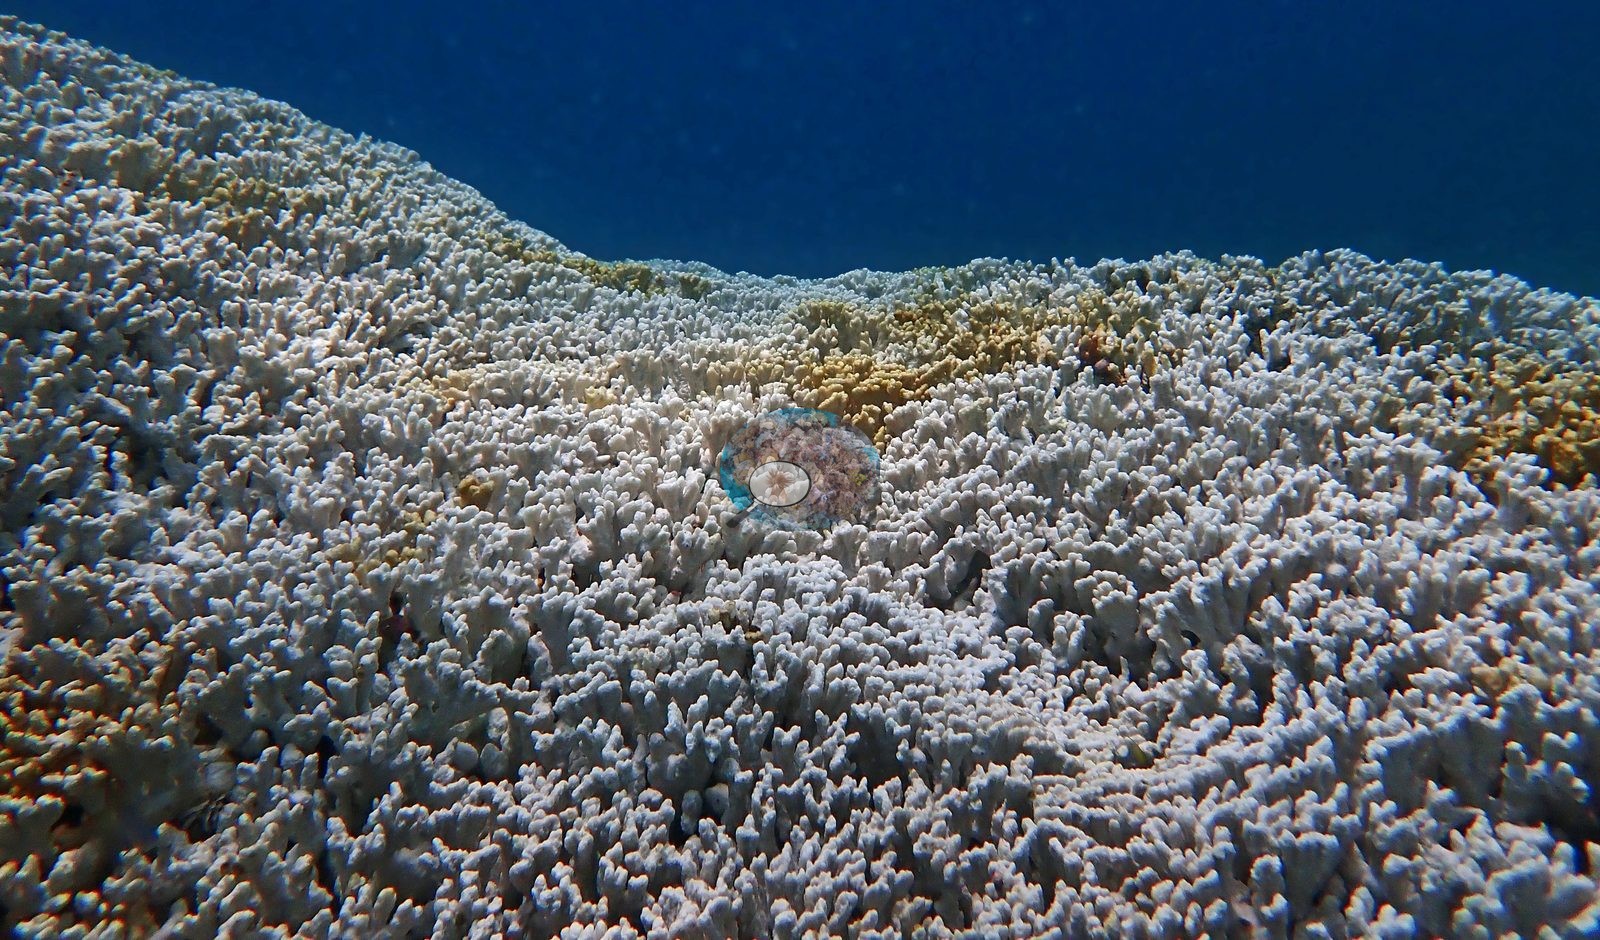
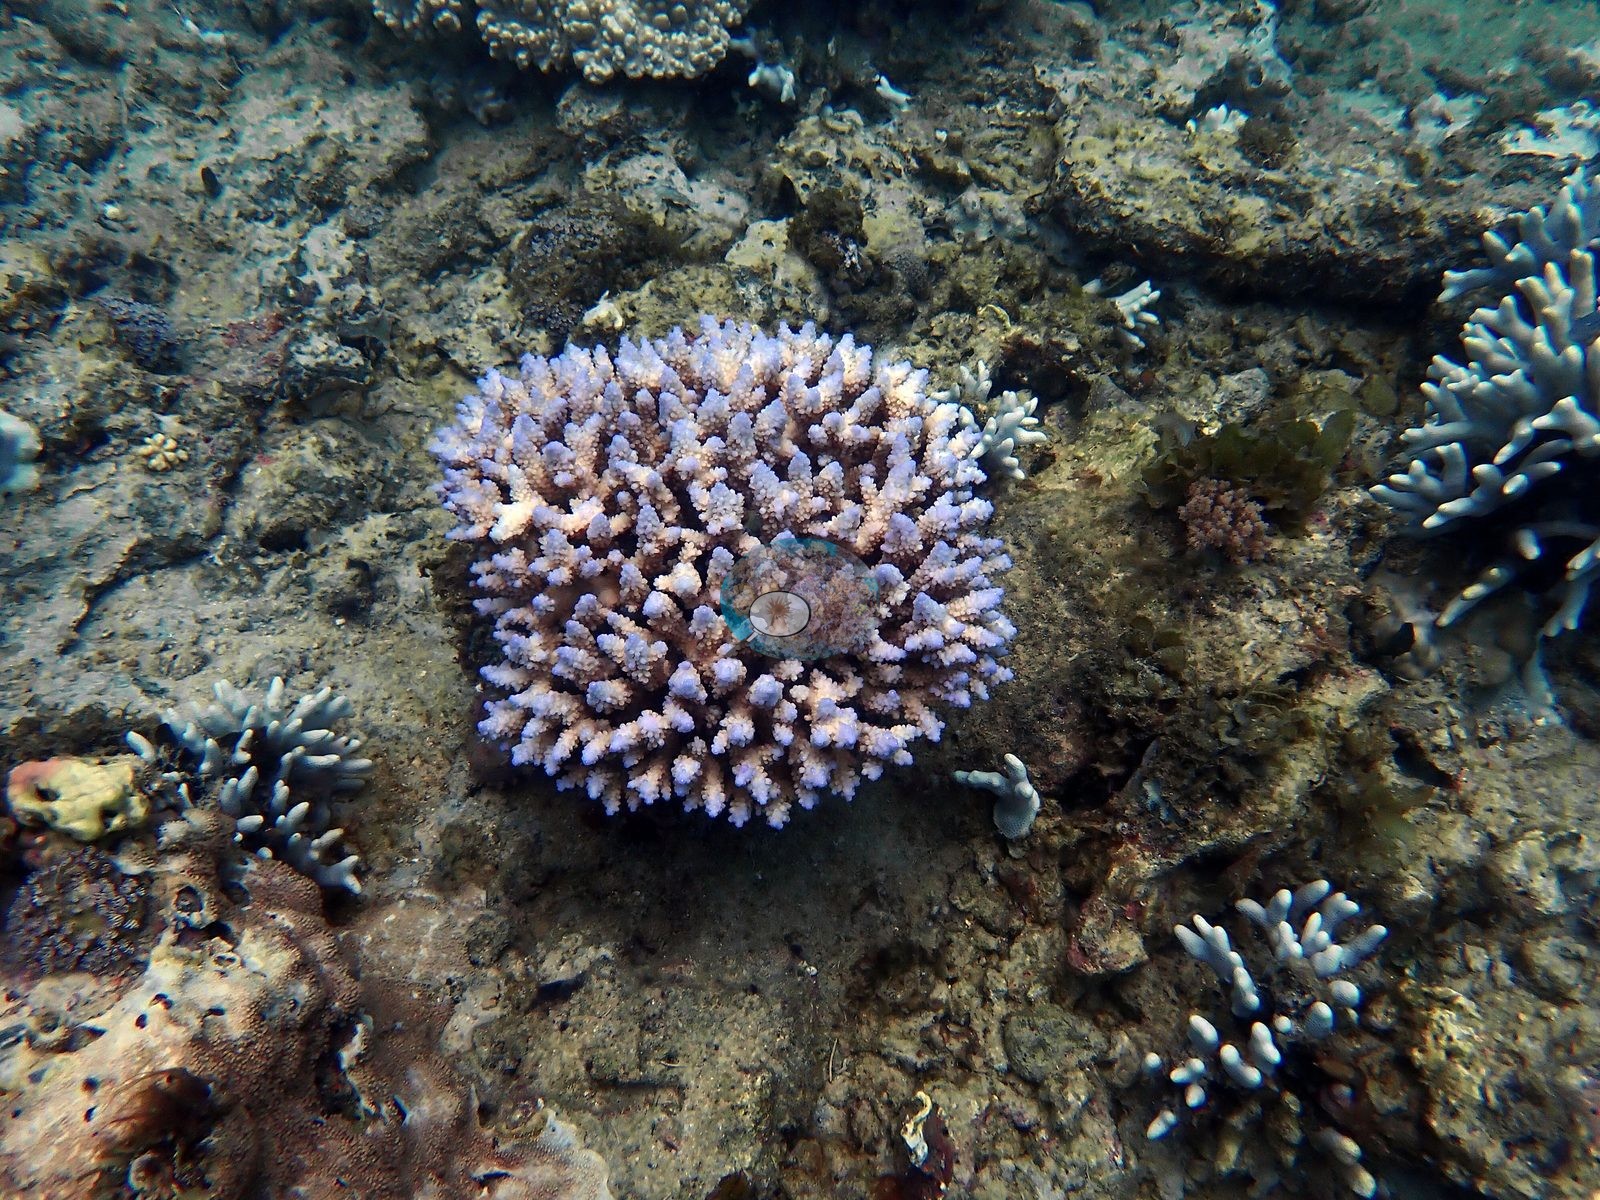
A wide frame of the Galaxea field shows the same thing. The Galaxea sheets read white to pale gray-lavender across every wide frame listed above, with whiteness carried unbroken across entire colony surfaces rather than in patches, which is the pattern of thermal bleaching rather than of shading or camera cast. The discrete taxa follow suit: one frame is a large Platygyra dome gone chalk-white with dead eroded depressions already opening on its upper surface; another is a meter-scale lobate Porites bleached pale gray-lavender with only small brown remnant patches; a third is a Plerogyra with every vesicle stark white; the close-up Galaxea is white with tentacles still fully expanded, i.e. alive and bleached rather than dead. Branching Acropora is the most absolutely white group in the set, and the cleanest evidence is within-frame contrast rather than absolute color: one frame is a single bone-white corymbose colony sitting inside a ring of dark red-brown fleshy macroalgae, and five others all show white branching colonies against dark turfed rock in the same exposure (e.g., Image 3).
Two close-ups explain why the published figure is 89.2% of tissue and not 100%. Both are macro views of the knobby coral in which each individual knob is bleached white or pale pink at its margins but still carries a dense gold-yellow polyp center. Tissue is present and partly pigmented at the polyp scale on colonies that read as fully white from a meter away. The same partial retention shows at colony scale in one frame, where paling mauve-white lobes sit beside knobs holding faint tan. A minority of the reef kept obvious pigment, and it is worth naming because it is the exception. One frame is an olive-and-gold branching bommie beside the diver, plainly pigmented in the same frame as pale surroundings. Another is a bommie of salmon-orange knobby colonies (e.g., Image 1).
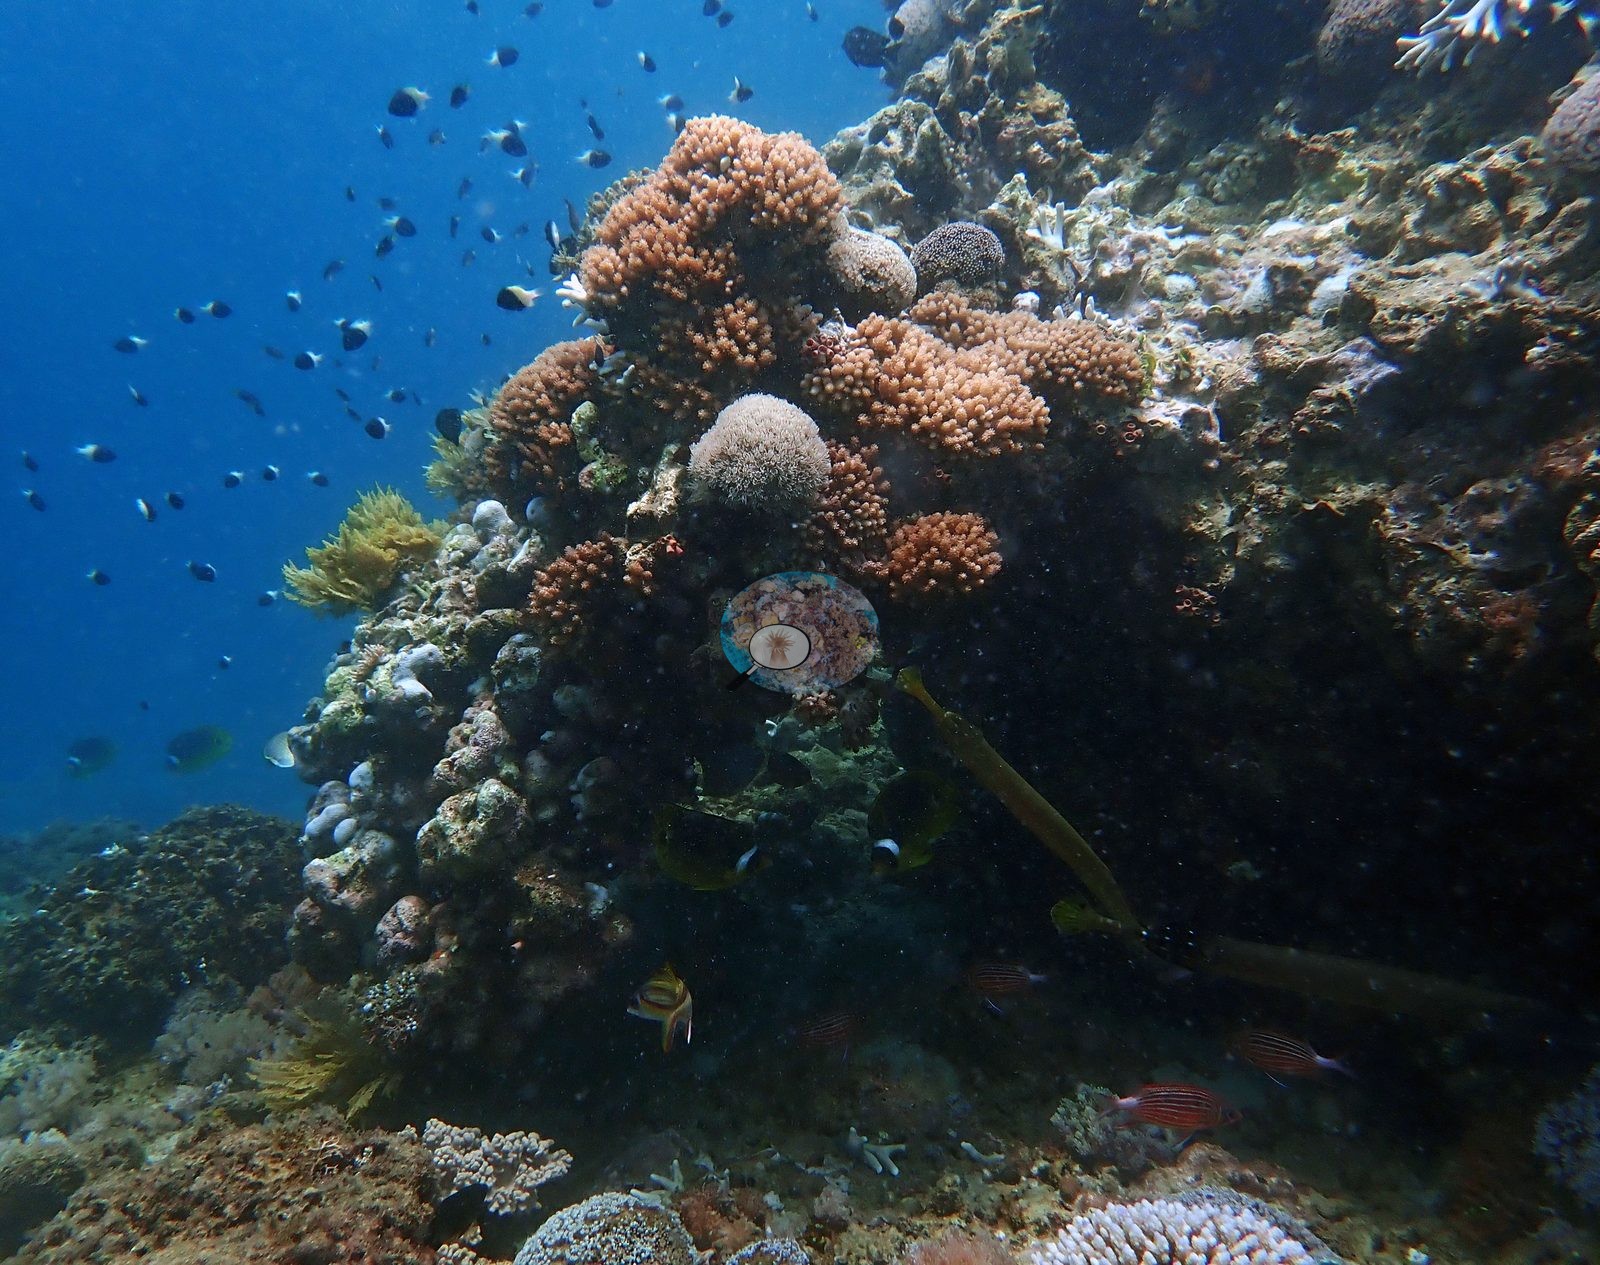
A third is a dark gray-purple encrusting dome on otherwise pale pavement. A fourth is a dark red-brown foliose plate. One more frame is a broad field of cream-tan ruffled leather corals, and another a deep maroon soft coral on sand -- both frames show soft corals holding color, so the earlier line that soft corals were bleaching alongside the stony corals is only partly supported and has been narrowed. Crown-of-thorns predation, which the earlier pass could only cite second-hand because no seastar appeared in the four published frames, is directly documented here in four frames. In every one the animal is draped directly onto white bleached coral, surrounded by pink fleshy macroalgae and red sponge -- predation stacked on top of thermal stress. The frames are mutually consistent with one or two individuals photographed repeatedly rather than an outbreak, and should not be read as four animals. Outright mortality is in the set too. One frame is an entire elongate massive colony already sheeted over in gray-green algal film with no live tissue visible, and the bleached Platygyra dome has open dead patches. Typical recent thermal stress: mean annual maximum of 4.1 degree heating weeks (2021-2025, NOAA CRW; East African Coral Coast ecoregion). Seawater here measured 31.6°C during the survey (the Kenya survey-wide mean of 32.0°C matched the 1998 event), and NOAA recorded a peak of 13.5 degree-heating weeks on 18 April 2024, the highest for Kenya since records began in 1985. In situ temperatures ran 1.3 degrees C above NOAA's estimates, so the true heat stress was likely nearer 22 DHWs.
Fish and other fauna
Other fauna recorded: a Phyllidia nudibranch, blue-gray with yellow tubercles, in three frames; a purple-and-orange Pseudoceros flatworm in three frames; a giant clam with a fully pigmented dark maroon mantle -- notable because it held color while the corals around it did not; dense clouds of damselfish and orange anthias over the bommies; and butterflyfish over the reef top.
Comparisons with other data
No independent survey was made at this exact site; the nearest ones are listed in the table below.
Dive record
Dived 21 Mar 2024 at about 6 m in Kisite Marine National Park with REEFolution, during the 2024 Western Indian Ocean mass bleaching event. Surveys were run with REEFolution.
Other notes
Two frames put a diver in the scene for scale.
CV model comparison
| Method | Hard-coral cover (%) |
|---|---|
| Manual (published) | 45.5 |
| CoralNet | 45.5 |
| In-house DINOv3 | 36.1 |
| CoralSCOP unedited | 17.9 |
Independent surveys nearby
| Agency / program | Year(s) | Stations / distance | Link |
|---|---|---|---|
| Kenyan reef survey compilation (source not identified) | — | 2 stations, 0.63–1.79 km | Records ↓ |
| McClanahan et al. (1996) | 1996 | 1 station, 3.96 km | Records ↓ |
| MERMAID project “KenyaBleachingSurveys_2024”* | 2024 | 1 station, 4.88 km | Records ↓ |
| REEFolution Foundation | 2013–2023 | 8 stations, 1.29–4.96 km | Records ↓ |
| WCS Kenya / WCS Tanzania via MERMAID | 2020 | 1 station, 0.57 km | Records ↓ |
| WCS Kenya via MERMAID | 2009–2019 | 9 stations, 0.81–4.89 km | Records ↓ |
 Dr. Coral (CRD)Year-average (no detectable trend)
Within 5 km, 20 independent survey stations recorded hard coral cover in 130 records between 1996 and 2024. Of the 7 stations surveyed in more than one year, 3 declined, 2 increased, and 2 changed by less than 5 percentage points between their first and latest surveys. The longest record, Kikuyu House (REEFolution Foundation, 4.96 km away), went from 32% in 2018 to 23% in 2023. Surveys since 2021 average 28% (range 23–36%, n=4). This site's own estimate (46%) sits 9.6 points above the recent range (23–36%); the methods differ, so the comparison is context, not a like-for-like test. 2 further rows in the table have no survey date, so they are listed but not part of this summary.
Collected by other programs using different methods (MERMAID is a data platform: each MERMAID row names the organization that did the survey, and its method is in the row's hover text. *Conducted by citizen scientists), so these are context for the figures above, not a like-for-like comparison. Where a station was surveyed more than once the range is shown. Station names are not dive-site names.
Show all 22 independent survey records
| Agency | Site / location | Date | Hard coral cover (%) | Distance | Link |
|---|---|---|---|---|---|
| McClanahan et al. (1996) | Kisite Island | 1996 | 24% (3 surveys) | 3.96 km | HeatCRD database |
| WCS Kenya via MERMAID | Kisite (mean of 2 surveys, 2008–2009) | 2009 | 42% (4 images) | 3.38 km | Darling E. 2018. Kenya CRCP legacy. MERMAID |
| WCS Kenya via MERMAID | Kisite South of Site 1 | 2010 | 56% (2 images) | 3.49 km | Darling E. 2018. Kenya CRCP legacy. MERMAID |
| WCS Kenya via MERMAID | Kisite Edge 1 | 2013 | 42% (2 images) | 2.83 km | Darling E. 2018. Kenya CRCP legacy. MERMAID |
| REEFolution Foundation | Kisite Edge 2 | 2013–2017 | 15–21% (2 surveys) | 4.58 km | 2023. REEFolution Kenya. MERMAID |
| WCS Kenya via MERMAID | Jiwe la kale East | 2014 | 25% (2 images) | 4.80 km | Darling E. 2018. Kenya CRCP legacy. MERMAID |
| WCS Kenya via MERMAID | Kisite 2 (mean of 2 surveys, 2012–2015) | 2015 | 48% (4 images) | 3.94 km | Darling E. 2018. Kenya CRCP legacy. MERMAID |
| WCS Kenya via MERMAID | Mpunguti | 2016 | 32% (3 images) | 0.81 km | Darling E. 2018. Kenya CRCP legacy. MERMAID |
| WCS Kenya via MERMAID | Kisite corner | 2016 | 50% (2 images) | 2.83 km | Darling E. 2018. Kenya CRCP legacy. MERMAID |
| WCS Kenya via MERMAID | Kisite 1 (mean of 3 surveys, 2012–2016) | 2016 | 46% (6 images) | 3.38 km | Darling E. 2018. Kenya CRCP legacy. MERMAID |
| REEFolution Foundation | Dolphin Point | 2017–2019 | 20–42% (14 surveys) | 1.29 km | 2023. REEFolution Kenya. MERMAID |
| REEFolution Foundation | Lower Mpunguti | 2017–2019 | 0.0–8.0% (15 surveys) | 1.45 km | 2023. REEFolution Kenya. MERMAID |
| REEFolution Foundation | Outer Kisite | 2017–2019 | 39–53% (13 surveys) | 2.82 km | 2023. REEFolution Kenya. MERMAID |
| REEFolution Foundation | Kisite 2 | 2017–2018 | 29–48% (3 surveys) | 3.94 km | 2023. REEFolution Kenya. MERMAID |
| REEFolution Foundation | Kikuyu House | 2018–2023 | 23–32% (24 surveys) | 4.96 km | 2023. REEFolution Kenya. MERMAID |
| REEFolution Foundation | Mkwiro CMA | 2018–2023 | 29–37% (7 surveys) | 4.96 km | 2023. REEFolution Kenya. MERMAID |
| REEFolution Foundation | Lower Mpunguti (mean of 15 surveys, 2017–2019) | 2019 | 7.1% (15 surveys) | 1.45 km | 2023. REEFolution Kenya. MERMAID |
| WCS Kenya via MERMAID | Mji wa Kale 2 (Mkwiro) (mean of 2 surveys, 2015–2019) | 2019 | 22% (4 images) | 4.89 km | Darling E, Kosgei J, McClanahan T, Muthiga N. 2019. Kenya MACMON 2016-17. MERMAID |
| WCS Kenya / WCS Tanzania via MERMAID | Mkwiro | 2020 | 29% (3 surveys) | 0.57 km | Darling E, Mensa J, O'Leary J, Schwarz A. 2020. BAF 1 - 2020. MERMAID |
| MERMAID project “KenyaBleachingSurveys_2024”* | Mji wa Kale 1 (Mkwiro) | 2024 | 36% (2 images) | 4.88 km | Kosgei J, Musembi P. 2024. KenyaBleachingSurveys_2024. MERMAID |
| Kenyan reef survey compilation (source not identified) | Upper Mpunguti Leeward (site code S_UPL’14), South zone | — | 12% | 0.63 km | — |
| Kenyan reef survey compilation (source not identified) | Upper Mpunguti Seaward (site code S_UPS’14), South zone | — | 12% | 1.79 km | — |
Data & links
- CoralNet image repository for this region ↗
- HeatCRD database ↗
- (reference) ↗
- Photo portfolio ↗
- Coral Reef Diagnostics page for this area ↗
All images from Coral Reef Diagnostics. Data are from Coral Reef Diagnostics and the organizations named in the data-sources table above.
© Coral Reef Diagnostics.
References
- McClanahan TR, Kamukuru AT, Muthiga NA, Yebio MG, Obura D (1996). Effect of Sea Urchin Reductions on Algae, Coral, and Fish Populations. Conservation Biology 10:136-154. DOI
- Mayfield AB (2025). A Citizen Science Approach for Documenting Mass Coral Bleaching in the Western Indian Ocean. Environments 12:276. PDF