
Kenya - North Canyon (Watamu)

Part of the regional summary: Kenya
More info
Kenya (NOAA CRW virtual station) · East African Coral Coast ecoregion mean=4.1°C-heating weeksNorth Canyon, despite its name, is not a canyon at all - the full photographic record shows a low-relief hardground reef top with discrete, well-separated colonies rather than continuous framework, and it sits at the bad end of the Kenya survey on both measures (22% cover, 95.3% of tissue bleached). Nearly every scleractinian in view is bone-white, cream, or pastel, with many colonies turning a distinctive salmon-pink to lilac stress coloration rather than pure white - a fluorescent-pigment response to losing their symbionts - and even host anemones were found bleached alongside the coral.
Eneo lenye kina kirefu zaidi kati ya matatu ya Watamu, kwa takriban 15 m, na lililopauka karibu kabisa kwa asilimia 95.3. Licha ya jina lake, hakuna ukuta, korongo wala pango linaloonekana katika hata moja ya picha 82; ardhi ni sakafu ngumu yenye mwinuko mdogo yenye koloni zilizotengana vizuri, na rangi ya msongo ya urujuani hafifu na waridi ndiyo alama ya kuonekana ya eneo hili.
Tafsiri ya muhtasari huu kwa AI; Kiingereza ndicho kinachotumika rasmi. Translated from the site’s shorter map summary.
Seven independent survey stations shown with the program’s logo — click one to see how far it is from this site.
Two other CRD dive sites within 5 km shown in orange — click a marker to open its page.
Site description
Setting
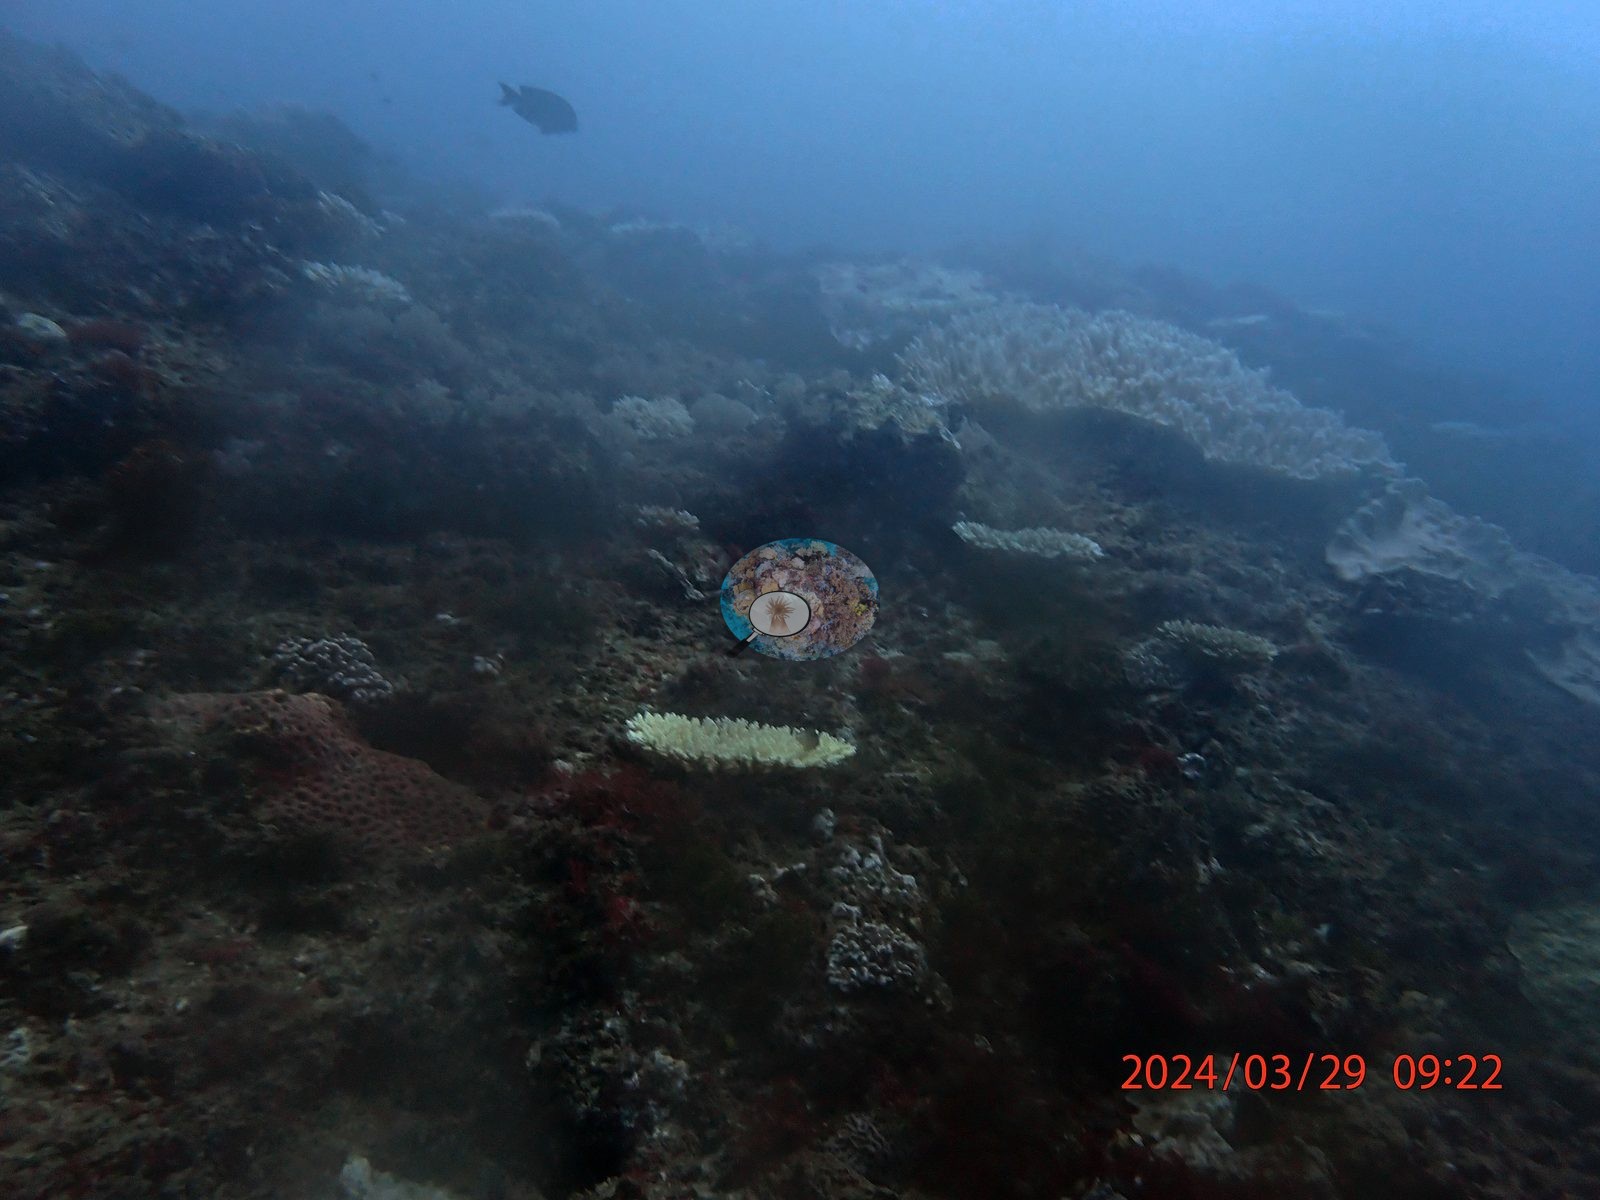
Terrain. Despite the name, the photographs do not show a canyon. There is no frame in the whole set of a vertical wall, a swim-through, or a steep undercut face. What the set shows is an extensive hardground reef top of low to moderate relief -- coralline-encrusted pavement, boulder and rubble aprons, sand pockets, and low bommie mounds -- with the outer edge sloping away into open blue in the wider frames (e.g., Image 4).
General benthic features
The reef is also not densely packed with coral. Across most of the set, colonies sit as discrete, well-separated individuals on algal pavement, and several frames hold only two or three corals in the whole field of view. Community. Foliose and laminar plates are the commonest growth form -- Turbinaria-, Echinopora-, and Montipora-type laminae and agariciid plates, some a meter or more across, stacked and overlapping on the low mounds. Massive and meandroid colonies are the second element and are unusually well represented: Platygyra brains, Lobophyllia and Symphyllia with thick banded ridges, cerioid Favites and Goniastrea, and nodular Astreopora and Porites boulders. Branching coral is present but subordinate and always in small isolated stands. Free-living fungiid discs sit on the rubble in two frames. Soft corals and leathers are scattered rather than dominant, and orange, red, and gray sponges and pink crustose coralline fill the interstitial rock. Algae and early mortality. Deep red fleshy and coralline algae are conspicuous across the pavement in roughly half the set, with bright green filamentous and Halimeda-type turf increasing through the later frames.
Coral cover
That is the visual counterpart of the published 21.6%, which sits well below the 29.9% Kenyan mean: the coral here is scattered, not continuous. Coral cover 22% -- and 95.3% of hard coral tissue bleached (March-April 2024). Measured from 83 white-balanced photographs taken at this site during the 2024 Western Indian Ocean mass bleaching event and point-annotated in CoralNet, published in Mayfield, A.B. (2025) A Citizen Science Approach for Documenting Mass Coral Bleaching in the Western Indian Ocean. Environments 12(8):276. doi:10.3390/environments12080276, Supplemental File S1. This is a published diver-photograph point-annotation value, not a computer vision estimate, and it is not recomputed here.
Stressors
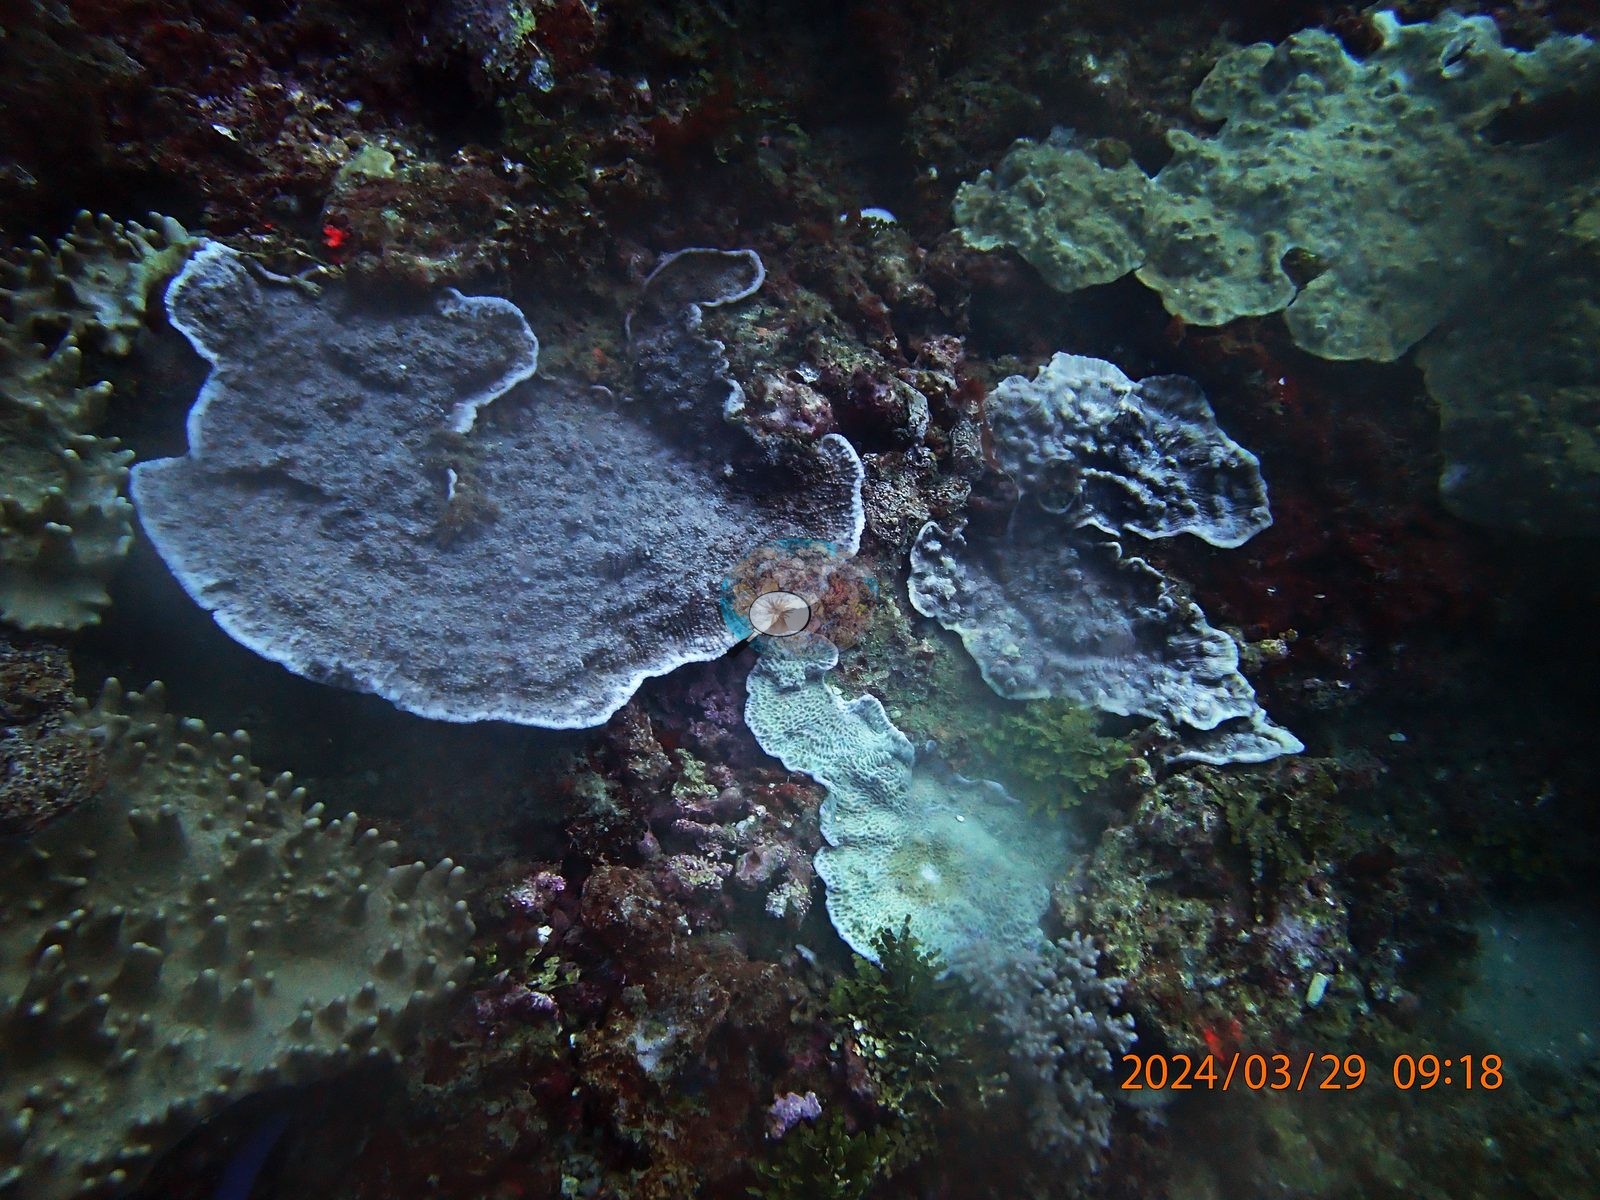
Bleaching. The full set is emphatic, and it confirms rather than softens the published 95.3%. In frame after frame every scleractinian colony in view is bone-white, cream, pale mint, pale blue, or pastel lilac (e.g., Image 1).
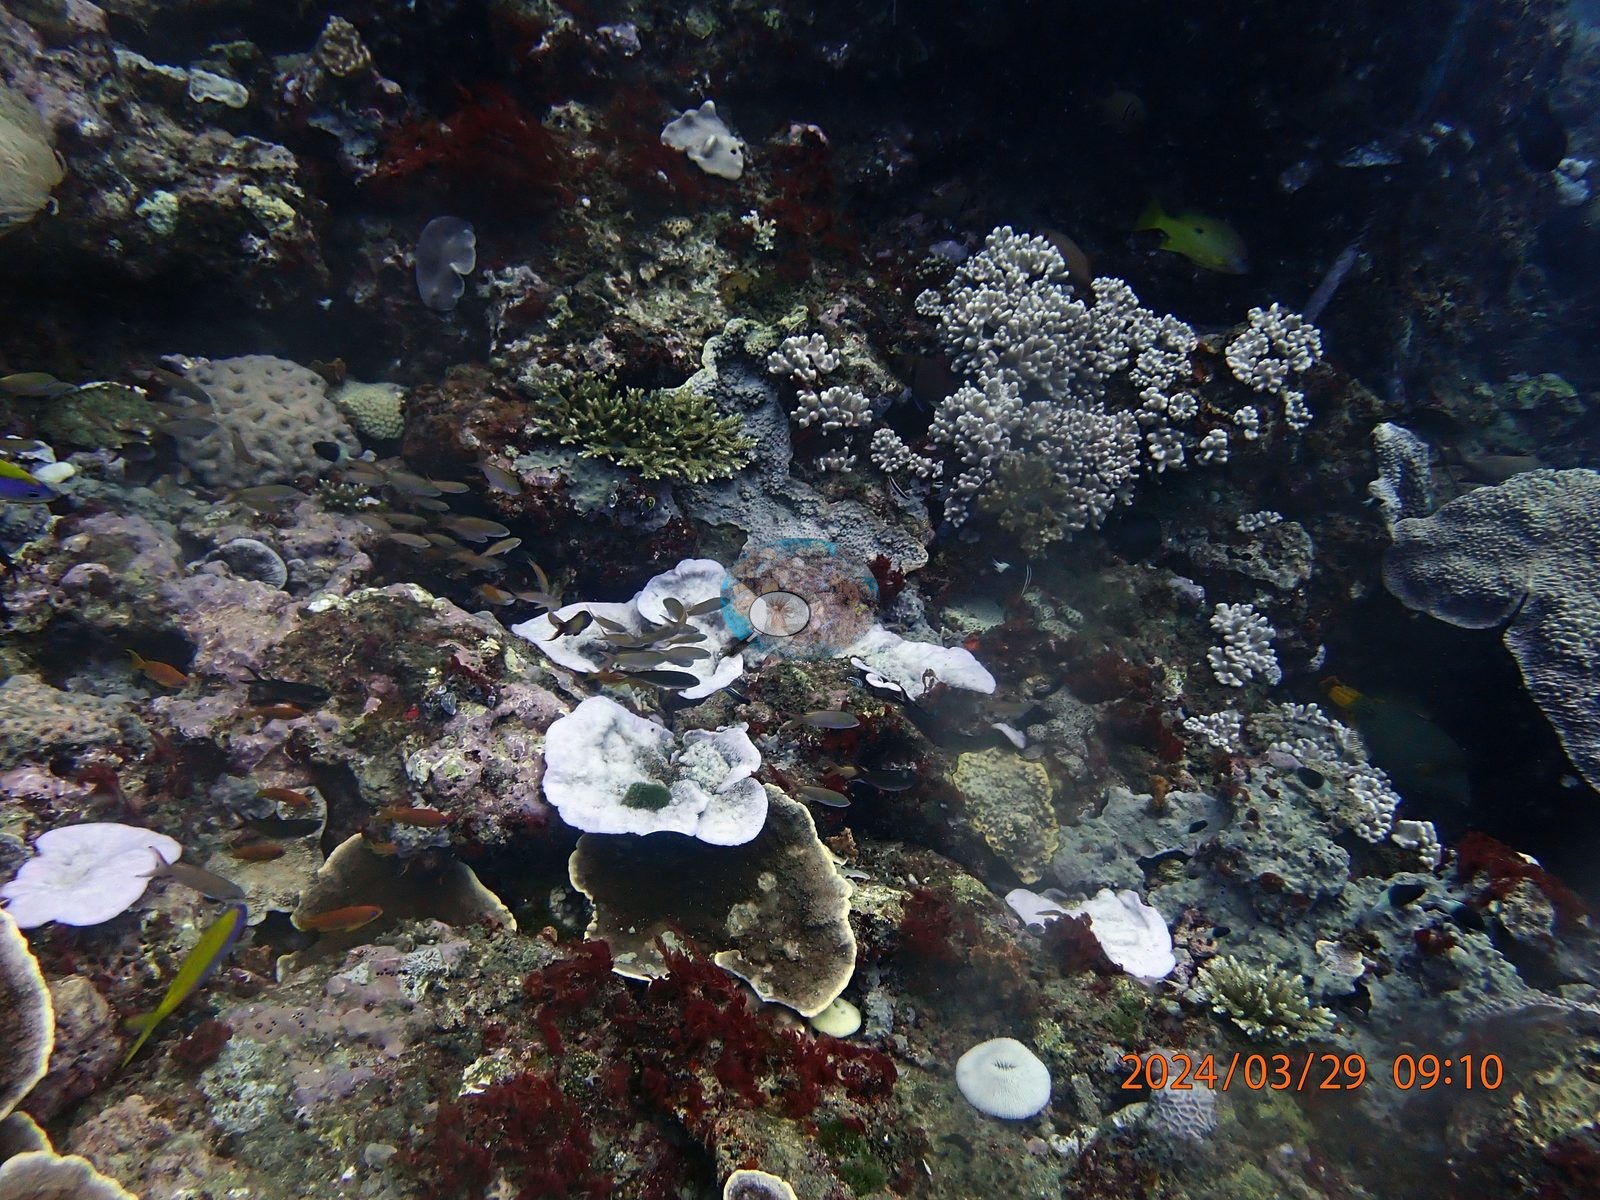
The most complete examples are massive and laminar: a large sheeting meandroid colony gone uniformly chalk-white in one frame; big white plates in ten frames; a fully white knobby dome in another; a white Platygyra in another (e.g., Image 3).
Branching coral fared no better -- every branching colony in the set is bone-white, with the corymbose and digitate Acropora in five frames white right down to the branch bases. The striking thing at North Canyon, and the observation from the earlier description that the full set most strongly supports, is the color the surviving colonies turned. A large number of massive and meandroid corals are not brown and not white but pastel: violet and mauve cerioid Favites, lilac and pink-gray lobate colonies, salmon-pink and cream banded Lobophyllia, a pale pink Platygyra abutting a stark white lobate colony in one frame, a mauve-pink brain dome, and lilac free-living fungiids (e.g., Image 2).
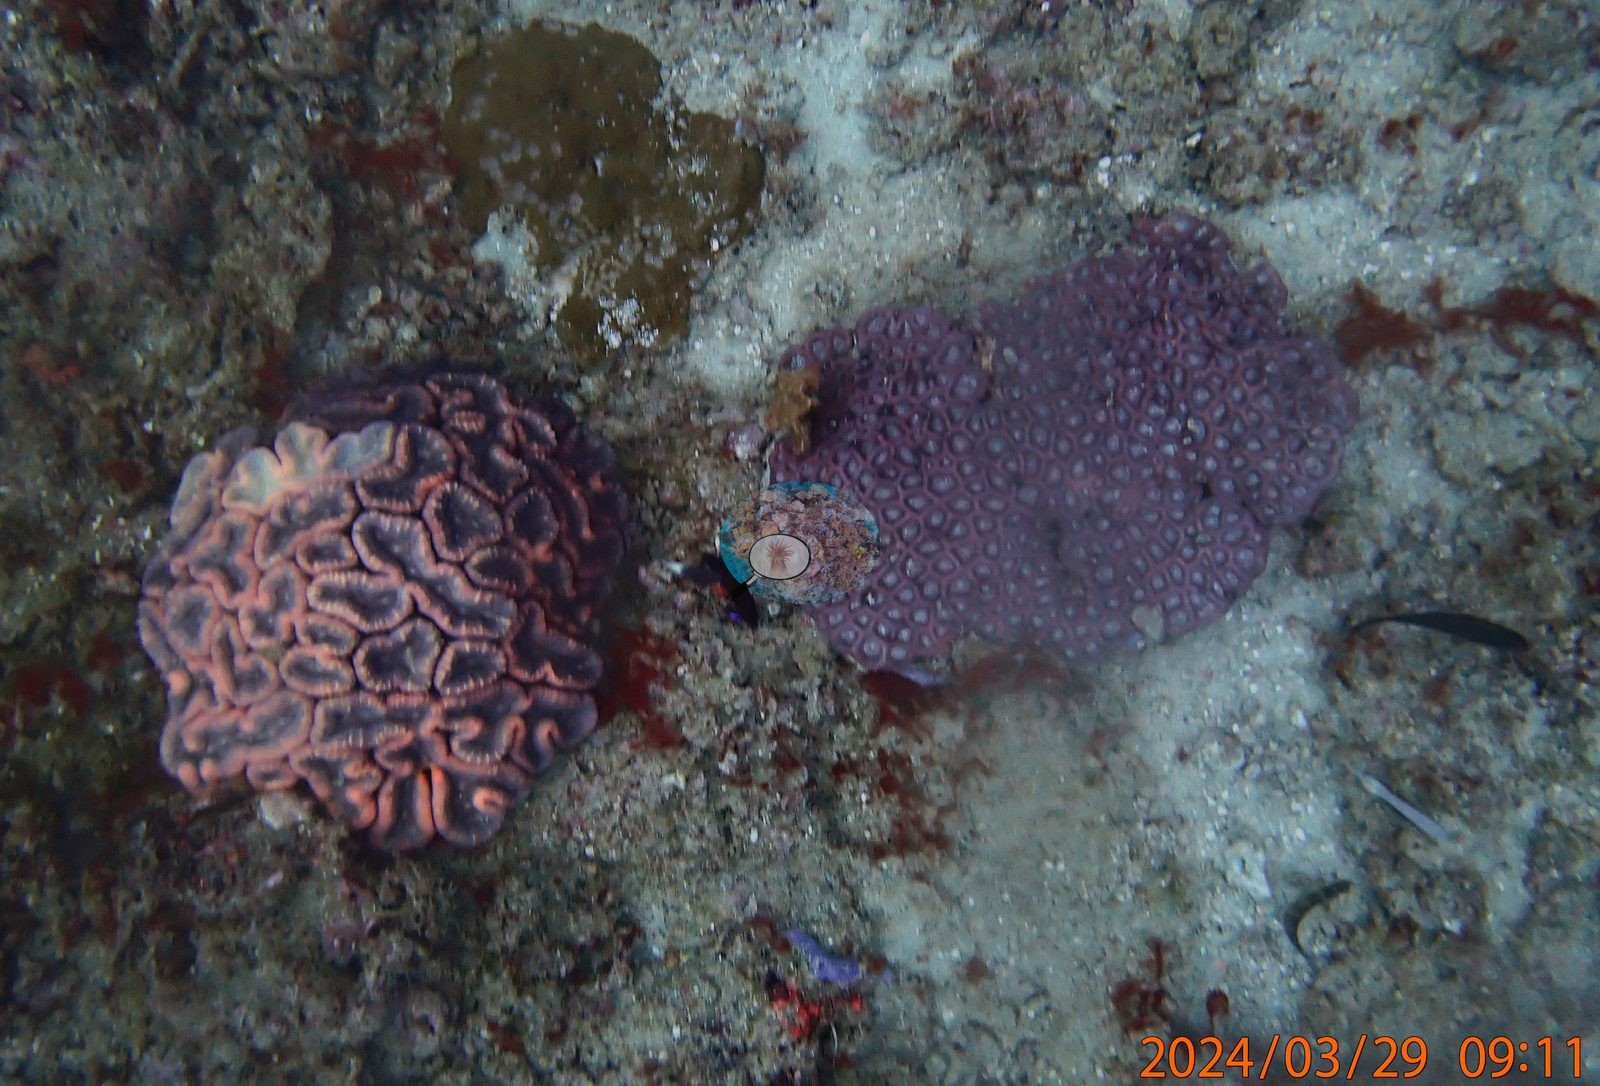
One frame is the clearest single example: a large gray-blue encrusting colony carrying a distinct patch of retained salmon-pink. This is the fluorescent-pigment stress response of a colony that has lost its symbionts but not yet its tissue, and it is the visual signature of this site. A small minority of colonies held normal brown or olive pigment, and they are worth naming because they are the exception and because they act as the internal control on the color-adjusted frames: a dark brown Platygyra dome, a tan tabular Acropora with a clean white growing margin, a dark olive-green encrusting colony among red algae, tan-brown tabulate plates, and a brown-gray brain hard against a bright white lobate colony in one frame. That last frame, and the frame with the pale pink Platygyra abutting a white lobate colony, are the two clearest within-frame contrasts in the set: pigmented and bleached skeletons side by side under one exposure. Several white colonies carry dark mottled patches that could be turf settling on newly dead skeleton, but nine days into the event the photographs do not resolve whether these are early tissue loss or sediment and shadow, and no unambiguous disease lesion is visible anywhere in the set. No crown-of-thorns seastars appear in any of the 82 frames. What does recur is bleached anemones: large host anemones with fully expanded but stark white or cream tentacles in four frames, and paler ones in two others -- a non-scleractinian bleaching signal on top of the coral figure. Typical recent thermal stress: mean annual maximum of 4.1 degree heating weeks (2021-2025, NOAA CRW; East African Coral Coast ecoregion). Seawater here measured 32.3°C during the survey (the Kenya survey-wide mean of 32.0°C matched the 1998 event), and NOAA recorded a peak of 13.5 degree-heating weeks on 18 April 2024, the highest for Kenya since records began in 1985. In situ temperatures ran 1.3 degrees C above NOAA's estimates, so the true heat stress was likely nearer 22 DHWs. Recorded seawater temperature at this site on the day was 32.3 degrees C.
Fish and other fauna
Fauna. Large mixed schools of yellow-and-blue fusiliers stream over the reef through the first third of the dive and are the dominant fish signal. Dark damselfish and chromis hang over the plates, an angelfish crosses one frame, and a red squirrelfish- or soldierfish-type fish sits in a crevice in another. Fish life reads as normal and abundant over an almost entirely bleached benthos, which is what would be expected in the first weeks of a bleaching event, before structural loss follows.
Comparisons with other data
Different station, different observers: a near-concurrent cross-check, not a repeat of this site.
Dive record
Dived 29 Mar 2024 at about 15 m off Watamu, the deepest of the three Watamu sites, at the height of the 2024 Western Indian Ocean mass bleaching event. Surveys were run with Extra Divers.
Other notes
This account is written from the site's full photographic record -- all 82 frames, opened one by one -- rather than the four frames published to the map, and on two points the full set corrects what those four implied.
CV model comparison
| Method | Hard-coral cover (%) |
|---|---|
| Manual (published) | 21.6 |
| CoralNet | 21.6 |
| In-house DINOv3 | 20.3 |
| CoralSCOP unedited | 19.1 |
Independent surveys nearby
| Agency / program | Year(s) | Stations / distance | Link |
|---|---|---|---|
| Kenyan reef survey compilation (source not identified) | — | 5 stations, 0.51–1.76 km | Records ↓ |
| McClanahan et al. 2016 | 2016 | 3 stations, 2.32–2.44 km | Records ↓ |
| WCS Kenya via MERMAID | 2014–2024 | 4 stations, 0.50–1.64 km | Records ↓ |
 Dr. Coral (CRD)Year-average (no detectable trend)
Within 5 km, 7 independent survey stations recorded hard coral cover in 15 records between 2014 and 2024. Of the 1 station surveyed in more than one year, 1 increased between their first and latest surveys. The longest record, Watamu (WCS Kenya via MERMAID, 0.50 km away), went from 8.8% in 2022 to 15% in 2024. Surveys since 2021 average 13% (range 8.8–16%, n=3). This site's own estimate (22%) is indistinguishable from the recent range (8.8–16%): the 5.7-point gap is inside the ±7 percentage-point noise between methods; the methods differ, so the comparison is context, not a like-for-like test. 5 further rows in the table have no survey date, so they are listed but not part of this summary.
Collected by other programs using different methods (MERMAID is a data platform: each MERMAID row names the organization that did the survey, and its method is in the row's hover text), so these are context for the figures above, not a like-for-like comparison. Where a station was surveyed more than once the range is shown. Station names are not dive-site names.
Show all 12 independent survey records
| Agency | Site / location | Date | Hard coral cover (%) | Distance | Link |
|---|---|---|---|---|---|
| WCS Kenya via MERMAID | Watamu Tewa | 2014 | 20% (2 images) | 0.66 km | Darling E. 2018. Kenya CRCP legacy. MERMAID |
| WCS Kenya via MERMAID | Watamu Canyon | 2014 | 19% | 1.64 km | Darling E. 2018. Kenya CRCP legacy. MERMAID |
| McClanahan et al. 2016 | Watamu north (Kenya) | 2016 | 24% (2 surveys) | 2.32 km | — |
| McClanahan et al. 2016 | Watamu South (Kenya) | 2016 | 23% | 2.44 km | — |
| McClanahan et al. 2016 | Watamu south (Kenya) | 2016 | 28% | 2.44 km | — |
| WCS Kenya via MERMAID | Watamu | 2022–2024 | 8.8–15% (2 images) | 0.50 km | Darling E, Kosgei J, McClanahan T, Muthiga N, Oddenyo R. 2022. Kenya-Marine Monitoring_2022. MERMAID; Hassan J, Julius P, Mensa J, Mkwavila S, Musembi P. 2024. Miamba Yetu Program - Kenya & Tanzania. MERMAID |
| WCS Kenya via MERMAID | Watamu (mean of 6 surveys, 2008–2024) | 2024 | 16% (6 images) | 0.50 km | Darling E. 2018. Kenya CRCP legacy. MERMAID |
| Kenyan reef survey compilation (source not identified) | Moray (site code C_MO’13), Central zone | — | 12% | 0.51 km | — |
| Kenyan reef survey compilation (source not identified) | Turtle Reef (site code C_TR’15), Central zone | — | 12% | 0.62 km | — |
| Kenyan reef survey compilation (source not identified) | Drummers (site code C_DR’13), Central zone | — | 12% | 0.90 km | — |
| Kenyan reef survey compilation (source not identified) | Dolphin (site code C_DP’14), Central zone | — | 12% | 1.62 km | — |
| Kenyan reef survey compilation (source not identified) | Richard Bennette (site code C_RB’15), Central zone | — | 12% | 1.76 km | — |
Data & links
- CoralNet image repository for this region ↗
- Photo portfolio ↗
- Coral Reef Diagnostics page for this area ↗
All images from Coral Reef Diagnostics. Data are from Coral Reef Diagnostics and the organizations named in the data-sources table above.
© Coral Reef Diagnostics.