
Regional summary of 19 dive sites. Figures are averages across the sites that report them (n = sites with a value); each site's own page has its individual values.
⬇ Download this region as a report card
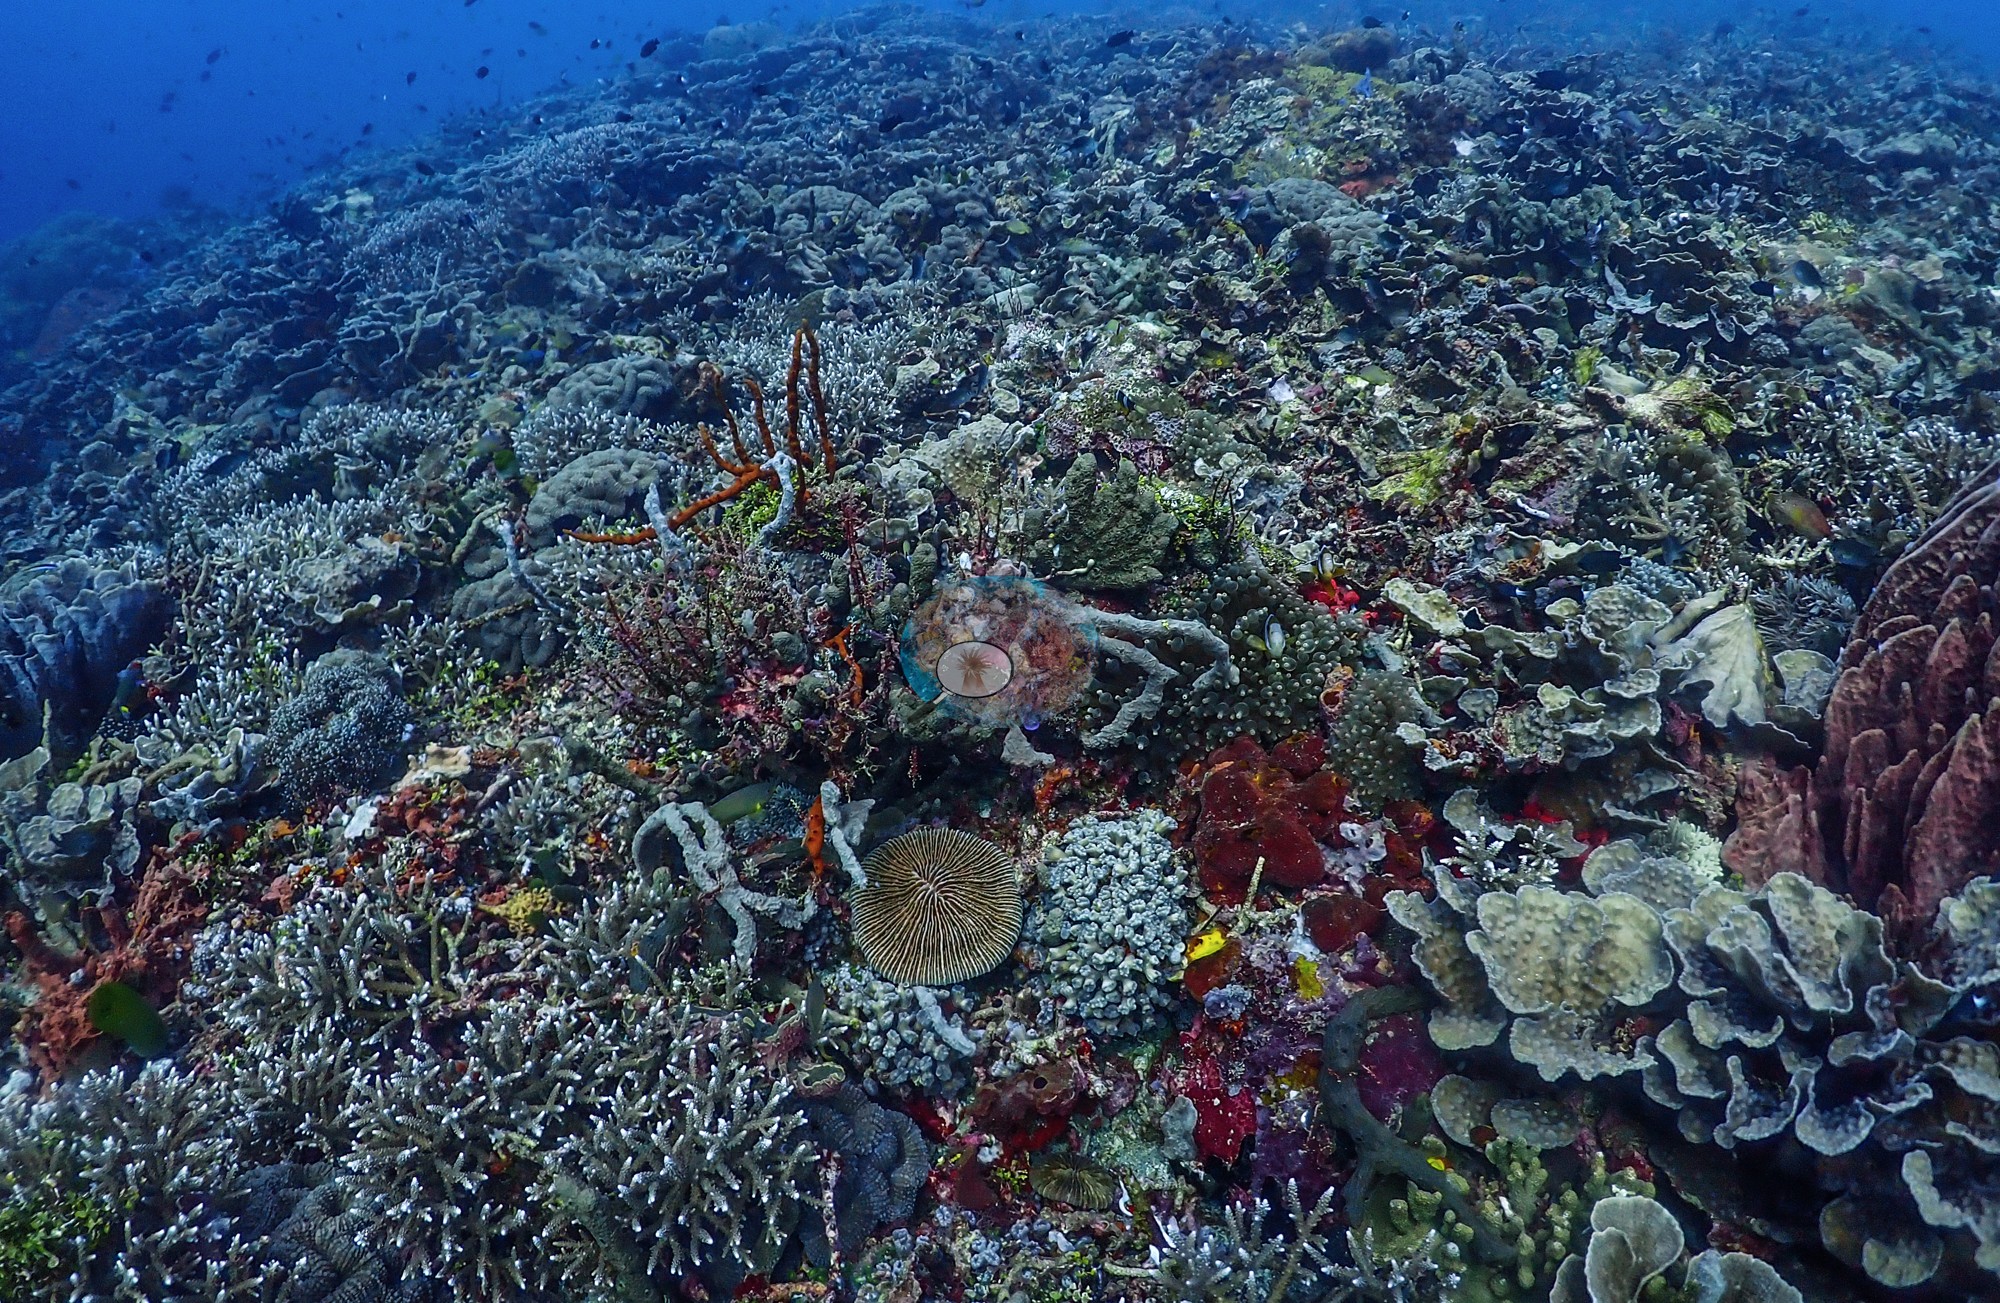

Alor's walls, sloping reefs, and volcanic-sand muck sites, dived in 2026, are dominated more by sponges, sea fans, and crinoids than by reef-building corals, with the richest staghorn canopies in the shallows. Cold upwelling, an exceptional-current corner, seahorses, and sea kraits add variety, and no widespread bleaching was seen.
Heat stress
Long-term record: 6 years since 1985 reached 8 or more °C-weeks at NOAA’s East Nusa Tenggara station. Download the annual DHW data (CSV).
19 sites in this region — click a marker to open that site.
Regional setting
Spalding et al. (2001) place the Alor group among the Nusa Tenggara Islands, part of their Wallacea sub-region, where mountainous, volcanically active islands with narrow shelves are separated by deep water. Detailed accounts of Nusa Tenggara reefs were scarce, but fringing reefs are widespread, and the authors summarize studies from Lembata Island, in the middle of the chain, showing how strongly reefs change with exposure. On Lembata's northwest coast, a well-developed fringing reef carries a seagrass-rich reef flat 200-400 m wide, broader again on the west coast. The south coast, open to Indian Ocean swell and possibly to cool upwelling, has a narrow reef flat, marked spur-and-groove structure, and several deep-water species that may favor cooler conditions. South of the chain, Timor Sea currents flow west year-round, and the authors report relatively little 1998 bleaching over much of the sub-region. Nationally, they estimate about 51,020 km² of reef in Indonesia, 18% of the world total, with 443 coral species recorded and 581-602 estimated for the wider biogeographic region. Souter et al. (2021) place the Lesser Sunda ecoregion, together with Southern Java, in an East Asian Seas subregion holding 4,279 km² of reef.
Souter et al. (2021) could say little with confidence about that subregion: coral cover estimates swing widely, algal cover shows a progressive decline, and no site there had been surveyed over more than 15 years. They warn that archipelagic nations, with long coastlines relative to their land area, may feel climate impacts across an unusually wide area, and they attribute region-wide coral losses after 2010 and 2016 to mass bleaching. Wilkinson (2006) reported that deforestation for timber and oil palm was clearly increasing sediment loads on Indonesian coasts, while noting that, as of 2004, Indonesian reefs were among the few in Southeast Asia showing signs of recovery.
Overview
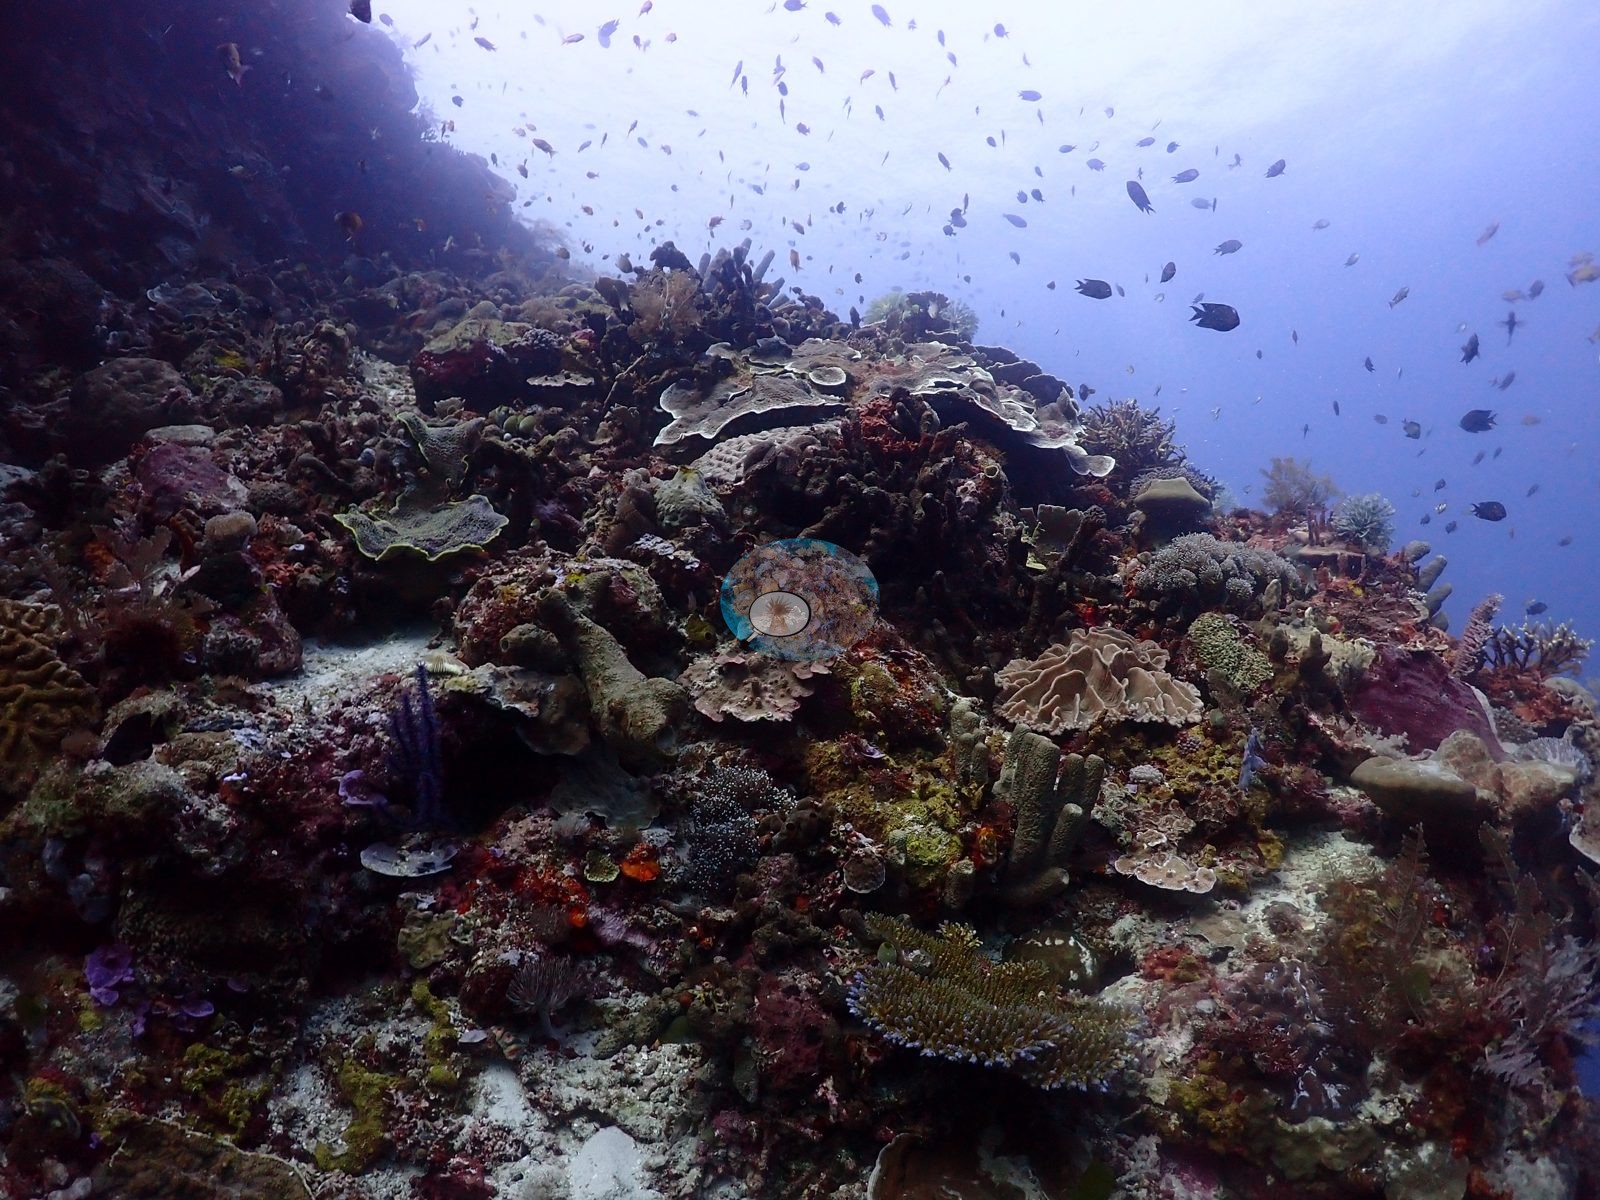
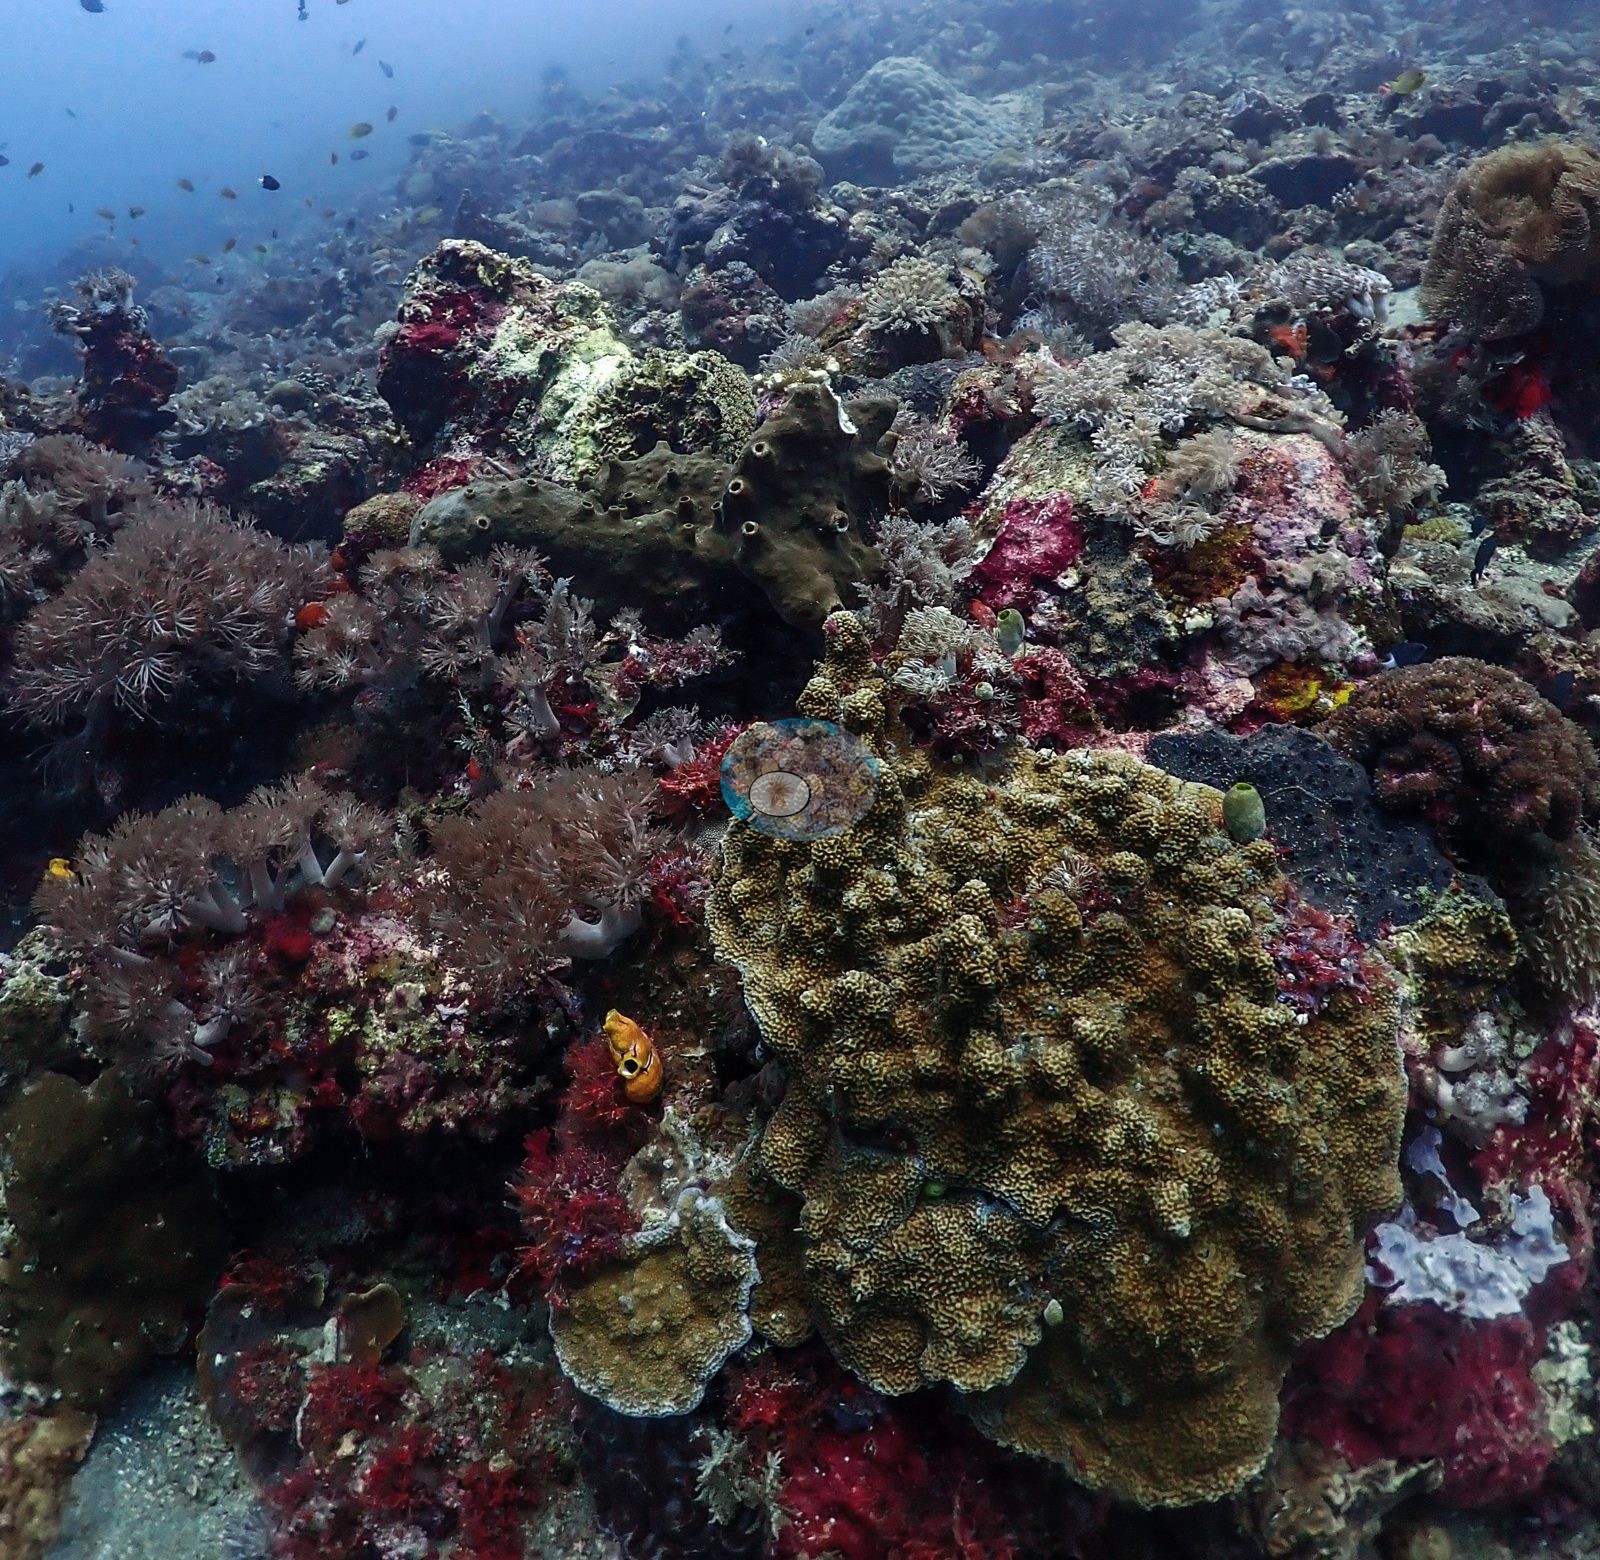
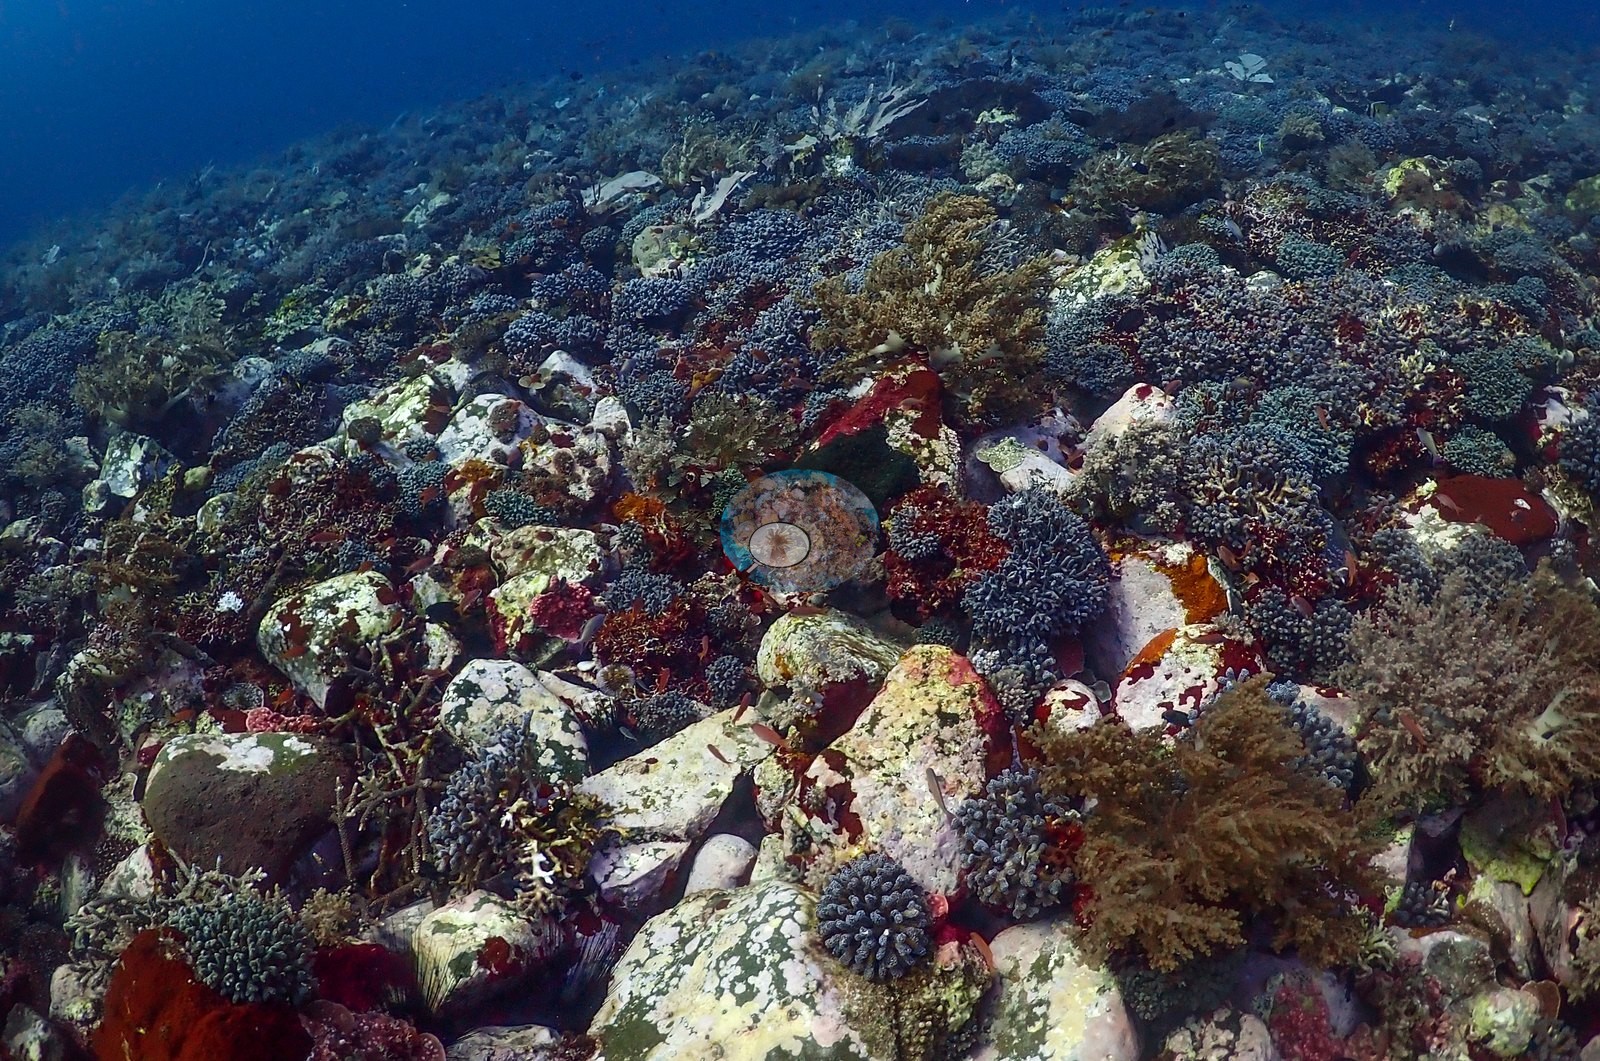
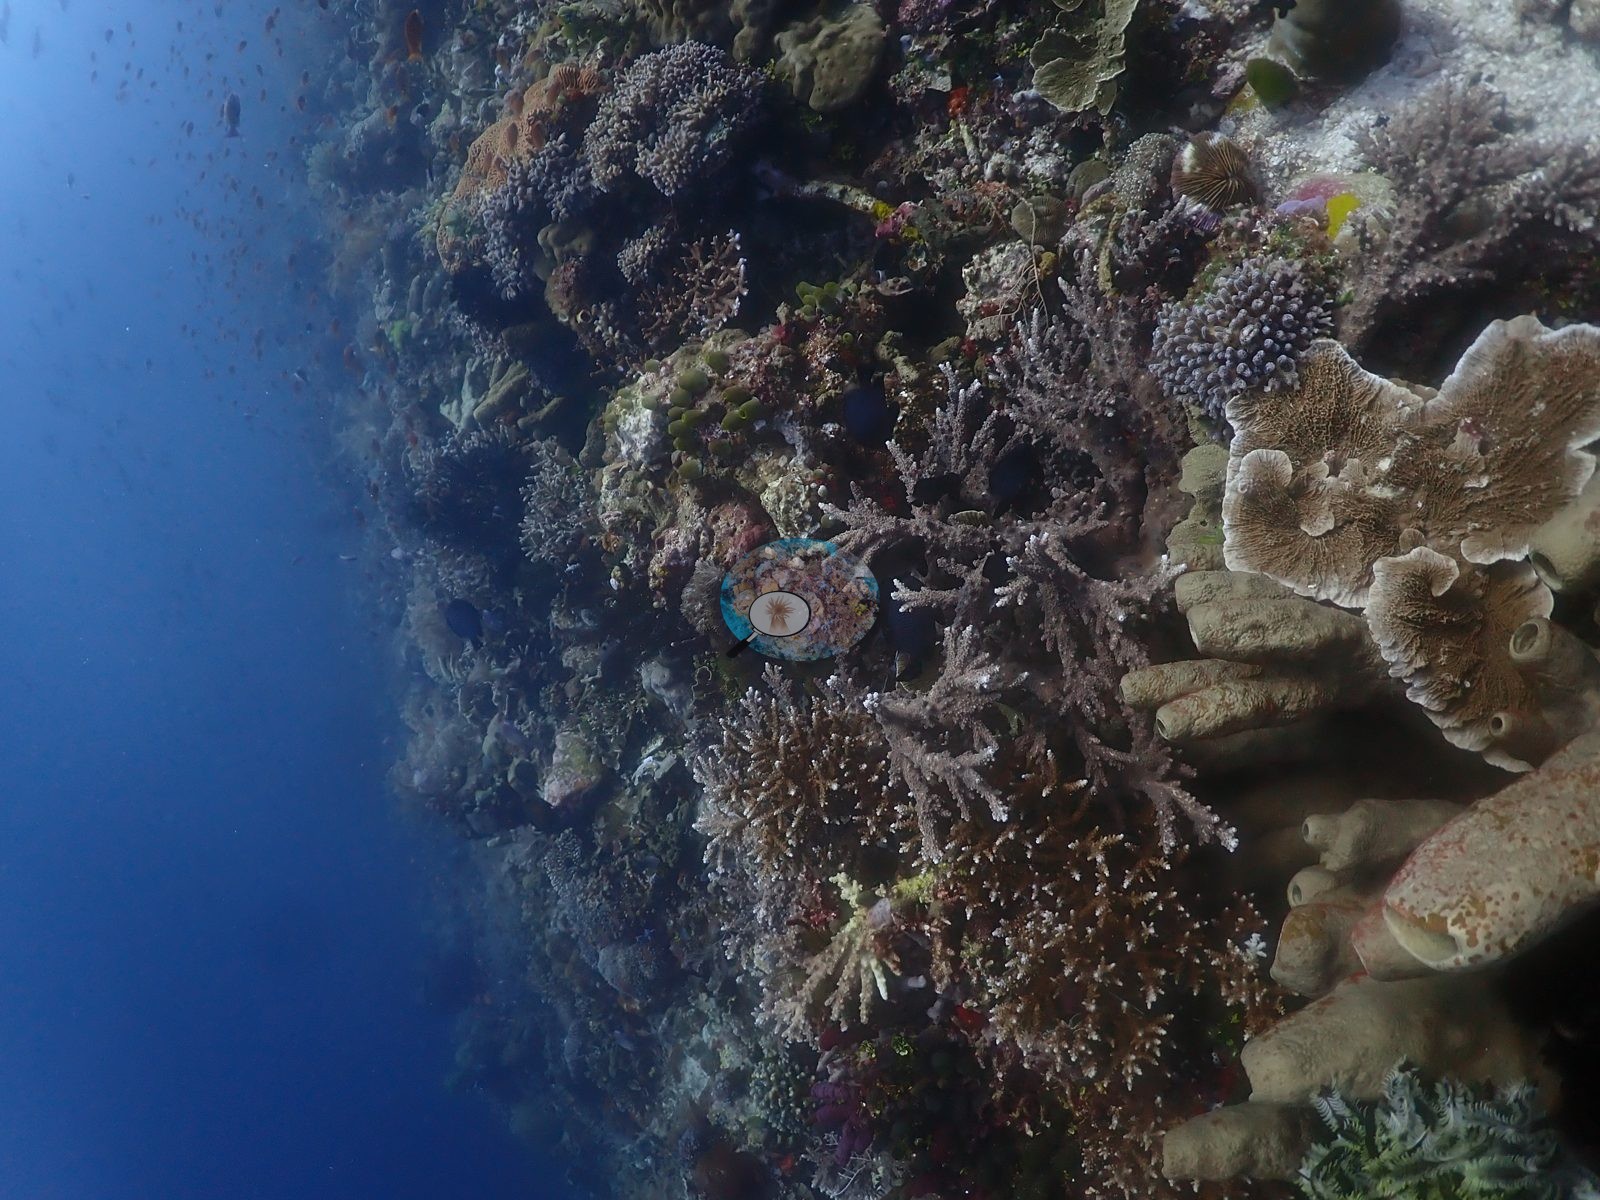
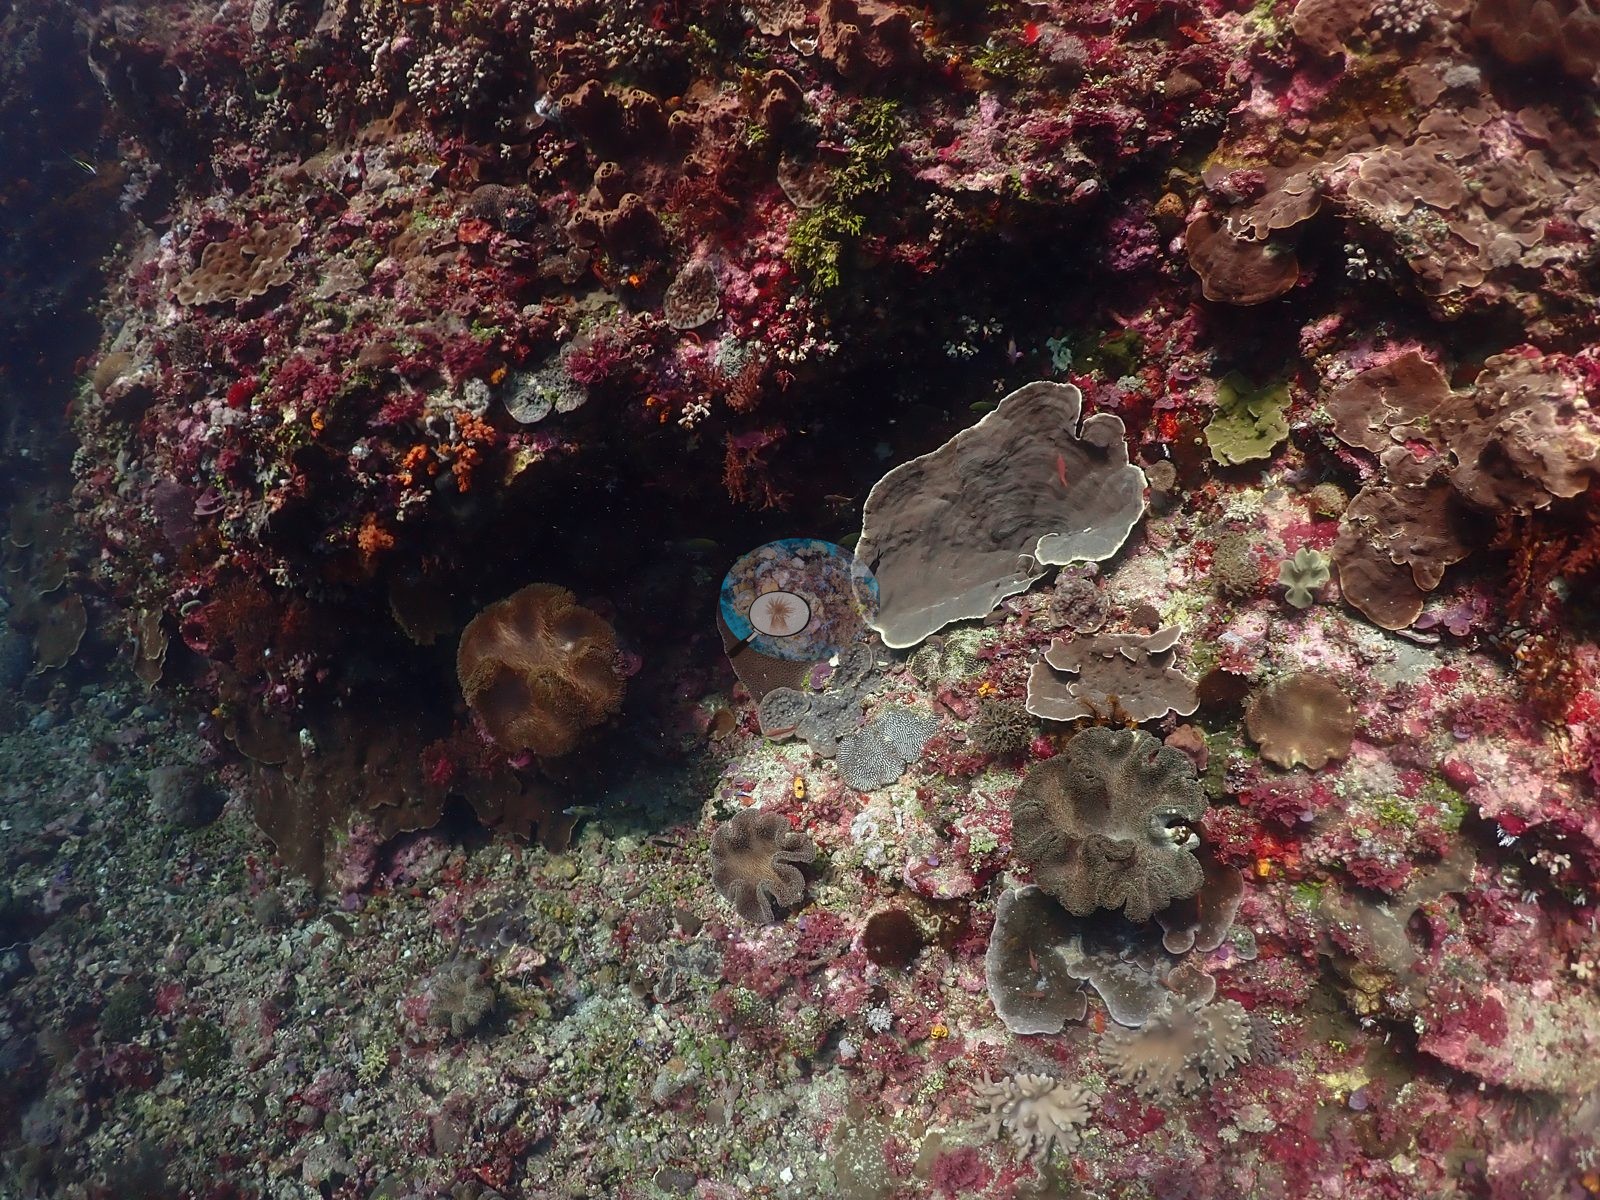
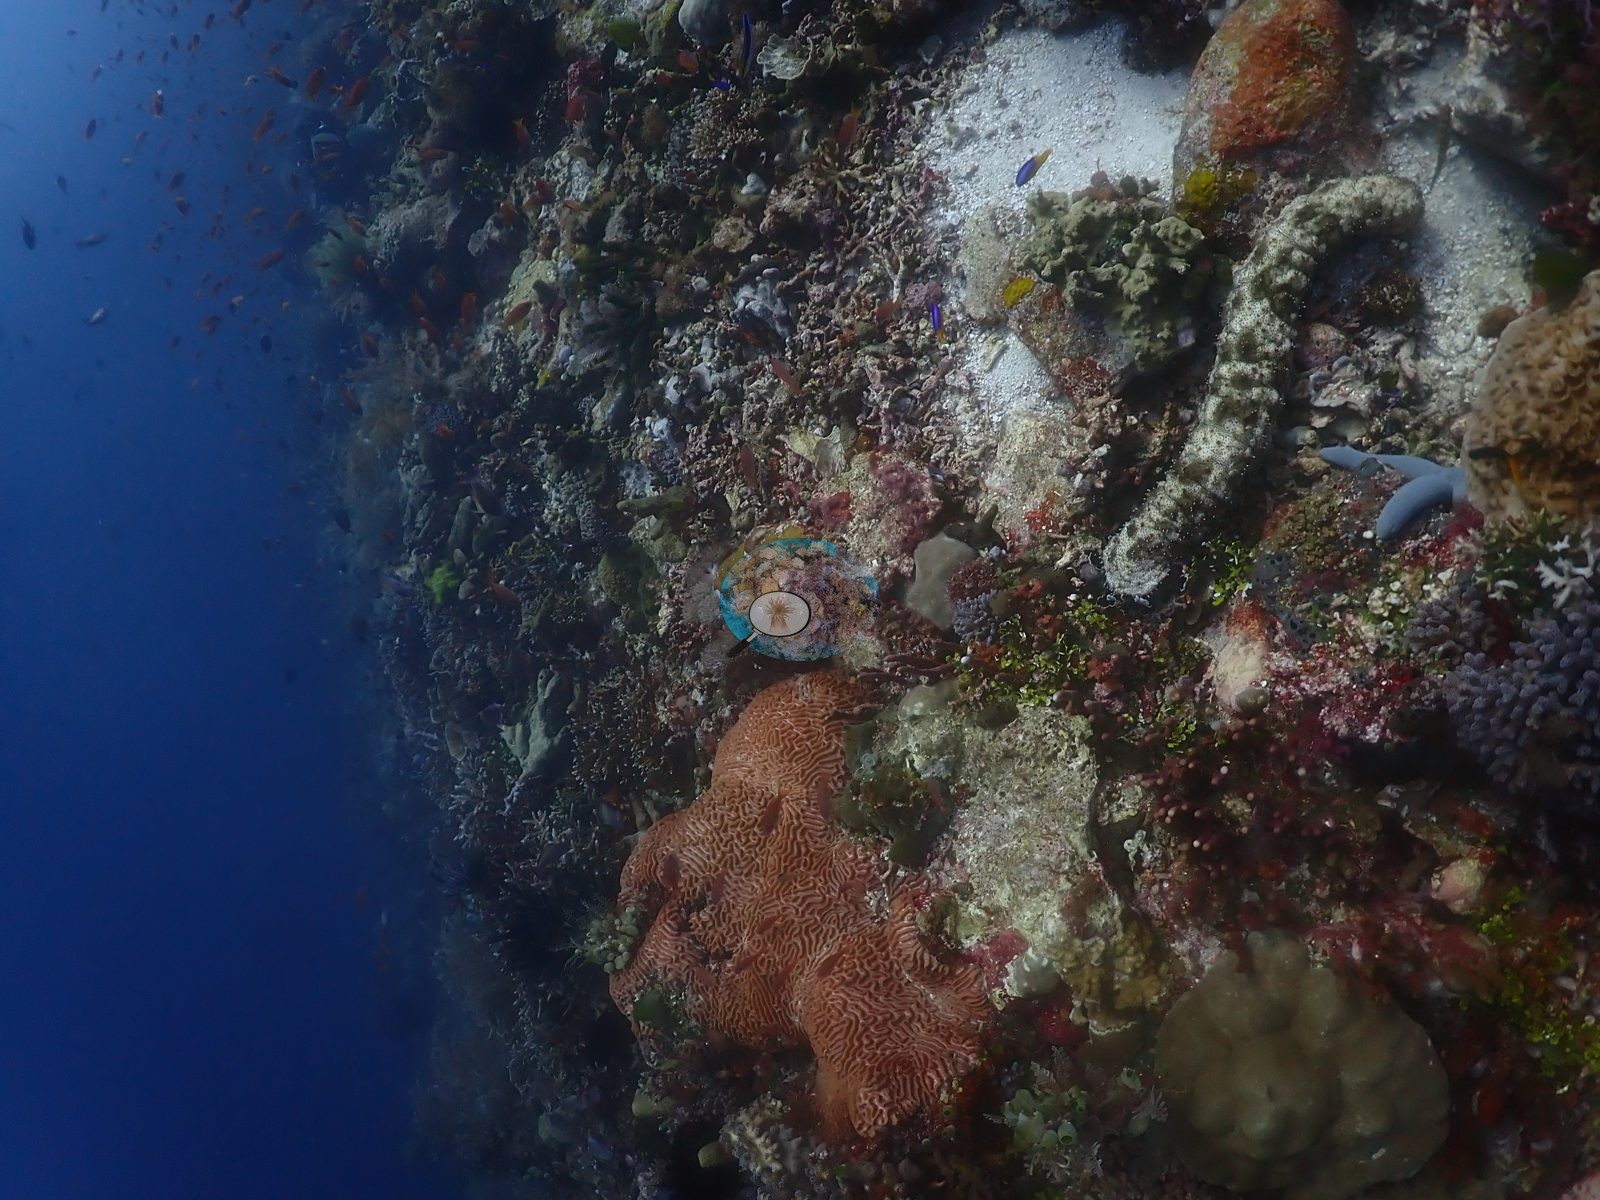
The 19 Alor pins come from a week of diving in late July and early August 2026, from the Kalabahi area to Ternate Island and the Pantar Strait. Walls and drop-offs (Bama Wall, Motonglang, The Arch, Umapura, Sulambali Wall, Babylon, Monaseli) are covered more by encrusting sponges, coralline algae, barrel sponges, sea fans, black coral, and crinoids than by reef-building corals, with plating colonies compatible with Montipora, Pachyseris, and Turbinaria on the ledges. Sloping reefs (Goat Fence, Apuri Bay, Clown Valley, Harilolong, Pasir Merah, Limarahing) grade between rubble or volcanic sand and dense coral gardens. Muck and jetty sites (Masjid Ampera, Ampera, Lobang, Bakalang Jetty, Beang Abang) sit on dark volcanic sand and are defined by macro life, and Goa Wolang is a cave.
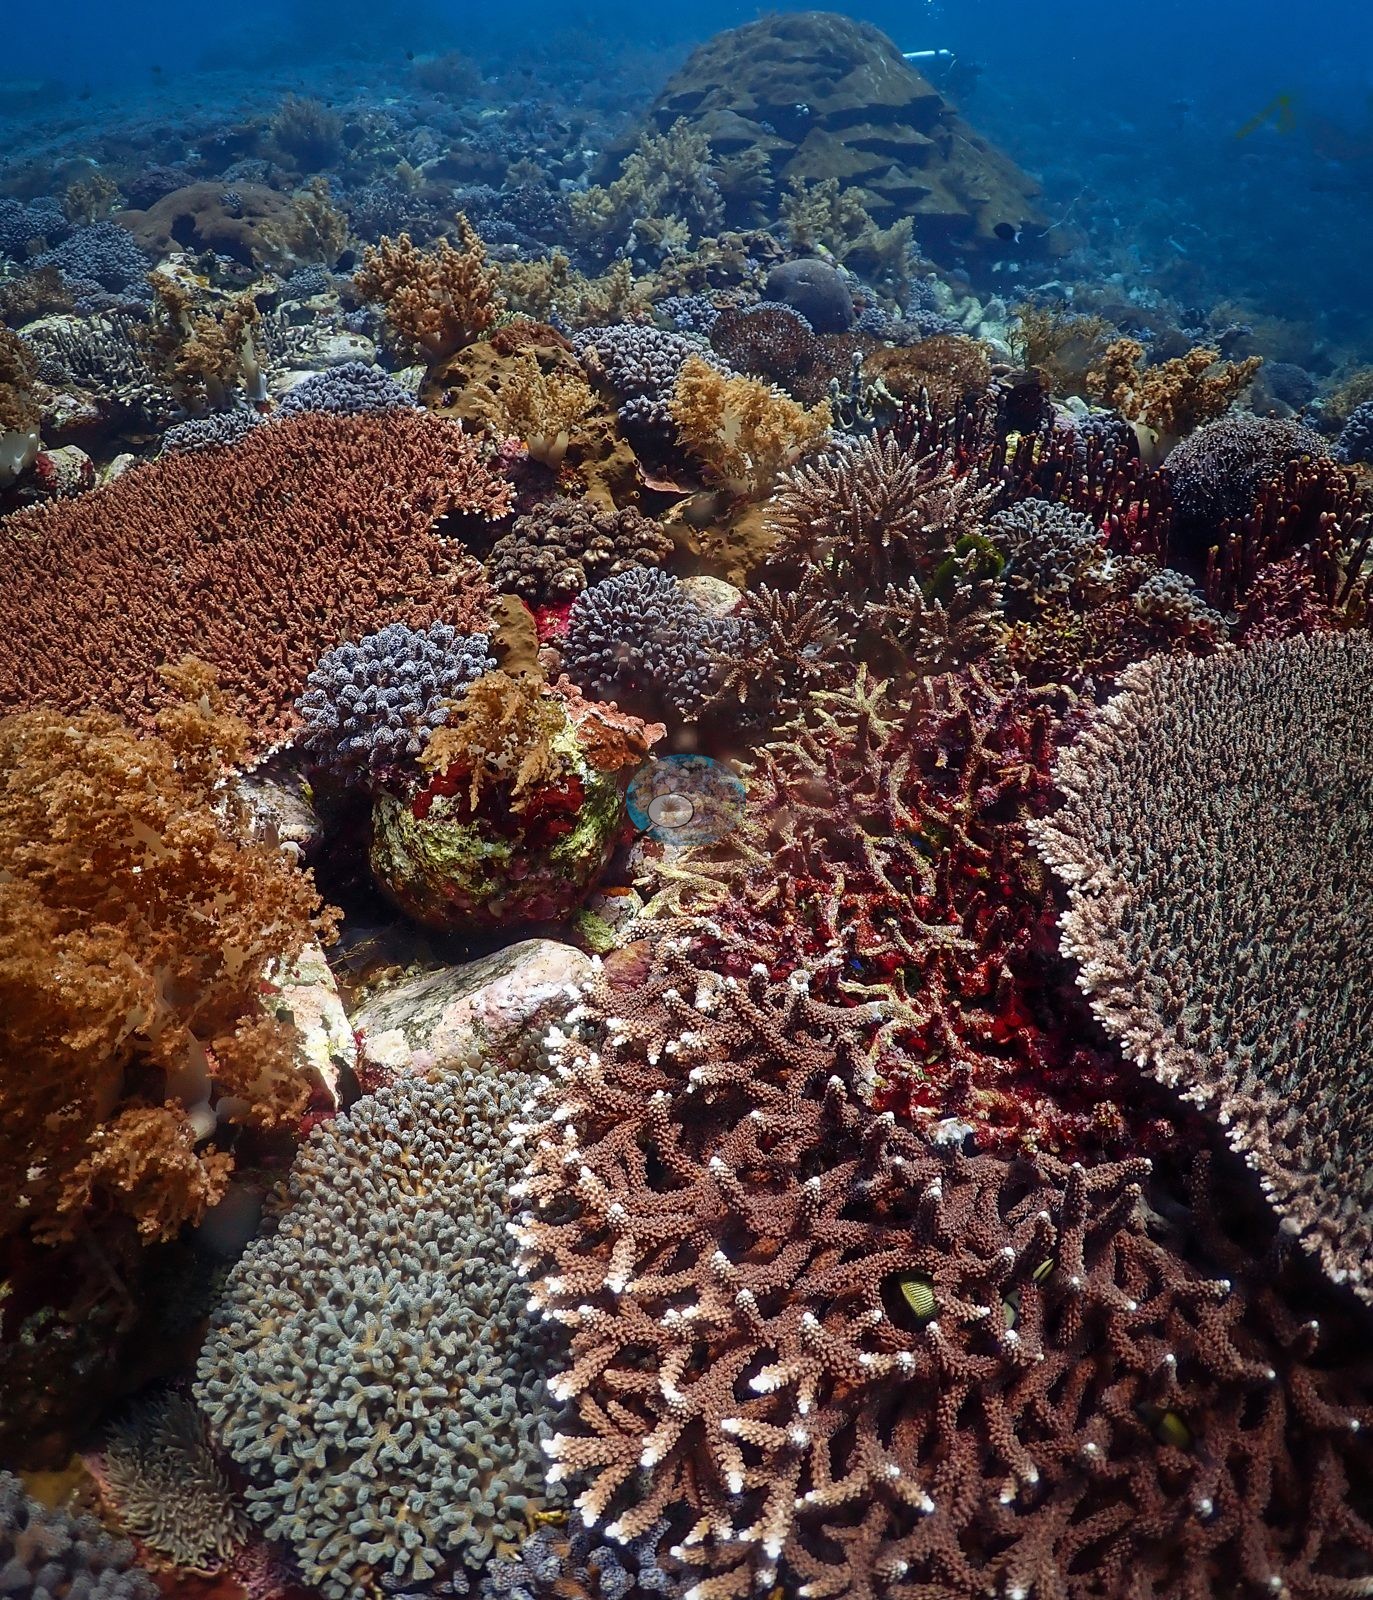
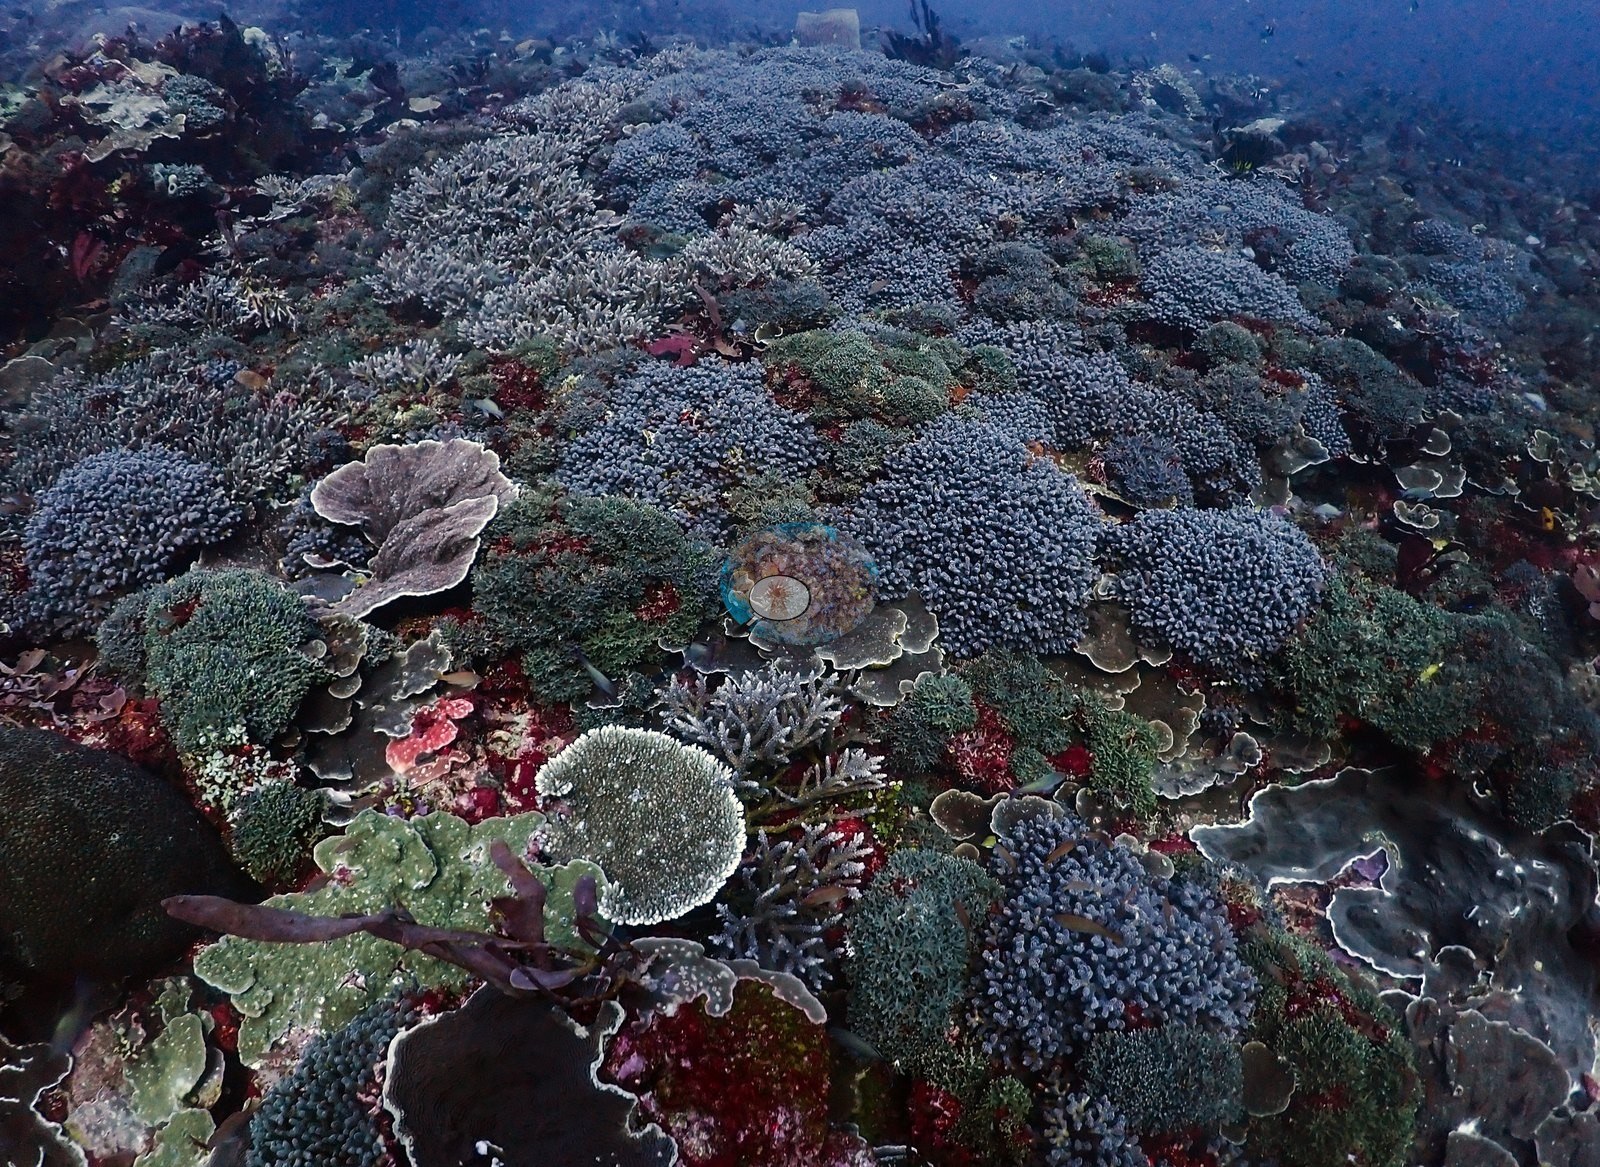
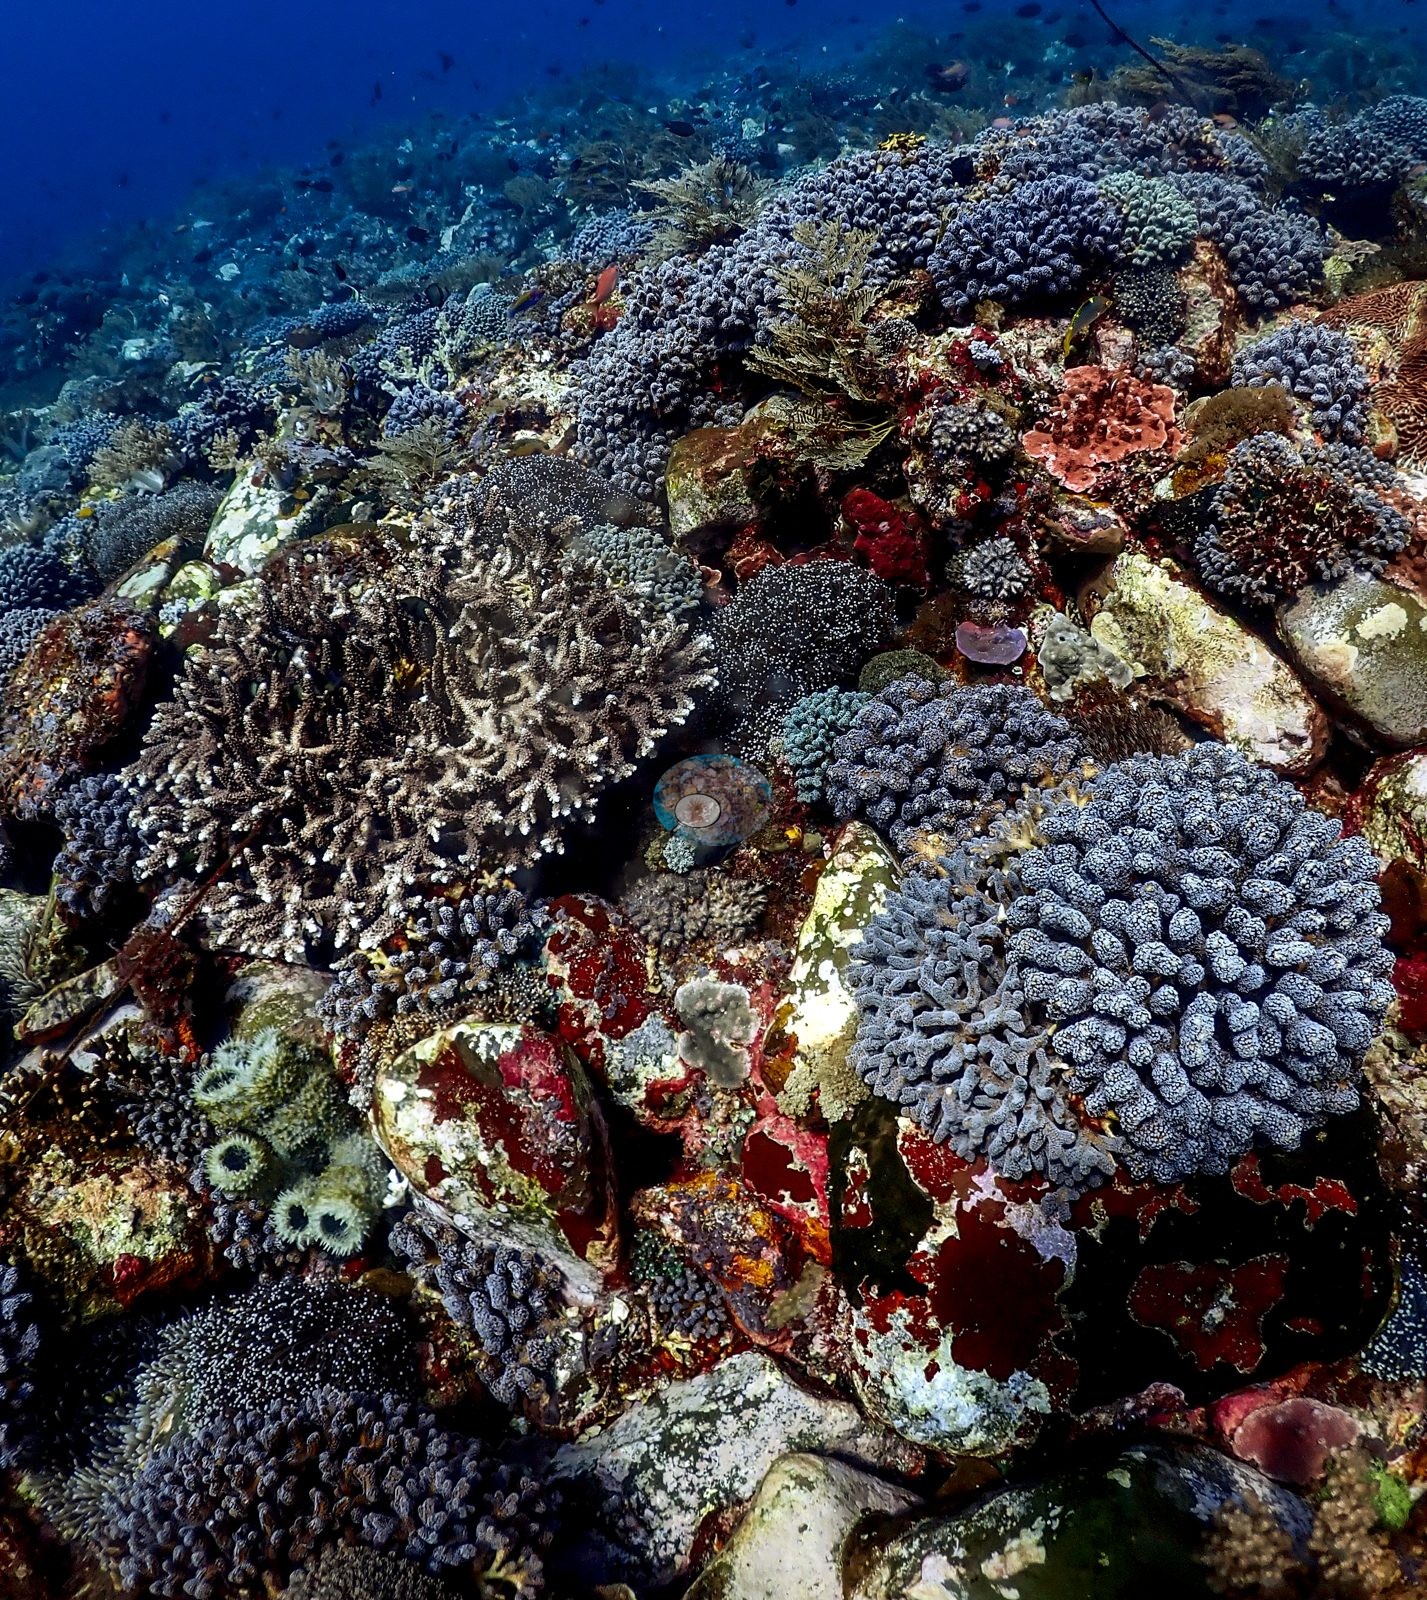
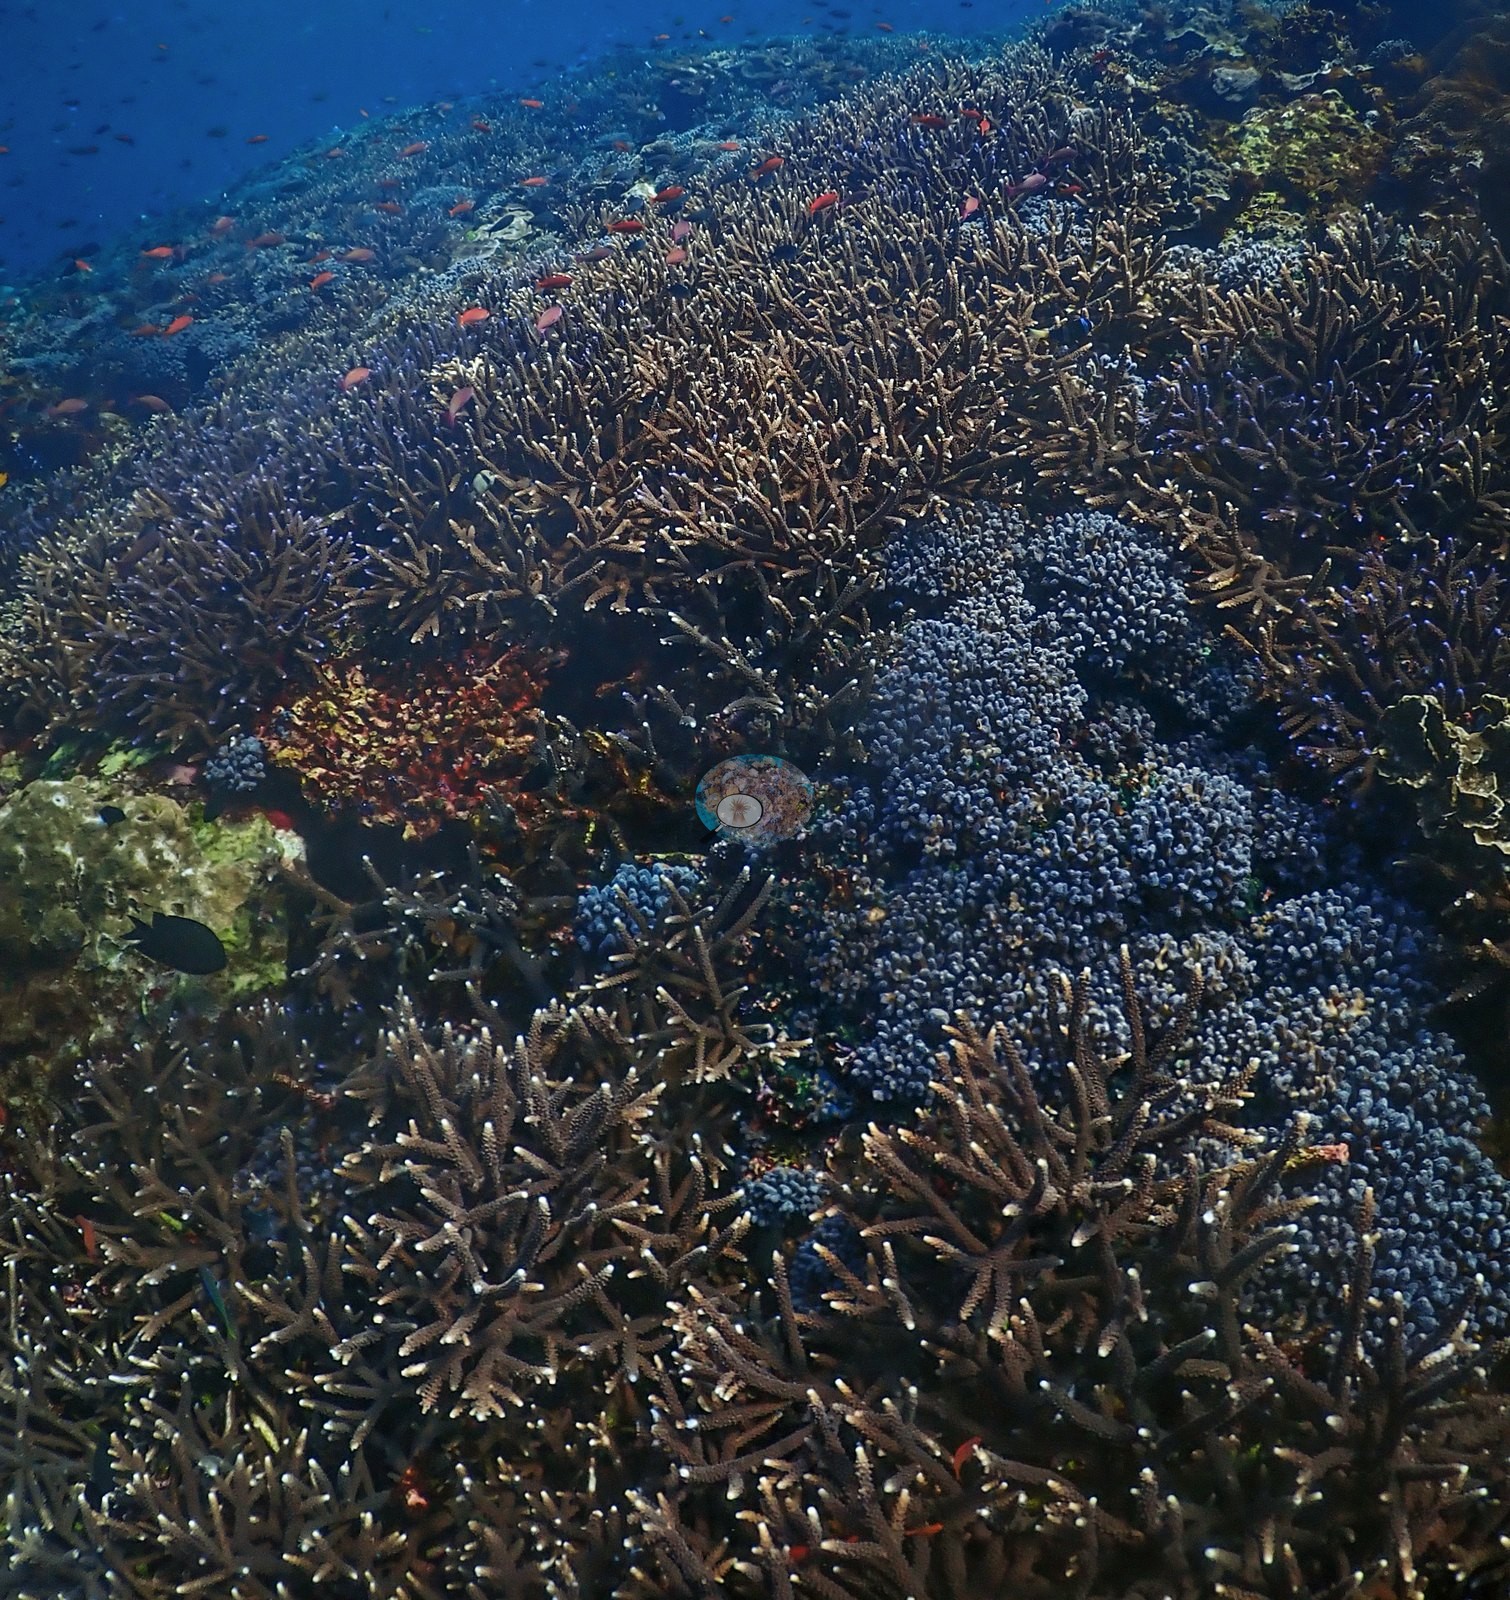
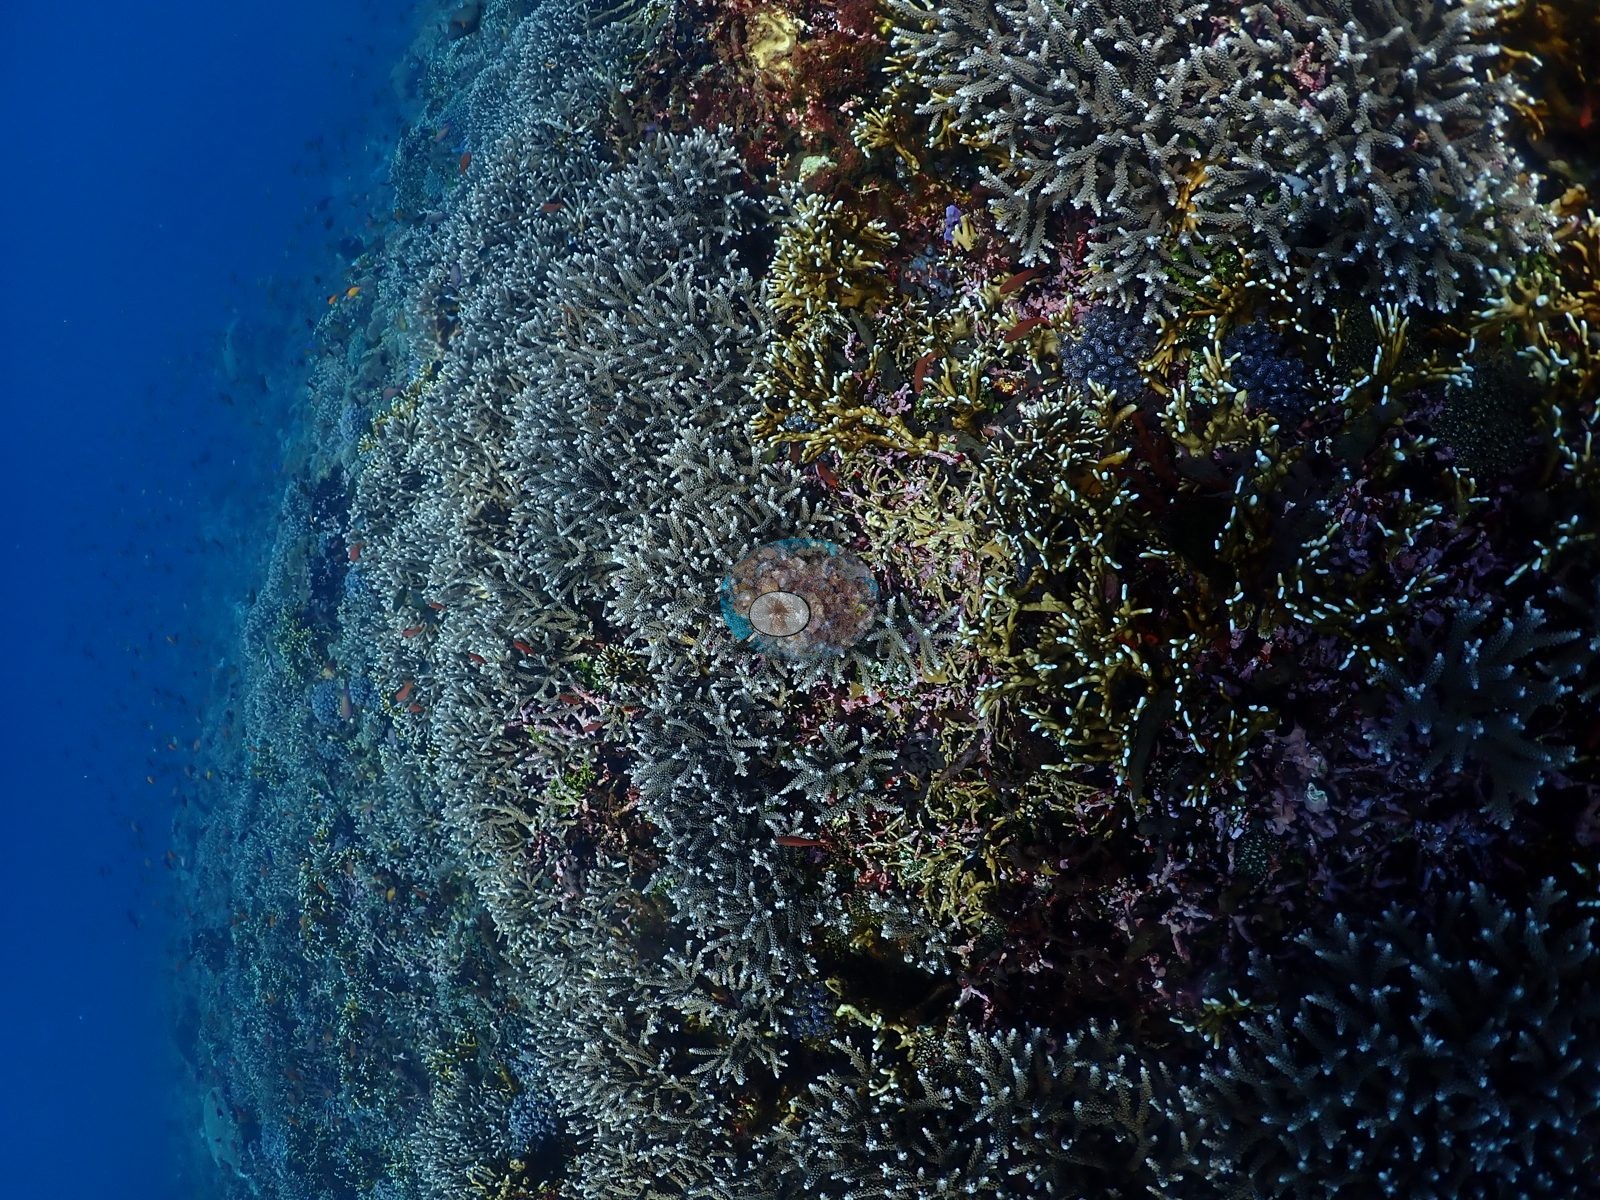
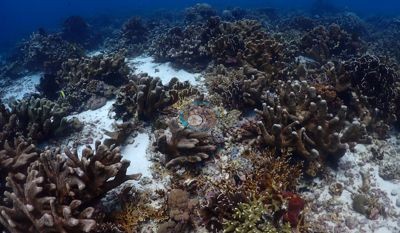
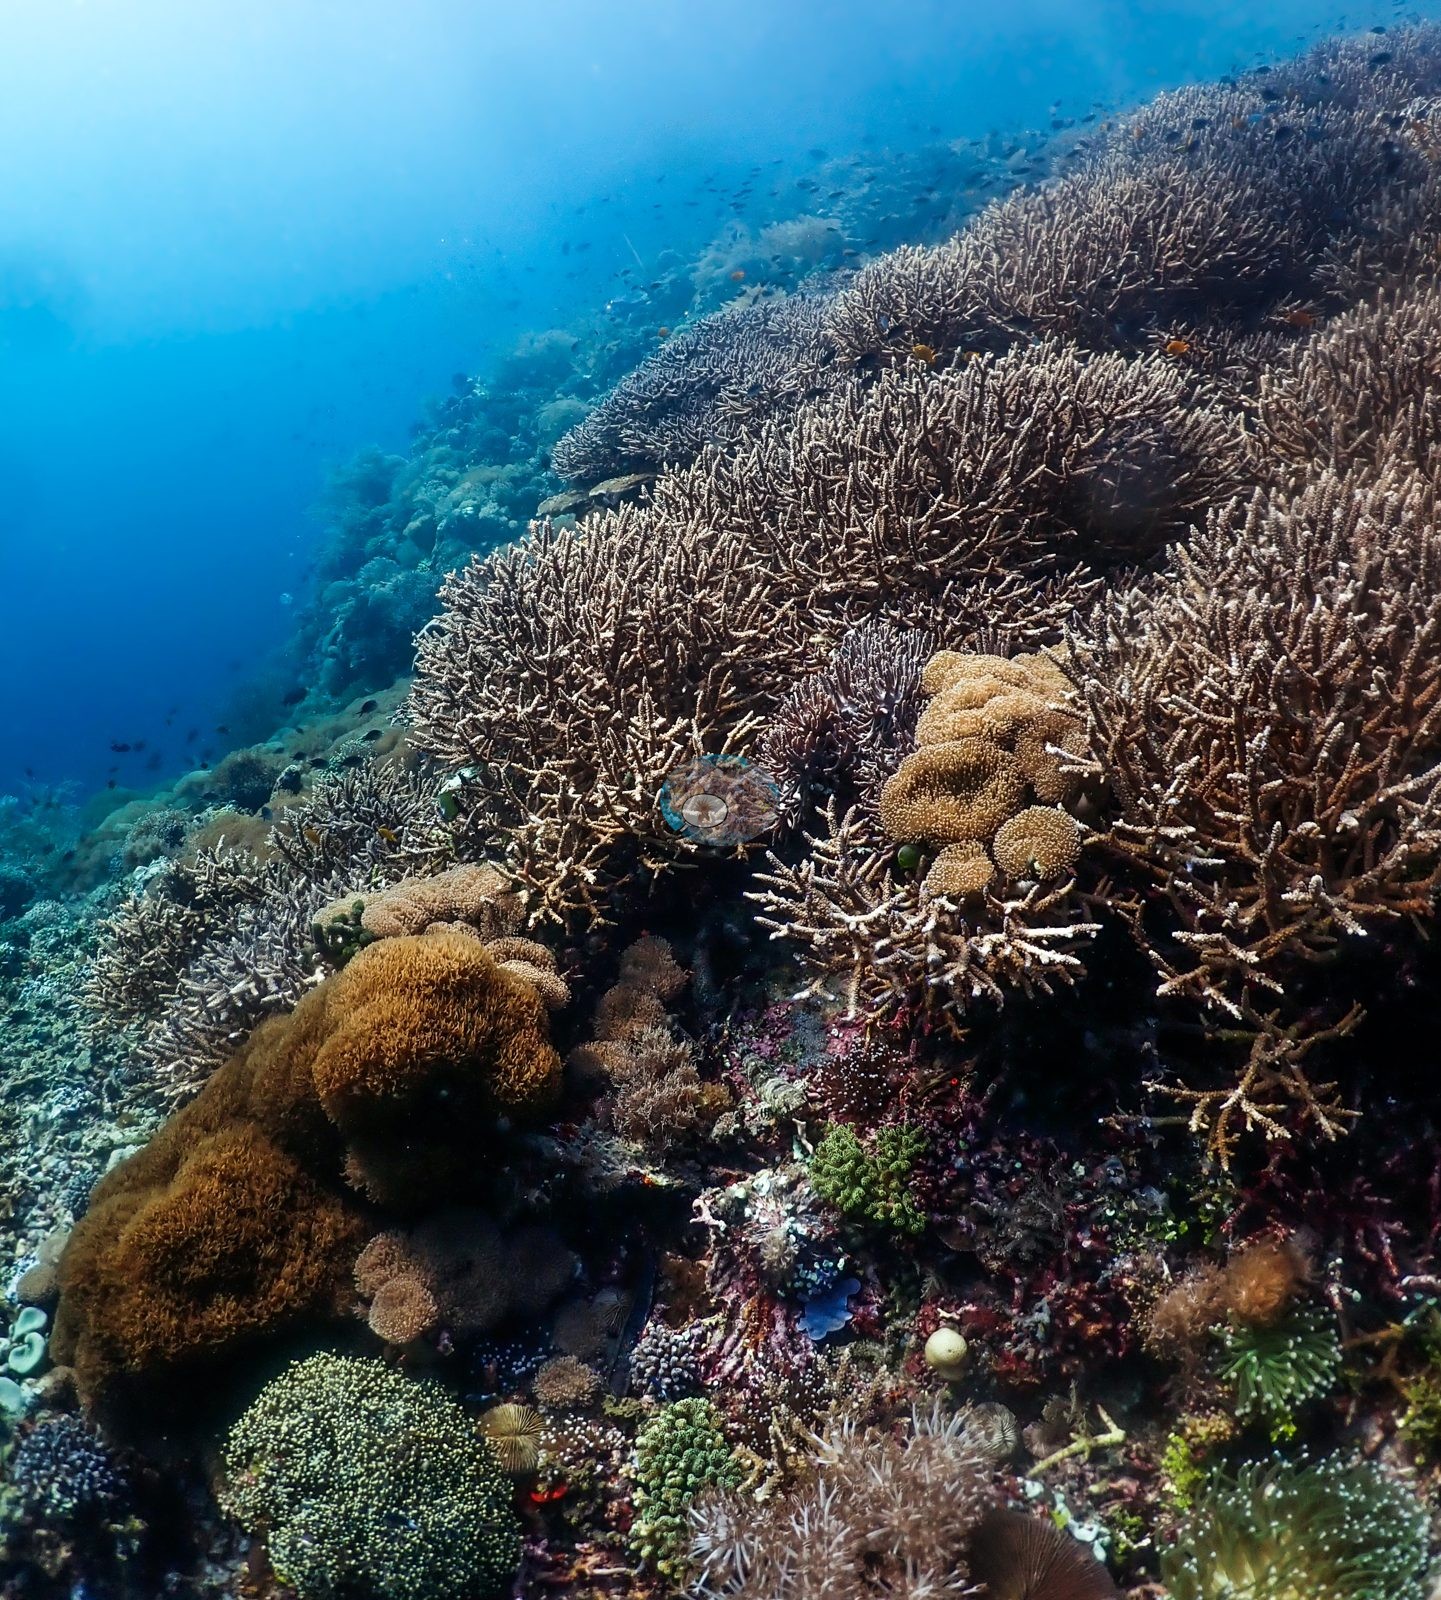
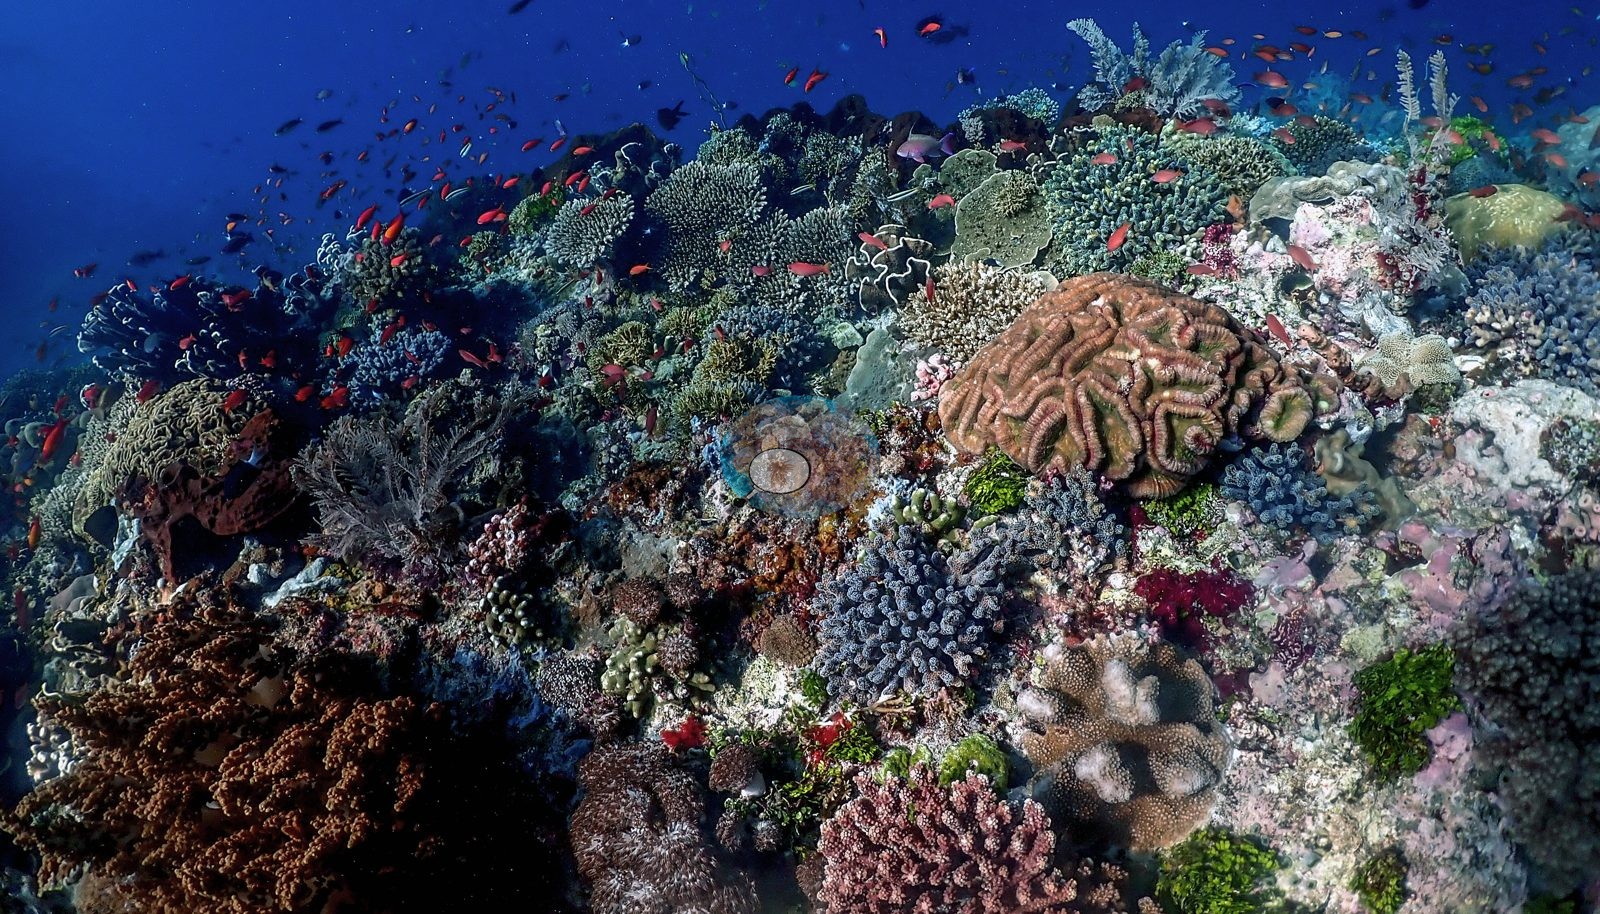
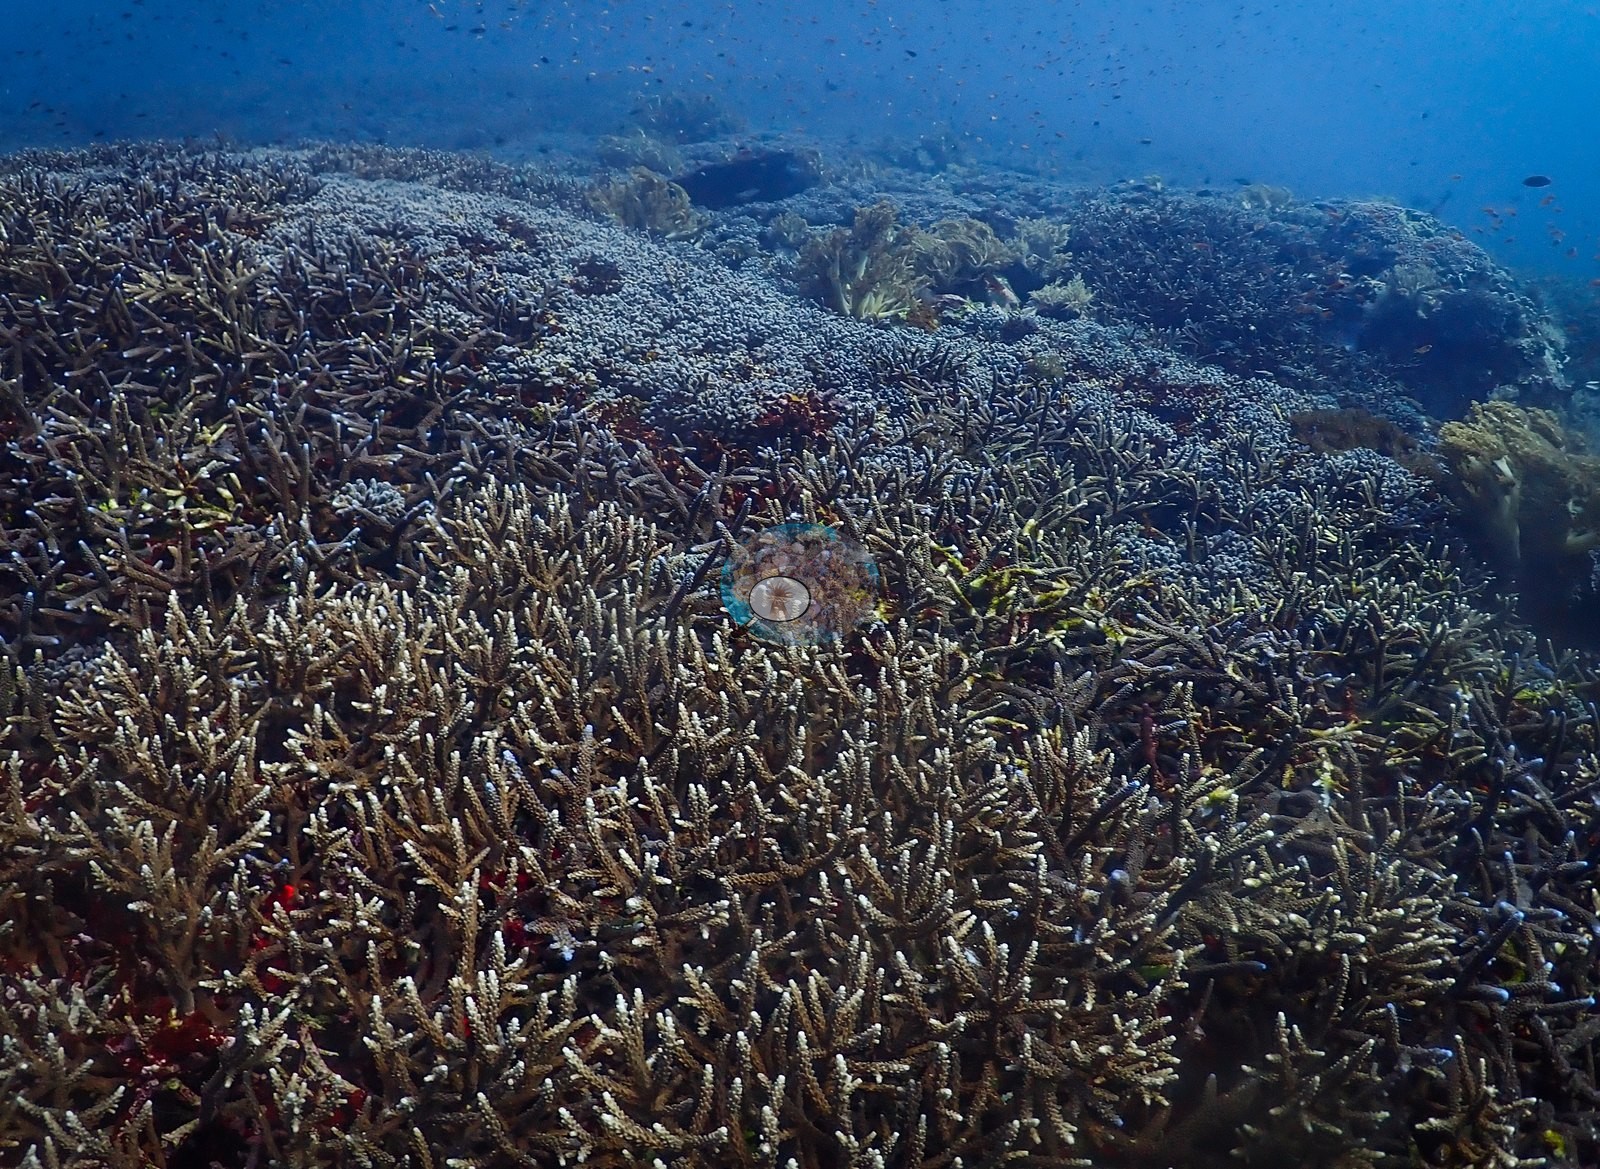
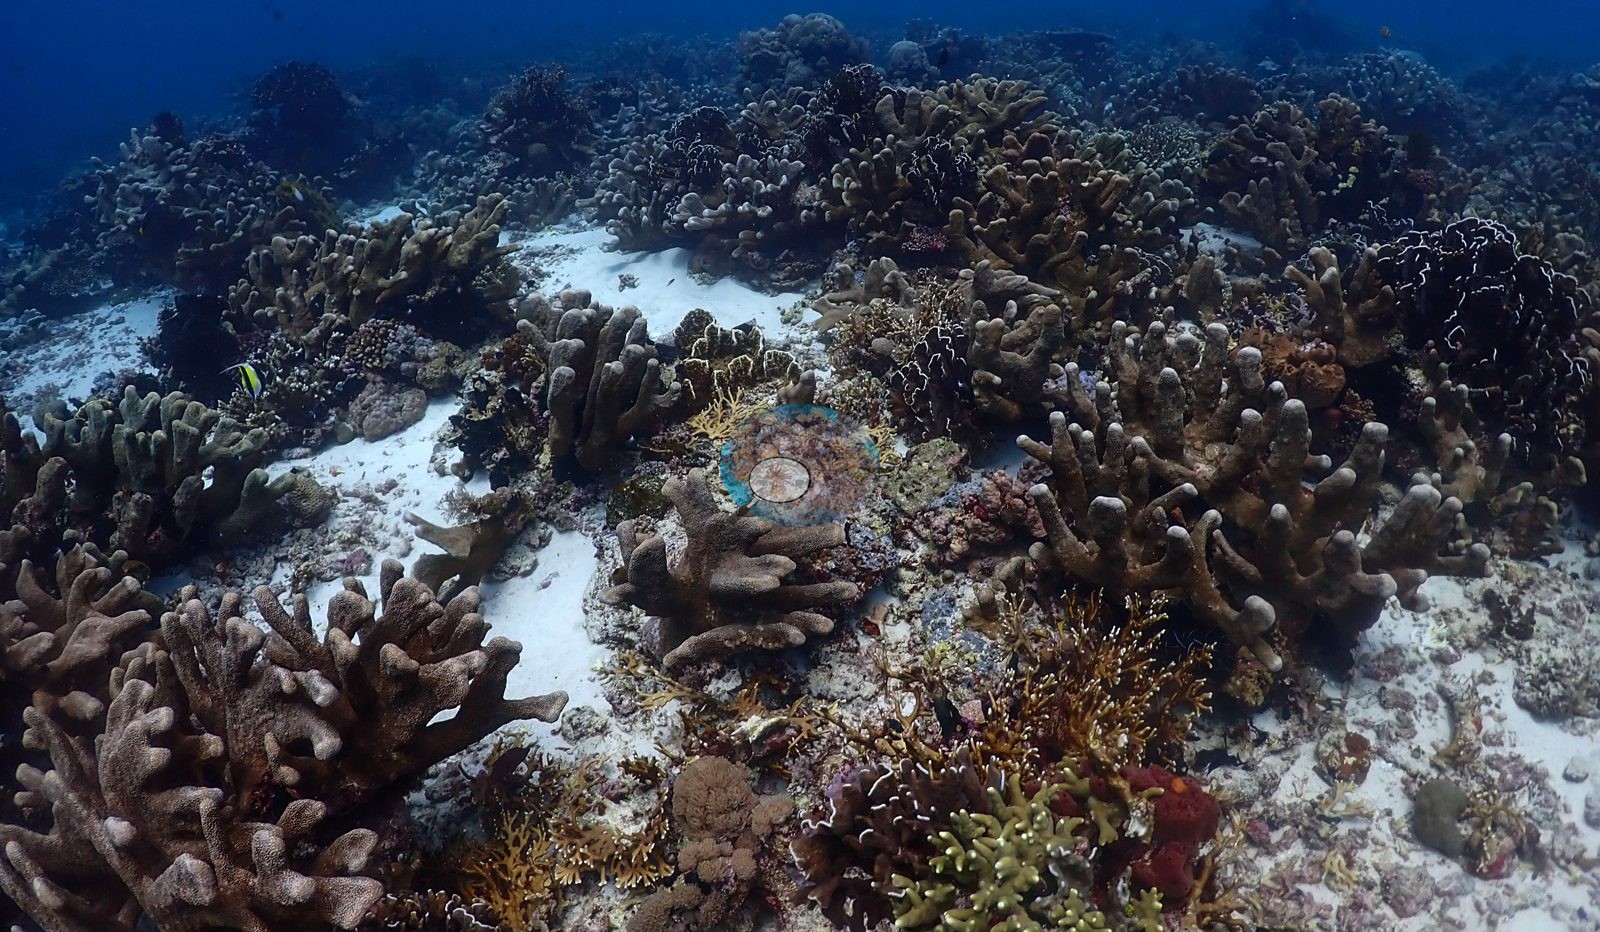
The richest coral is usually in the shallower sections: near-continuous staghorn Acropora canopies on Goat Fence's mid slope, across the final third of Harilolong, at Clown Valley and The Arch, and on the second Babylon dive, the most extensive branching-coral habitat photographed on the trip. Other standouts are meter-scale plate beds at Sulambali Wall, a single massive Porites head at least 2-3 m across at Apuri Bay, and a brain coral more than a meter across at The Arch. Hard coral cover (Claude CV) across 15 sites ranged from 5.8% at Motonglang (Cathedral) to 41.0% at Clown Valley. At Limarahing a single figure averages a dense coral garden with open black sand. Apuri Bay logged 17-24°C, consistent with strong upwelling, and Monaseli is an exceptional-current corner.
No site showed widespread bleaching. Localized signs include one large, almost entirely white massive colony and older dead-Acropora rubble at Sulambali Wall, and coralline-cemented rubble carrying new Acropora recruits at Monaseli. Monofilament line was photographed at Umapura and Sulambali Wall, a metal cage frame at Goa Wolang, and bamboo-and-mesh cages of unconfirmed purpose at Apuri Bay. Anthias clouds are near-universal; banded sea kraits crossed the reef at Bama Wall and Harilolong, a very large marbled ray was logged at Motonglang, and the muck dives produced three seahorses at Beang Abang and a bobtail squid at Ampera.
Highlights
- Near-continuous staghorn Acropora canopies at Goat Fence, Harilolong, Clown Valley, The Arch, and on the second Babylon dive
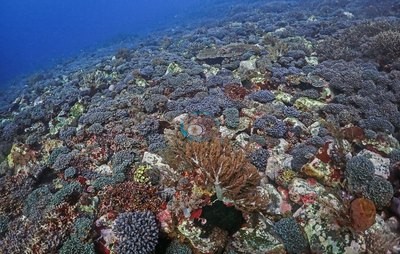 photo: Alor - Clown Valley
 - Meter-scale plating-coral beds at Sulambali Wall, one carpeted in red anthias
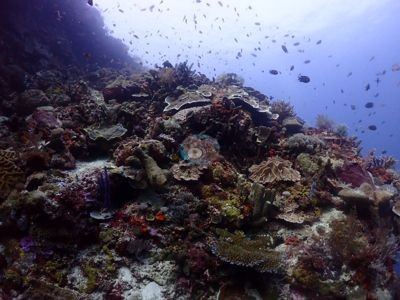 photo: Alor - Sulambali Wall
 - A single massive Porites head at least 2-3 m across at Apuri Bay, where 17-24°C water was logged
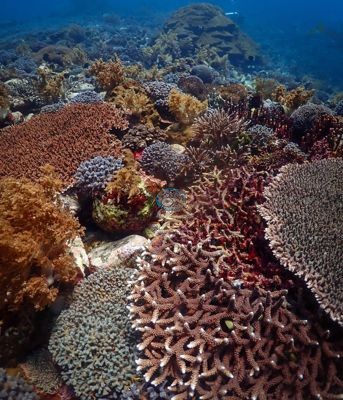 photo: Alor - Apuri Bay
 - Hard coral cover (Claude CV) from 5.8% (Motonglang) to 41.0% (Clown Valley) across 15 sites; the night dives and the Beang Abang muck dive carry no cover figure
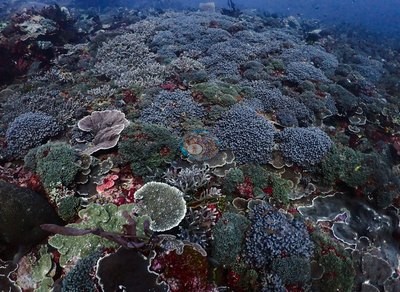 photo: Alor - Clown Valley
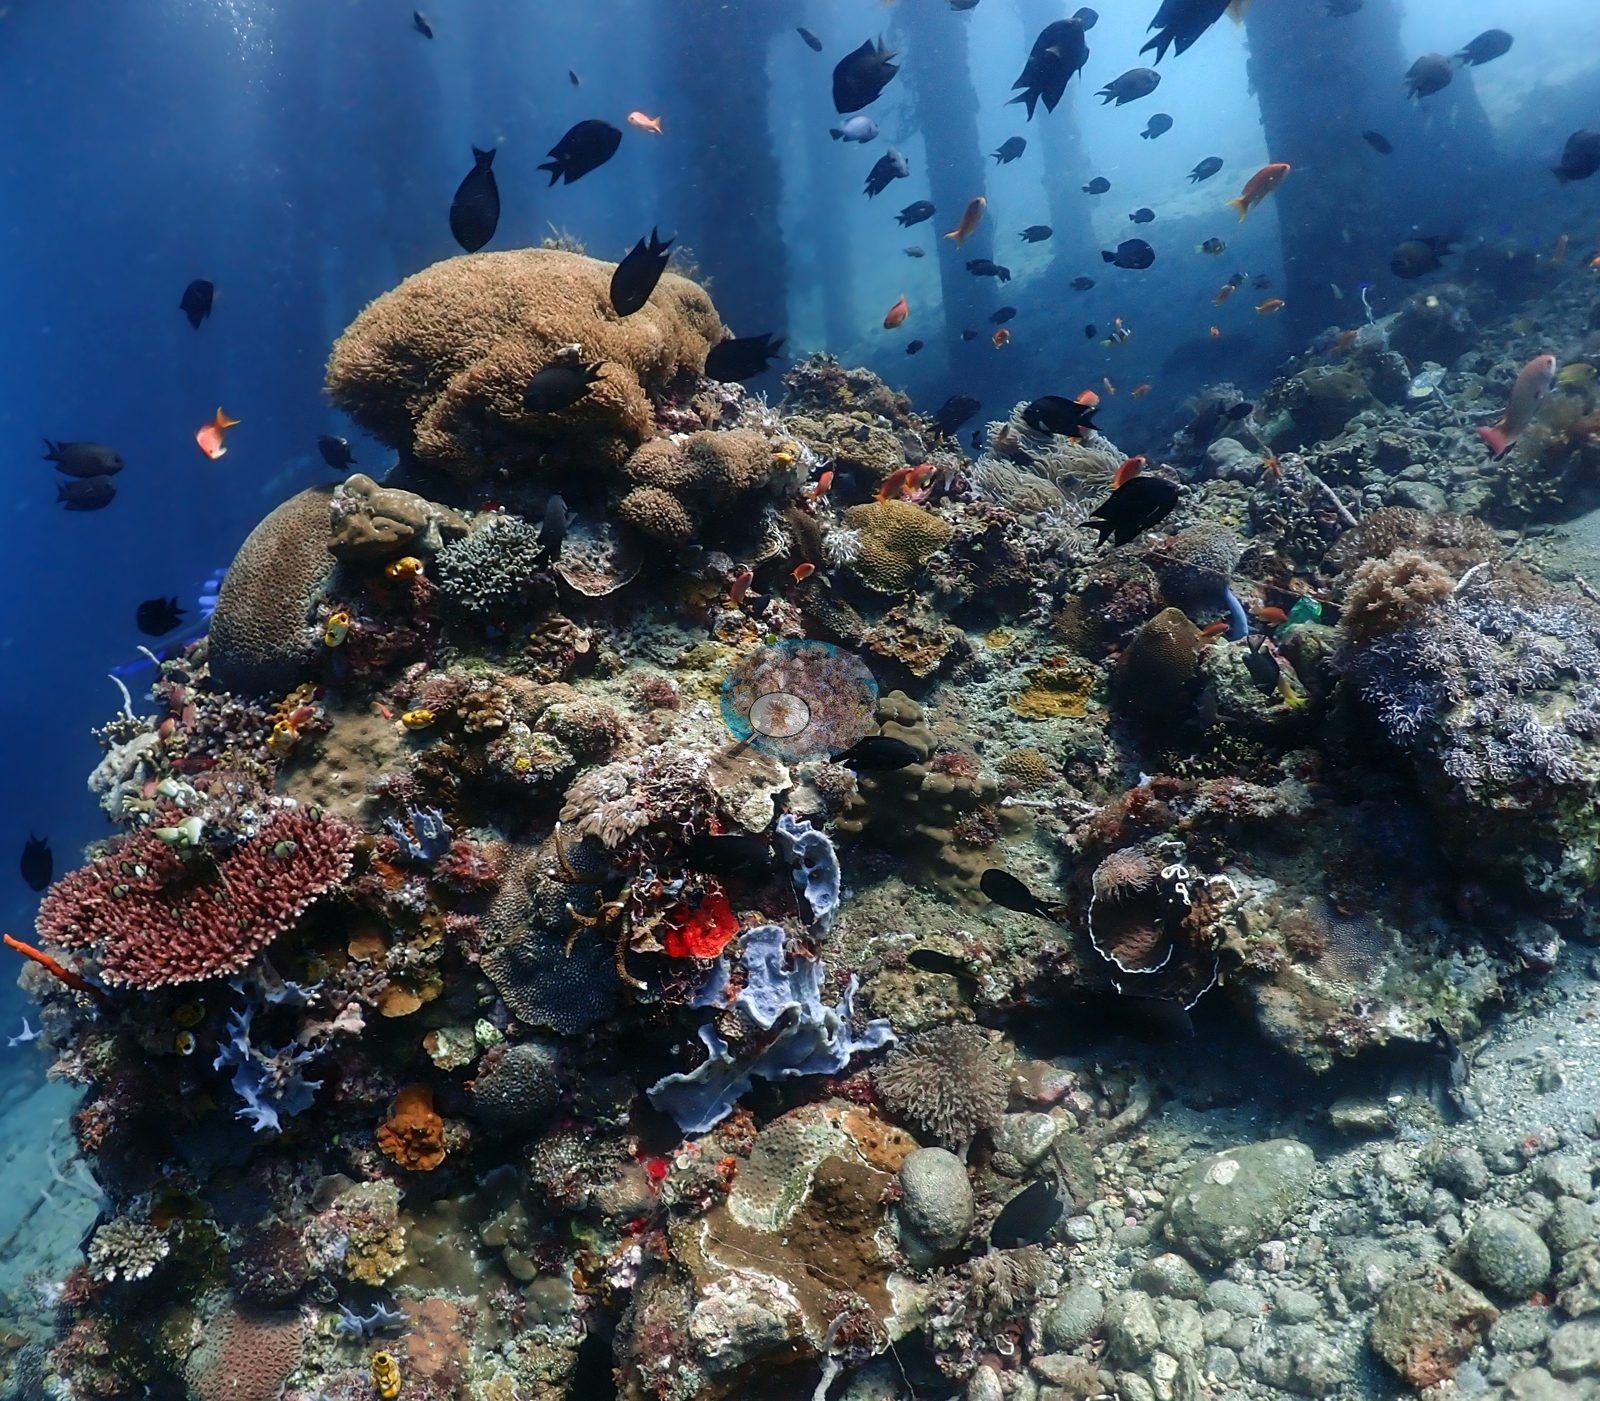
 - Muck and jetty sites with sponge-sheathed pilings, seahorses, frogfish, and a bobtail squid (Beang Abang, Bakalang Jetty, Ampera)
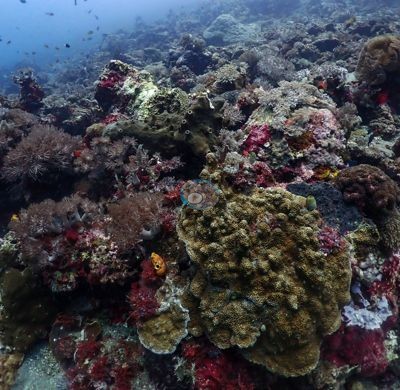 photo: Alor - Bakalang Jetty
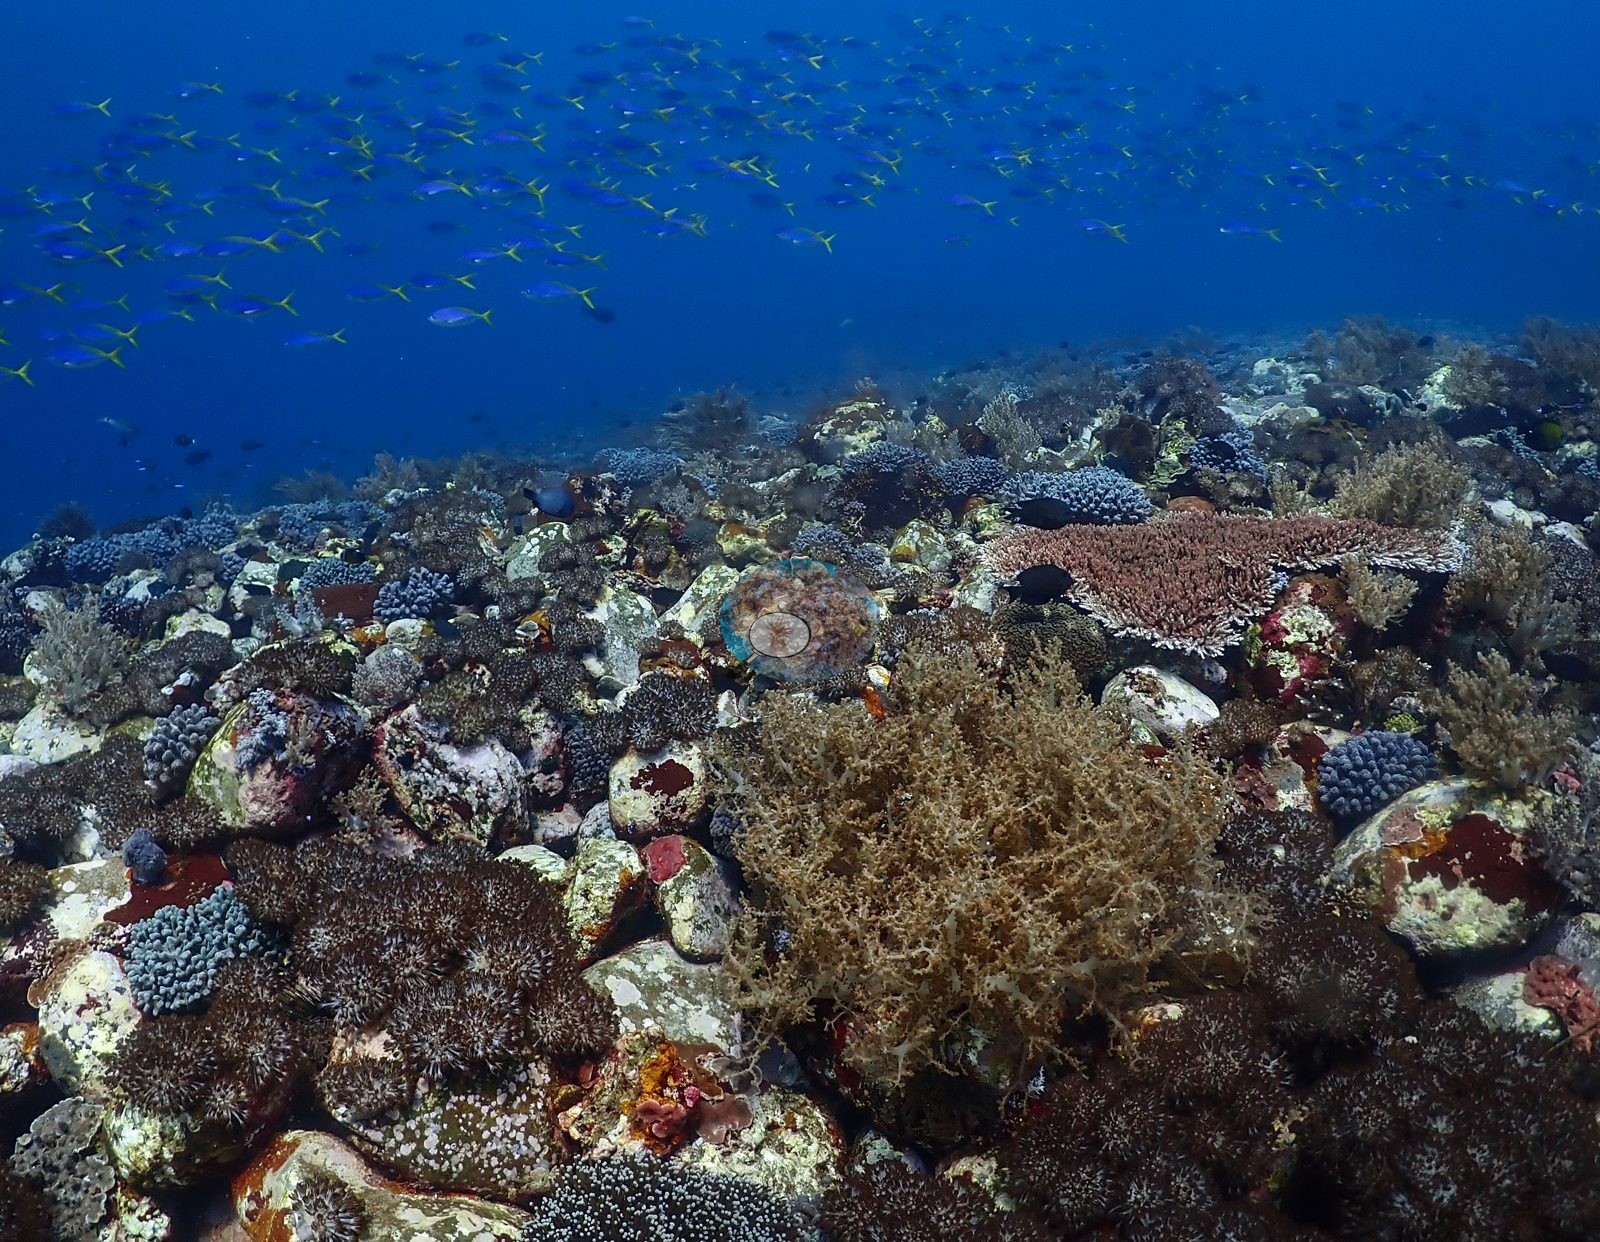
 - Banded sea kraits photographed at Bama Wall and Harilolong
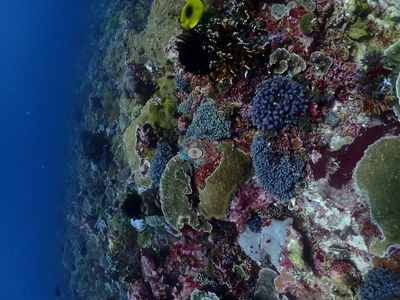 photo: Alor - Harilolong (School's Out)
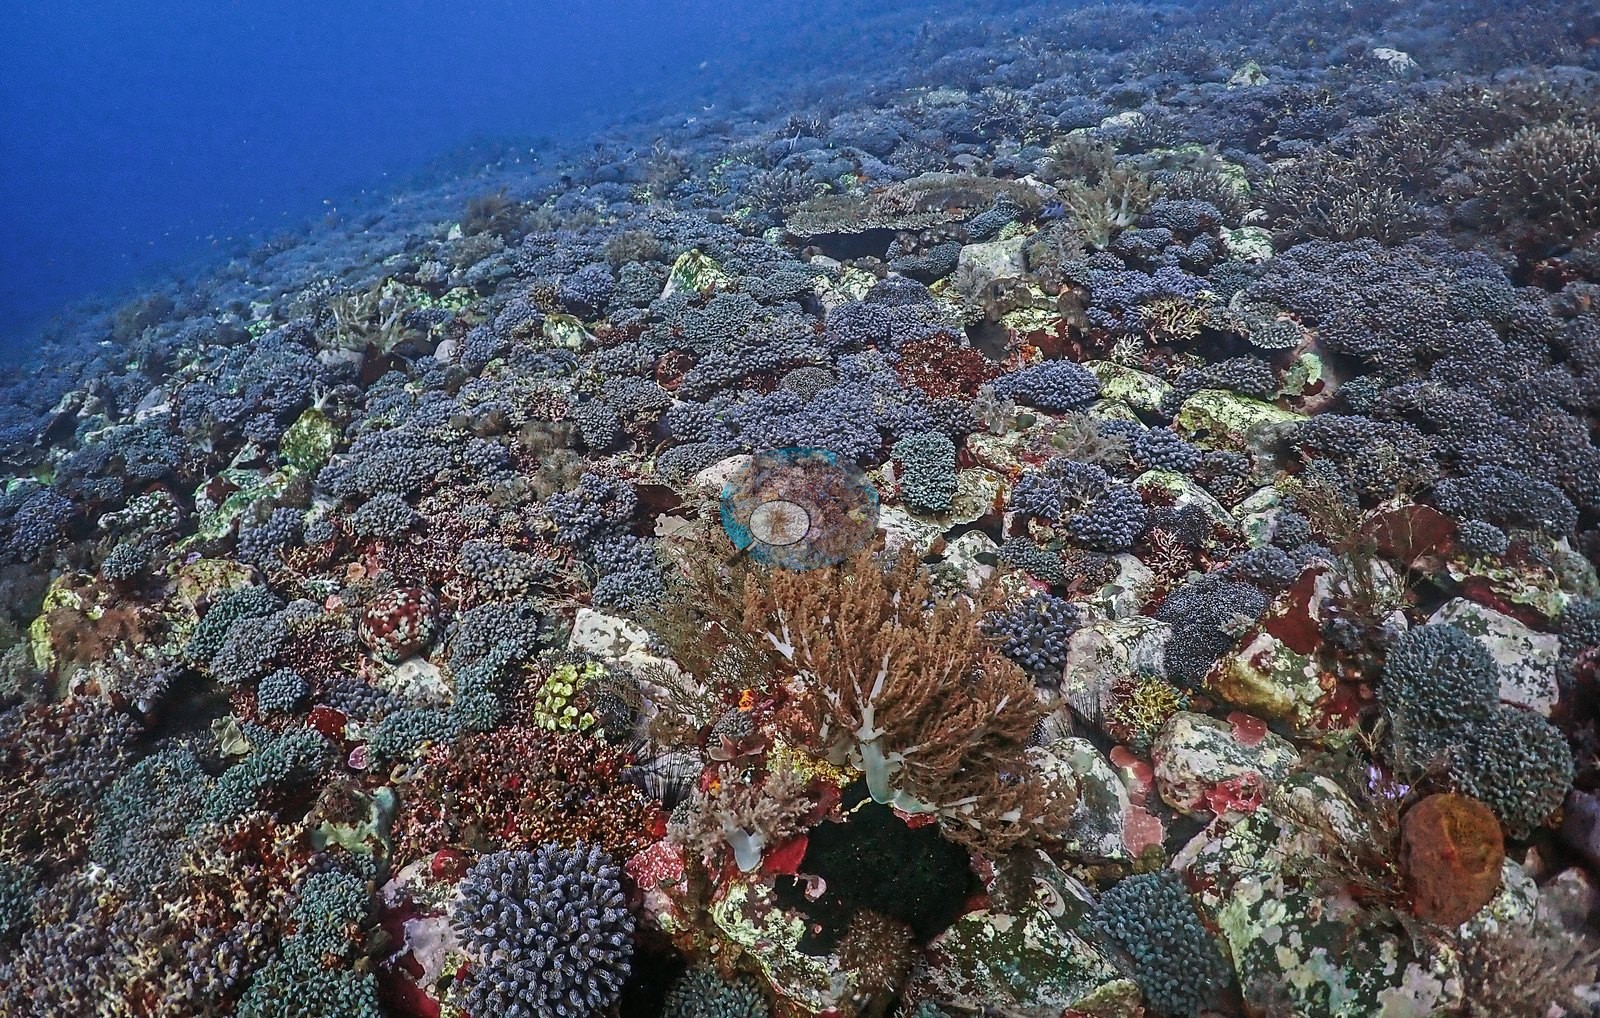
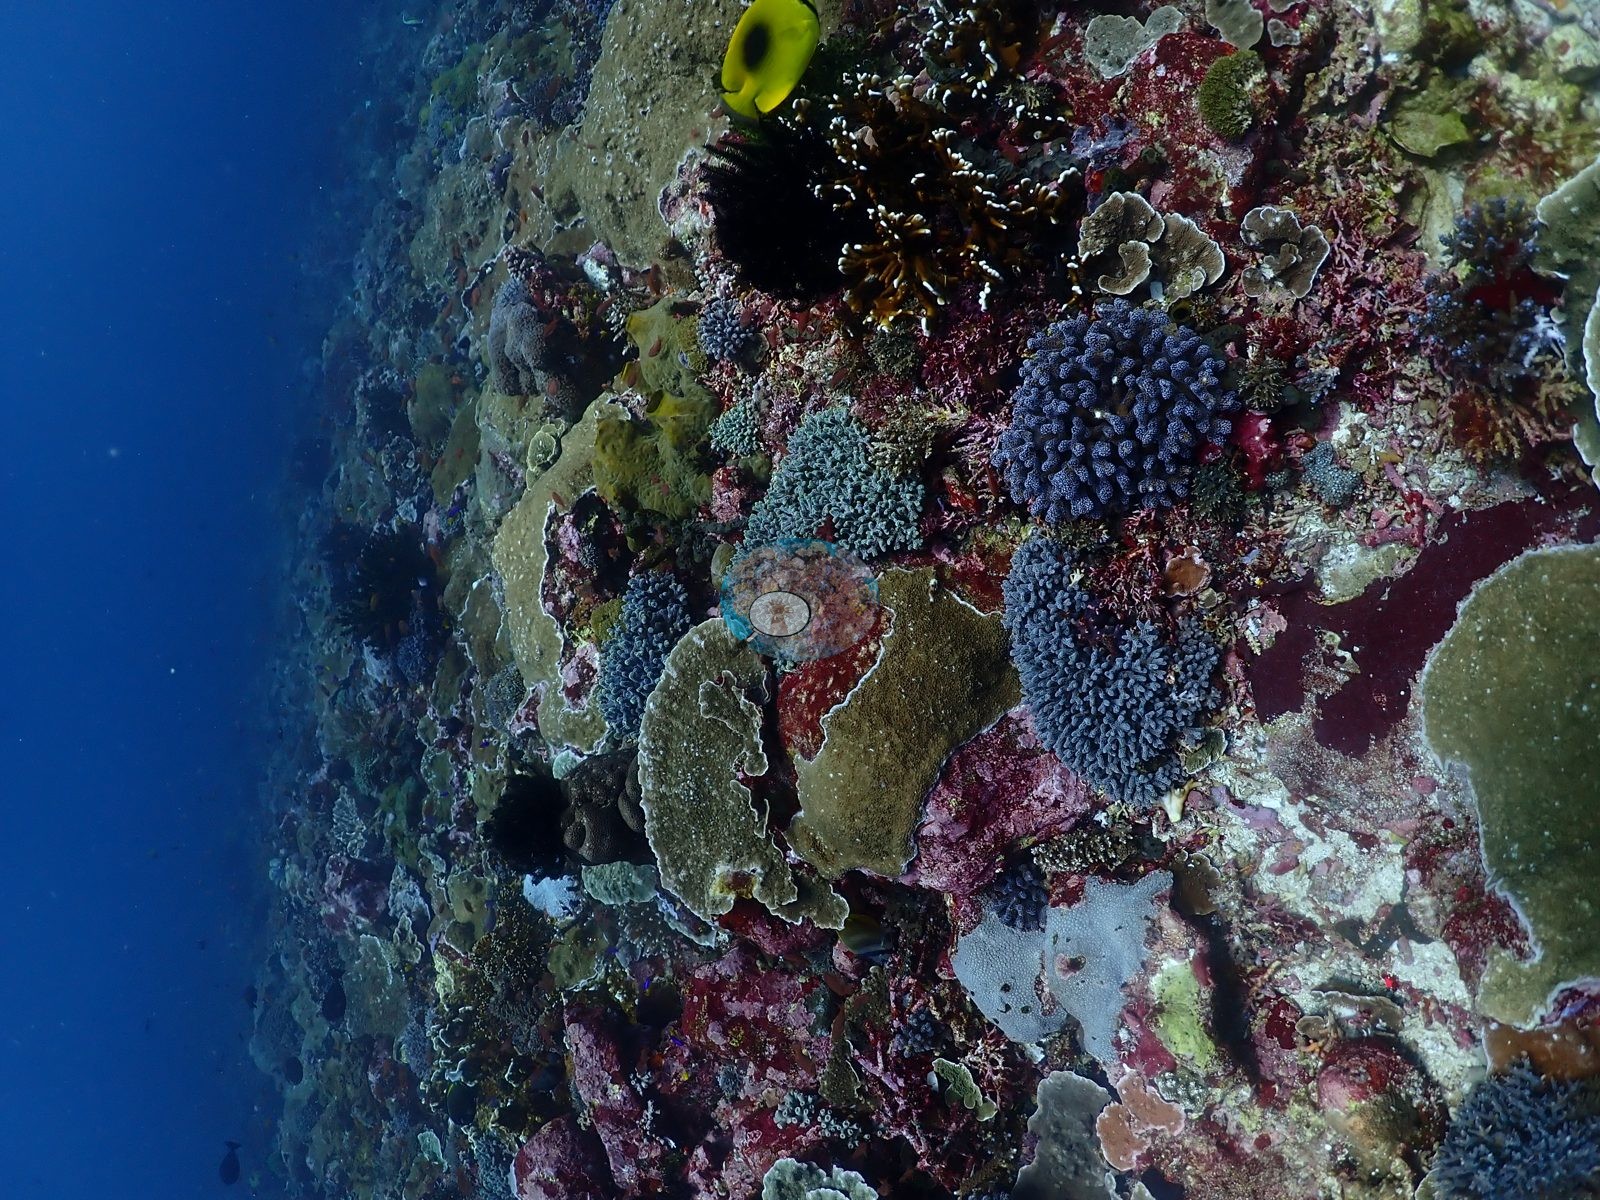
Ini adalah terjemahan mesin dari ringkasan berbahasa Inggris; teks berbahasa Inggris adalah versi yang otoritatif. AI translation of this summary; the English is authoritative.
Regional setting
Spalding et al. (2001) menempatkan gugus Alor di antara Kepulauan Nusa Tenggara (Nusa Tenggara Islands), bagian dari subkawasan Wallacea dalam pembagian mereka, tempat pulau-pulau bergunung dengan gunung api aktif dan paparan yang sempit dipisahkan oleh perairan dalam. Uraian rinci tentang terumbu Nusa Tenggara masih jarang, tetapi terumbu tepi tersebar luas, dan para penulis merangkum kajian dari Pulau Lembata (Lembata Island), di bagian tengah rangkaian pulau, yang menunjukkan betapa kuatnya kondisi terumbu berubah menurut tingkat keterpaparannya. Di pantai barat laut Lembata, terumbu tepi yang berkembang baik memiliki rataan terumbu kaya lamun selebar 200-400 m, dan lebih lebar lagi di pantai barat. Pantai selatan, yang terbuka terhadap alun Samudra Hindia dan mungkin juga terhadap upwelling air dingin, memiliki rataan terumbu yang sempit, struktur taji-dan-alur (spur-and-groove) yang jelas, serta beberapa spesies perairan dalam yang mungkin menyukai kondisi lebih dingin. Di selatan rangkaian pulau ini, arus Laut Timor (Timor Sea) mengalir ke barat sepanjang tahun, dan para penulis melaporkan pemutihan karang yang relatif sedikit pada tahun 1998 di sebagian besar subkawasan tersebut. Secara nasional, mereka memperkirakan luas terumbu di Indonesia sekitar 51,020 km², 18% dari total dunia, dengan 443 spesies karang tercatat dan 581-602 spesies diperkirakan untuk kawasan biogeografis yang lebih luas. Souter et al. (2021) menempatkan ekoregion Sunda Kecil (Lesser Sunda), bersama Jawa bagian selatan (Southern Java), dalam subkawasan Laut Asia Timur (East Asian Seas) yang memiliki 4,279 km² terumbu.
Souter et al. (2021) hanya dapat menyimpulkan sedikit hal secara meyakinkan tentang subkawasan tersebut: perkiraan tutupan karang berayun lebar, tutupan alga menunjukkan penurunan bertahap, dan tidak ada satu lokasi pun di sana yang telah disurvei selama lebih dari 15 tahun. Mereka memperingatkan bahwa negara kepulauan, yang garis pantainya panjang dibandingkan luas daratannya, dapat merasakan dampak iklim di wilayah yang luar biasa luas, dan mereka mengaitkan hilangnya karang di seluruh kawasan setelah tahun 2010 dan 2016 dengan pemutihan massal. Wilkinson (2006) melaporkan bahwa penggundulan hutan untuk kayu dan kelapa sawit jelas meningkatkan beban sedimen di pesisir Indonesia, sekaligus mencatat bahwa, per tahun 2004, terumbu Indonesia termasuk segelintir terumbu di Asia Tenggara yang menunjukkan tanda-tanda pemulihan.
Overview
Sebanyak 19 titik (pin) Alor berasal dari satu minggu penyelaman pada akhir Juli dan awal Agustus 2026, dari kawasan Kalabahi hingga Pulau Ternate (Ternate Island) dan Selat Pantar (Pantar Strait). Dinding dan tubir (Bama Wall, Motonglang, The Arch, Umapura, Sulambali Wall, Babylon, Monaseli) lebih banyak ditutupi spons mengerak, alga koralin, spons tong, kipas laut, karang hitam, dan lili laut daripada karang pembentuk terumbu, dengan koloni berbentuk lembaran yang sesuai dengan Montipora, Pachyseris, dan Turbinaria di birai-birainya. Terumbu landai (Goat Fence, Apuri Bay, Clown Valley, Harilolong, Pasir Merah, Limarahing) bergradasi antara pecahan karang atau pasir vulkanik dan taman karang yang padat. Lokasi muck dan dermaga (Masjid Ampera, Ampera, Lobang, Bakalang Jetty, Beang Abang) berada di atas pasir vulkanik gelap dan dicirikan oleh kehidupan makro, sedangkan Goa Wolang adalah sebuah gua.
Karang terkaya biasanya berada di bagian yang lebih dangkal: kanopi Acropora tanduk rusa yang nyaris tak terputus di lereng tengah Goat Fence, di sepertiga terakhir Harilolong, di Clown Valley dan The Arch, serta pada penyelaman kedua di Babylon, habitat karang bercabang paling luas yang difoto selama perjalanan ini. Lokasi menonjol lainnya adalah hamparan karang lembaran berukuran sekitar satu meter di Sulambali Wall, satu bongkah Porites masif berdiameter sedikitnya 2-3 m di Apuri Bay, dan karang otak berdiameter lebih dari satu meter di The Arch. Tutupan berbasis foto di 16 lokasi berkisar dari 7.5% di dinding dan gua Motonglang hingga 27.0% di Clown Valley. Kedua metode sering kali berbeda jauh, dan di Limarahing satu angka merupakan rata-rata dari taman karang yang padat dan pasir hitam terbuka. Di Apuri Bay tercatat suhu 17-24°C, yang sesuai dengan upwelling yang kuat, dan Monaseli adalah sudut dengan arus yang luar biasa.
Tidak ada lokasi yang menunjukkan pemutihan karang yang meluas. Tanda-tanda setempat meliputi satu koloni masif besar yang hampir seluruhnya putih serta pecahan Acropora mati yang sudah lama di Sulambali Wall, dan pecahan karang yang terekat alga koralin dengan rekrut Acropora baru di Monaseli. Tali pancing monofilamen difoto di Umapura dan Sulambali Wall, rangka kurungan logam di Goa Wolang, dan kurungan bambu berjaring yang tujuannya belum dipastikan di Apuri Bay. Awan ikan anthias hampir selalu ada; ular laut belang melintasi terumbu di Bama Wall dan Harilolong, seekor pari marmer yang sangat besar tercatat di Motonglang, dan penyelaman muck menghasilkan tiga kuda laut di Beang Abang serta seekor cumi-cumi bobtail di Ampera.
Highlights
- Kanopi Acropora tanduk rusa yang nyaris tak terputus di Goat Fence, Harilolong, Clown Valley, The Arch, dan pada penyelaman kedua di Babylon
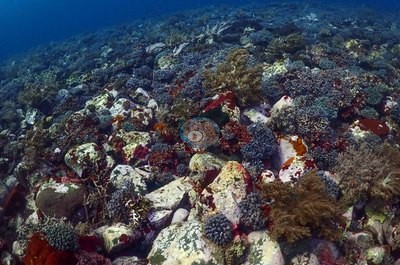 photo: Alor - Clown Valley
 - Hamparan karang lembaran berukuran sekitar satu meter di Sulambali Wall, salah satunya diselimuti ikan anthias merah
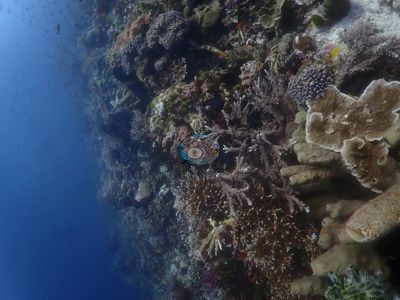 photo: Alor - Sulambali Wall
 - Satu bongkah Porites masif berdiameter sedikitnya 2-3 m di Apuri Bay, tempat tercatat suhu air 17-24°C
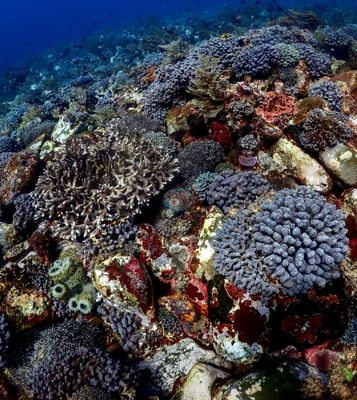 photo: Alor - Apuri Bay
 - Tutupan berbasis foto dari 7.5% (Motonglang) hingga 27.0% (Clown Valley) di 16 lokasi; tiga penyelaman muck malam tidak memiliki angka tutupan
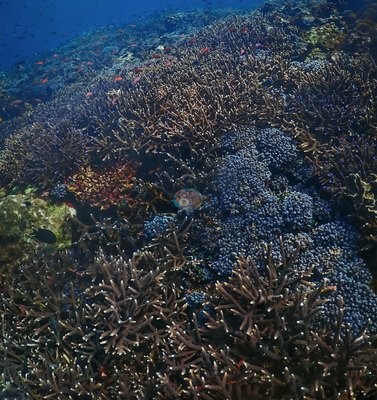 photo: Alor - Clown Valley
 - Lokasi muck dan dermaga dengan tiang pancang berselubung spons, kuda laut, ikan kodok, dan cumi-cumi bobtail (Beang Abang, Bakalang Jetty, Ampera)
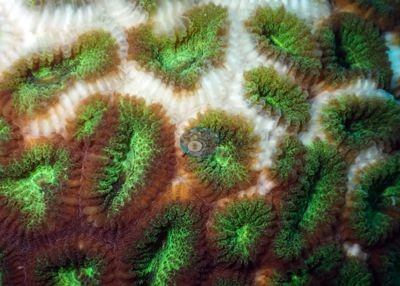 photo: Alor - Bakalang Jetty
 - Ular laut belang difoto di Bama Wall dan Harilolong
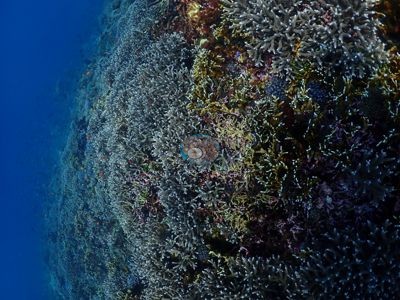 photo: Alor - Harilolong (School's Out)
Notable observations
- Alor - Goat Fence: One strongly pale colony, a red-rimmed fleshy coral with a white interior; single-colony observation, not site-wide, and pale centers can be normal pigmentation. Localized old mortality, rubble, and algal colonization on the deeper slope
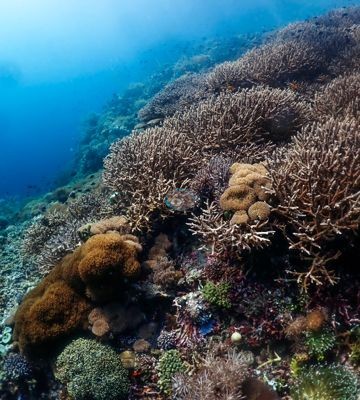
- Alor - Bakalang Jetty: One mounding branching colony with pale branch tips that could be natural pigmentation, algae, or early paling/bleaching; not called with confidence either way
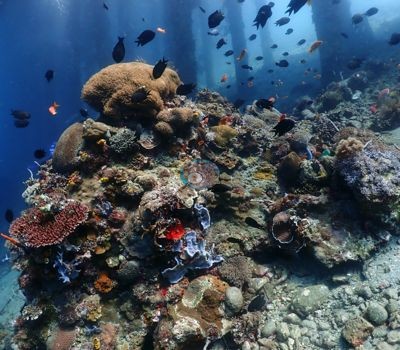
- Alor - Apuri Bay: Bamboo-and-mesh cage structures and a guideline on the sand, purpose not established (fish traps vs. coral nursery/restoration frame); small pale patches on the giant Porites read as old partial-mortality scars rather than active bleaching
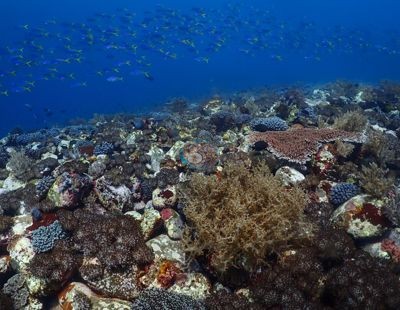
- Alor - Goa Wolang (Walang Cave): Metal cage/rebar frame with attached lines on the rubble pavement; a thin line or mooring rope crosses three frames
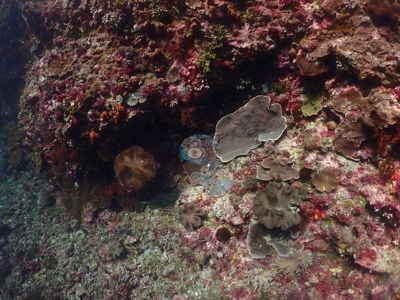
- Alor - Umapura: Thin white monofilament line draped on the reef in several frames; a few individually pale colonies, no widespread bleaching
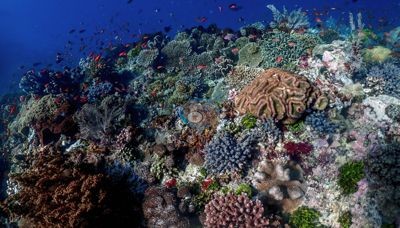
- Alor - Sulambali Wall: One large massive colony almost entirely white (bleached or recently dead) and several smaller colonies with white patches, individual not site-wide; extensive older dead-Acropora rubble aprons; monofilament line or thin rope on the wall in at least four frames
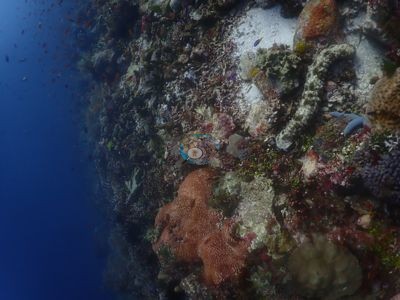
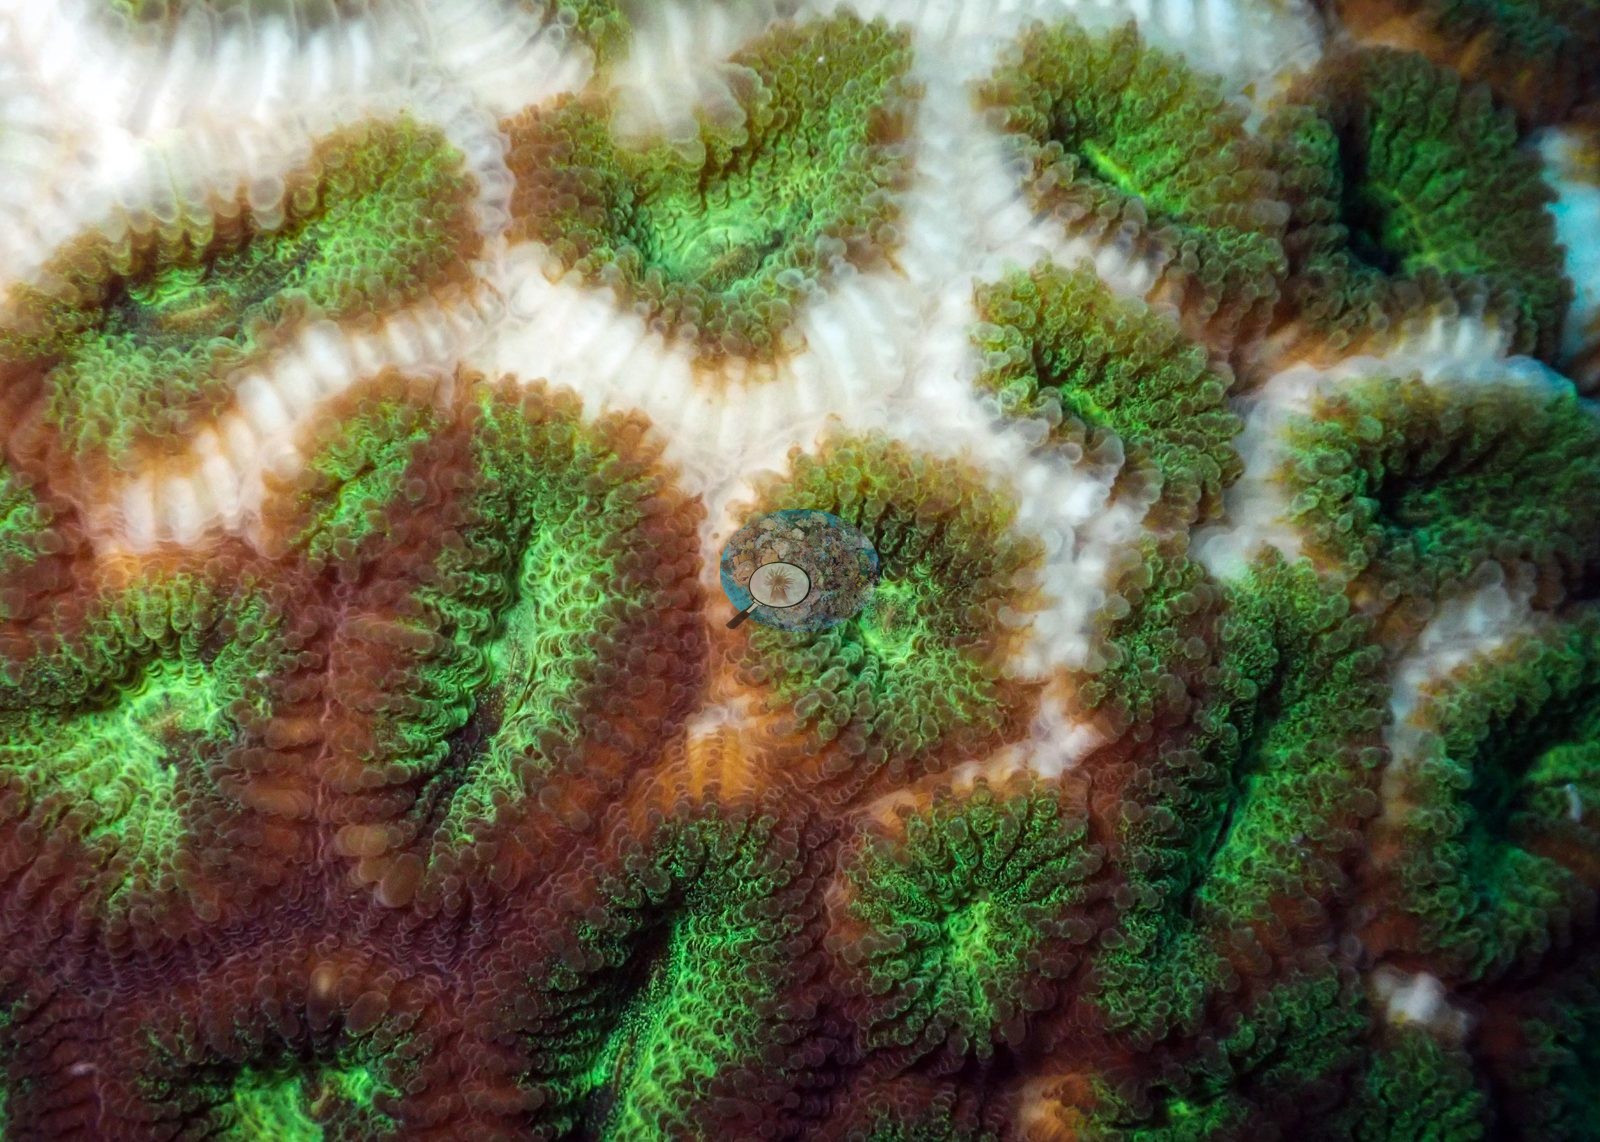
- Alor - Clown Valley: One unusually saturated green plating colony, possibly stressed or naturally pigmented; flagged for a second look
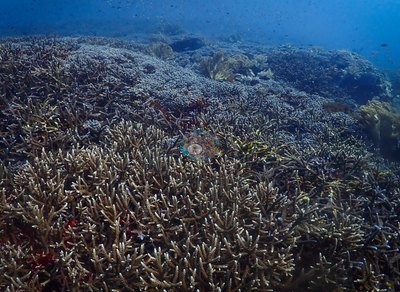
- Alor - Monaseli (Munaseli): Extensive coralline-crusted rubble fields of broken branch fragments, not recent, cause undetermined; partial mortality on a plate about 1.5 m across. No bleaching, disease, crown-of-thorns starfish (COTS), or fishing gear recorded
Coral cover over time (pooled)
Sites in this region (19)
- Alor - Ampera
- Alor - Apuri Bay — 29% coral cover
- Alor - Babylon — 30% coral cover
- Alor - Bakalang Jetty — 7.6% coral cover
- Alor - Bama Wall — 11% coral cover
- Alor - Beang Abang (Baeng Beach / Baeng Jetty)
- Alor - Clown Valley — 41% coral cover
- Alor - Goa Wolang (Walang Cave) — 7.7% coral cover
- Alor - Goat Fence — 11% coral cover
- Alor - Harilolong (School's Out) — 36% coral cover
- Alor - Limarahing (Black Sands) — 29% coral cover
- Alor - Lobang
- Alor - Masjid Ampera (Mucky Mosque)
- Alor - Monaseli (Munaseli) — 20% coral cover
- Alor - Motonglang (Cathedral) — 5.8% coral cover
- Alor - Pasir Merah (Red Sand) — 16% coral cover
- Alor - Sulambali Wall — 22% coral cover
- Alor - The Arch — 23% coral cover
- Alor - Umapura — 18% coral cover
Nearby external survey stations
4 independent survey records within 5 km of a site in this region (deduplicated across sites).
- WCS Indonesia via MERMAID — 1001 (2025): 0.0% hard coral cover, 0.52 km from Alor - Umapura
- WWF-US / WWF-Indonesia — 5002 (2014): 8.0% hard coral cover, 0.63 km from Alor - Apuri Bay
- WWF-US / WWF-Indonesia — 5003 (2014): 24% hard coral cover, 0.99 km from Alor - Pasir Merah (Red Sand)
- WWF-US / WWF-Indonesia — 5004 (2014): 53% hard coral cover, 0.24 km from Alor - Babylon
All images from Coral Reef Diagnostics. Data are from Coral Reef Diagnostics.
© Coral Reef Diagnostics.
References
- Souter D, et al. (eds) (2021) Status of Coral Reefs of the World: 2020. International Coral Reef Initiative / Global Coral Reef Monitoring Network. [PDF]
- Spalding MD, et al. (2001) World Atlas of Coral Reefs. University of California Press, Berkeley. [PDF]
- Wilkinson C (2006) Status of coral reefs of the world: summary of threats and remedial action. In: Côté IM, Reynolds JD (eds) Coral Reef Conservation. Cambridge University Press, Cambridge. [PDF]