
Regional summary of 11 dive sites. Figures are averages across the sites that report them (n = sites with a value); each site's own page has its individual values. Part of the Red Sea overview.
⬇ Download this region as a report card
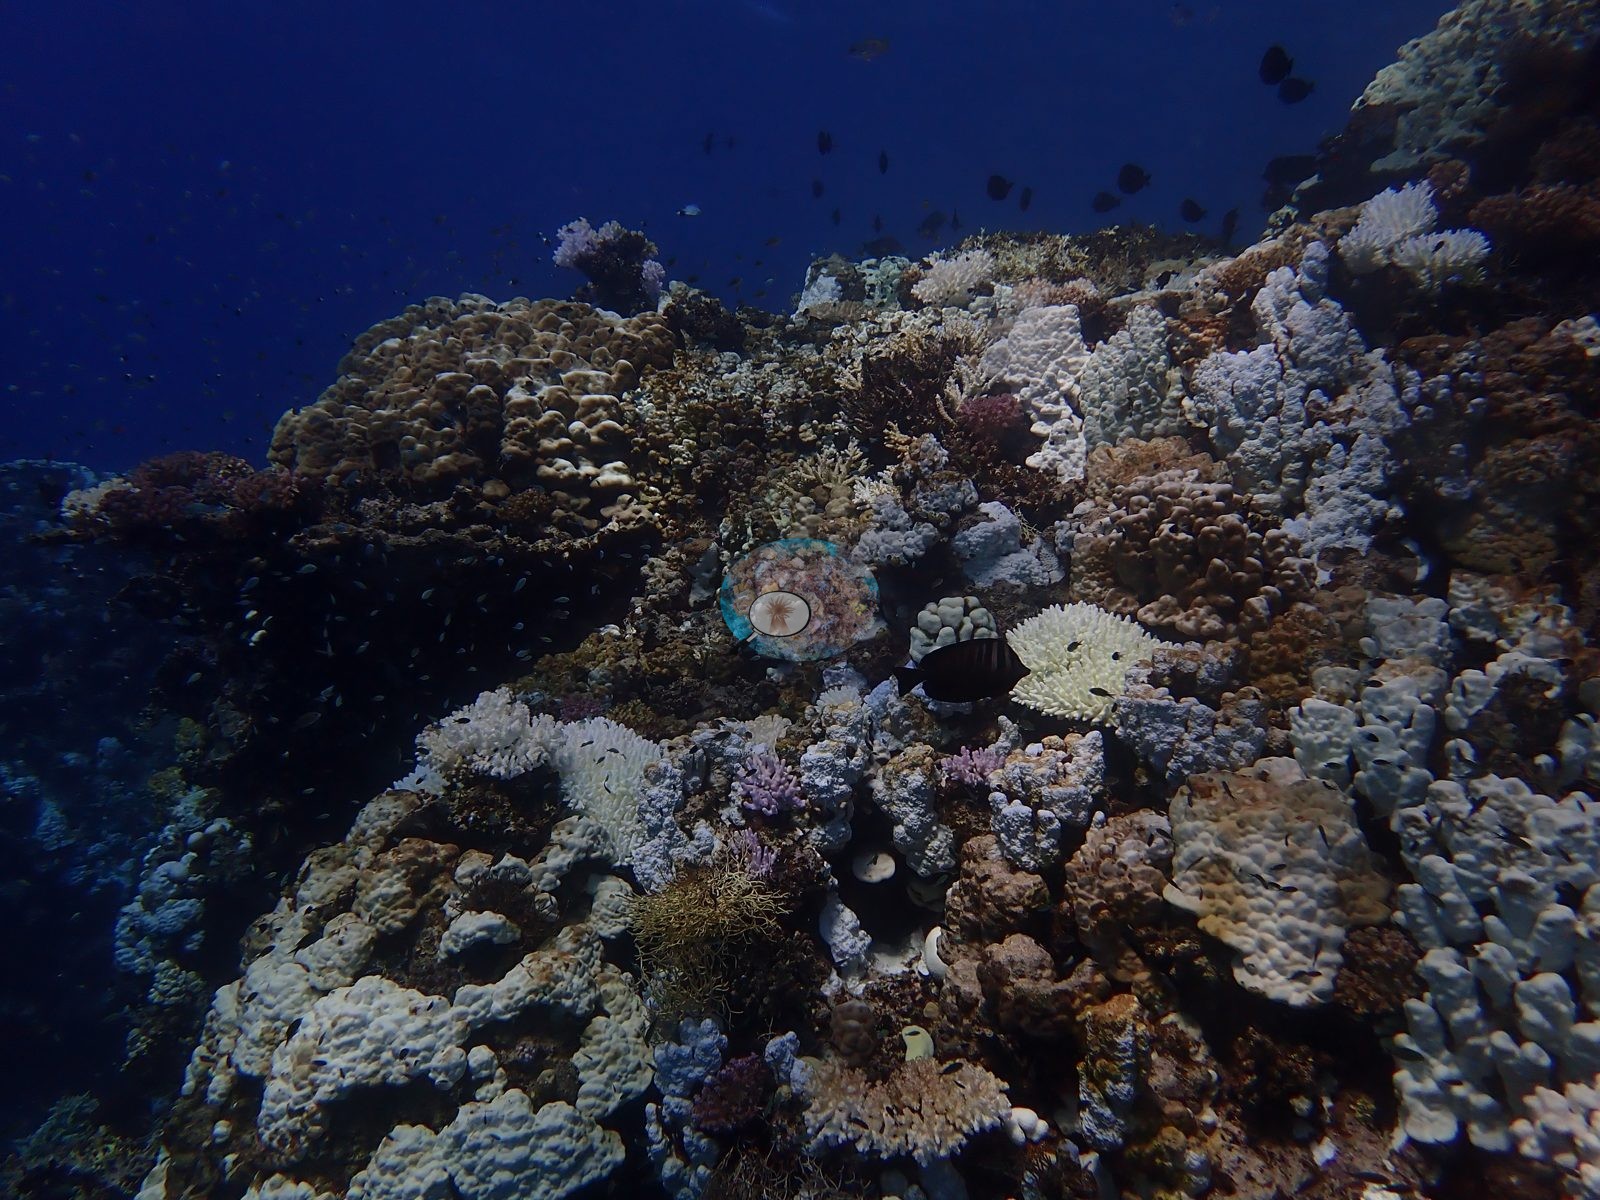

Eleven Red Sea reef slopes, pinnacles, and a coral-covered shipwreck at Marsa Nakari and Wadi Lahami were dived in September 2024, in the middle of a severe bleaching event. Nearly all corals showed some bleaching, with bleached tissue ranging from 45.5% to 73.8% across sites.
Heat stress
Long-term record: 11 years since 1985 reached 8 or more °C-weeks at NOAA’s Egypt station. Download the annual DHW data (CSV).
11 sites in this region — click a marker to open that site.
Regional setting
The Red Sea is geologically a young ocean, a basaltic spreading rift that has been pulling Africa and Arabia apart for some 70 million years. Its shallow link to the Indian Ocean has closed many times, most recently during the Pleistocene, and many of today's reefs are thin modern veneers over older Pleistocene reefs (Spalding et al. 2001). Together with the Gulf of Aden, the Red Sea may be the most biologically diverse reef area outside Southeast Asia, with many endemic species. South of the Gulfs of Suez and Aqaba, both shores of the northern Red Sea are lined with fringing reefs that run unbroken for tens of kilometers, usually with narrow reef flats. Live coral cover reached 60–80% on many northern reef slopes, and no bleached reefs were seen in this part of the Red Sea in 1998. Egypt's coast has been reshaped by tourism since the 1980s; poorly planned resort growth around Hurghada and Safaga degraded or destroyed many nearshore fringing reefs, and as of 2001 new developments were spreading farther south. Protection extends to all of Egypt's reefs in the Gulf of Aqaba and to the fringing reefs of 22 Red Sea islands, among them the remote Brothers, Daedalus, Zabargad, and Rocky. Spalding et al. (2001) estimate about 3,800 km² of coral reef for Egypt; Souter et al. (2021) give 13,605 km² for the Red Sea–Gulf of Aden region, 7,800 km² of it in the northern and central Red Sea.
Summarizing the 2004 status report, Wilkinson (2006) described Red Sea reefs as still in fairly good health, with little runoff or fishing pressure apart from shark removal, and with most 1998 bleaching damage reversed; shipping, poorly controlled tourism growth, bleaching, and crown-of-thorns starfish were the threats ahead. Souter et al. (2021) name tourism and coastal development as the main local causes of coral loss in the northern Red Sea. In their analysis, coral cover in the northern and central Red Sea dipped from 35.2% (1997) to 29.7% (2002) and then climbed slowly to 39.1% by 2019, while algal cover rose from 5.2% in 2010 to 11.5%. The region's only sampling units with more than 15 years of data lie on the Egyptian coast, where more frequent disturbances have produced a stepwise decline: half of those that lost at least a fifth of their coral had not regained 90% of it.
Overview
The Egypt unit covers eleven Red Sea dives in two areas surveyed on 20-23 September 2024: Marsa Nakari (Nakari House Reef-South, Marsa Nakari-North, Habili El Ghadeer, and Om Halhala) and Wadi Lahami (Shabrour-north, Shabrour-south, Gazella Reef, Salah, Abu Galawa-small, Habili Daisy, and Habili Gazella). The settings range from low-relief house-reef slopes of coralline pavement, rubble and sand at Marsa Nakari, to submerged pinnacles (Habili El Ghadeer, Habili Daisy, Habili Gazella), a sand plain studded with bommies at Shabrour-north, a coral ridge with canyon-like gaps at Gazella Reef, dense Porites-and-Acropora slopes at Om Halhala and Salah, and a heavily coral-colonized steel shipwreck at Abu Galawa-small. Recorded depths ran from 15.8 m at Gazella Reef to 30.8 m on the Habili El Ghadeer pinnacle; Nakari House Reef-South and Habili Gazella have no depth.
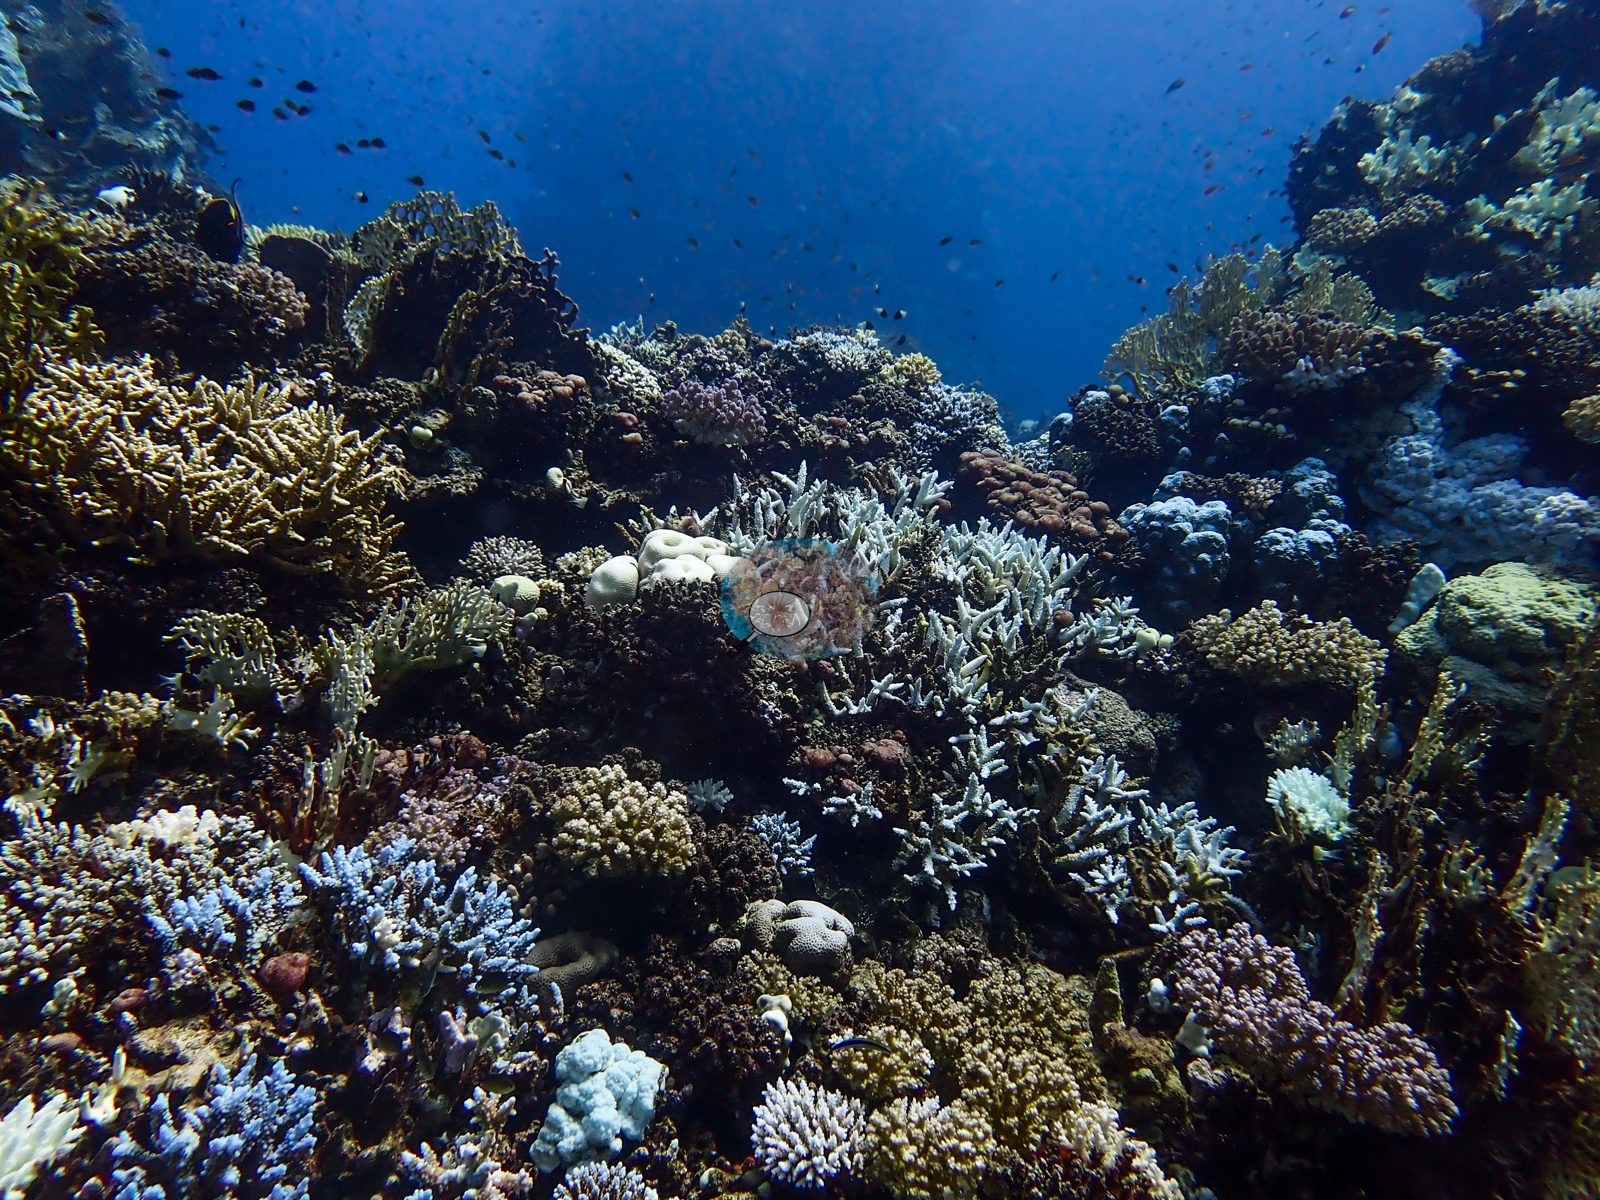
Published cover from photographic point counts ranged from 13.2% on the bioeroded, coralline-crusted plateau of Habili El Ghadeer to 28.1% at Salah, and algal cover was low everywhere (3.4% at Om Halhala to 7.9% at Habili El Ghadeer). The coral communities combine massive Porites, corymbose and staghorn Acropora, pocilloporids, Seriatopora hystrix, faviids, and Millepora-type fire coral, with electric-blue Acropora at Gazella Reef and Shabrour-south. At Marsa Nakari, Reef Check stations 0.1-0.25 km from the two house-reef pins recorded 37.2% and 39.4% in 2024, a different method on what may be the same reef.
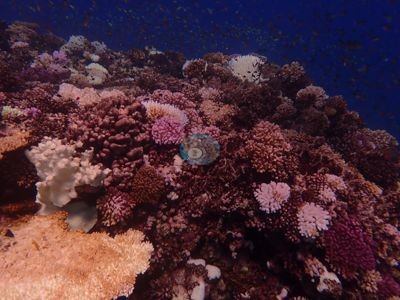
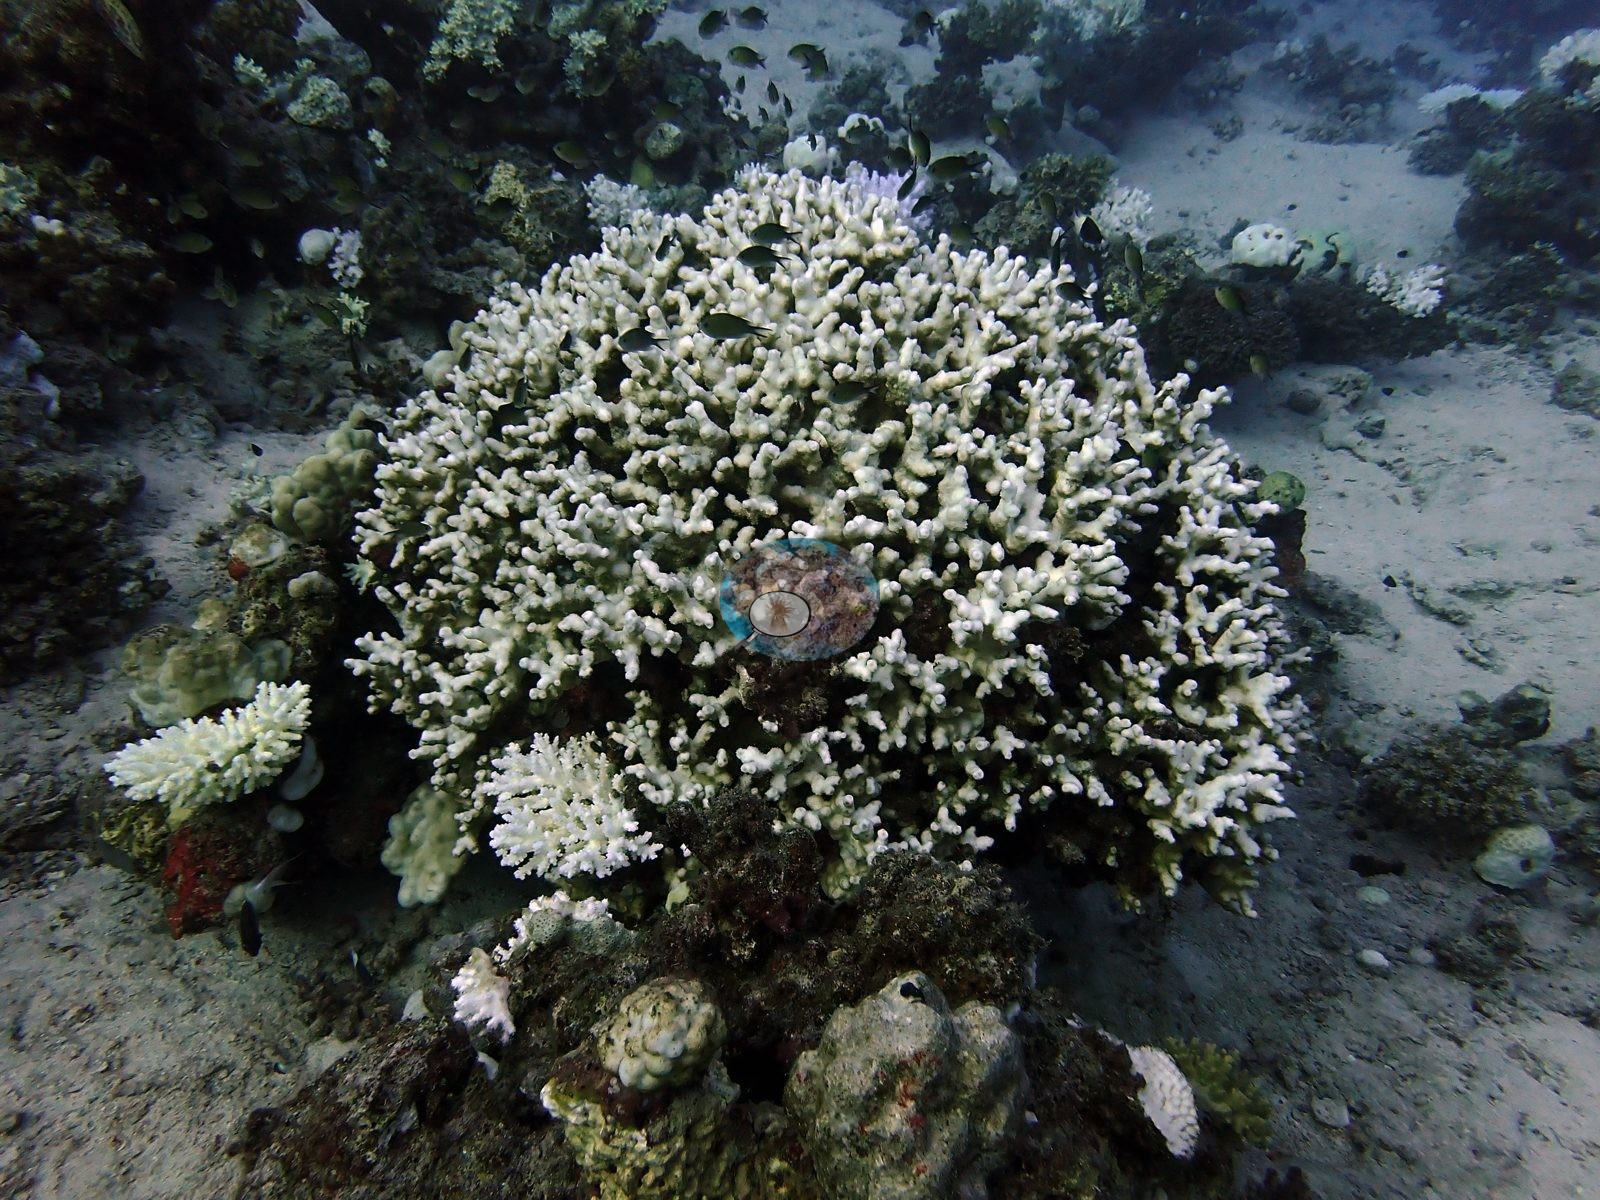
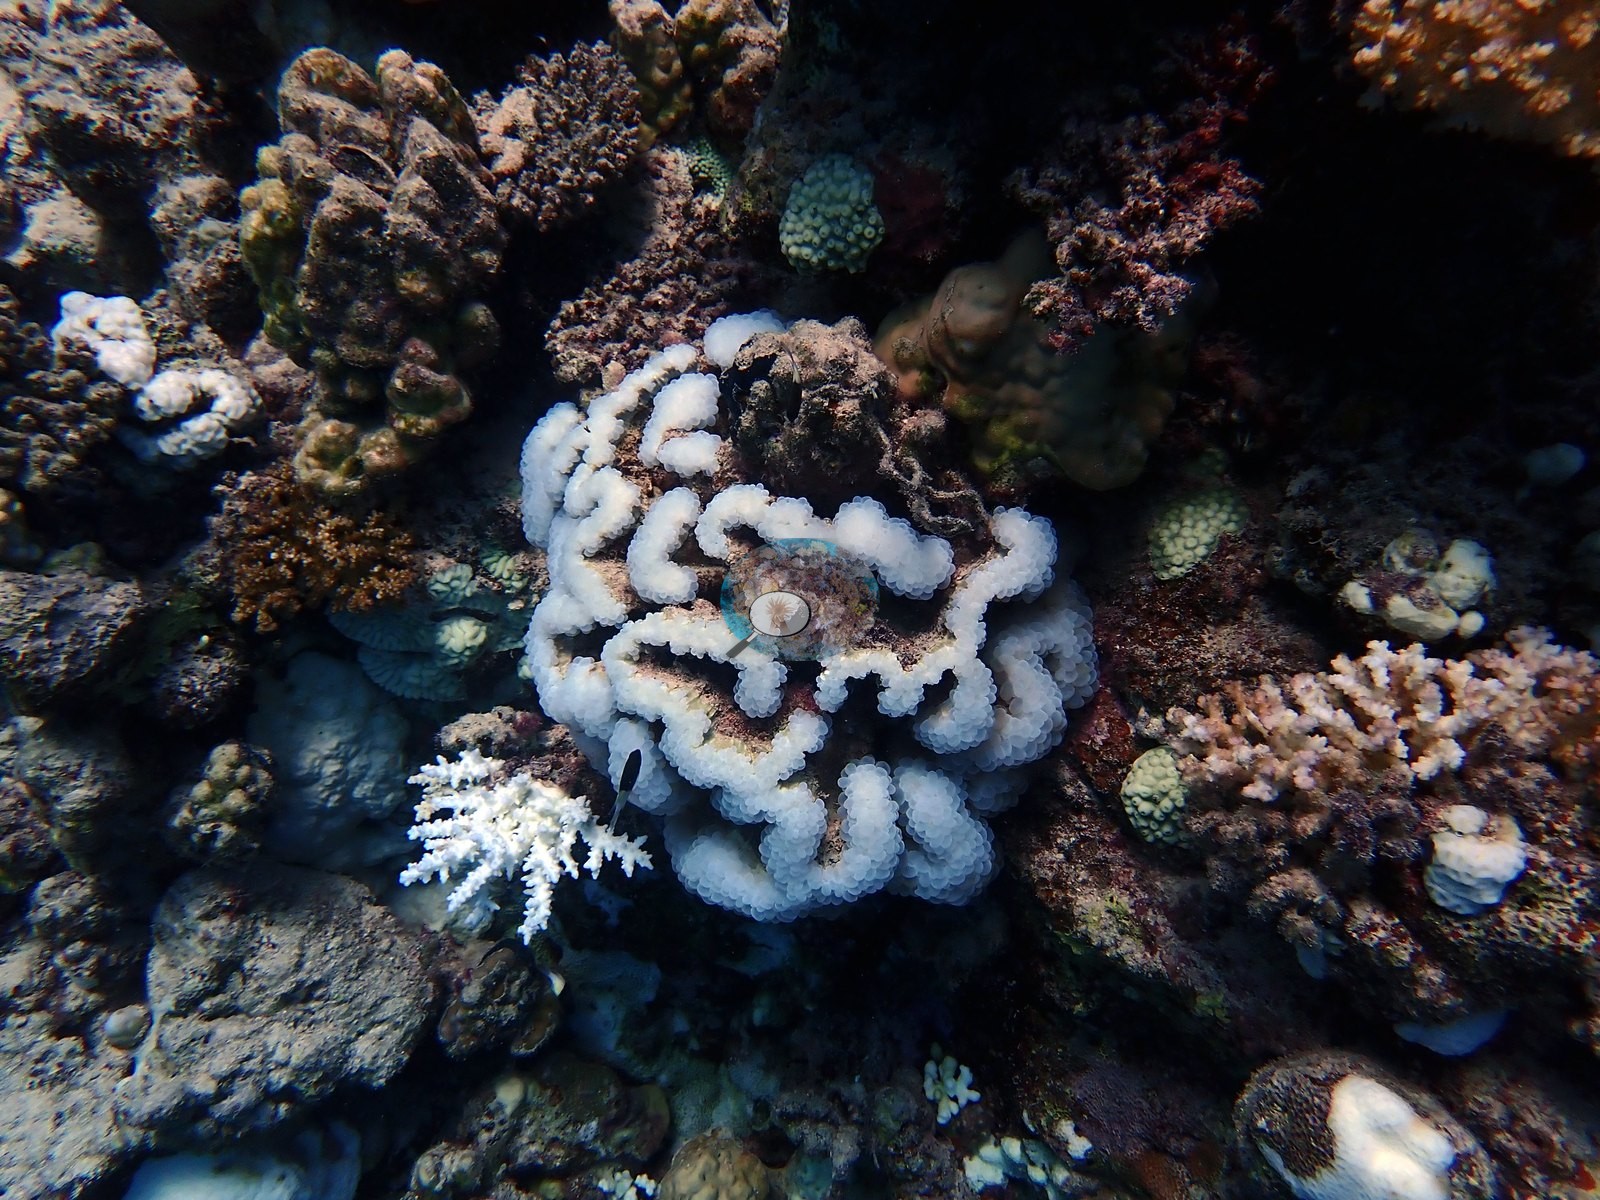
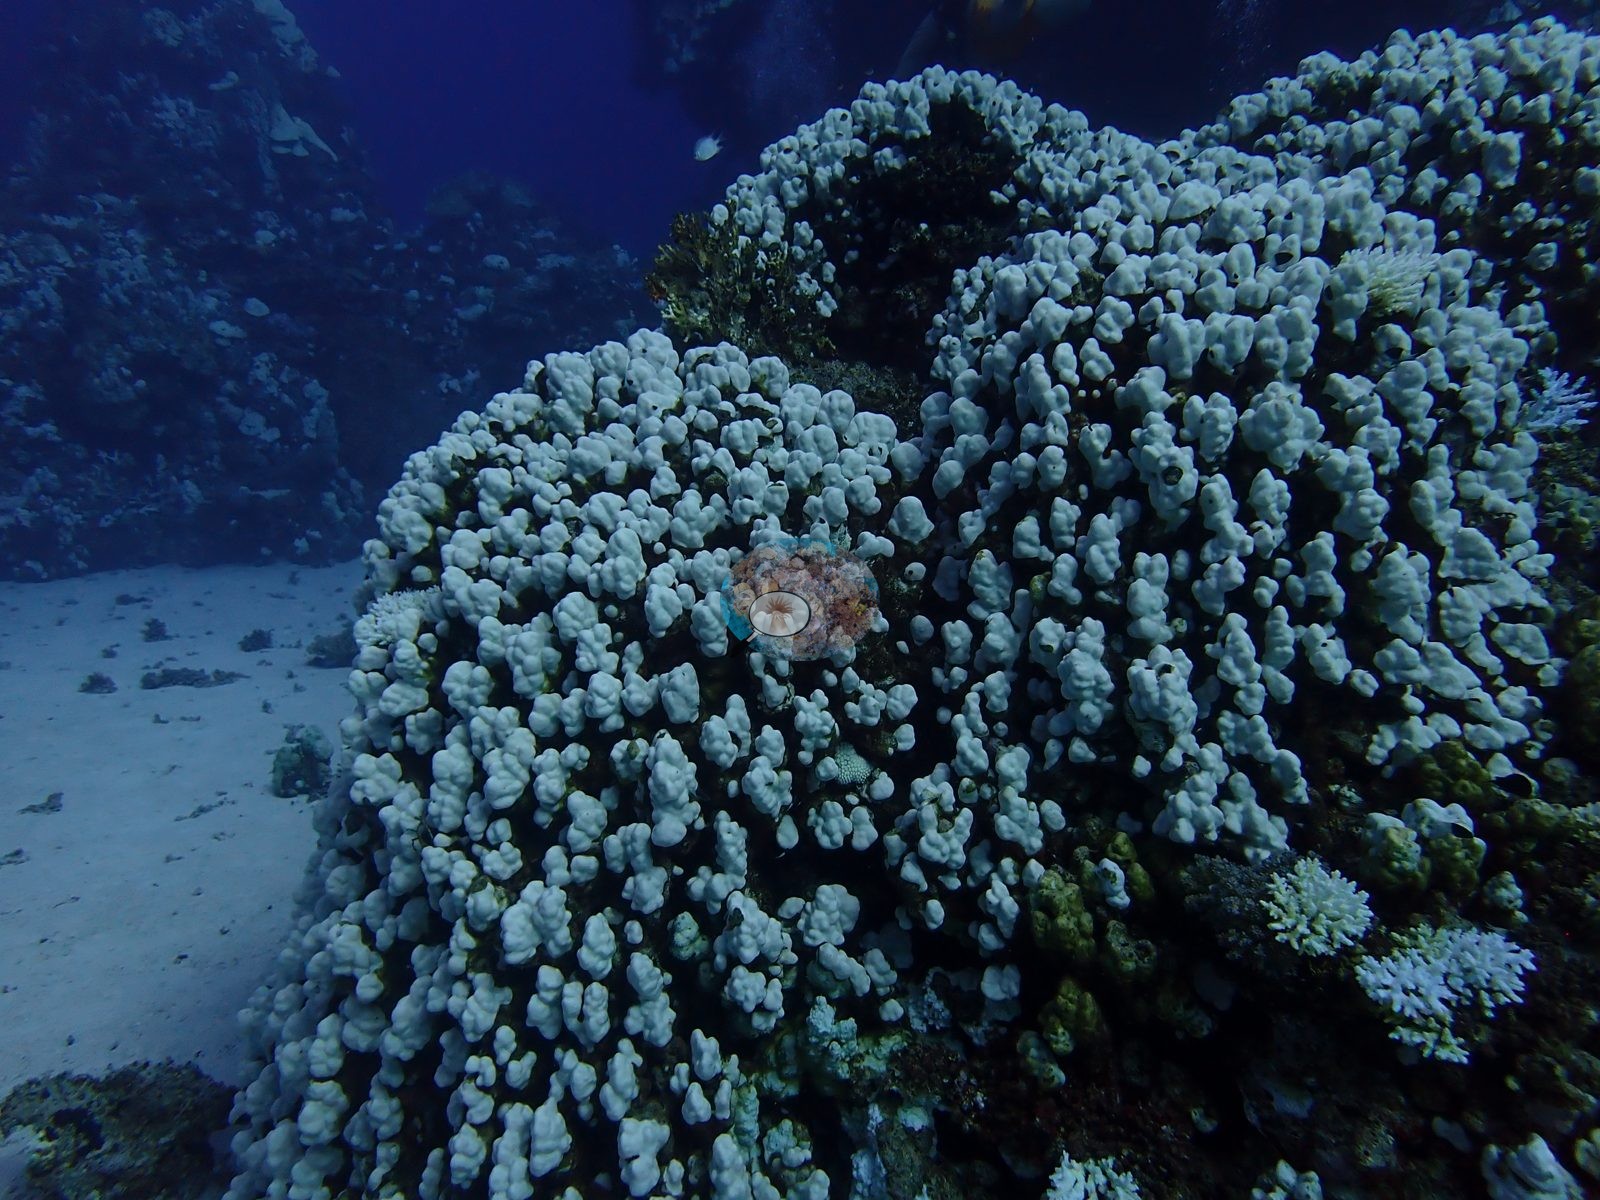
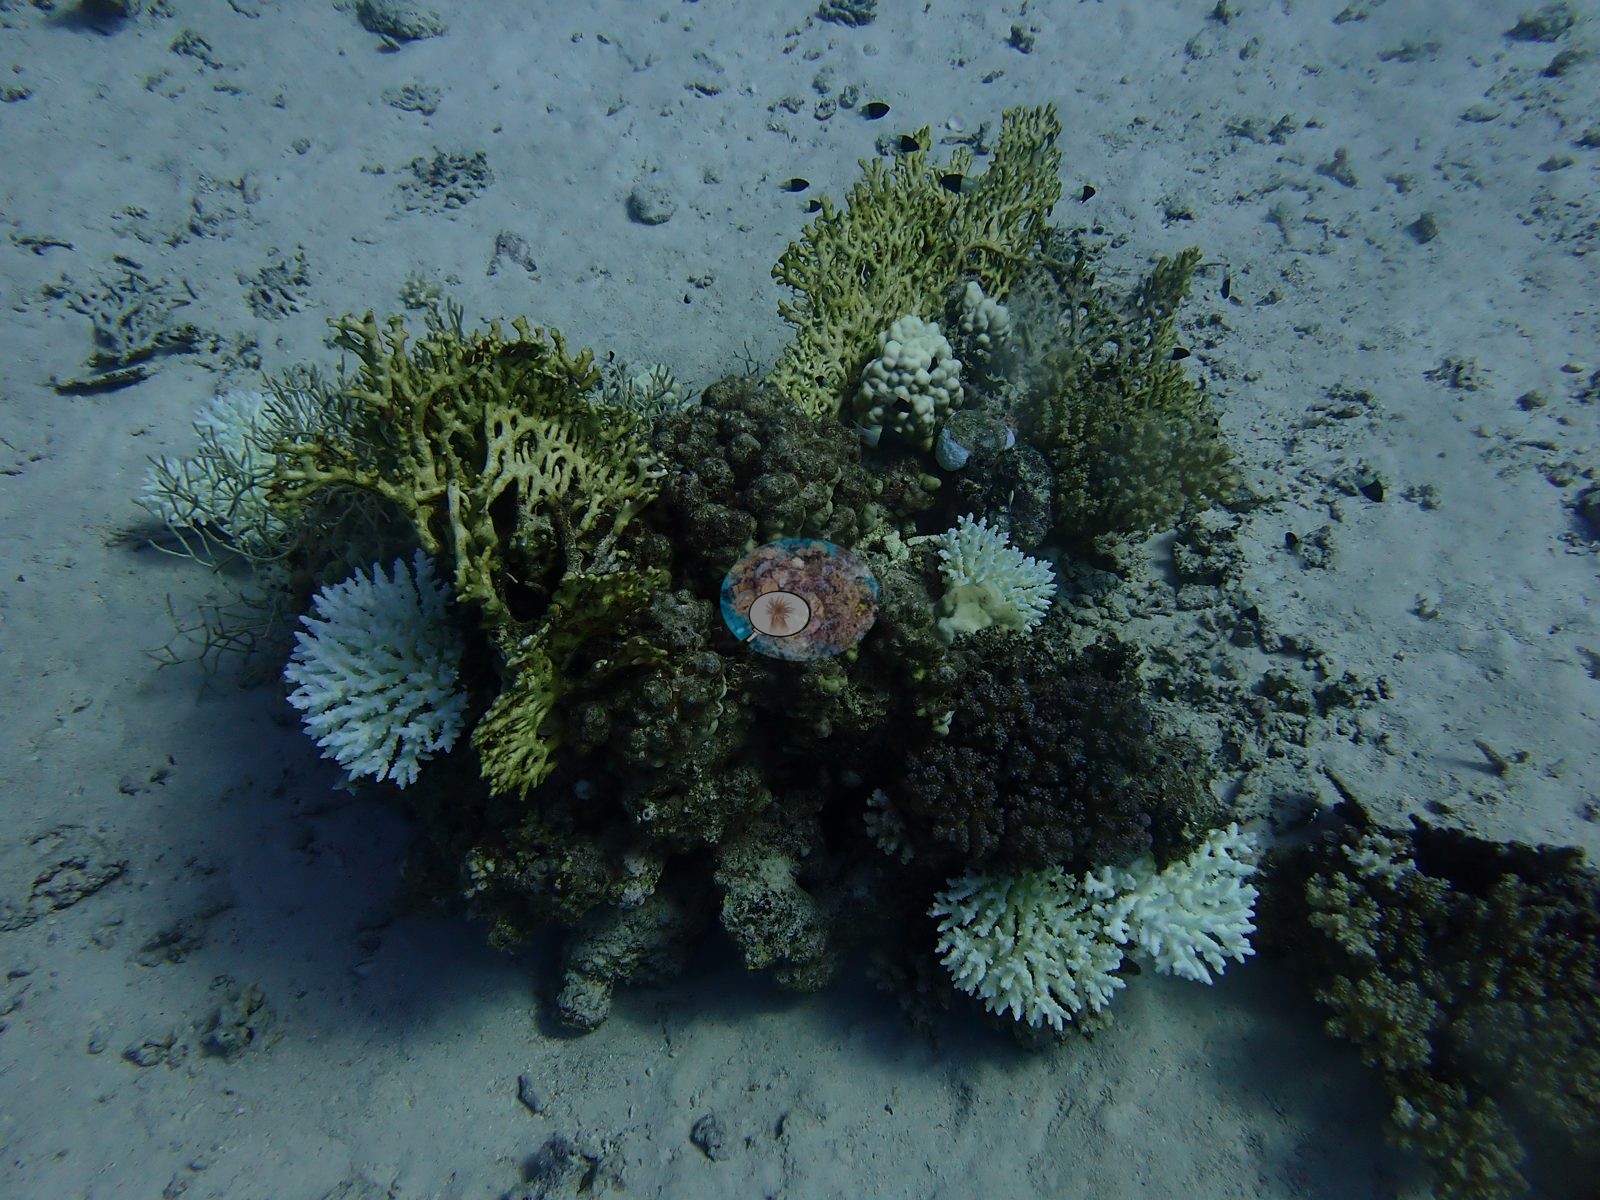
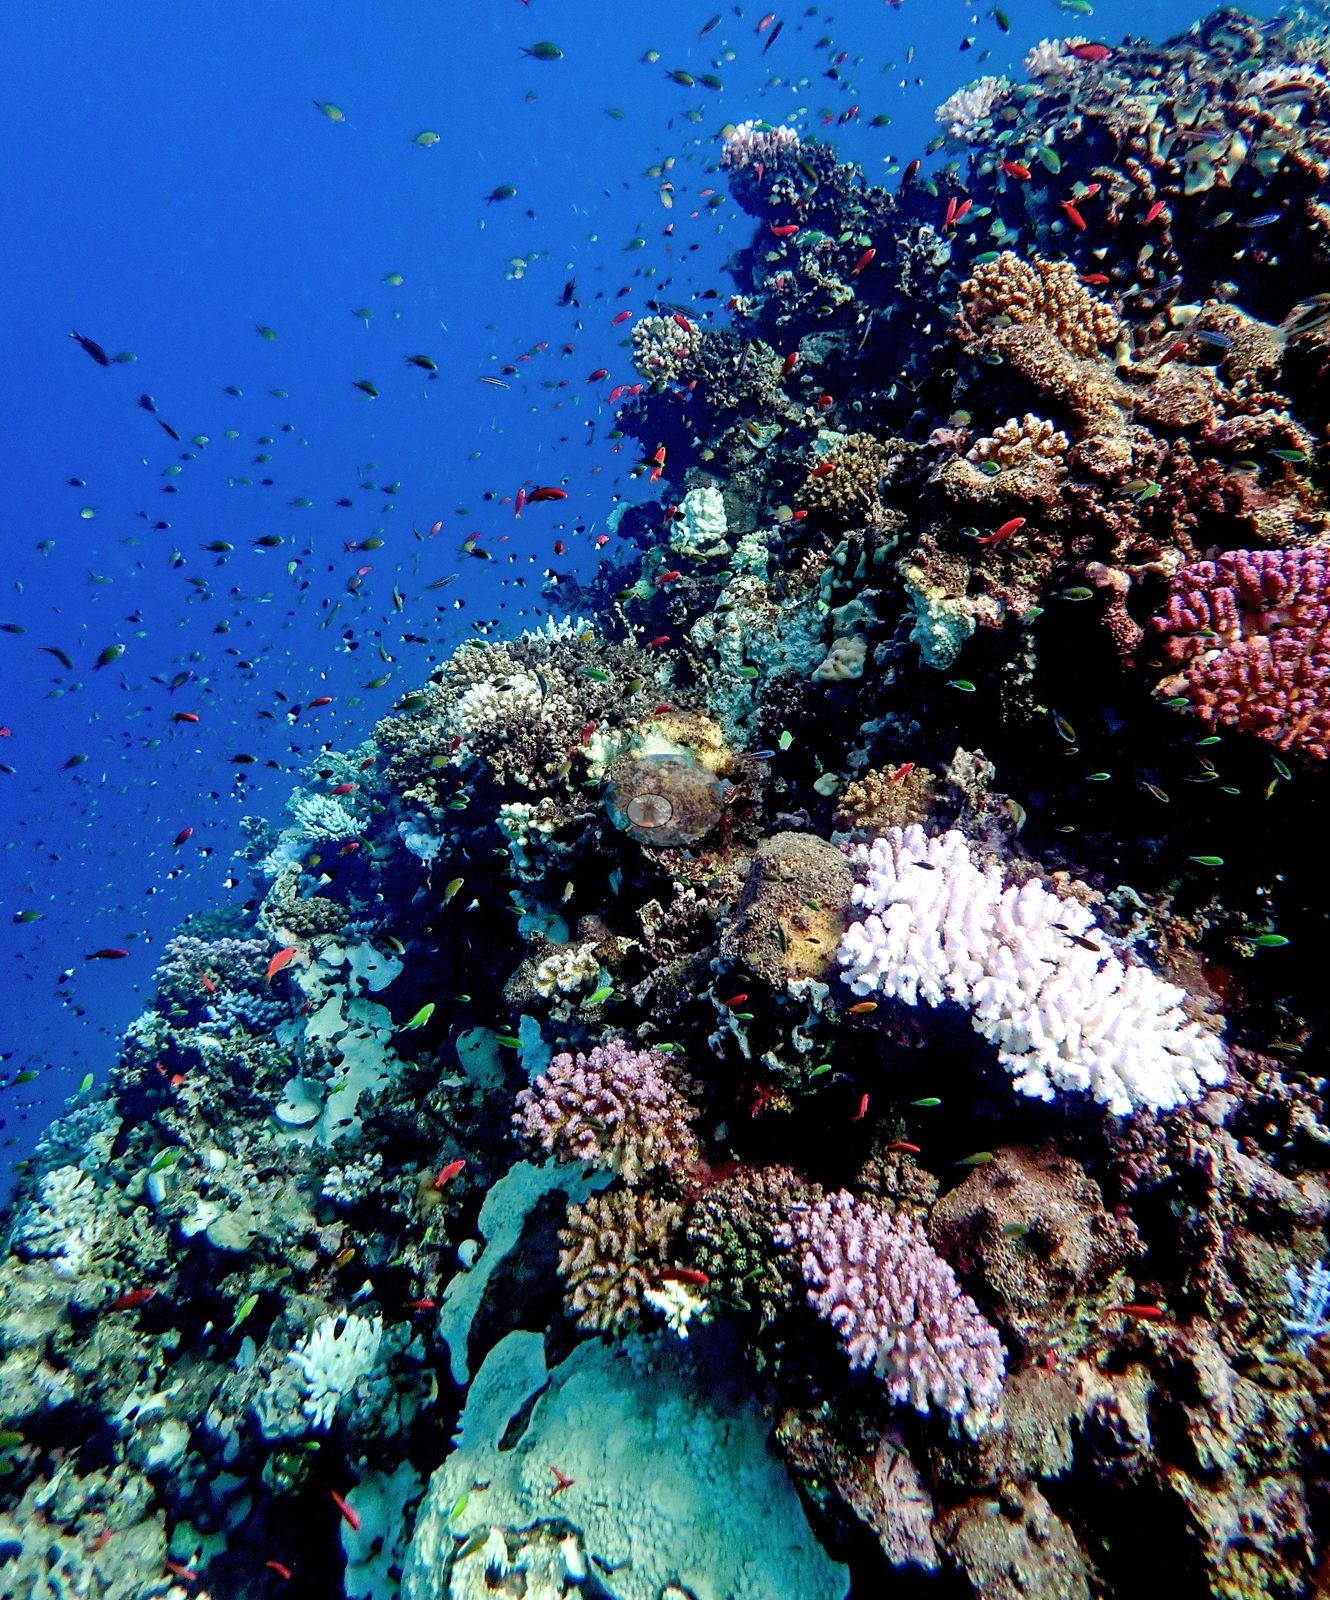
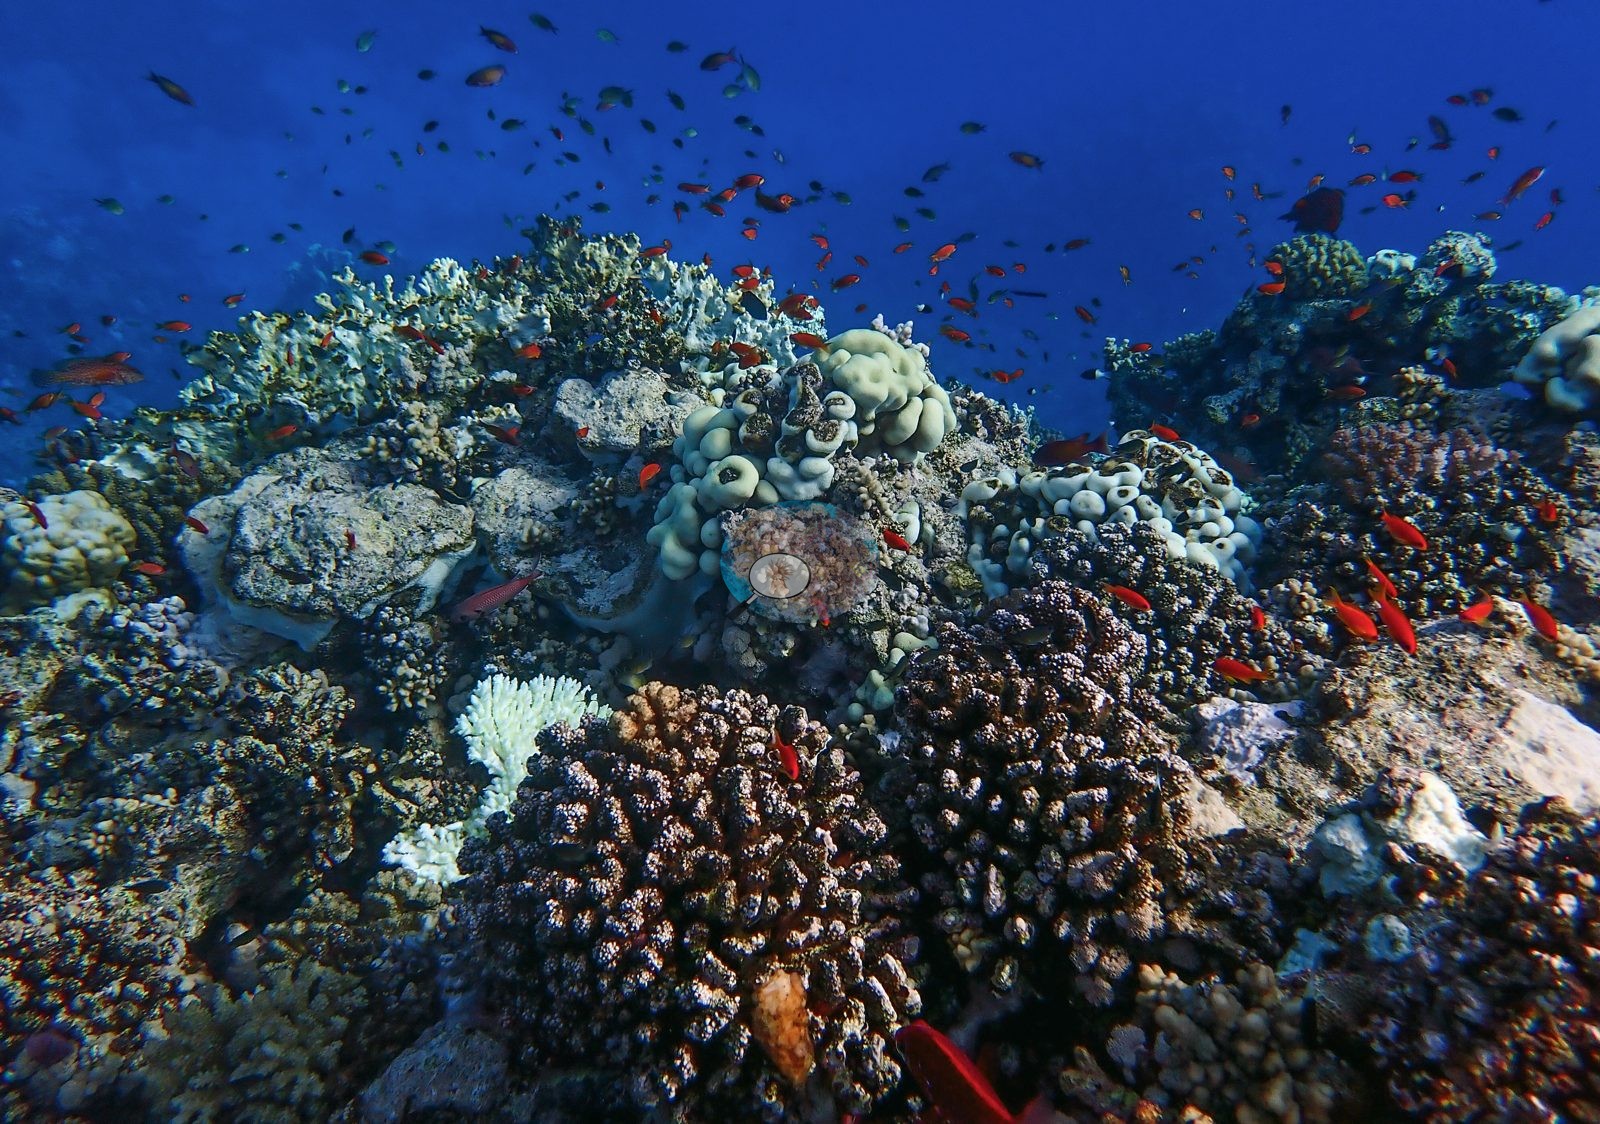
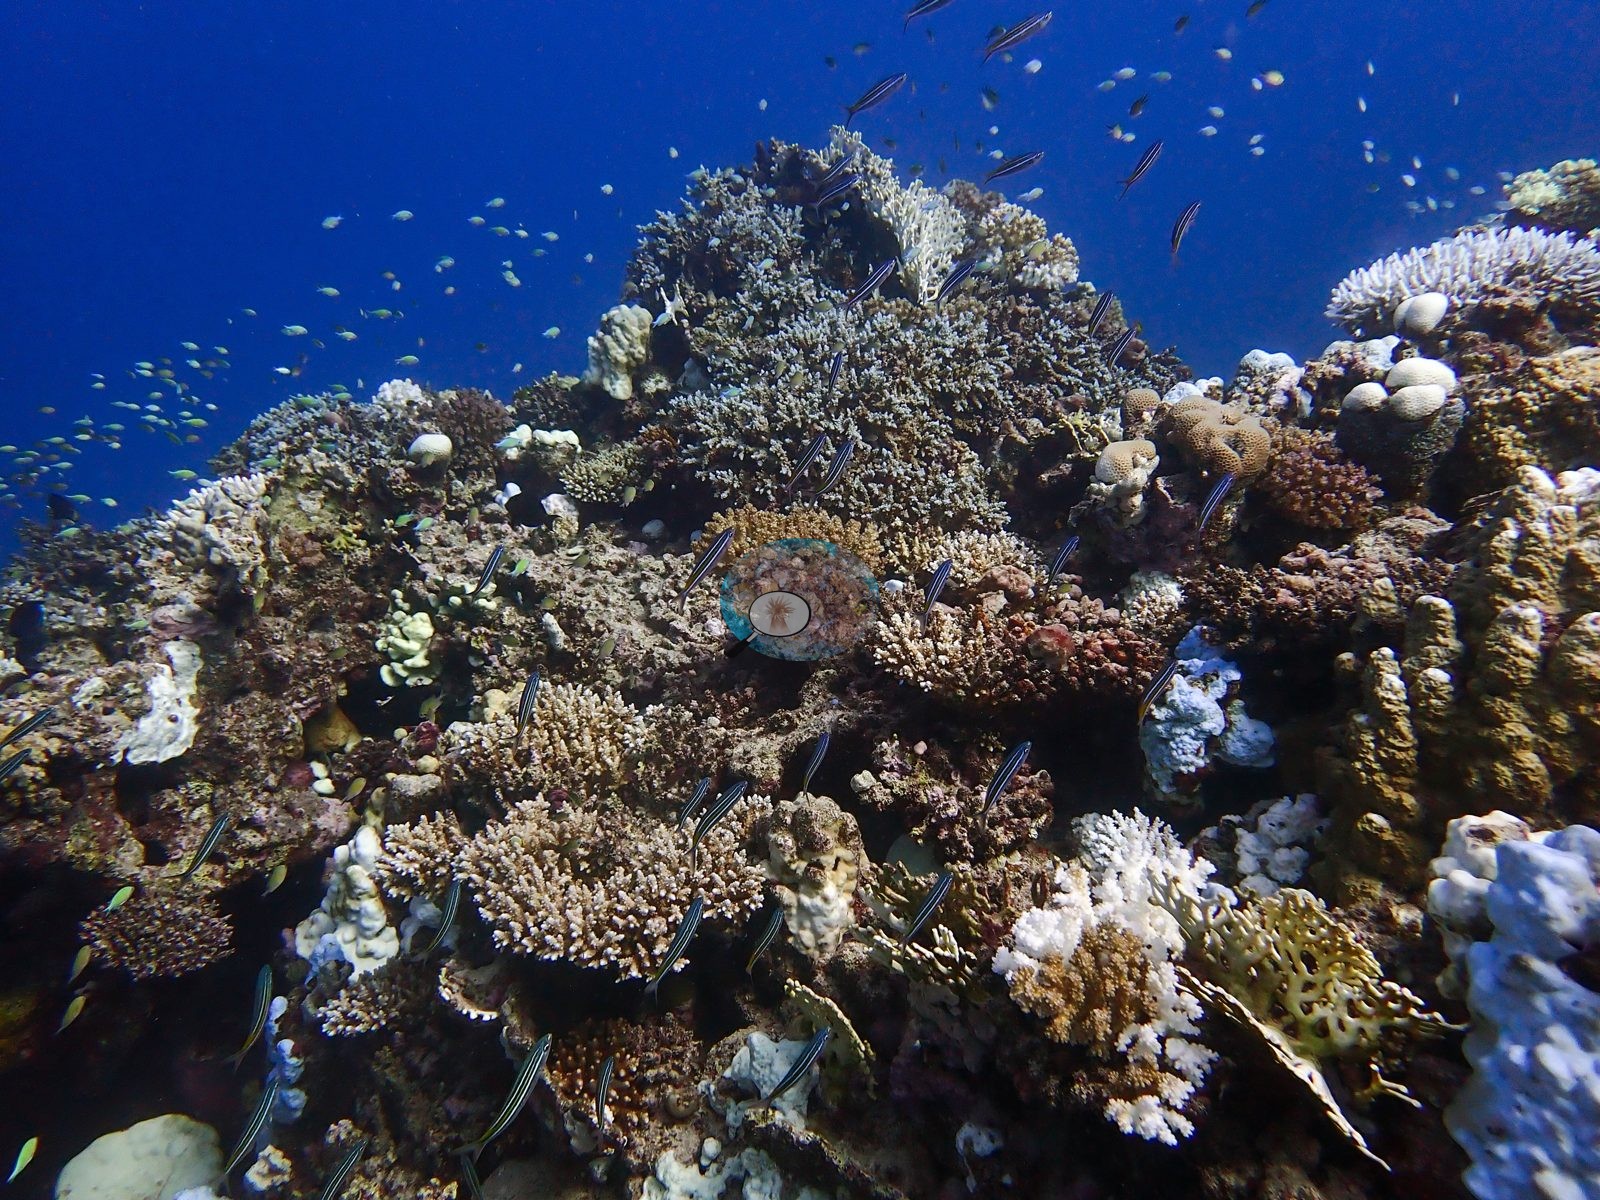
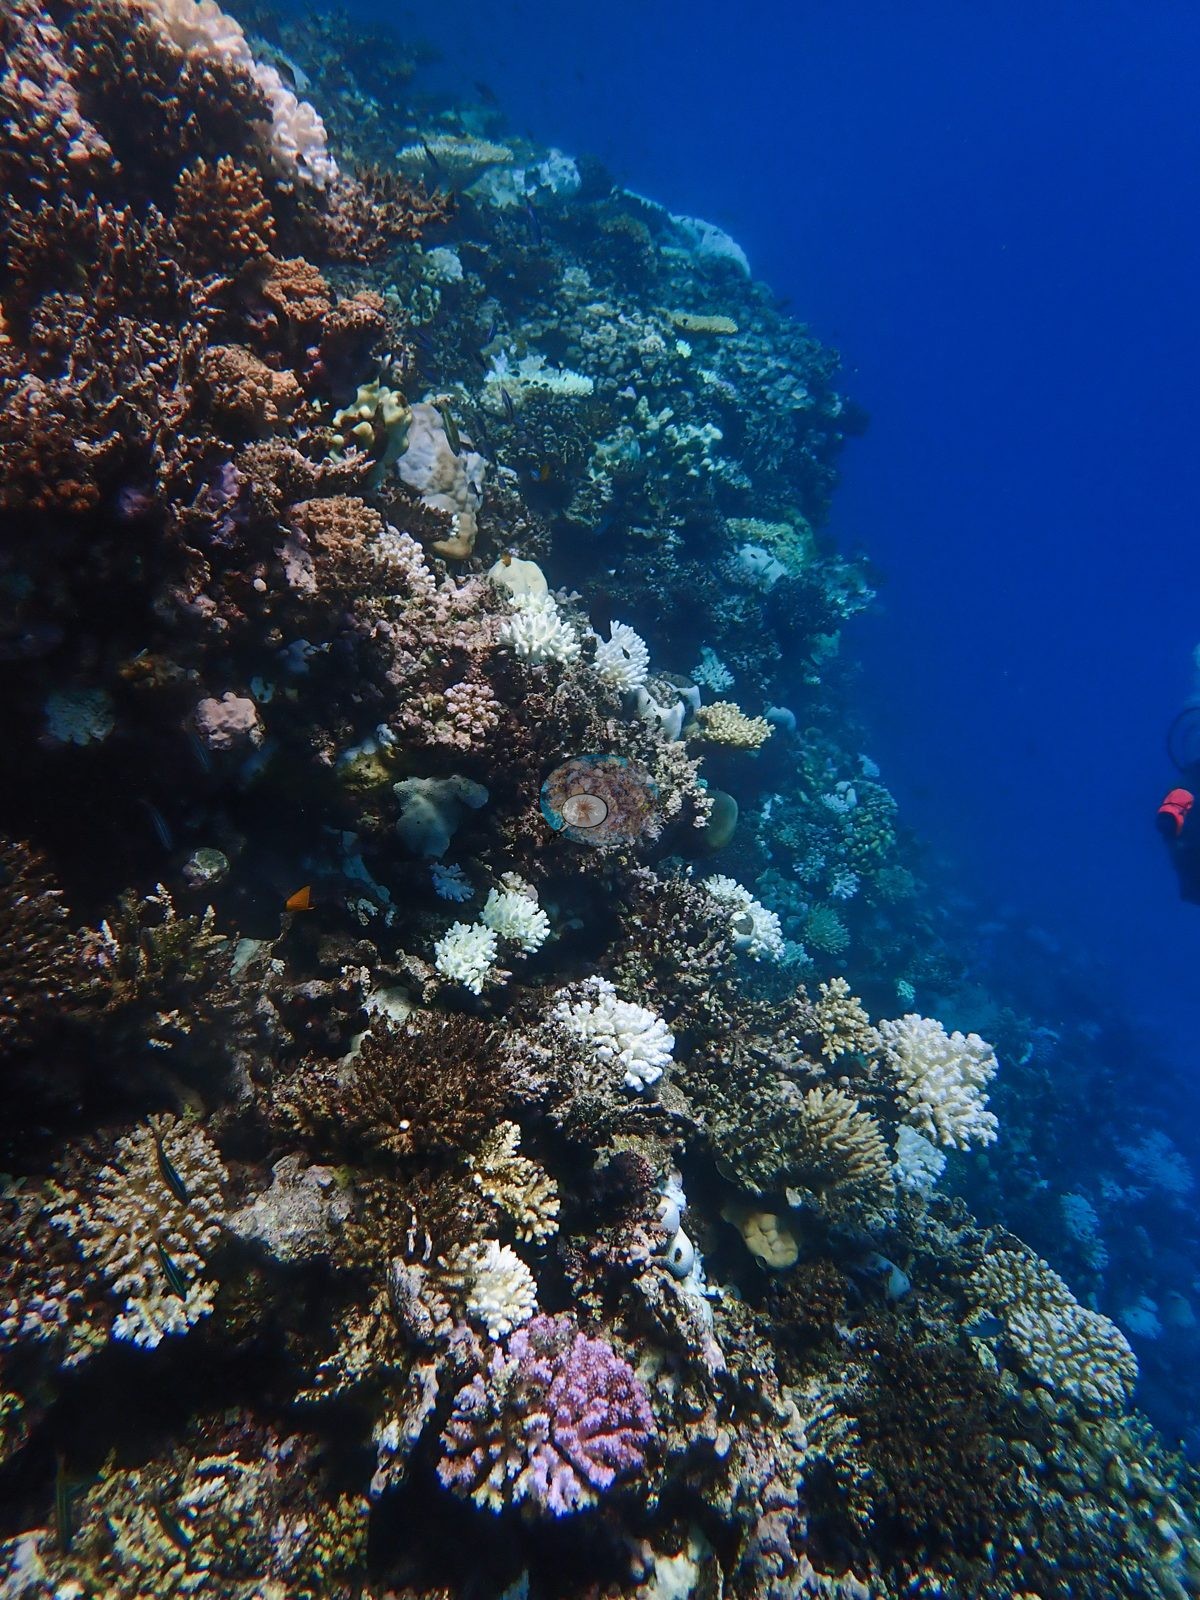
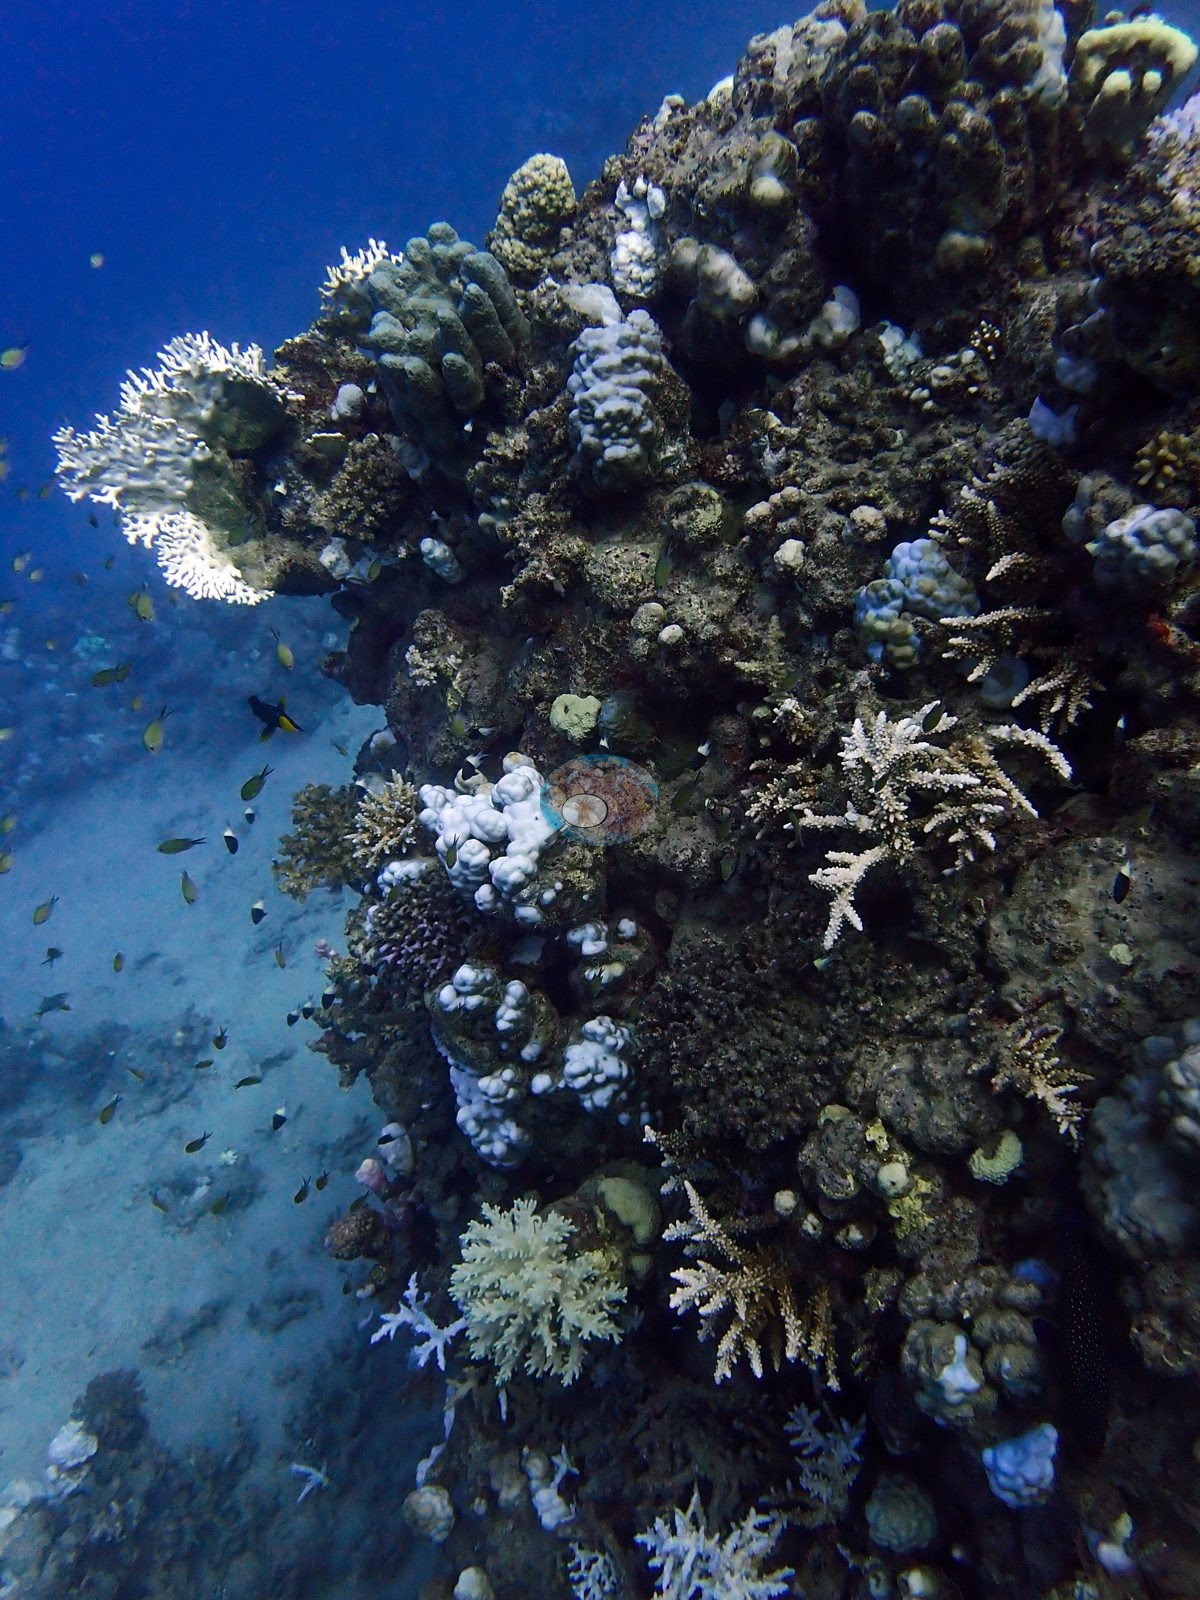
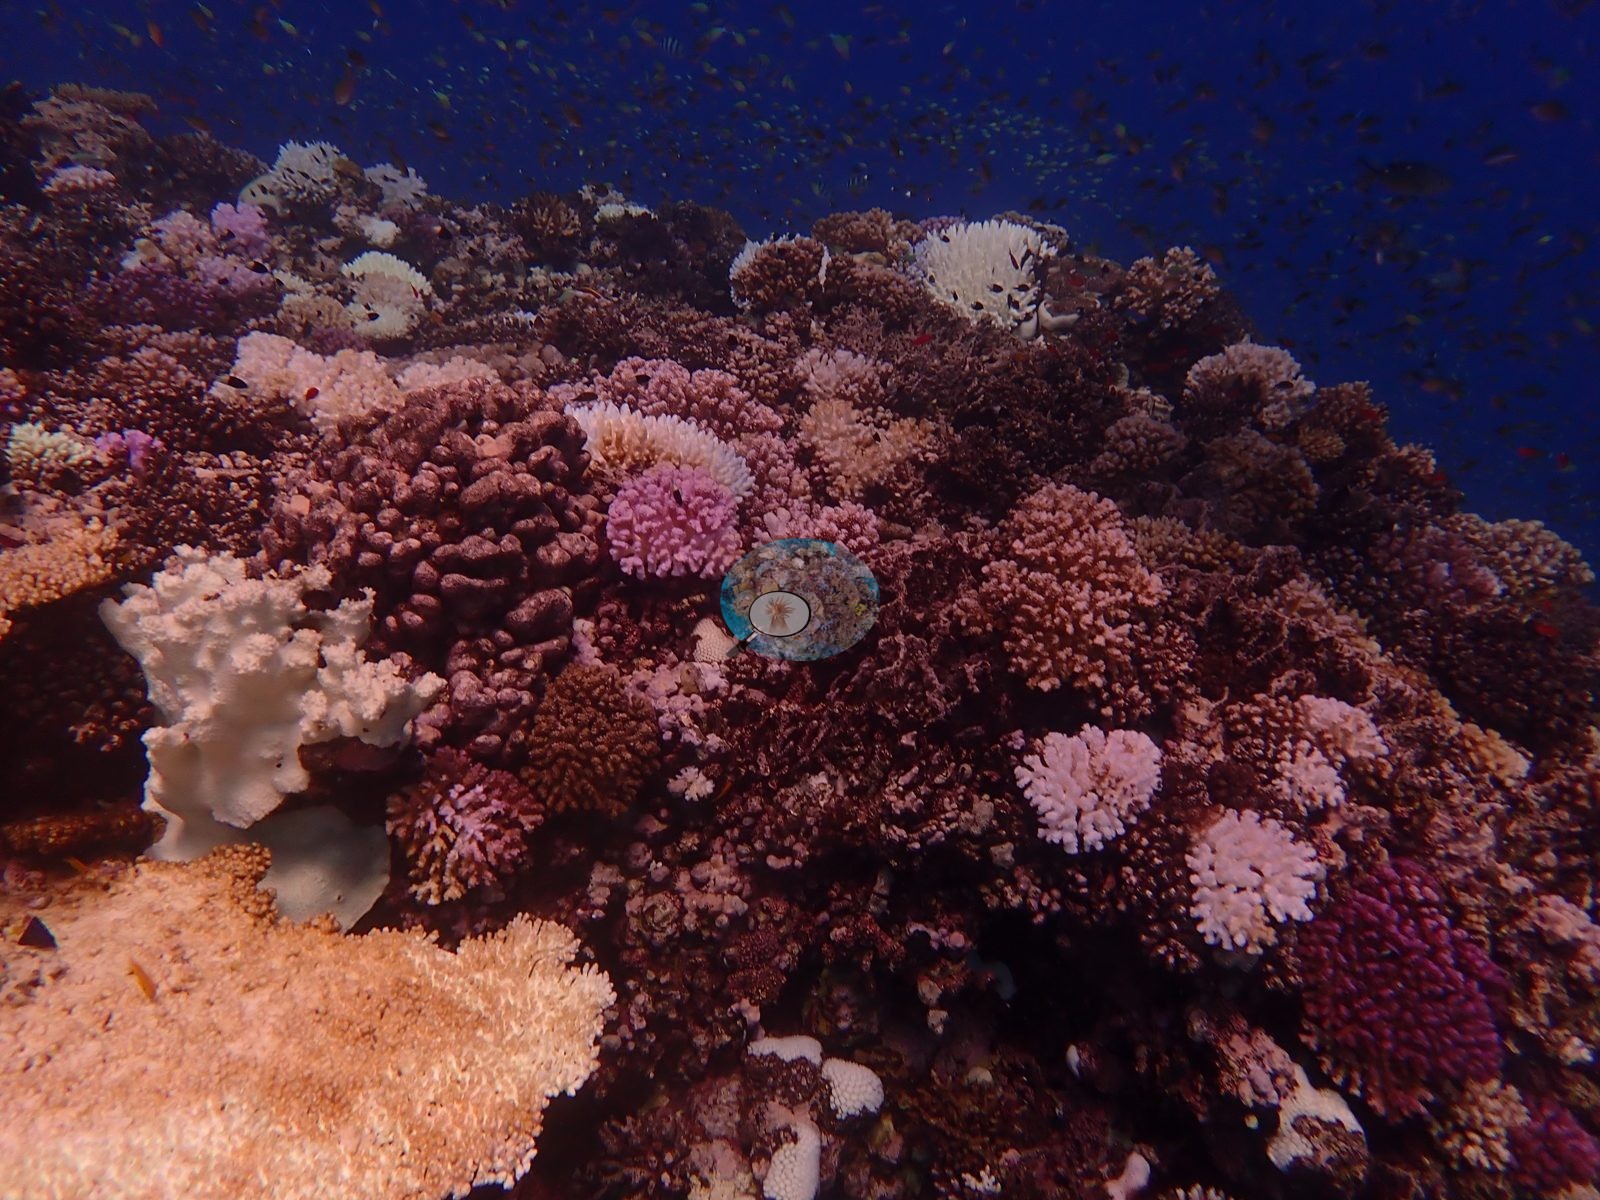
Every site was surveyed during a severe bleaching event at about 21.8-21.9 degree-heating-weeks, and Anderson's dive computer read 31°C at Marsa Nakari-North. Bleached tissue ranged from 45.5% at Habili Gazella to 73.8% at Shabrour-north, and nearly all corals showed some degree of bleaching. Branching, massive and fire corals were all affected: at Om Halhala the Porites framework was bleached en masse while nearby Acropora thickets held color, and the corals on the Abu Galawa-small wreck were almost entirely white. Captioned frames also record completed mortality at several sites, including dead Acropora, Seriatopora, Pocillopora, and fire coral. Shabrour-south, dived on consecutive days, returned nearly identical bleaching figures (62.7% and 63.7%). No crown-of-thorns starfish or disease lesions were resolved at any site. Habili Gazella carries the unit's only Coral Health Index, 2.00, below the 2.5 average. Sightings include an electric ray at Nakari House Reef-South, lionfish, a stingray and a gray shark at Shabrour-north, trevally over Habili Gazella, and dense anthias and chromis on the pinnacles.
Highlights
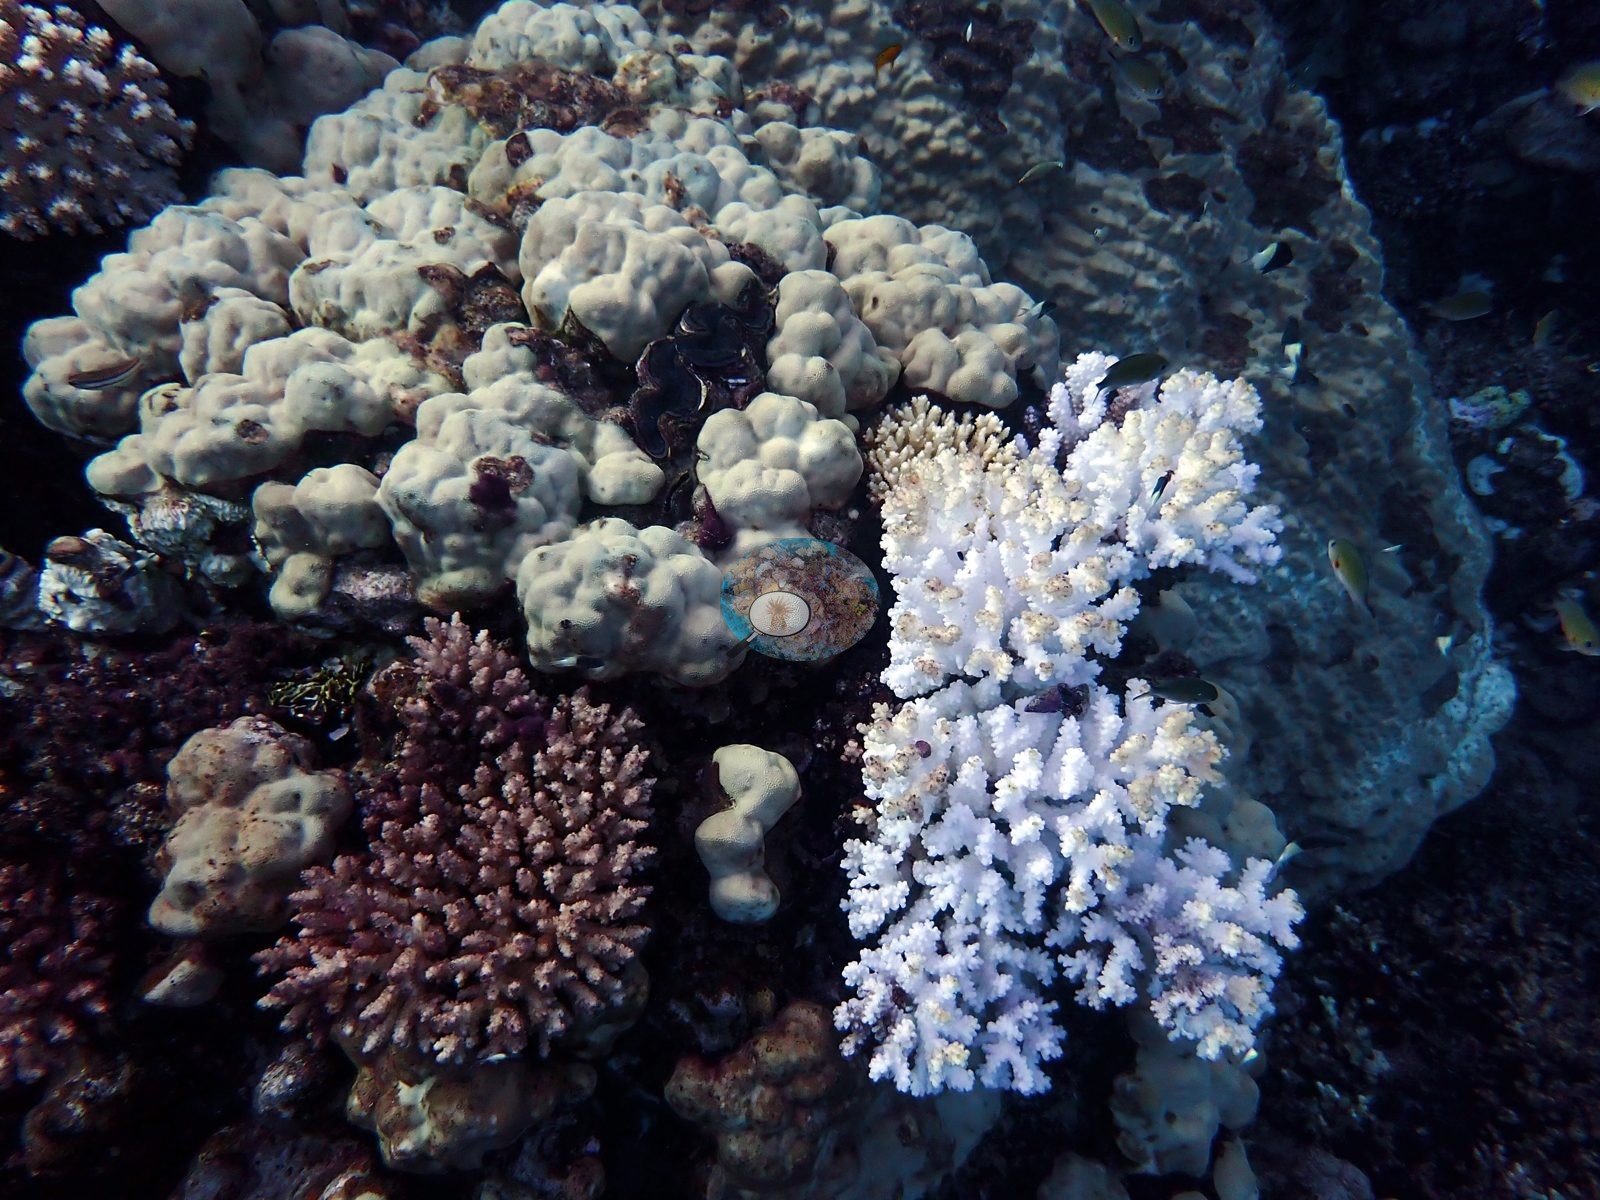
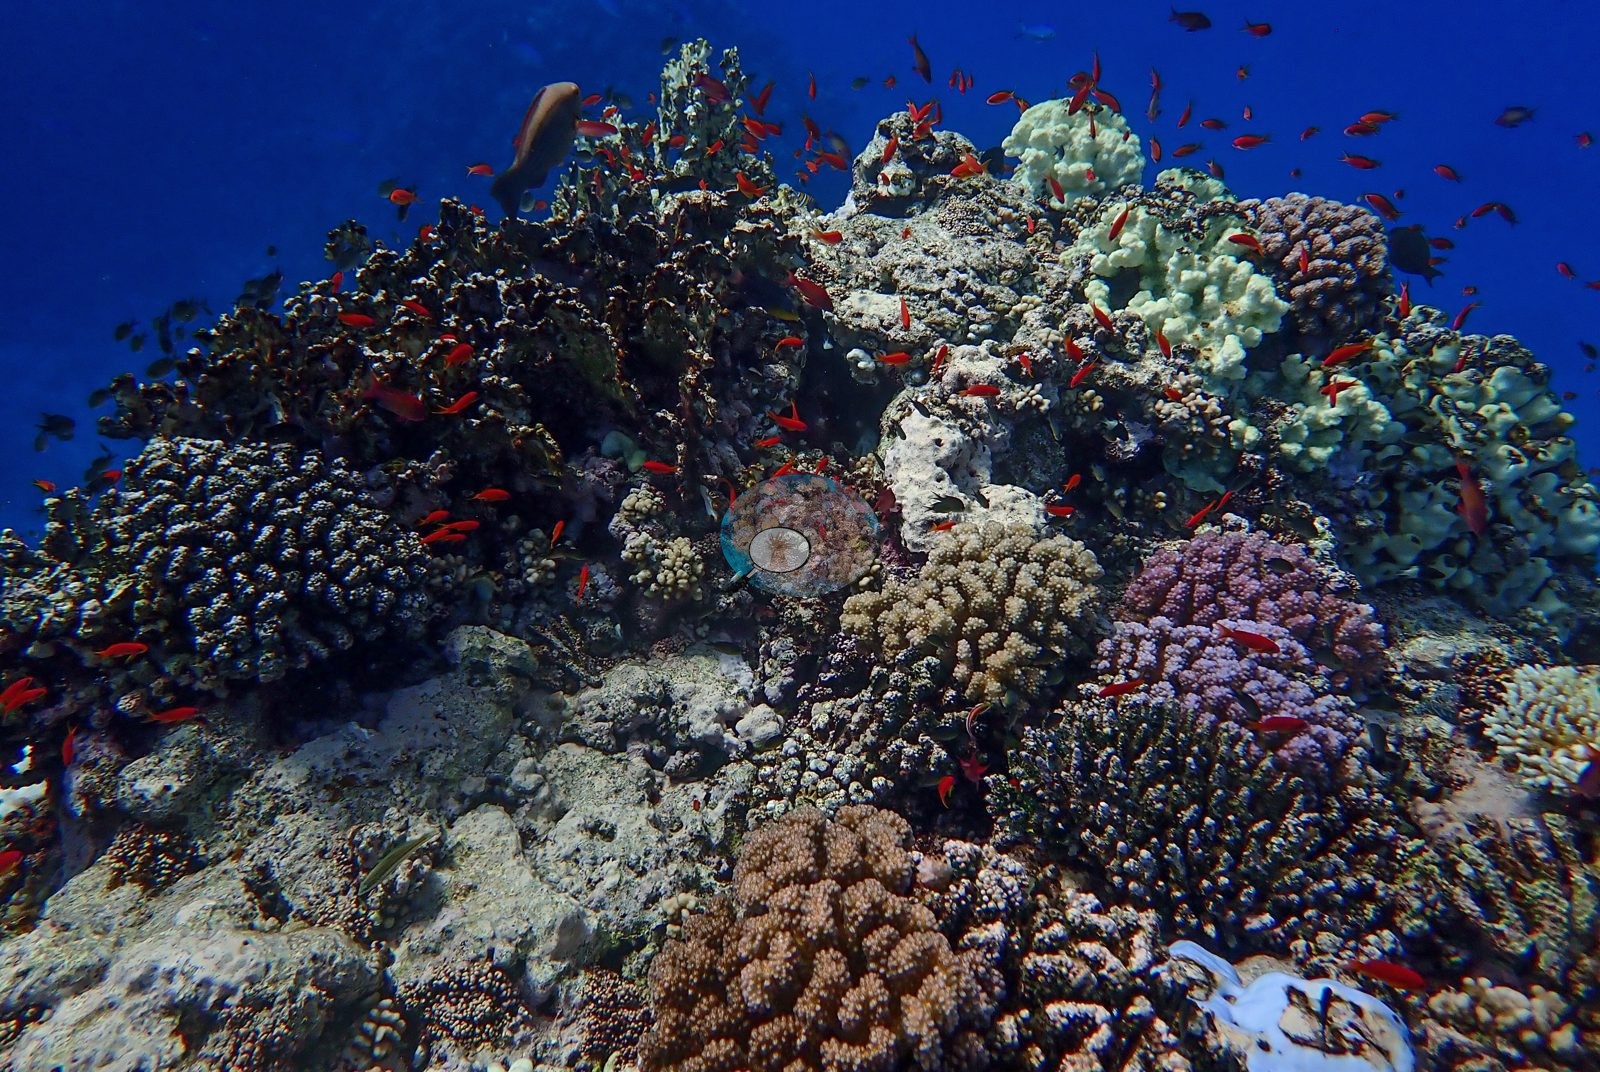
- Nakari House Reef: captioned frames run from 'survivors' through 'dying Acropora' to 'dead corals' on a single dive at Nakari House Reef-South
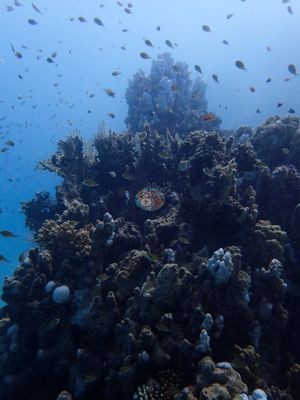 photo: Egypt Red Sea - Nakari House Reef-South (Marsa Nakari)
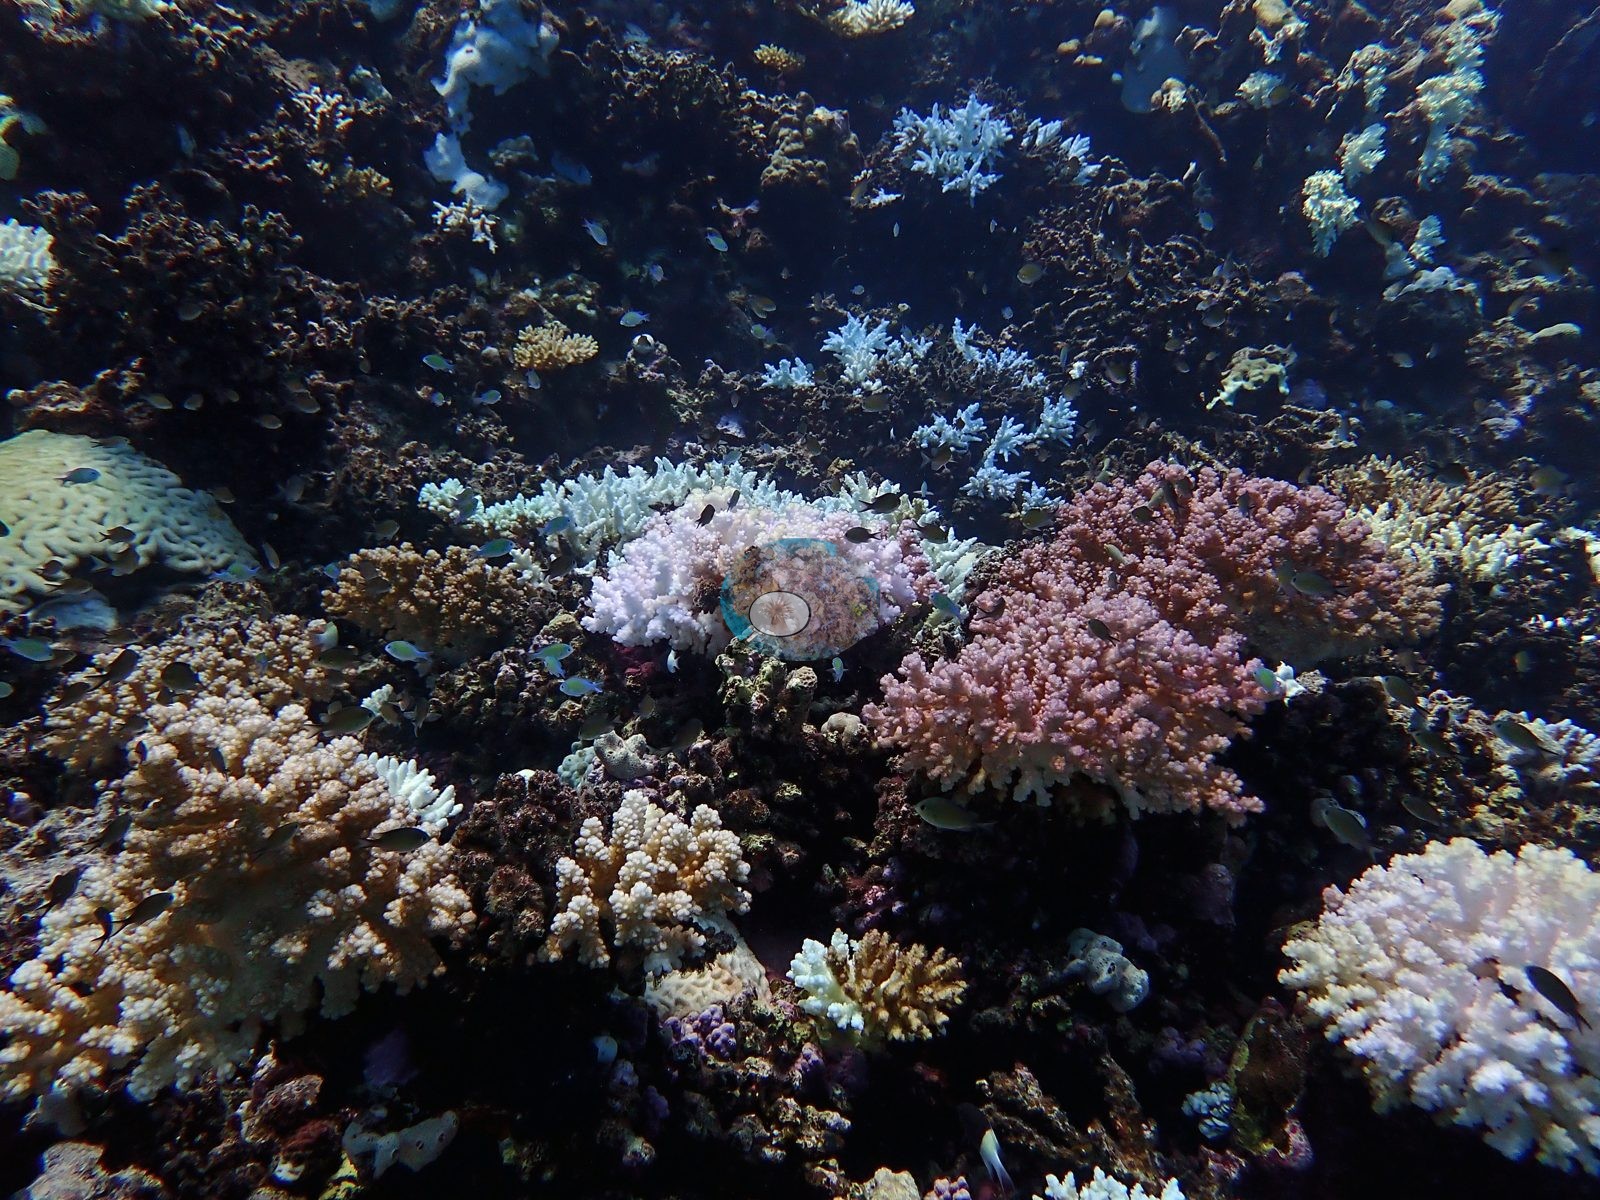
 - Gazella Reef: two touching Pocillopora colonies, one bleached cream-white and one fully pigmented, beside electric-blue Acropora
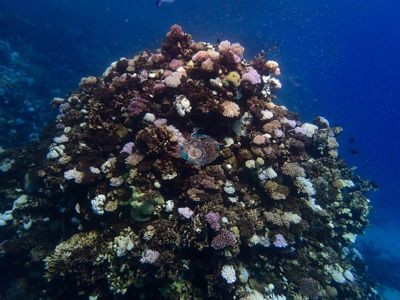 photo: Egypt Red Sea - Gazella Reef (Wadi Lahami)
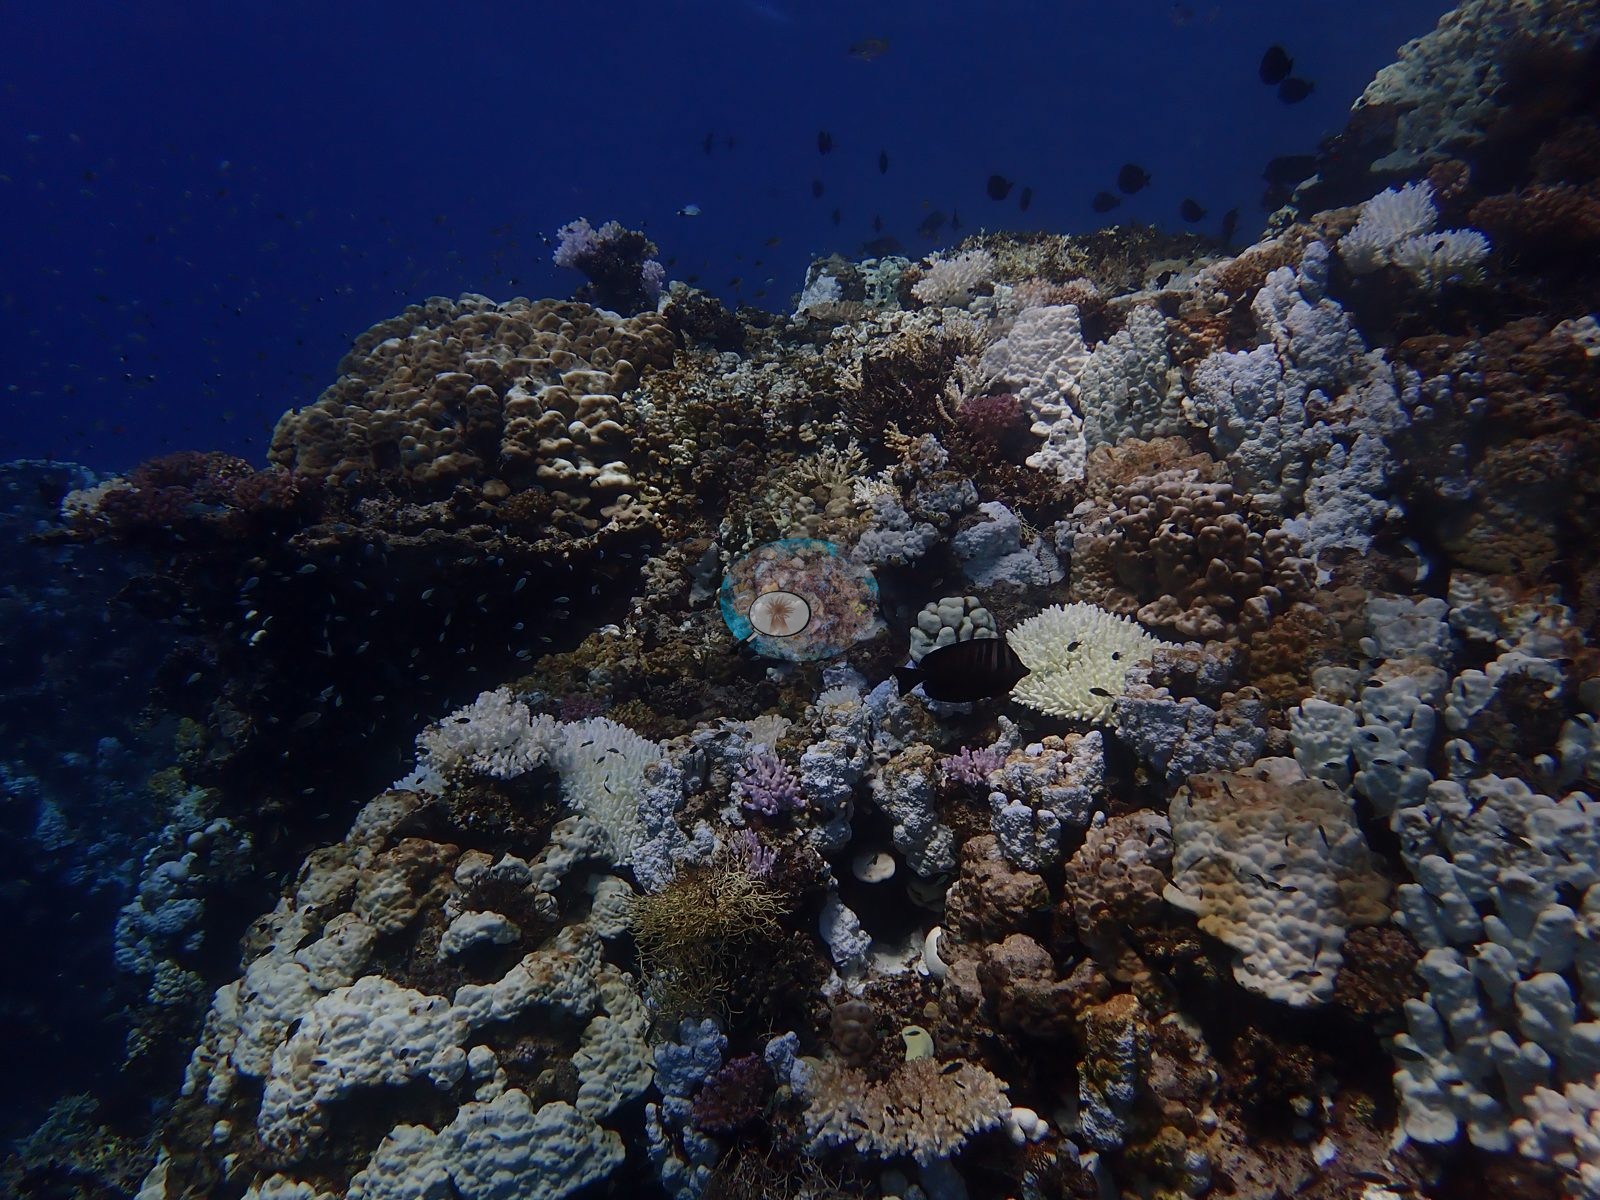
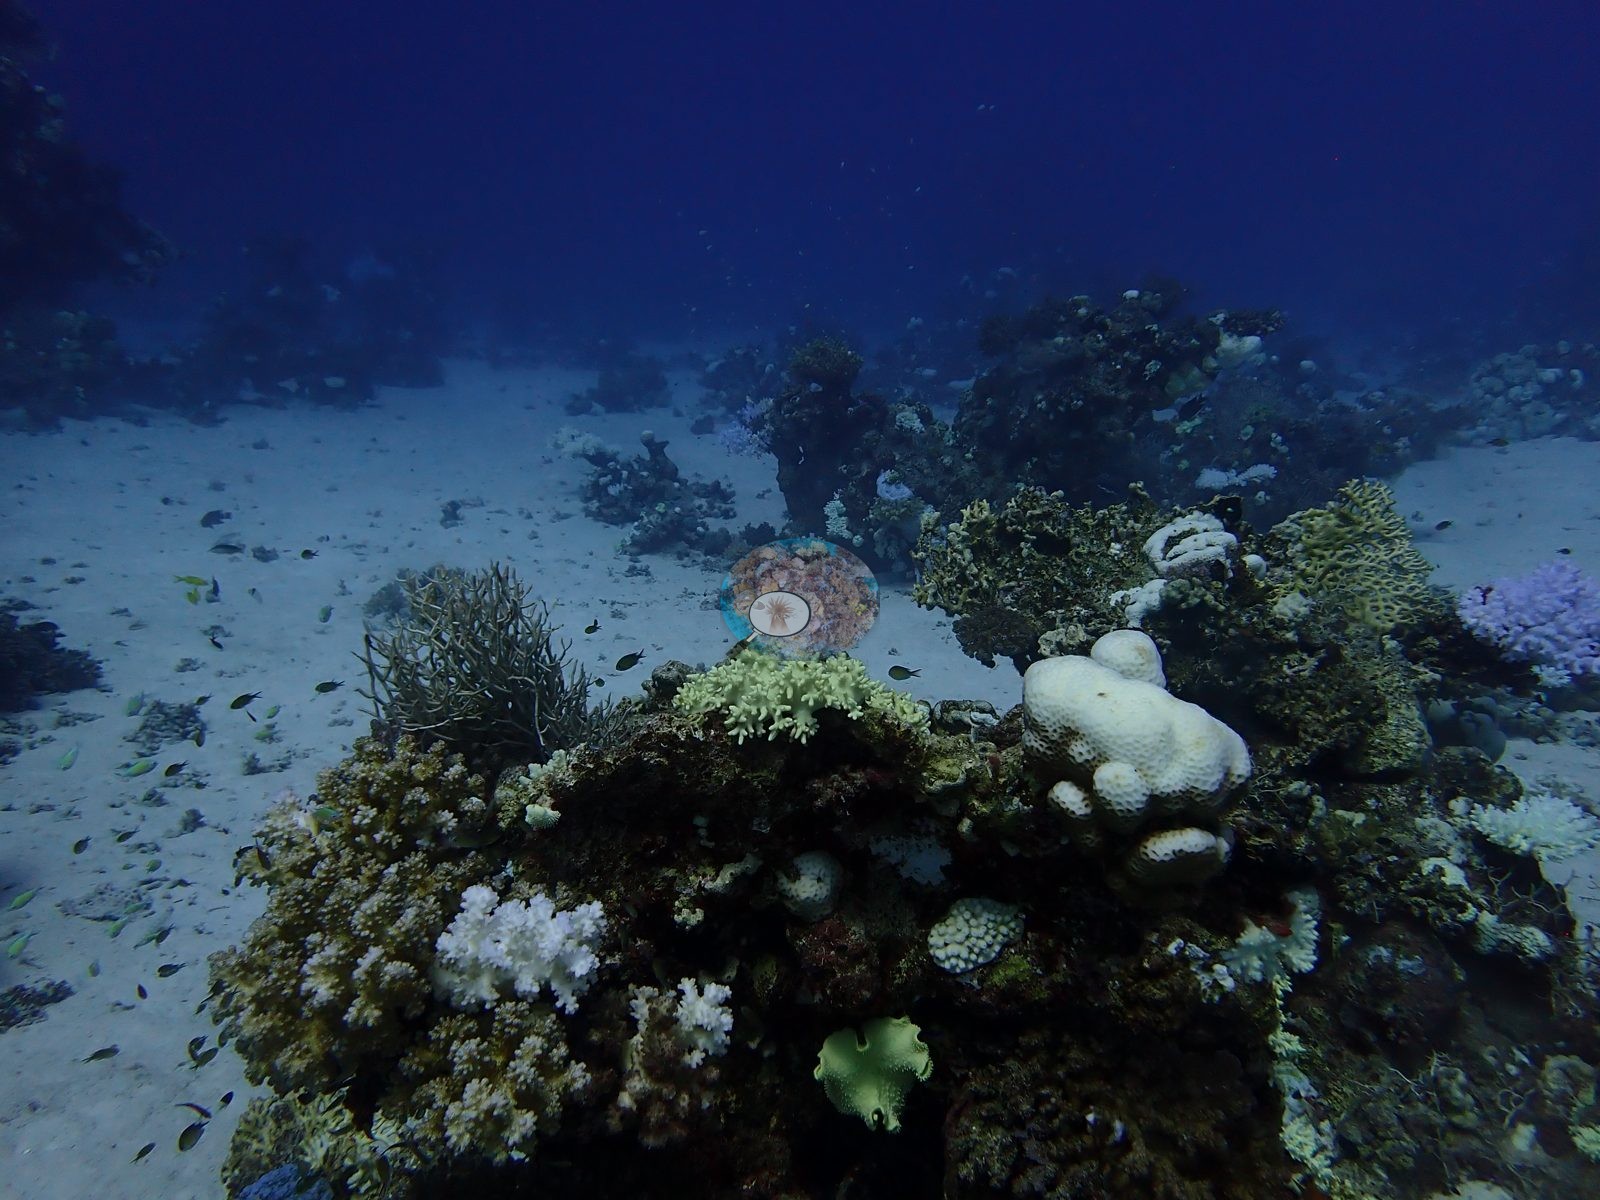
 - Bleached tissue from 45.5% (Habili Gazella) to 73.8% (Shabrour-north), all eleven sites surveyed mid-bleaching on 20-23 September 2024
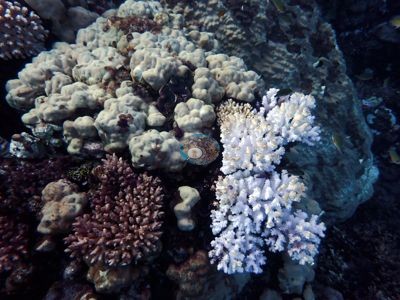 photo: Egypt Red Sea - Shabrour-north (Wadi Lahami)
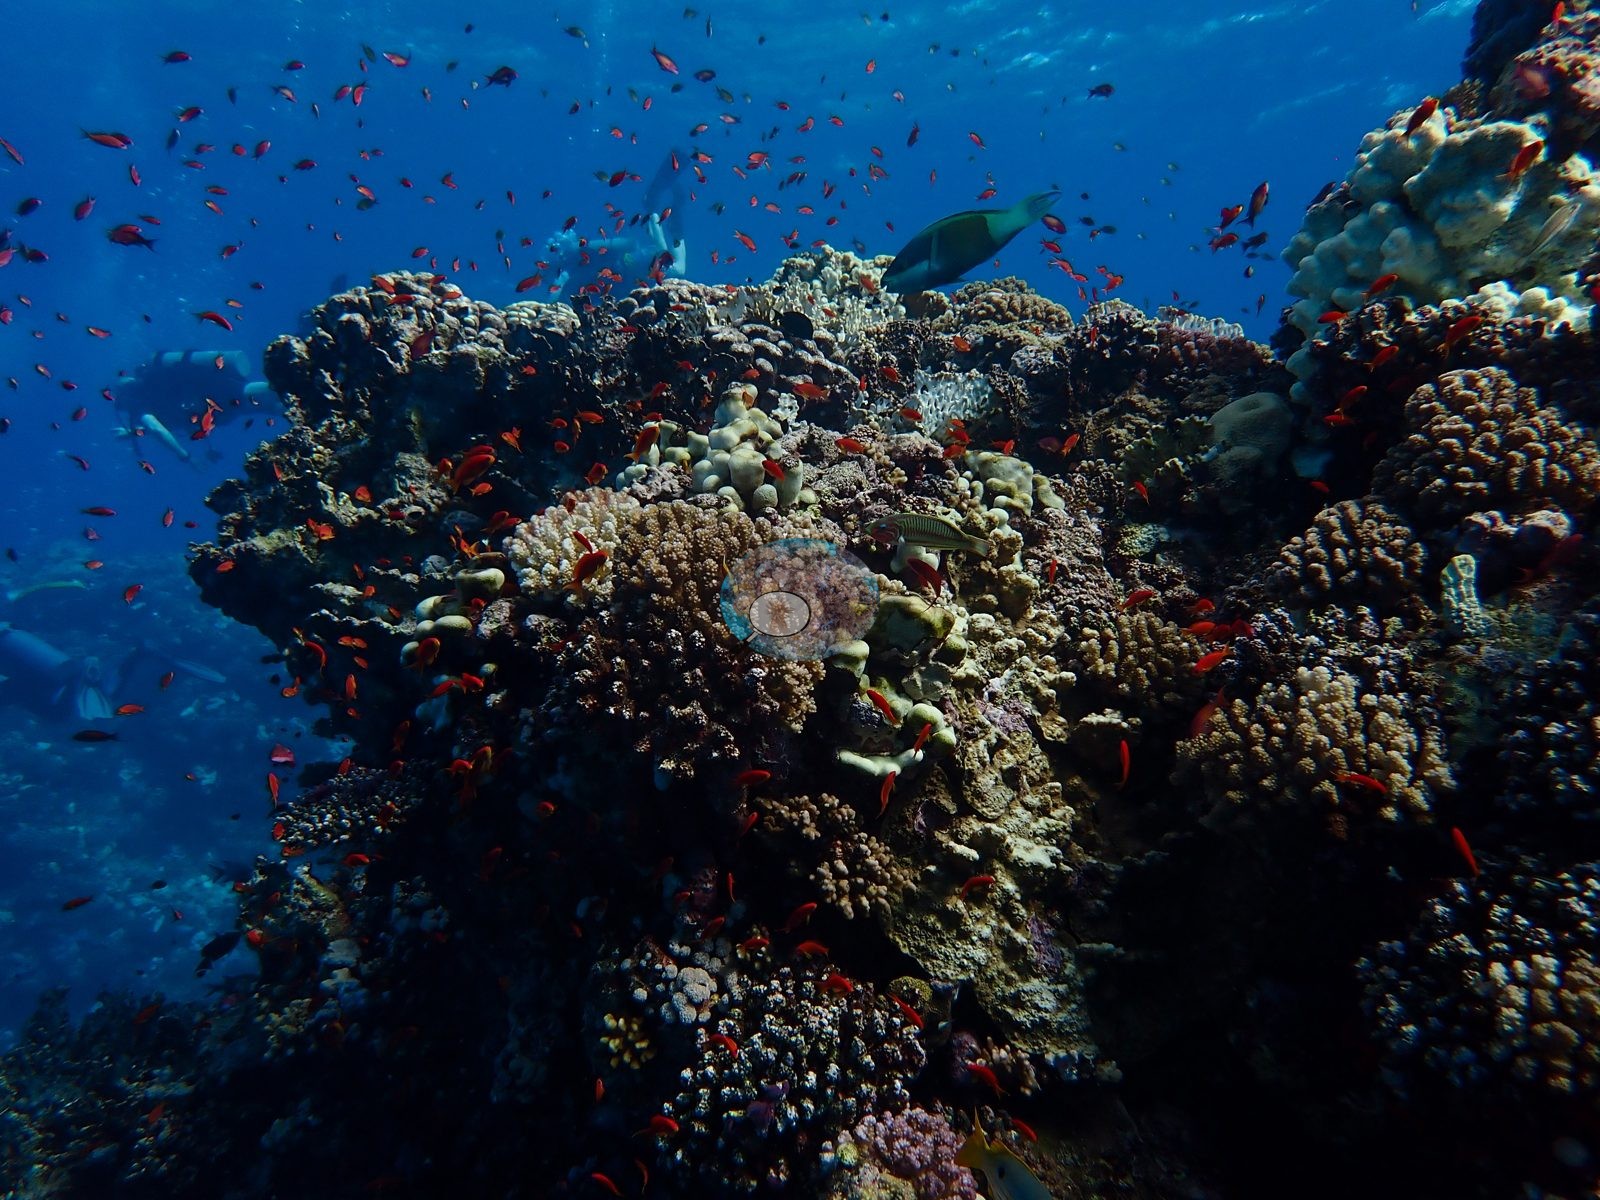
 - Published cover from 13.2% (Habili El Ghadeer) to 28.1% (Salah), with algal cover 3.4% to 7.9%
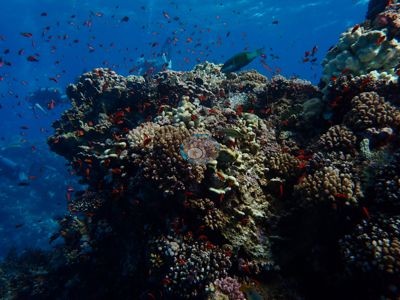 photo: Egypt Red Sea - Habili El Ghadeer (Marsa Nakari)
 - Corals on the steel shipwreck at Abu Galawa-small almost entirely bleached white against the rusted hull
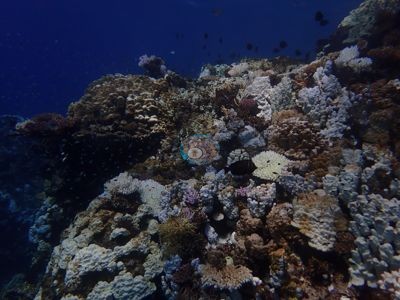 photo: Egypt Red Sea - Abu Galawa-small (Wadi Lahami)
هذه ترجمة آلية للملخص الإنجليزي؛ والنص الإنجليزي هو النسخة المعتمدة. AI translation of this summary; the English is authoritative.
Regional setting
البحر الأحمر محيط فتيّ من الناحية الجيولوجية، فهو صدع بازلتي متباعد ما زال يباعد بين أفريقيا وشبه الجزيرة العربية منذ نحو 70 مليون سنة. وقد انقطع اتصاله الضحل بالمحيط الهندي مرات عديدة، آخرها خلال عصر البليستوسين، وكثير من الشعاب الحالية ليست سوى أغطية حديثة رقيقة فوق شعاب أقدم تعود إلى البليستوسين (Spalding et al. 2001). وقد يكون البحر الأحمر، مع خليج عدن، أكثر مناطق الشعاب تنوعًا حيويًا خارج جنوب شرق آسيا، وفيه أنواع مستوطنة كثيرة. وجنوب خليجَي السويس (Gulf of Suez) والعقبة (Gulf of Aqaba)، تصطف على ضفتي شمال البحر الأحمر شعاب هدبية تمتد دون انقطاع لعشرات الكيلومترات، وعادةً ما تكون مسطحاتها الشعابية ضيقة. وبلغت تغطية المرجان الحي 60–80% على كثير من منحدرات الشعاب الشمالية، ولم تُشاهَد أي شعاب مبيضّة في هذا الجزء من البحر الأحمر عام 1998. وقد أعادت السياحة تشكيل ساحل مصر منذ الثمانينيات (1980s)؛ إذ أدّى النمو غير المخطط جيدًا للمنتجعات حول الغردقة (Hurghada) وسفاجا (Safaga) إلى تدهور أو تدمير كثير من الشعاب الهدبية القريبة من الشاطئ، وحتى عام 2001 كانت مشاريع التطوير الجديدة تمتد أبعد نحو الجنوب. وتشمل الحماية جميع شعاب مصر في خليج العقبة والشعاب الهدبية المحيطة بـ22 جزيرة في البحر الأحمر، ومنها الجزر النائية: الأخوين (Brothers)، وديدالوس (Daedalus)، والزبرجد (Zabargad)، وروكي (Rocky). ويقدّر Spalding et al. (2001) مساحة الشعاب المرجانية في مصر بنحو 3,800 km²؛ في حين يعطي Souter et al. (2021) رقم 13,605 km² لمنطقة البحر الأحمر وخليج عدن، منها 7,800 km² في شمال ووسط البحر الأحمر.
وفي معرض تلخيصه لتقرير الحالة لعام 2004، وصف Wilkinson (2006) شعاب البحر الأحمر بأنها لا تزال في حالة صحية جيدة إلى حد ما، مع قليل من الجريان السطحي أو ضغط الصيد باستثناء صيد أسماك القرش، ومع انعكاس معظم أضرار ابيضاض عام 1998؛ وكانت الملاحة البحرية، ونمو السياحة غير المنضبط، والابيضاض، ونجم البحر ذو التاج الشوكي هي التهديدات المقبلة. ويذكر Souter et al. (2021) السياحة والتطوير الساحلي بوصفهما السببين المحليين الرئيسيين لفقدان المرجان في شمال البحر الأحمر. وفي تحليلهم، انخفضت التغطية المرجانية في شمال ووسط البحر الأحمر من 35.2% (1997) إلى 29.7% (2002)، ثم ارتفعت ببطء إلى 39.1% بحلول عام 2019، بينما ارتفعت التغطية الطحلبية من 5.2% عام 2010 إلى 11.5%. ووحدات أخذ العينات الوحيدة في المنطقة التي تتوفر لها بيانات لأكثر من 15 عامًا تقع على الساحل المصري، حيث أدّت الاضطرابات الأكثر تواترًا إلى تراجع تدريجي على مراحل: فنصف الوحدات التي فقدت خُمس مرجانها على الأقل لم تستعد 90% منه.
Overview
تغطي وحدة مصر إحدى عشرة غطسة في البحر الأحمر في منطقتين جرى مسحهما في 20-23 سبتمبر 2024: مرسى نكاري (Marsa Nakari)، وتضم Nakari House Reef-South وMarsa Nakari-North وHabili El Ghadeer وOm Halhala؛ ووادي لحمي (Wadi Lahami)، ويضم Shabrour-north وShabrour-south وGazella Reef وSalah وAbu Galawa-small وHabili Daisy وHabili Gazella. وتتراوح البيئات بين منحدرات منخفضة التضاريس لشعاب الشاطئ من رصيف تكسوه الطحالب المرجانية الكلسية والركام والرمل في مرسى نكاري، والقمم المغمورة (Habili El Ghadeer وHabili Daisy وHabili Gazella)، وسهل رملي مرصّع بالكتل المرجانية المنعزلة في Shabrour-north، وحافة مرجانية ذات فجوات تشبه الوديان في Gazella Reef، ومنحدرات كثيفة من Porites وAcropora في Om Halhala وSalah، وحطام سفينة فولاذية استعمرها المرجان بكثافة في Abu Galawa-small.
تراوحت التغطية المنشورة المستندة إلى عدّ النقاط في الصور بين 13.2% على الهضبة المتآكلة حيويًا والمكسوّة بقشور الطحالب المرجانية الكلسية في Habili El Ghadeer و28.1% في Salah، وكانت التغطية الطحلبية منخفضة في كل مكان (3.4-7.9%). وتجمع المجتمعات المرجانية بين Porites الكتلية، وAcropora العنقودية وقرن الأيل، والبوسيلوبوريدات (pocilloporids)، وSeriatopora hystrix، والفافيدات (faviids)، والمرجان الناري من نوع Millepora، مع Acropora بلون أزرق كهربائي في Gazella Reef وShabrour-south. وفي مرسى نكاري، سجّلت محطات Reef Check الواقعة على بعد 0.1-0.25 km من علامتَي شعاب الشاطئ نسبتي 37.2% و39.4% عام 2024، وذلك بطريقة مختلفة وعلى ما قد يكون الشعاب نفسها.
جرى مسح كل موقع خلال حدث ابيضاض شديد عند نحو 21.8-21.9 من أسابيع درجات التسخين، وسجّل حاسوب الغوص لدى Anderson 31°C في Marsa Nakari-North. وتراوح النسيج المبيضّ بين 45.5% في Habili Gazella و73.8% في Shabrour-north، وأظهرت المرجانيات كلها تقريبًا درجة ما من الابيضاض. وتأثرت المرجانيات المتفرعة والكتلية والنارية جميعها: ففي Om Halhala ابيضّ هيكل Porites بشكل جماعي بينما احتفظت أجمات Acropora القريبة بلونها، وكانت المرجانيات على حطام Abu Galawa-small بيضاء بالكامل تقريبًا. كما توثّق الصور المشروحة نفوقًا مكتملًا في عدة مواقع، بما في ذلك Acropora وSeriatopora وPocillopora ومرجان ناري ميت. وأعطت Shabrour-south، التي جرى الغوص فيها في يومين متتاليين، أرقام ابيضاض متطابقة تقريبًا (62.7% و63.7%). ولم يُتبيَّن أي نجم بحر ذي تاج شوكي أو آفات مرضية في أي موقع. ومن المشاهدات سمكة رعّاد في Nakari House Reef-South، وأسماك الأسد، وسمكة لخمة لاسعة، وقرش رمادي في Shabrour-north، وأسماك الجش فوق Habili Gazella، وأعداد كثيفة من أسماك الأنثياس والكروميس على القمم.
Highlights
- جرى مسح المواقع الإحدى عشرة جميعها في خضم الابيضاض، 20-23 سبتمبر 2024، عند نحو 21.9 من أسابيع درجات التسخين
- النسيج المبيضّ من 45.5% (Habili Gazella) إلى 73.8% (Shabrour-north)
 photo: Egypt Red Sea - Shabrour-north (Wadi Lahami)
 - التغطية المنشورة من 13.2% (Habili El Ghadeer) إلى 28.1% (Salah)، مع تغطية طحلبية دون 8% في كل مكان
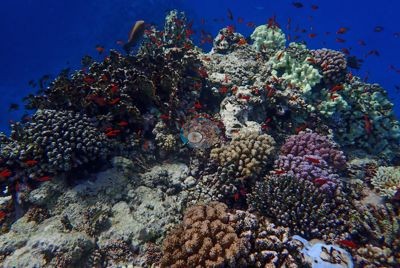 photo: Egypt Red Sea - Habili El Ghadeer (Marsa Nakari)
 - حطام سفينة فولاذية استعمرها المرجان في Abu Galawa-small
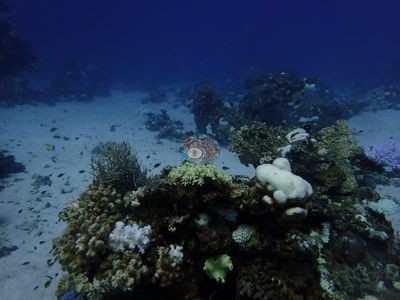 photo: Egypt Red Sea - Abu Galawa-small (Wadi Lahami)
 - أجمات Acropora زرقاء كهربائية في Gazella Reef وShabrour-south
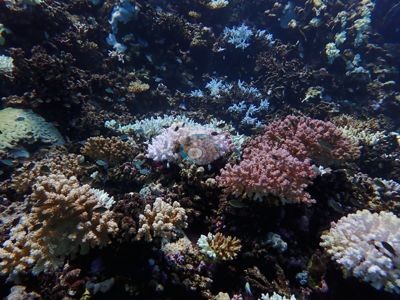 photo: Egypt Red Sea - Gazella Reef (Wadi Lahami)
Notable observations (11)
- Egypt Red Sea - Shabrour-north (Wadi Lahami): 73.8% of coral tissue bleached, the highest site-level figure in the Red Sea set (Egypt and Saudi Arabia pins); frame captioned "dead acroporid"; one corymbose Acropora has stark white outer branches around a pigmented interior
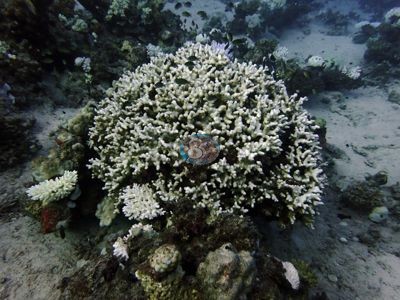
- Egypt Red Sea - Shabrour-south (Wadi Lahami): 62.7% (22 Sep) and 63.7% (23 Sep 2024) of coral tissue bleached; "bleached bubble coral", "bleaching Porites" and "dead Acropora" captions
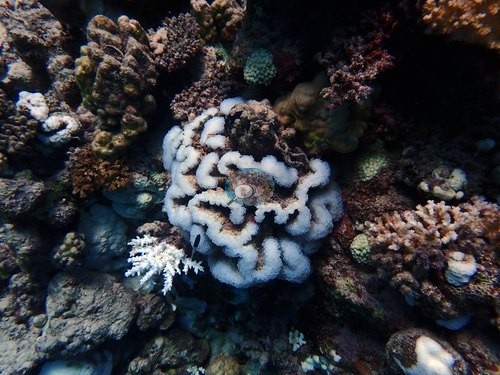
- Egypt Red Sea - Salah (Wadi Lahami): 62.9% of coral tissue bleached; staghorn Acropora, massive and Millepora-type fire coral bleached together in single frames
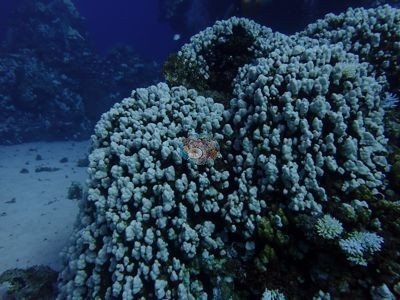
- Egypt Red Sea - Om Halhala (Marsa Nakari): 61.2% of coral tissue bleached; Porites framework bleached chalk-white at field scale
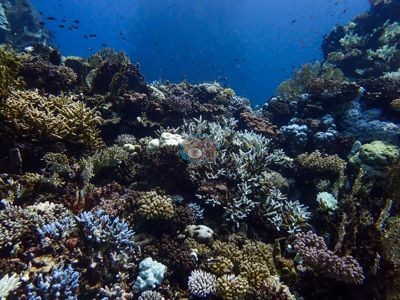
- Egypt Red Sea - Abu Galawa-small (Wadi Lahami): 61.3% of coral tissue bleached; Acropora on the wreck almost entirely bleached white
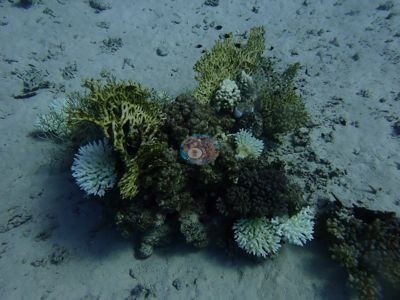
- Egypt Red Sea - Habili Daisy (Wadi Lahami): 61.3% of coral tissue bleached; framework extensively bleached
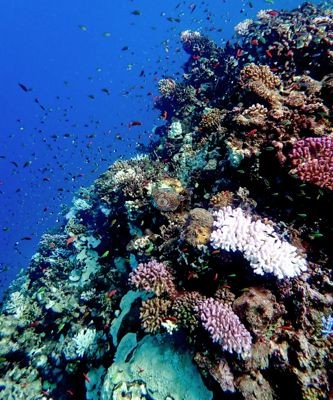
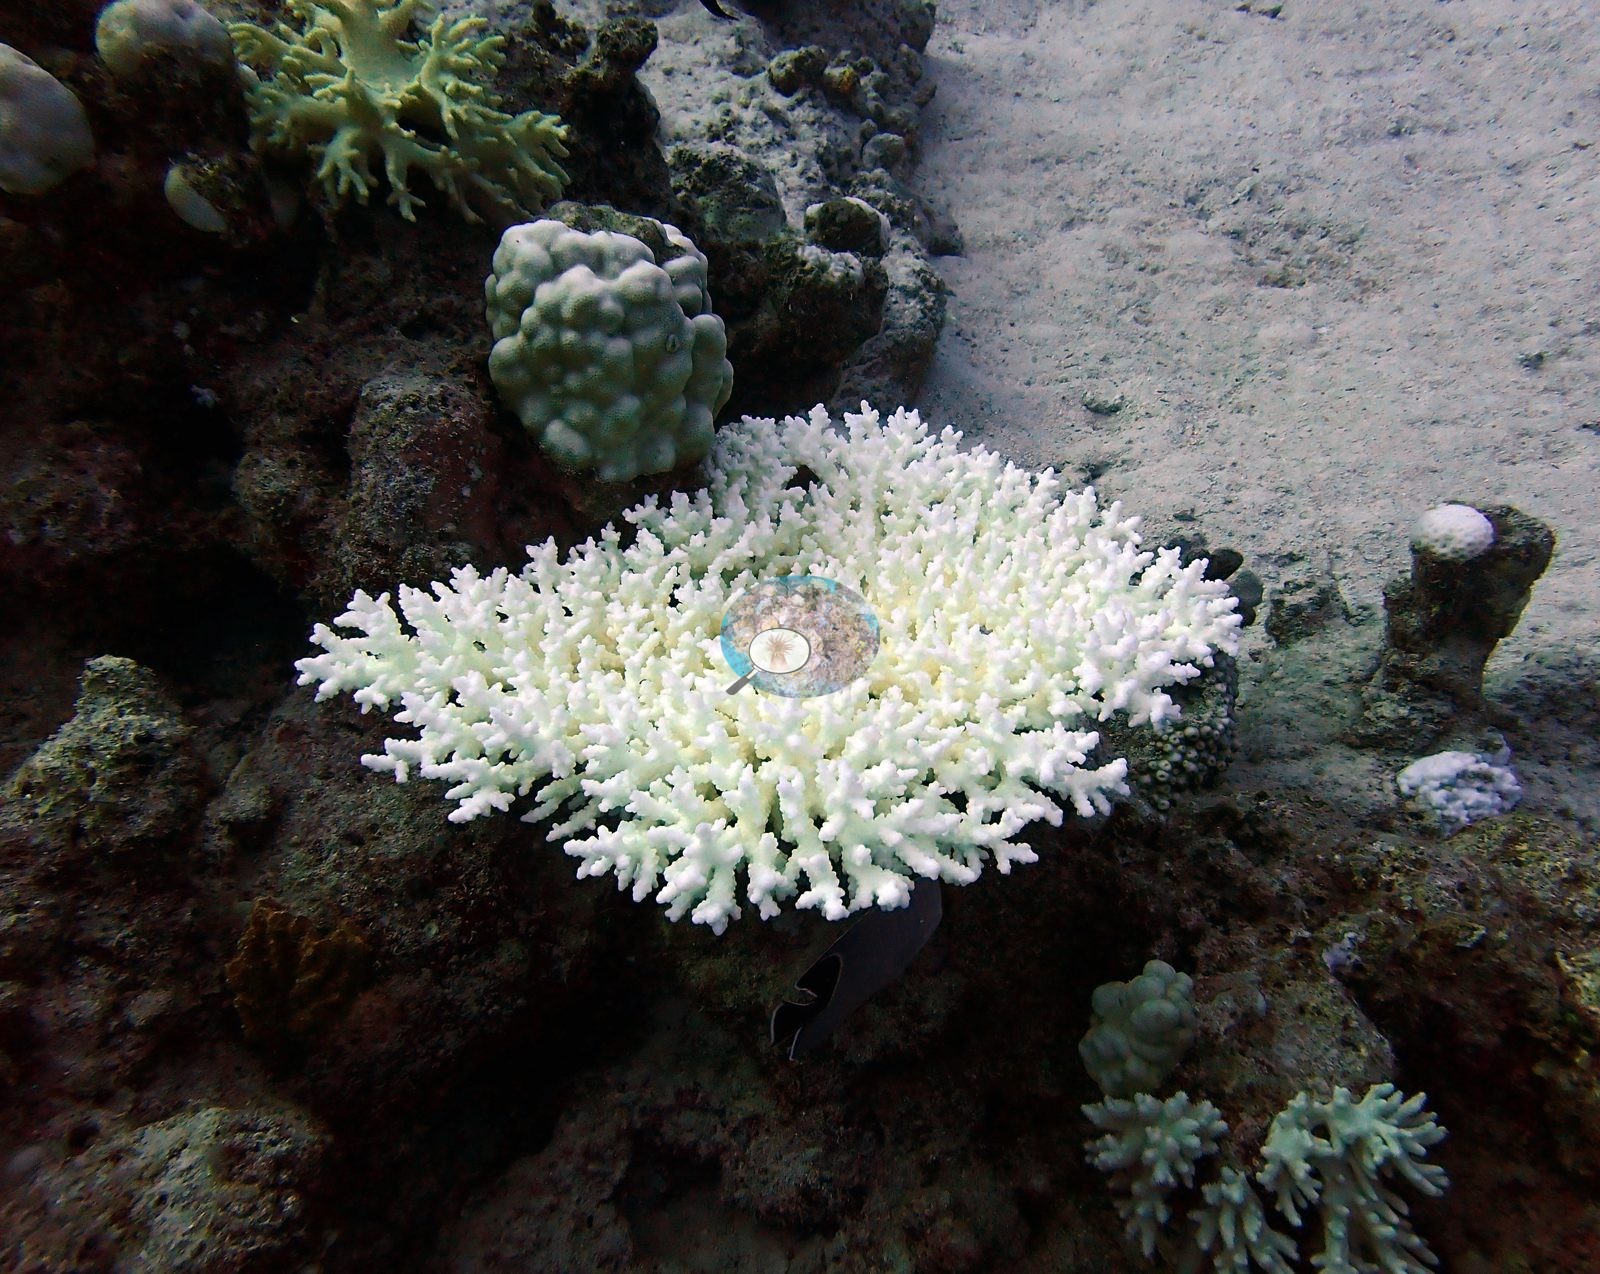
- Egypt Red Sea - Habili El Ghadeer (Marsa Nakari): 57.2% of coral tissue bleached; a large table Acropora over a meter across bleached uniformly white
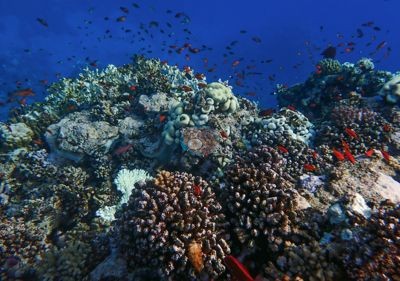
- Egypt Red Sea - Marsa Nakari-North (Marsa Nakari): 56.9% of coral tissue bleached; "badly bleached Acropora table"; captions record dead Pocillopora, dead Porites and dead fire coral
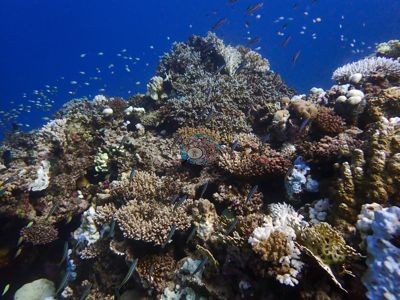
- Egypt Red Sea - Gazella Reef (Wadi Lahami): 53.8% of coral tissue bleached; captions record dead Acropora, dead acroporid and dead coral
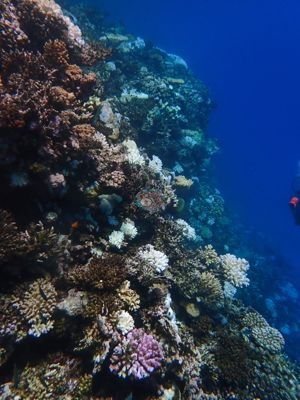
- Egypt Red Sea - Nakari House Reef-South (Marsa Nakari): 50.4% of coral tissue bleached; captions from 'survivors' through 'dying Acropora' to 'dead Seriatopora hystrix' and 'dead corals'
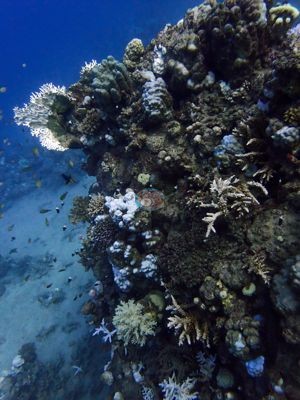
- Egypt Red Sea - Habili Gazella (Wadi Lahami): 45.5% of coral tissue bleached (prose gives 45.9%); bleaching patchier than at neighboring sites
Coral cover over time (pooled)
Sites in this region (11)
- Egypt Red Sea - Abu Galawa-small (Wadi Lahami) — 22% coral cover
- Egypt Red Sea - Gazella Reef (Wadi Lahami) — 17% coral cover
- Egypt Red Sea - Habili Daisy (Wadi Lahami) — 23% coral cover
- Egypt Red Sea - Habili El Ghadeer (Marsa Nakari) — 13% coral cover
- Egypt Red Sea - Habili Gazella (Wadi Lahami) — 18% coral cover
- Egypt Red Sea - Marsa Nakari-North (Marsa Nakari) — 23% coral cover
- Egypt Red Sea - Nakari House Reef-South (Marsa Nakari) — 25% coral cover
- Egypt Red Sea - Om Halhala (Marsa Nakari) — 24% coral cover
- Egypt Red Sea - Salah (Wadi Lahami) — 28% coral cover
- Egypt Red Sea - Shabrour-north (Wadi Lahami) — 24% coral cover
- Egypt Red Sea - Shabrour-south (Wadi Lahami) — 25% coral cover
% coral cover by method
Pooled across 2 published areas
| Method | Mean % coral cover | Std. dev. between published areas | n published areas | Note |
|---|---|---|---|---|
| Manual point count (author) | 21.8% | ±0.5 | 2 | frame-weighted 21.8% over 1,854 frames |
| Claude (Anthropic), blind point count | 27.9% | ±0.2 | 2 | frame-weighted 27.9% over 159 frames |
| In-house DINOv3 point classifier | 41.2% | ±0.8 | 2 | frame-weighted 40.8% over 159 frames |
The mean is an UNWEIGHTED mean of the published area values — each published area counts once, whatever its photo count — which is the convention of the published tables and of every other figure on this page. The frame-weighted alternative is given per method in the Note column; where the two differ, the difference is a photo-count imbalance, not a coral-cover finding.
Closest to the reference
Over the published areas where an independent reference exists, Claude (Anthropic), blind point count sits closest to it — a mean absolute deviation of 6.1 pp across 2 published areas, then In-house DINOv3 point classifier 19.4 pp (n=2). A mean absolute deviation is not an accuracy score: a model with a consistent offset is correctable, while one with the same deviation scattered in both directions is not.
By published area
| Published area | Manual point count | Claude | DINOv3 |
|---|---|---|---|
| Wadi Lahami | 22.1% n=1,180 | 28.0% n=129 | 40.6% n=129 |
| Marsa Nakari | 21.4% n=674 | 27.7% n=30 | 41.8% n=30 |
n under each value is the number of photographs that method scored at that published area. ⚠ marks a cell that is not an independent check.
Reference: point-count on the photographs (a human scoring the same pixels the models see). Denominator: coral points / (30 − WATER − FISH); `Unk` is IN the denominator (Mayfield 2025 convention); divers (`DVR`) are excluded as well, per the Red Sea paper. Source: published verbatim (Mayfield 2025, Environments 12:248, Table 4) ⚠ These rows are REGIONS, not dive sites — the published paper reports cover by region only. ⚠ The manual column and the computer vision (CV) columns are on DIFFERENT FRAME SETS: the published cover spans 674–1,180 frames, the CV arms ran on the 30- and 129-frame hand-scored reference subsets. CoralNet is n/a by design: the reference set IS the hand-scored set. DINOv3 is restricted to frames it never saw.
Nearby external survey stations
62 independent survey records within 5 km of a site in this region (deduplicated across sites).
Show all 62 records
- Reef Check — Checkpoint (2003): 39% hard coral cover, 3.19 km from Egypt Red Sea - Marsa Nakari-North (Marsa Nakari)
- Reef Check — Checkpoint (2007): 22% hard coral cover, 3.19 km from Egypt Red Sea - Marsa Nakari-North (Marsa Nakari)
- Reef Check — Checkpoint (2013): 43% hard coral cover, 3.29 km from Egypt Red Sea - Marsa Nakari-North (Marsa Nakari)
- Reef Check — Dream Lagoon Marsa Alam (2022): 53% hard coral cover, 1.55 km from Egypt Red Sea - Nakari House Reef-South (Marsa Nakari)
- Reef Check — Dream Lagoon Marsa Alam (2024): 58% hard coral cover, 1.55 km from Egypt Red Sea - Nakari House Reef-South (Marsa Nakari)
- Reef Check — Dream Lagoon Marsa Alam (2024): 55% hard coral cover, 1.55 km from Egypt Red Sea - Nakari House Reef-South (Marsa Nakari)
- Reef Check — Gotta Nakari (2005): 23% hard coral cover, 2.56 km from Egypt Red Sea - Marsa Nakari-North (Marsa Nakari)
- Reef Check — Gotta Nakari (2006): 9.4% hard coral cover, 2.56 km from Egypt Red Sea - Marsa Nakari-North (Marsa Nakari)
- Reef Check — Markas Ratz South (2007): 11% hard coral cover, 4.61 km from Egypt Red Sea - Marsa Nakari-North (Marsa Nakari)
- Reef Check — Marsa Nakari North (2010): 35% hard coral cover, 0.22 km from Egypt Red Sea - Nakari House Reef-South (Marsa Nakari)
- Reef Check — Marsa Nakari North (2011): 46% hard coral cover, 0.22 km from Egypt Red Sea - Nakari House Reef-South (Marsa Nakari)
- Reef Check — Marsa Nakari North (2013): 31% hard coral cover, 0.22 km from Egypt Red Sea - Nakari House Reef-South (Marsa Nakari)
- Reef Check — Marsa Nakari North (2015): 41% hard coral cover, 0.22 km from Egypt Red Sea - Nakari House Reef-South (Marsa Nakari)
- Reef Check — Marsa Nakari North (2018): 40% hard coral cover, 0.22 km from Egypt Red Sea - Nakari House Reef-South (Marsa Nakari)
- Reef Check — Marsa Nakari North (2024): 47% hard coral cover, 0.22 km from Egypt Red Sea - Nakari House Reef-South (Marsa Nakari)
- Reef Check — Marsa Nakari North (2024): 39% hard coral cover, 0.22 km from Egypt Red Sea - Nakari House Reef-South (Marsa Nakari)
- Reef Check — Marsa Nakari North (2025): 27% hard coral cover, 0.22 km from Egypt Red Sea - Nakari House Reef-South (Marsa Nakari)
- Reef Check — Marsa Nakari South (2010): 37% hard coral cover, 0.10 km from Egypt Red Sea - Nakari House Reef-South (Marsa Nakari)
- Reef Check — Marsa Nakari South (2011): 39% hard coral cover, 0.10 km from Egypt Red Sea - Nakari House Reef-South (Marsa Nakari)
- Reef Check — Marsa Nakari South (2013): 30% hard coral cover, 0.10 km from Egypt Red Sea - Nakari House Reef-South (Marsa Nakari)
- Reef Check — Marsa Nakari South (2015): 40% hard coral cover, 0.10 km from Egypt Red Sea - Nakari House Reef-South (Marsa Nakari)
- Reef Check — Marsa Nakari South (2018): 37% hard coral cover, 0.10 km from Egypt Red Sea - Nakari House Reef-South (Marsa Nakari)
- Reef Check — Marsa Nakari South (2024): 40% hard coral cover, 0.10 km from Egypt Red Sea - Nakari House Reef-South (Marsa Nakari)
- Reef Check — Marsa Nakari South (2024): 37% hard coral cover, 0.10 km from Egypt Red Sea - Nakari House Reef-South (Marsa Nakari)
- Reef Check — Marsa Nakari South (2025): 29% hard coral cover, 0.10 km from Egypt Red Sea - Nakari House Reef-South (Marsa Nakari)
- Reef Check — Marsa Tondoba North (2003): 39% hard coral cover, 4.78 km from Egypt Red Sea - Marsa Nakari-North (Marsa Nakari)
- Reef Check — Marsa Tondoba North (2004): 48% hard coral cover, 4.78 km from Egypt Red Sea - Marsa Nakari-North (Marsa Nakari)
- Reef Check — Marsa Tondoba North (2005): 48% hard coral cover, 4.78 km from Egypt Red Sea - Marsa Nakari-North (Marsa Nakari)
- Reef Check — Marsa Tondoba North (2006): 49% hard coral cover, 4.78 km from Egypt Red Sea - Marsa Nakari-North (Marsa Nakari)
- Reef Check — Marsa Tondoba North (2007): 47% hard coral cover, 4.78 km from Egypt Red Sea - Marsa Nakari-North (Marsa Nakari)
- Reef Check — Marsa Tondoba North (2009): 49% hard coral cover, 4.78 km from Egypt Red Sea - Marsa Nakari-North (Marsa Nakari)
- Reef Check — Marsa Tondoba North (2012): 52% hard coral cover, 4.78 km from Egypt Red Sea - Marsa Nakari-North (Marsa Nakari)
- Reef Check — Marsa Tondoba North (2013): 53% hard coral cover, 4.78 km from Egypt Red Sea - Marsa Nakari-North (Marsa Nakari)
- Reef Check — Marsa Tondoba North (2014): 50% hard coral cover, 4.78 km from Egypt Red Sea - Marsa Nakari-North (Marsa Nakari)
- Reef Check — Marsa Tondoba/3 Sisters (2005): 61% hard coral cover, 1.88 km from Egypt Red Sea - Marsa Nakari-North (Marsa Nakari)
- Reef Check — Marsa Tondoba/3 Sisters (2007): 39% hard coral cover, 1.88 km from Egypt Red Sea - Marsa Nakari-North (Marsa Nakari)
- Reef Check — Marsa Tondoba/3 Sisters (2007): 51% hard coral cover, 1.88 km from Egypt Red Sea - Marsa Nakari-North (Marsa Nakari)
- Reef Check — Marsa Tondoba/3 Sisters (2012): 53% hard coral cover, 1.88 km from Egypt Red Sea - Marsa Nakari-North (Marsa Nakari)
- Reef Check — Marsa Um Tondoba Fringing Reef North (2014): 6.2% hard coral cover, 4.78 km from Egypt Red Sea - Marsa Nakari-North (Marsa Nakari)
- Reef Check — Marsa Um Tondoba Lagoon (2014): 4.4% hard coral cover, 4.78 km from Egypt Red Sea - Marsa Nakari-North (Marsa Nakari)
- Reef Check — Marsa Um Tondoba North Entrance (2013): 14% hard coral cover, 4.69 km from Egypt Red Sea - Marsa Nakari-North (Marsa Nakari)
- Reef Check — Marsa Um Tondoba- 3 Sisters (2014): 52% hard coral cover, 4.15 km from Egypt Red Sea - Marsa Nakari-North (Marsa Nakari)
- Reef Check — Samaka Mogeha (North Marsa Nakari) (2003): 49% hard coral cover, 0.73 km from Egypt Red Sea - Marsa Nakari-North (Marsa Nakari)
- Reef Check — Samaka Mogeha (North Marsa Nakari) (2005): 43% hard coral cover, 0.73 km from Egypt Red Sea - Marsa Nakari-North (Marsa Nakari)
- Reef Check — Samaka Mogeha (North Marsa Nakari) (2005): 45% hard coral cover, 0.73 km from Egypt Red Sea - Marsa Nakari-North (Marsa Nakari)
- Reef Check — Shaab Nakari, north-east side (2017): 53% hard coral cover, 2.77 km from Egypt Red Sea - Marsa Nakari-North (Marsa Nakari)
- Reef Check — Shaab Nakari, north-east side (2019): 59% hard coral cover, 2.77 km from Egypt Red Sea - Marsa Nakari-North (Marsa Nakari)
- Reef Check — Shaab Nakari, north-east side (2024): 51% hard coral cover, 2.77 km from Egypt Red Sea - Marsa Nakari-North (Marsa Nakari)
- Reef Check — Tondoba Bay, outer reef North (2005): 33% hard coral cover, 4.59 km from Egypt Red Sea - Marsa Nakari-North (Marsa Nakari)
- Reef Check — Tondoba Bay, outer reef North (2012): 44% hard coral cover, 4.59 km from Egypt Red Sea - Marsa Nakari-North (Marsa Nakari)
- Reef Check — Tondoba Bay, outer reef North (2013): 22% hard coral cover, 4.59 km from Egypt Red Sea - Marsa Nakari-North (Marsa Nakari)
- Reef Check — Tondoba Bay, outer reef North (2014): 46% hard coral cover, 4.59 km from Egypt Red Sea - Marsa Nakari-North (Marsa Nakari)
- Reef Check — Wadi Lahami House Reef 1 (2009): 30% hard coral cover, 1.75 km from Egypt Red Sea - Shabrour-south (Wadi Lahami)
- Reef Check — Wadi Lahami House Reef 1 (2009): 37% hard coral cover, 1.75 km from Egypt Red Sea - Shabrour-south (Wadi Lahami)
- Reef Check — Wadi Lahami House Reef 1 (2012): 30% hard coral cover, 1.75 km from Egypt Red Sea - Shabrour-south (Wadi Lahami)
- Reef Check — Wadi Lahami House Reef 1 (2018): 46% hard coral cover, 1.75 km from Egypt Red Sea - Shabrour-south (Wadi Lahami)
- Reef Check — Wadi Lahami House Reef 1 (2023): 41% hard coral cover, 1.75 km from Egypt Red Sea - Shabrour-south (Wadi Lahami)
- Reef Check — Wadi Lahami House Reef 2 (2009): 56% hard coral cover, 1.55 km from Egypt Red Sea - Shabrour-south (Wadi Lahami)
- Reef Check — Wadi Lahami House Reef 2 (2009): 49% hard coral cover, 1.55 km from Egypt Red Sea - Shabrour-south (Wadi Lahami)
- Reef Check — Wadi Lahami House Reef 2 (2012): 45% hard coral cover, 1.55 km from Egypt Red Sea - Shabrour-south (Wadi Lahami)
- Reef Check — Wadi Lahami House Reef 2 (2018): 52% hard coral cover, 1.55 km from Egypt Red Sea - Shabrour-south (Wadi Lahami)
- Reef Check — Wadi Lahami House Reef 2 (2023): 44% hard coral cover, 1.55 km from Egypt Red Sea - Shabrour-south (Wadi Lahami)
All images from Coral Reef Diagnostics. Data are from Coral Reef Diagnostics and Reef Check Foundation.
© Coral Reef Diagnostics.
References
- Souter D, et al. (eds) (2021) Status of Coral Reefs of the World: 2020. International Coral Reef Initiative / Global Coral Reef Monitoring Network. [PDF]
- Spalding MD, et al. (2001) World Atlas of Coral Reefs. University of California Press, Berkeley. [PDF]
- Wilkinson C (2006) Status of coral reefs of the world: summary of threats and remedial action. In: Côté IM, Reynolds JD (eds) Coral Reef Conservation. Cambridge University Press, Cambridge. [PDF]
- Mayfield AB (2025). Using Tourist Diver Photos to Assess the Effects of Marine Heatwaves on Central Red Sea Coral Reefs. Environments 12:248. PDF