
Egypt Red Sea - Marsa Nakari-North (Marsa Nakari)

Part of the regional summaries: Egypt and Red Sea
More info
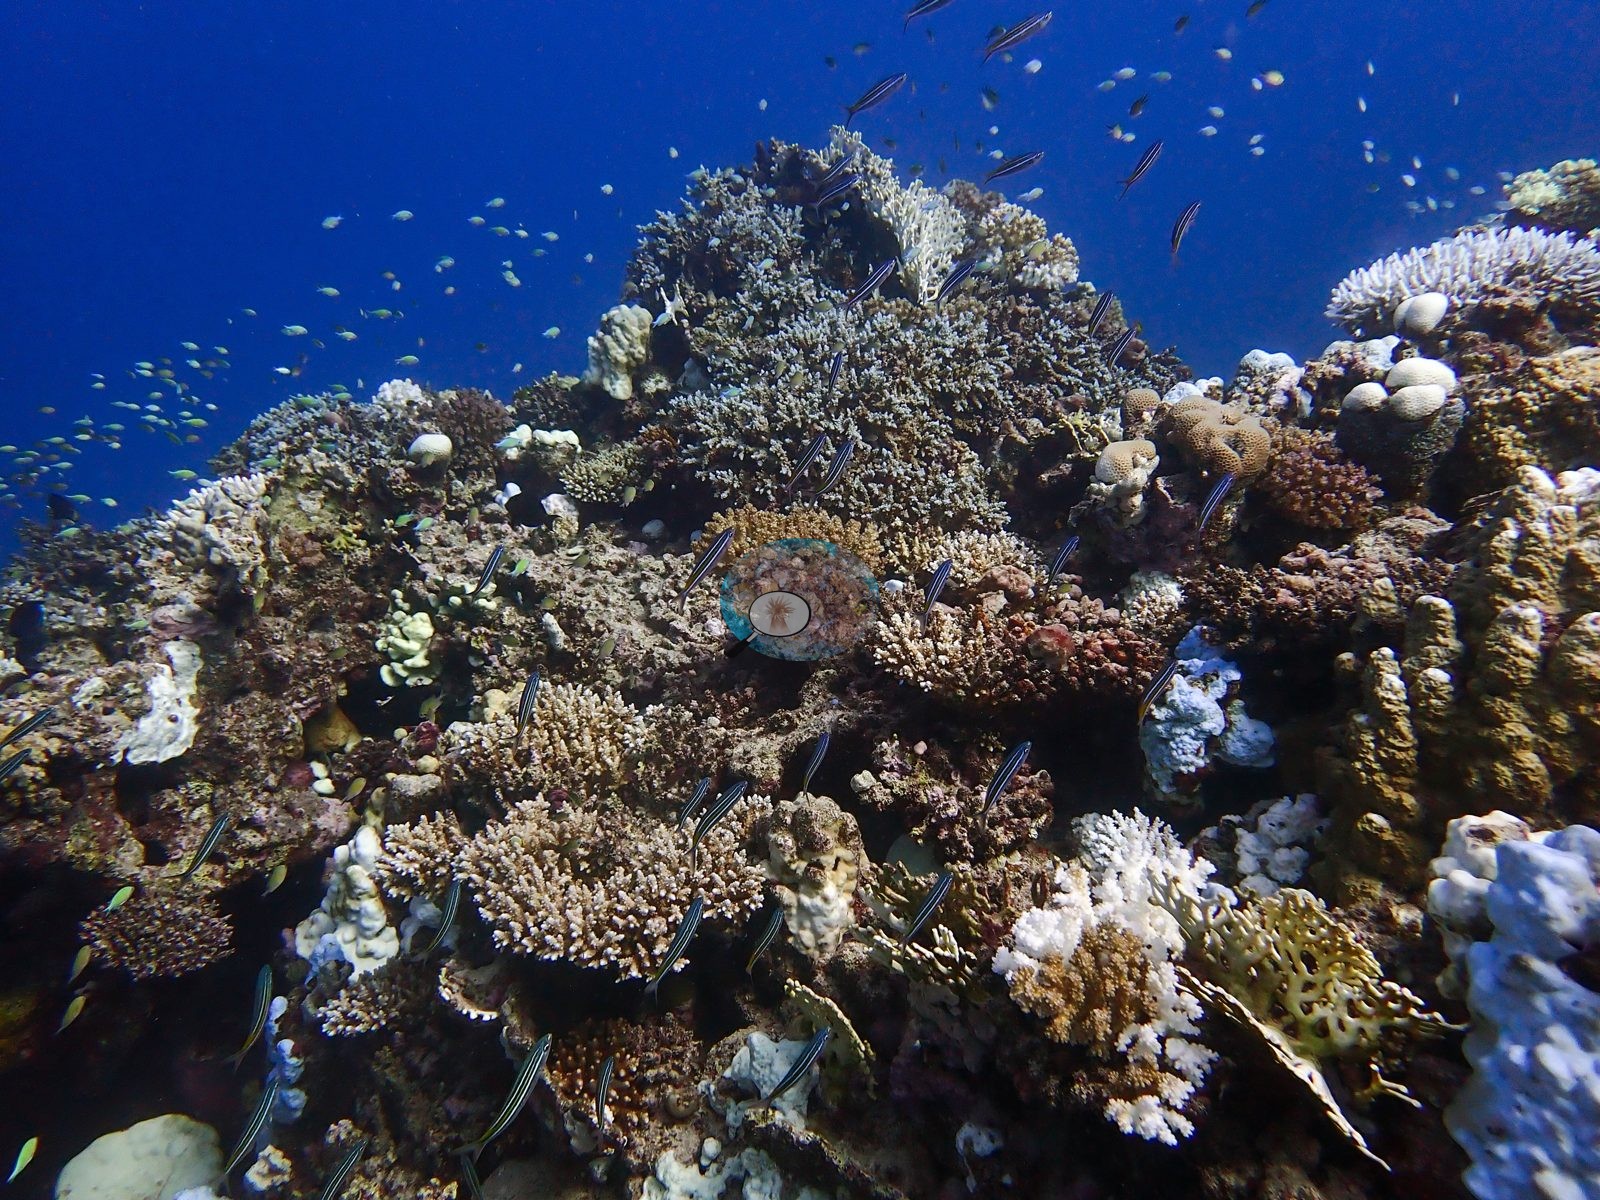
Egypt (NOAA CRW virtual station) · Northern and Central Red Sea ecoregion mean=12.2°C-heating weeksThe northern arm of the Marsa Nakari house reef, a low-relief slope of coralline pavement and rubble with scattered coral patches and a hunting lionfish. It was severely bleached in September 2024, with about 57% of coral tissue affected, and Anderson's own dive computer read 31°C on the dive.
الذراع الشمالية لشعبة نزل مرسى نكاري، منحدر منخفض التضاريس من رصيف مرجاني وحطام تتناثر فيه بقع مرجانية، مع سمكة أسد تصطاد. أصابه ابيضاض شديد في سبتمبر 2024 طال نحو 57% من الأنسجة المرجانية، وقرأ حاسوب الغوص الخاص بأندرسون 31°C في تلك الغطسة.
ترجمة هذا الملخص بالذكاء الاصطناعي؛ النص الإنجليزي هو المعتمد.
Fifteen independent survey stations shown with the program’s logo — click one to see how far it is from this site.
One other CRD dive site within 5 km shown in orange — click a marker to open its page.
3 of these 4 photographs are shown beside the text that discusses them under "Site description" below.
Site description
Setting
The northern arm of the Marsa Nakari house reef, dived on the afternoon of 20 September 2024 with Red Sea Diving Safari.
General benthic features
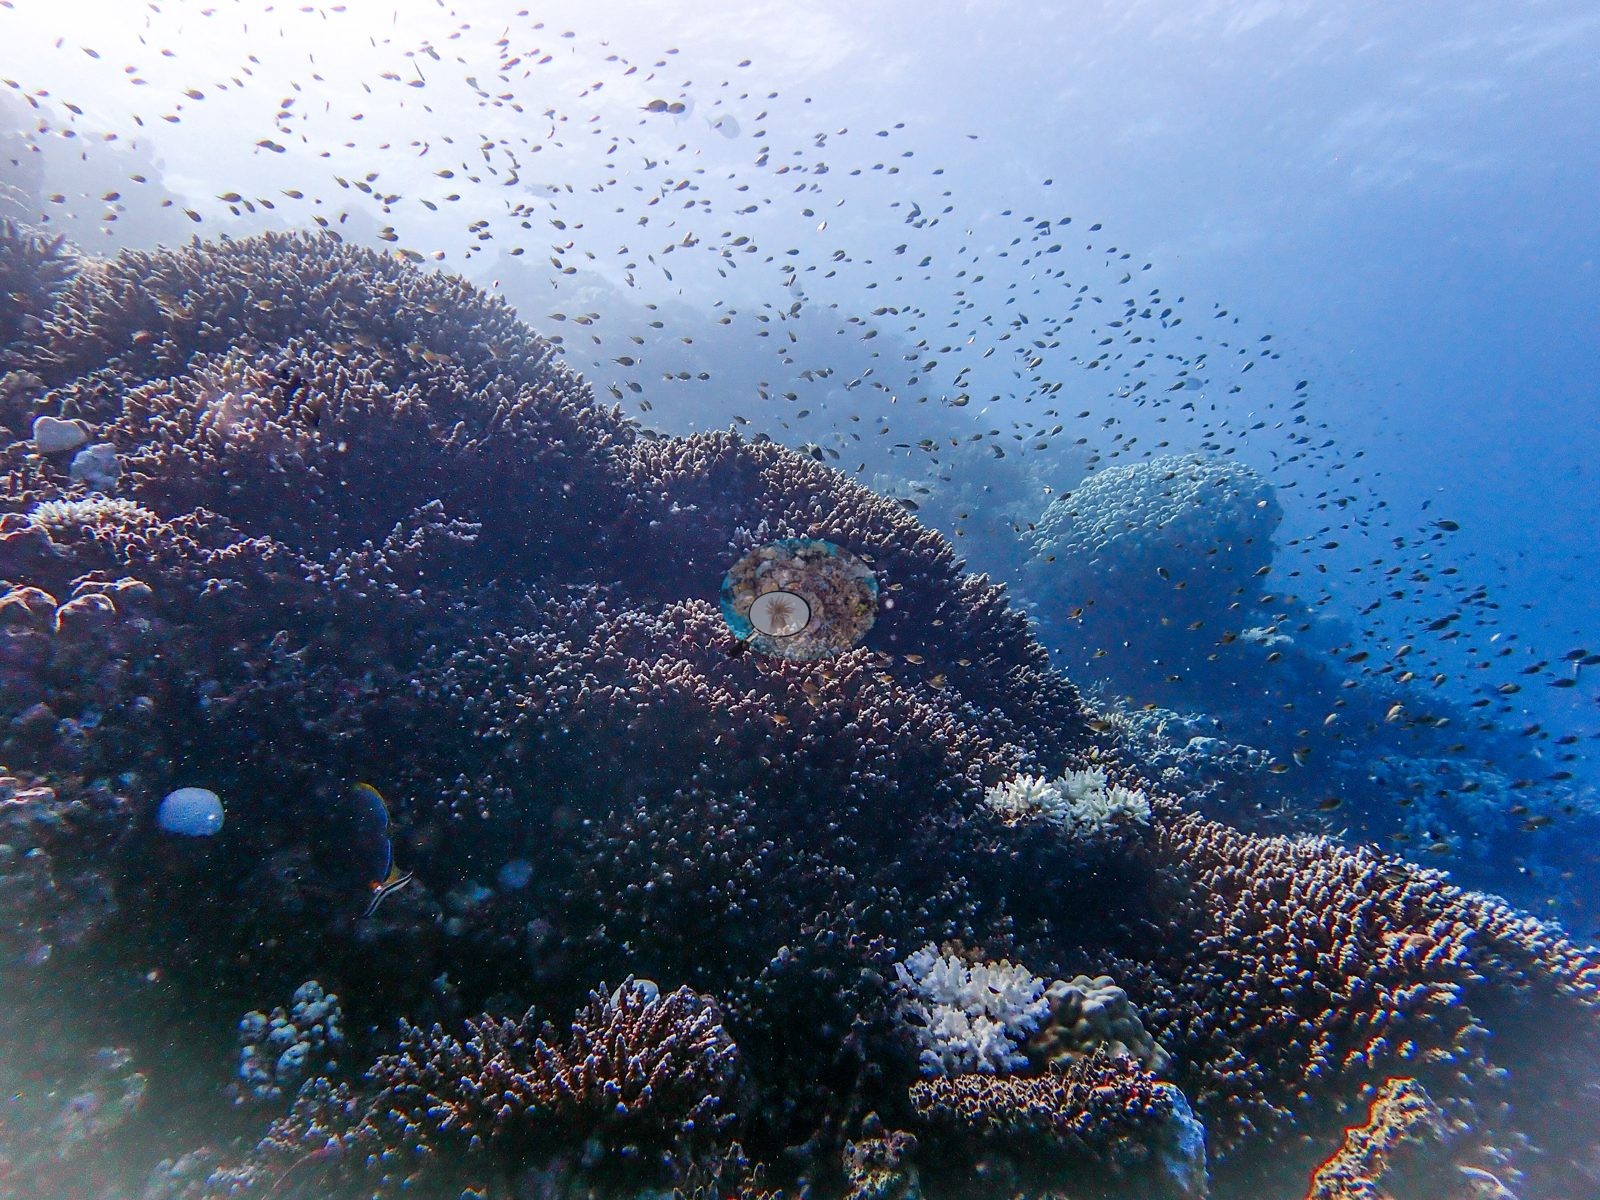
The reef is a low-relief slope of broad coralline-crusted pavement and rubble running out onto sand, with widely spaced coral patches on it — branching and corymbose Acropora, pocilloporids, Porites, faviids, encrusting Millepora-type fire coral, and one large partly overgrown giant clam shell set into the pavement.
Coral cover
Coral cover is 23.3% ± 14.0 across 195 photographs, quoted verbatim from Mayfield, A.B. (2025) Environments 12:248 — Red Sea 2023-24 bleaching; CoralNet point annotation, Appendix A — a manual, diver-annotated CoralNet point count from Anderson's own published work, not a computer vision output and not recomputed here.
Stressors
The site record reports 56.9% of coral tissue bleached at about 21.9°C-weeks DHW. Anderson recorded the water temperature himself: one frame is a wrist shot of his dive computer reading 31°C at 13:59. That single image is the most direct evidence anywhere in the set of what was driving the bleaching. Much of the pavement is old dead framework rather than recent loss, but scattered through it, in almost every wide-angle, are small stark-white colonies (e.g., Image 1, Image 3, Image 4).
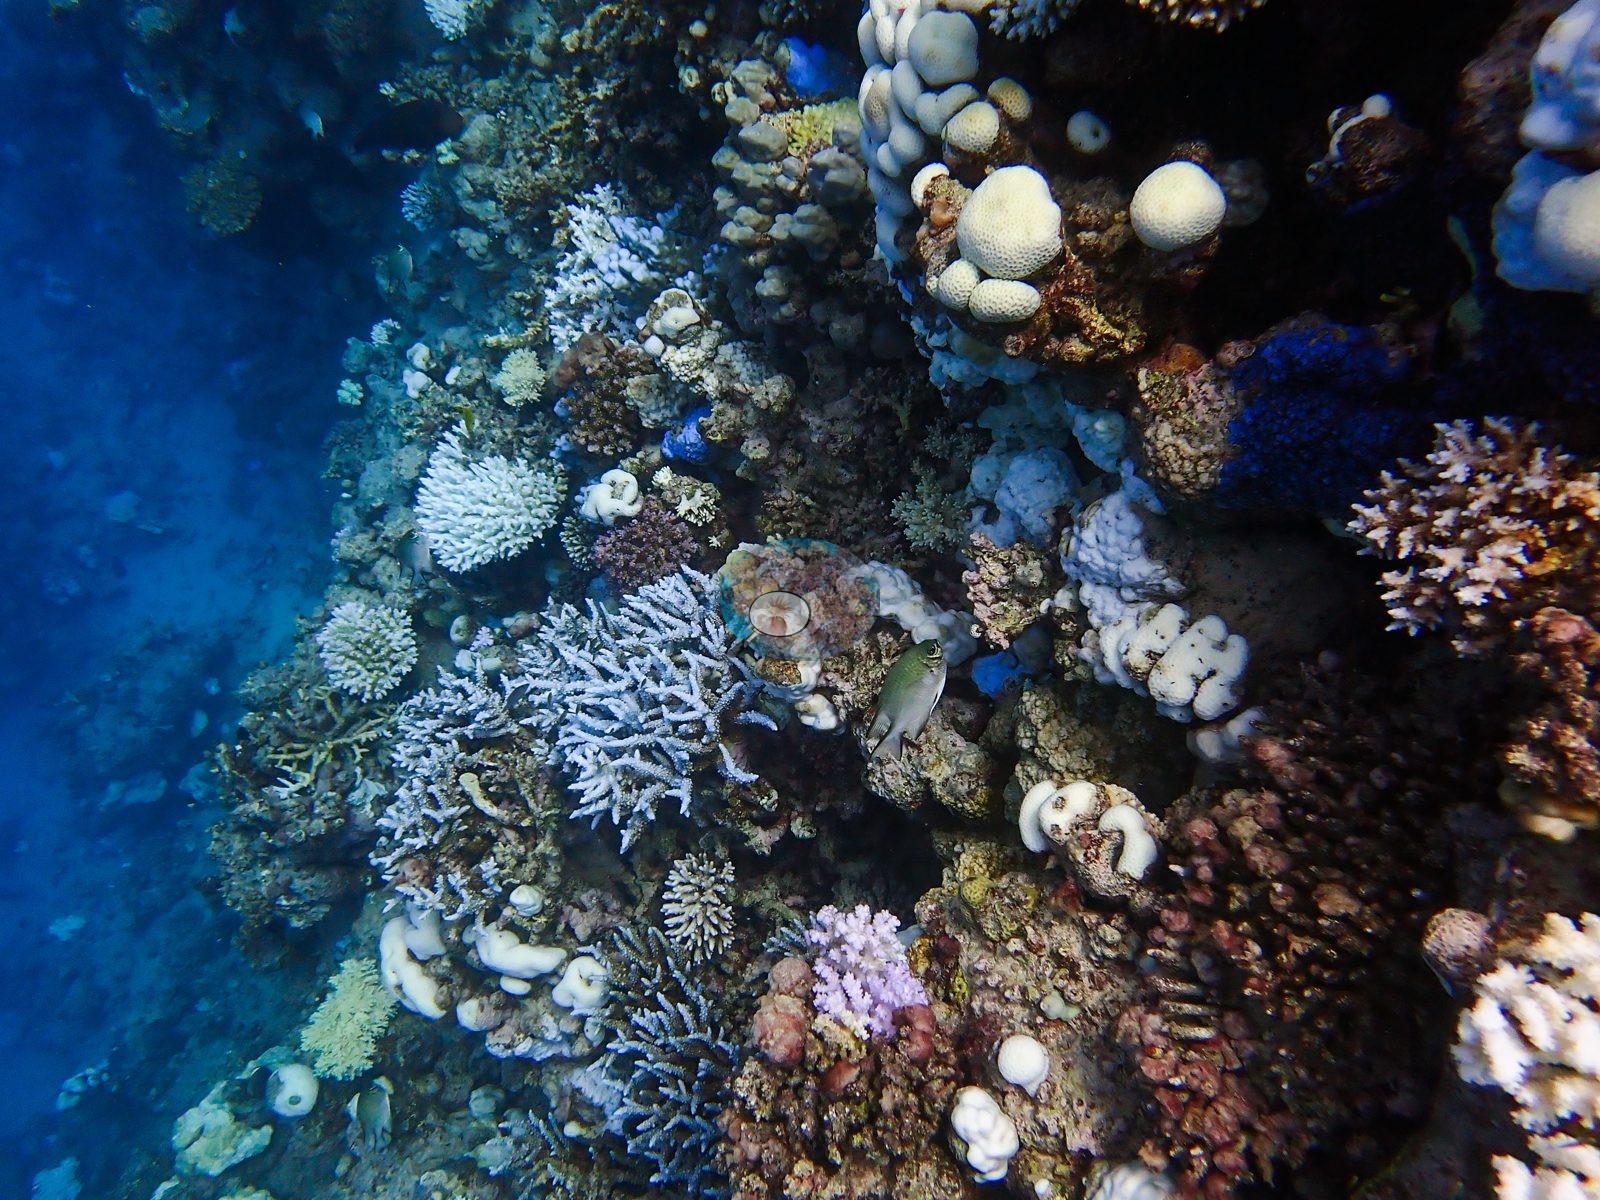
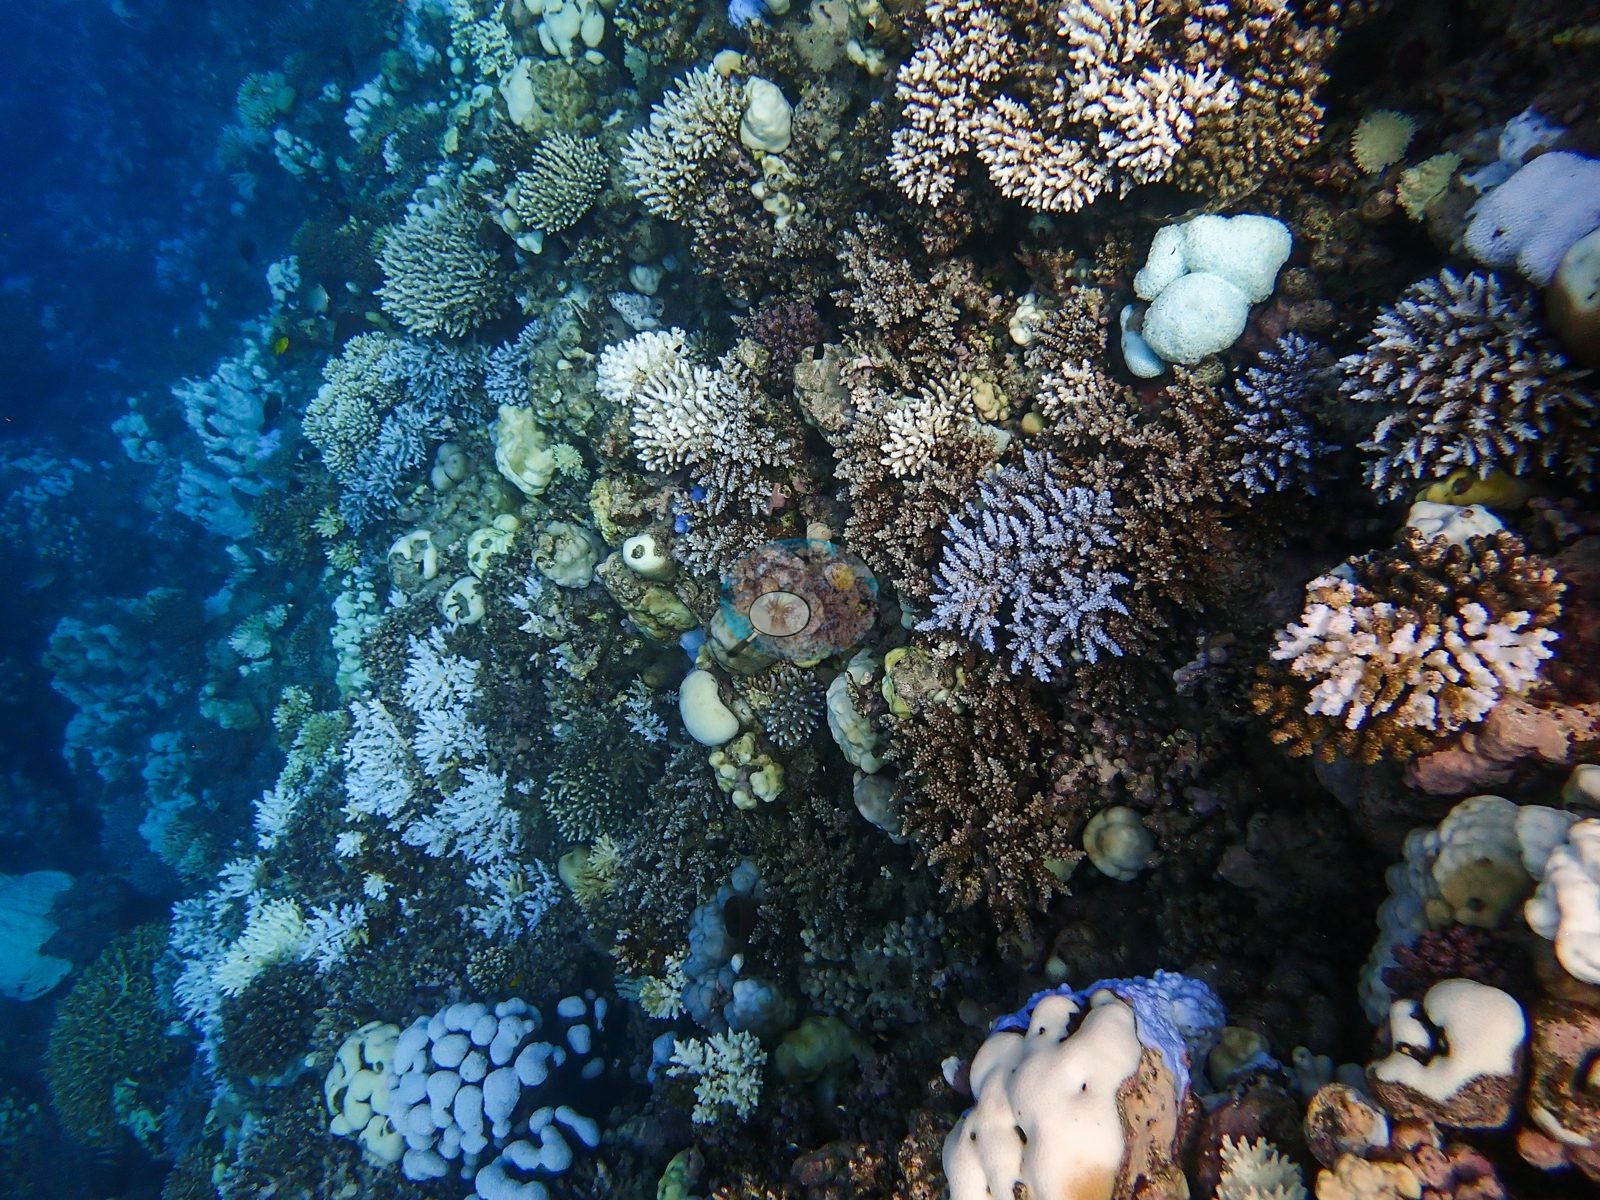
Anderson's captions record what he found in detail: "badly bleached Acropora table", "bleaching Porites", "dead Pocillopora", "dead pocilloporid", "another dead pocilloporid", "dead Porites", "dead fire coral".
Fish and other fauna
A lionfish (Pterois-type) hunts the patches.
Comparisons with other data
This site also carries an external cross-reference to Reef Check's Marsa Nakari North station 0.25 km away (mean 38.0% hard coral over seven surveys, 2010–2025), reported side by side with the CRD figure and deliberately not averaged. Different station, different observers: a near-concurrent cross-check, not a repeat of this site.
Other notes
See flags.
CV model comparison
More info
The reference row is this dive site's own published value (Mayfield 2025, Appendix A, 195 photos); the other rows are AREA-level (Marsa Nakari) comparisons, not run on this site's frames. ⚠ The comparison rows are REGIONS, not dive sites: the paper's main tables report cover by region, and this site's own value comes from its Appendix A. ⚠ The manual column and the CV columns are on DIFFERENT FRAME SETS: the published cover spans 674–1,180 frames, the CV arms ran on the 30- and 129-frame hand-scored reference subsets. CoralNet is n/a by design: the reference set IS the hand-scored set. DINOv3 is restricted to frames it never saw. CoralNet automated point classifier: n/a — the reference set IS the hand-scored set; these frames carry no independent CoralNet robot label to compare against CoralSCOP (SAM-based mask-sum), unedited photos: pending — CoralSCOP run: 370/747 images scored at build time CoralSCOP (SAM-based mask-sum), edited photos: pending — CoralSCOP run: 370/747 images scored at build time| Method | Hard-coral cover (%) |
|---|---|
| Manual (published) | 23.3 |
| In-house DINOv3 | 41.8 |
| Claude | 27.7 |
Independent surveys nearby
 Dr. Coral (CRD)
Within 5 km, 15 independent survey stations recorded hard coral cover in 70 surveys between 2003 and 2025. Of the 10 stations surveyed in more than one year, 5 declined, 3 increased, and 2 changed by less than 5 percentage points between their first and latest surveys. The longest record, Marsa Nakari North (Reef Check, 0.25 km away), went from 35% in 2010 to 27% in 2025. Surveys since 2021 average 43% (range 27–58%, n=7). This site's own estimate (23%) is indistinguishable from the recent range (27–58%): the 3.6-point gap is inside the ±7 percentage-point noise between methods; the methods differ, so the comparison is context, not a like-for-like test.
Collected by other programs using different methods (Reef Check uses point-intercept transects), so these are context for the figures above, not a like-for-like comparison. Where a station was surveyed more than once the range is shown. Station names are not dive-site names.
Show all 15 independent survey records
| Agency | Site / location | Date | Hard coral cover (%) | Distance | Link |
|---|---|---|---|---|---|
| Reef Check | Samaka Mogeha (North Marsa Nakari) | 2003–2005 | 43–49% (3 surveys) | 0.73 km | — |
| Reef Check | Checkpoint | 2003–2013 | 22–43% (3 surveys) | 3.19 km | — |
| Reef Check | Marsa Tondoba North | 2003–2014 | 39–53% (11 surveys) | 4.78 km | — |
| Reef Check | Marsa Tondoba/3 Sisters | 2005–2012 | 39–61% (3 surveys) | 1.88 km | — |
| Reef Check | Gotta Nakari | 2005–2006 | 9.4–23% (3 surveys) | 2.56 km | — |
| Reef Check | Tondoba Bay, outer reef North | 2005–2014 | 22–46% (5 surveys) | 4.59 km | — |
| Reef Check | Markas Ratz South | 2007 | 11% | 4.61 km | — |
| Reef Check | Marsa Nakari North | 2010–2025 | 27–47% (13 surveys) | 0.25 km | — |
| Reef Check | Marsa Nakari South | 2010–2025 | 29–40% (14 surveys) | 0.44 km | — |
| Reef Check | Marsa Um Tondoba North Entrance | 2013 | 14% | 4.69 km | — |
| Reef Check | Marsa Um Tondoba- 3 Sisters | 2014 | 52% | 4.15 km | — |
| Reef Check | Marsa Um Tondoba Lagoon | 2014 | 4.4% | 4.78 km | — |
| Reef Check | Marsa Um Tondoba Fringing Reef North | 2014 | 6.2% | 4.78 km | — |
| Reef Check | Shaab Nakari, north-east side | 2017–2024 | 51–59% (6 surveys) | 2.77 km | — |
| Reef Check | Dream Lagoon Marsa Alam | 2022–2024 | 53–58% (4 surveys) | 1.93 km | — |
Data & links
All images from Coral Reef Diagnostics. Data are from Coral Reef Diagnostics and the organizations named in the data-sources table above.
© Coral Reef Diagnostics.