
Regional summary of 8 dive sites. Figures are averages across the sites that report them (n = sites with a value); each site's own page has its individual values.
⬇ Download this region as a report card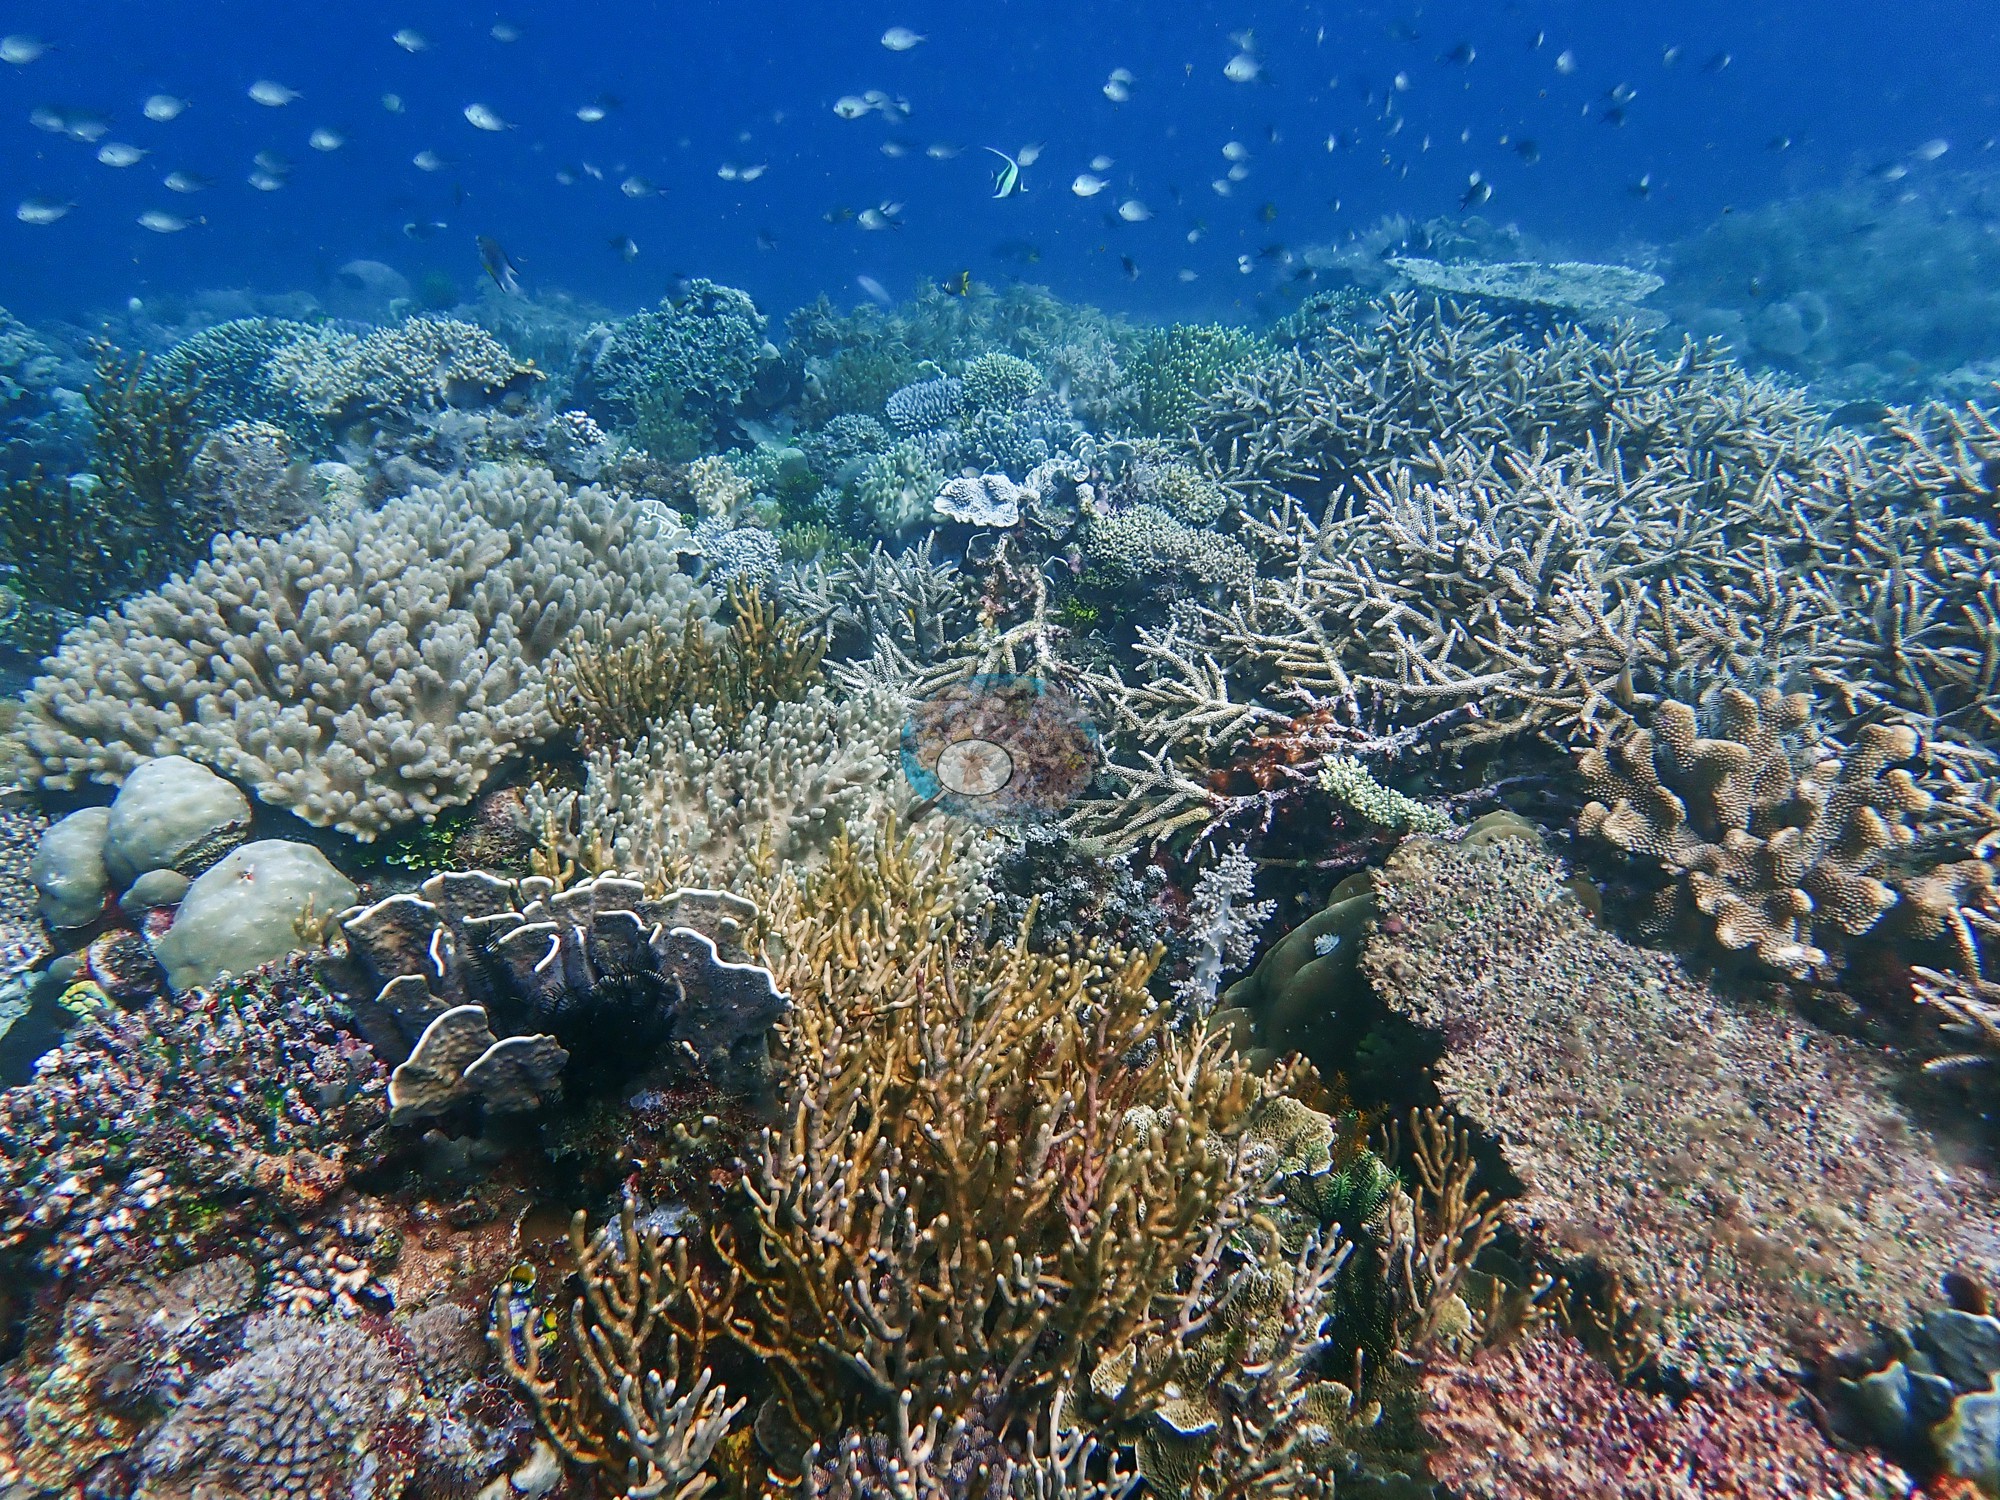

Atauro Island's reefs, dived in early 2024, range from a shallow snorkel garden to steep ridges and a deep pinnacle, dominated by near-continuous staghorn thickets under dense clouds of small fish. Dense coral mixes with rubble at every site, and no reef-wide bleaching was seen.
Heat stress
Long-term record: 0 years since 1985 reached 8 or more °C-weeks at NOAA’s Timor-Leste station. Download the annual DHW data (CSV).
8 sites in this region — click a marker to open that site.
Regional setting
Spalding et al. (2001) give East Timor no separate account or reef-area figure. Its coast appears on the maps of their Indonesia chapter, and Timor falls in the sub-region they call the Moluccas and Irian Jaya, which includes a chain of small archipelagos along the southern edge of the Banda Sea running east from Timor to the Aru Islands. They describe that sub-region as one of complex bathymetry and deep, mostly clear oceanic water, with islands a few tens of kilometers apart sometimes separated by more than 1,000 m. In the Timor Sea, surface currents flow west throughout the year, and a 1990 image in the same chapter shows Luang and Ukenao atolls lying east of East Timor. Souter et al. (2021) report that by December 2020 the Allen Coral Atlas had produced detailed satellite-derived reef maps of the Timor and Arafura Seas.
Overview
Eight of the nine Timor-Leste pins are sites around Atauro Island, dived between 29 January and 1 February 2024. The ninth is a general Atauro Island pin with no dive record of its own. The sites run from a 2 m snorkel garden at Compass Reef and the shallow Inner Reef to a steep coral ridge at Raiketa, the upper terrace of Biqueli Wall, and the deep, dim Pinnacle, dived to 35.7 m. Haruine was dived by day and after dark.
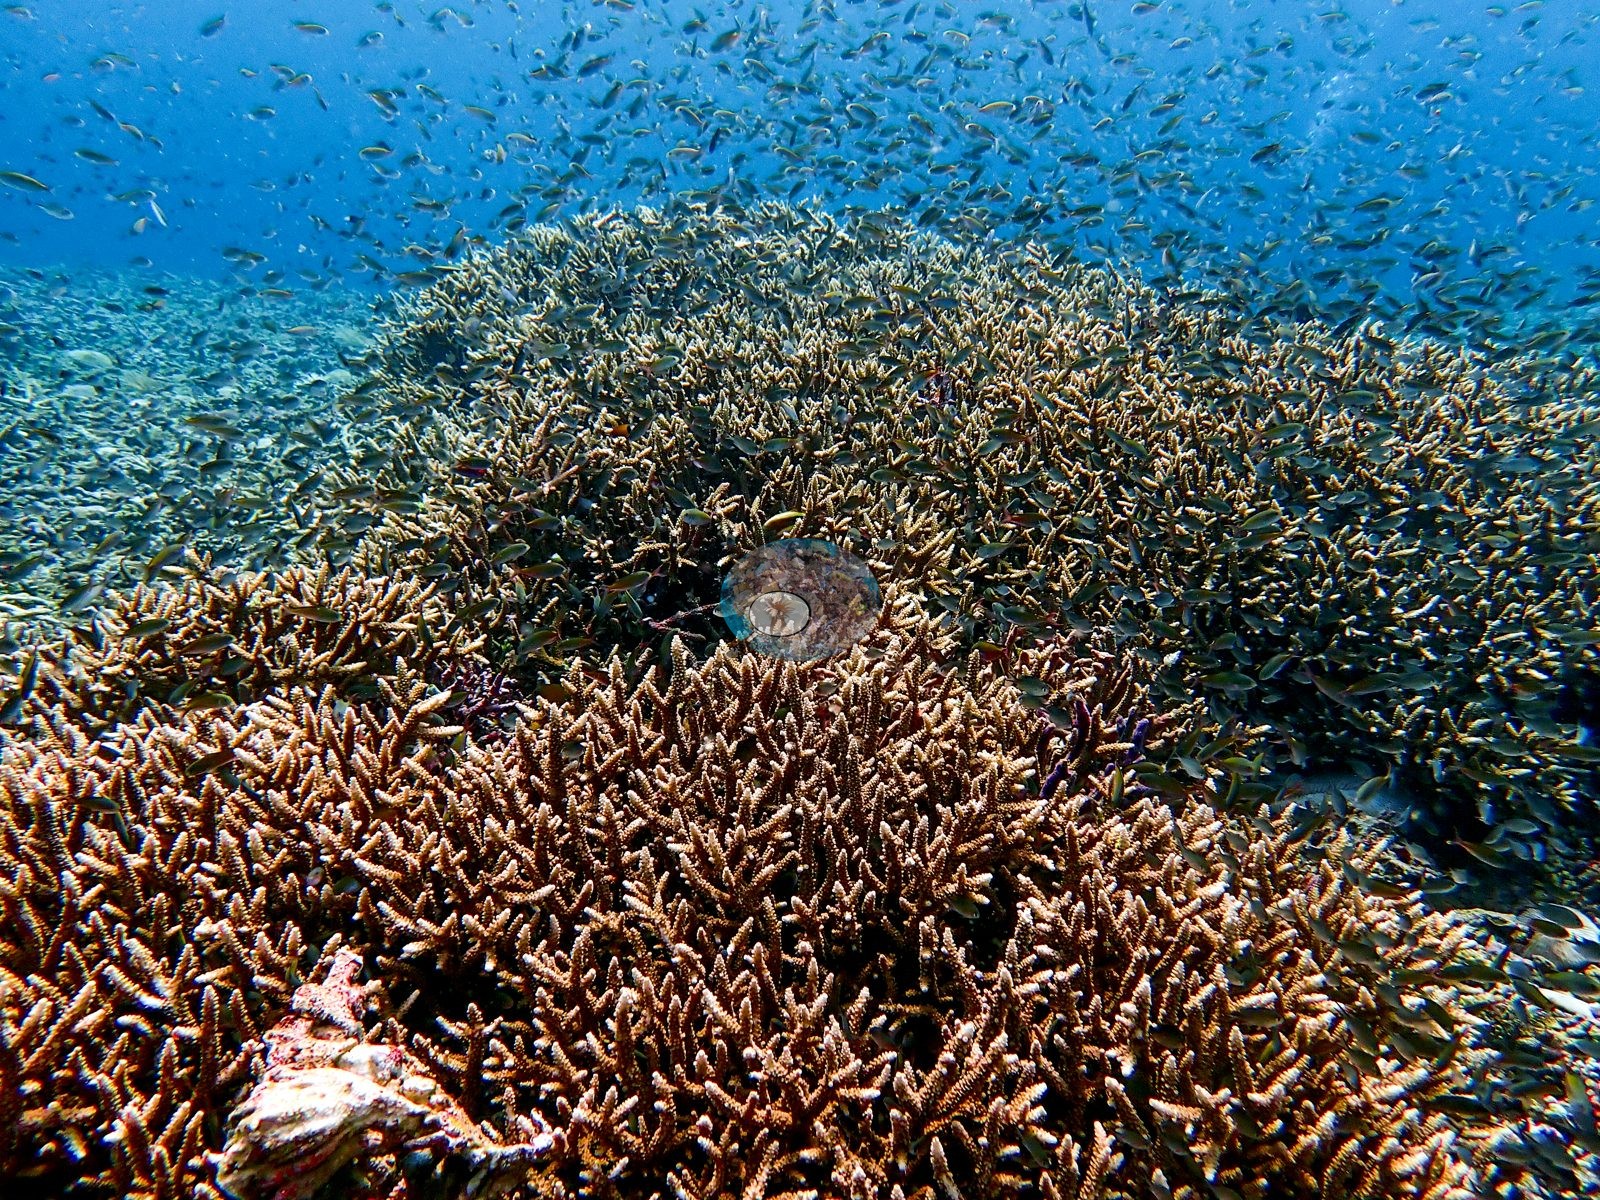
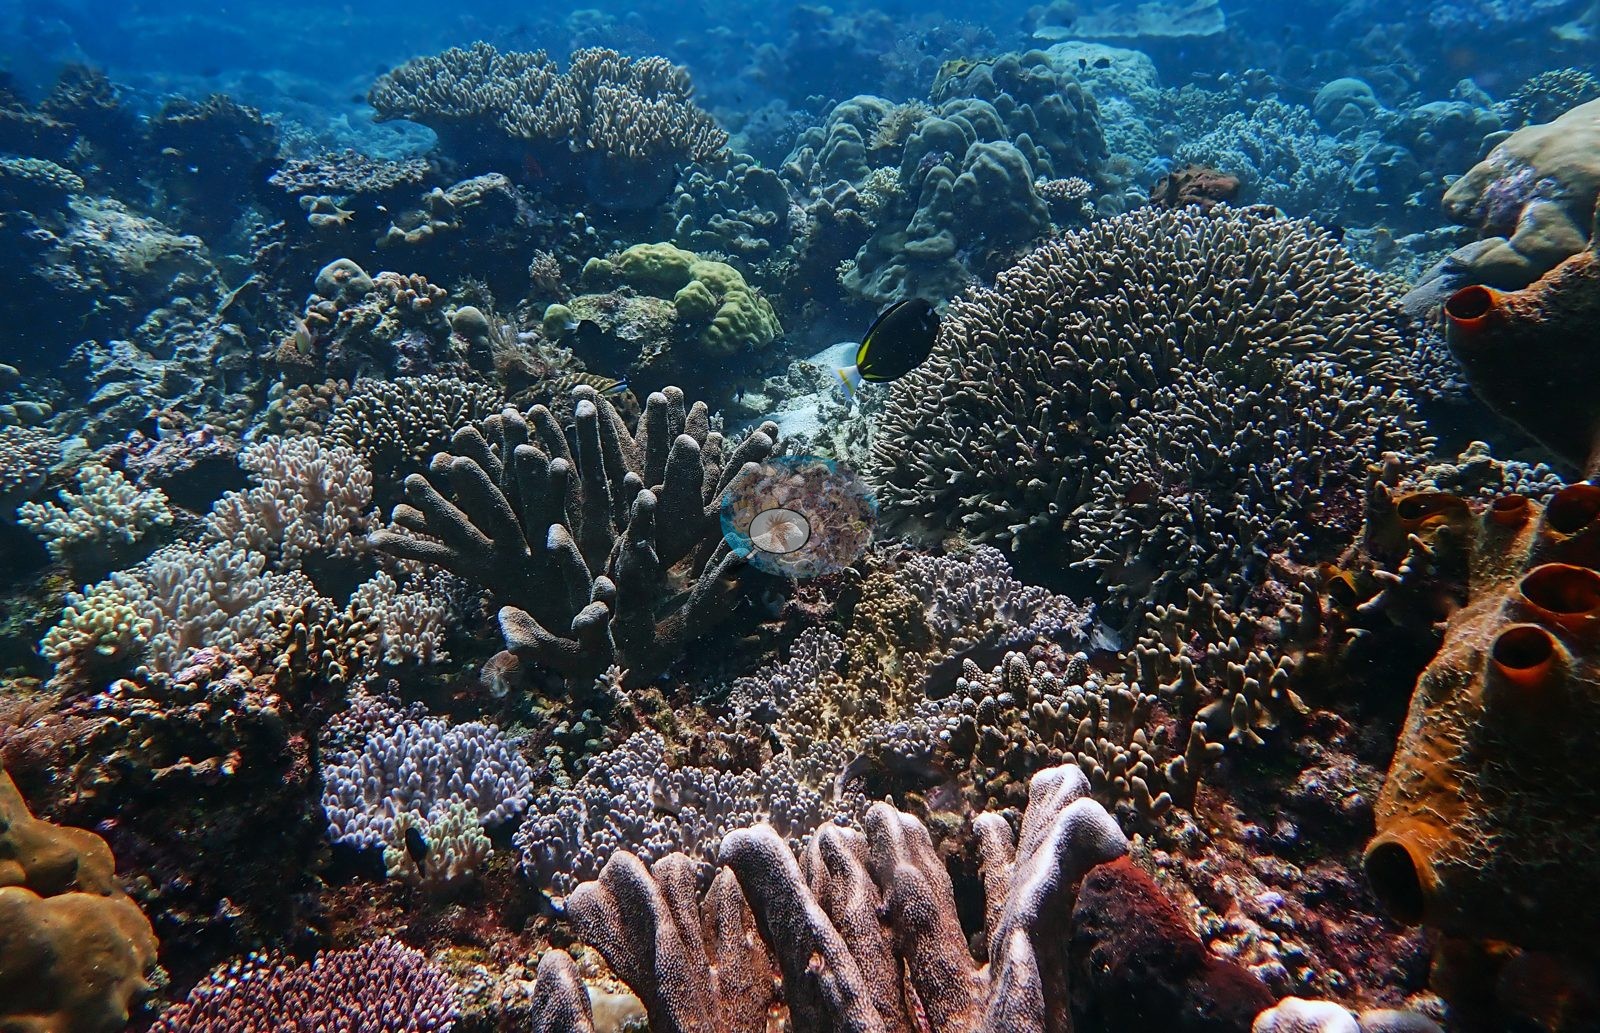
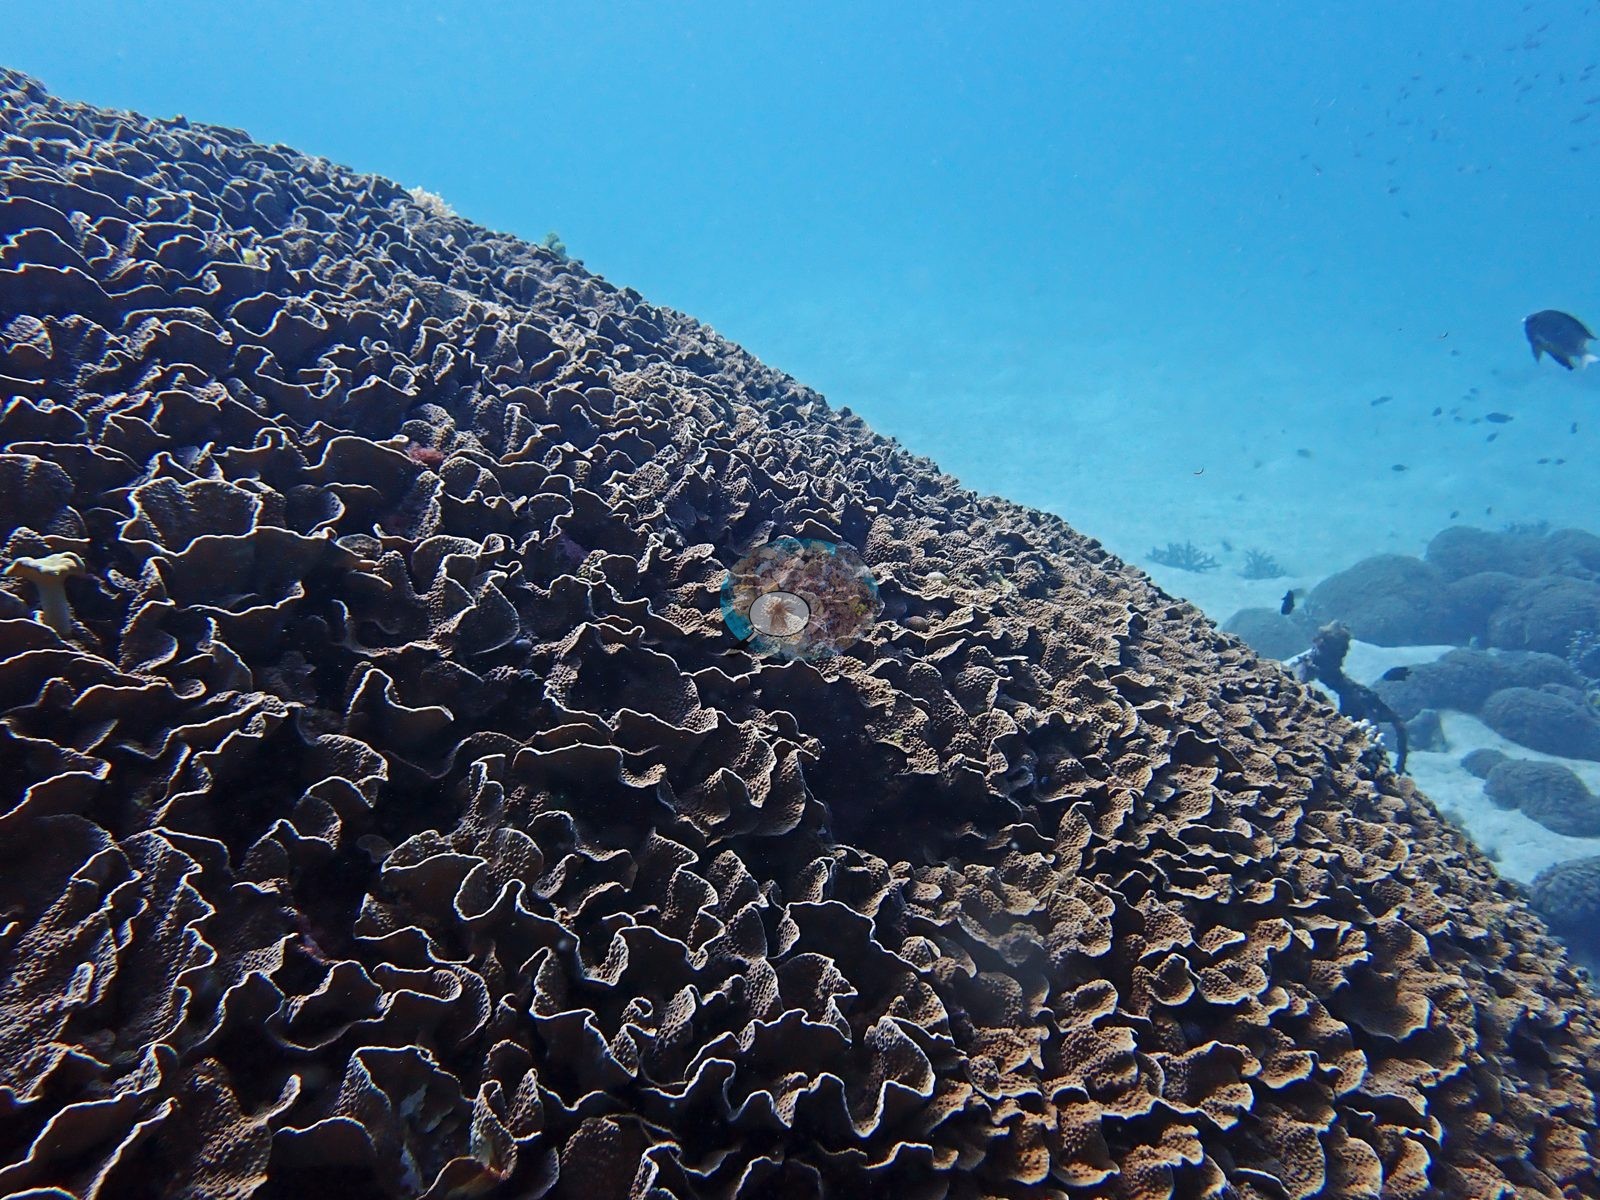
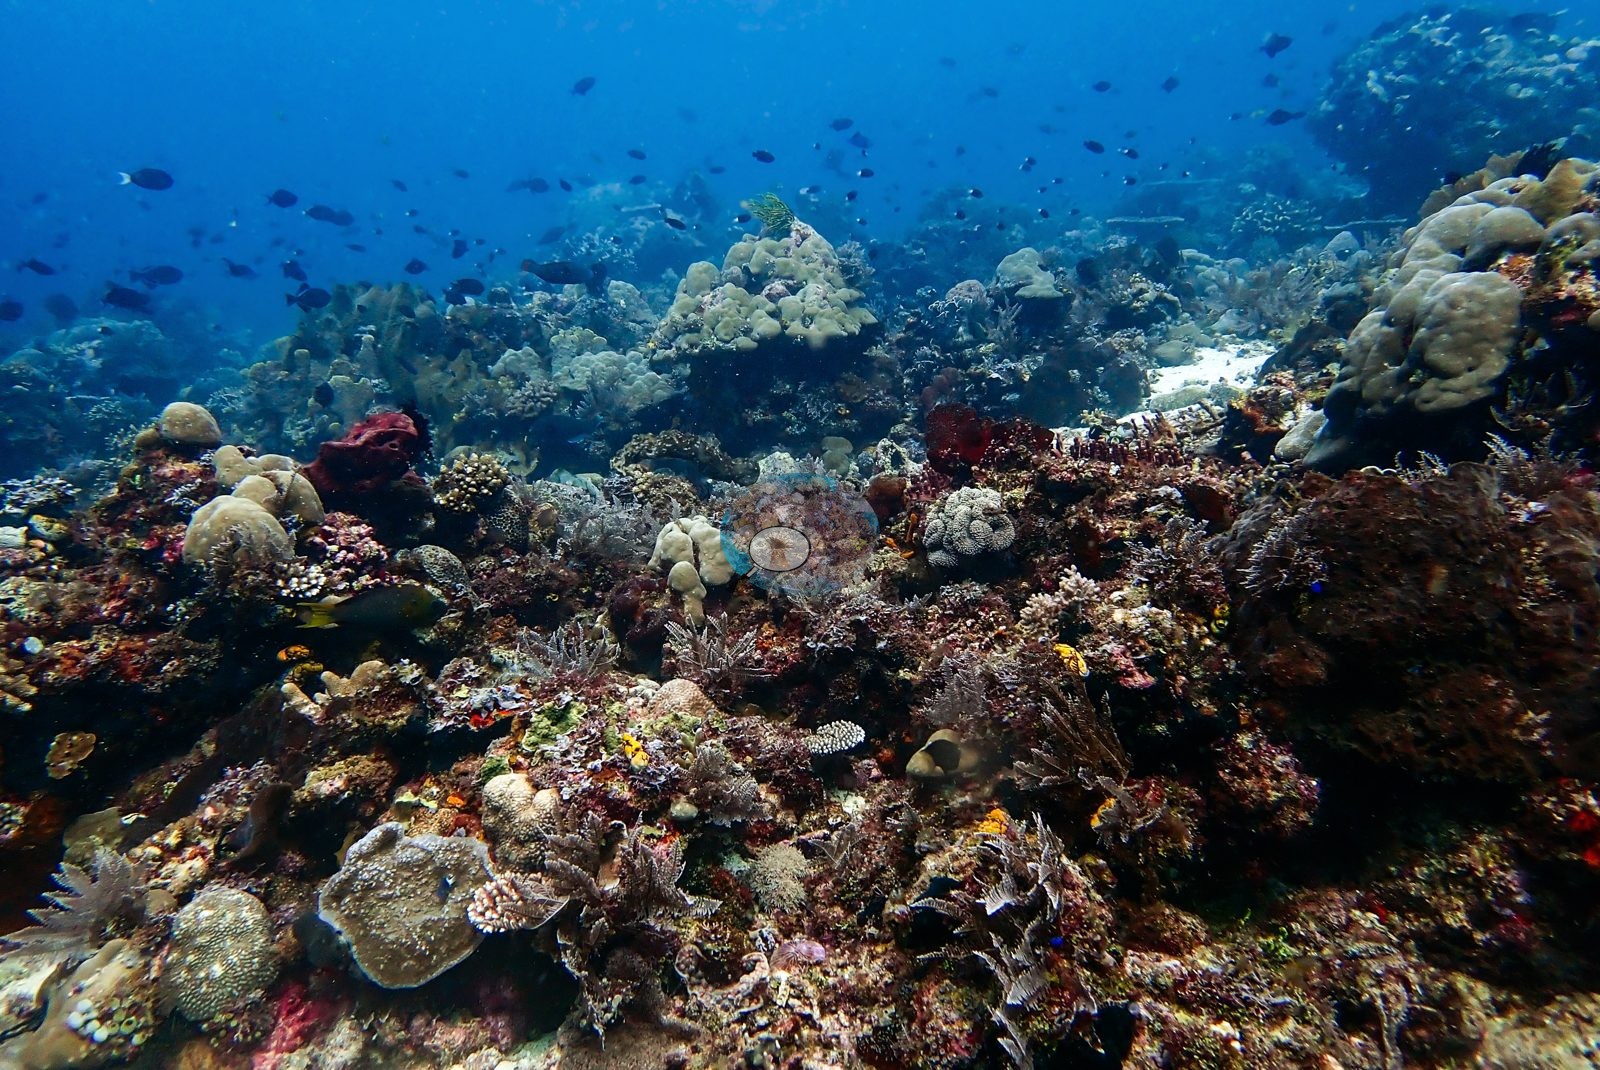
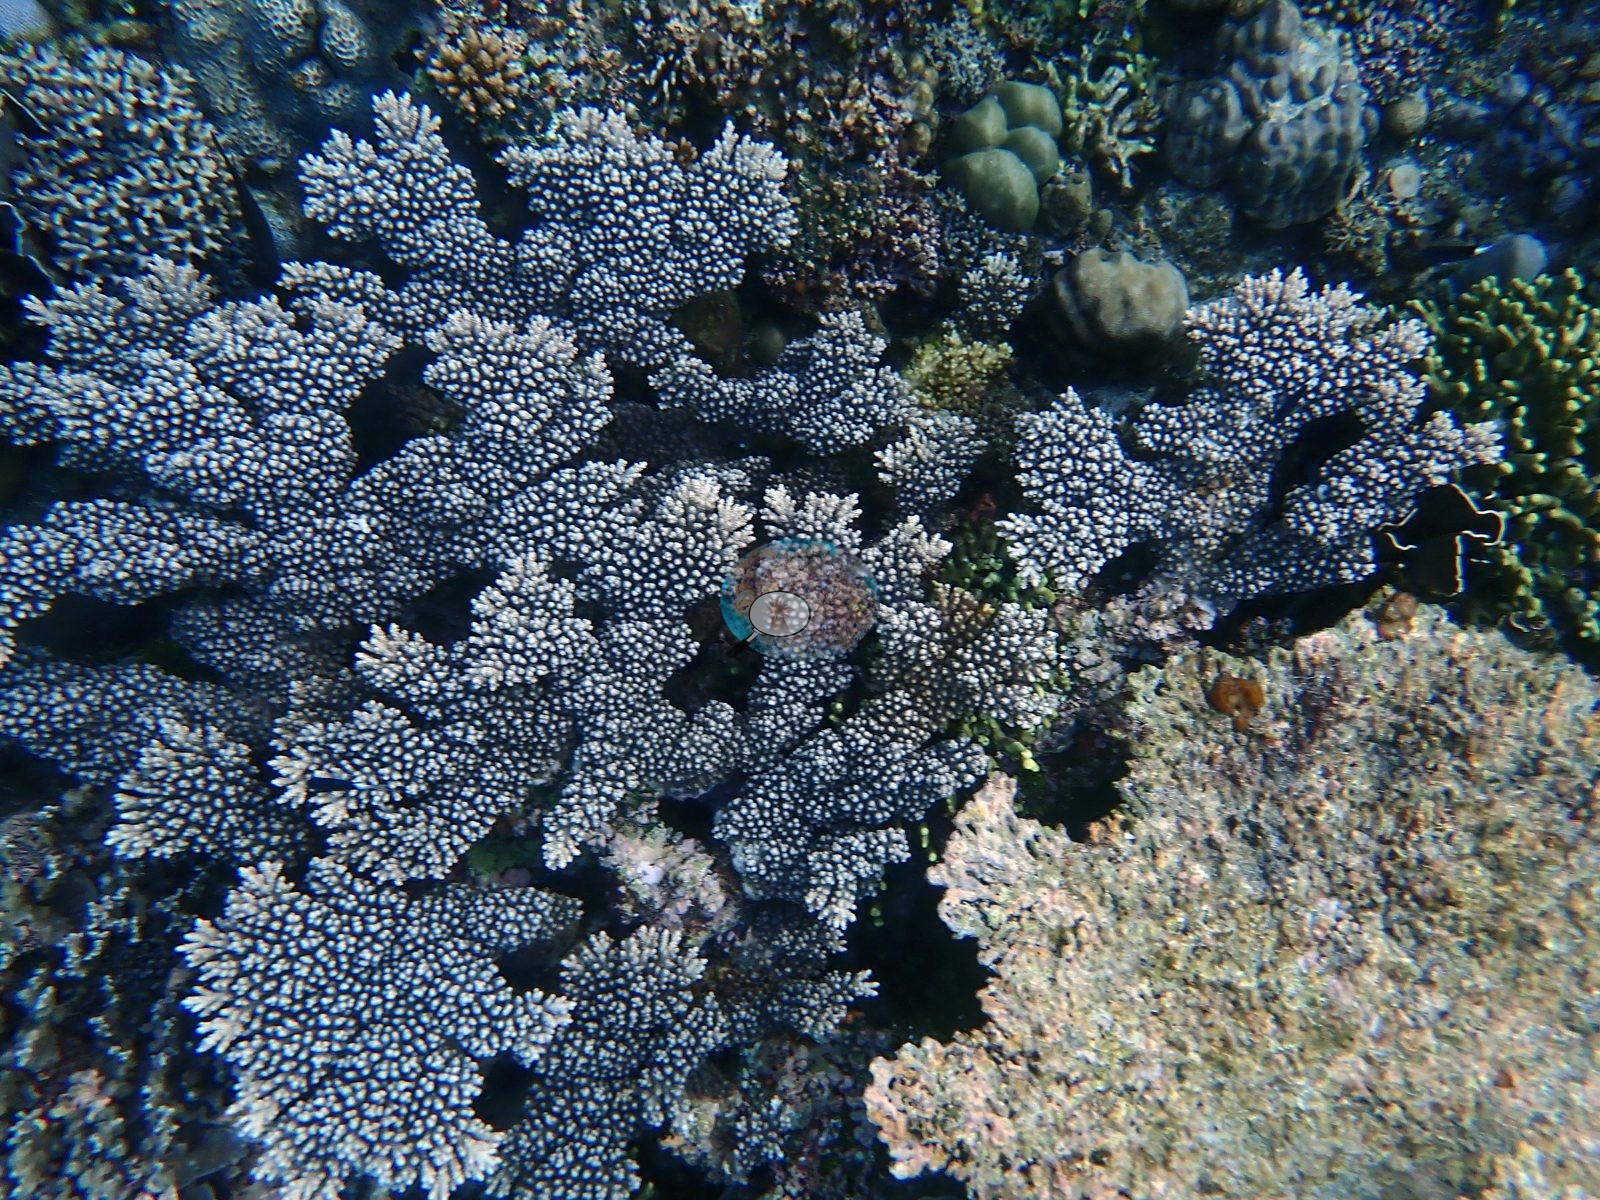
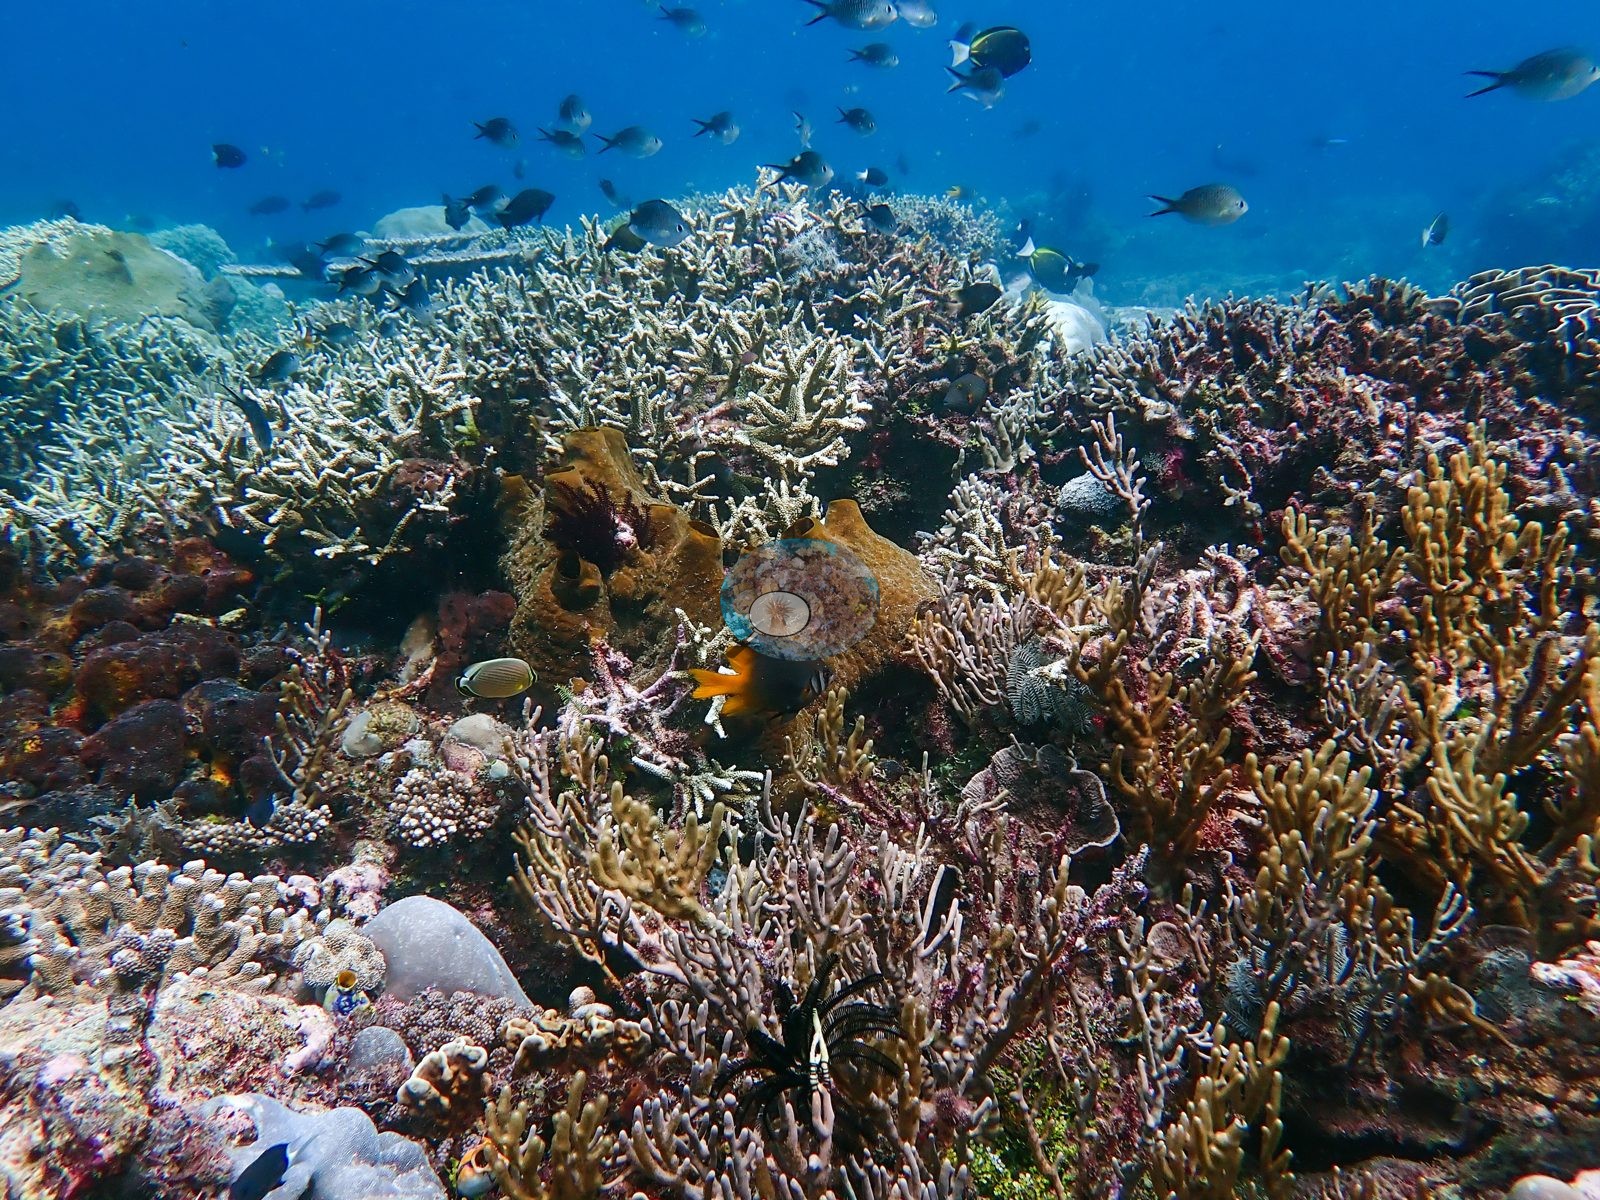
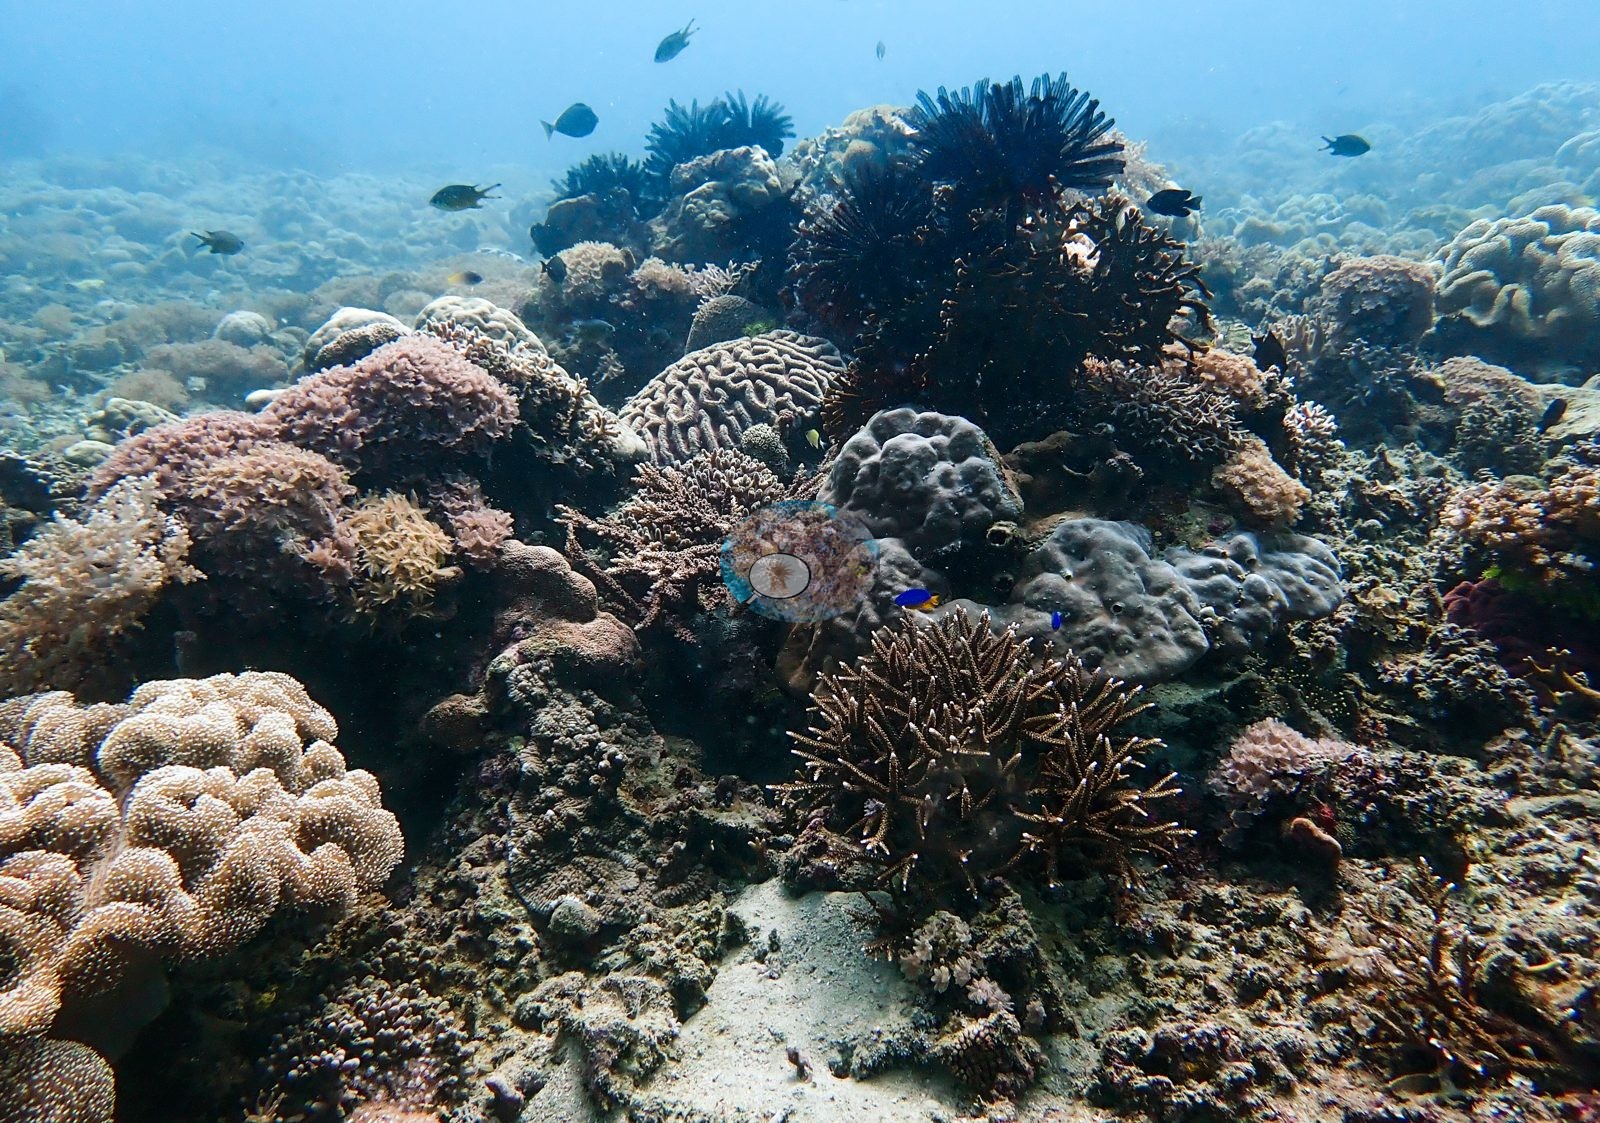
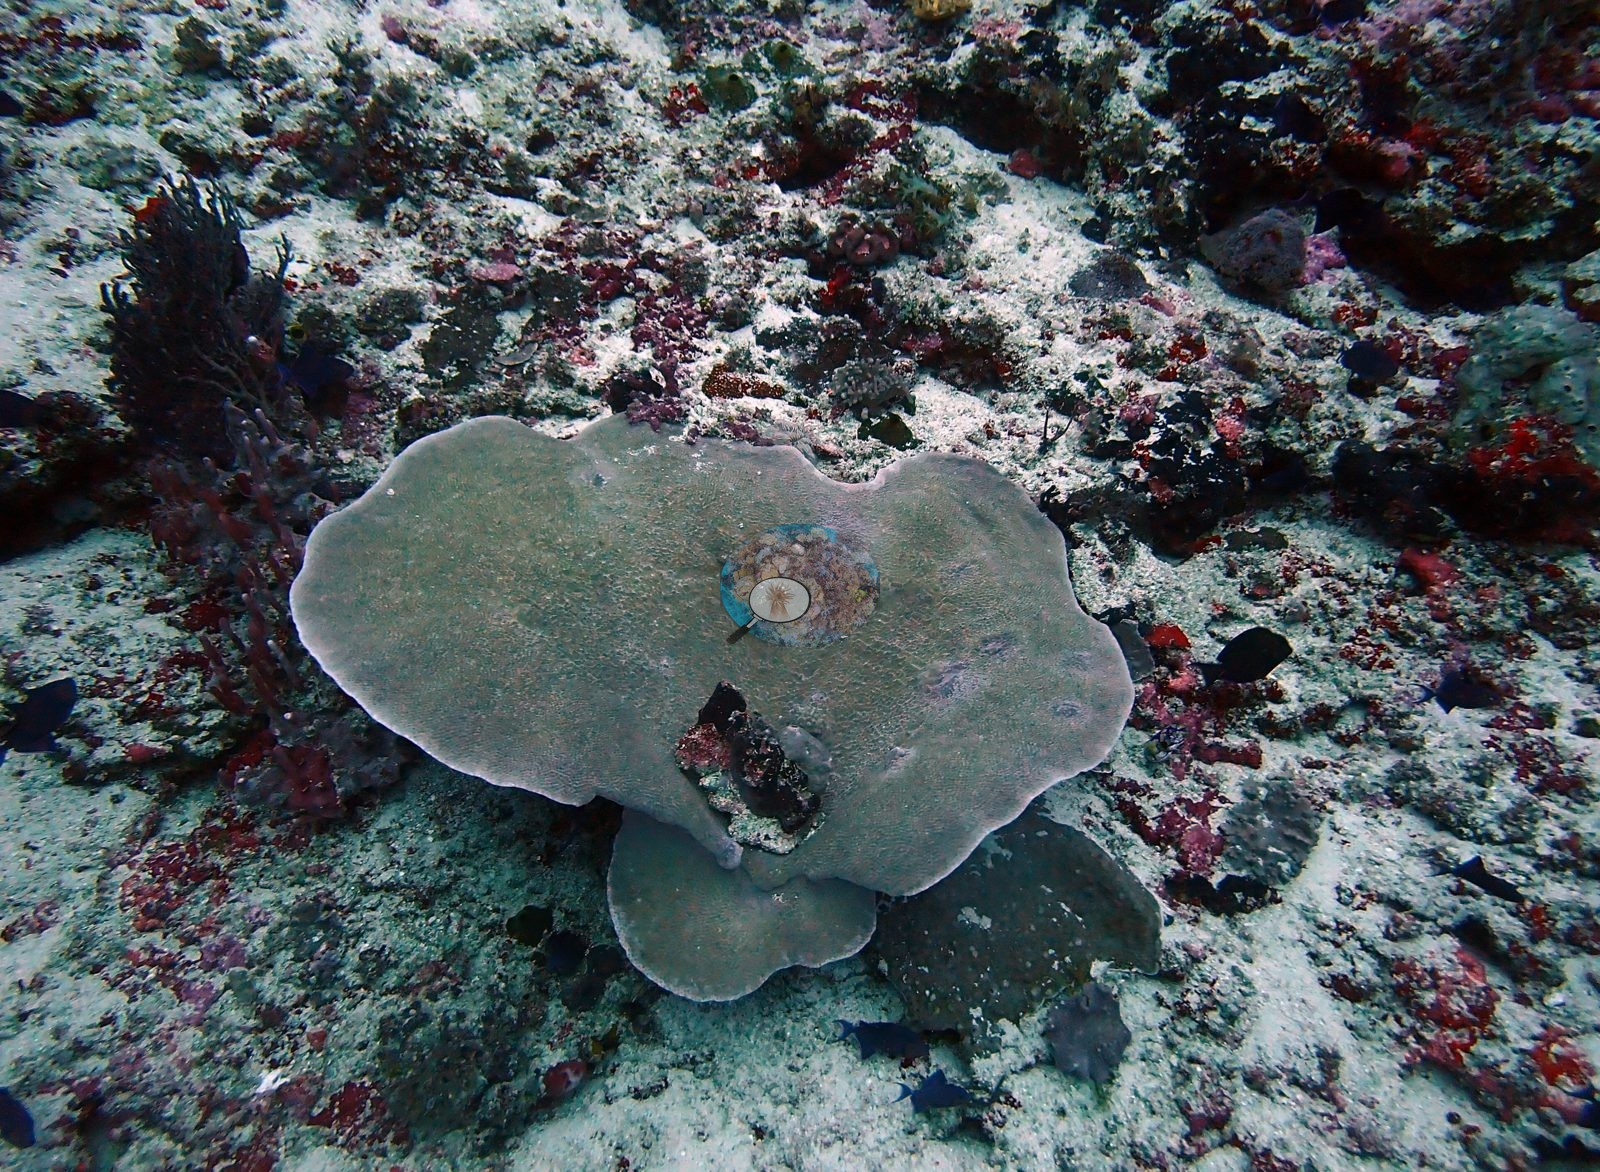
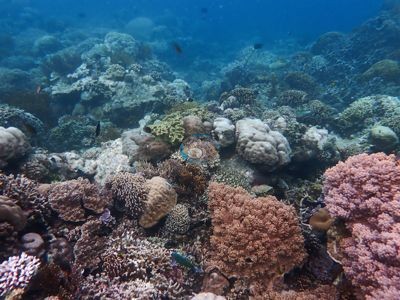
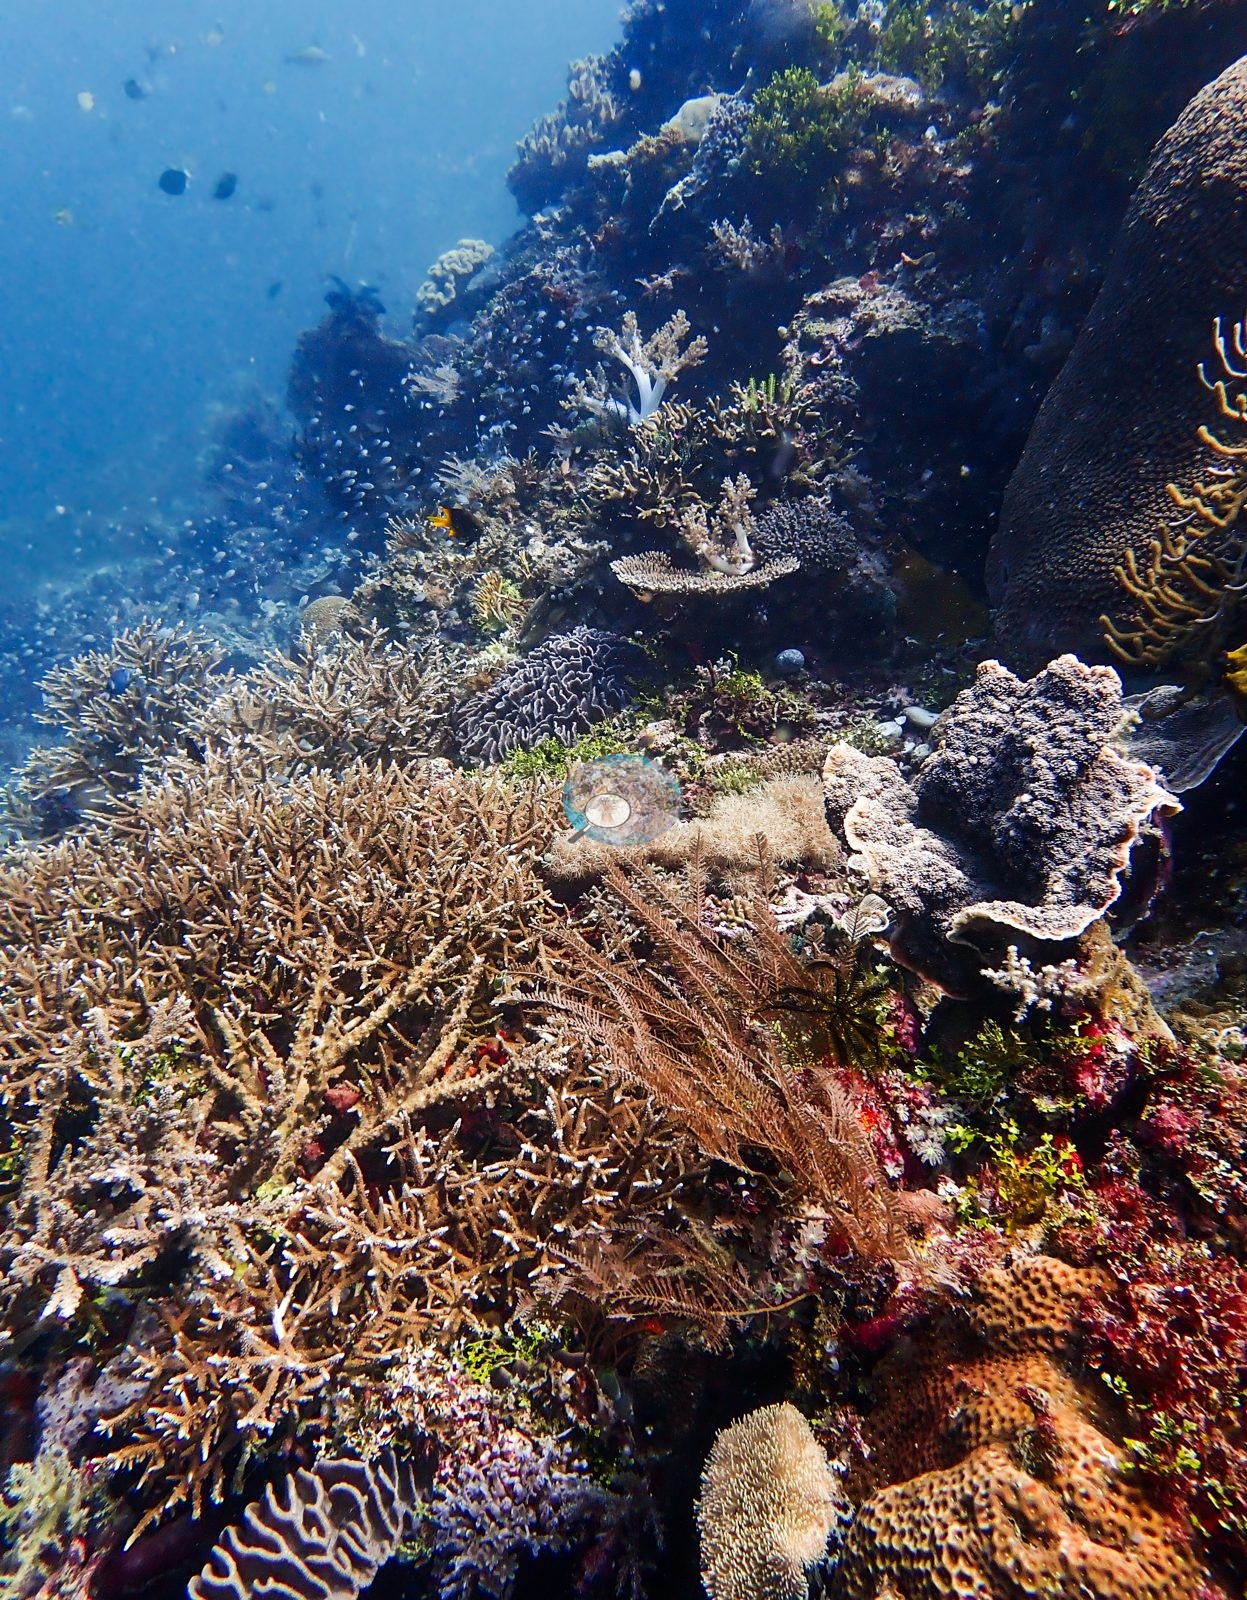
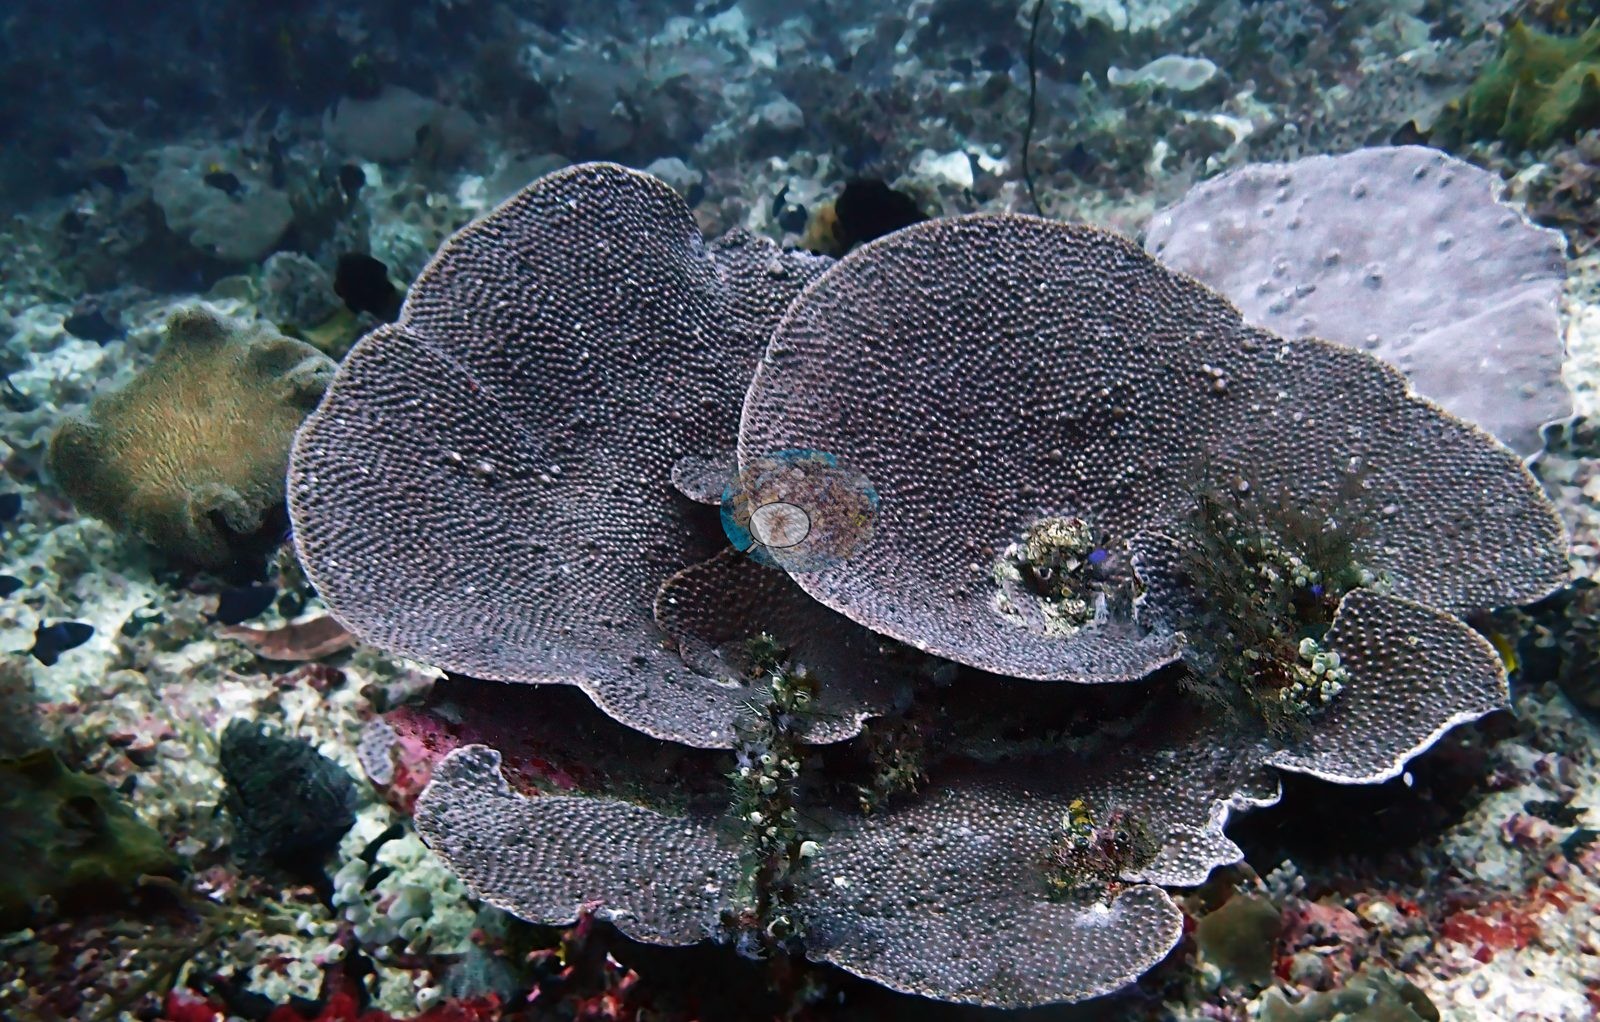
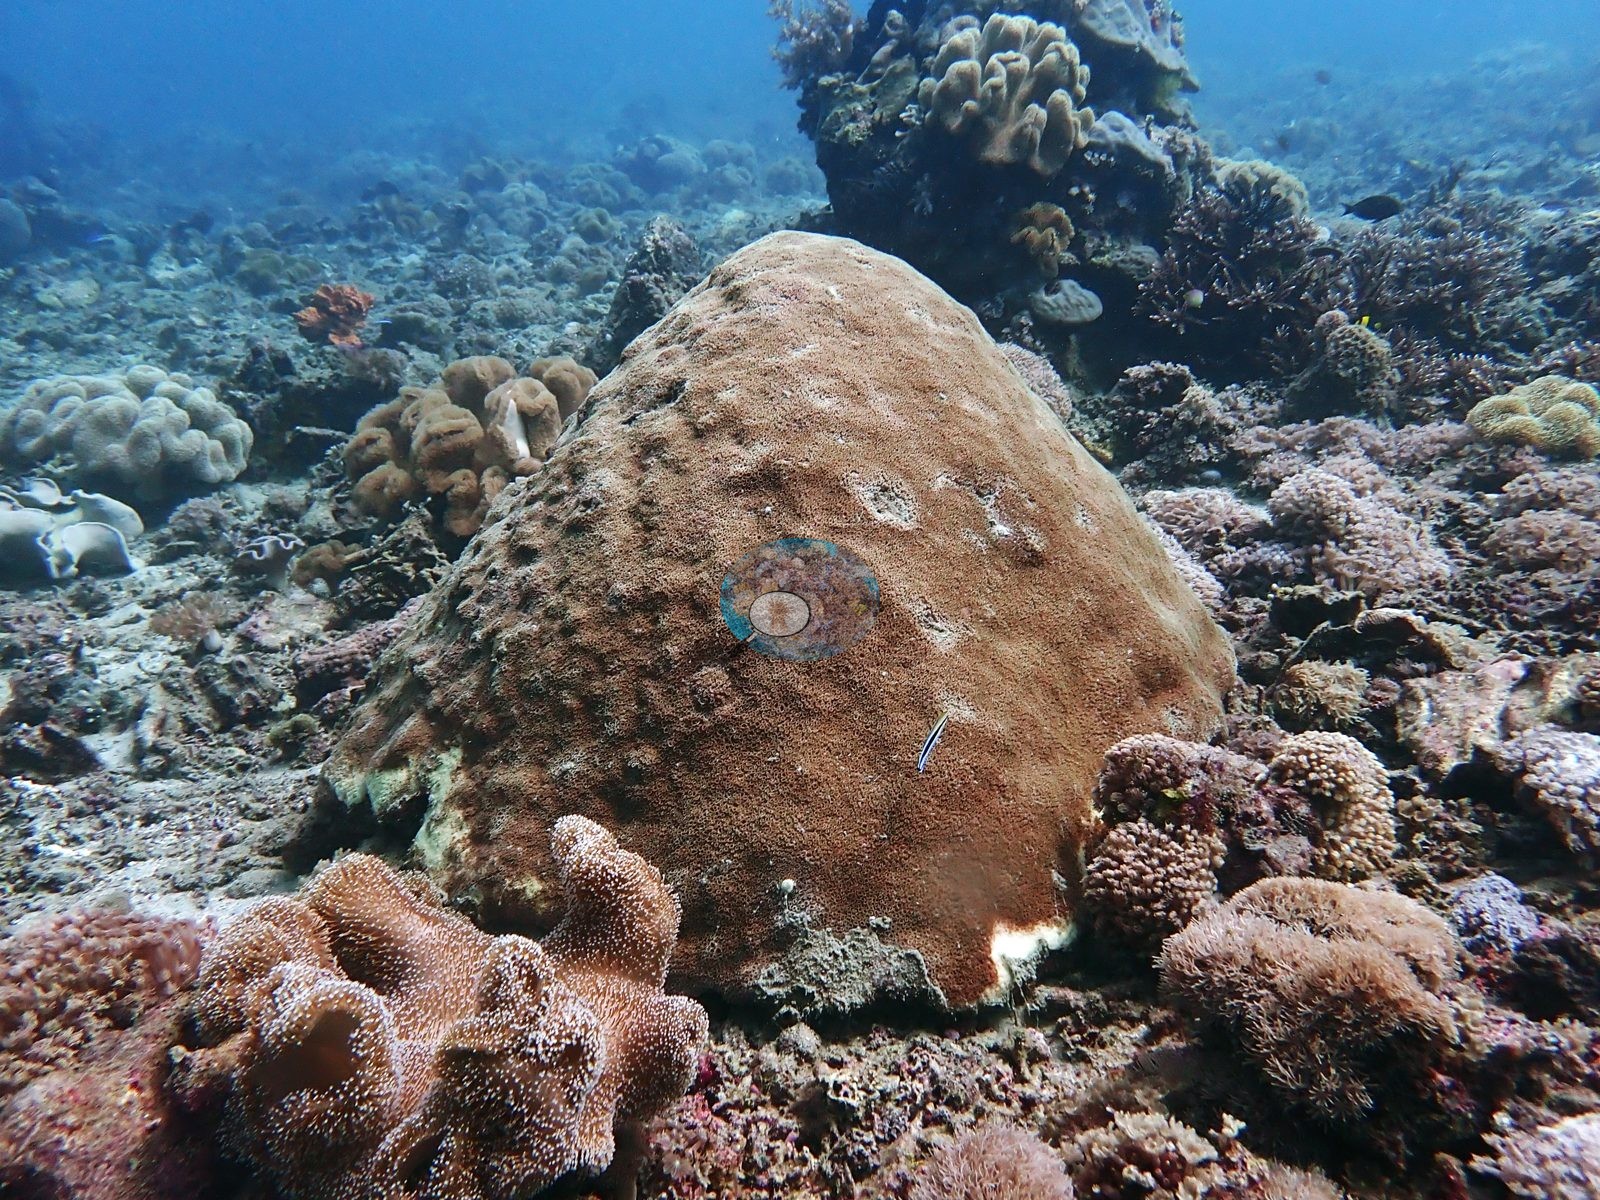
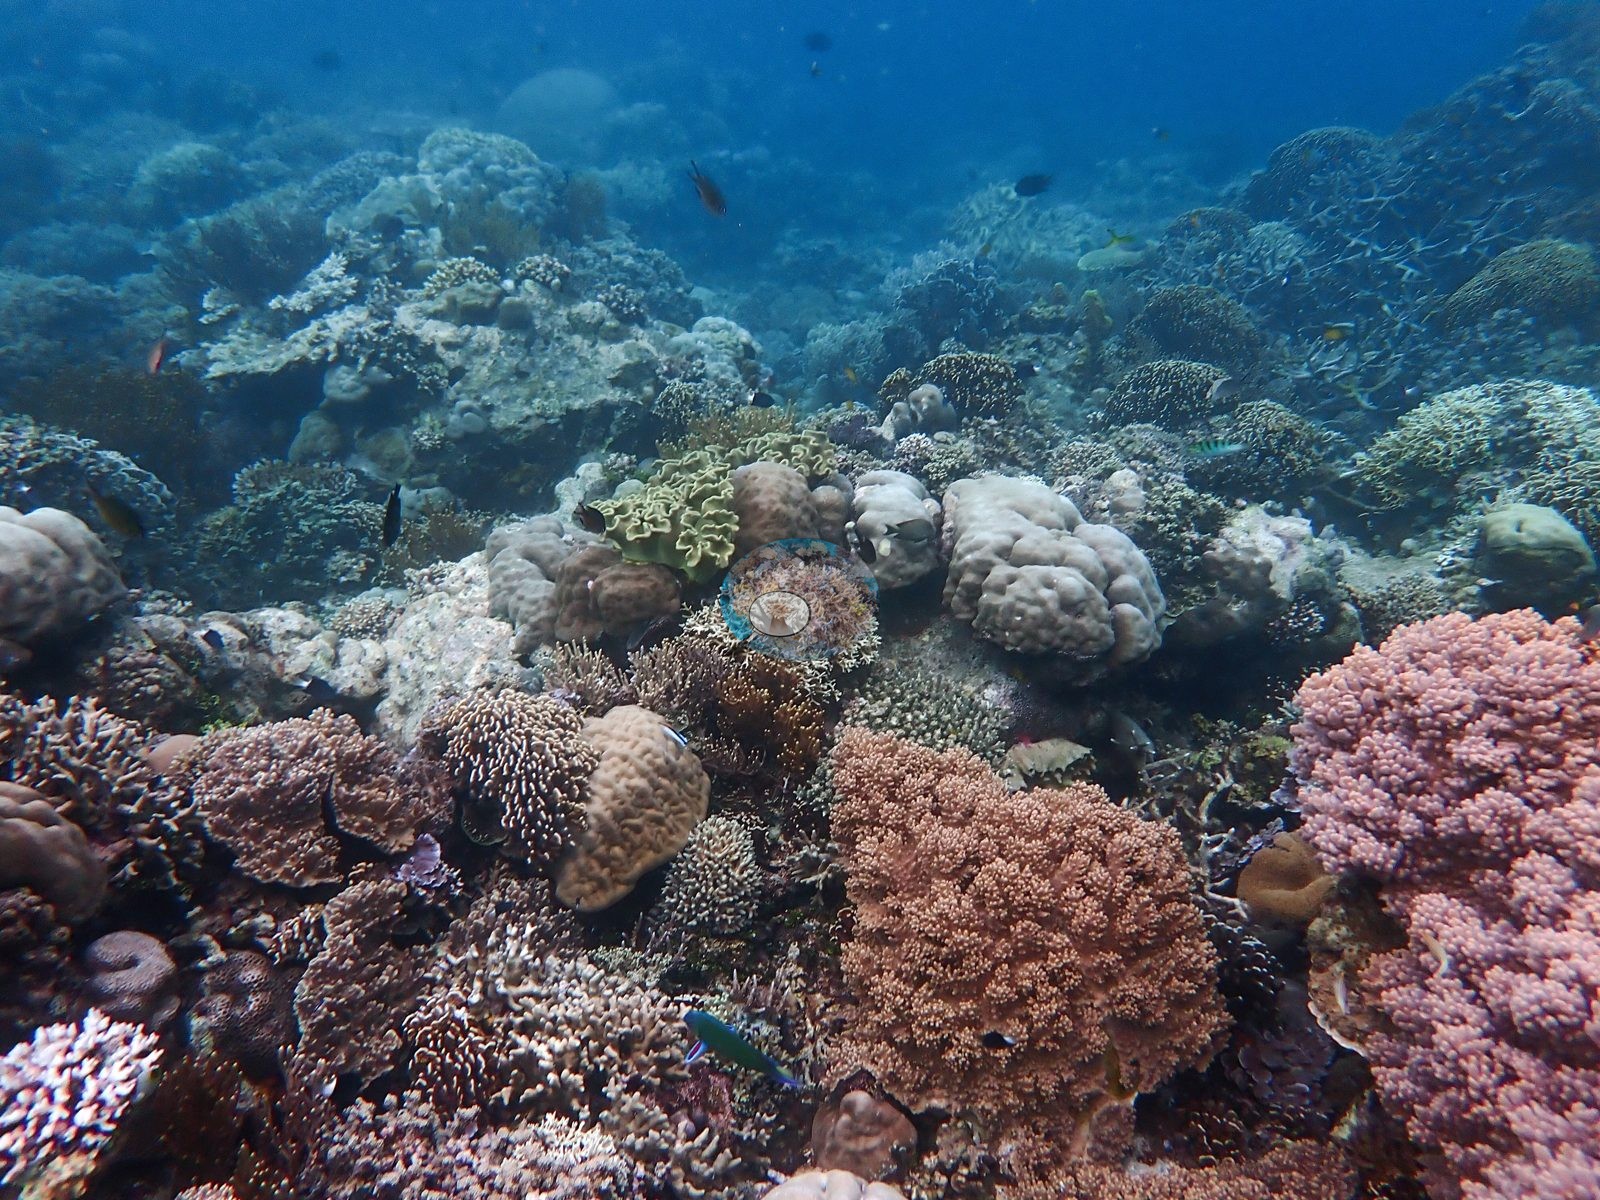
Branching Acropora is the dominant community. Raiketa, Haruine, Biqueli Wall, and the single surviving frame from Watuwai all show near-continuous tan staghorn thickets, often under dense clouds of damselfish, fusiliers, and anthias; at Haruine thousands of small blue damselfish hovered over the thickets. Inner Reef had the widest mix of growth forms, with columnar and lobate Porites, branching and plating Acropora, mauve Pocillopora, and large tube-sponge clusters. Cabbage Patch is named for a colossal dome of folded foliose coral on a sand slope. Pinnacle differed from the rest: a turf-covered framework with scattered Porites heads, plating corals, big finger, and tube sponges, and an unusually high density of feather stars.
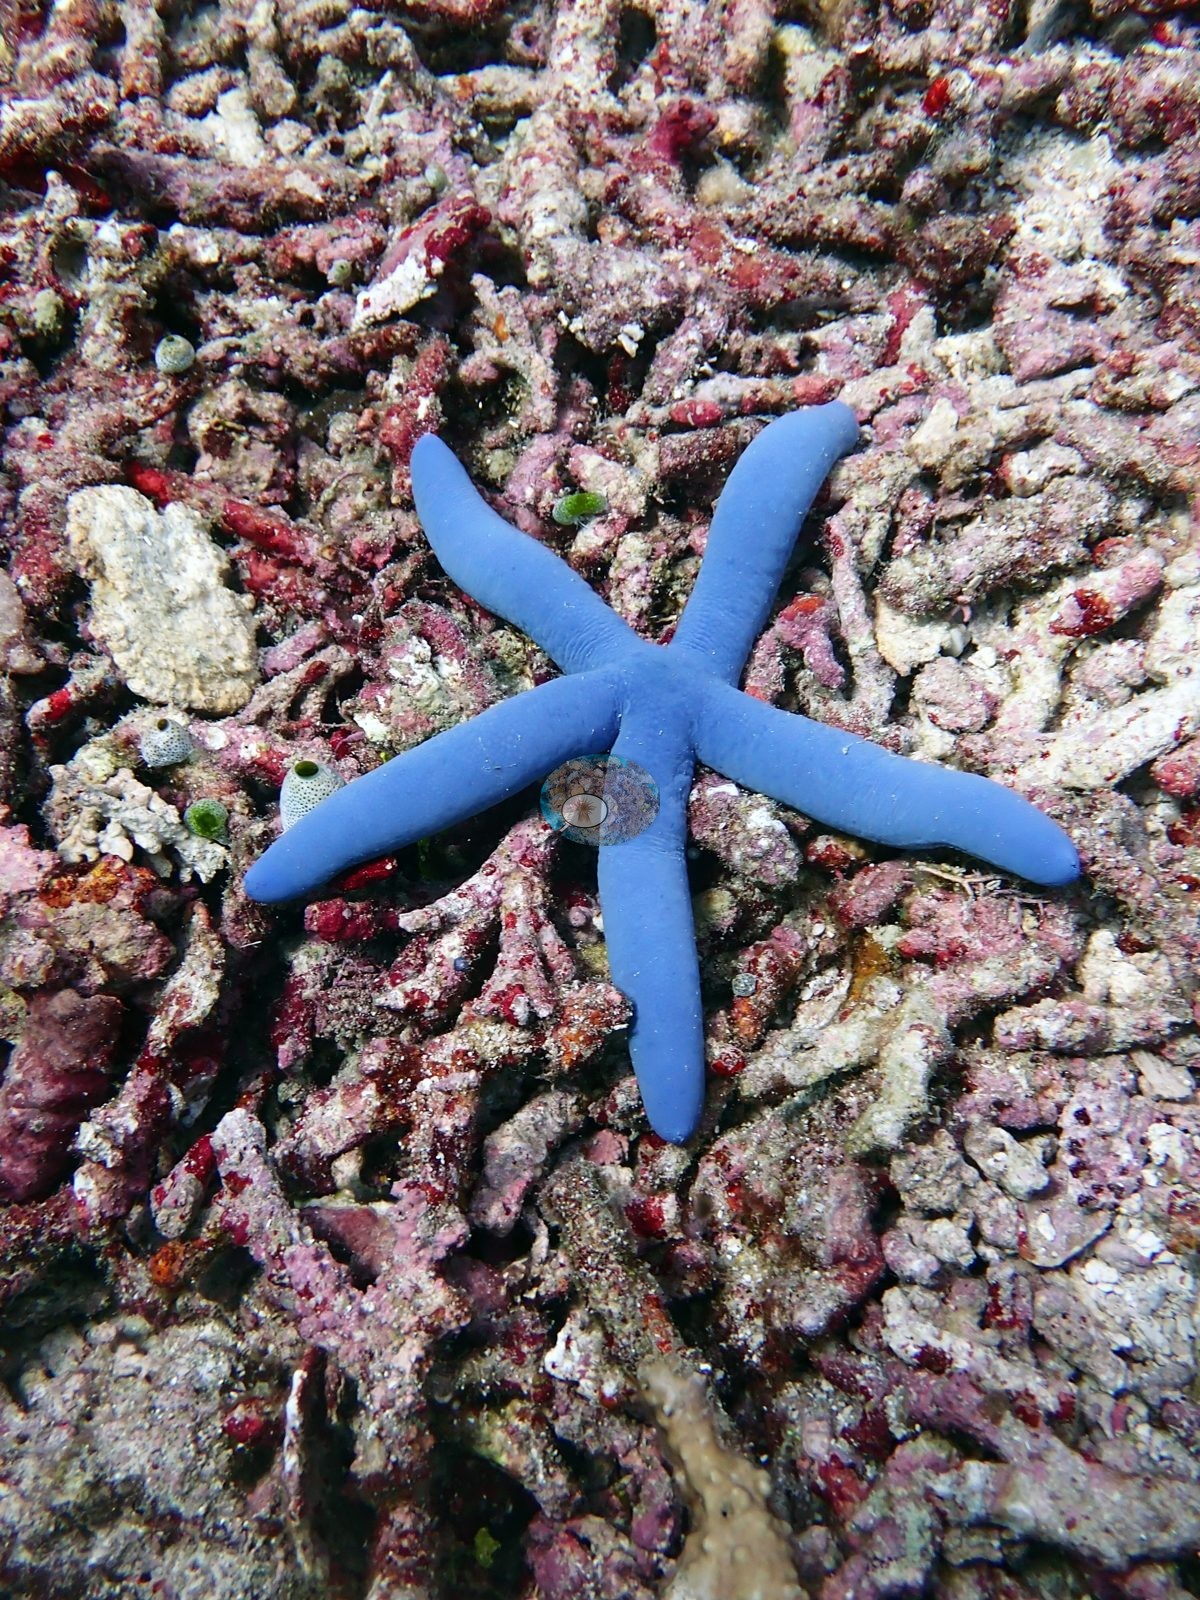
Photo-derived cover estimates ranged from 31.7% at Pinnacle to 44.5% at Inner Reef, where the two computer vision methods differ most (38.4% and 50.6%); Raiketa (41.3%) was the only other station above 40%. Every site mixed dense coral with rubble, sand, or older framework, most starkly at Biqueli Wall, where a single live table coral stood in a broad field of coralline-crusted dead Acropora rubble. No reef-wide bleaching was apparent. Local flags included pale or white colonies at Raiketa, Inner Reef, Pinnacle, and Compass Reef, recent basal tissue loss on a large Porites at Cabbage Patch, and a crown-of-thorns seastar in one Inner Reef frame.
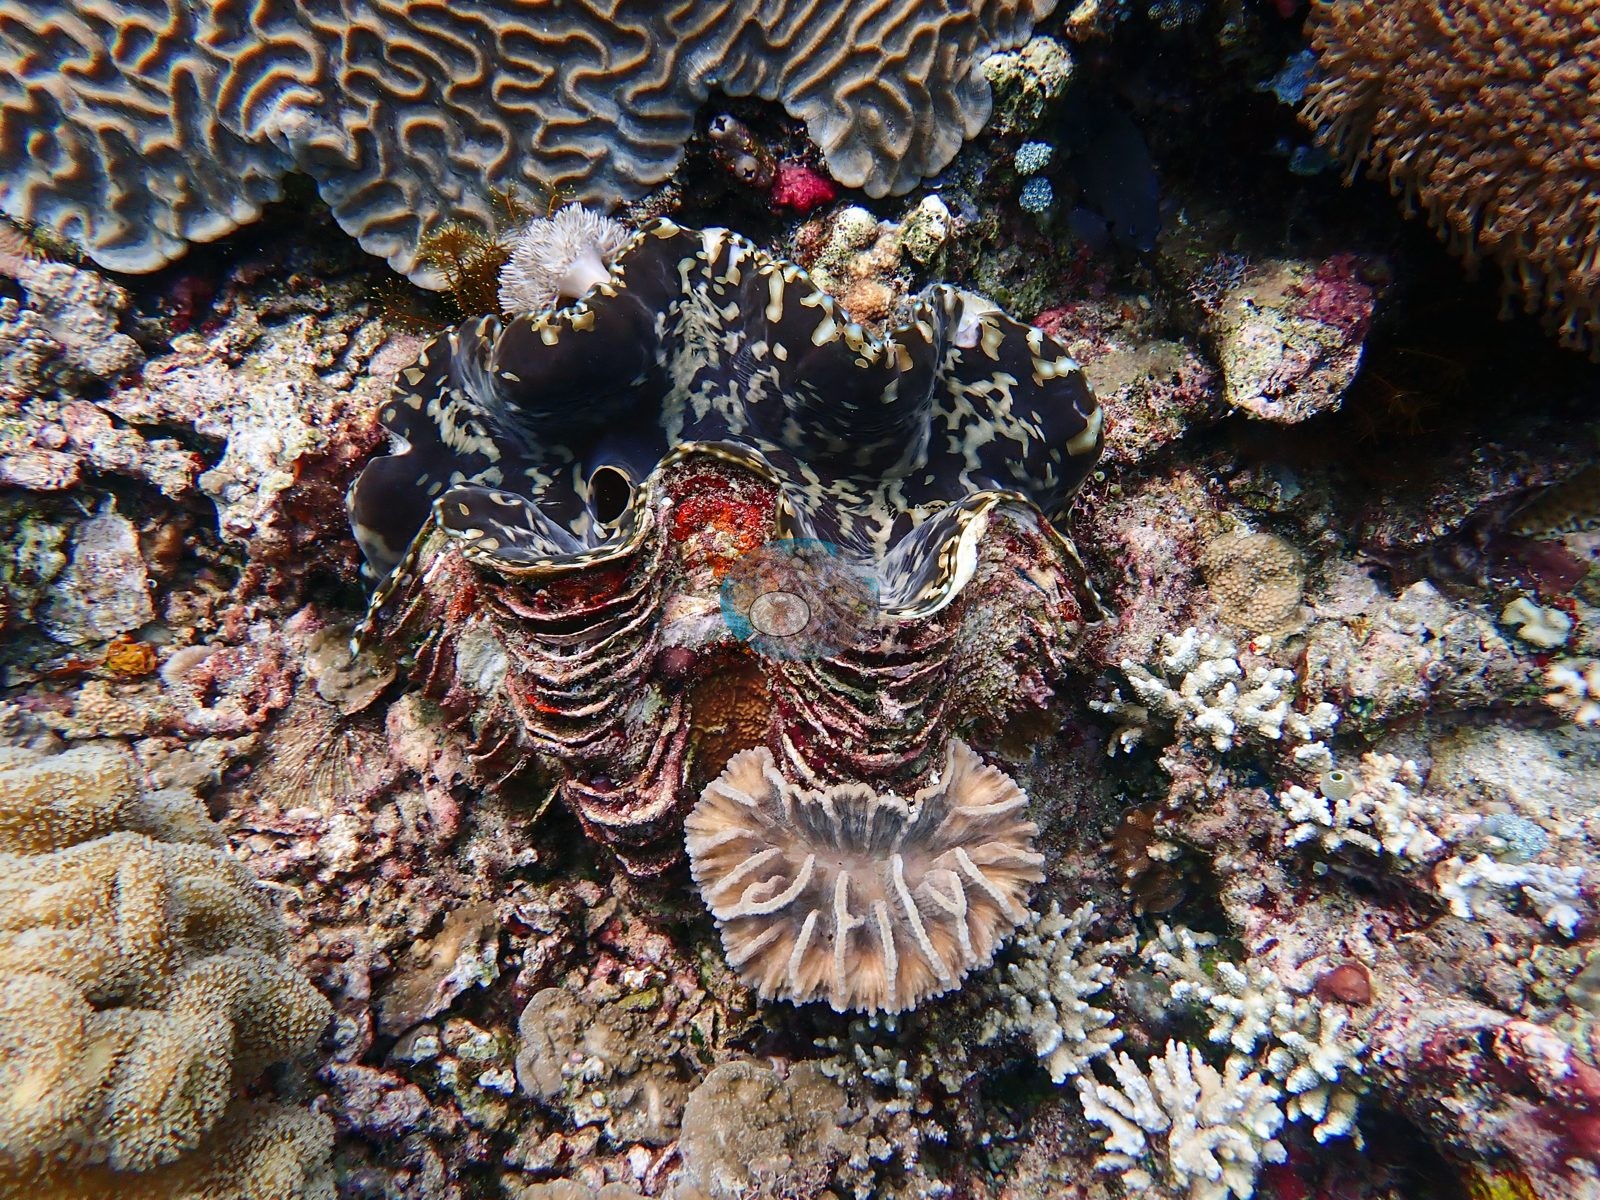
Giant clams were wedged into the framework at Inner Reef, and Compass Reef combined a dense mixed coral garden with a seagrass-fringed flat of small massive colonies.
Highlights
- Eight Atauro sites dived 29 January-1 February 2024, from a 2 m snorkel to 35.7 m
- Near-continuous staghorn Acropora thickets at Raiketa, Haruine, and Biqueli Wall
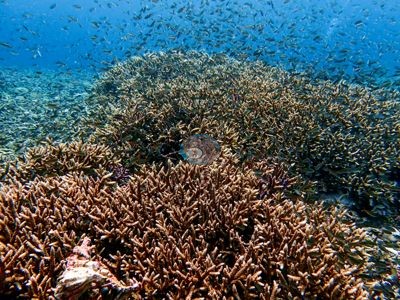 photo: Atauro - Biqueli Wall
 - Inner Reef: the widest mix of growth forms and the highest photo-derived cover (44.5%), with giant clams wedged into the framework
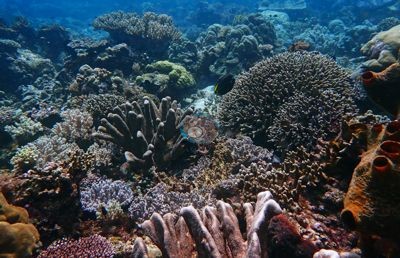 photo: Atauro - Inner Reef
 - Cabbage Patch: a colossal dome of tightly folded foliose coral
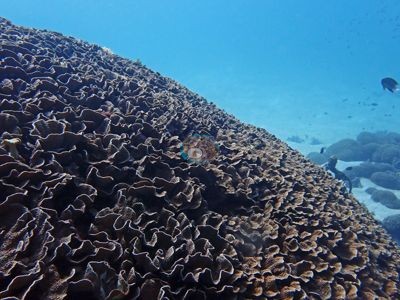 photo: Atauro - Cabbage Patch
 - Pinnacle: a sponge- and crinoid-rich deep reef rather than a coral carpet
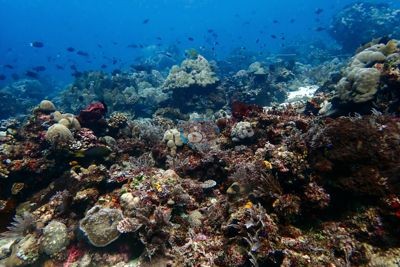 photo: Atauro - Pinnacle
 - Compass Reef: a 2 m snorkel garden with colonies packed edge to edge, beside a seagrass-fringed flat
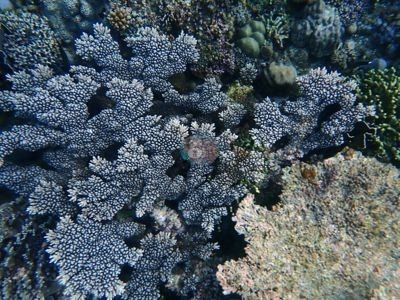 photo: Atauro - Compass Reef
Ne'e tradusaun husi mákina ba sumáriu lian-inglés; testu lian-inglés mak versaun ofisiál ne'ebé bele fiar. AI translation of this summary, low confidence and not yet reviewed by a native speaker; the English is authoritative.
Regional setting
Spalding et al. (2001) la fó relatóriu separadu ka númeru área ahu-ruin nian ba Timor-Leste (East Timor). Ninia kosta mosu iha mapa sira kapítulu Indonézia nian, no Timor tama iha sub-rejiaun ne'ebé sira bolu Moluccas and Irian Jaya, ne'ebé inklui kadeia arkipélagu ki'ik sira iha rohan súl Tasi Banda nian (Banda Sea), ne'ebé la'o husi Timor ba leste to'o Illa Aru (Aru Islands). Sira deskreve sub-rejiaun ne'e nu'udar fatin ho batimetria kompleksu no bee oseániku kle'an ne'ebé barak liu moos, ho illa sira ne'ebé dook malu de'it kilómetru sanulu balun, maibé dala ruma fahe malu husi tasi ne'ebé kle'an liu 1,000 m. Iha Tasi Timor (Timor Sea), korrente tasi nian iha superfísie suli ba oeste durante tinan tomak, no imajen ida husi 1990 iha kapítulu hanesan hatudu atol Luang no Ukenao, ne'ebé iha Timor-Leste nia leste. Souter et al. (2021) relata katak to'o Dezembru 2020, Allen Coral Atlas prodús ona mapa ahu-ruin detalladu ne'ebé bazeia ba satélite ba Tasi Timor no Tasi Arafura (Arafura Sea).
Overview
Pin ualu husi pin sia Timor-Leste nian mak fatin sira iha Illa Ataúru (Atauro Island) nia leet, ho mergullu entre 29 Janeiru no 1 Fevereiru 2024. Pin da-sia mak pin jerál ida ba Illa Ataúru ne'ebé la iha rejistu mergullu rasik. Fatin sira ne'e hahú husi jardín snorkel ho kle'an 2 m iha Compass Reef no Inner Reef ne'ebé la kle'an, to'o foho-lolon ahu-ruin ne'ebé tuun maka'as iha Raiketa, teras leten husi Biqueli Wall, no Pinnacle ne'ebé kle'an no nakukun, ne'ebé mergullu to'o 35.7 m. Iha Haruine, mergullu iha loron no mós iha kalan.
Komunidade ne'ebé domina mak Acropora ho sanak (branching). Raiketa, Haruine, Biqueli Wall, no foto ida de'it ne'ebé sei iha husi Watuwai, hotu-hotu hatudu staghorn kór-kafé kinur ne'ebé moris metin hamutuk no besik kontínuu, dala barak iha okos kalohan ikan barak, hanesan damselfish, fusilier, no anthias; iha Haruine, damselfish azúl ki'ik rihun ba rihun hela iha staghorn sira-nia leten. Inner Reef iha forma moris (growth forms) ne'ebé varia liu, ho Porites kolunár no lobadu, Acropora ho sanak no forma prato, Pocillopora kór-roxu mamar, no grupu boot esponja tubu nian. Cabbage Patch hetan naran husi kúpula boot tebes ida husi ahu-ruin foliose ne'ebé dobra-dobra, iha rai-henek ne'ebé tuun. Pinnacle la hanesan fatin seluk: estrutura ne'ebé turf taka, ho ulun Porites ne'ebé fahe-fahe, ahu-ruin forma prato, esponja liman-fuan no tubu ne'ebé boot, no densidade fitun-tasi penas (feather stars) ne'ebé aas liu baibain.
Estimativa kobertura husi foto hahú husi 30.1% iha Biqueli Wall to'o 48.5% iha Inner Reef, fatin ne'ebé estimativa rua la hanesan maka'as. Fatin hotu-hotu kahur ahu-ruin mahar ho rubble (ahu-ruin mate ne'ebé fakar), rai-henek, ka estrutura tuan, liuliu iha Biqueli Wall, fatin ne'ebé ahu-ruin meza moris ida de'it hamriik iha kampu luan ida husi rubble Acropora mate ne'ebé alga koralina taka. La hatudu bleaching (ahu-ruin sai mutin) iha ahu-ruin tomak. Sinál lokál sira inklui kolónia mutin-kinur ka mutin iha Raiketa, Inner Reef, Pinnacle, no Compass Reef, lakon tesidu foin daudaun iha Porites boot ida nia baze iha Cabbage Patch, no fitun-tasi crown-of-thorns ida iha foto ida husi Inner Reef.
Kima (giant clam) tama metin iha estrutura ahu-ruin nian iha Inner Reef, no Compass Reef kombina jardín ahu-ruin kahur ne'ebé mahar ho área rata ida ne'ebé du'ut-tasi haleu, ho kolónia masivu ki'ik sira.
Highlights
- Fatin ualu iha Ataúru, mergullu 29 Janeiru-1 Fevereiru 2024, husi snorkel 2 m to'o 35.7 m
- Staghorn Acropora ne'ebé moris metin hamutuk no besik kontínuu iha Raiketa, Haruine, no Biqueli Wall
 photo: Atauro - Biqueli Wall
 - Inner Reef: forma moris ne'ebé varia liu no kobertura husi foto ne'ebé aas liu (48.5%)
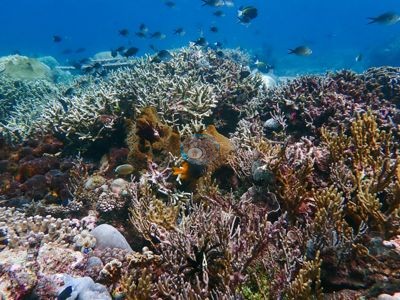 photo: Atauro - Inner Reef
 - Cabbage Patch: kúpula boot tebes ida husi ahu-ruin foliose ne'ebé dobra metin
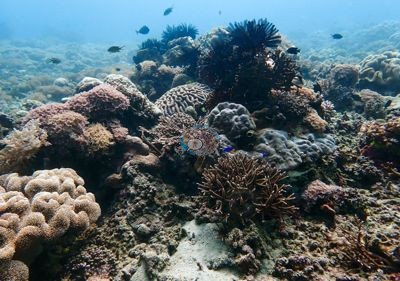 photo: Atauro - Cabbage Patch
 - Pinnacle: ahu-ruin kle'an ne'ebé riku ho esponja no krinóide, la'ós tapete ahu-ruin
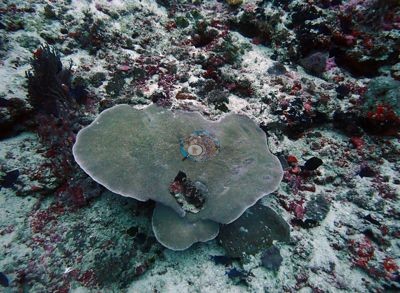 photo: Atauro - Pinnacle
 - Ikan ki'ik barak tebes iha staghorn sira-nia leten iha fatin ne'ebé la kle'an
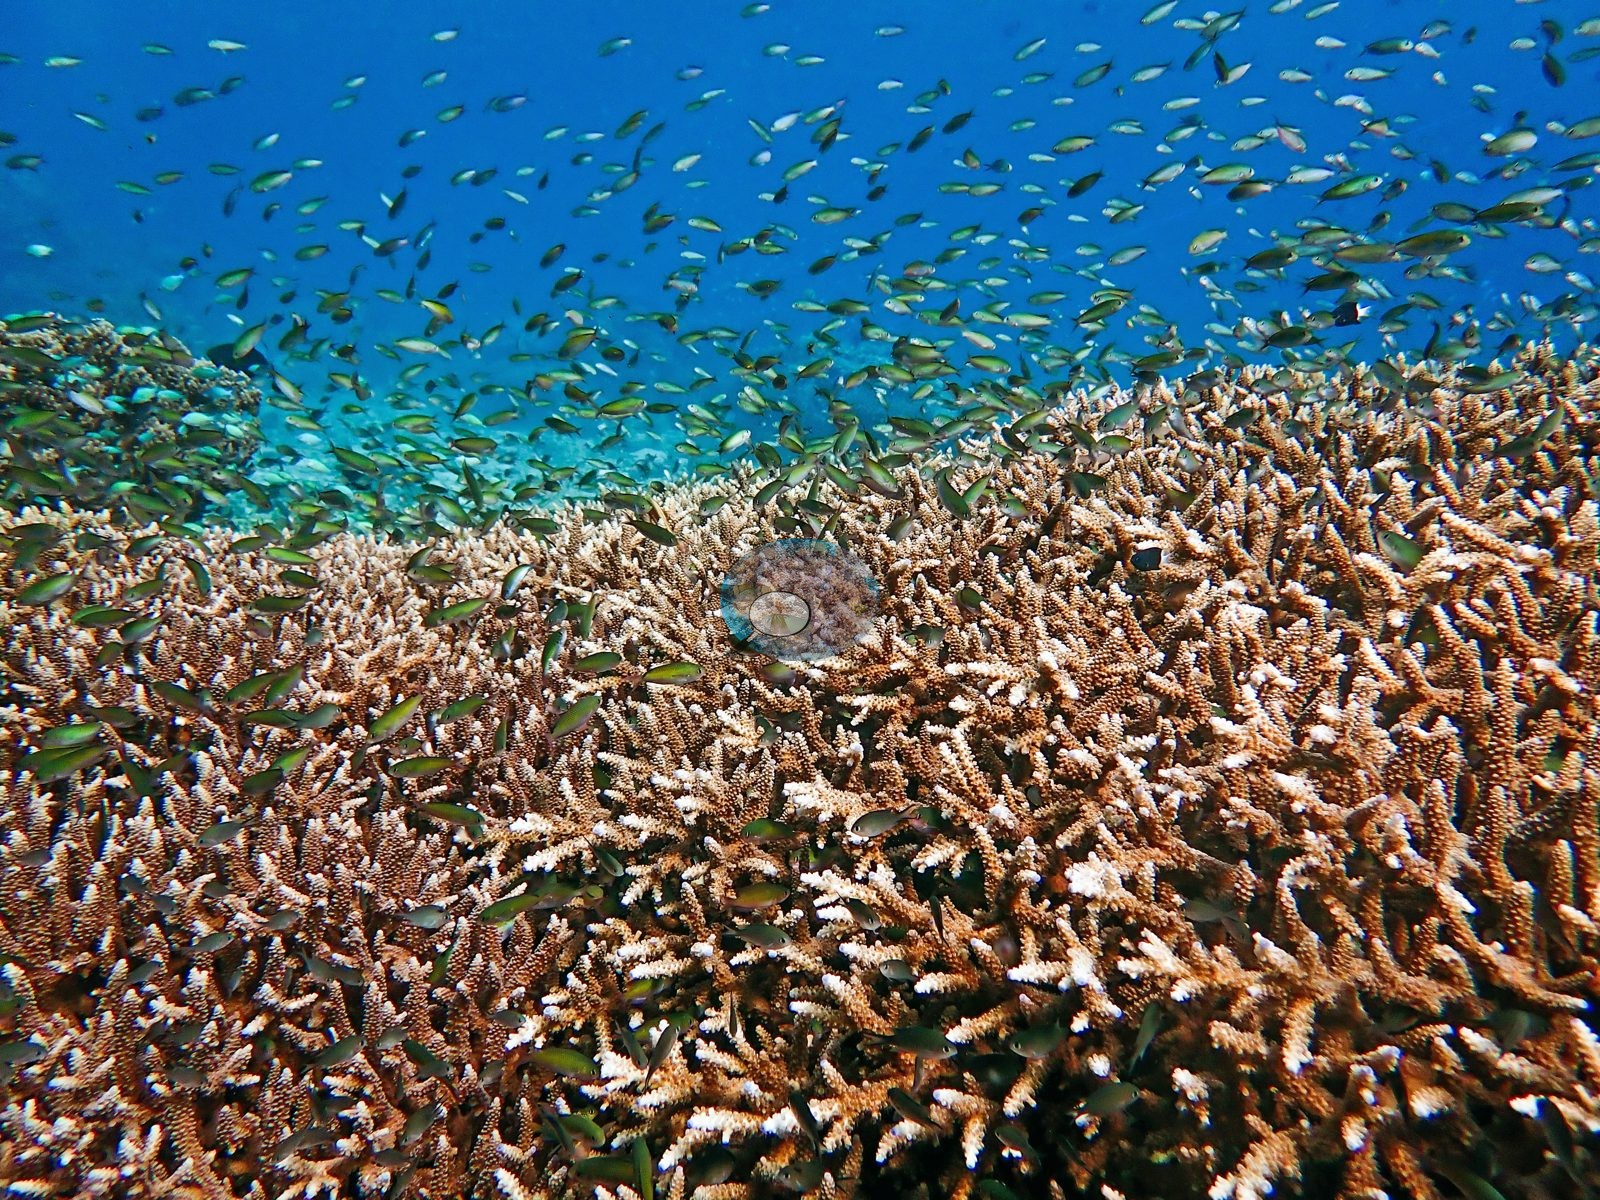
Notable observations
- Atauro - Raiketa: A small number of pale-to-white colonies in the background; cannot be separated into bleaching, recent mortality, or pale pigment (pin also records a recurring pale-to-white branching signal across roughly a third of an earlier reviewed sequence)
- Atauro - Biqueli Wall: A single live table coral isolated within a broad field of dead, coralline-bound Acropora rubble (recorded from the larger gallery; the pin's four attached frames show coralline-crusted rubble beside living thickets). No bleaching, disease, or predation scars in the attached frames
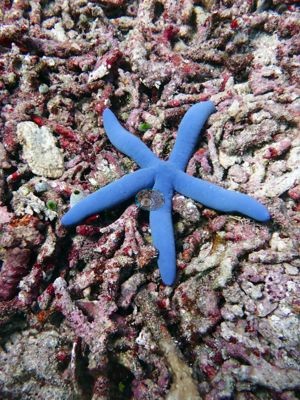
- Atauro - Inner Reef: A crown-of-thorns seastar present in one frame; pale-to-white patches and small dead or overgrown lesions across roughly a fifth of the reviewed frames (both from the larger gallery, not the four attached frames)
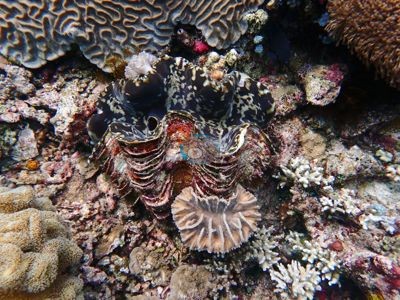
- Atauro - Pinnacle: At least three colonies with conspicuous whitening (a branching soft coral, a table Acropora with a bleached patch, a second table Acropora); one small ambiguous white patch (bleached nubbin vs dead skeleton chip)
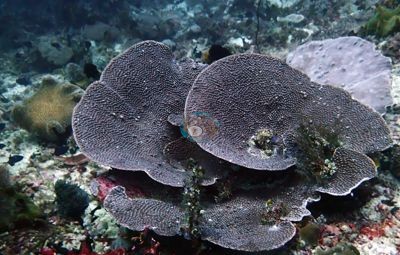
- Atauro - Cabbage Patch: Exposed white skeleton around the base of a large massive Porites, consistent with recent basal tissue loss (cause not determinable)
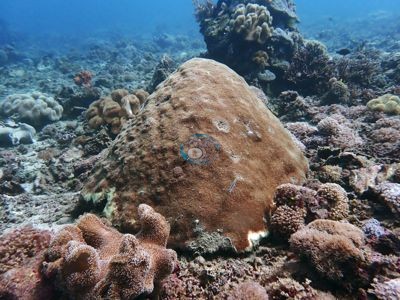
- Atauro - Compass Reef: One pale gray-white branching colony among pigmented neighbors - pale pigment vs bleaching vs recent mortality unresolved
Coral cover over time (pooled)
Sites in this region
- Atauro - Biqueli Wall — 27% coral cover
- Atauro - Cabbage Patch — 37% coral cover
- Atauro - Compass Reef — 38% coral cover
- Atauro - Haruine — 41% coral cover
- Atauro - Inner Reef — 45% coral cover
- Atauro - Pinnacle — 20% coral cover
- Atauro - Raiketa — 46% coral cover
- Atauro - Watuwai
Nearby external survey stations
17 independent survey records within 5 km of a site in this region (deduplicated across sites).
Show all 17 records
- Coral Triangle Center (CTC) — Baroana (08) (2017): 35% hard coral cover, 4.22 km from Atauro - Biqueli Wall
- Coral Triangle Center (CTC) — Beloi (10) (2017): 49% hard coral cover, 0.29 km from Atauro - Cabbage Patch
- Coral Triangle Center (CTC) — Lampian (12) (2017): 47% hard coral cover, 4.00 km from Atauro - Raiketa
- Coral Triangle Center (CTC) — Outer Reef (09) (2017): 41% hard coral cover, 0.75 km from Atauro - Haruine
- Coral Triangle Center (CTC) — Vila (11) (2017): 36% hard coral cover, 1.29 km from Atauro - Raiketa
- Reef Check — Haru ina (2017): 53% hard coral cover, 0.67 km from Atauro - Haruine
- Reef Check — North of Tanjung Reta (2004): 44% hard coral cover, 0.13 km from Atauro - Biqueli Wall
- Reef Check — Rai keta rala (2017): 39% hard coral cover, 0.32 km from Atauro - Raiketa
- Reef Check — Rai keta tungu (2017): 65% hard coral cover, 0.09 km from Atauro - Watuwai
- Reef Check — South of Barstool (2004): 25% hard coral cover, 2.02 km from Atauro - Biqueli Wall
- Reef Check — South of Tanjung Reta (2004): 33% hard coral cover, 0.38 km from Atauro - Pinnacle
- Reef Check — Uaro-Ana (Baru-ana) (2017): 61% hard coral cover, 4.63 km from Atauro - Biqueli Wall
- Reef Check — Vila South (2017): 25% hard coral cover, 3.17 km from Atauro - Raiketa
- Reef Check — Watu ai (2017): 49% hard coral cover, 0.36 km from Atauro - Raiketa
- XL Catlin Seaview Survey — transect 30013 (2014): 13% hard coral cover, 0.41 km from Atauro - Biqueli Wall
- XL Catlin Seaview Survey — transect 30014 (2014): 17% hard coral cover, 1.18 km from Atauro - Pinnacle
- XL Catlin Seaview Survey — transect 30015 (2014): 21% hard coral cover, 0.21 km from Atauro - Cabbage Patch
All images from Coral Reef Diagnostics. Data are from Coral Reef Diagnostics and Reef Check Foundation and XL Catlin Seaview Survey (University of Queensland).
 © Coral Reef Diagnostics.
References
- Souter D, et al. (eds) (2021) Status of Coral Reefs of the World: 2020. International Coral Reef Initiative / Global Coral Reef Monitoring Network. [PDF]
- Spalding MD, et al. (2001) World Atlas of Coral Reefs. University of California Press, Berkeley. [PDF]