
Regional summary of 7 dive sites. Figures are averages across the sites that report them (n = sites with a value); each site's own page has its individual values.
⬇ Download this region as a report card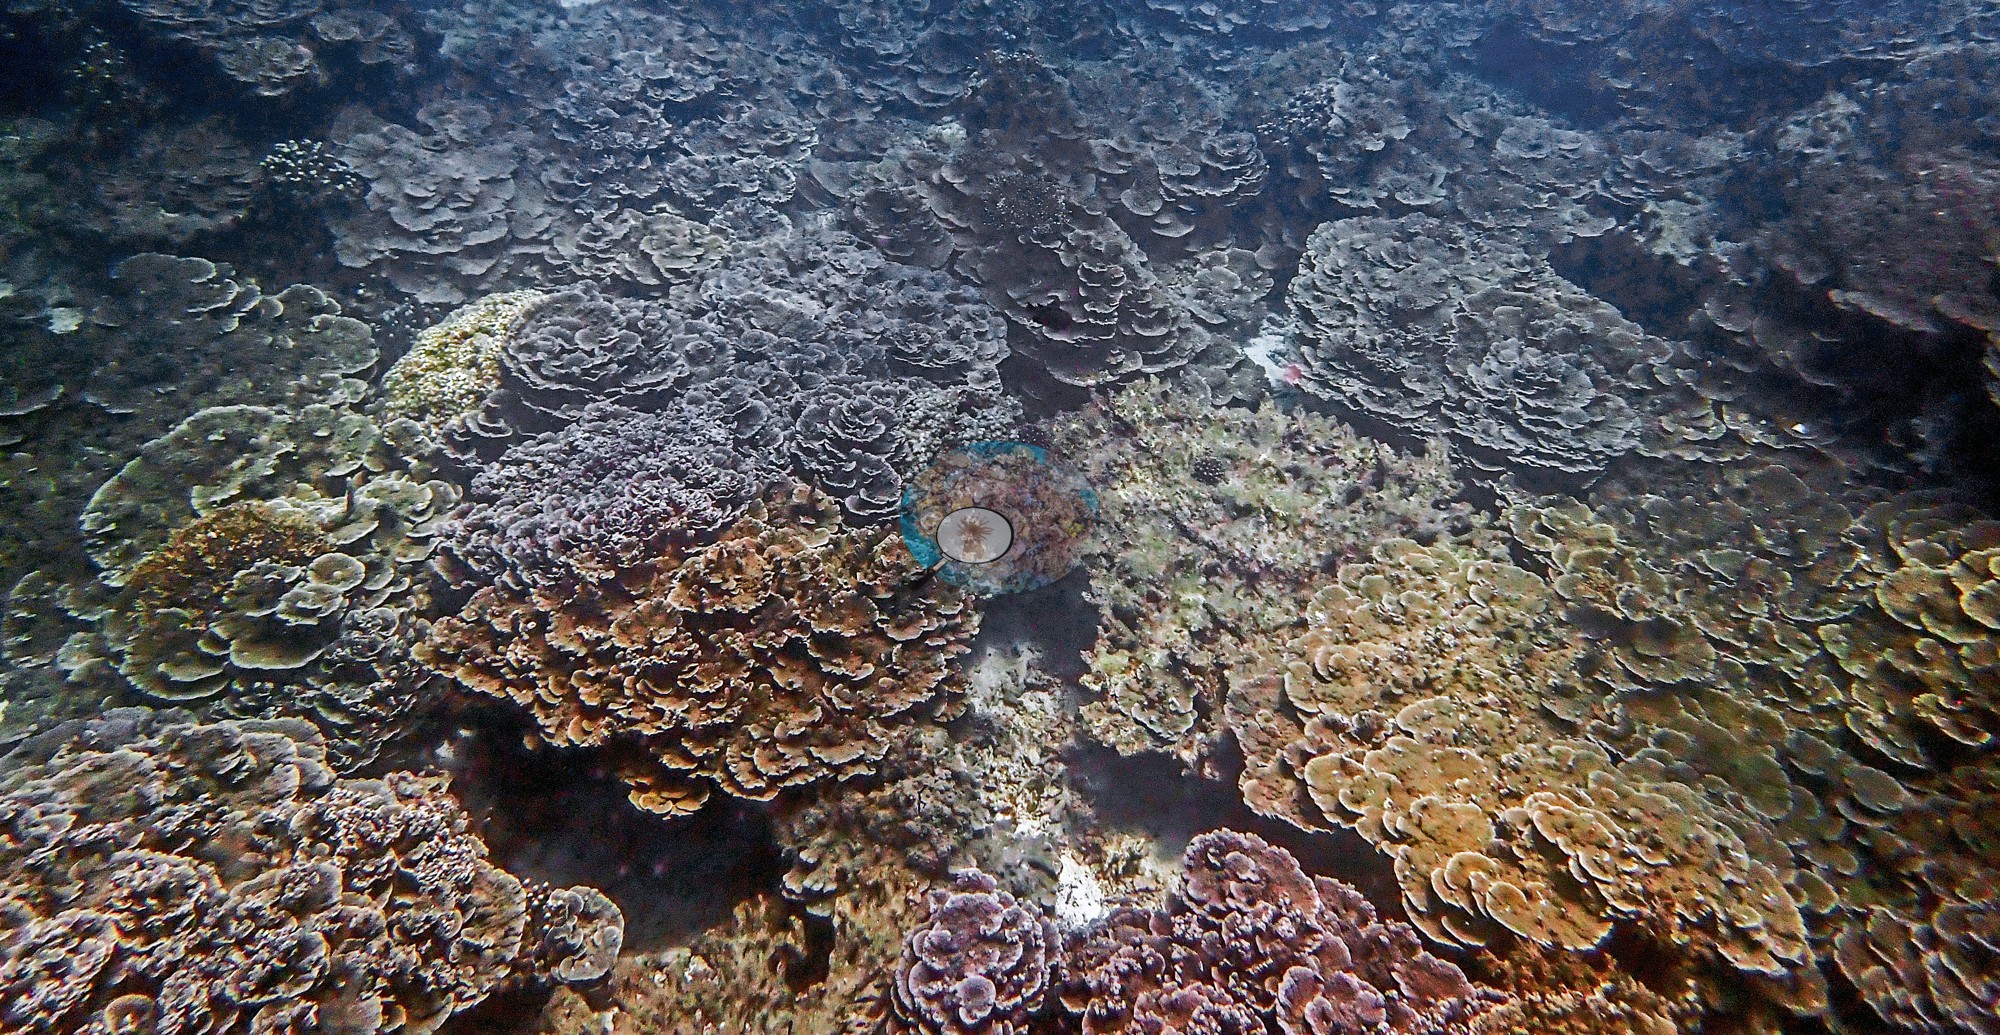

Oman's rocky, strongly zoned Muscat reefs and the shallow Daymaniyat island reefs, surveyed in May 2024, held 32.9% to 62.7% hard coral. With only a trace of bleaching, they stand as a record taken weeks before heat stress struck that summer.
Heat stress
Long-term record: 7 years since 1985 reached 8 or more °C-weeks at NOAA’s Gulf of Oman station. Download the annual DHW data (CSV).
7 sites in this region — click a marker to open that site.
Regional setting
Oman's coasts face the Arabian Sea and the Gulf of Oman, and the Arabian Sea shores remained almost unstudied until the late 1980s (Spalding et al. 2001). Strong southwest monsoon winds in summer drive upwelling of cool, nutrient-rich water of about 16–17°C along southern Arabia, so that in southern Oman macroalgae such as Sargassum, with kelp in deeper water, often occupy hard ground where corals might otherwise grow. In the Gulf of Oman the cool-water influence is weaker and less constant. Spalding et al. (2001) name four main areas of well-developed coral communities and small reef formations: the Musandam Peninsula, the shores and bays around Muscat together with the Daymaniyat Islands, western Masirah Island and the facing mainland, and sheltered rocky coast around the Al Halaniyat Islands and Dhofar. Many of these communities combine high cover with low diversity, dominated by Porites, Pocillopora damicornis, or Acropora. Natural impacts included storm damage and some crown-of-thorns predation, and the 1998 bleaching killed shallow corals in Dhofar but did little harm elsewhere. The Daymaniyat Islands became a nature reserve in 1995. Spalding et al. (2001) estimate about 530 km² of coral reef for Oman; Souter et al. (2021) give 196 km² for the Sea of Oman subregion and 2,009 km² for the whole ROPME Sea Area.
As of 2001, Spalding et al. judged human impacts on Oman's reefs to be considerable. Overfishing was probably only local, but anchors, fishing gear, and discarded nets did far more harm: one 1996 survey found 25–100% of the coral damaged on the Pocillopora damicornis reefs it examined. In the Sea of Oman, Souter et al. (2021) report that reefs lost almost half their coral cover from 2005 to 2010 after super-cyclone Gonu in 2007, cyclone Phet in 2010, and a large algal bloom in 2008–09, before recovering. The subregion bleached again in 2015, and algal cover there has roughly tripled since the early 2000s, a sign of a possible phase shift. The only records in the ROPME dataset spanning more than a decade come from around Muscat.
Overview
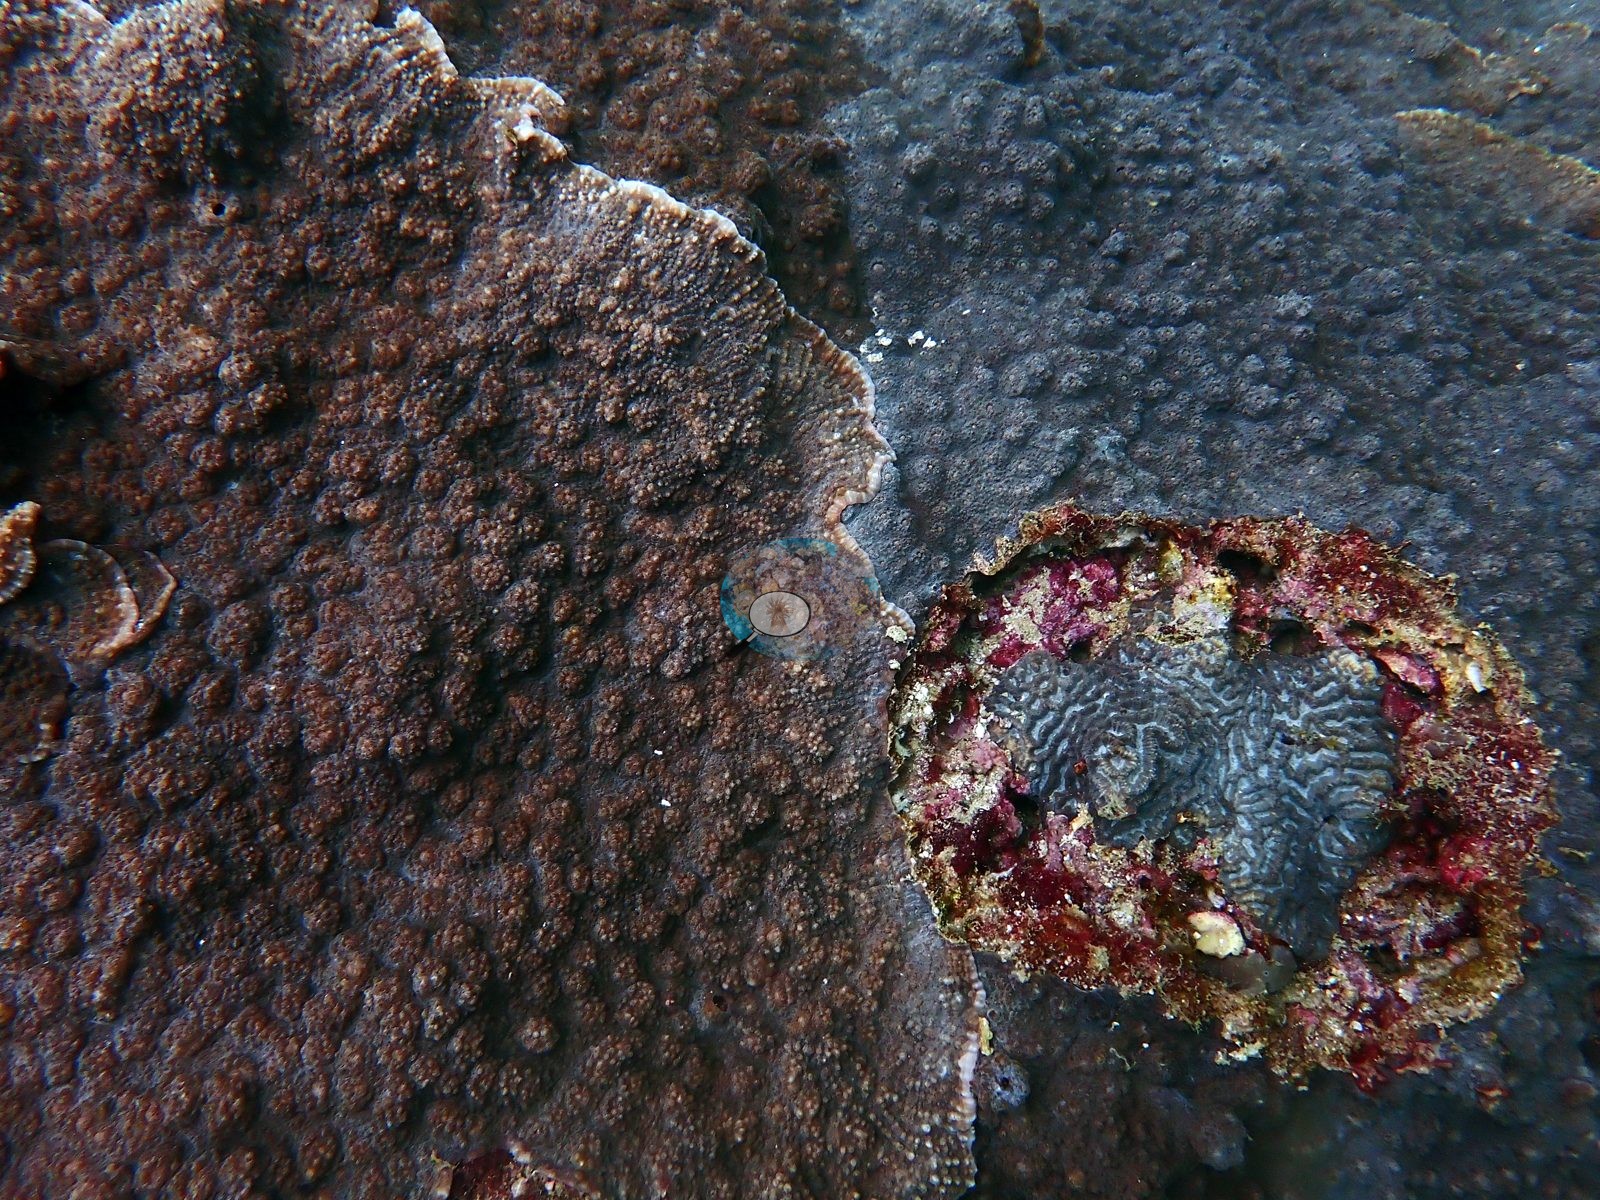
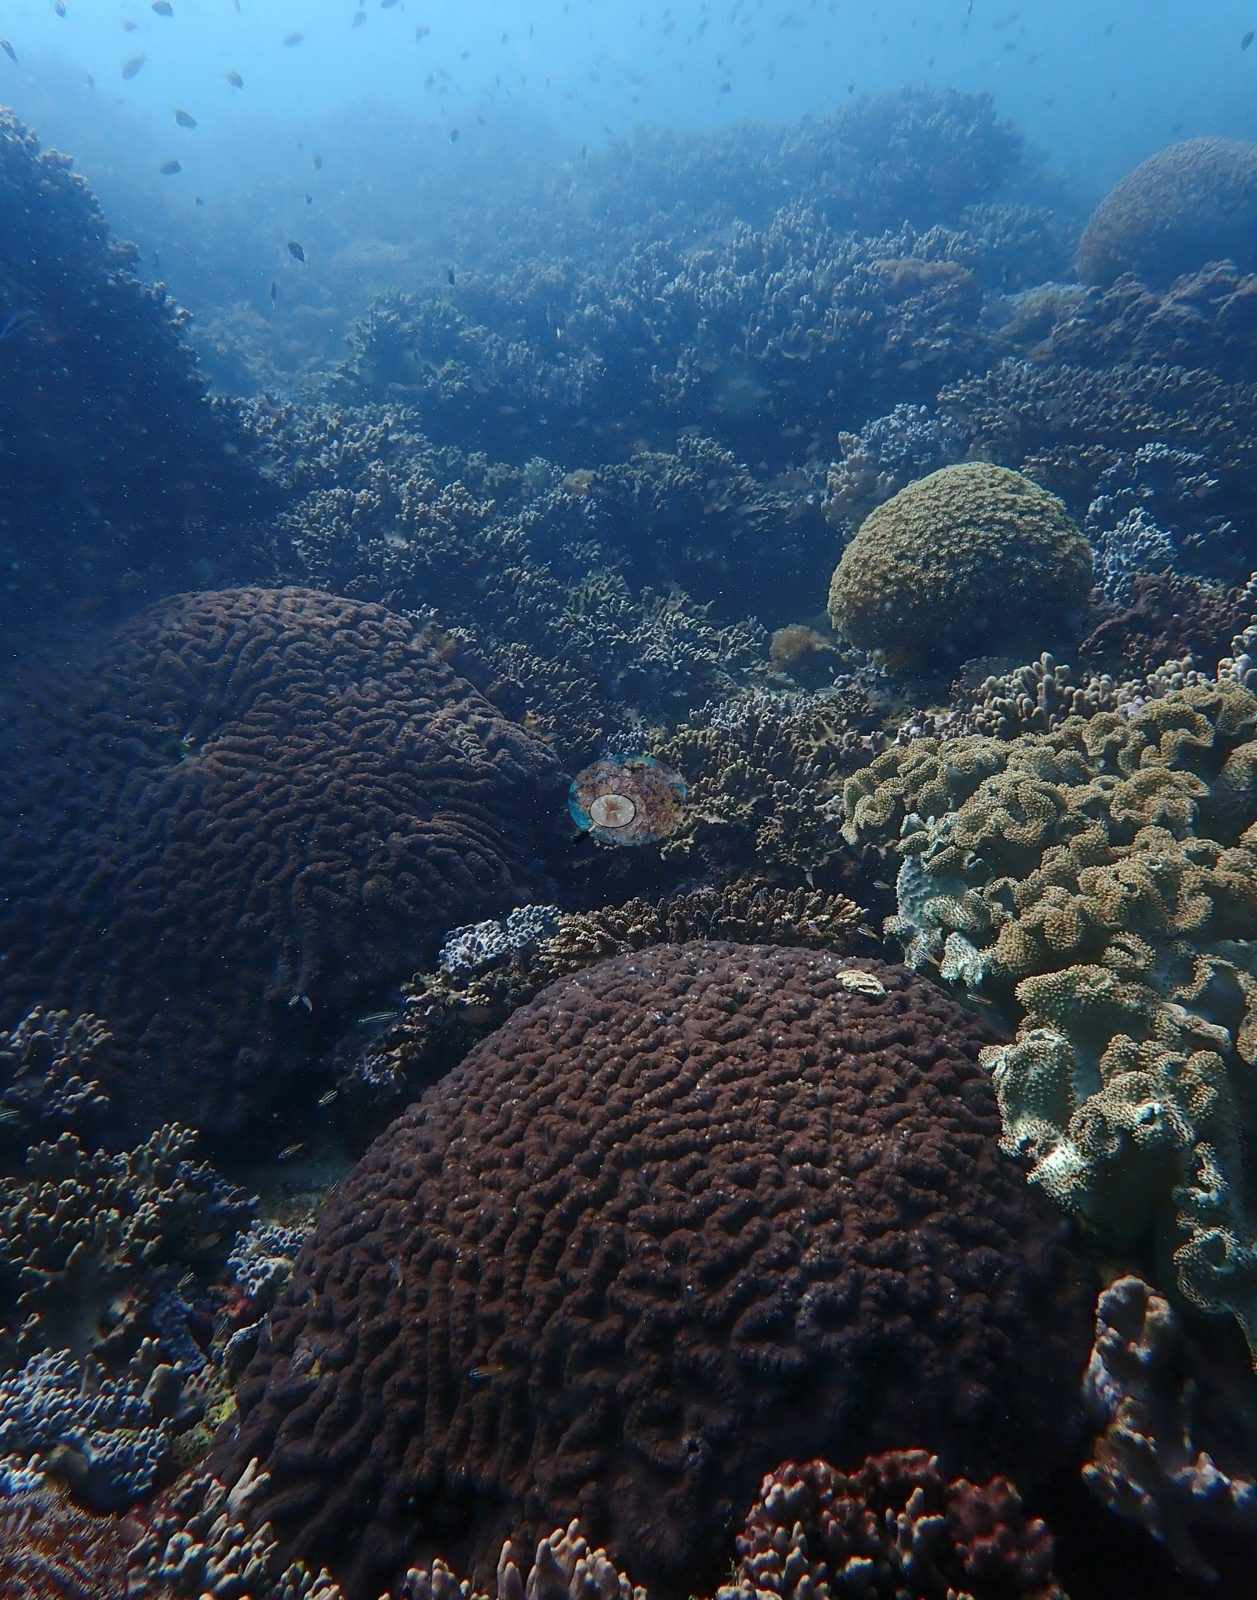
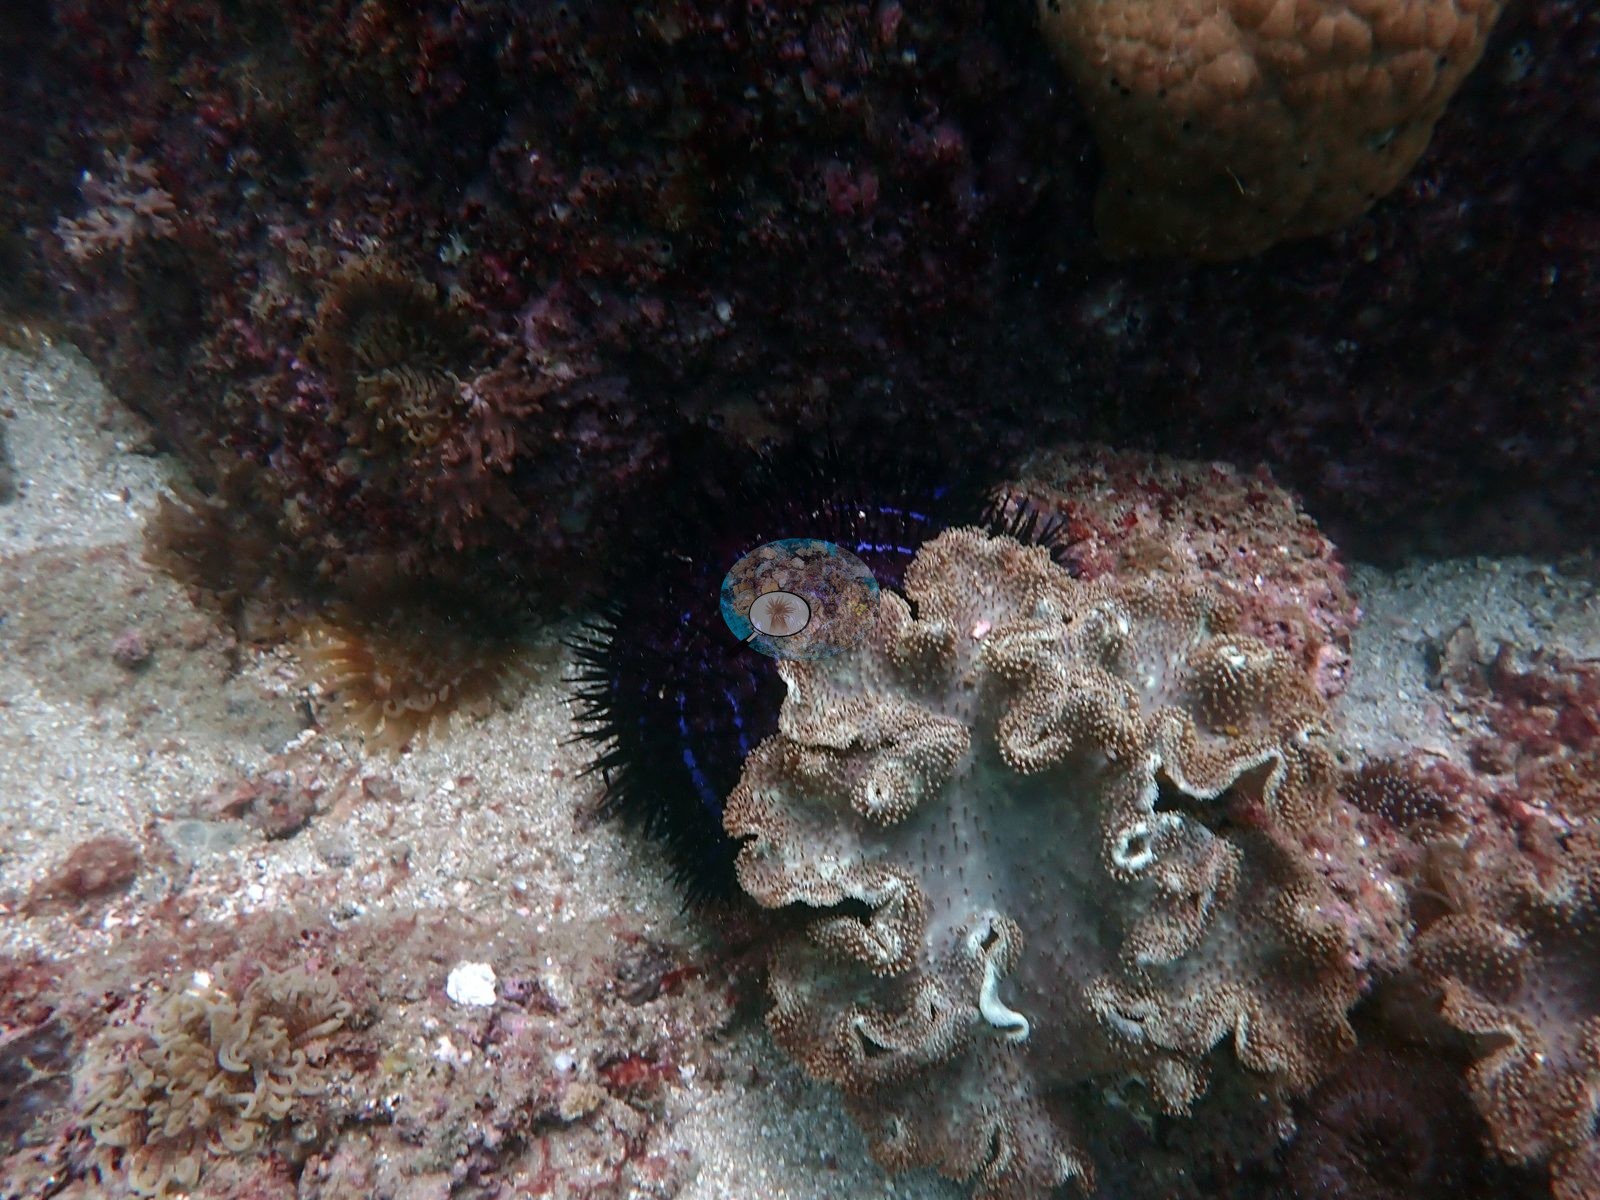
Oman's seven pins are Anderson's May 2024 survey sites, four on the Muscat coast (Novice Bay, Cave Site, Jissah Point, Cat Island) dived on 20-21 May and three in the Daymaniyat islands dived on 25 May. Published hard coral cover from manual point counts ranged from 32.9% at Cat Island to 62.7% at Cave Site. The Muscat reefs are rocky and strongly zoned. Novice Bay grades from a shallow flat of brain corals and Pocillopora thickets into leather-coral slopes and deep coralline buttresses, with soft coral at 29%. At Cave Site, where sand gullies and overhangs cut through the framework, colonies are packed so tightly that coral-on-coral contact is the norm. Jissah Point is the outlier, a low-relief pavement where algal turf (37.8%) nearly matches hard coral (39.5%) among leather-coral banks. Cat Island splits almost evenly between hard coral, soft coral, and turf, with compact branching colonies on boulder tops above leather corals and corallimorph carpets.
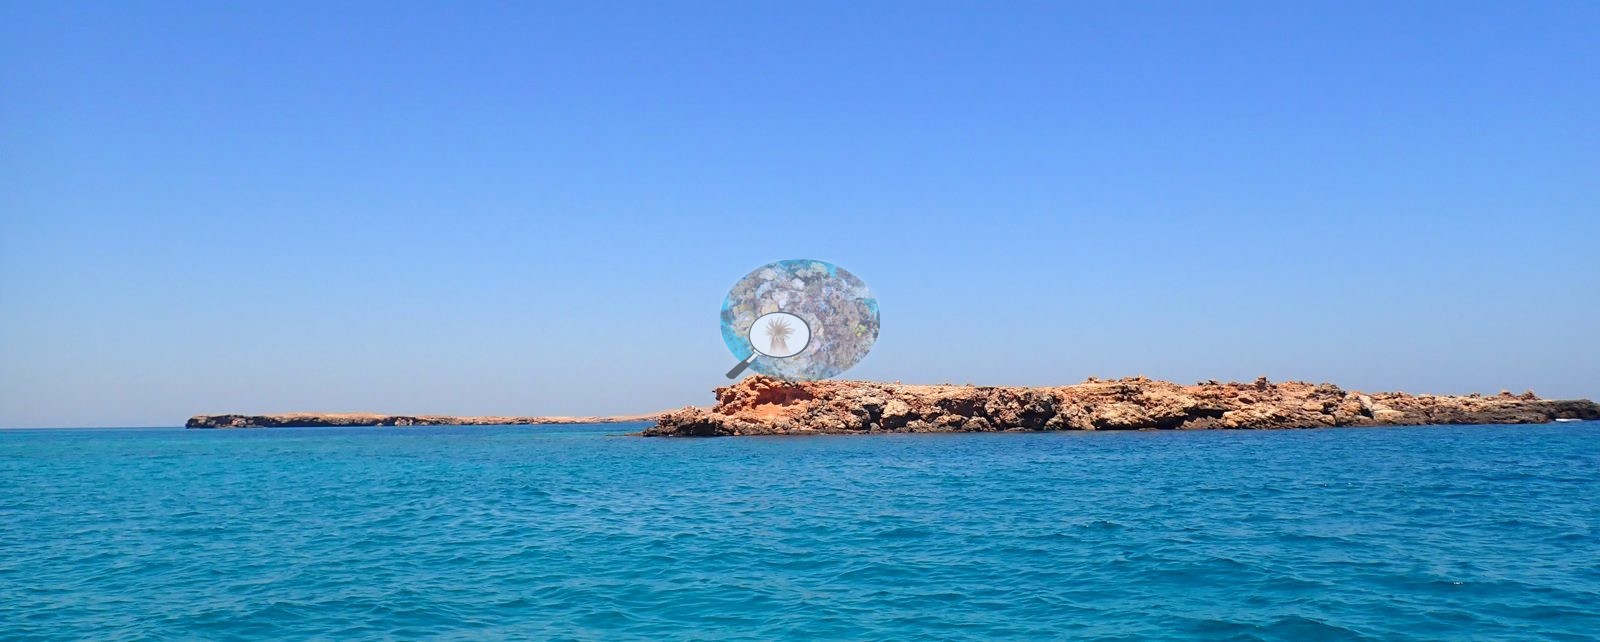
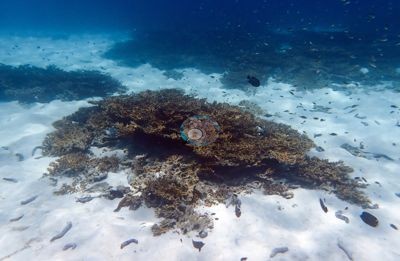
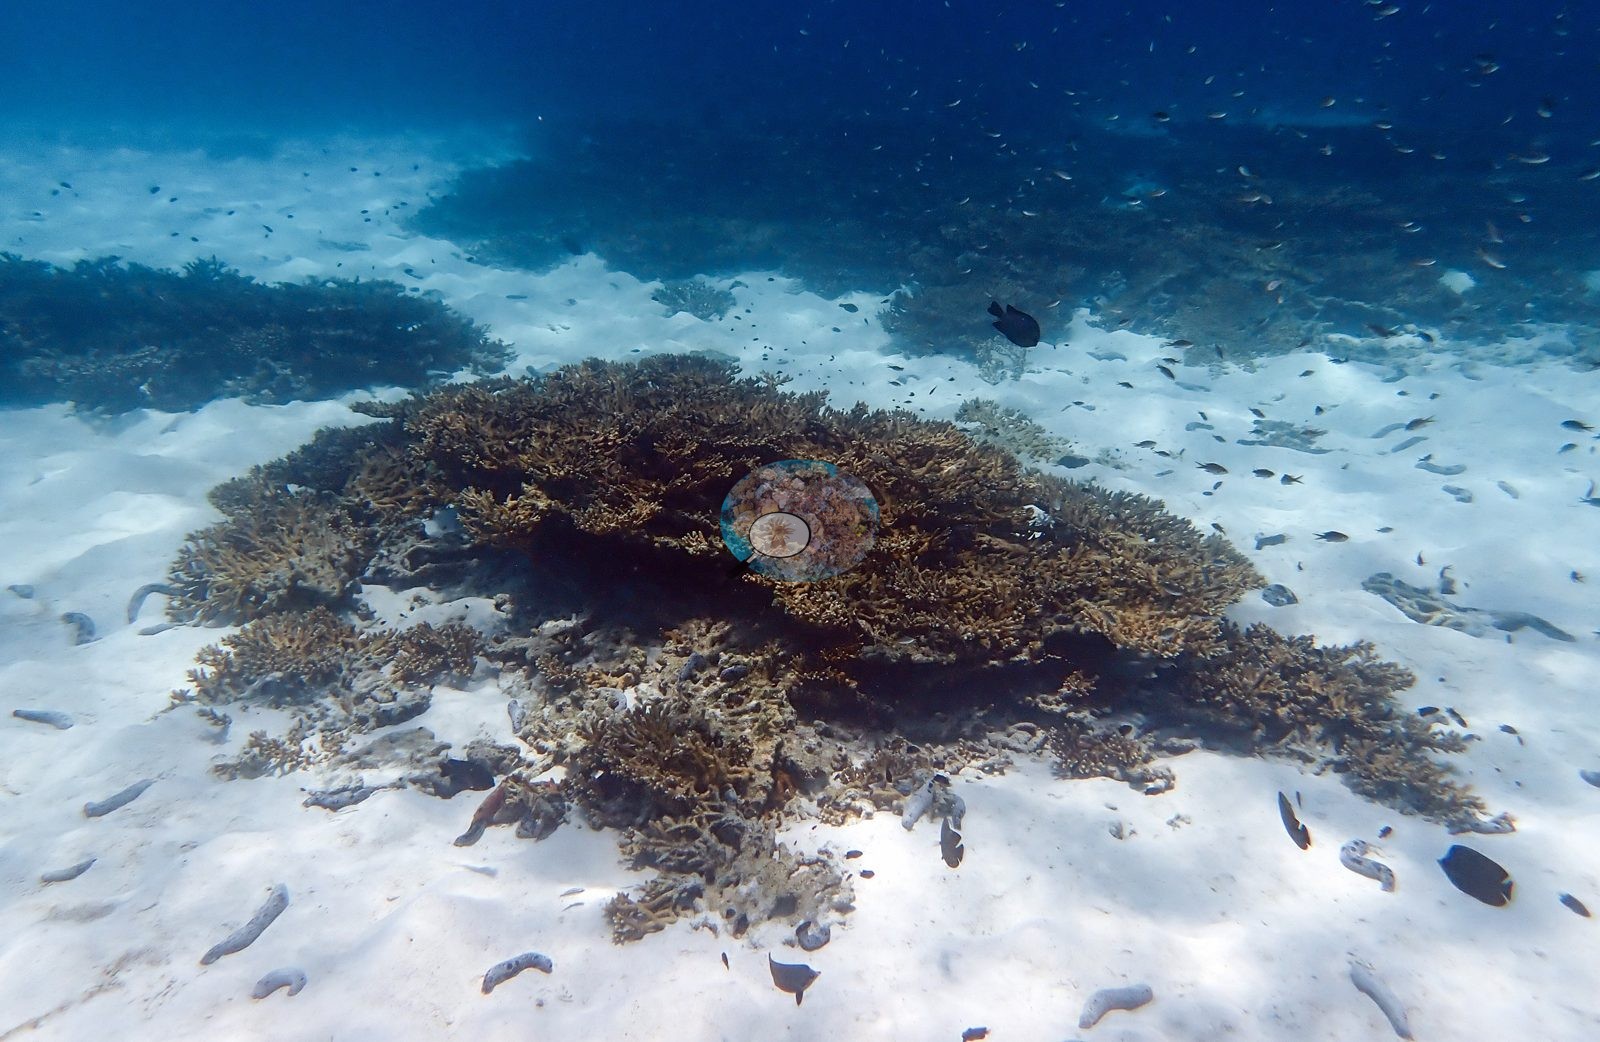
The Daymaniyat sites are shallow reefs rising from bright white sand. Site 1 holds near-monospecific meadows of tabular Acropora and dense Pocillopora fields separated by sand channels and Porites bommies, and Site 3 is covered almost wall to wall in fine-branched tabular and branching corals. At Site 2, a fringing reef off a low rocky islet, bommies are wrapped in knobby coral and tiered laminar plates, with turf down to 5.3%. Photo review found that tabular Acropora had been partly scored as soft coral at Sites 1 and 3, so the published hard coral values there (51.1% and 41.5%) likely understate living hard coral.
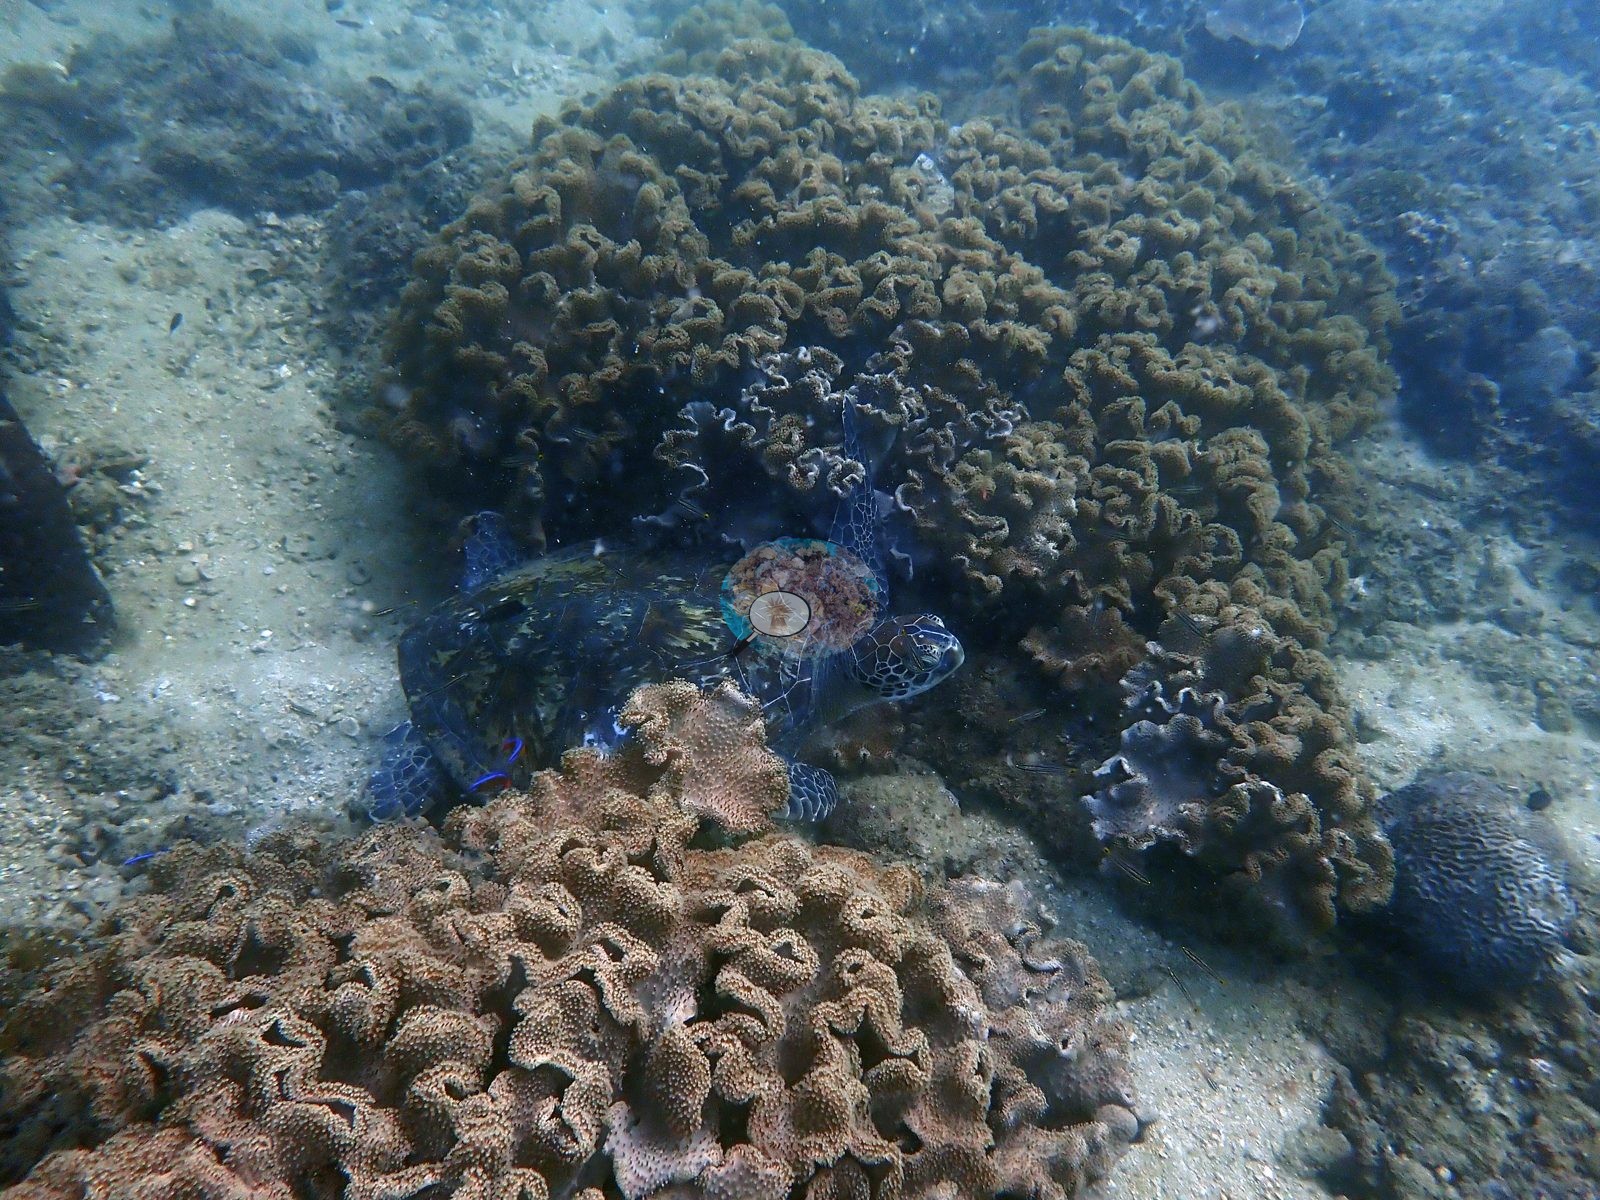
No bleaching was seen in May 2024 except a trace (0.2% of hard coral points) at Novice Bay. The surveys fell weeks before NOAA Coral Reef Watch recorded Alert Level 2 heat stress and bleaching was reported along this coast from July 2024, so they stand as a pre-stress record. Sea turtles were photographed repeatedly at the Daymaniyat sites, and a banded sea snake, honeycomb moray, and scorpionfish were recorded off Muscat.
Highlights
- Cave Site (Muscat): 62.7% hard coral cover, the highest of the seven sites
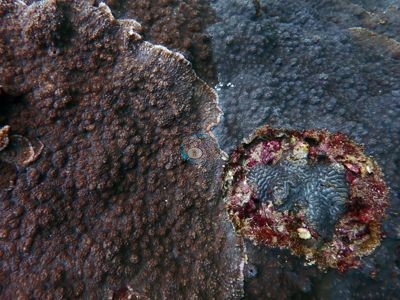 photo: Oman - Cave Site (Muscat)
 - Daymaniyat Site 2: near-unbroken coral on bommies and laminar plates, with turf at just 5.3%
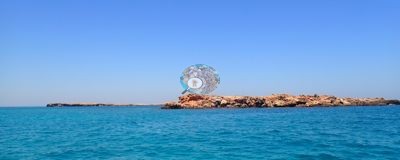 photo: Oman - Daymaniyat Site 2
 - Jissah Point: turf-dominated pavement, the outlier of the survey
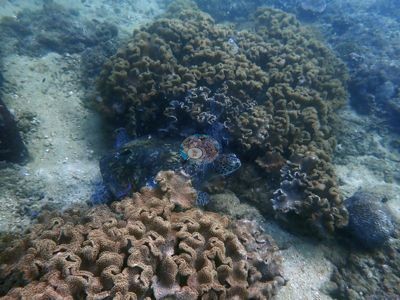 photo: Oman - Jissah Point (Muscat)
 - All seven sites surveyed 20-25 May 2024, weeks before the July 2024 heat stress
- Only trace bleaching recorded (0.2% of hard coral points at Novice Bay)
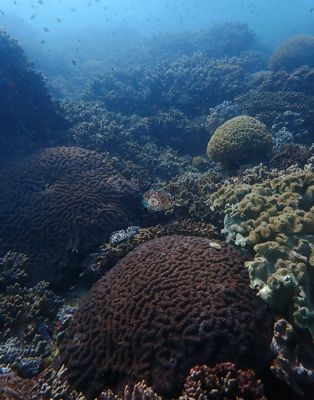 photo: Oman - Novice Bay (Muscat)
هذه ترجمة آلية للملخص الإنجليزي؛ والنص الإنجليزي هو النسخة المعتمدة. AI translation of this summary; the English is authoritative.
Regional setting
تطل سواحل عُمان على بحر العرب وخليج عُمان، وظلت شواطئ بحر العرب شبه غير مدروسة حتى أواخر الثمانينيات (1980s) (Spalding et al. 2001). وتدفع رياح الموسم الجنوبي الغربي القوية في الصيف إلى صعود مياه باردة غنية بالمغذيات تبلغ حرارتها نحو 16–17°C على امتداد جنوب شبه الجزيرة العربية، بحيث تحتل الطحالب الكبيرة مثل Sargassum، مع طحالب الكِلب (kelp) في المياه الأعمق، القاعَ الصلب في جنوب عُمان حيث كان يمكن أن ينمو المرجان لولا ذلك. وفي خليج عُمان يكون تأثير المياه الباردة أضعف وأقل ثباتًا. ويحدد Spalding et al. (2001) أربع مناطق رئيسية لمجتمعات مرجانية جيدة النمو وتكوينات شعابية صغيرة: شبه جزيرة مسندم (Musandam)، والشواطئ والخلجان المحيطة بمسقط (Muscat) مع جزر الديمانيات (Daymaniyat Islands)، وغرب جزيرة مصيرة (Masirah) والبر الرئيسي المقابل لها، والساحل الصخري المحمي حول جزر الحلانيات (Al Halaniyat Islands) وظفار (Dhofar). وكثير من هذه المجتمعات يجمع بين تغطية عالية وتنوع منخفض، وتهيمن عليها Porites أو Pocillopora damicornis أو Acropora. وشملت التأثيرات الطبيعية أضرار العواصف وبعض الافتراس من نجم البحر ذي التاج الشوكي، وقتل ابيضاض عام 1998 المرجان الضحل في ظفار لكنه لم يُحدث ضررًا يُذكر في أماكن أخرى. وأصبحت جزر الديمانيات محمية طبيعية عام 1995. ويقدّر Spalding et al. (2001) مساحة الشعاب المرجانية في عُمان بنحو 530 km²؛ في حين يعطي Souter et al. (2021) رقم 196 km² لمنطقة بحر عُمان الفرعية و2,009 km² للمنطقة البحرية للمنظمة الإقليمية لحماية البيئة البحرية (ROPME Sea Area) بأكملها.
وحتى عام 2001، رأى Spalding et al. أن التأثيرات البشرية على شعاب عُمان كبيرة. فالصيد الجائر كان على الأرجح محليًا فقط، لكن المراسي ومعدات الصيد والشباك المهملة ألحقت ضررًا أكبر بكثير: فقد وجد مسح أُجري عام 1996 أن 25–100% من المرجان كان متضررًا في شعاب Pocillopora damicornis التي فحصها. وفي بحر عُمان، يفيد Souter et al. (2021) بأن الشعاب فقدت ما يقارب نصف تغطيتها المرجانية من 2005 إلى 2010 في أعقاب الإعصار الفائق جونو (Gonu) عام 2007، وإعصار فيت (Phet) عام 2010، وازدهار طحلبي كبير في 2008–09، قبل أن تتعافى. وتعرضت المنطقة الفرعية للابيضاض مجددًا عام 2015، وتضاعفت التغطية الطحلبية فيها ثلاث مرات تقريبًا منذ أوائل الألفينيات (2000s)، وهو مؤشر على تحوّل طوري محتمل. والسجلات الوحيدة في مجموعة بيانات ROPME التي تمتد لأكثر من عقد تأتي من محيط مسقط.
Overview
علامات عُمان السبع هي مواقع المسح التي زارها Anderson في مايو 2024، أربعة منها على ساحل مسقط (Novice Bay وCave Site وJissah Point وCat Island) جرى الغوص فيها في 20-21 مايو، وثلاثة في جزر الديمانيات جرى الغوص فيها في 25 مايو. وتراوحت التغطية المنشورة للمرجان الصلب المستندة إلى العدّ اليدوي للنقاط بين 32.9% في Cat Island و62.7% في Cave Site. وشعاب مسقط صخرية وذات تمنطق واضح. ففي Novice Bay يتدرّج المشهد من مسطح ضحل من المرجان الدماغي وأجمات Pocillopora إلى منحدرات من المرجان الجلدي ودعامات عميقة مكسوّة بالطحالب المرجانية الكلسية، مع مرجان رخو بنسبة 29%. وفي Cave Site، حيث تشق الأخاديد الرملية والسقوف الصخرية البارزة الهيكلَ الشعابي، تتراصّ المستعمرات بإحكام شديد حتى صار تلامس المرجان بالمرجان هو القاعدة. أما Jissah Point فهو الاستثناء، إذ هو رصيف صخري منخفض التضاريس تكاد فيه الطحالب العشبية القصيرة (37.8%) تعادل المرجان الصلب (39.5%) بين ضفاف المرجان الجلدي. وتنقسم Cat Island بالتساوي تقريبًا بين المرجان الصلب والمرجان الرخو والطحالب العشبية، مع مستعمرات متفرعة مدمجة على قمم الصخور الكبيرة فوق المرجان الجلدي وبُسُط من الكوراليمورفات (corallimorphs).
أما مواقع الديمانيات فهي شعاب ضحلة ترتفع من رمل أبيض ناصع. ويضم Site 1 مروجًا شبه أحادية النوع من Acropora الطاولية وحقولًا كثيفة من Pocillopora تفصل بينها قنوات رملية وكتل مرجانية منعزلة من Porites، ويكاد Site 3 يكون مغطى بالكامل بمرجانيات طاولية ومتفرعة دقيقة التفرّع. وفي Site 2، وهو شعاب هدبية قبالة جزيرة صخرية منخفضة، تلتف حول الكتل المرجانية المنعزلة مرجانيات عُقدية وصفائح رقائقية متدرجة الطبقات، وتنخفض فيه الطحالب العشبية إلى 5.3%. وكشفت مراجعة الصور أن Acropora الطاولية سُجّلت جزئيًا على أنها مرجان رخو في Site 1 وSite 3، ولذلك فإن قيم المرجان الصلب المنشورة هناك (51.1% و41.5%) تقلّل على الأرجح من تقدير المرجان الصلب الحي.
لم يُشاهَد أي ابيضاض في مايو 2024 باستثناء أثر ضئيل (0.2% من نقاط المرجان الصلب) في Novice Bay. وقد جرت المسوح قبل أسابيع من تسجيل NOAA Coral Reef Watch لإجهاد حراري من مستوى التنبيه 2 (Alert Level 2) ومن ورود تقارير عن الابيضاض على امتداد هذا الساحل ابتداءً من يوليو 2024، ولذلك فهي تمثل سجلًا لما قبل الإجهاد. وصُوّرت السلاحف البحرية مرارًا في مواقع الديمانيات، وسُجّل قبالة مسقط ثعبان بحر مطوّق وثعبان موراي قرص العسل وسمكة عقرب.
Highlights
- Cave Site (مسقط): تغطية مرجان صلب بنسبة 62.7%، وهي الأعلى بين المواقع السبعة لعام 2024
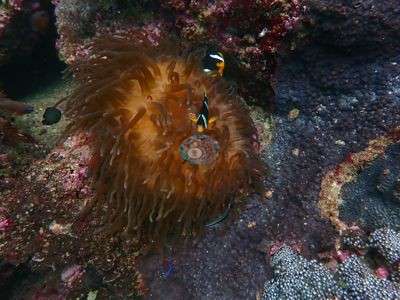 photo: Oman - Cave Site (Muscat)
 - Daymaniyat Site 2: مرجان شبه متصل على الكتل المرجانية المنعزلة والصفائح الرقائقية، مع طحالب عشبية بنسبة 5.3% فقط
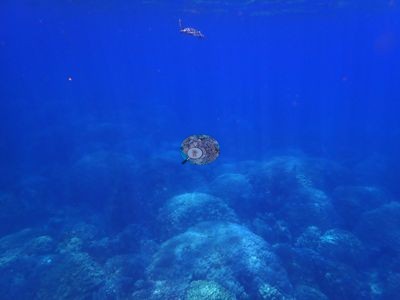 photo: Oman - Daymaniyat Site 2
 - Jissah Point: رصيف صخري تهيمن عليه الطحالب العشبية، وهو الاستثناء في المسح
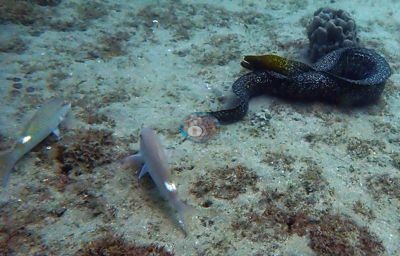 photo: Oman - Jissah Point (Muscat)
 - جرى مسح المواقع السبعة جميعها في 20-25 مايو 2024، قبل أسابيع من الإجهاد الحراري في يوليو 2024
- لم يُسجَّل سوى أثر ضئيل من الابيضاض (0.2% من نقاط المرجان الصلب في Novice Bay)
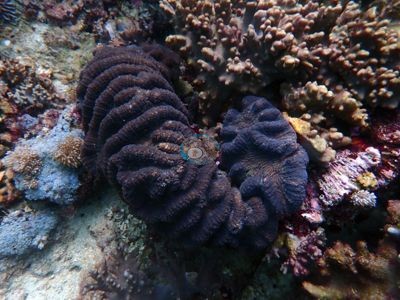 photo: Oman - Novice Bay (Muscat)
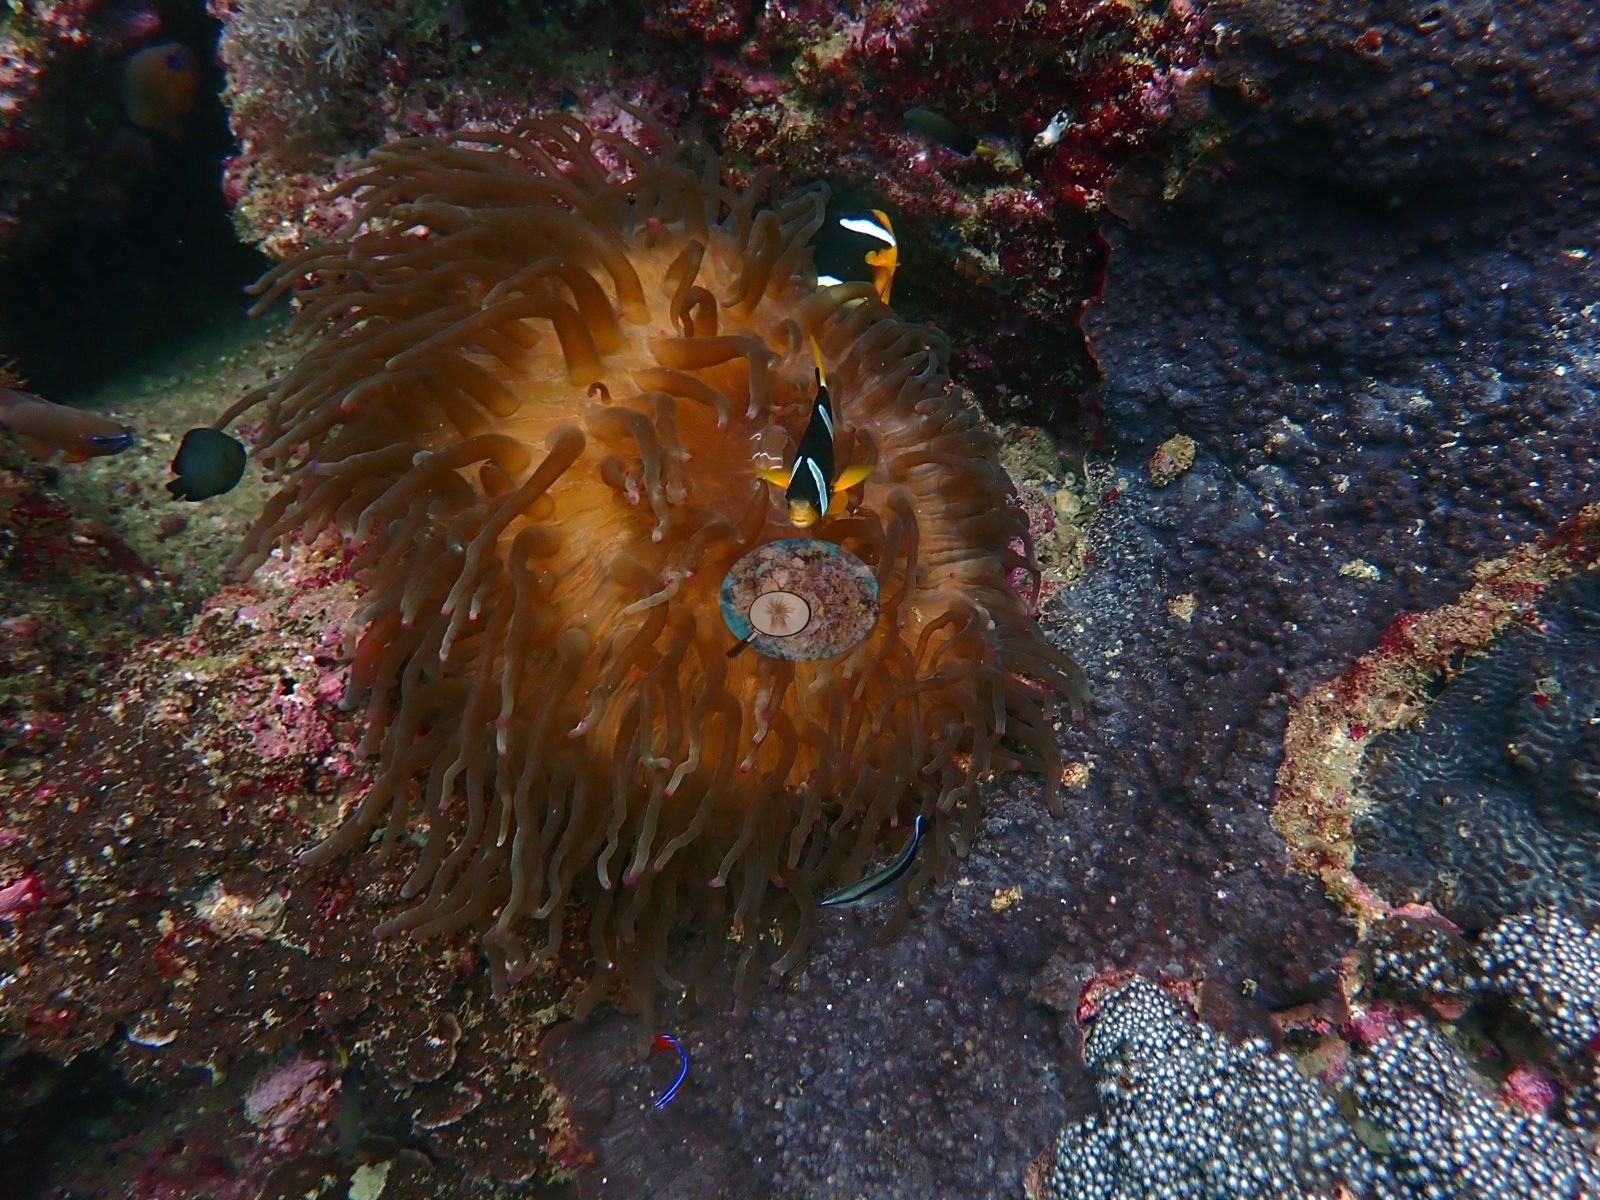
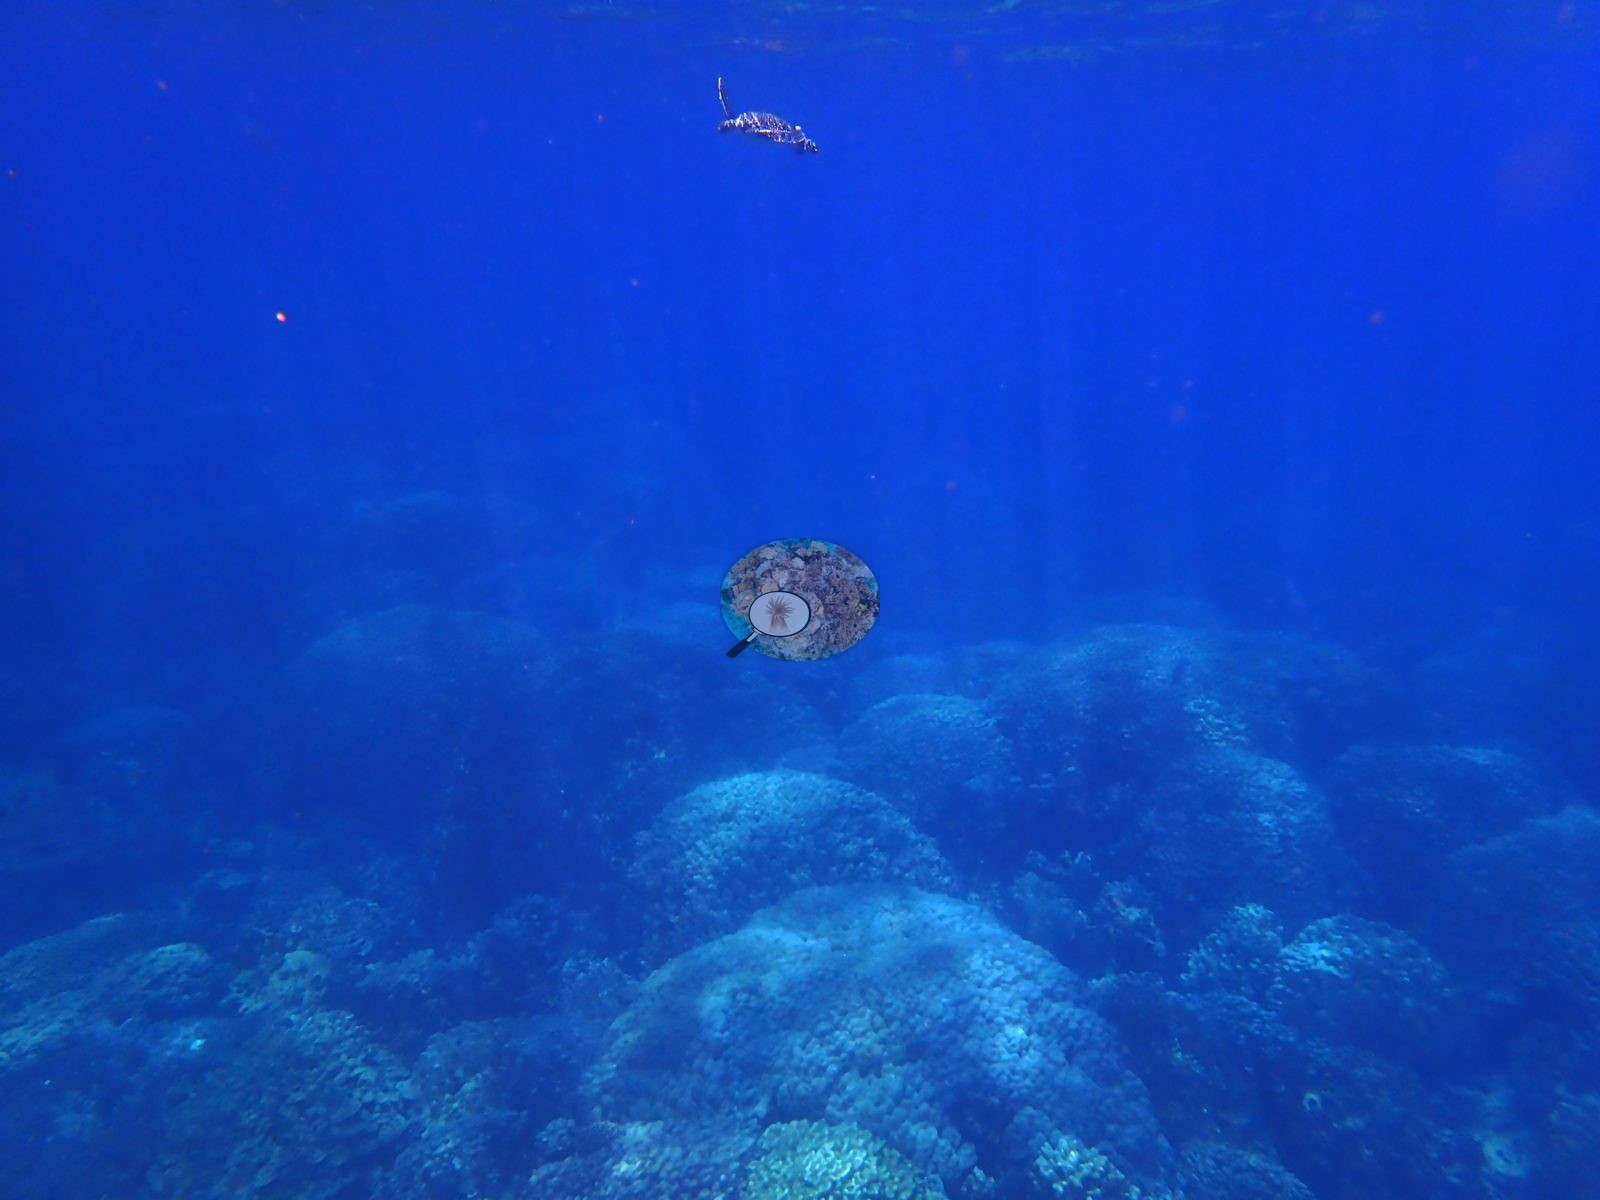
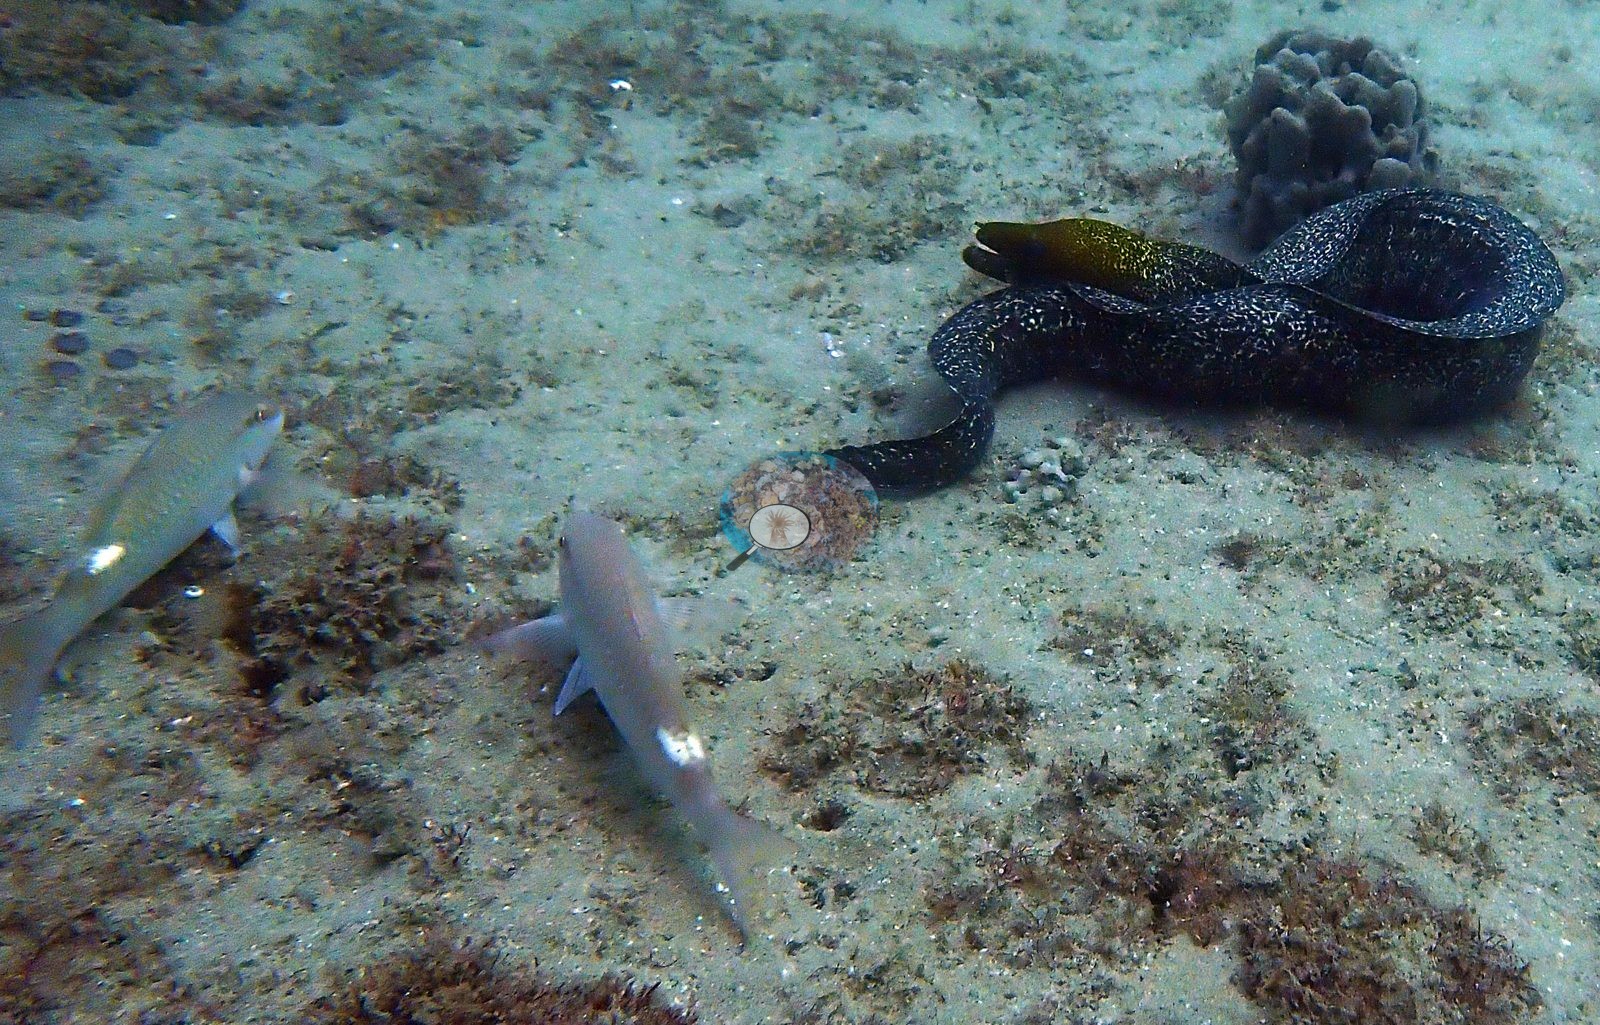
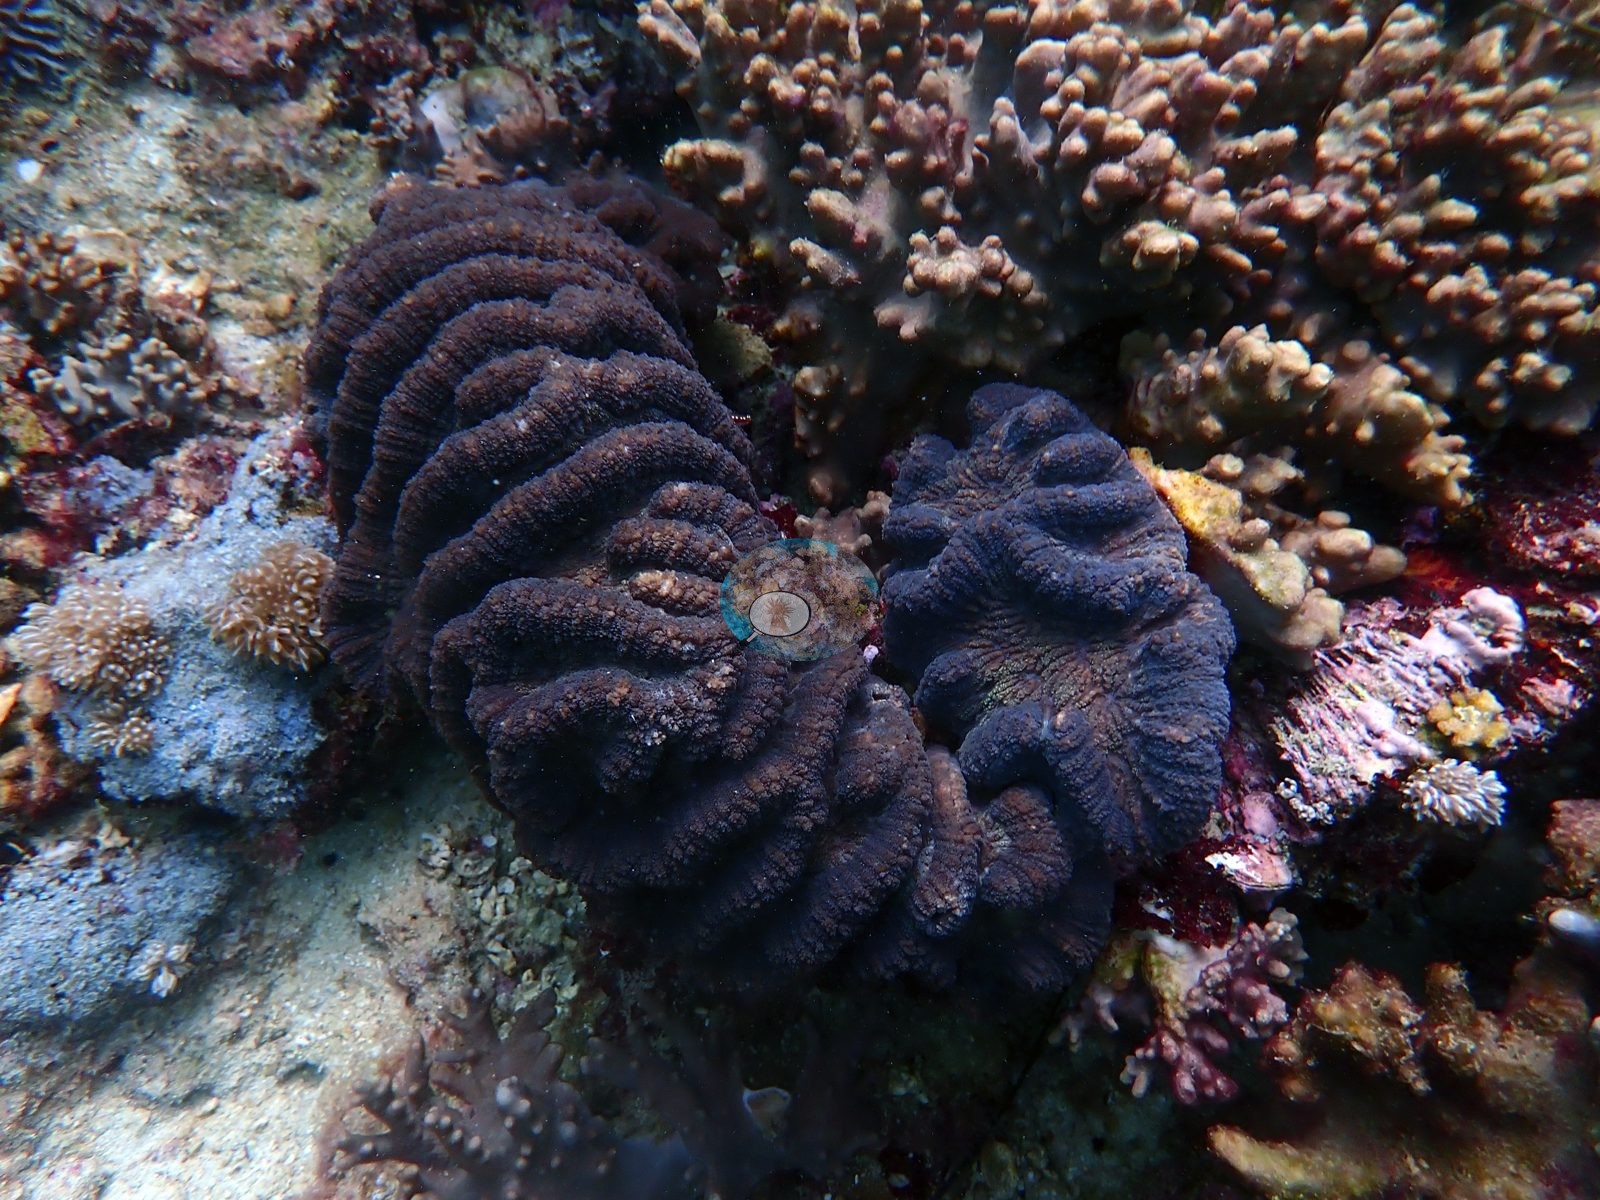
Notable observations
- Oman - Novice Bay (Muscat): Bleaching: the only site of the survey with any bleaching, a trace 0.2% of hard coral points; a photograph cannot separate bleached tissue from freshly dead skeleton
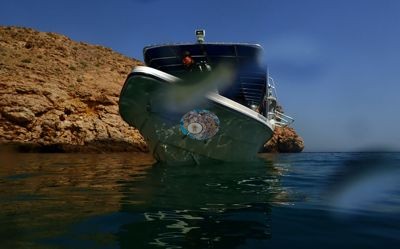
- Oman - Cat Island (Muscat): Crown-of-thorns: a seastar is on record for this site from an earlier review, but it does not appear in the reviewed photographs (the spiny animal in frame 1 is a Diadema-type urchin)
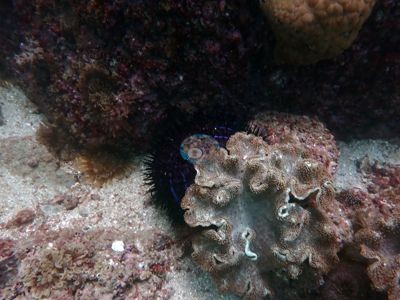
- Oman - Daymaniyat Site 1: Broken branch tips read as physical breakage and bare skeleton, not as a bleaching signal
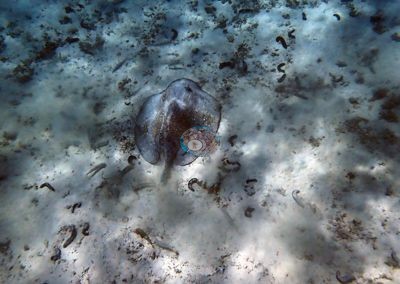
- Oman - Daymaniyat Site 3: A patch of old, gray, turf-furred dead branching framework beside living tables, the one sign of past mortality
Coral cover over time (pooled)
Sites in this region
- Oman - Cat Island (Muscat) — 25% coral cover
- Oman - Cave Site (Muscat) — 51% coral cover
- Oman - Daymaniyat Site 1 — 42% coral cover
- Oman - Daymaniyat Site 2 — 38% coral cover
- Oman - Daymaniyat Site 3 — 33% coral cover
- Oman - Jissah Point (Muscat) — 33% coral cover
- Oman - Novice Bay (Muscat) — 39% coral cover
% coral cover by method
Pooled across 7 dive sites
| Method | Mean % coral cover | Std. dev. between dive sites | n dive sites | Note |
|---|---|---|---|---|
| Manual point count (author) | 37.3% | ±8.3 | 7 | frame-weighted 39.8% over 660 frames |
| CoralNet automated point classifier | 36.6% | ±8.2 | 6 | frame-weighted 37.9% over 461 frames; 5 of these dive sites are the SAME MEASUREMENT as the reference and are excluded from the ranking |
| CoralSCOP (SAM-based mask-sum), edited photos | 37.2% | ±14 | 7 | frame-weighted 42.8% over 540 frames |
| CoralSCOP (SAM-based mask-sum), unedited photos | 35.2% | ±12 | 7 | frame-weighted 40.1% over 540 frames |
| Claude (Anthropic), blind point count | 44.5% | ±14 | 7 | frame-weighted 44.6% over 103 frames |
| In-house DINOv3 point classifier | 30.0% | ±9.8 | 7 | frame-weighted 29.9% over 554 frames |
The mean is an UNWEIGHTED mean of the dive site values — each dive site counts once, whatever its photo count — which is the convention of the published tables and of every other figure on this page. The frame-weighted alternative is given per method in the Note column; where the two differ, the difference is a photo-count imbalance, not a coral-cover finding.
Closest to the reference
Over the dive sites where an independent reference exists, CoralNet automated point classifier sits closest to it — a mean absolute deviation of 2.7 pp across 1 dive site, then CoralSCOP (SAM-based mask-sum), edited photos 4.8 pp (n=2), CoralSCOP (SAM-based mask-sum), unedited photos 4.9 pp (n=2), In-house DINOv3 point classifier 17.9 pp (n=2). 5 dive sites are excluded from this calculation entirely — Cat Island, Daymaniyat-site 1, Daymaniyat-site 2, Daymaniyat-site 3, Jissah Point — because the reference there is itself machine output, so a model compared against it is only being compared with another model. A mean absolute deviation is not an accuracy score: a model with a consistent offset is correctable, while one with the same deviation scattered in both directions is not.
By dive site
| Dive site | Manual point count | CoralNet | CoralSCOP (edited) | CoralSCOP (unedited) | Claude | DINOv3 |
|---|---|---|---|---|---|---|
| Cave Site | 51.4% n=170 | 48.7% n=106 | 50.5% n=149 | 49.0% n=149 | 69.3% n=15 | 31.2% n=151 |
| Daymaniyat-site 1 | 41.7% n=79 | 41.7%⚠ n=79 | 24.6%⚠ n=56 | 23.2%⚠ n=56 | 51.9%⚠ n=15 | 34.4%⚠ n=56 |
| Novice Bay | 38.5% n=135 | — | 47.3% n=111 | 45.9% n=111 | 41.9% n=15 | 23.0% n=120 |
| Daymaniyat-site 2 | 38.1% n=106 | 38.1%⚠ n=106 | 50.4%⚠ n=81 | 42.2%⚠ n=81 | 48.3%⚠ n=15 | 46.5%⚠ n=84 |
| Jissah Point | 33.3% n=61 | 33.3%⚠ n=61 | 38.1%⚠ n=54 | 34.9%⚠ n=54 | 26.8%⚠ n=15 | 16.0%⚠ n=54 |
| Daymaniyat-site 3 | 33.0% n=28 | 33.0%⚠ n=28 | 13.3%⚠ n=19 | 17.6%⚠ n=19 | 35.9%⚠ n=13 | 34.2%⚠ n=18 |
| Cat Island | 24.9% n=81 | 24.9%⚠ n=81 | 36.5%⚠ n=70 | 33.3%⚠ n=70 | 37.1%⚠ n=15 | 24.9%⚠ n=71 |
n under each value is the number of photographs that method scored at that dive site. ⚠ marks a cell that is not an independent check.
Reference: point-count on the photographs (a human scoring the same pixels the models see). Denominator: coral points / (30 − WATER − FISH); `Unk` is IN the denominator (Mayfield 2025 convention). Source: published verbatim (Mayfield 2025, Platax, Table 1) ⚠ Only 200 of the 661 frames behind the published Oman cover carry the author's own points (Novice Bay 135 + 65 of Cave Site); the other 461 carry CoralNet robot labels. Cave Site is the ONLY real CoralNet comparison in this region. The two CoralSCOP columns are PAIRED — a frame counts only if the same stem was scored in both runs, so edited minus unedited is not a frame-selection artefact. CoralSCOP cover is a mask-sum AREA fraction; no point denominator applies to it. The Claude column is the edited-photo blind arm (15 frames/site, 13 at Daymaniyat site 3). The harder unedited fair test is a separate, non-interchangeable number.
Nearby external survey stations
20 independent survey records within 5 km of a site in this region (deduplicated across sites).
Show all 20 records
- Environment Authority-Oman — BK 1 (2026): 45% hard coral cover, 1.09 km from Oman - Novice Bay (Muscat)
- Environment Authority-Oman — Coral Garden (2026): 1.1% hard coral cover, 1.99 km from Oman - Daymaniyat Site 3
- MERMAID project “coral cover BK”* — BK big mount (2024): 60% hard coral cover, 0.43 km from Oman - Cave Site (Muscat)
- MERMAID project “coral cover BK”* — BK big mount (2025): 70% hard coral cover, 0.43 km from Oman - Cave Site (Muscat)
- MERMAID project “coral cover BK”* — BK big mount (mean of 2 surveys, 2024–2025) (2025): 65% hard coral cover, 0.43 km from Oman - Cave Site (Muscat)
- MERMAID project “coral cover BK”* — BK miad (2025): 34% hard coral cover, 1.81 km from Oman - Novice Bay (Muscat)
- MERMAID project “coral cover BK”* — BK small mount (2025): 34% hard coral cover, 0.29 km from Oman - Novice Bay (Muscat)
- MERMAID project “coral cover BK”* — black tip island (2025): 4.3% hard coral cover, 0.46 km from Oman - Daymaniyat Site 1
- MERMAID project “coral cover BK”* — coral island (2025): 14% hard coral cover, 1.68 km from Oman - Daymaniyat Site 3
- Reef Check — Novice Bay, Bandar Khayran (2017): 14% hard coral cover, 0.39 km from Oman - Novice Bay (Muscat)
- Sultan Qaboos University — CAYC (Deep) (2025): 12% hard coral cover, 0.45 km from Oman - Cat Island (Muscat)
- Sultan Qaboos University — CAYC (Shallow) (2025): 4.2% hard coral cover, 0.50 km from Oman - Cat Island (Muscat)
- Sultan Qaboos University — Dimaniyat - Police Bay (Deep) (2026): 22% hard coral cover, 0.52 km from Oman - Daymaniyat Site 1
- Sultan Qaboos University — Dimaniyat - Police Bay (Shallow) (2026): 1.0% hard coral cover, 0.54 km from Oman - Daymaniyat Site 1
- Sultan Qaboos University — Dimaniyat - Turtle City (Deep) (2026): 35% hard coral cover, 0.17 km from Oman - Daymaniyat Site 1
- Sultan Qaboos University — Dimaniyat - Turtle City (Shallow) (2026): 0.0% hard coral cover, 0.10 km from Oman - Daymaniyat Site 1
- Sultan Qaboos University — Qantab Main Beach ( Shallow) (2025): 25% hard coral cover, 2.88 km from Oman - Jissah Point (Muscat)
- Sultan Qaboos University — Qantab Main Beach (Deep) (2025): 53% hard coral cover, 2.85 km from Oman - Jissah Point (Muscat)
- Sultan Qaboos University — Sifat Ash Skeikh (Deep) (2025): 37% hard coral cover, 3.86 km from Oman - Novice Bay (Muscat)
- Sultan Qaboos University — Sifat Ash Skeikh (Shallow) (2025): 51% hard coral cover, 3.87 km from Oman - Novice Bay (Muscat)
All images from Coral Reef Diagnostics. Data are from Coral Reef Diagnostics and Reef Check Foundation and NOAA Coral Reef Watch.
 © Coral Reef Diagnostics.
References
- Souter D, et al. (eds) (2021) Status of Coral Reefs of the World: 2020. International Coral Reef Initiative / Global Coral Reef Monitoring Network. [PDF]
- Spalding MD, et al. (2001) World Atlas of Coral Reefs. University of California Press, Berkeley. [PDF]
- Mayfield AB (2025). High coral cover at “tourist reefs” of the Sultanate of Oman. Platax 22:27-44. PDF