
Regional summary of 7 dive sites. Figures are averages across the sites that report them (n = sites with a value); each site's own page has its individual values.
⬇ Download this region as a report card

Mauritius's northern patch reefs and boulder fields and its southwest volcanic boulders and walls, dived in February 2025, are built mainly of massive Porites, with live coral patchy on boulder tops. No widespread bleaching was seen, and one lagoon site is carpeted in anemones rather than coral.
Heat stress
Long-term record: 9 years since 1985 reached 8 or more °C-weeks at NOAA’s Southern Mauritius station. Download the annual DHW data (CSV).
7 sites in this region — click a marker to open that site.
Regional setting
Mauritius, Rodrigues, and Réunion, the three Mascarene Islands, sit toward the southern extremity of the submarine Mascarene Ridge. All three are geologically young volcanic islands, and Spalding et al. (2001) describe a clear sequence of reef development along the chain: reefs are least developed around Réunion, the youngest island, and become better developed and extend farther offshore toward the older islands to the east. Mauritius is almost completely encircled by fringing reefs, with substantial lagoon and barrier-reef development on its east and southwest coasts. Its lagoons are dominated by algae with some seagrass, its reef slopes show a clear spur-and-groove zone, and below about 20 m the coral usually forms only a thin veneer over volcanic rock. Spalding et al. (2001) put the country's reef area at about 870 km², a national figure that includes Rodrigues, the remote Cargados Carajos Bank, and Agalega, and list 161 recorded coral species. The same account notes that the 1998 bleaching event affected 30–40% of Mauritian corals but killed very few, a survival the authors relate to overcast, windy weather during Cyclone Anacelle, and that many reefs had already been degraded by sedimentation and agricultural runoff following forest clearance, domestic and industrial effluent, past blast fishing, anchor damage, crown-of-thorns outbreaks since the early 1980s, and tourism-driven coastal development. At a wider scale, the Western Indian Ocean holds about 15,180 km² of coral reef, almost 6% of the global total (Souter et al. 2021).
More recent assessments describe reefs under mounting pressure. Across the Western Indian Ocean, Souter et al. (2021) report that regional hard coral cover fell after the 1998 bleaching event, recovered from 2004 to a peak of about 32% in 2012, and dropped sharply again in 2013 and 2017, with the 1998 and 2016 bleaching events the clearest signals in the record; they place about 1,076 km² of reef in the Mascarene and Cargados Carajos subregion. Around Mauritius itself, Elliott et al. (2018) documented a decline in stony coral cover between 1998 and 2010 that steepened after about 2005, and McClanahan & Muthiga (2021) recorded a 40% loss of hard coral cover between 2004 and 2019, concentrated in the south and east, where acute thermal anomalies were most frequent. Sea-surface temperatures around the island have been rising by about 0.16°C per decade, above the regional bleaching threshold in most years since 2000 (Doorga et al. 2023 (publisher page: the PDF on file is only the first page)), and NOAA Coral Reef Watch recorded severe heat stress (8 or more degree heating weeks) in 2016, 2019–2020, and again in both 2024 and 2025. Local pressures add to this: the 2020 grounding of the bulk carrier Wakashio spilled oil along the southeast coast (Rajendran et al. 2022 (publisher page: the PDF on file is only the first page)), and island-wide surveys continue to report coral disease and compromised coral health (Jogee et al. 2025).
Overview
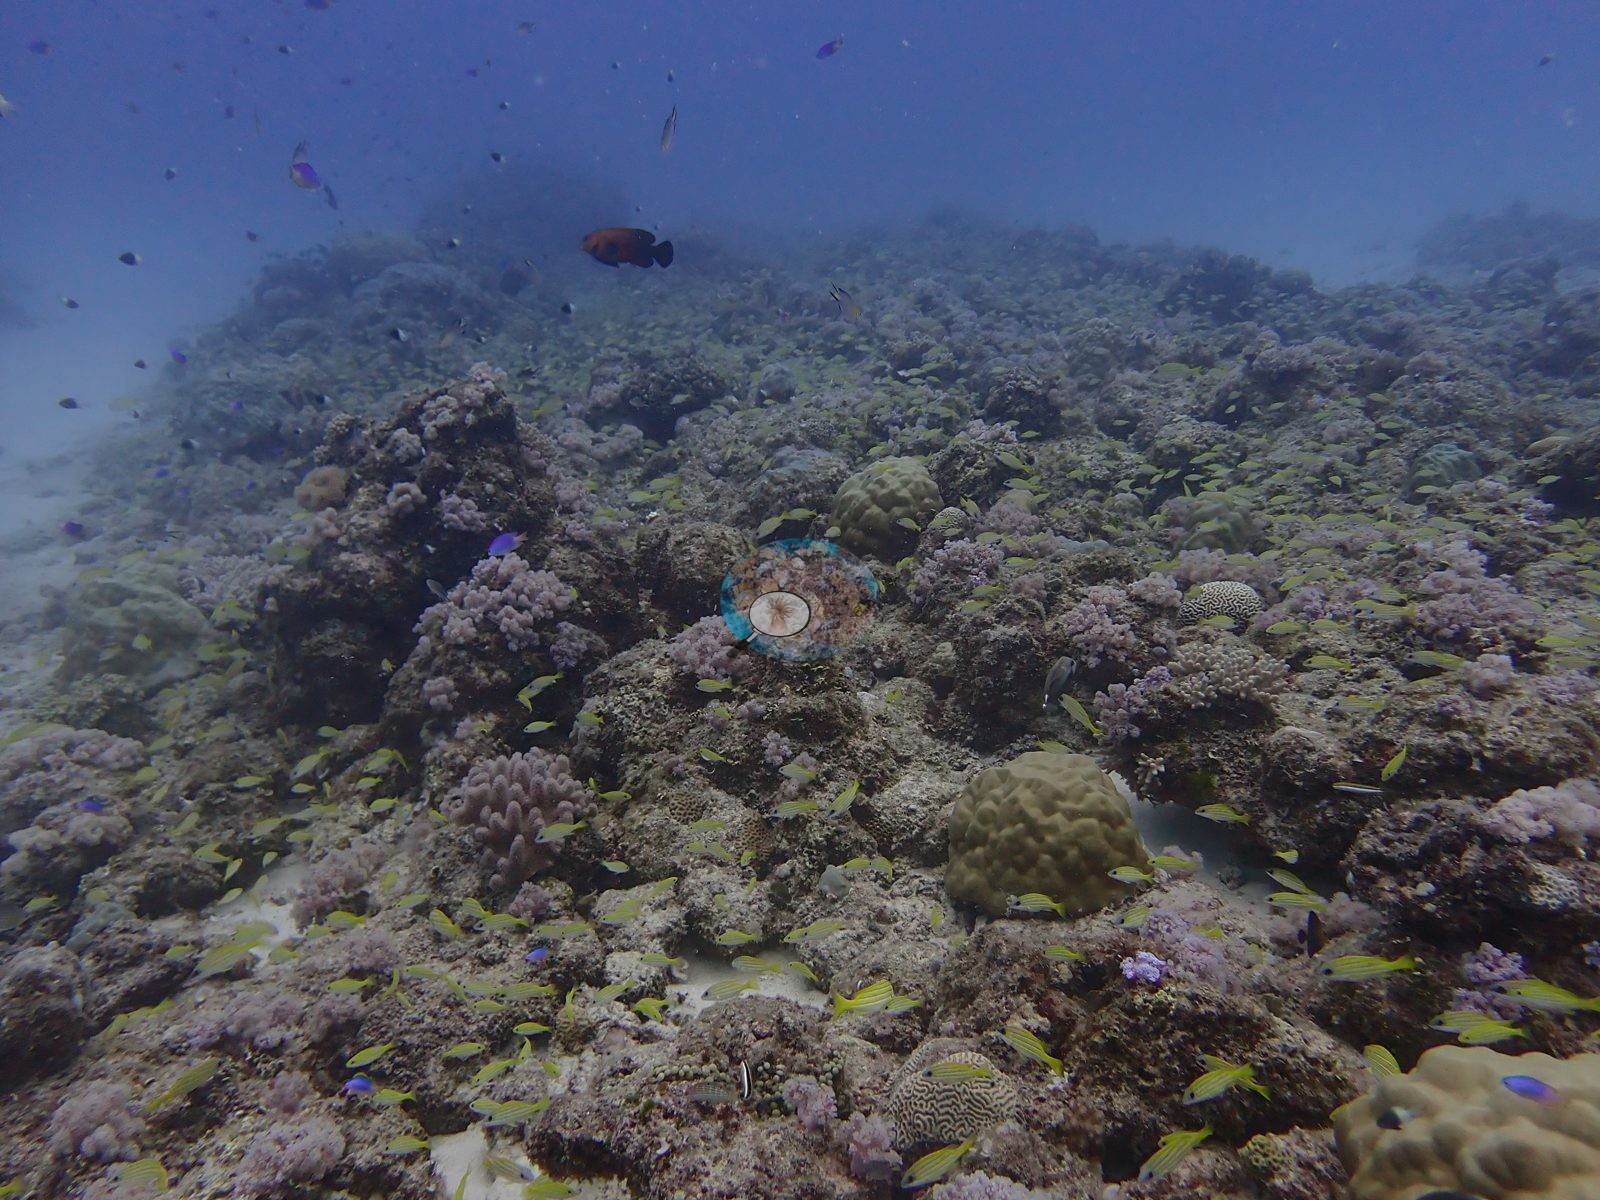
The Mauritius unit covers seven sites dived between 1 and 10 February 2025, at depths from 15.6 m (Ti Korail) to 35.3 m (Bamboo). Four northern sites (Reef Garden, Ti Korail, Carpenter, and Lost Anchor off Coin de Mire) are low-relief patch reefs and boulder fields cut by sand and rubble channels, although Carpenter also has steeper boulder faces. Aquarium / Big Rock, off Le Morne, is built on huge volcanic boulders and rock spurs. Bamboo, dived the same day, combines a sand-veneered rubble base with sections of near-vertical wall.
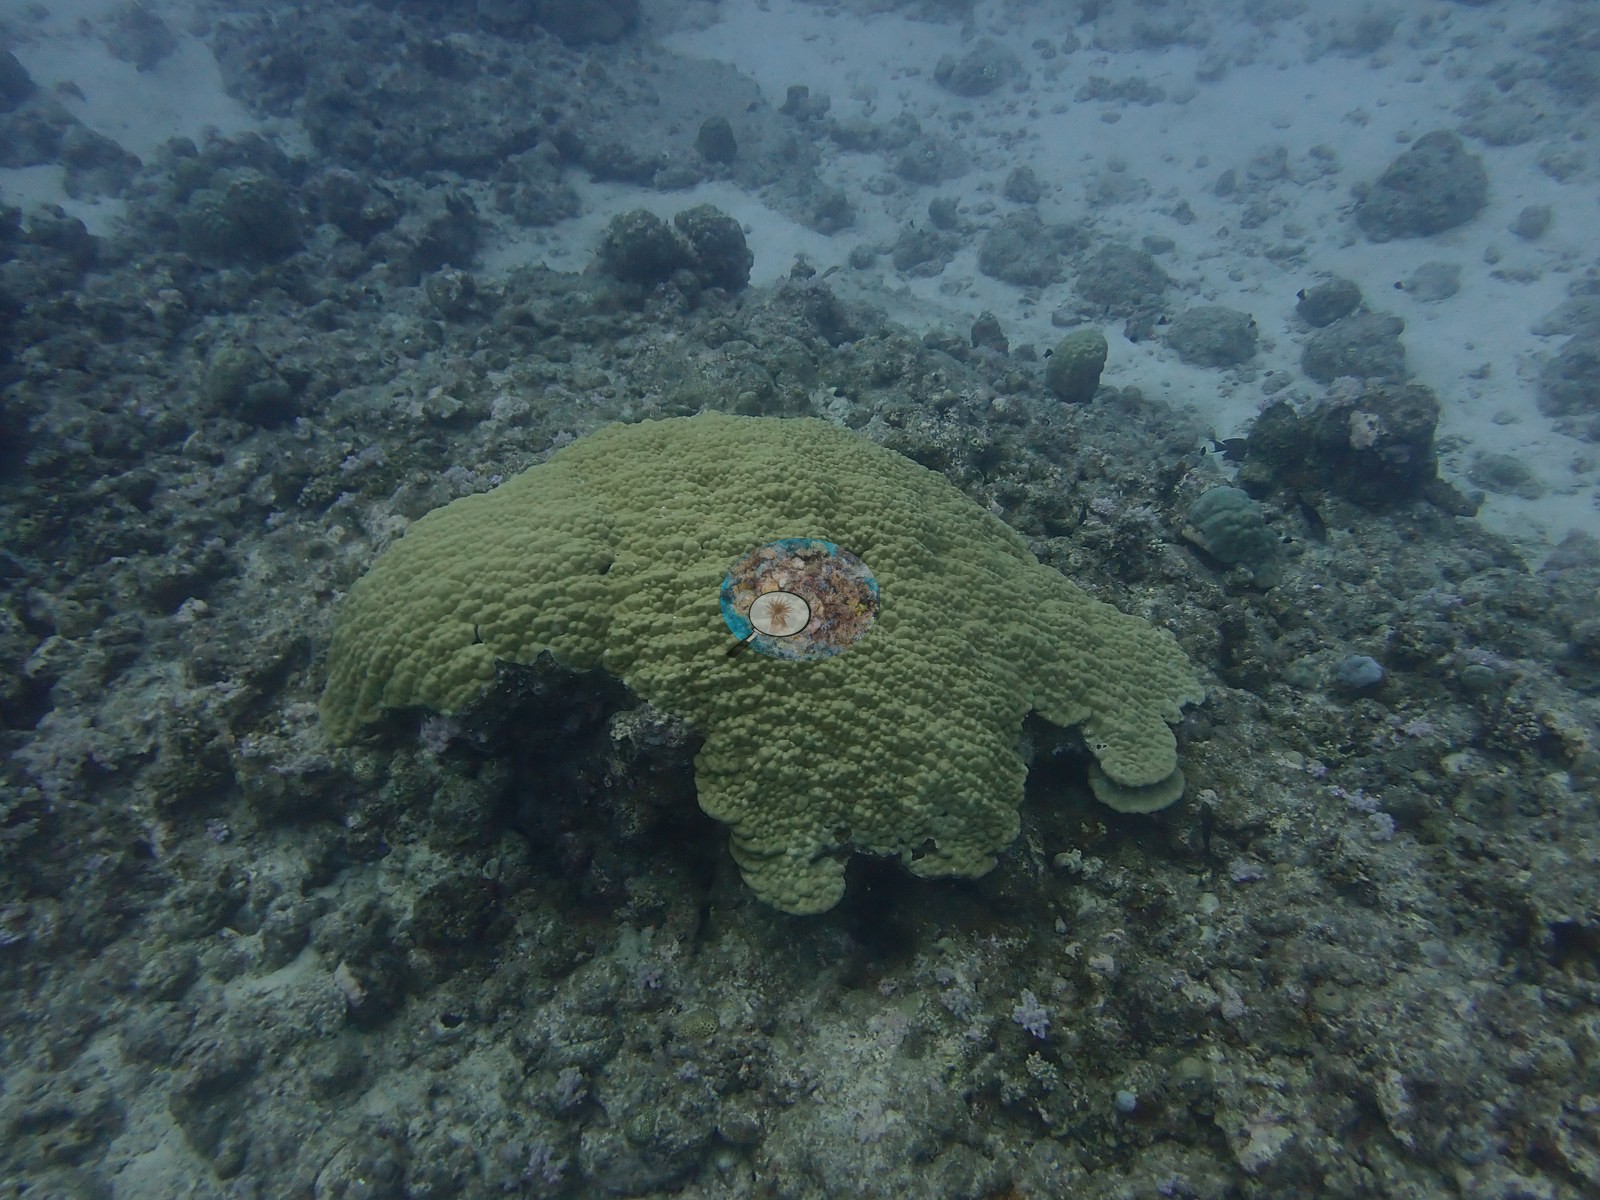
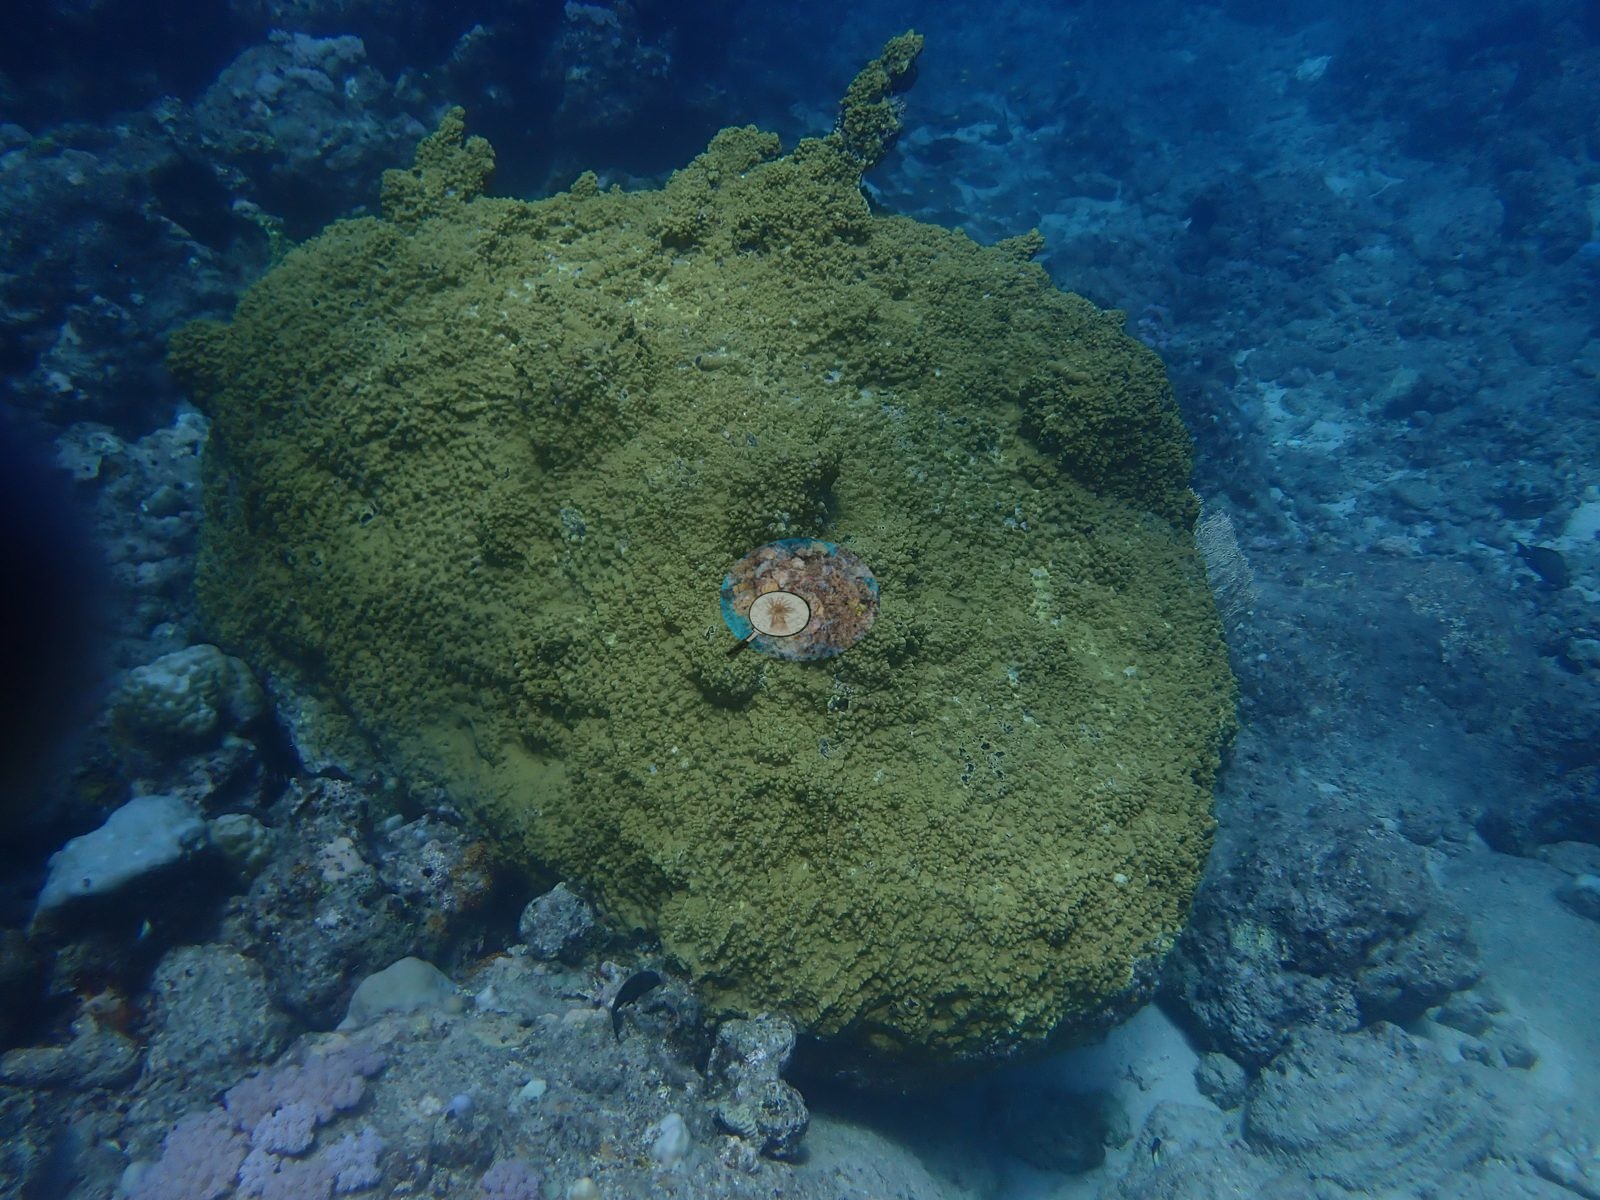
Massive Porites is the most consistent framework builder. It is joined by brain corals consistent with Platygyra and Dipsastraea/Favites, tabular and branching Acropora, and Pocillopora. At Carpenter some Porites domes stand about a diver's height off the bottom. Live coral is patchy and concentrated on boulder tops and flanks, with turf, crustose coralline algae, and encrusting sponges holding most of the remaining rock. Manually scored hard coral cover at the six reef sites ranged from 7.0% at Ti Korail to 26.3% at Reef Garden, with Lost Anchor at 10.9%, Aquarium / Big Rock and Carpenter at 14.4% and 14.5%, and Bamboo at 17.2%. Reef Garden adds slopes carpeted in soft corals, while Bamboo's open pavement carries dense clusters of Diadema-type urchins.
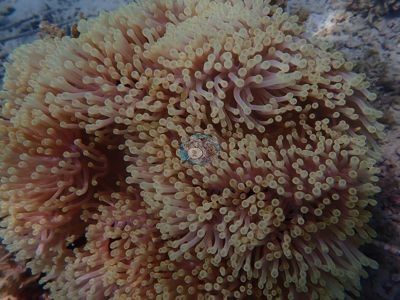
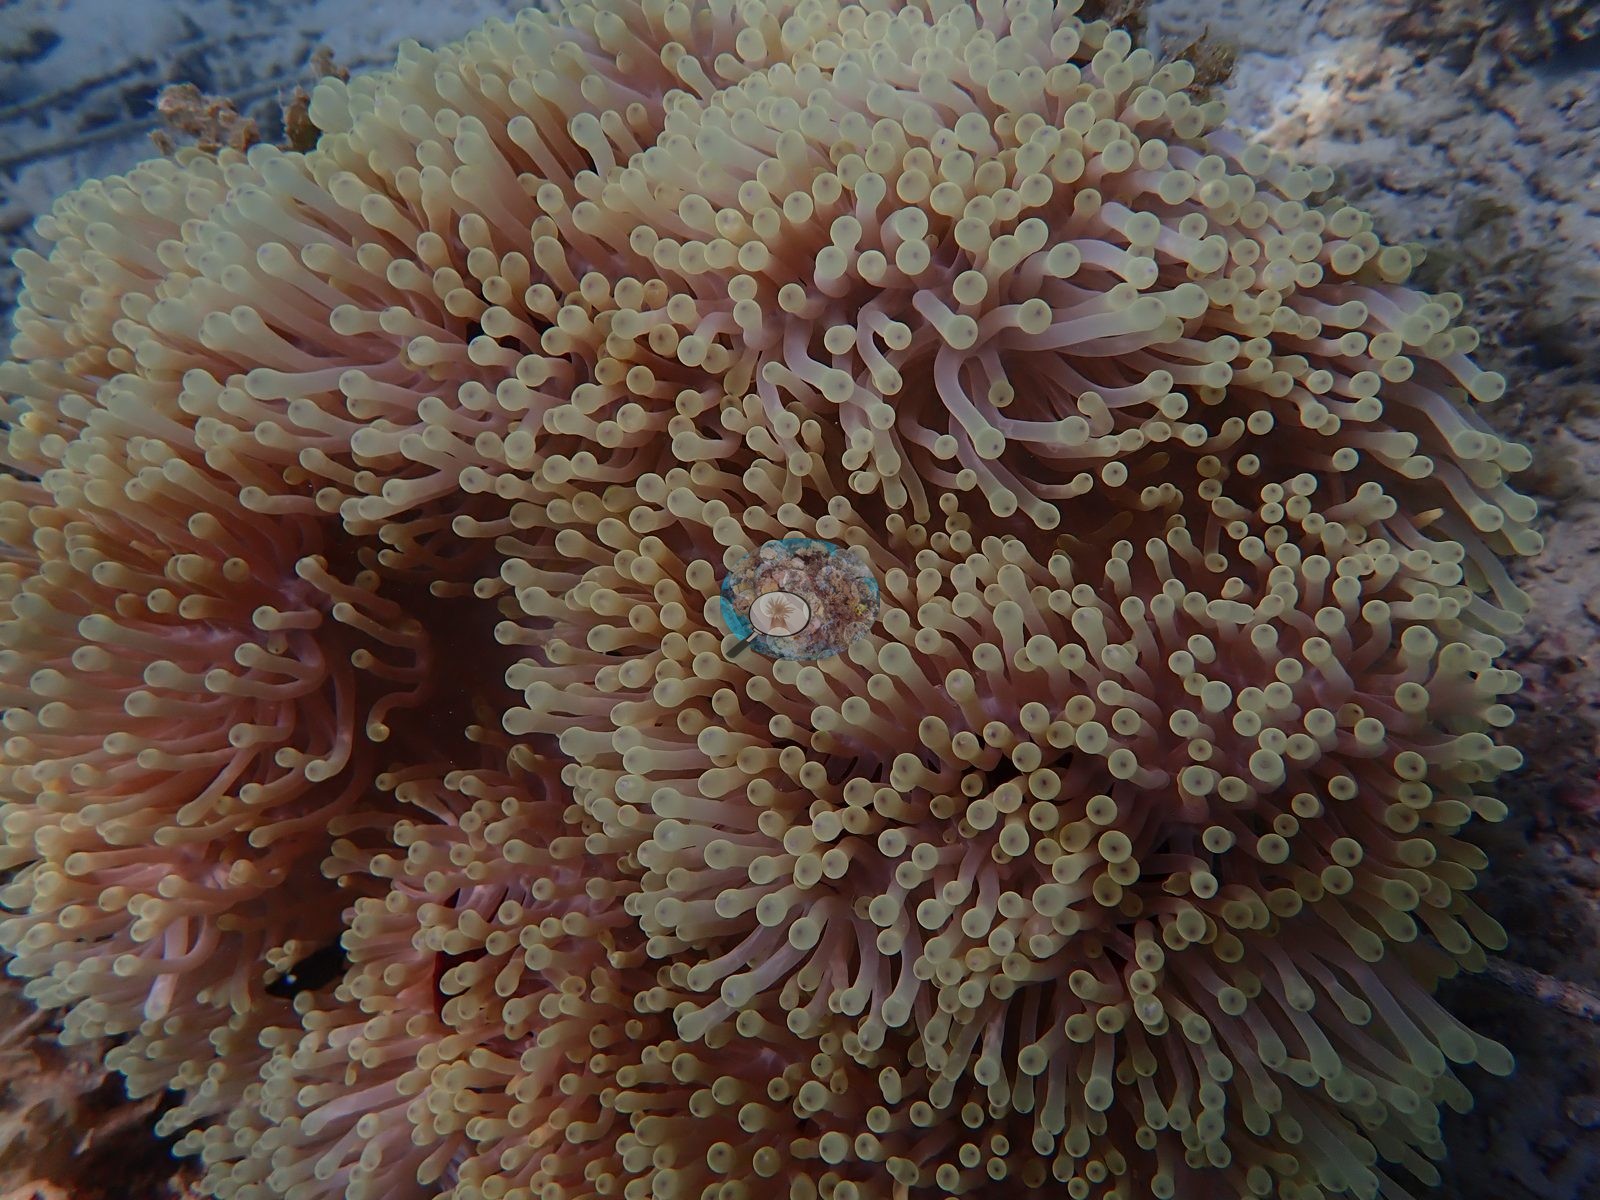
Anemone Garden is not typical reef. It is a lagoon patch whose bommies are carpeted almost wholesale by anemones consistent with Heteractis magnifica, with only 3.3% hard coral, and fleshy brown macroalgae over heavily silted rubble hold the flat around them. None of the reef sites showed widespread bleaching; a few pale colonies at Ti Korail could not be separated from natural coloration. Nearby 2019 surveys near Carpenter, Lost Anchor, and Aquarium / Big Rock differ from the 2025 values by only a few percentage points, which is too small to separate from differences in method. Sightings included a resting sea turtle and a day octopus at Aquarium / Big Rock, a leaf scorpionfish at Ti Korail, garden eels, and lionfish.
Highlights
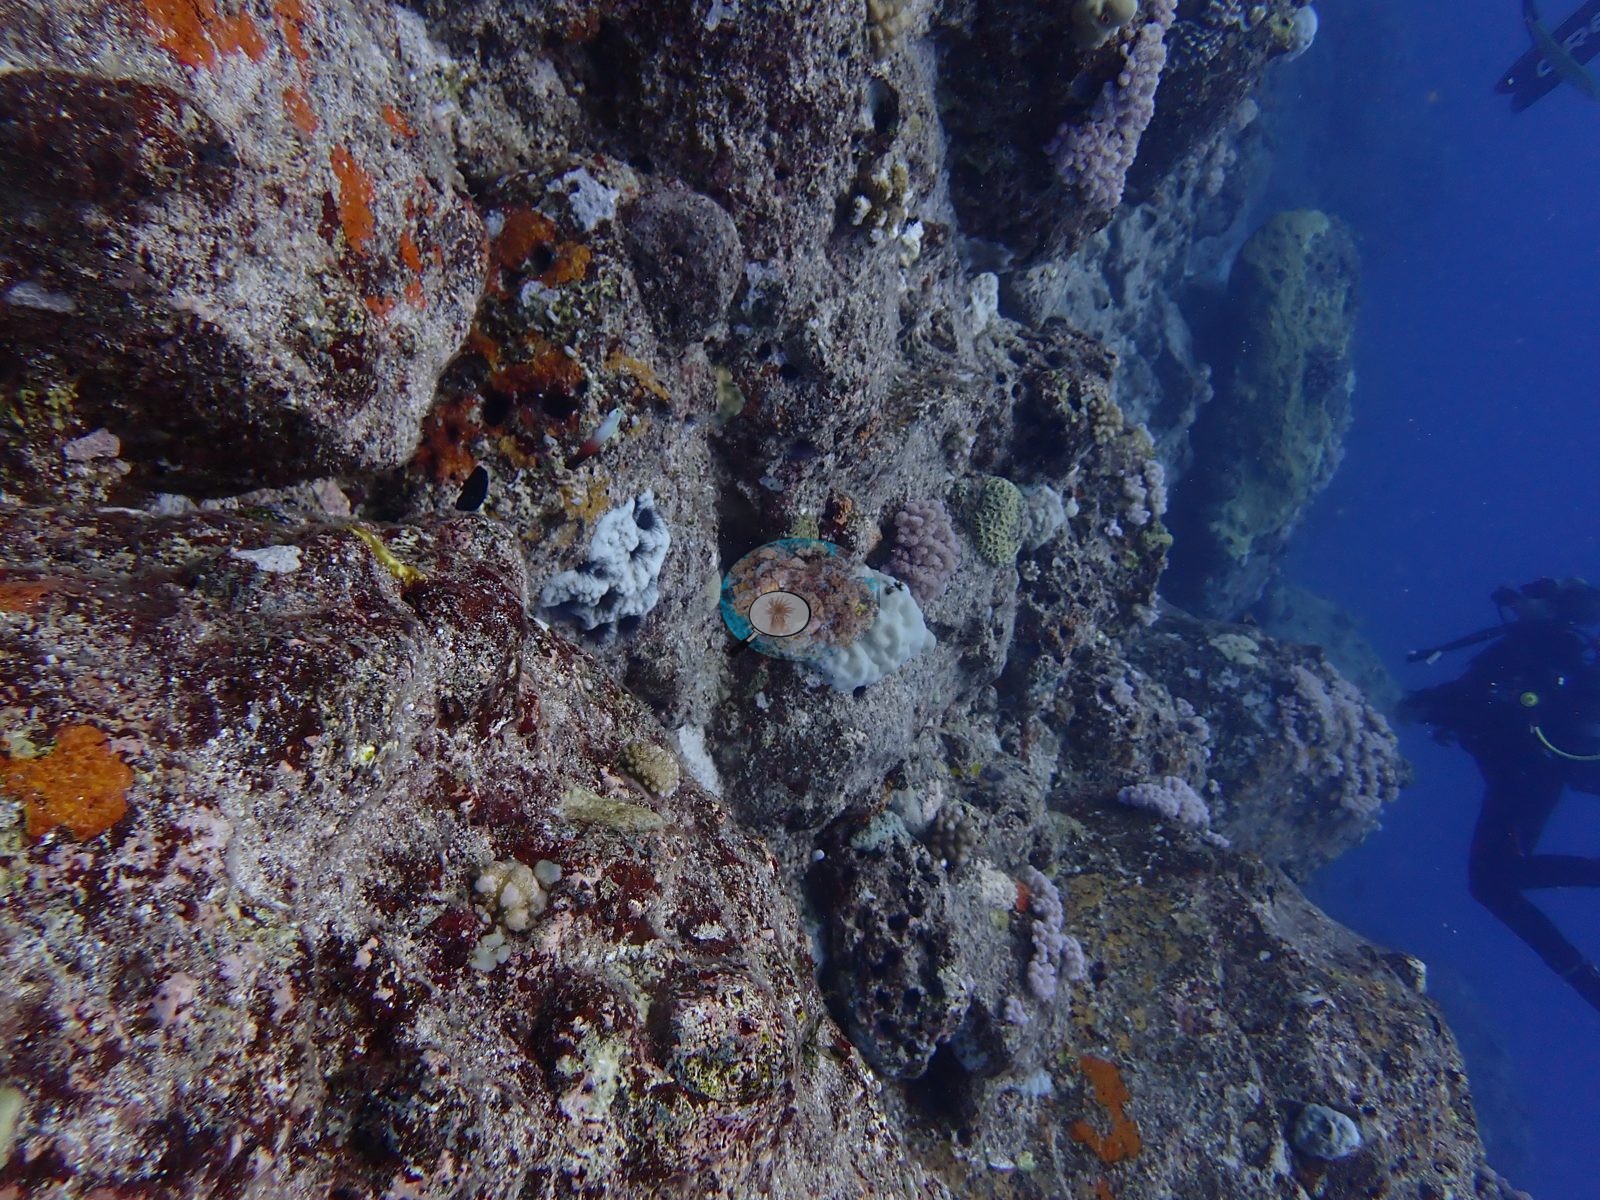
- Reef Garden had the highest manually scored hard coral cover of the seven sites, 26.3%, on bommies rising from a white sand flat.
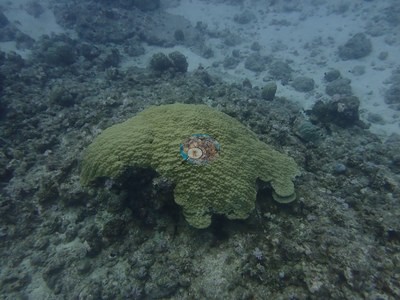 photo: Mauritius - Reef Garden
 - Dive depths ranged from 15.6 m at Ti Korail to 35.3 m on the wall sections at Bamboo.
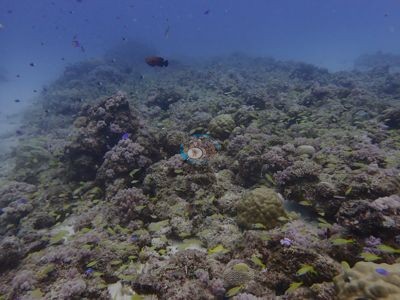 photo: Mauritius - Ti Korail
 - Carpenter's boulder field holds Porites domes about a diver's height tall, alongside table Acropora.
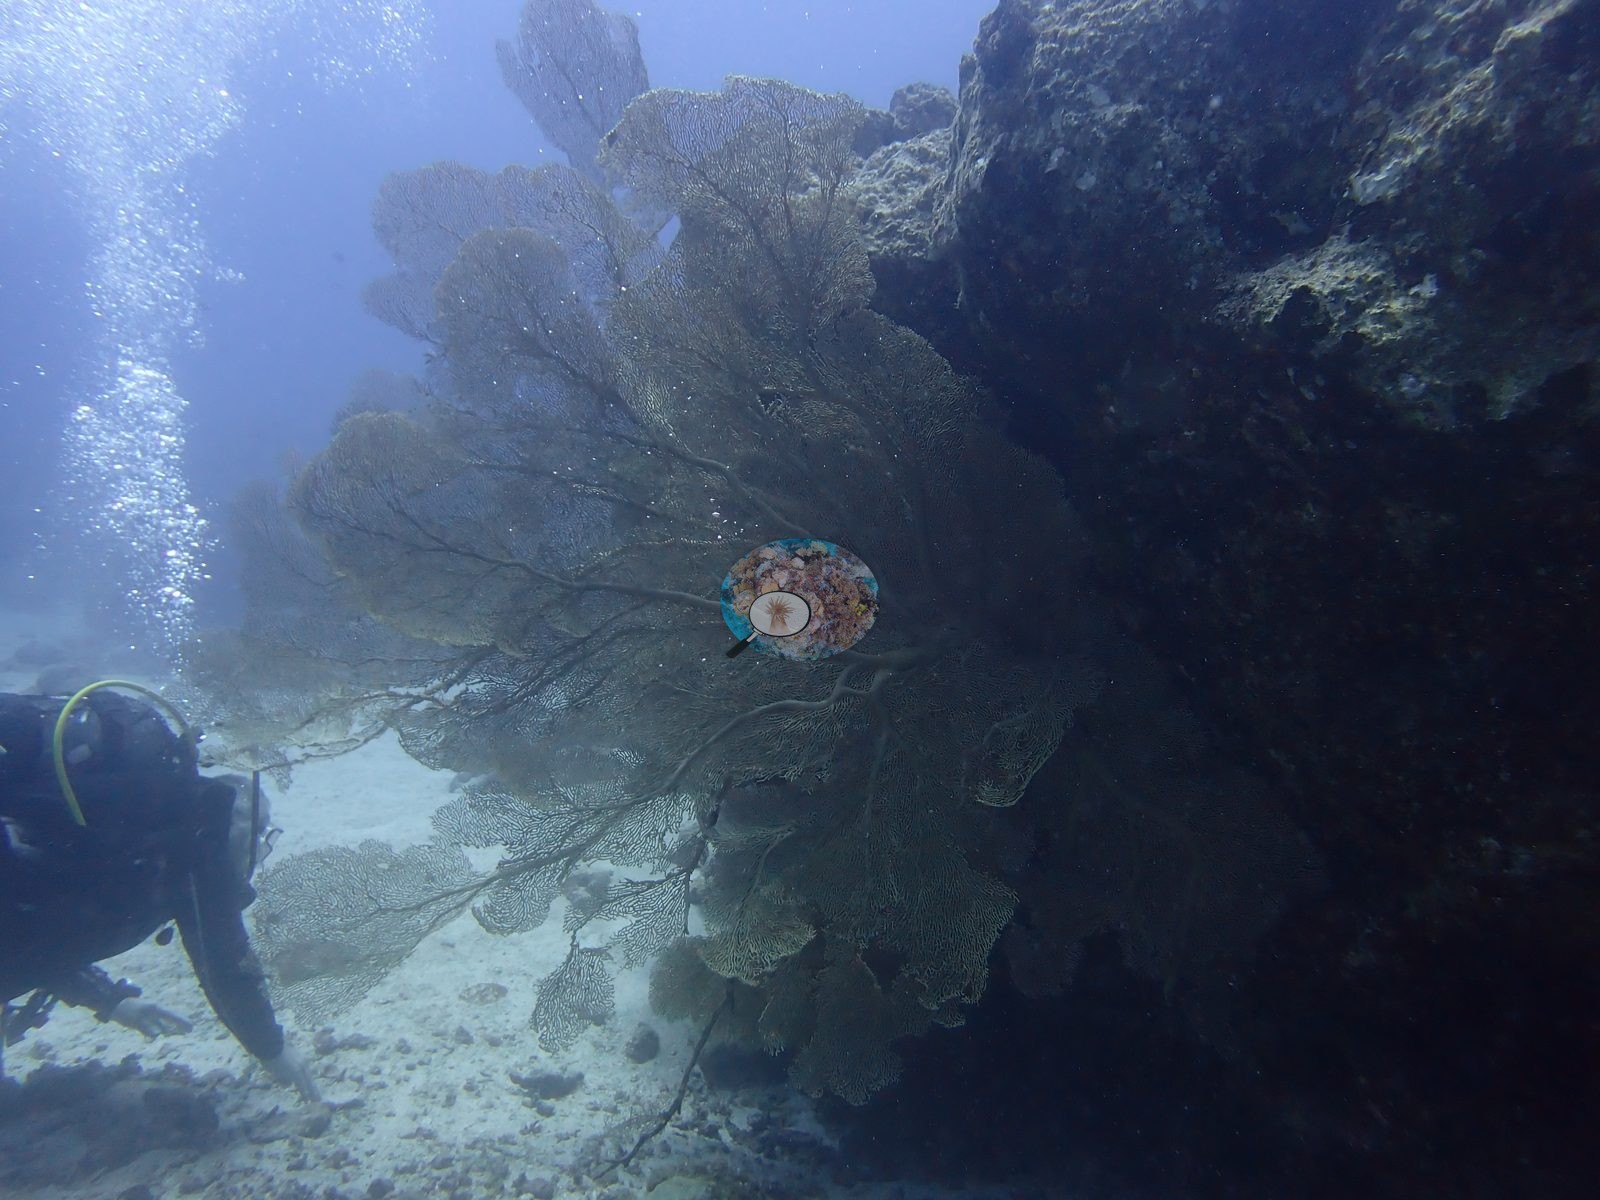
- Lost Anchor has a stand of large gorgonian sea fans rooted at the base of a rock face.
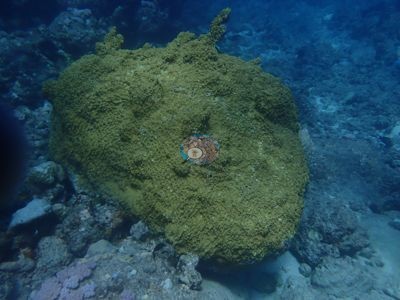 photo: Mauritius - Lost Anchor
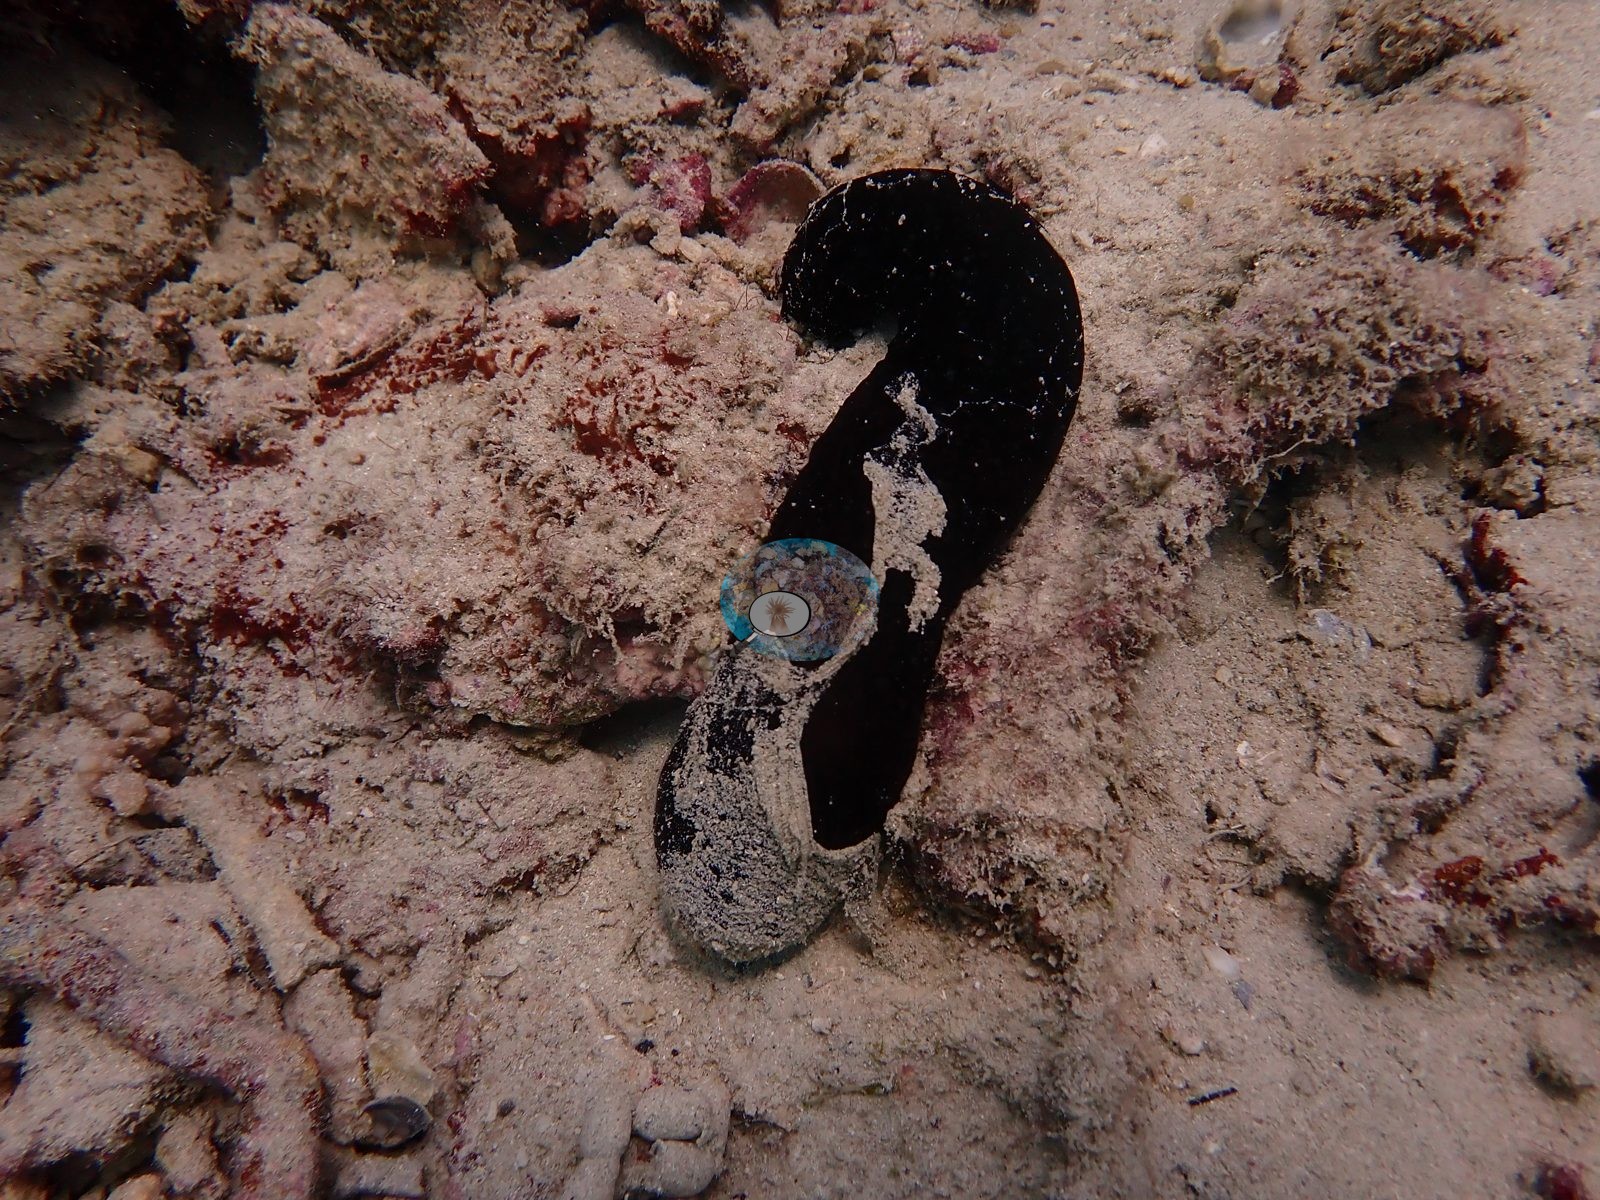
 - Anemone Garden is an anemone-dominated lagoon patch with 3.3% hard coral, not a typical reef.
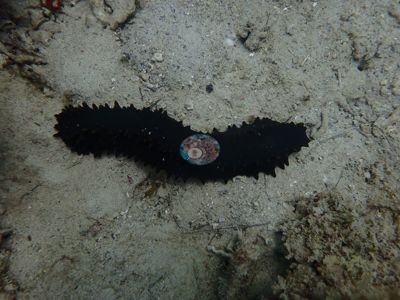 photo: Mauritius - Anemone Garden
 - No widespread bleaching was seen at any site in February 2025.
Ceci est une traduction automatique du résumé anglais ; le texte anglais fait foi. AI translation of this summary; the English is authoritative.
Regional setting
L'île Maurice (Mauritius), Rodrigues et La Réunion, les trois îles des Mascareignes (Mascarene Islands), se situent vers l'extrémité sud de la dorsale sous-marine des Mascareignes. Toutes trois sont des îles volcaniques géologiquement jeunes, et Spalding et al. (2001) décrivent une nette séquence de développement récifal le long de la chaîne : les récifs sont les moins développés autour de La Réunion, l'île la plus jeune, et deviennent plus développés et s'étendent plus loin au large vers les îles plus anciennes situées à l'est. Maurice est presque entièrement ceinturée de récifs frangeants, avec d'importants lagons et barrières récifales sur ses côtes est et sud-ouest. Ses lagons sont dominés par les algues, avec quelques herbiers, ses pentes récifales présentent une nette zone d'éperons et sillons, et en dessous d'environ 20 m les coraux ne forment généralement qu'un mince placage sur la roche volcanique. Spalding et al. (2001) estiment la surface récifale du pays à environ 870 km², un chiffre national qui inclut Rodrigues, le lointain banc de Cargados Carajos (Cargados Carajos Bank) et Agalega, et recensent 161 espèces de coraux. Le même ouvrage indique que l'épisode de blanchissement de 1998 a touché 30–40% des coraux mauriciens mais en a tué très peu, une survie que les auteurs relient au temps couvert et venteux pendant le cyclone Anacelle, et que de nombreux récifs avaient déjà été dégradés par la sédimentation et le ruissellement agricole consécutifs au défrichement des forêts, les rejets domestiques et industriels, l'ancienne pêche à l'explosif, les dégâts causés par les ancres, les proliférations d'acanthasters (étoiles de mer couronne d'épines) depuis le début des années 1980 et l'aménagement côtier lié au tourisme. À plus grande échelle, l'océan Indien occidental abrite environ 15 180 km² de récifs coralliens, soit près de 6% du total mondial (Souter et al. 2021).
Des évaluations plus récentes décrivent des récifs soumis à des pressions croissantes. Pour l'océan Indien occidental, Souter et al. (2021) indiquent que la couverture régionale en coraux durs a chuté après l'épisode de blanchissement de 1998, s'est rétablie à partir de 2004 jusqu'à un pic d'environ 32% en 2012, puis a de nouveau fortement baissé en 2013 et en 2017, les épisodes de blanchissement de 1998 et de 2016 étant les signaux les plus nets de la série ; ils situent environ 1 076 km² de récifs dans la sous-région Mascareignes et Cargados Carajos. Autour de Maurice même, Elliott et al. (2018) ont documenté un déclin de la couverture en coraux durs entre 1998 et 2010, qui s'est accentué après 2005 environ, et McClanahan & Muthiga (2021) ont enregistré une perte de 40% de la couverture en coraux durs entre 2004 et 2019, concentrée dans le sud et l'est, où les anomalies thermiques aiguës étaient les plus fréquentes. Les températures de surface de la mer autour de l'île augmentent d'environ 0.16°C par décennie et dépassent le seuil régional de blanchissement la plupart des années depuis 2000 (Doorga et al. 2023 (publisher page: the PDF on file is only the first page)), et NOAA Coral Reef Watch a enregistré un stress thermique sévère (8 degree heating weeks ou plus, c'est-à-dire semaines-degrés de chauffe) en 2016, en 2019–2020, puis à nouveau en 2024 et en 2025. Des pressions locales s'y ajoutent : l'échouement du vraquier Wakashio en 2020 a répandu du pétrole le long de la côte sud-est (Rajendran et al. 2022 (publisher page: the PDF on file is only the first page)), et les suivis menés sur l'ensemble de l'île continuent de signaler des maladies coralliennes et une santé des coraux compromise (Jogee et al. 2025).
Overview
L'unité de Maurice couvre sept sites plongés entre le 1er et le 10 février 2025, à des profondeurs allant de 15.6 m (Ti Korail) à 35.3 m (Bamboo). Quatre sites du nord (Reef Garden, Ti Korail, Carpenter et Lost Anchor, au large du Coin de Mire) sont des pâtés récifaux de faible relief et des champs de blocs entrecoupés de chenaux de sable et de débris, bien que Carpenter présente aussi des faces de blocs plus abruptes. Aquarium / Big Rock, au large du Morne, est bâti sur d'énormes blocs volcaniques et des éperons rocheux. Bamboo, plongé le même jour, associe une base de débris recouverte d'une fine couche de sable à des sections de tombant presque vertical.
Les Porites massifs sont les bâtisseurs de charpente les plus constants. Ils sont accompagnés de coraux cerveaux compatibles avec Platygyra et Dipsastraea/Favites, d'Acropora tabulaires et branchus, et de Pocillopora. À Carpenter, certains dômes de Porites s'élèvent à environ une hauteur de plongeur au-dessus du fond. Les coraux vivants sont répartis par taches et concentrés sur le sommet et les flancs des blocs, le gazon algal, les algues corallines encroûtantes et les éponges encroûtantes occupant l'essentiel de la roche restante. La couverture estimée à partir des photos sur les six sites récifaux allait de 12.3% à Aquarium / Big Rock à 30.2% à Reef Garden, qui présentait aussi la valeur la plus élevée en analyse manuelle (26.3%). Reef Garden comporte en outre des pentes tapissées de coraux mous, tandis que le fond dur dégagé de Bamboo porte des groupes denses d'oursins de type Diadema.
Anemone Garden n'est pas un récif typique. Il s'agit d'un pâté lagonaire dont les massifs coralliens sont presque entièrement tapissés d'anémones compatibles avec Heteractis magnifica, avec seulement 2.7% de coraux durs, tandis que les macroalgues et les débris envasés occupent le fond plat qui les entoure. Aucun des sites récifaux ne montrait de blanchissement étendu ; quelques colonies pâles à Ti Korail ne pouvaient être distinguées d'une coloration naturelle. Des relevés de 2019 effectués à proximité de Carpenter, Lost Anchor et Aquarium / Big Rock ne diffèrent des valeurs de 2025 que de quelques points de pourcentage, un écart trop faible pour être distingué des différences de méthode. Parmi les observations figuraient une tortue marine au repos et un poulpe diurne à Aquarium / Big Rock, un poisson-feuille à Ti Korail, des anguilles jardinières et des poissons-lions.
Highlights
- Reef Garden présentait la couverture en coraux durs la plus élevée des sept sites en analyse manuelle, 26.3%, sur des massifs coralliens s'élevant d'un fond de sable blanc.
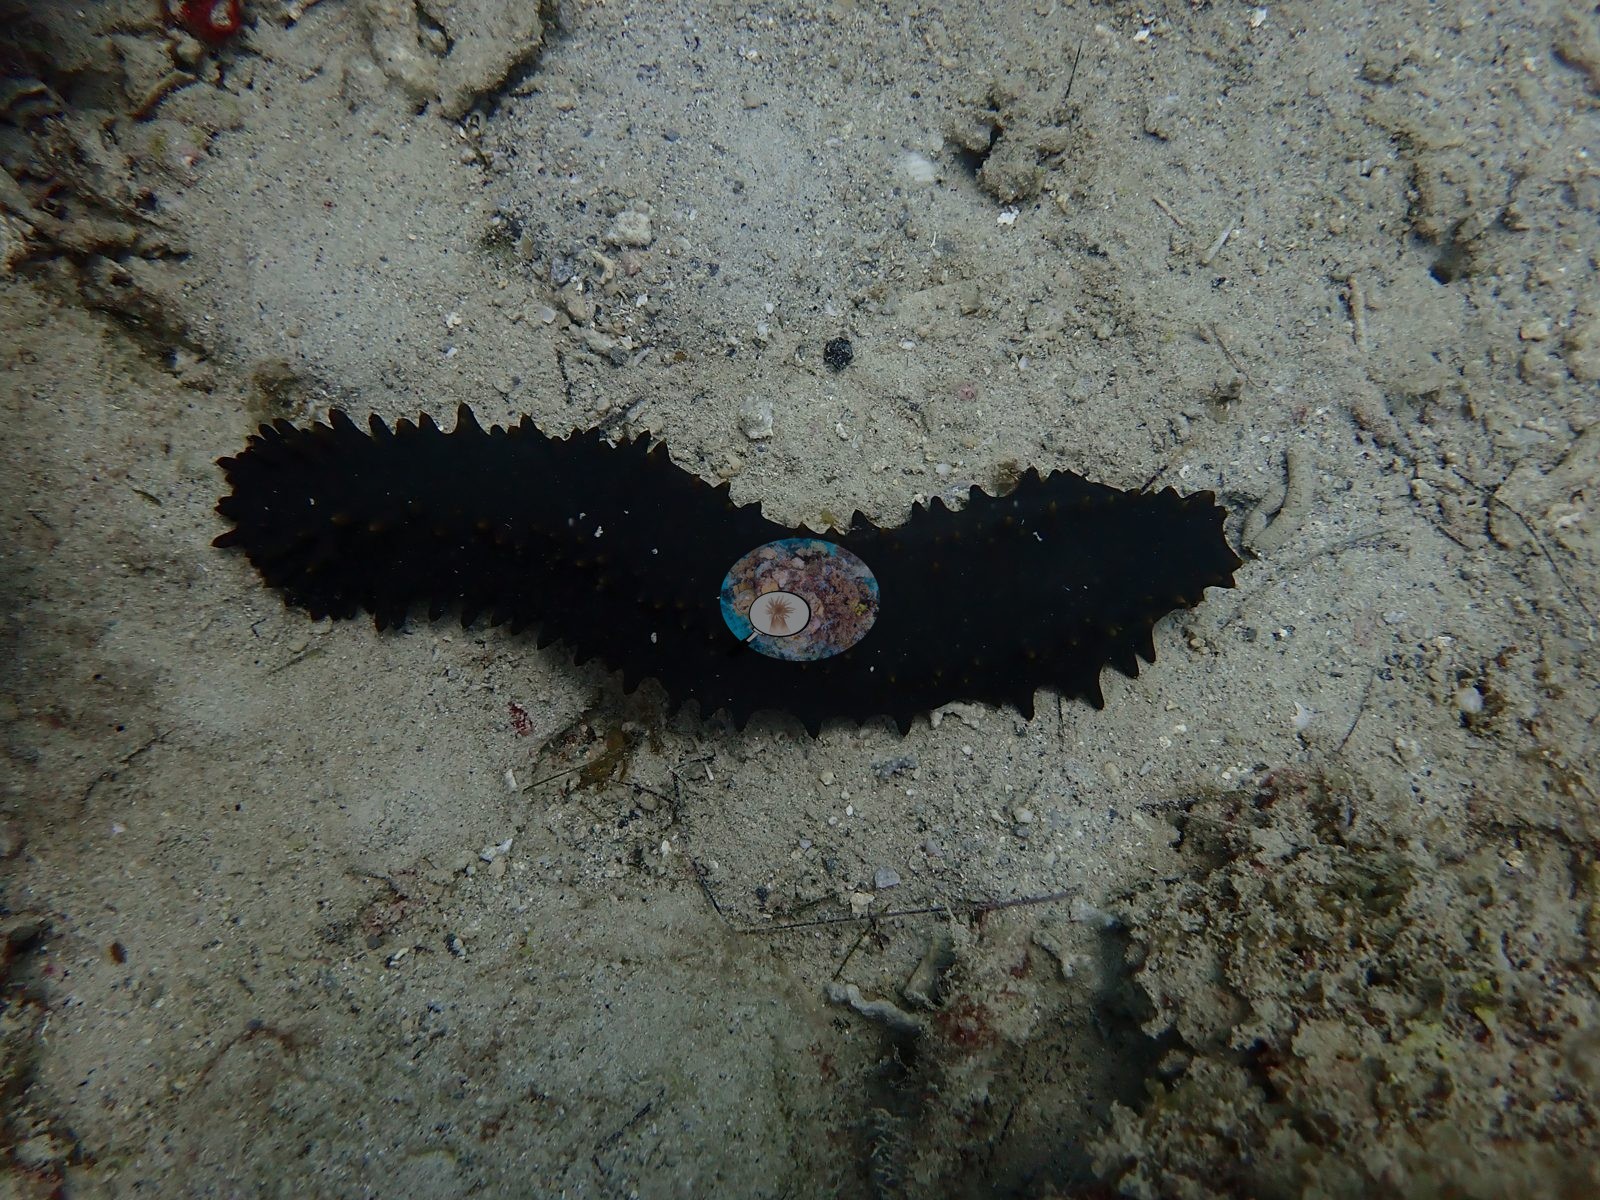
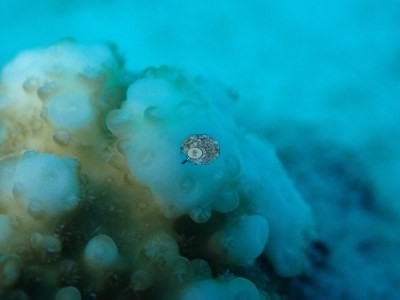 photo: Mauritius - Reef Garden
 - Les profondeurs de plongée allaient de 15.6 m à Ti Korail à 35.3 m sur les sections de tombant de Bamboo.
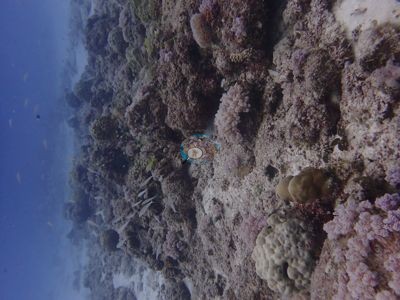 photo: Mauritius - Ti Korail
 - Le champ de blocs de Carpenter abrite des dômes de Porites d'environ une hauteur de plongeur, à côté d'Acropora tabulaires.
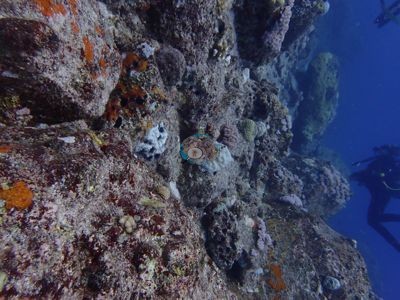 photo: Mauritius - Carpenter
 - Lost Anchor possède un groupe de grandes gorgones éventails ancrées au pied d'une paroi rocheuse.
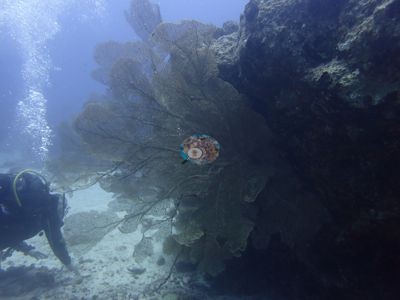 photo: Mauritius - Lost Anchor
 - Anemone Garden est un pâté lagonaire dominé par les anémones, avec 2.7% de coraux durs, et non un récif typique.
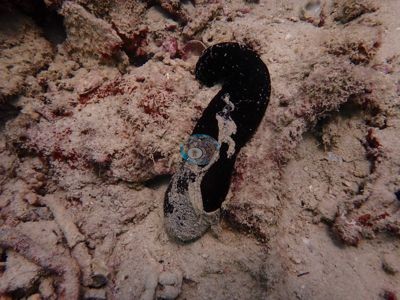 photo: Mauritius - Anemone Garden
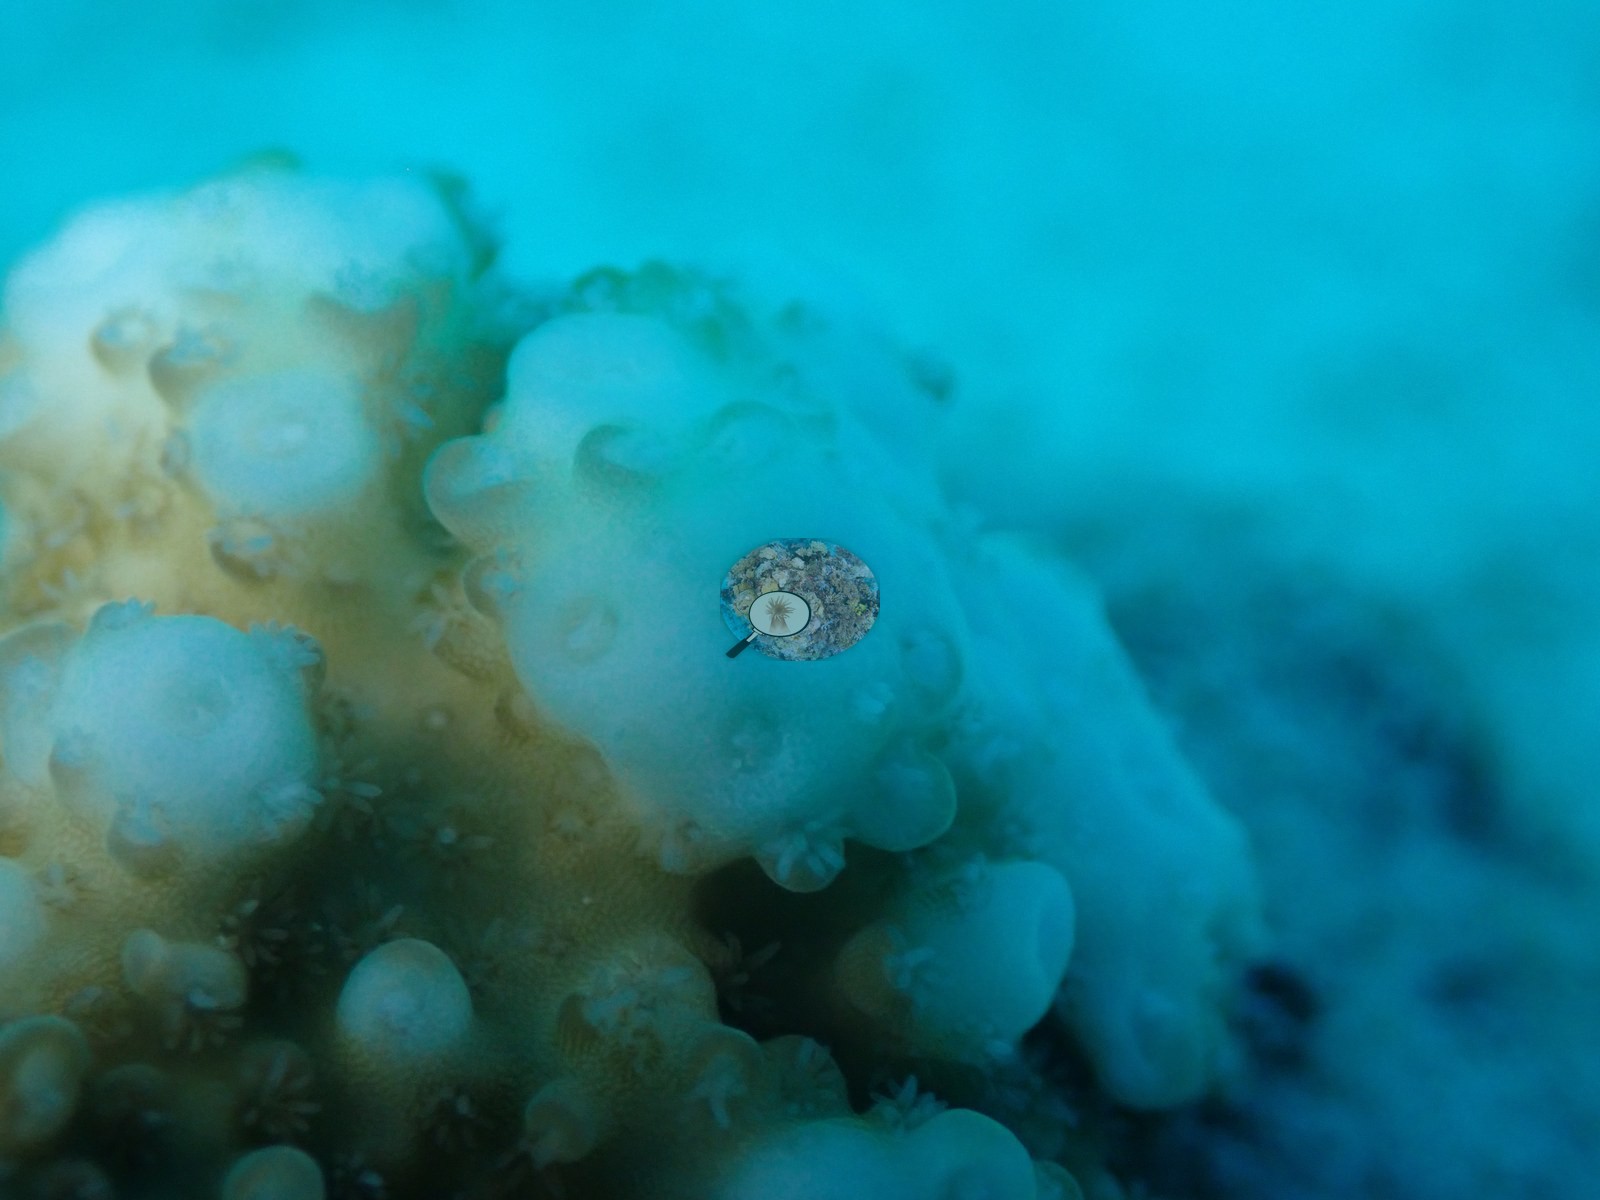
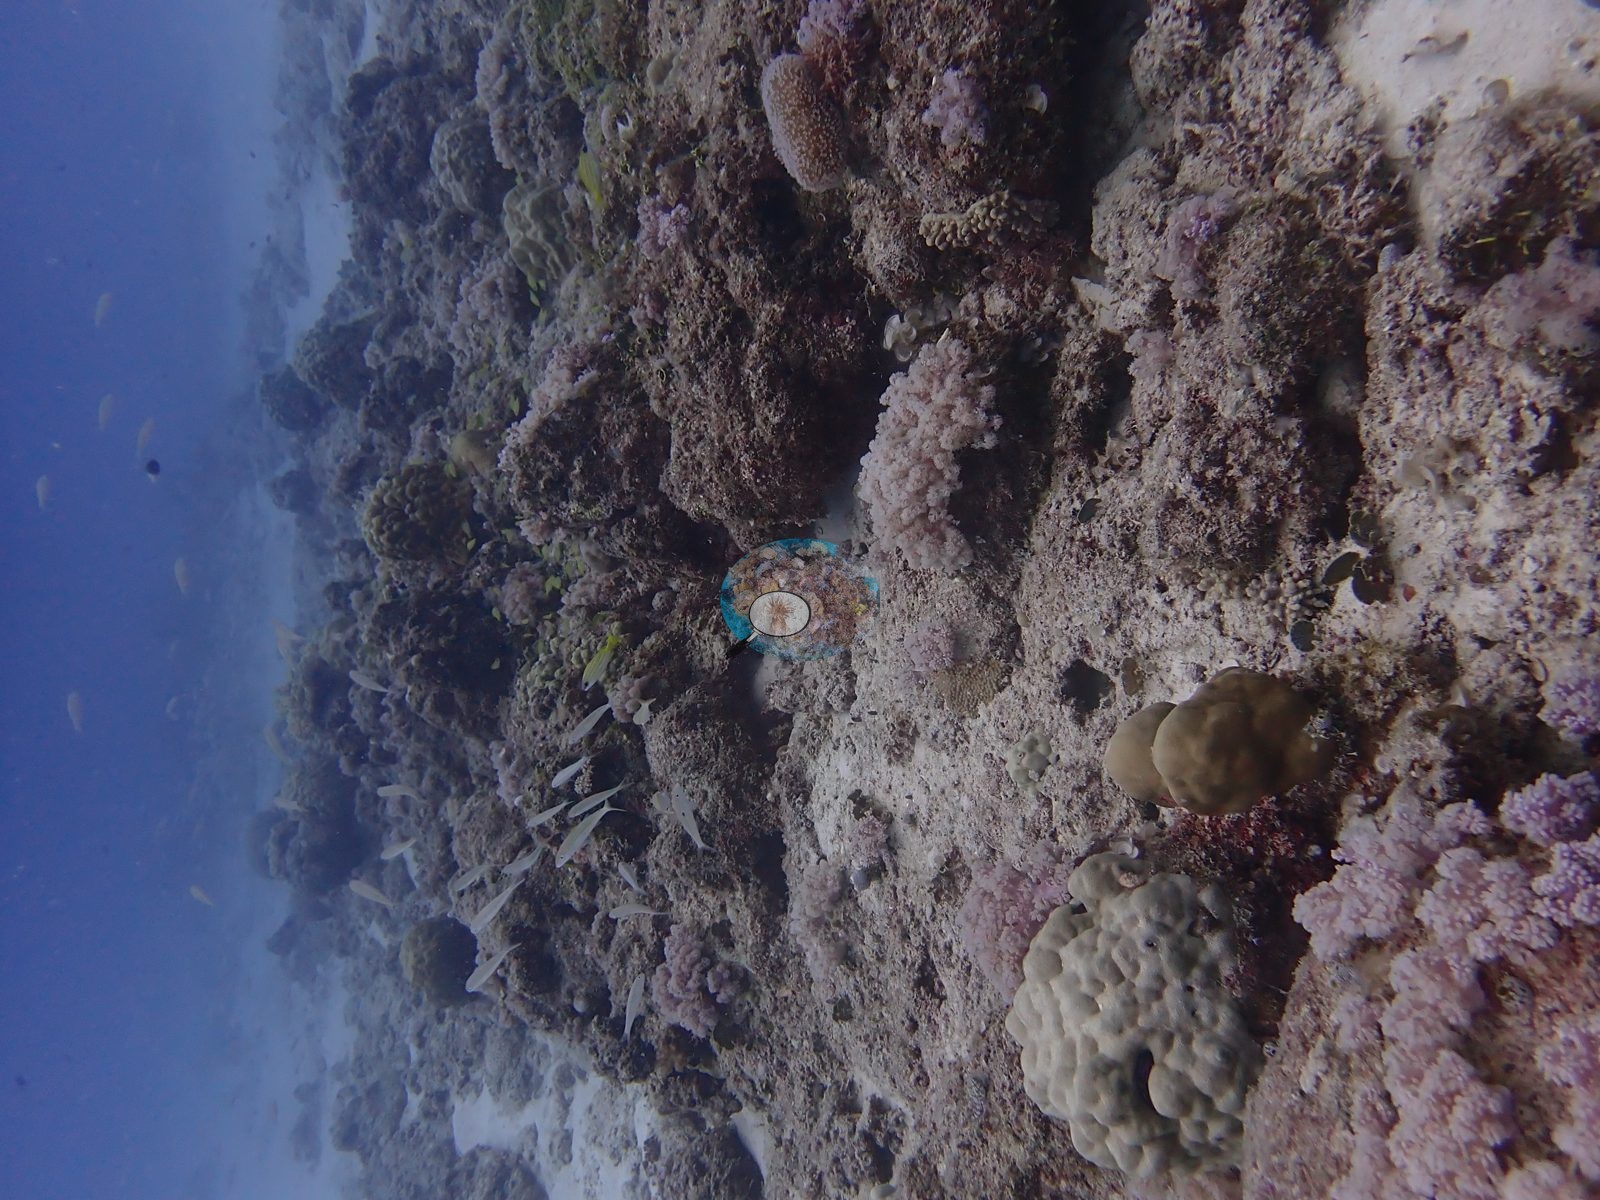
 - Aucun blanchissement étendu n'a été observé sur aucun des sites en février 2025.
Notable observations
- Mauritius - Ti Korail: Possible bleaching: a few colonies showed pale or whitened polyps that image quality alone cannot reliably distinguish from natural coloration; no widespread bleaching.
- Mauritius - Anemone Garden: Macroalgae and sediment: fleshy brown algae over silted rubble, not coral, hold the substrate; sediment loading on the substrate is heavy.
Coral cover over time (pooled)
Sites in this region
- Mauritius - Anemone Garden — 2.9% coral cover
- Mauritius - Aquarium / Big Rock — 17% coral cover
- Mauritius - Bamboo — 17% coral cover
- Mauritius - Carpenter — 18% coral cover
- Mauritius - Lost Anchor — 10% coral cover
- Mauritius - Reef Garden — 18% coral cover
- Mauritius - Ti Korail — 5.4% coral cover
% coral cover by method
Pooled across 7 dive sites
| Method | Mean % coral cover | Std. dev. between dive sites | n dive sites | Note |
|---|---|---|---|---|
| Manual point count (author) | 13.2% | ±7.6 | 7 | frame-weighted 15.7% over 344 frames |
| CoralNet automated point classifier | 12.3% | ±7.1 | 7 | frame-weighted 15.2% over 344 frames |
| CoralSCOP (SAM-based mask-sum), unedited photos | 20.7% | ±5.4 | 7 | frame-weighted 20.9% over 344 frames |
| Claude (Anthropic), blind point count | 11.5% | ±7.6 | 7 | frame-weighted 14.4% over 344 frames |
| In-house DINOv3 point classifier | 25.2% | ±10 | 7 | frame-weighted 28.9% over 344 frames |
The mean is an UNWEIGHTED mean of the dive site values — each dive site counts once, whatever its photo count — which is the convention of the published tables and of every other figure on this page. The frame-weighted alternative is given per method in the Note column; where the two differ, the difference is a photo-count imbalance, not a coral-cover finding.
By dive site
| Dive site | Manual point count | CoralNet | CoralSCOP (unedited) | Claude | DINOv3 |
|---|---|---|---|---|---|
| Reef Garden | 26.3% n=105 | 27.8% n=105 | 22.2% n=105 | 26.7% n=105 | 44.6% n=105 |
| Bamboo | 17.2% n=40 | 11.8% n=40 | 16.9% n=40 | 13.8% n=40 | 19.9% n=40 |
| Carpenter | 14.6% n=40 | 10.9% n=40 | 21.0% n=40 | 12.3% n=40 | 21.2% n=40 |
| Aquarium-Big Rock | 14.0% n=40 | 7.0% n=40 | 13.0% n=40 | 8.3% n=40 | 15.3% n=40 |
| Lost Anchor | 10.5% n=39 | 10.0% n=39 | 20.5% n=39 | 9.2% n=39 | 20.3% n=39 |
| Ti Korail | 7.0% n=40 | 10.6% n=40 | 20.5% n=40 | 7.4% n=40 | 21.9% n=40 |
| Anemone Garden | 2.7% n=40 | 7.7% n=40 | 30.5% n=40 | 2.9% n=40 | 33.3% n=40 |
n under each value is the number of photographs that method scored at that dive site. ⚠ marks a cell that is not an independent check.
Reference: point-count on the photographs (a human scoring the same pixels the models see). Denominator: coral points / all 30 points, water and fish left IN the denominator (the basis the canonical sheet uses). Source: draft manuscript value, not yet published ⚠ This region's values are on the ALL-30 denominator (water and fish left in), not the settled Mayfield-2025 rule used at Oman, Kenya and the Red Sea. The settled rule would raise every Mauritius site by 0–3.7 pp. Awaiting Anderson's ruling. The Claude row is the manuscript's Claude (with image context) value, scored on the same manual-reference frames as the manual count (v42 Table 3); the last of its five context batches had been seen before, so it is not fully blind. Anemone Garden is flagged non-reef in the source (anemone habitat); its manual value stands but carries no error term.
Nearby external survey stations
30 independent survey records within 5 km of a site in this region (deduplicated across sites).
Show all 30 records
- Original collectors (compiled by McClanahan et al. 2016) — ALR/ALBC (Mauritius) (2016): 89% hard coral cover, 3.22 km from Mauritius - Carpenter
- Original collectors (compiled by McClanahan et al. 2016) — ALR/ALLC (Mauritius) (2016): 98% hard coral cover, 3.25 km from Mauritius - Carpenter
- Pisternick et al. 2020 (PANGAEA) — FEF_C_11_1 (Flic en Flac, Control) (2018): 0.0% hard coral cover, 0.21 km from Mauritius - Aquarium / Big Rock
- Pisternick et al. 2020 (PANGAEA) — FEF_C_13_1 (Flic en Flac, Control) (2018): 0.0% hard coral cover, 0.20 km from Mauritius - Aquarium / Big Rock
- Pisternick et al. 2020 (PANGAEA) — FEF_C_15_1 (Flic en Flac, Control) (2018): 0.0% hard coral cover, 0.09 km from Mauritius - Aquarium / Big Rock
- Pisternick et al. 2020 (PANGAEA) — FEF_C_17_1 (Flic en Flac, Control) (2018): 0.0% hard coral cover, 0.24 km from Mauritius - Aquarium / Big Rock
- Pisternick et al. 2020 (PANGAEA) — FEF_C_1_1 (Flic en Flac, Control) (2018): 0.0% hard coral cover, 0.21 km from Mauritius - Aquarium / Big Rock
- Pisternick et al. 2020 (PANGAEA) — FEF_C_3_1 (Flic en Flac, Control) (2018): 0.0% hard coral cover, 0.10 km from Mauritius - Aquarium / Big Rock
- Pisternick et al. 2020 (PANGAEA) — FEF_C_5_1 (Flic en Flac, Control) (2018): 0.0% hard coral cover, 0.24 km from Mauritius - Aquarium / Big Rock
- Pisternick et al. 2020 (PANGAEA) — FEF_C_7_1 (Flic en Flac, Control) (2018): 0.0% hard coral cover, 0.18 km from Mauritius - Aquarium / Big Rock
- Pisternick et al. 2020 (PANGAEA) — FEF_C_9_1 (Flic en Flac, Control) (2018): 0.0% hard coral cover, 0.02 km from Mauritius - Aquarium / Big Rock
- Pisternick et al. 2020 (PANGAEA) — FEF_SGD_11_1 (Flic en Flac, SGD) (2018): 4.0% hard coral cover, 1.39 km from Mauritius - Aquarium / Big Rock
- Pisternick et al. 2020 (PANGAEA) — FEF_SGD_13_1 (Flic en Flac, SGD) (2018): 0.0% hard coral cover, 1.19 km from Mauritius - Aquarium / Big Rock
- Pisternick et al. 2020 (PANGAEA) — FEF_SGD_15_1 (Flic en Flac, SGD) (2018): 13% hard coral cover, 1.39 km from Mauritius - Aquarium / Big Rock
- Pisternick et al. 2020 (PANGAEA) — FEF_SGD_17_1 (Flic en Flac, SGD) (2018): 0.0% hard coral cover, 1.59 km from Mauritius - Aquarium / Big Rock
- Pisternick et al. 2020 (PANGAEA) — FEF_SGD_1_1 (Flic en Flac, SGD) (2018): 0.0% hard coral cover, 1.21 km from Mauritius - Aquarium / Big Rock
- Pisternick et al. 2020 (PANGAEA) — FEF_SGD_3_1 (Flic en Flac, SGD) (2018): 12% hard coral cover, 1.41 km from Mauritius - Aquarium / Big Rock
- Pisternick et al. 2020 (PANGAEA) — FEF_SGD_7_1 (Flic en Flac, SGD) (2018): 4.0% hard coral cover, 1.59 km from Mauritius - Aquarium / Big Rock
- Pisternick et al. 2020 (PANGAEA) — FEF_SGD_9_1 (Flic en Flac, SGD) (2018): 29% hard coral cover, 1.19 km from Mauritius - Aquarium / Big Rock
- Reef Check — Island Reef (1999): 61% hard coral cover, 0.30 km from Mauritius - Reef Garden
- Reef Check — Island Reef (2000): 30% hard coral cover, 0.30 km from Mauritius - Reef Garden
- Reef Check — Island Reef (2000): 46% hard coral cover, 0.30 km from Mauritius - Reef Garden
- Reef Check — Island Reef, Anse La Raie (1999): 46% hard coral cover, 2.81 km from Mauritius - Carpenter
- WCS Kenya / University of Mauritius via MERMAID — Anenome/Mahebourg (2019): 18% hard coral cover, 0.04 km from Mauritius - Anemone Garden
- WCS Kenya / University of Mauritius via MERMAID — Coin de Mire (2019): 10% hard coral cover, 0.27 km from Mauritius - Lost Anchor
- WCS Kenya / University of Mauritius via MERMAID — Flic and Flac (2019): 30% hard coral cover, 1.29 km from Mauritius - Aquarium / Big Rock
- WCS Kenya / University of Mauritius via MERMAID — Flic&Flac Reef lagoon (2019): 17% hard coral cover, 1.29 km from Mauritius - Aquarium / Big Rock
- WCS Kenya / University of Mauritius via MERMAID — Flic&Flac ReefSlope (2019): 13% hard coral cover, 1.29 km from Mauritius - Aquarium / Big Rock
- WCS via MERMAID — Bain Boeuf (2016): 71% hard coral cover, 1.32 km from Mauritius - Ti Korail
- WCS via MERMAID — Pointe D'Esny (2016): 73% hard coral cover, 1.78 km from Mauritius - Anemone Garden
All images from Coral Reef Diagnostics. Data are from Coral Reef Diagnostics and Reef Check Foundation and NOAA Coral Reef Watch.
 © Coral Reef Diagnostics.
References
- Jogee SY, et al. (2025) Variable prevalence of diseases and compromised health conditions on hard corals around Mauritius, Western Indian Ocean. Bulletin of Marine Science. [PDF]
- Doorga J, et al. (2023) Risk assessment of coral reef vulnerability to climate change and stressors in tropical islands: the case of Mauritius. Science of The Total Environment, 891: 164648. [PDF] (publisher page: the PDF on file is only the first page)
- Elliott J, et al. (2018) Decline in coral cover and flattening of the reefs around Mauritius (1998-2010). PeerJ, 6: e6014. [PDF]
- McClanahan T, Muthiga N (2021) Oceanic patterns of thermal stress and coral community degradation on the island of Mauritius. Coral Reefs, 40(1): 53-74. [PDF]
- Rajendran S, et al. (2022) History of a disaster: a baseline assessment of the Wakashio oil spill on the coast of Mauritius, Indian Ocean. Marine Pollution Bulletin, 175: 113330. [PDF] (publisher page: the PDF on file is only the first page)
- Souter D, et al. (eds) (2021) Status of Coral Reefs of the World: 2020. International Coral Reef Initiative / Global Coral Reef Monitoring Network. [PDF]
- Spalding MD, et al. (2001) World Atlas of Coral Reefs. University of California Press, Berkeley. [PDF]
- Pisternick T, Lilkendey J, Audit-Manna A, Dumur Neelayya D, et al. (2020). Benthic cover for Troux aux Biches and Flic en Flac lagoons, Mauritius. PANGAEA dataset. DOI