
Mauritius - Ti Korail

Part of the regional summary: Mauritius
More info
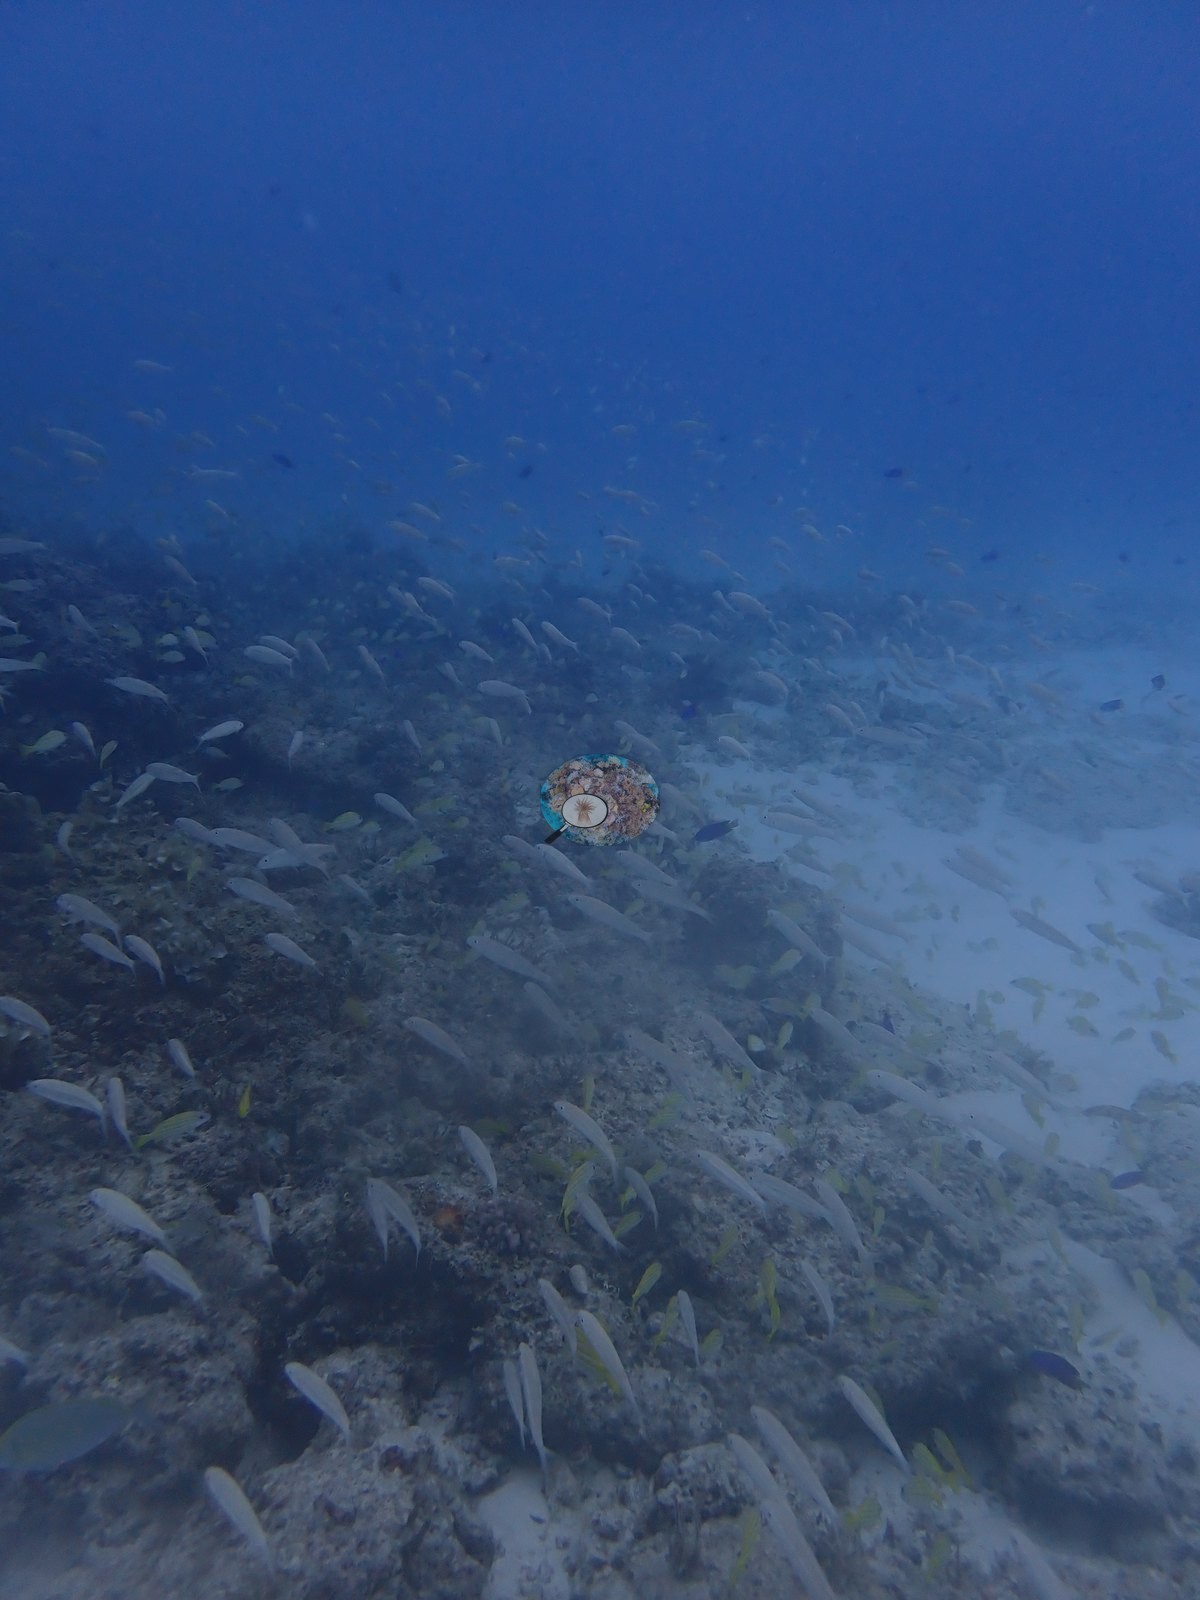
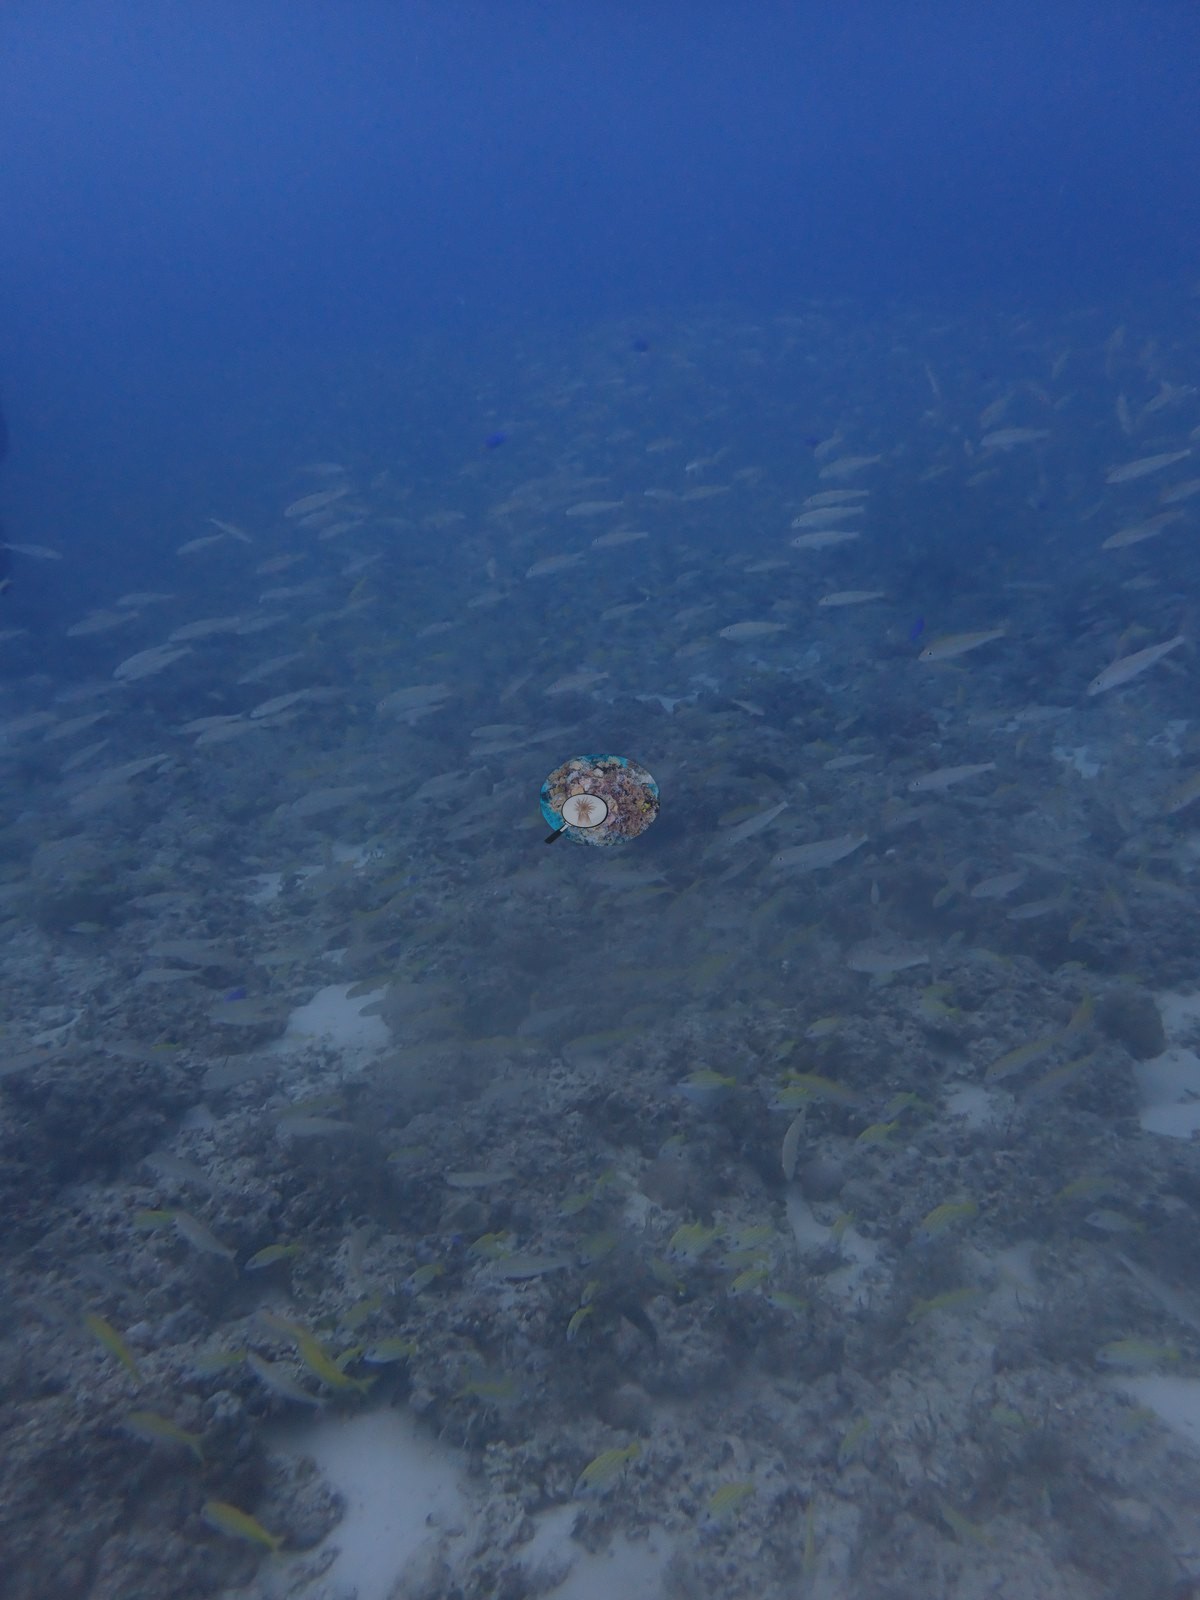
Southern Mauritius (NOAA CRW virtual station)A low-relief Mauritius patch reef and rubble-sand flat where isolated healthy coral heads sit among bare, sediment-covered ground, under dense schools of bluestripe snapper and fusiliers. Notable sightings included a large porcupinefish, a leaf scorpionfish, an octopus, a giant clam, and garden eels.
Un récif de patch à faible relief et un fond de débris et de sable où des têtes coralliennes isolées et saines reposent sur un substrat nu chargé de sédiments, sous des bancs denses de lutjans à bandes bleues et de fusiliers. Observations notables : un gros poisson-porc-épic, une rascasse-feuille, un poulpe, un bénitier et des anguilles-jardinières.
Traduction par IA de ce résumé ; la version anglaise fait foi.
Four independent survey stations shown with the program’s logo — click one to see how far it is from this site.
One other CRD dive site within 5 km shown in orange — click a marker to open its page.
18 of these 50 photographs are shown beside the text that discusses them under "Site description" below.
Site description
Setting
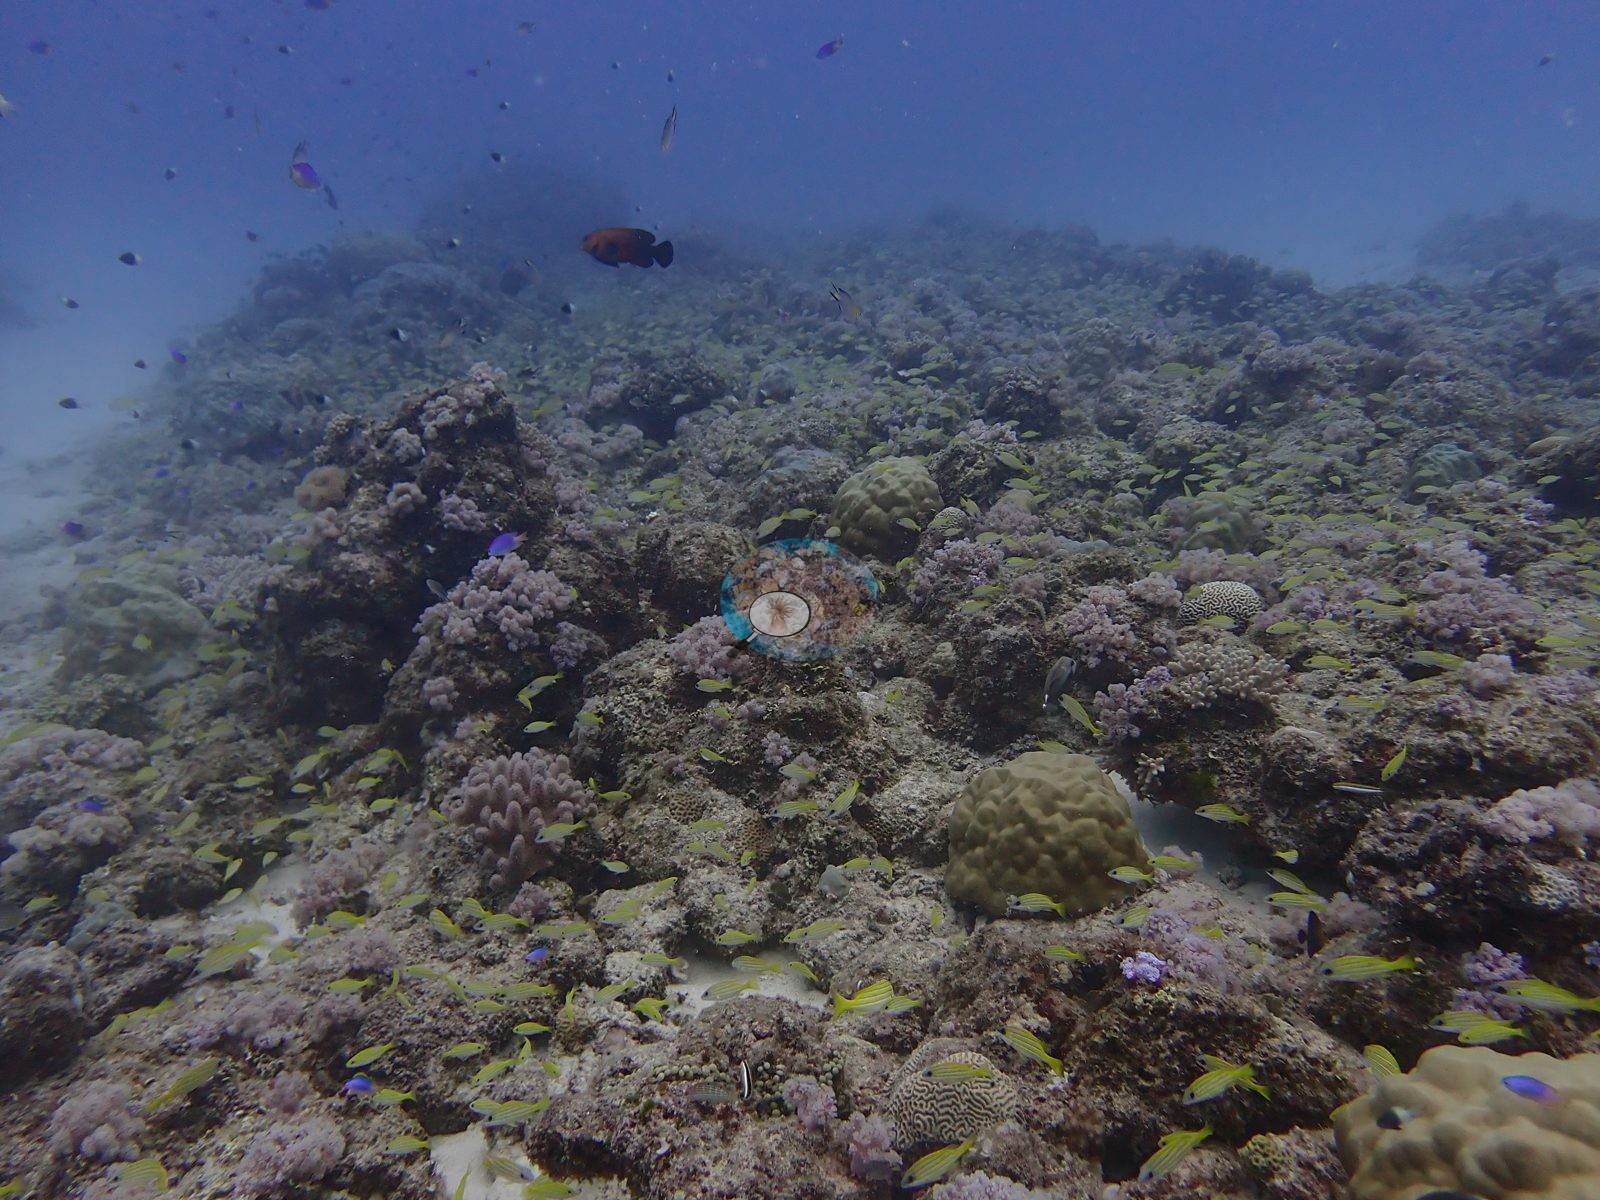
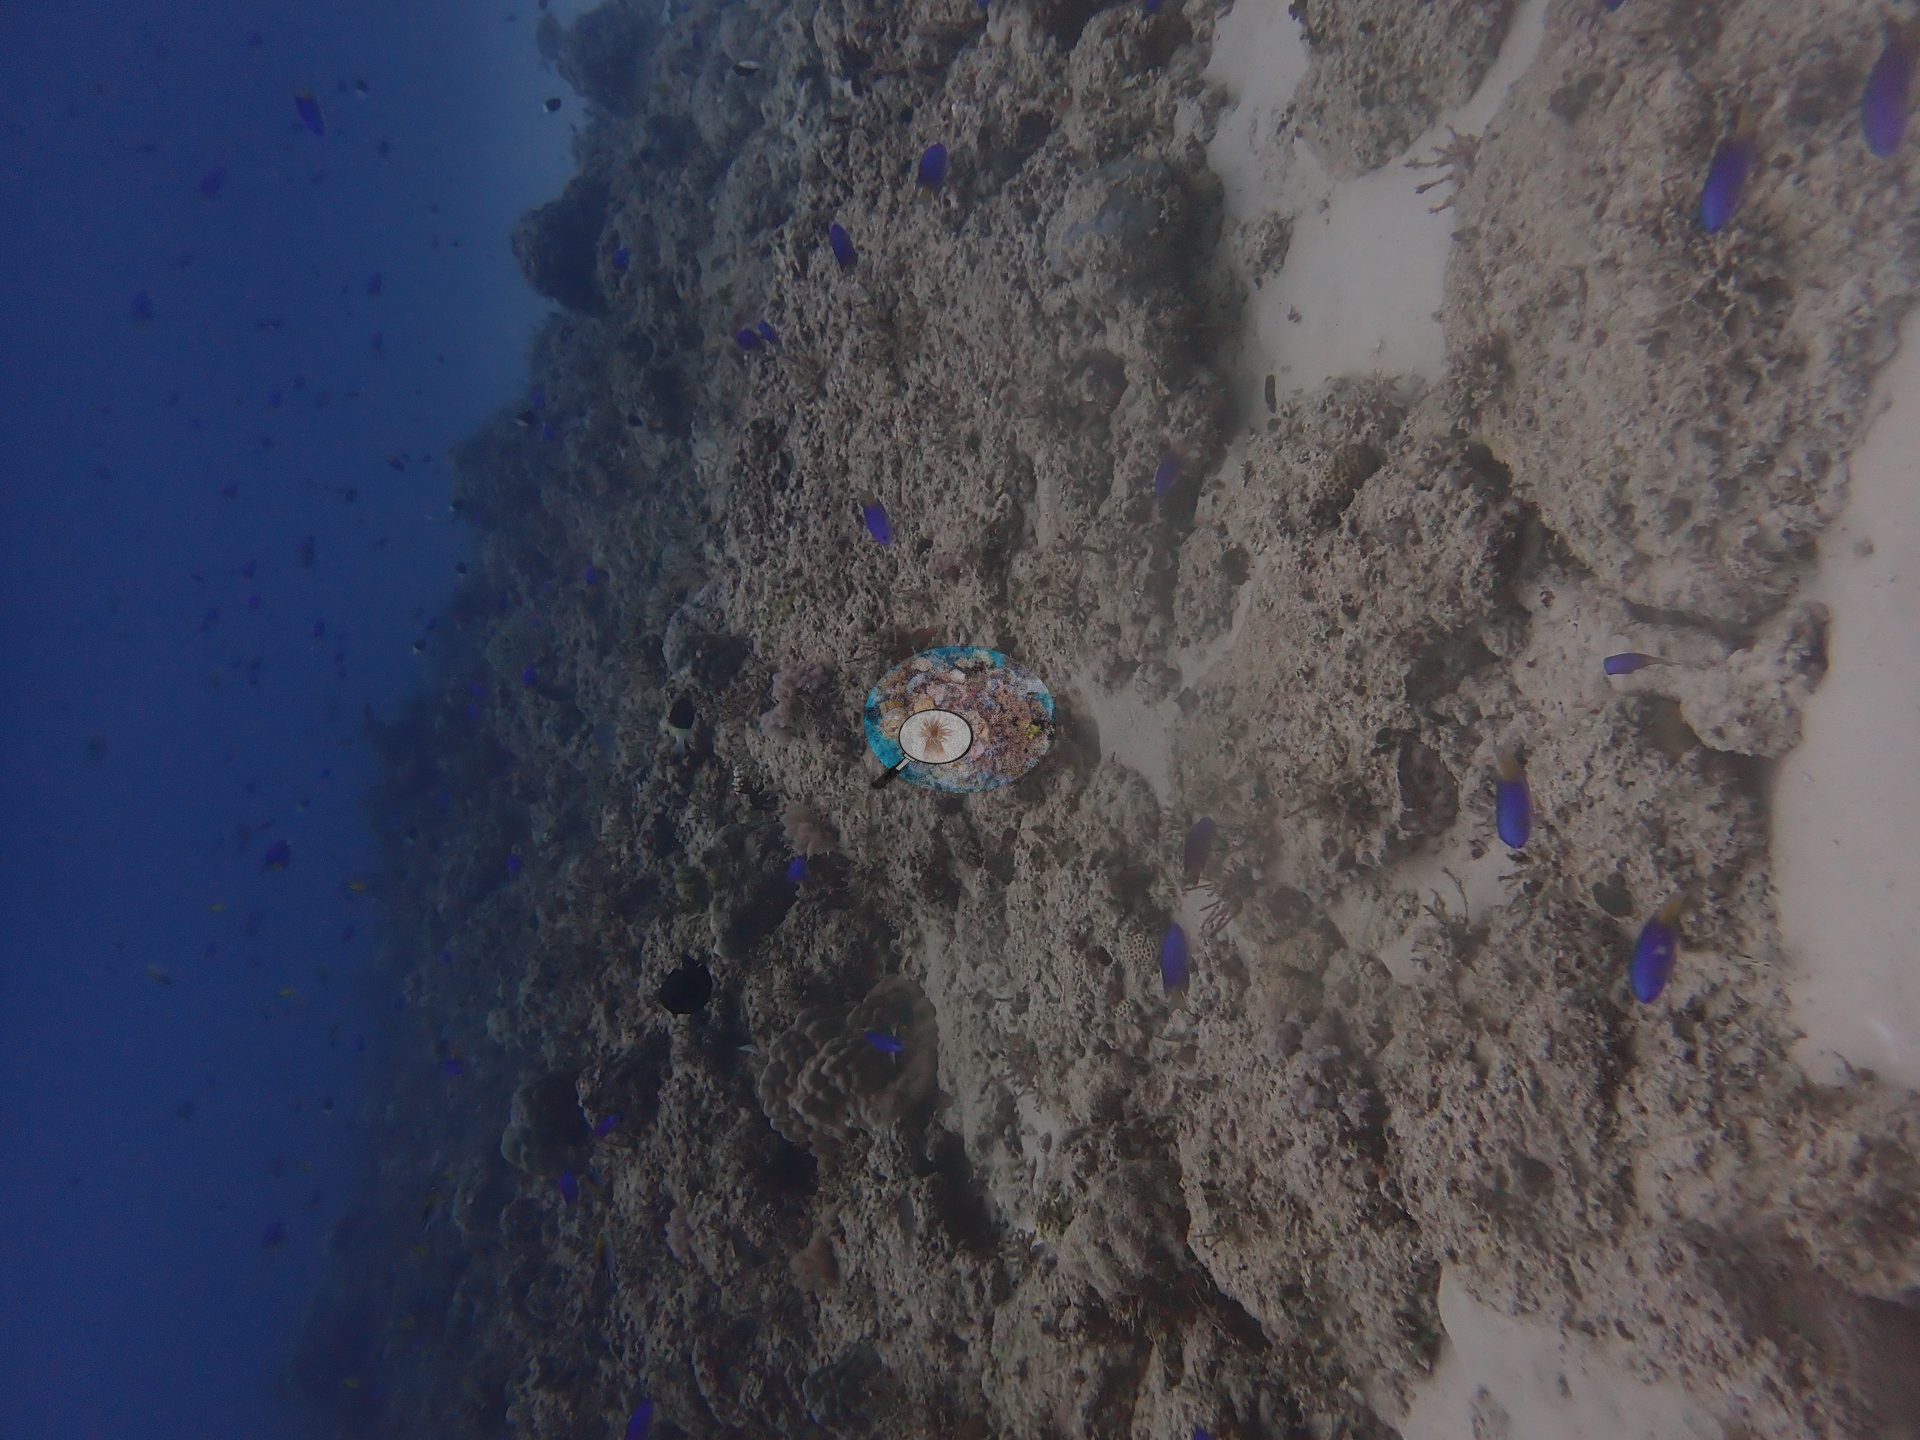
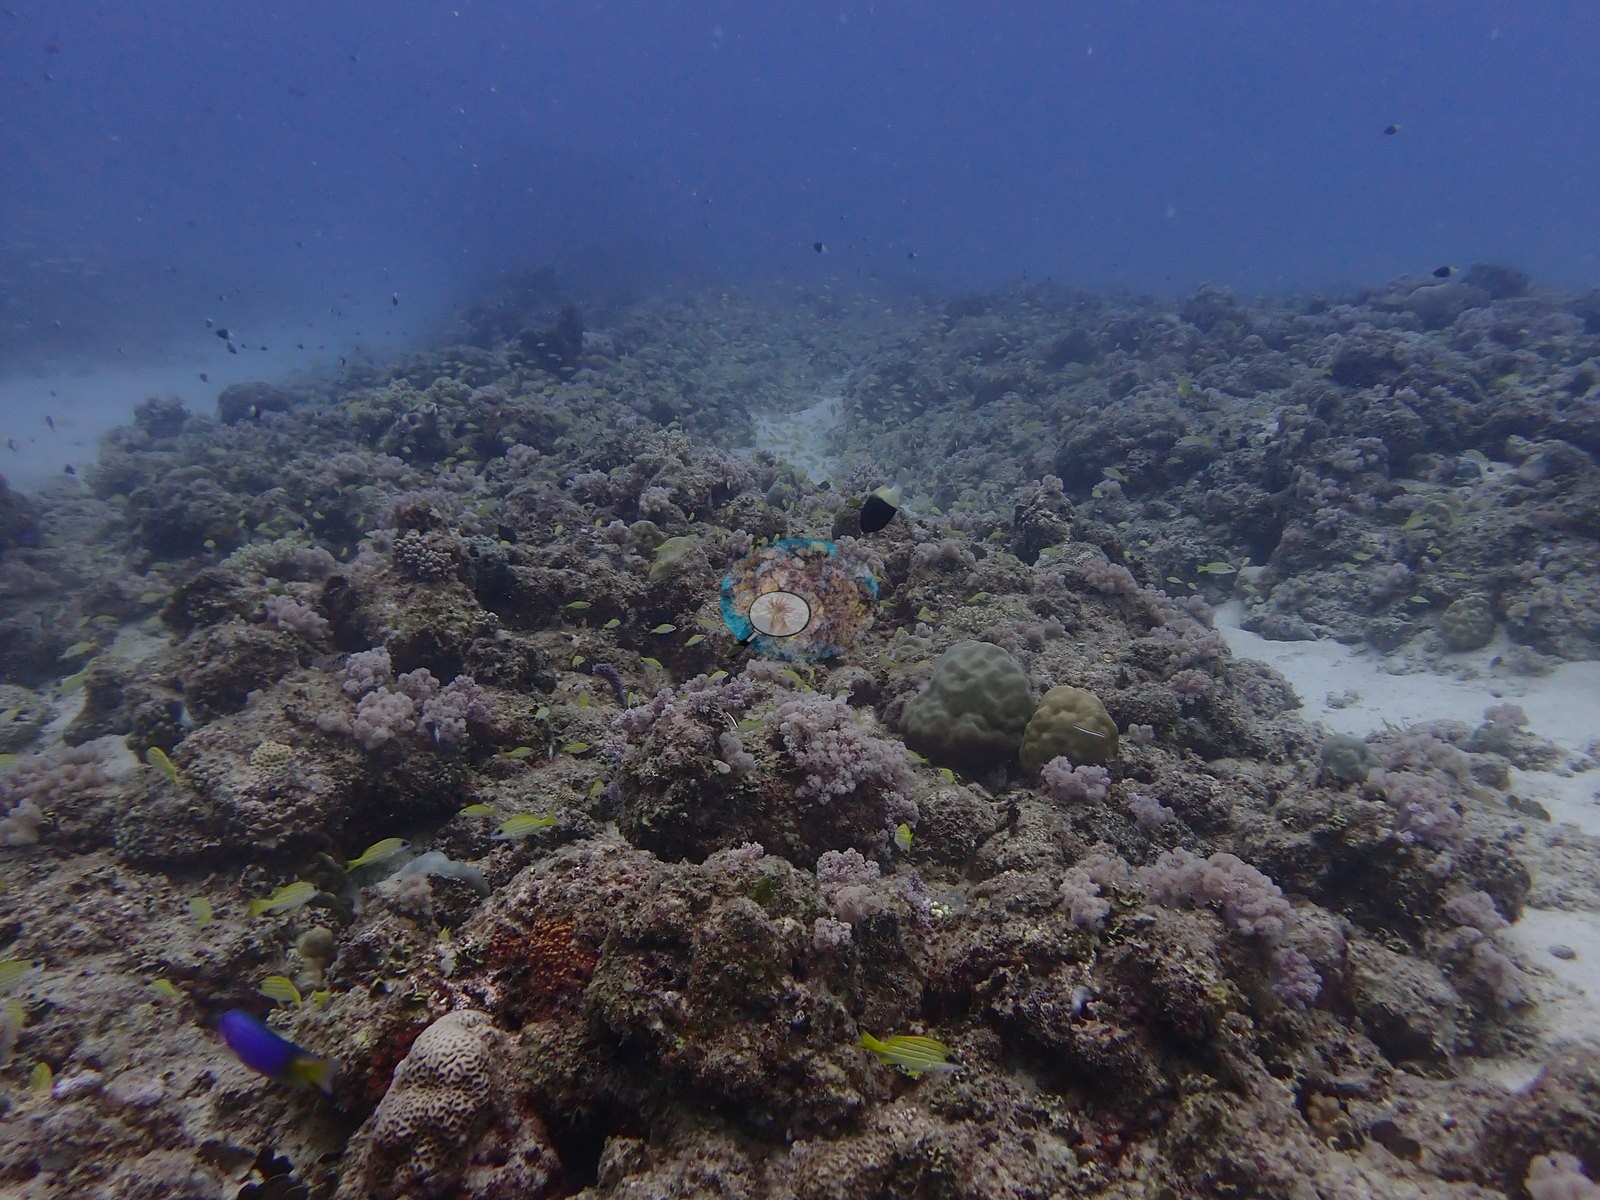
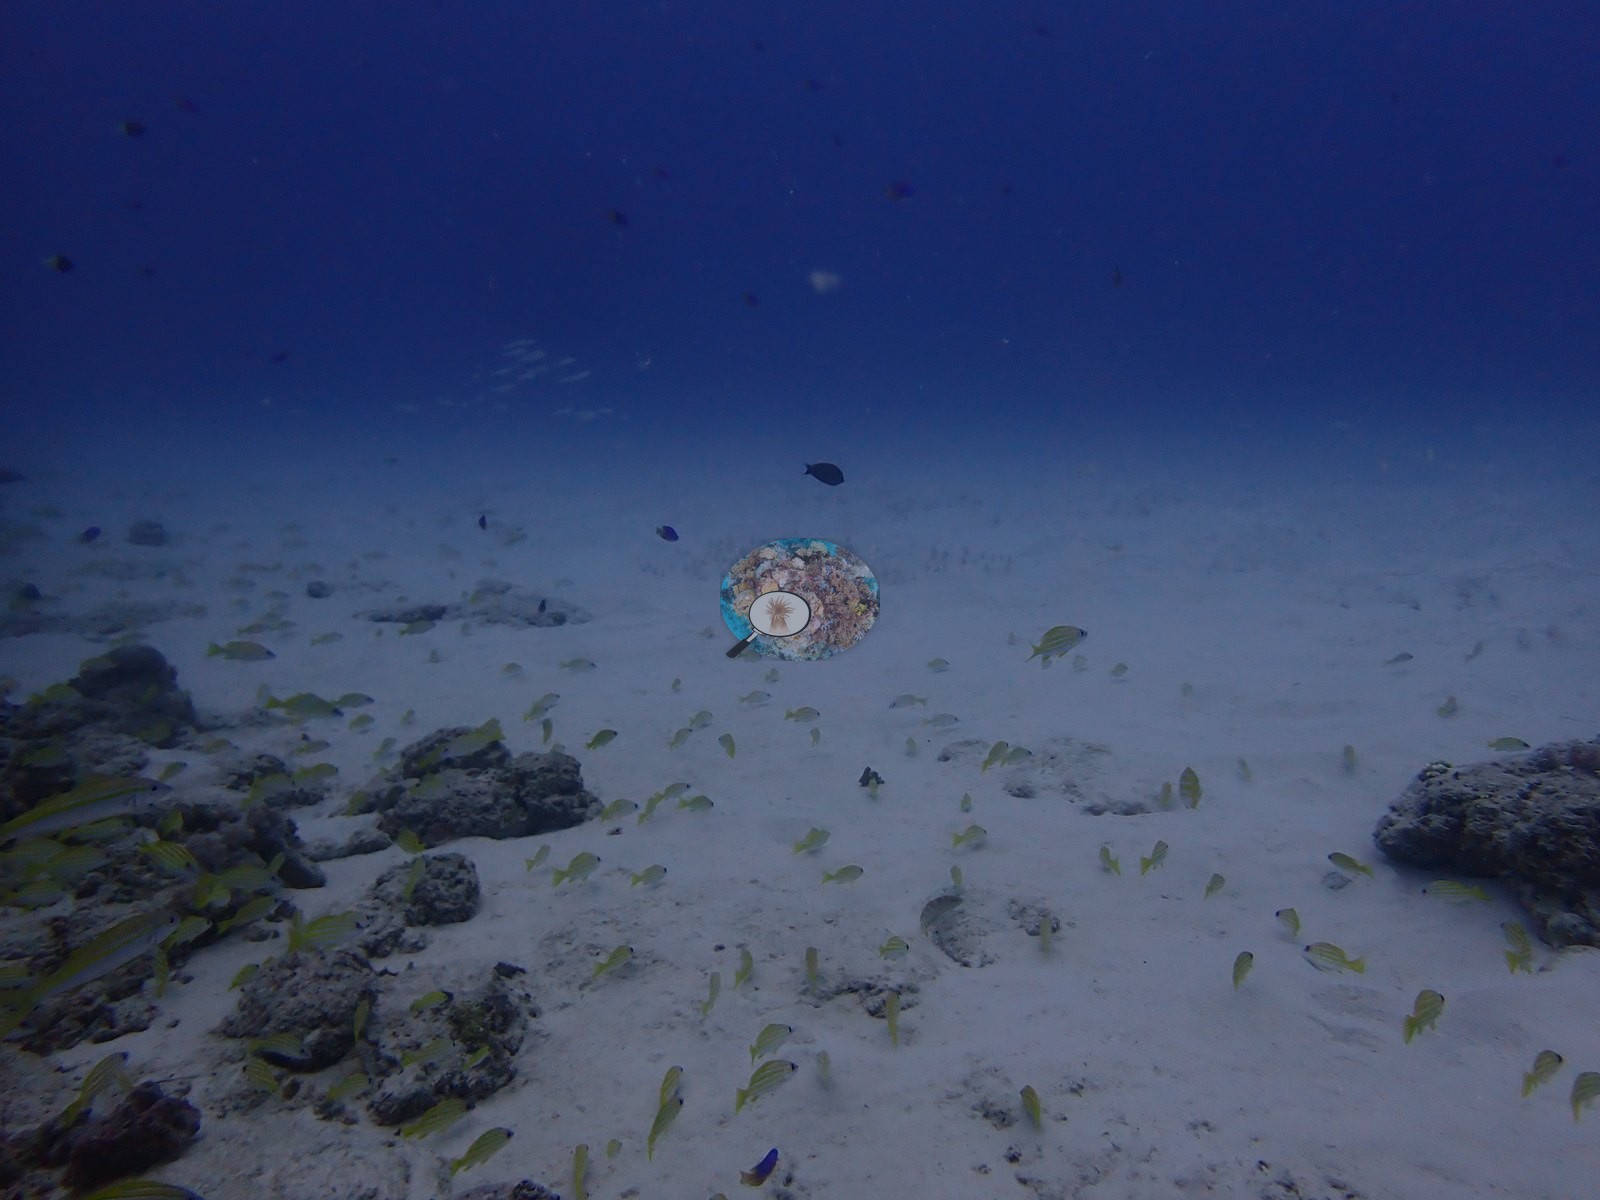
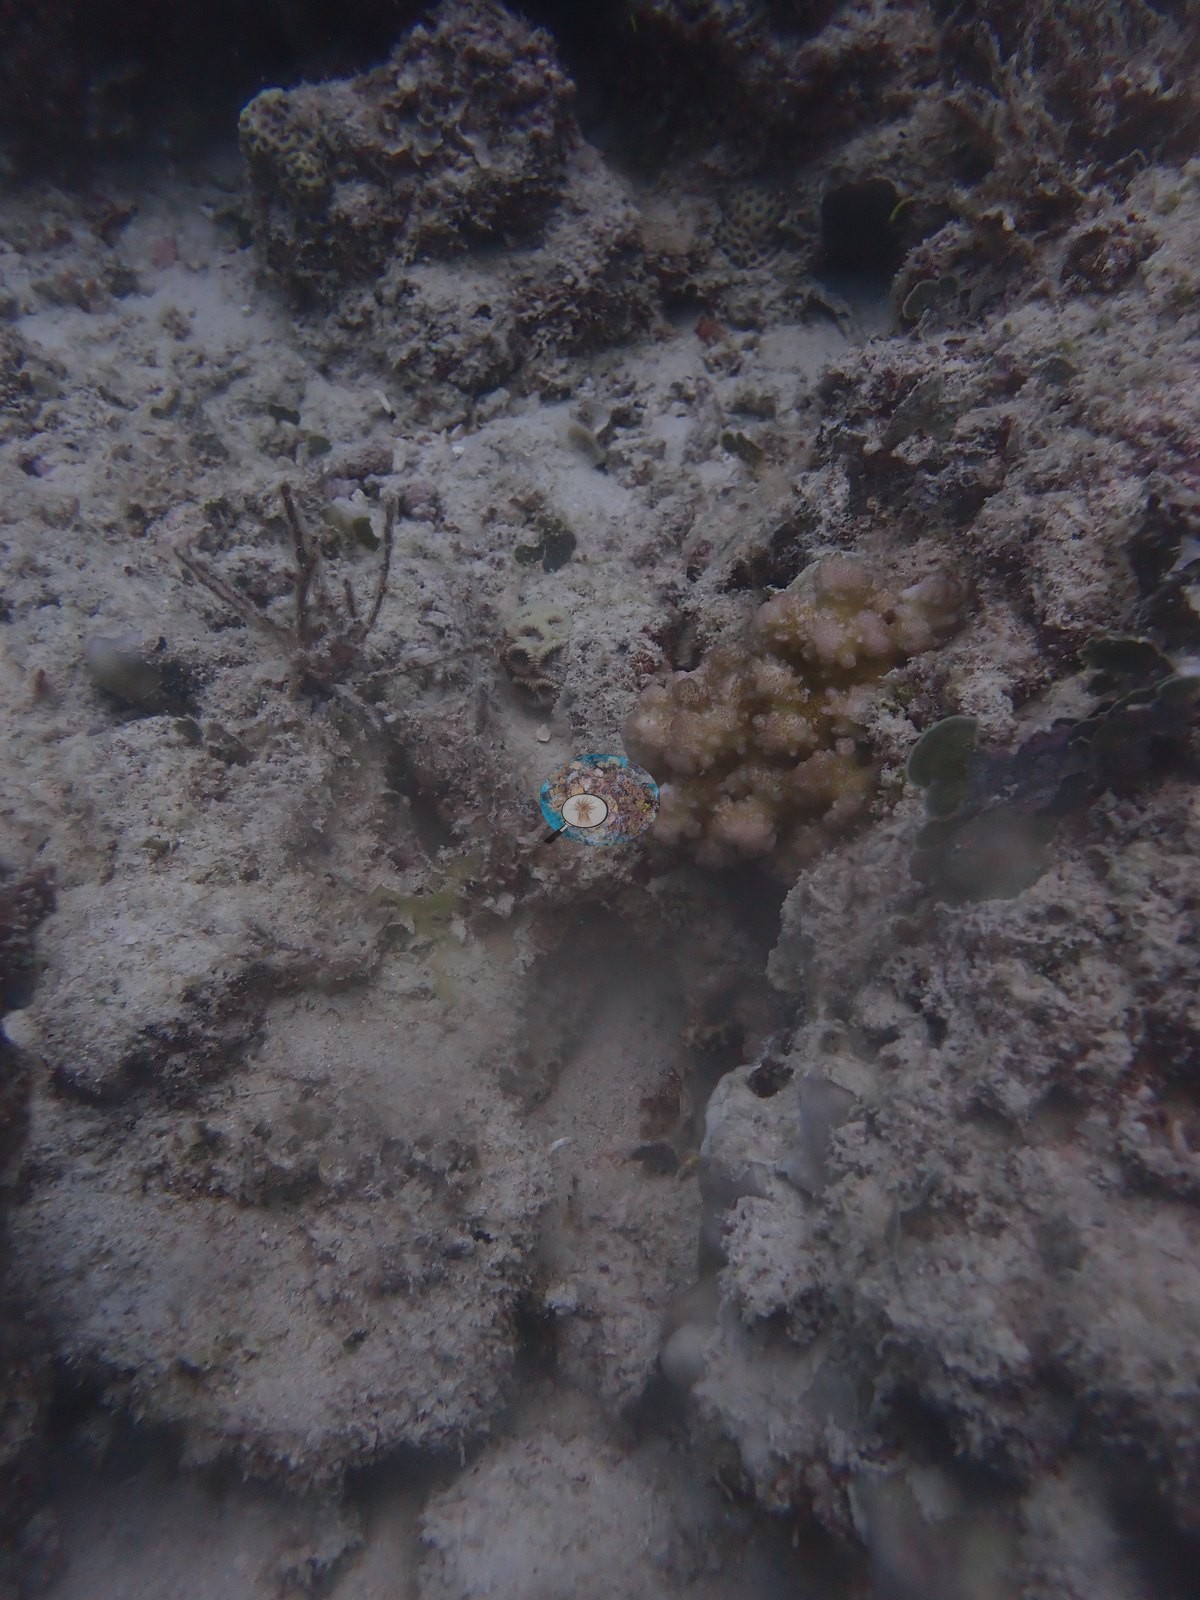
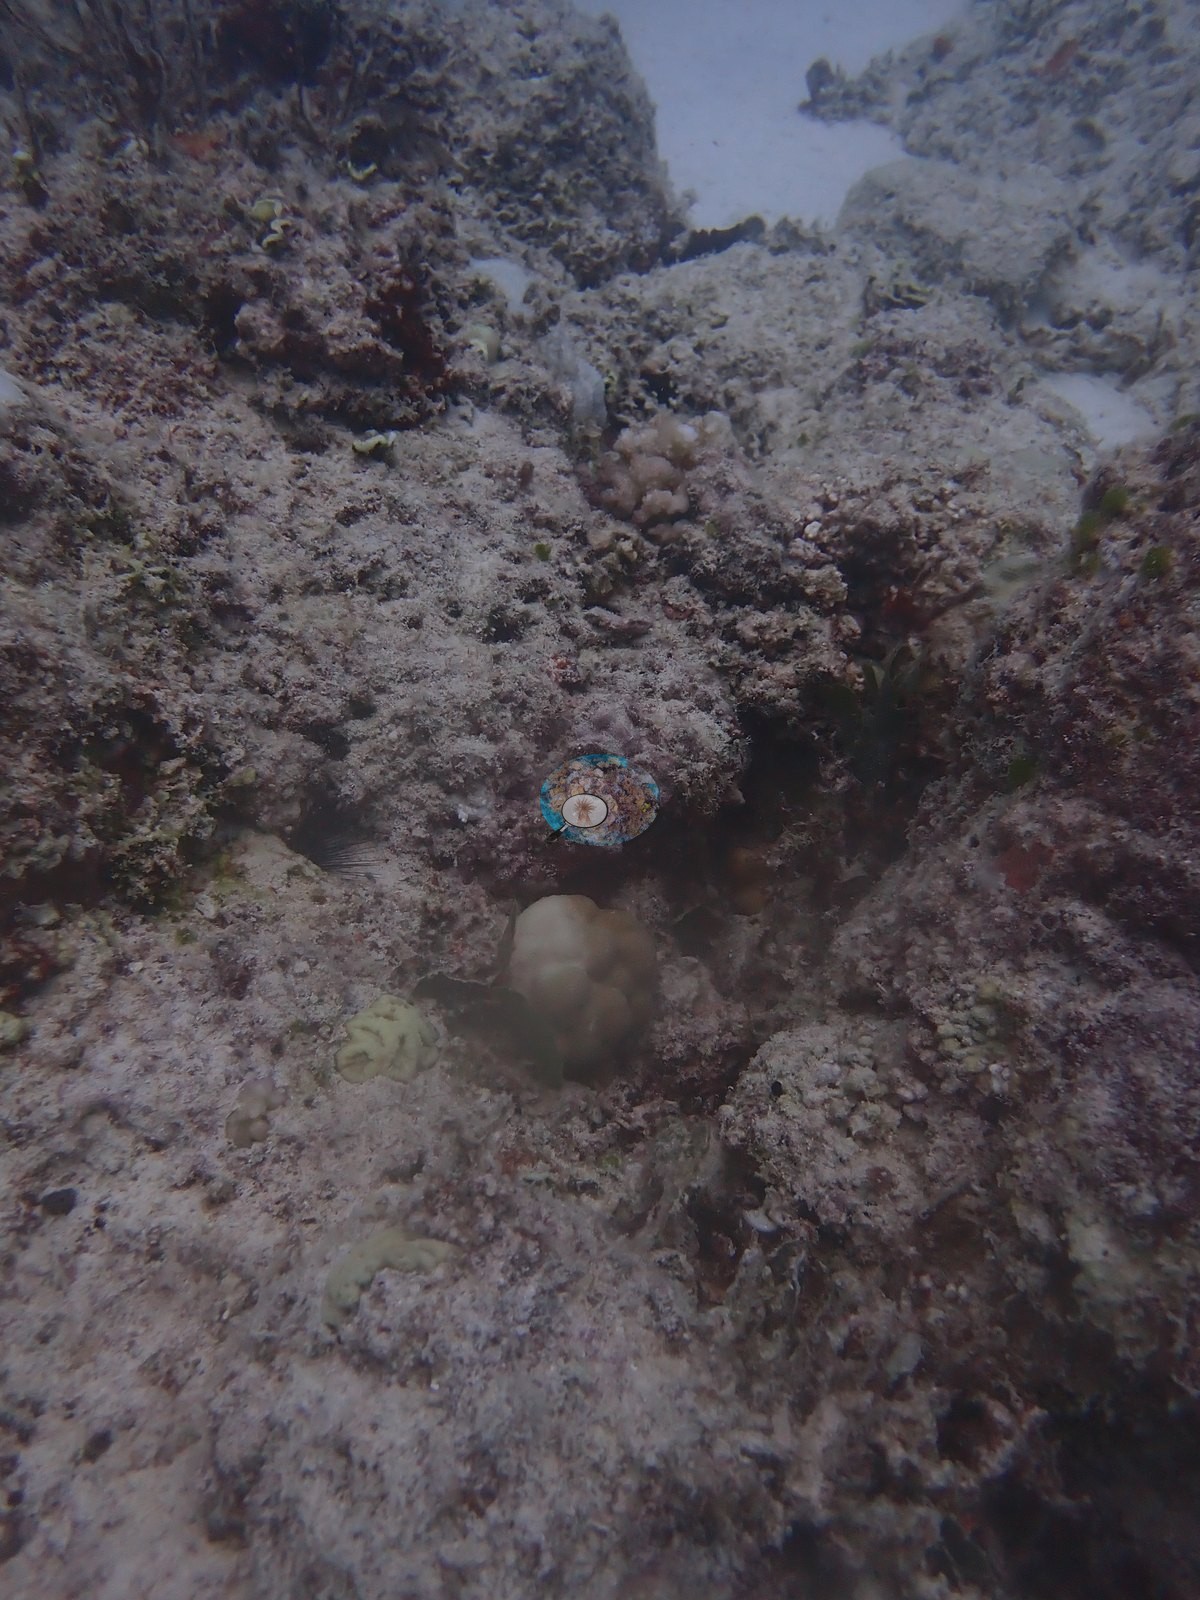
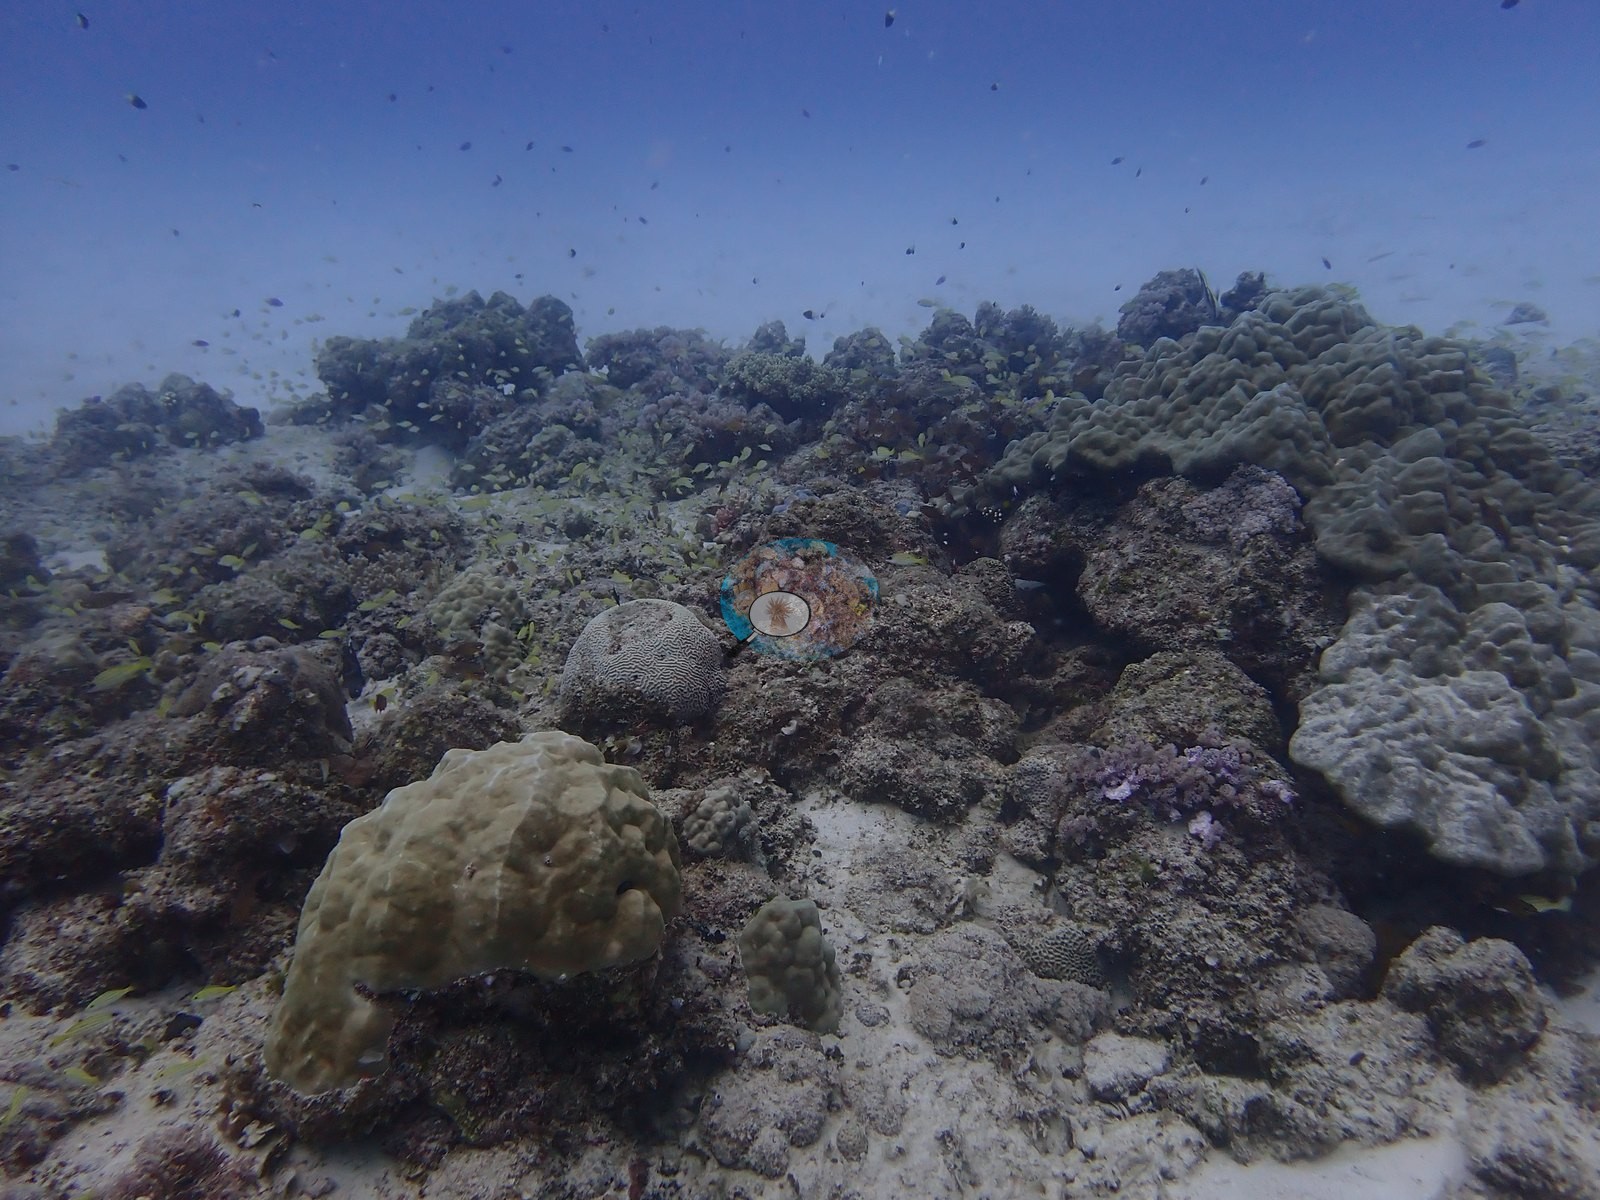
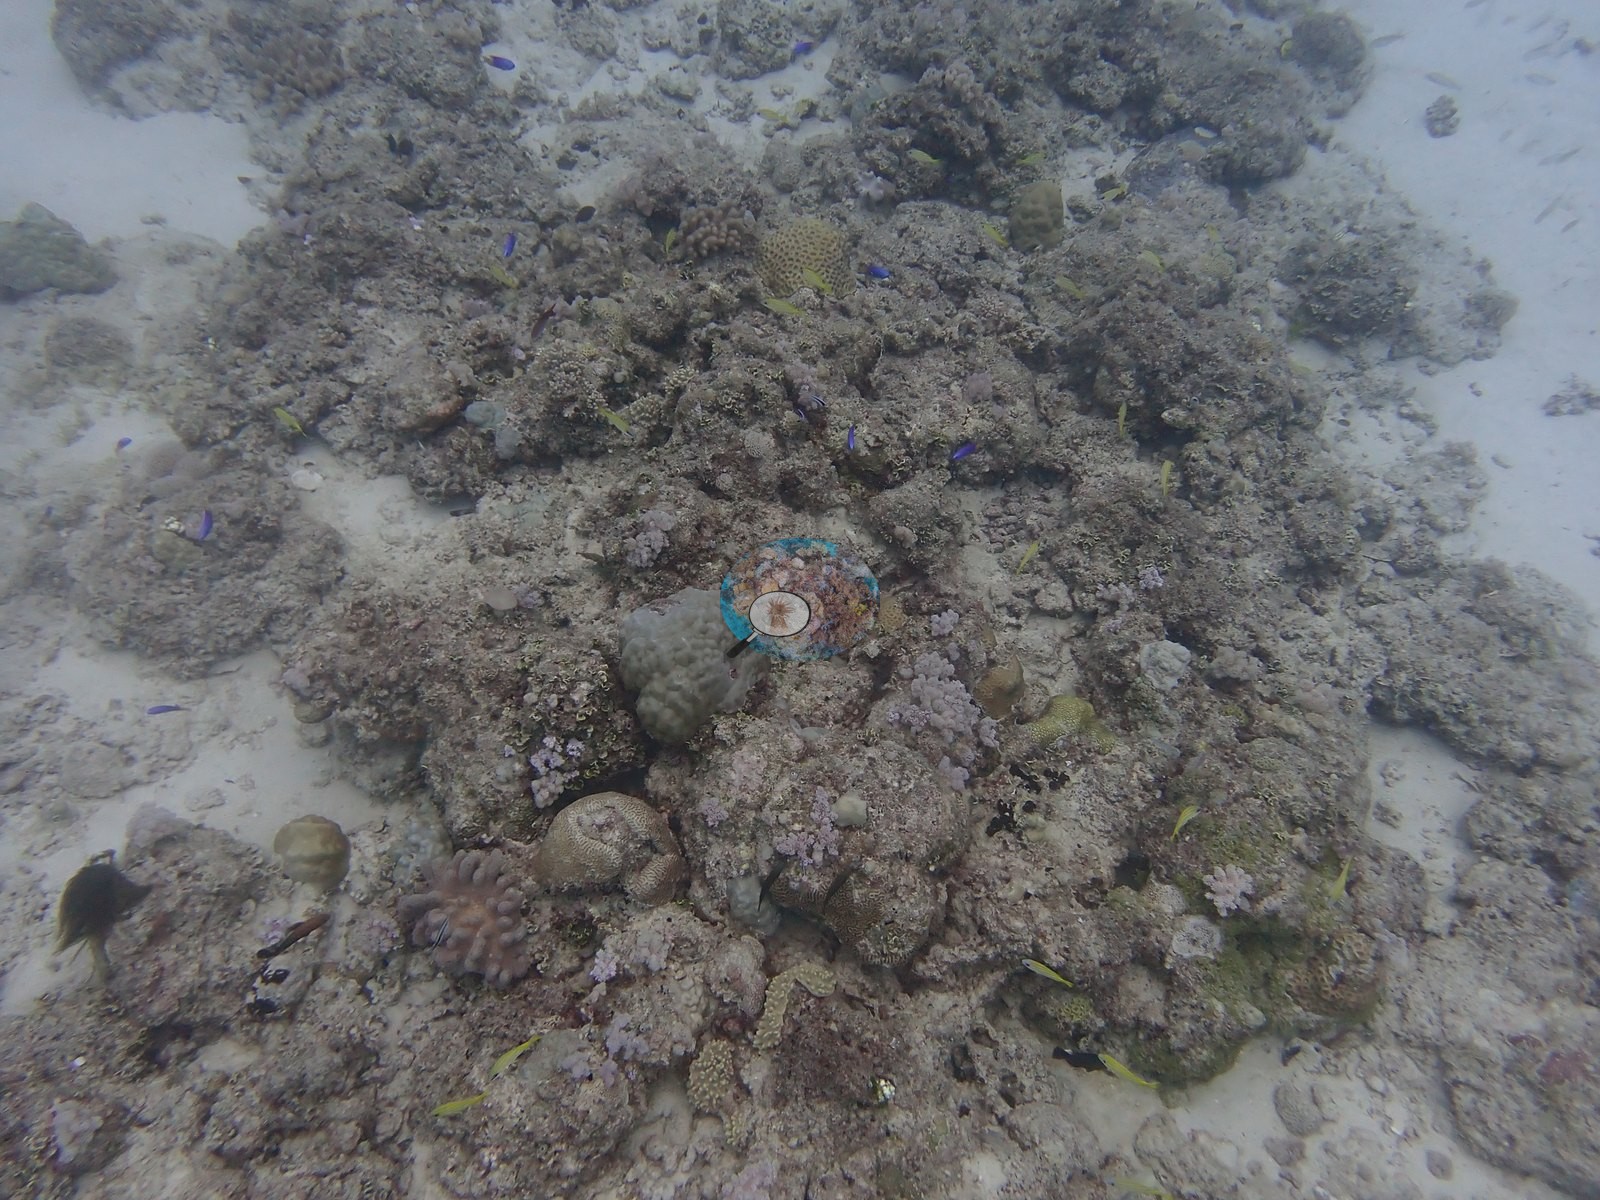
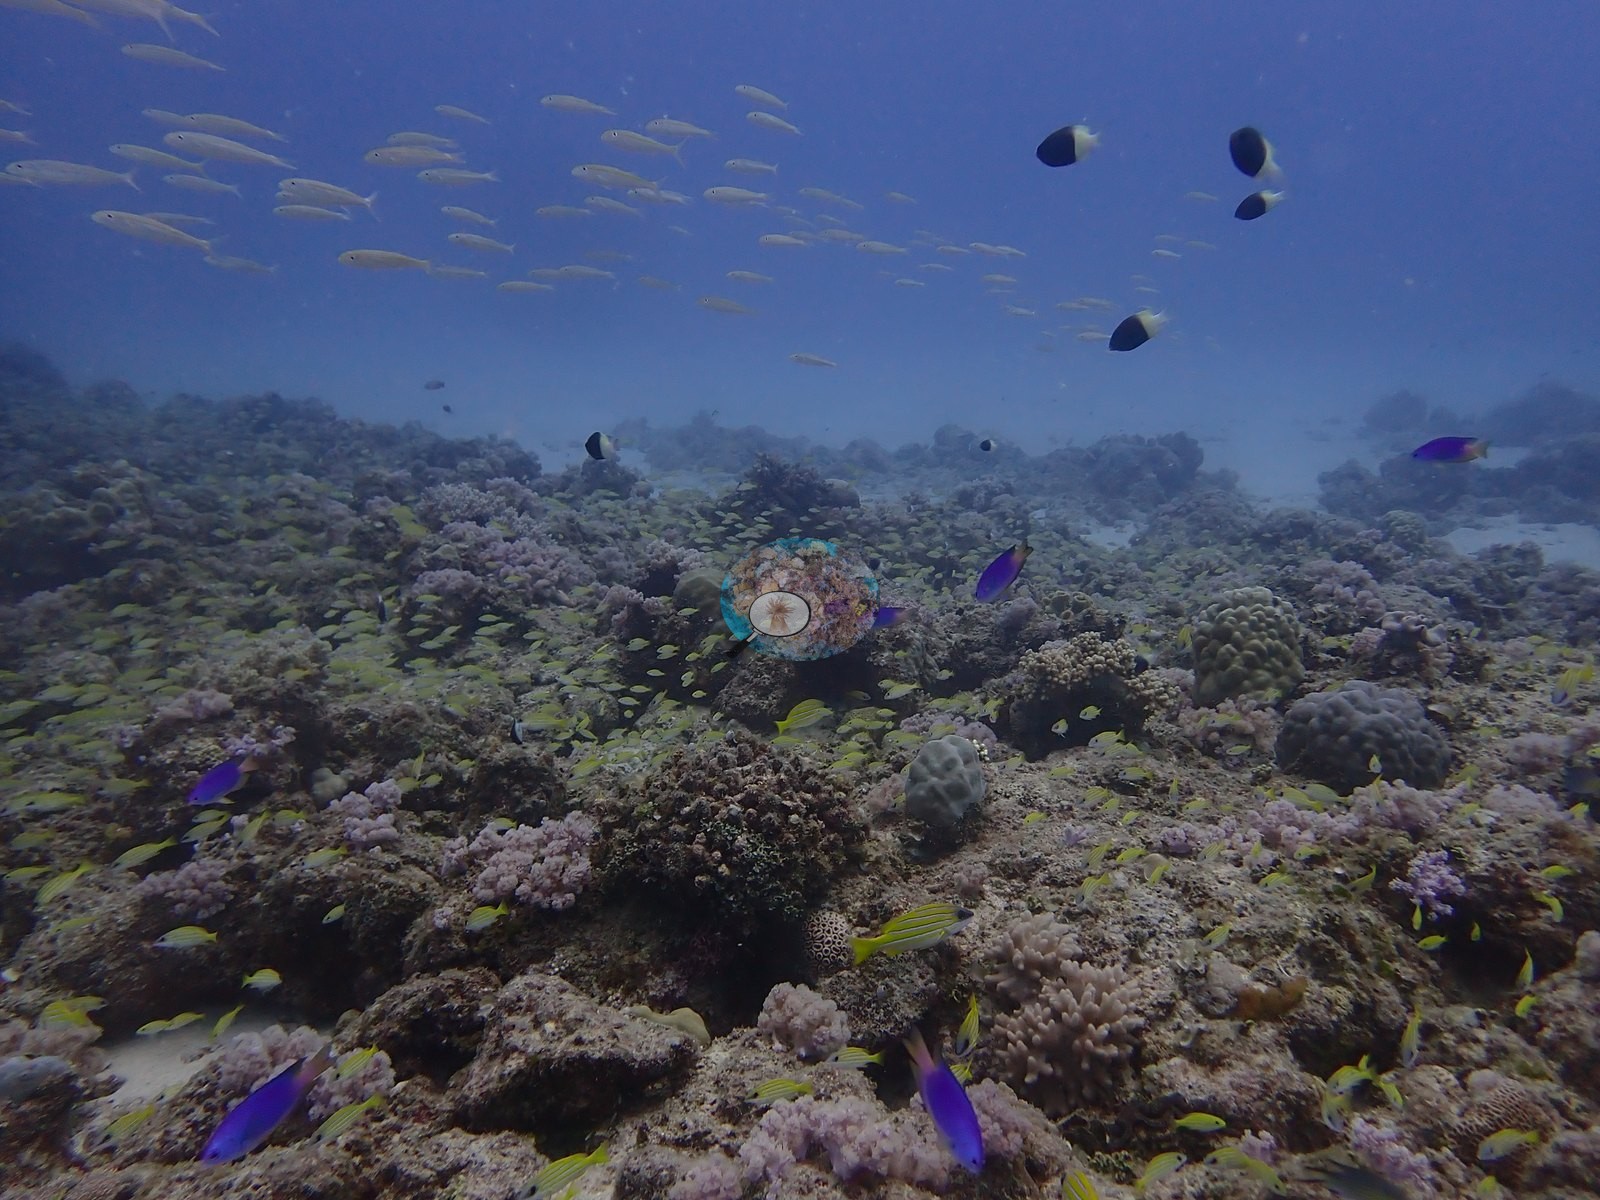
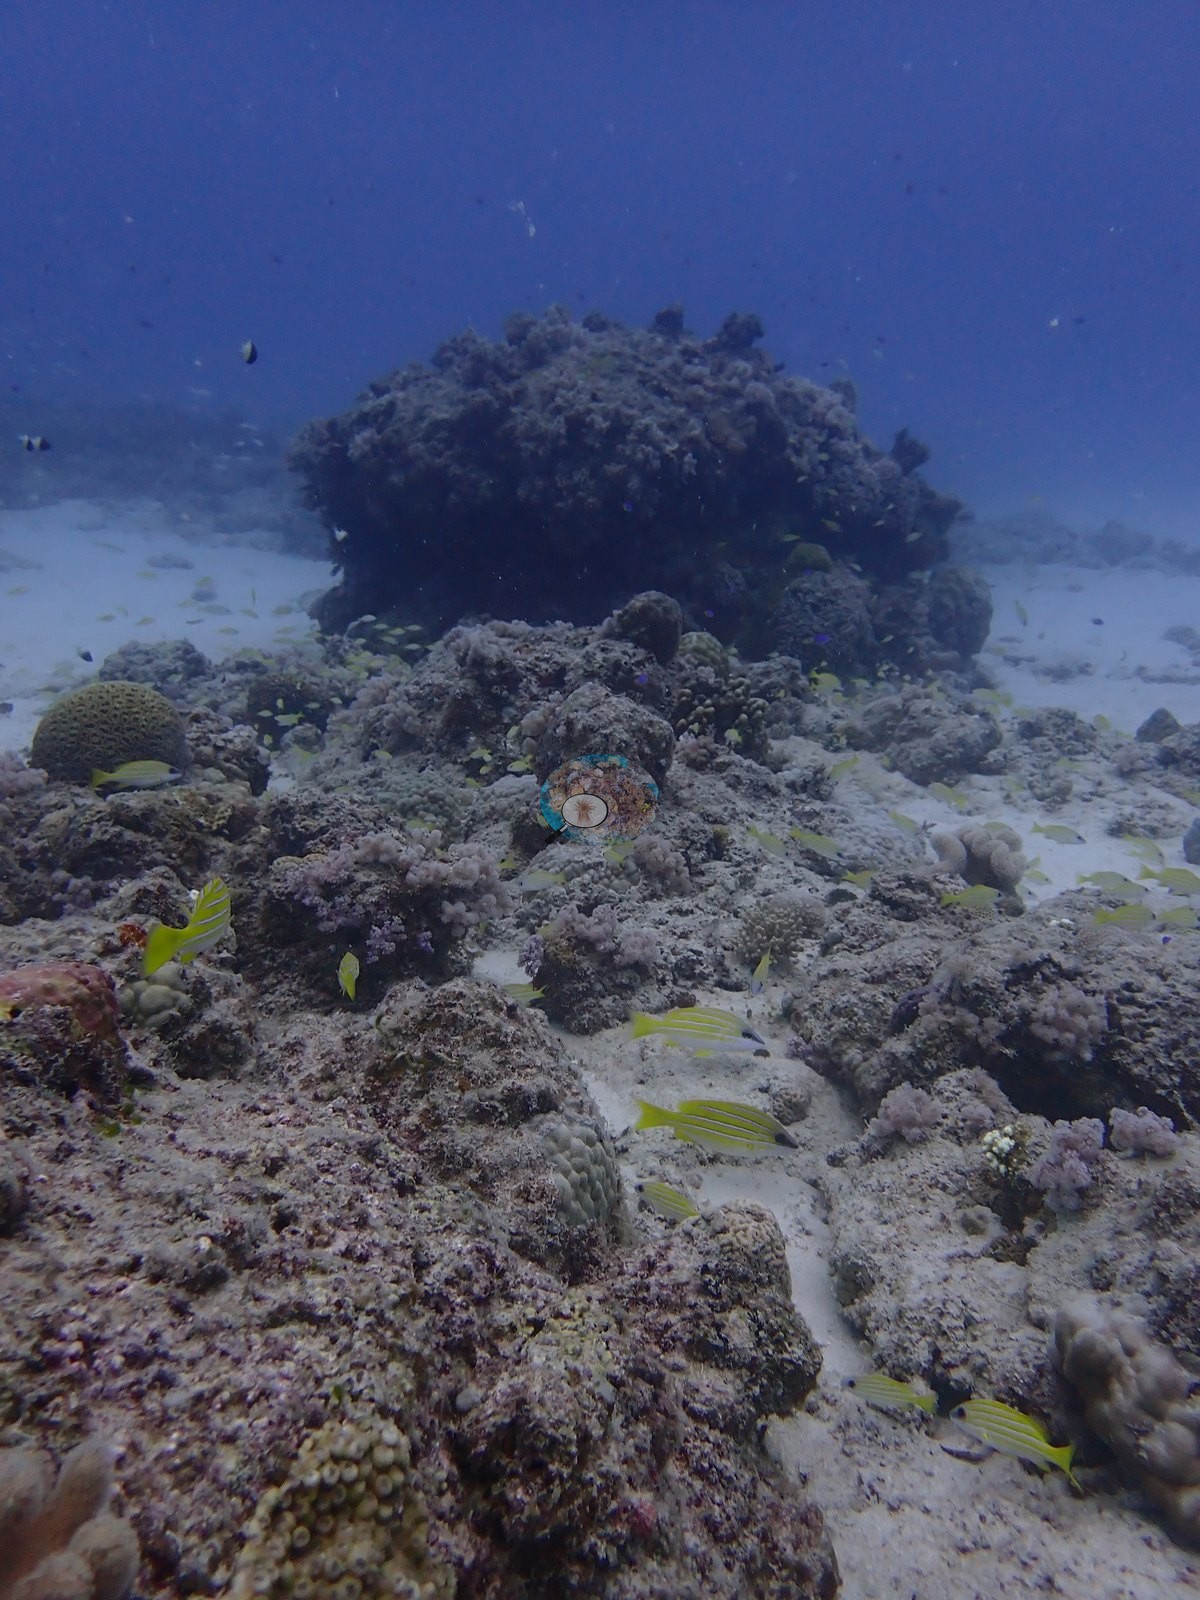
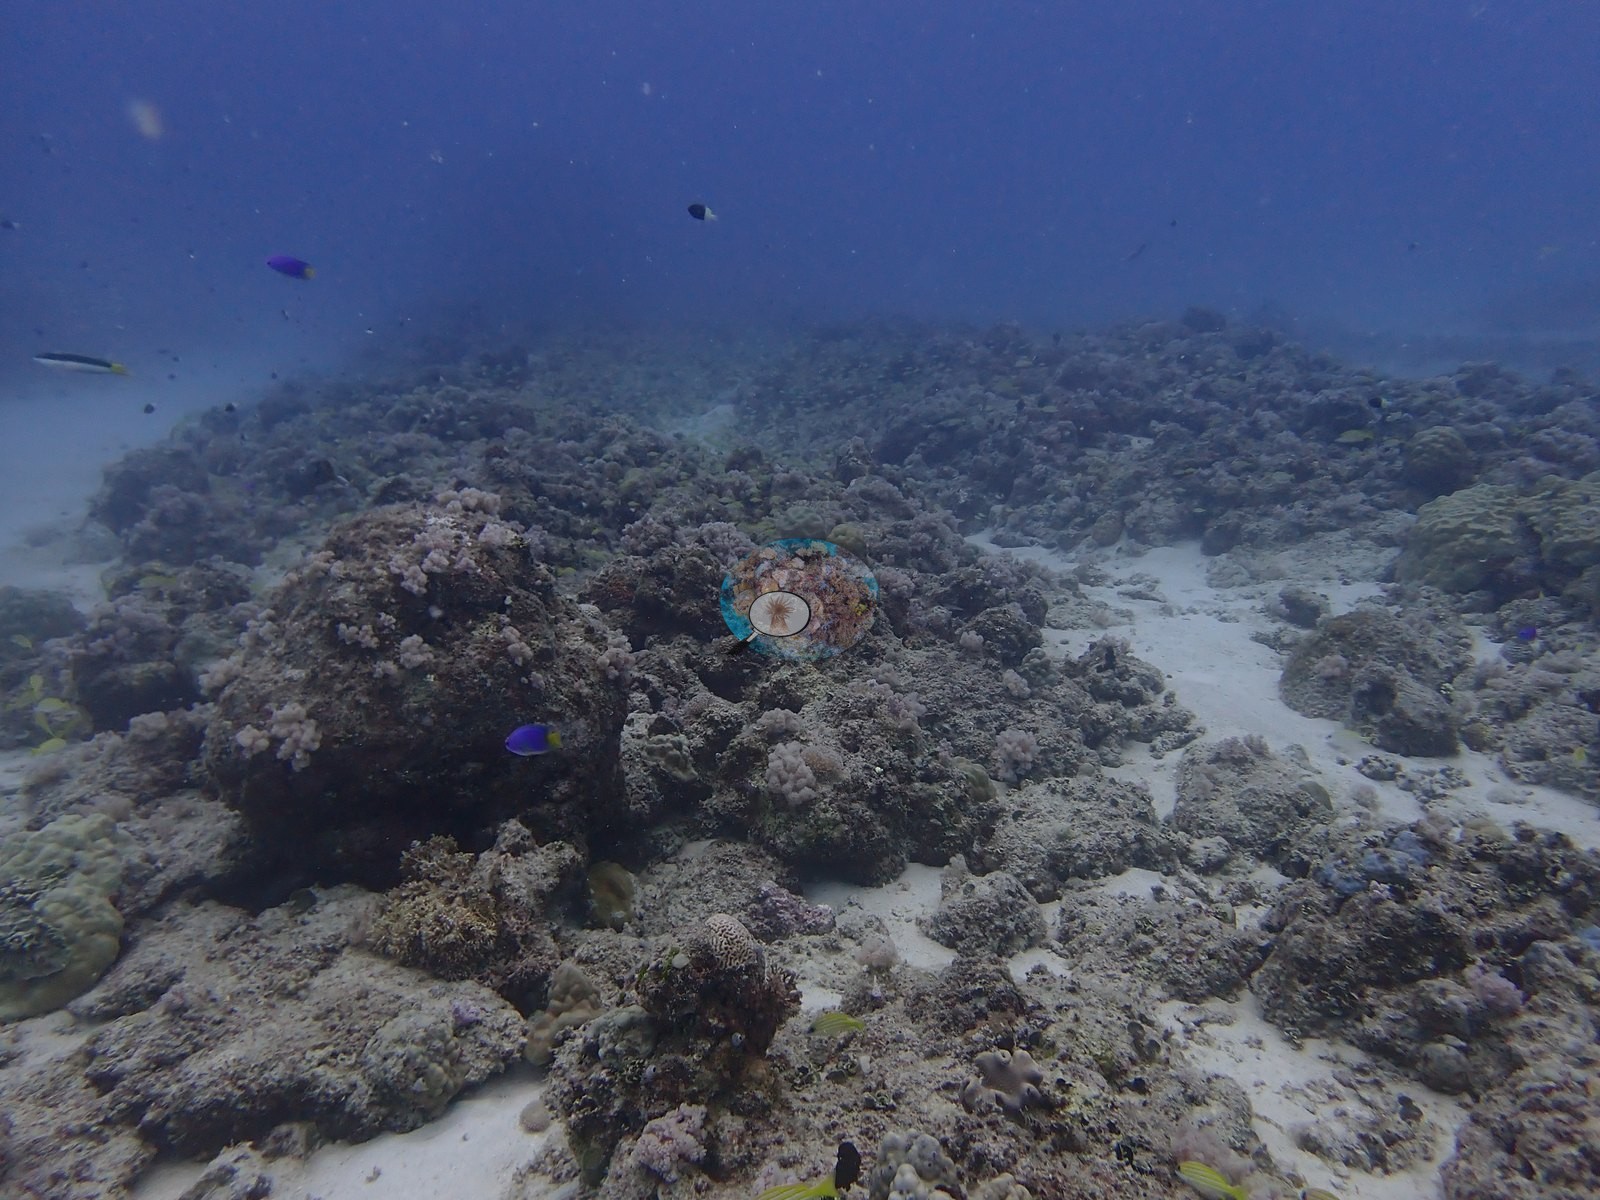
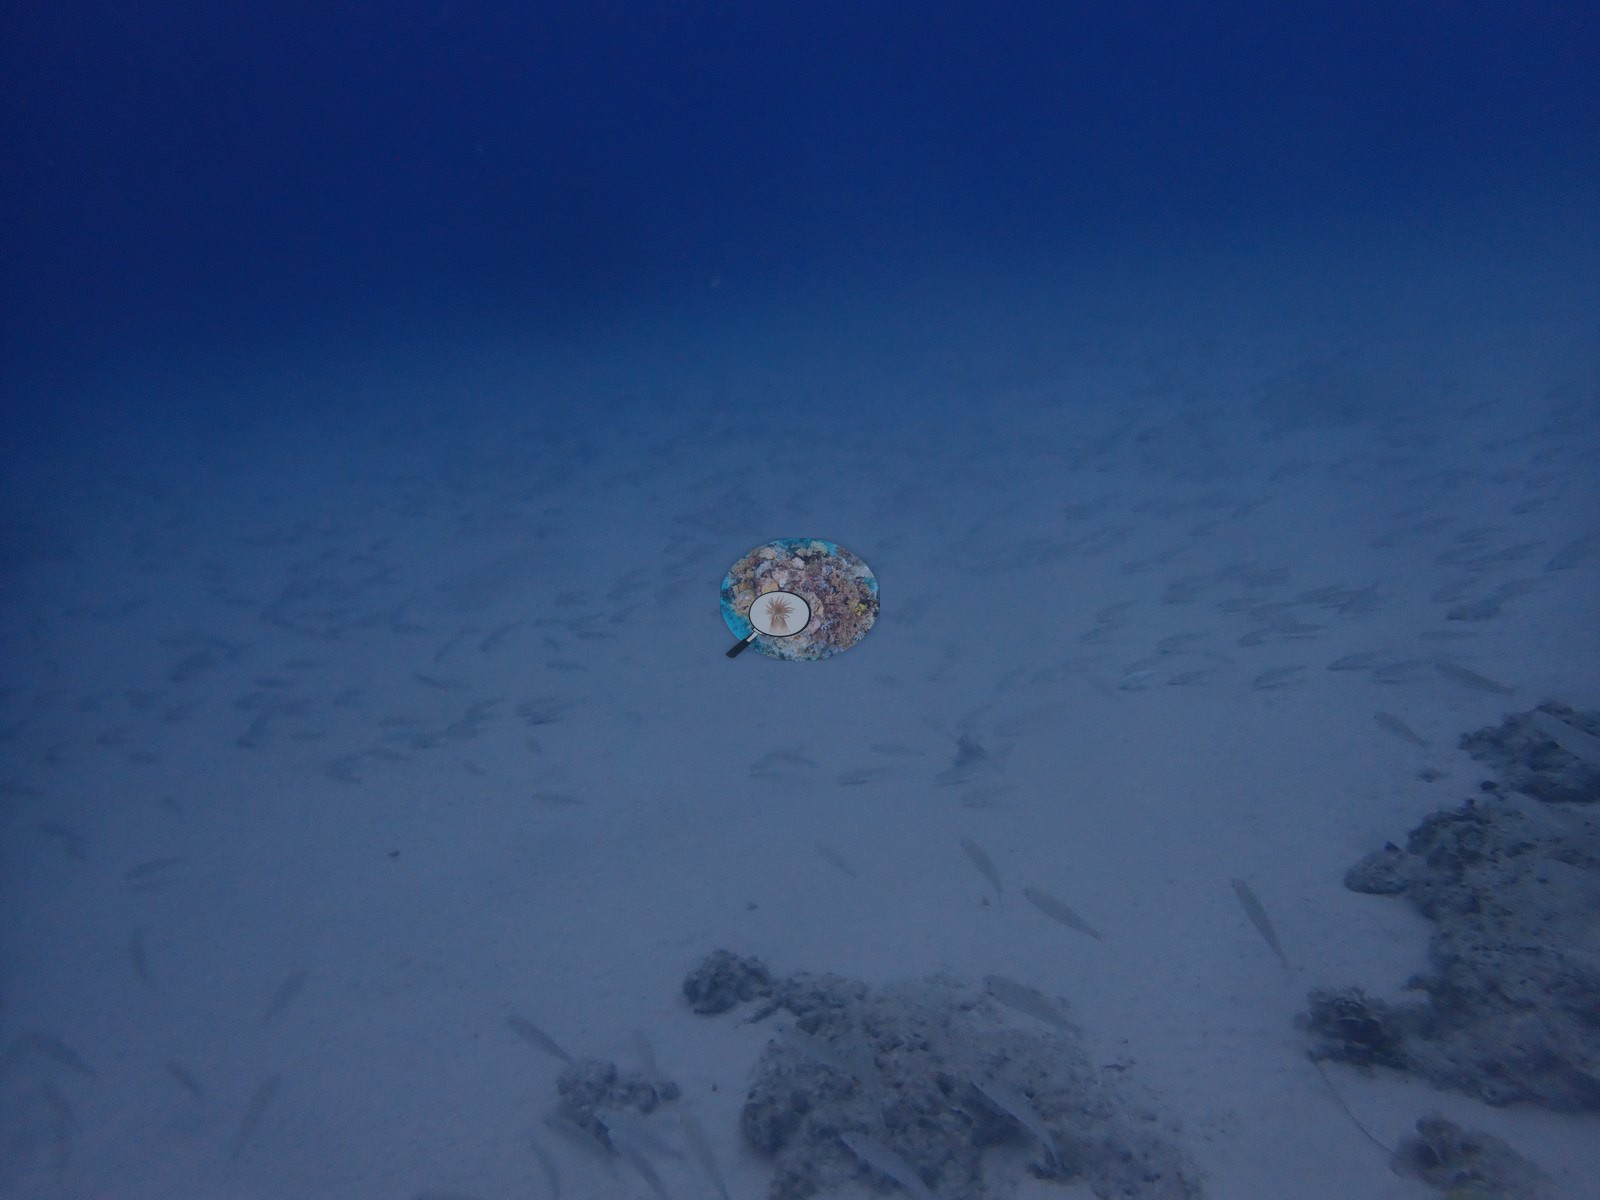
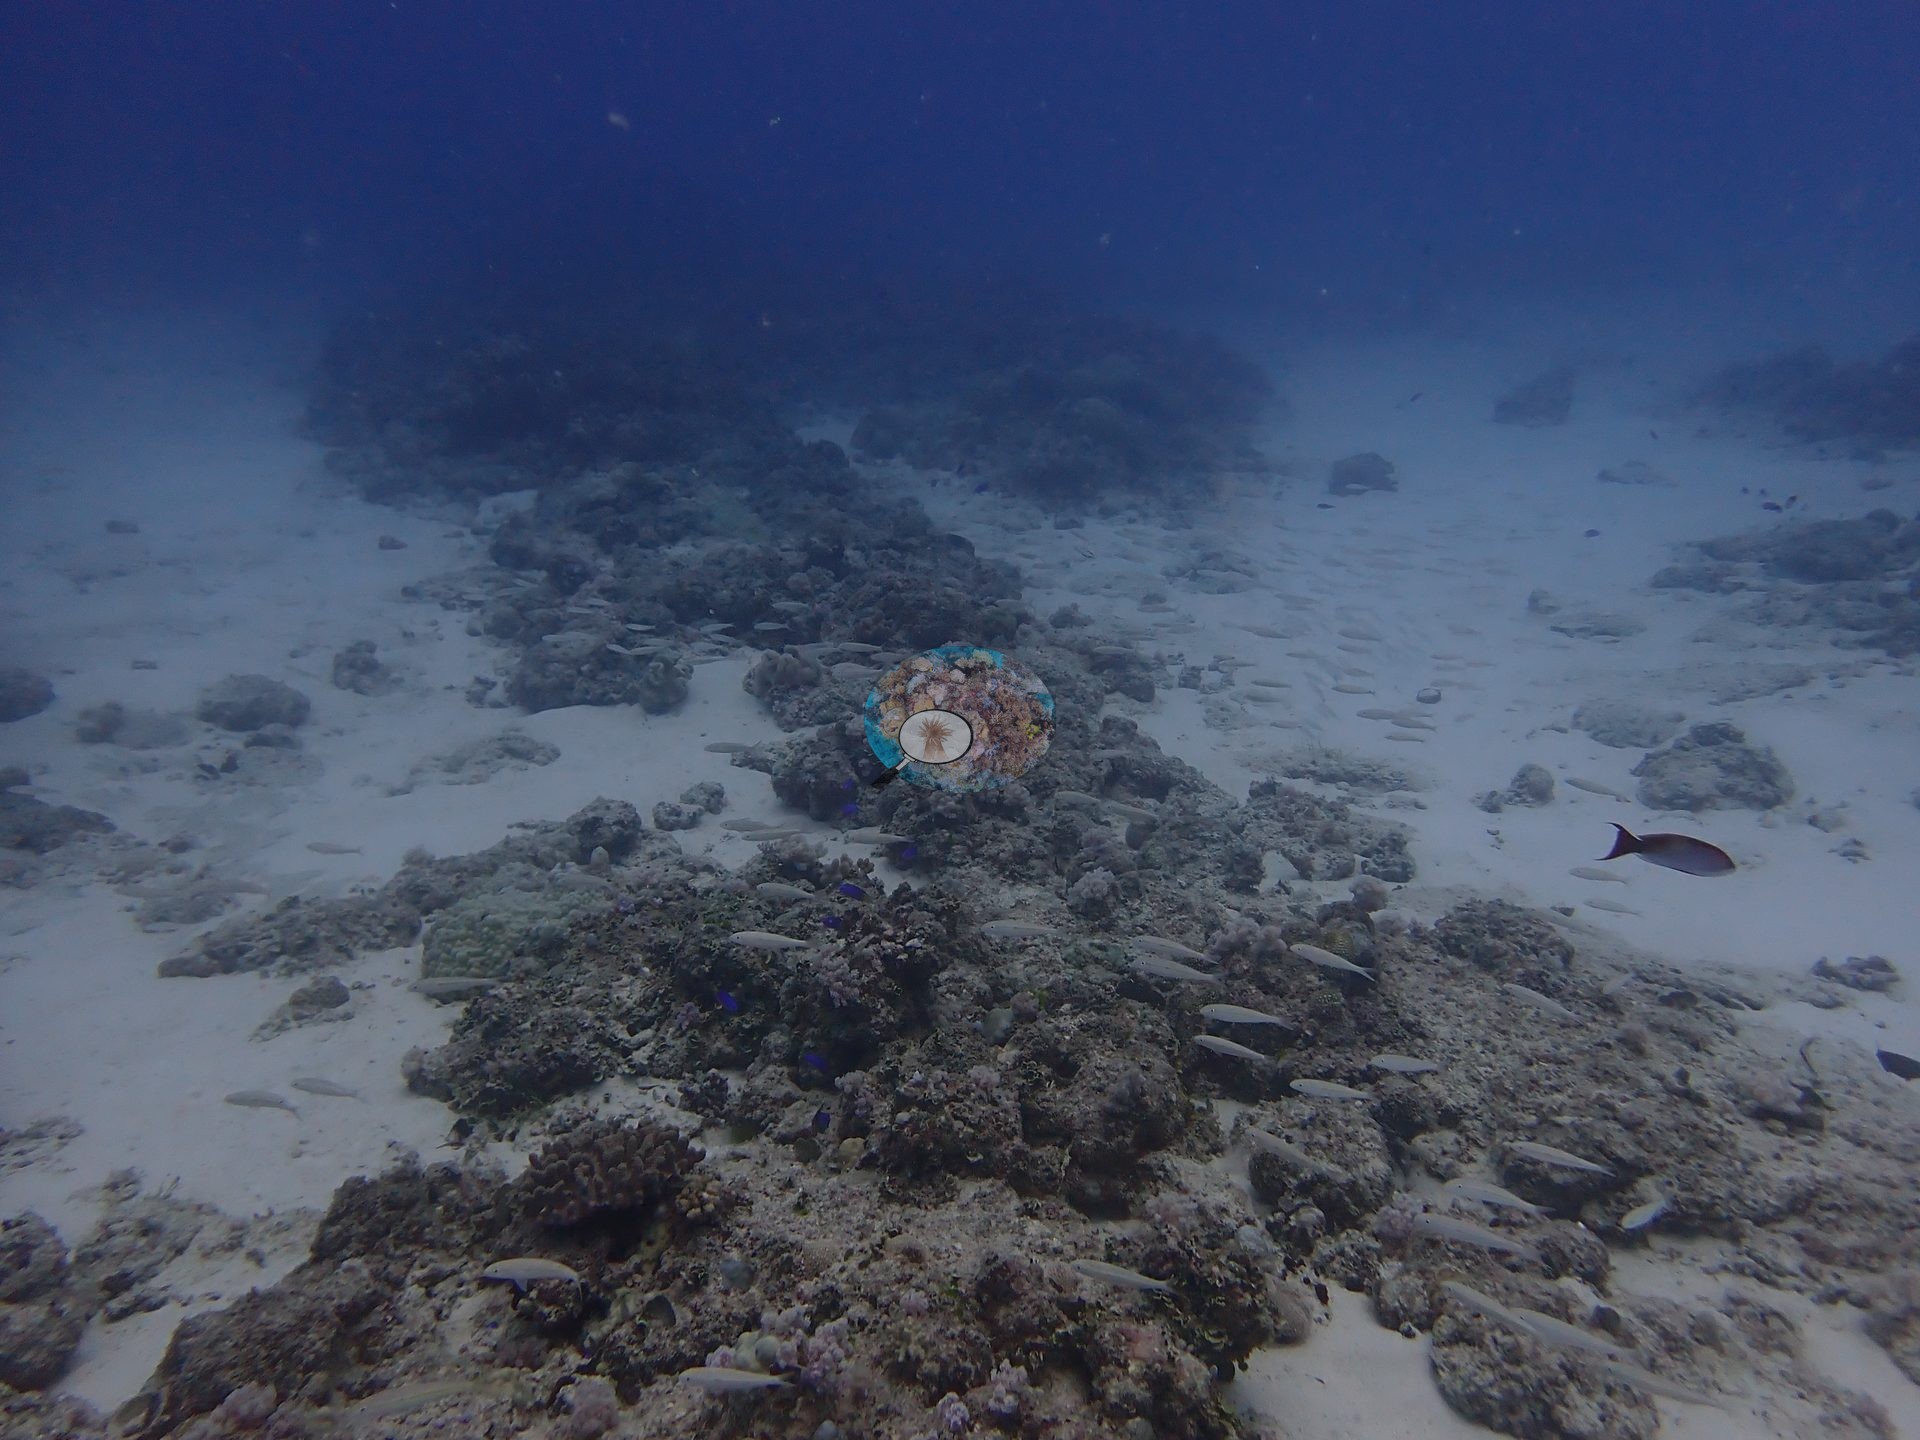
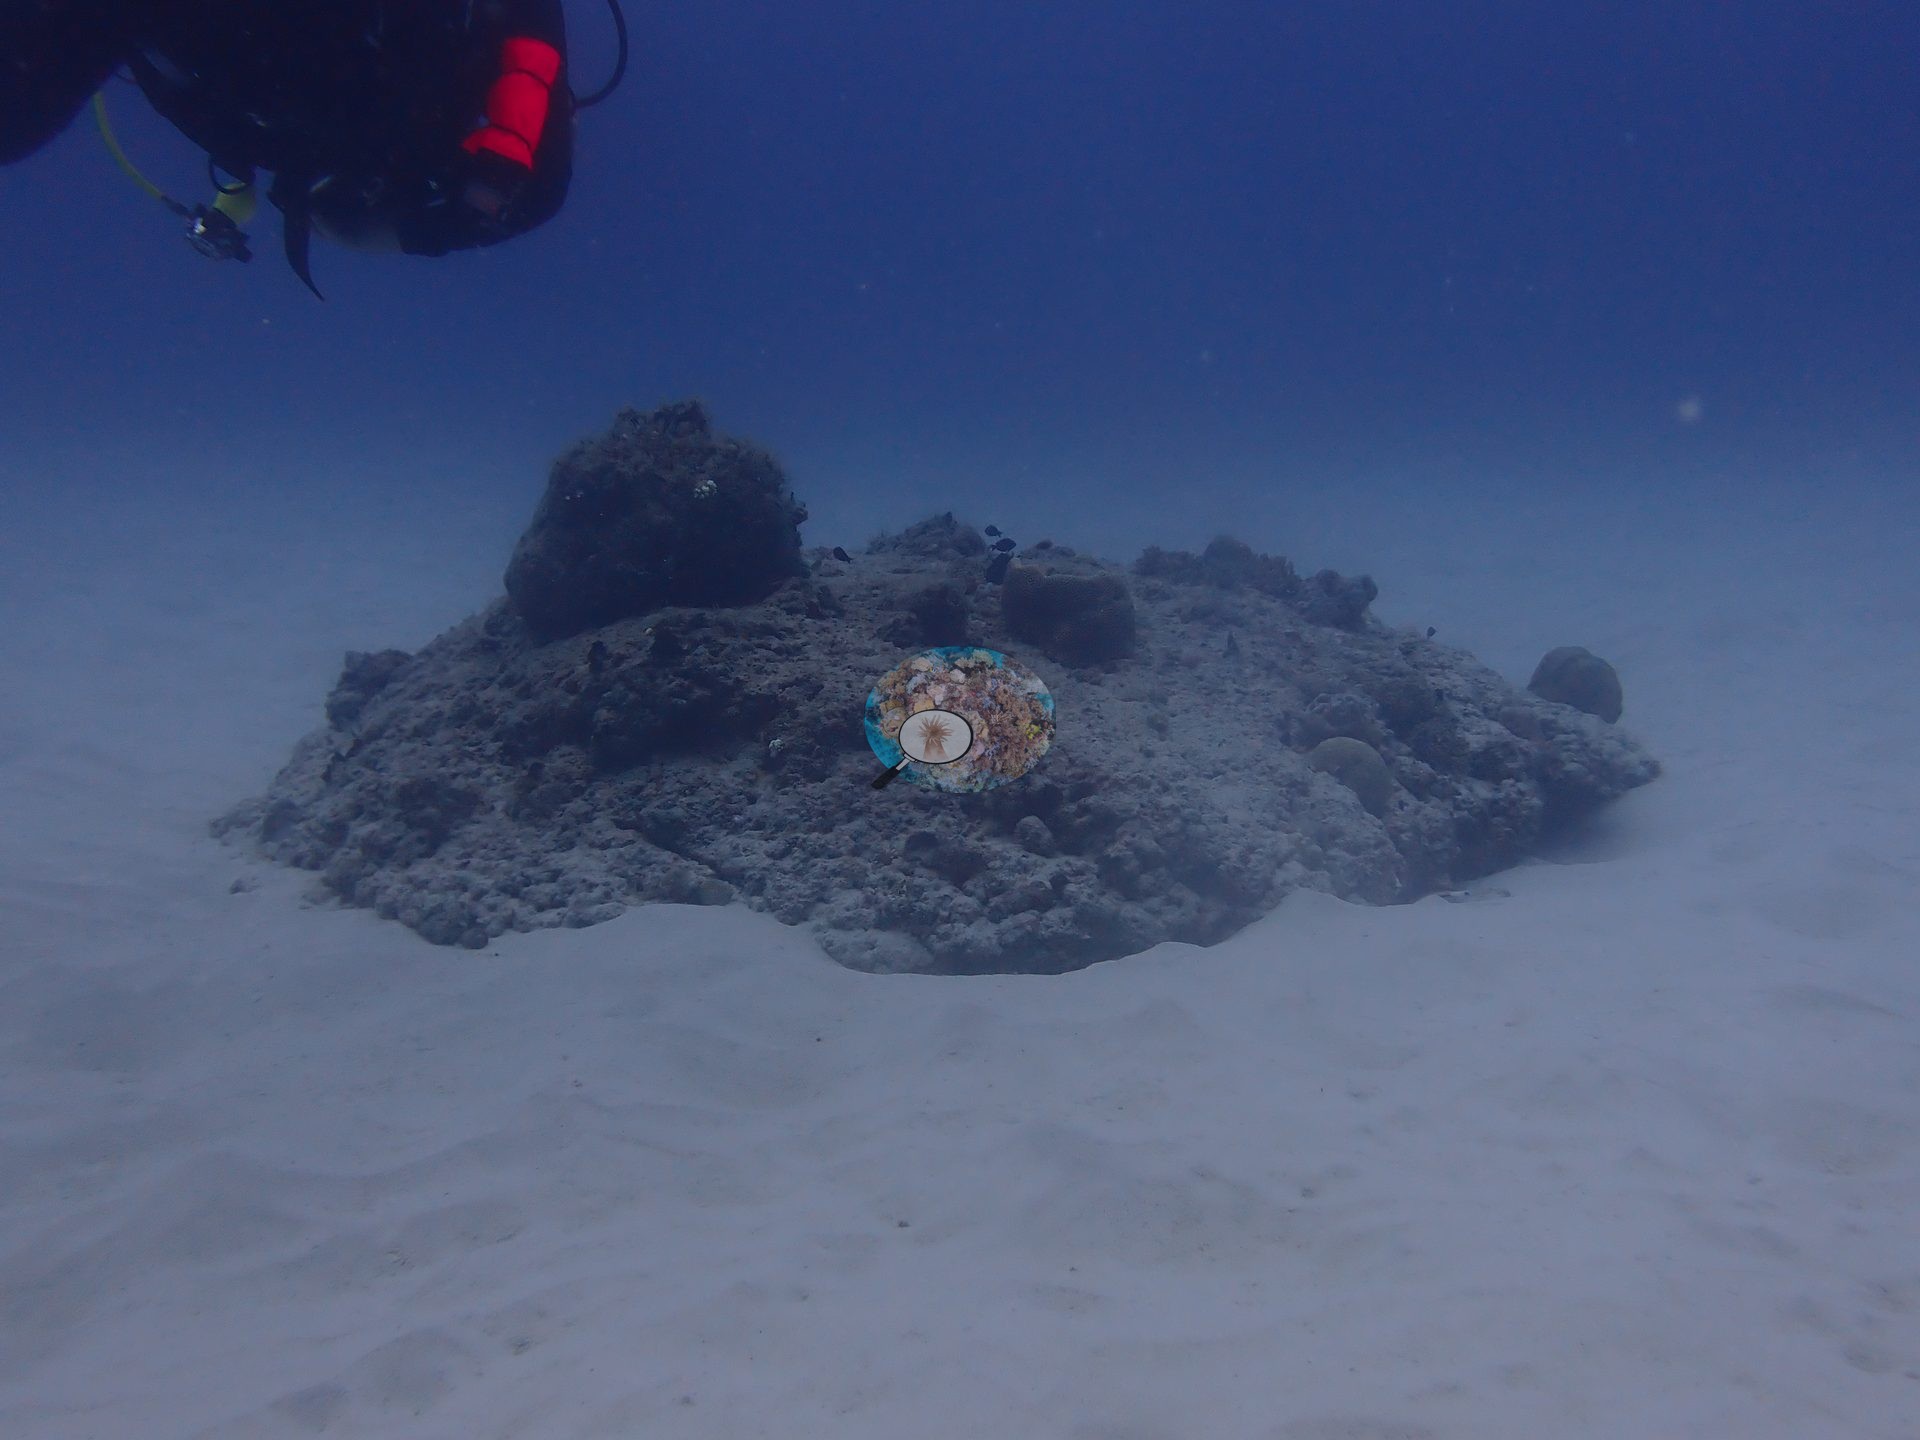
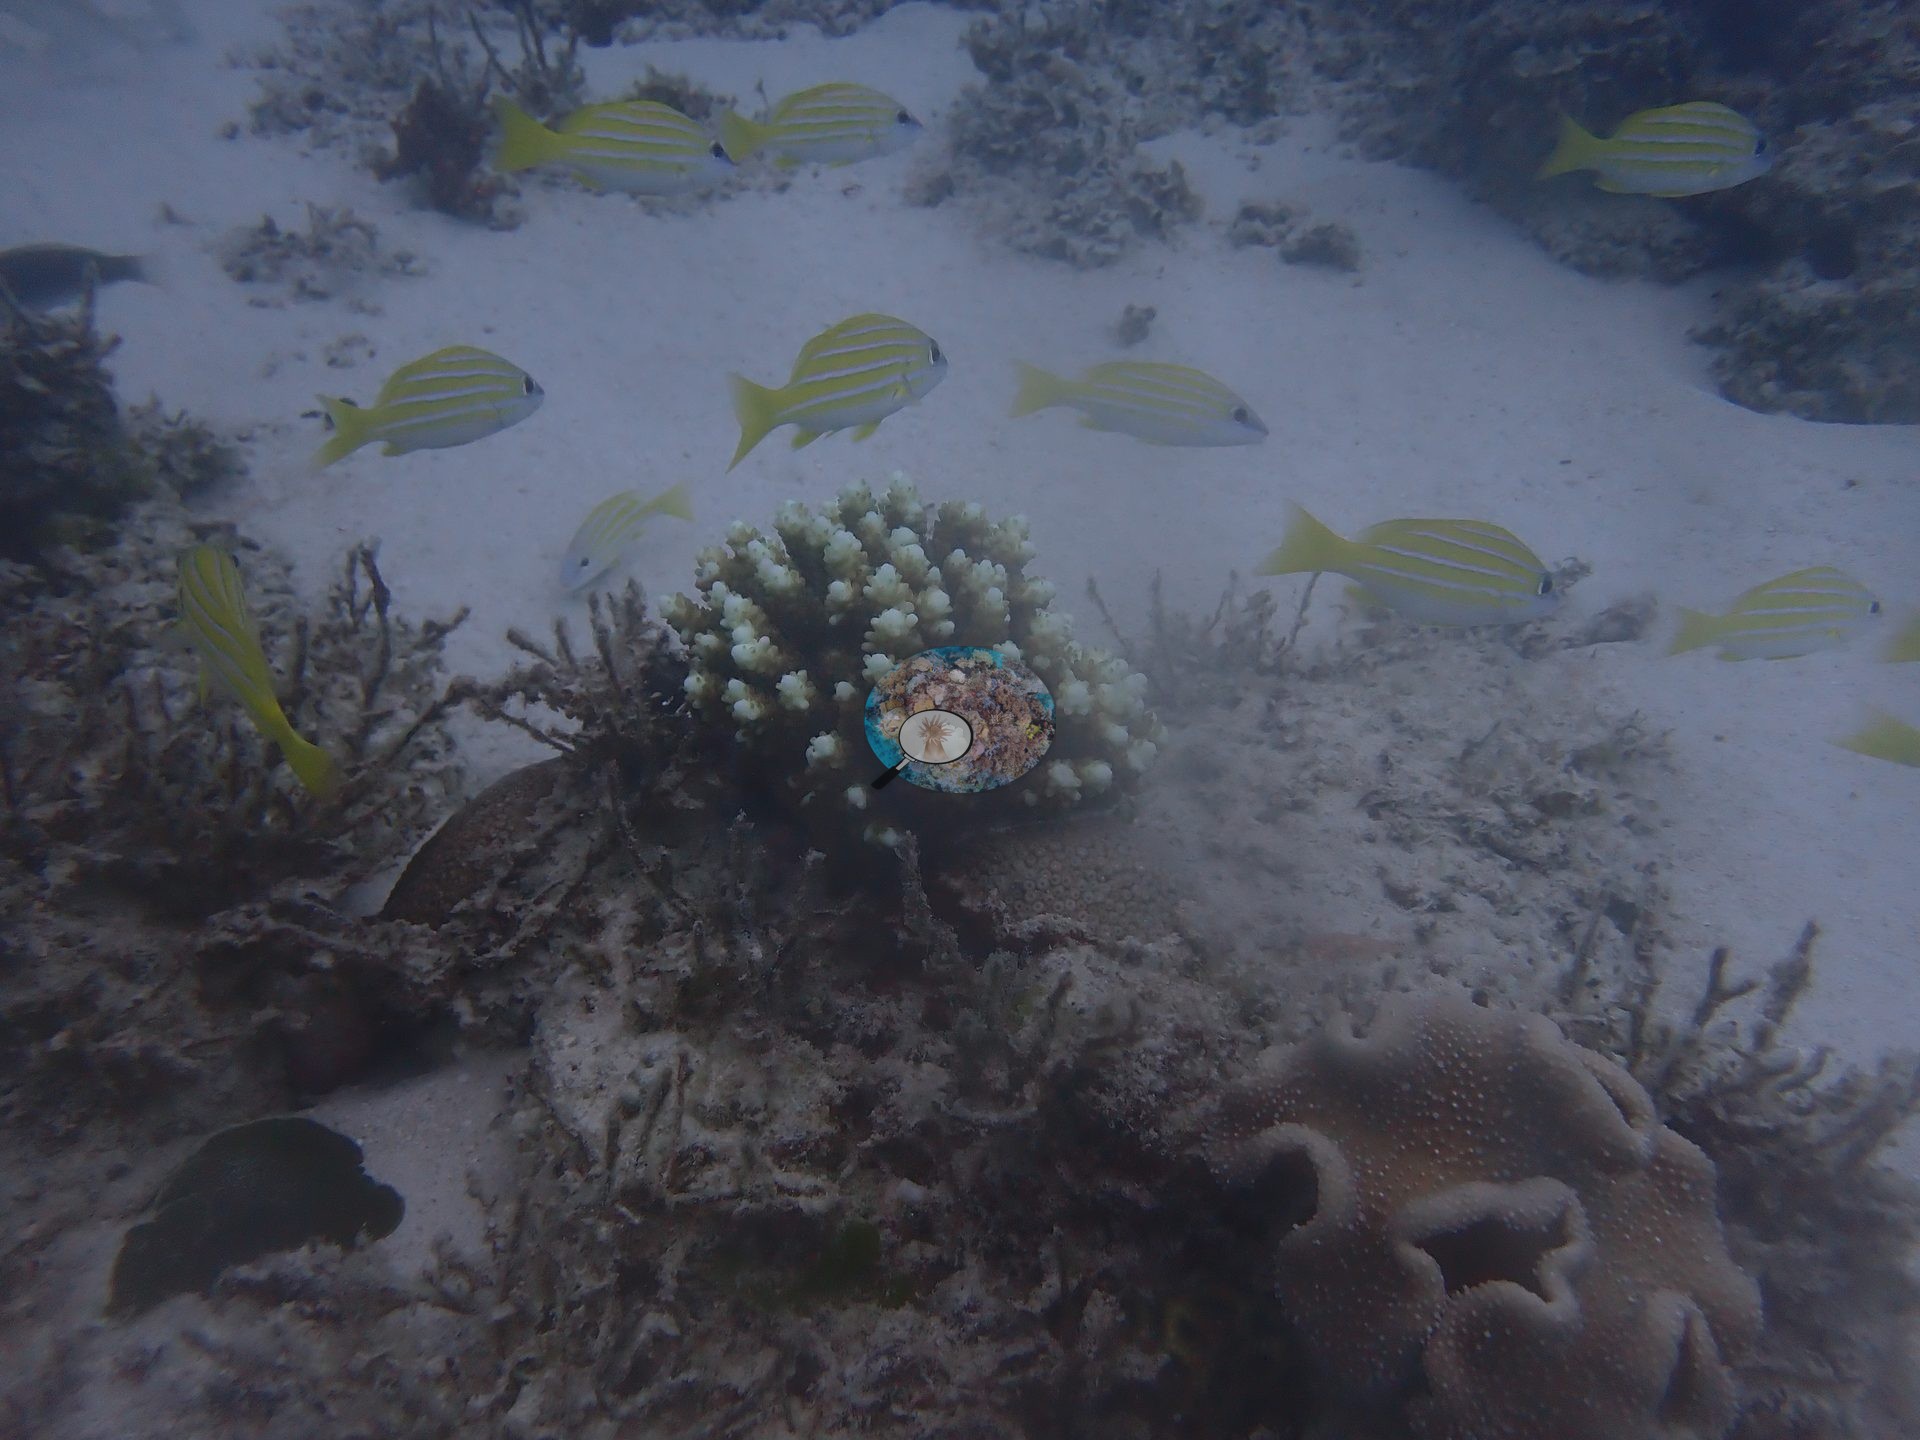
Ti Korail is a low-relief patch reef and rubble/sand flat rather than a wall or slope, with scattered coral heads and small bommies rising from broad areas of open sand and coral rubble (e.g., Image 5, Image 10, Image 13).
General benthic features
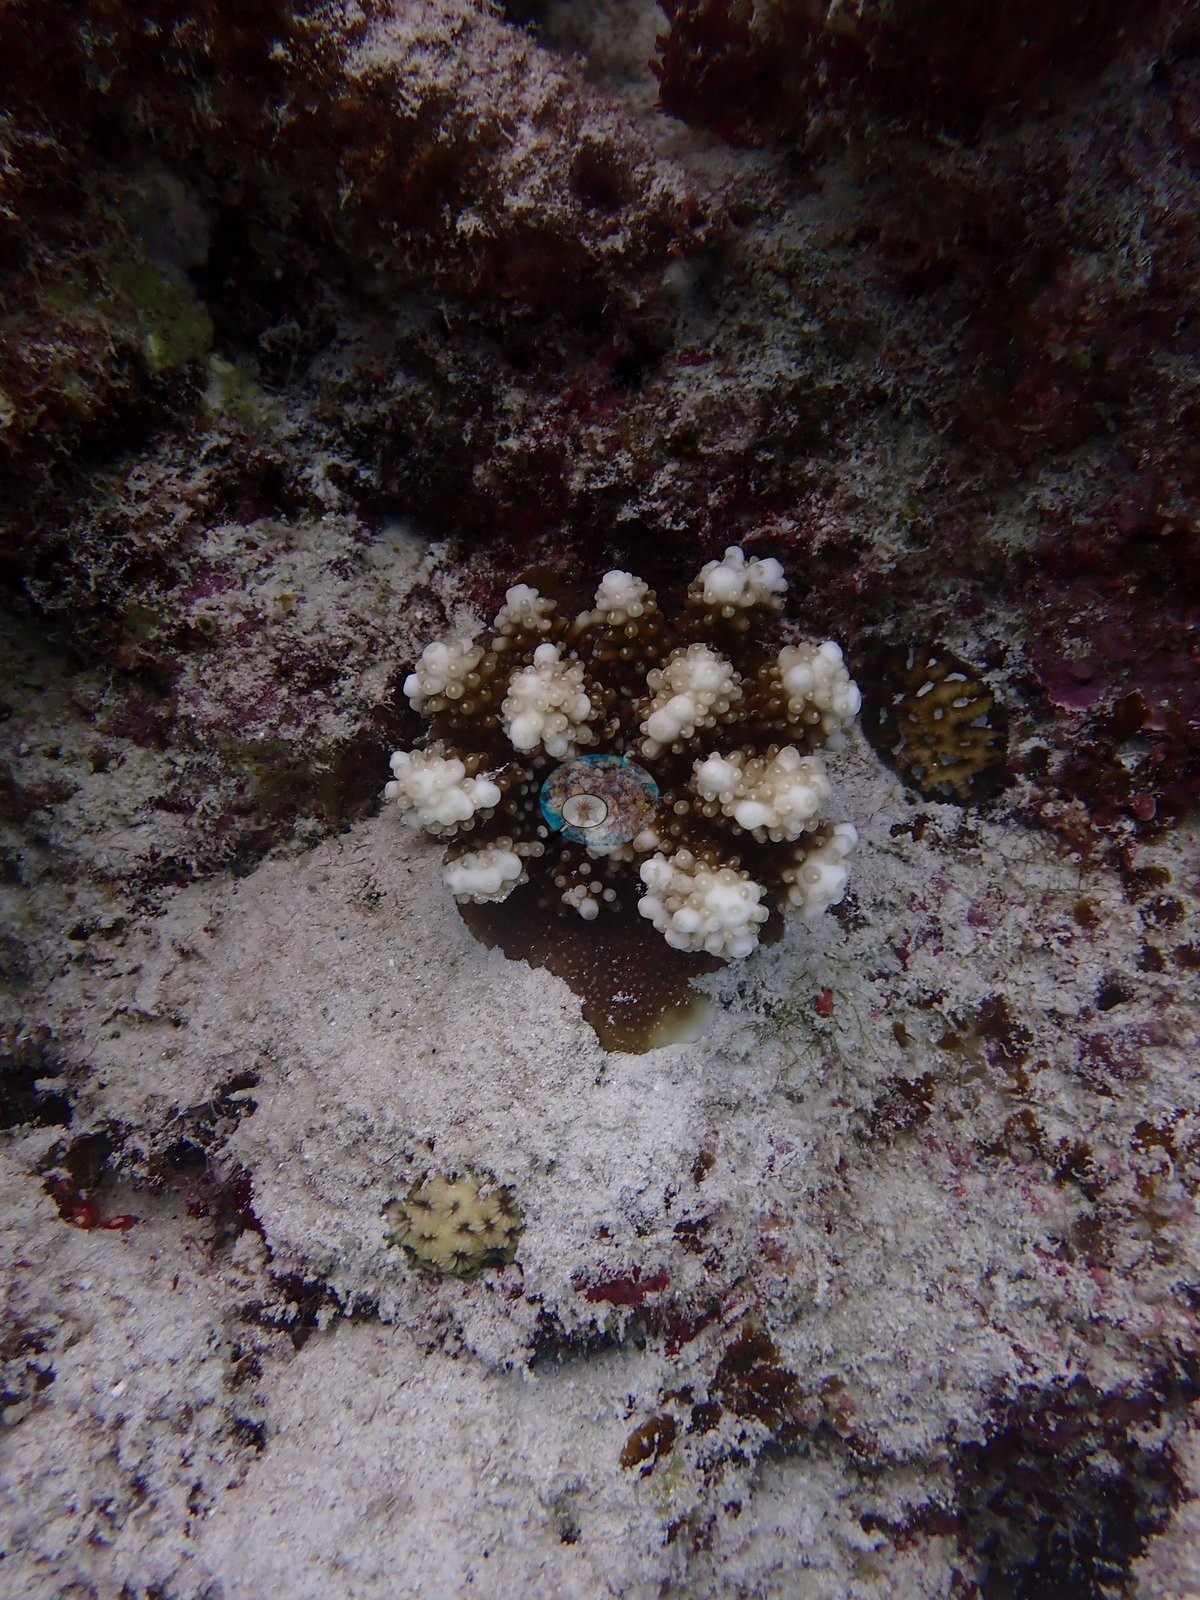
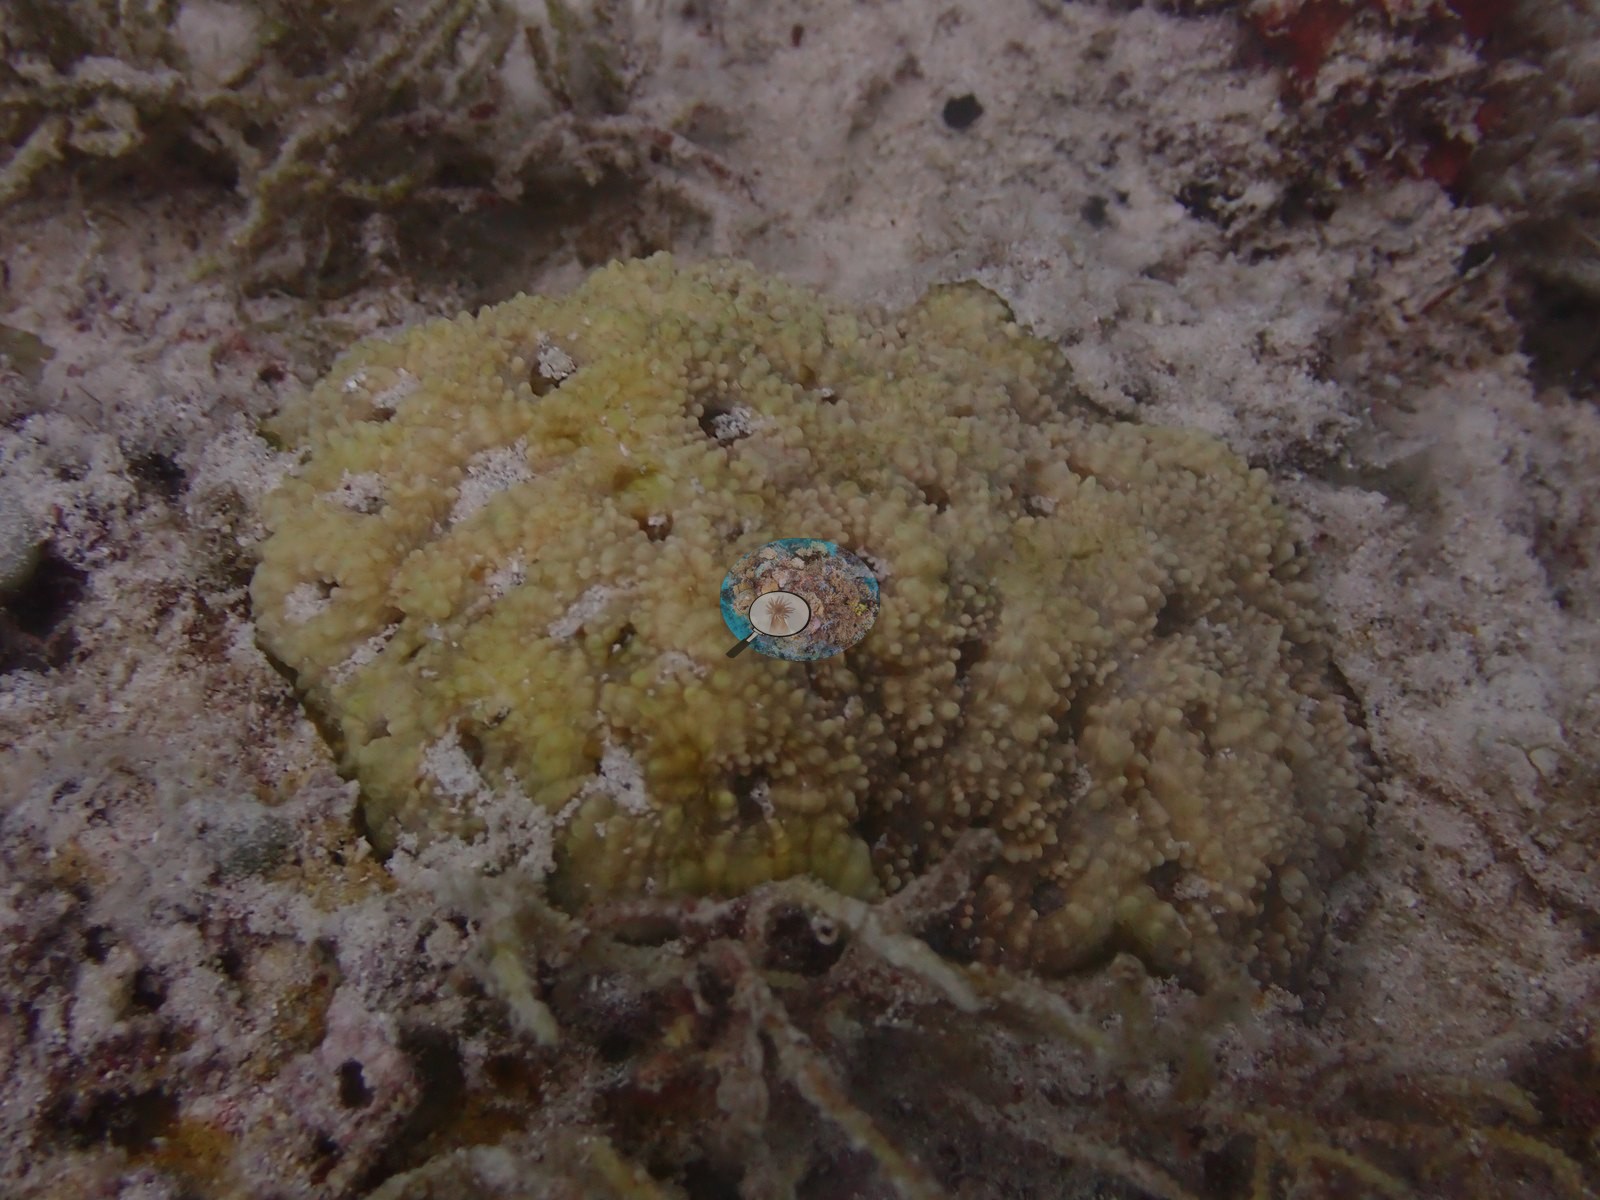
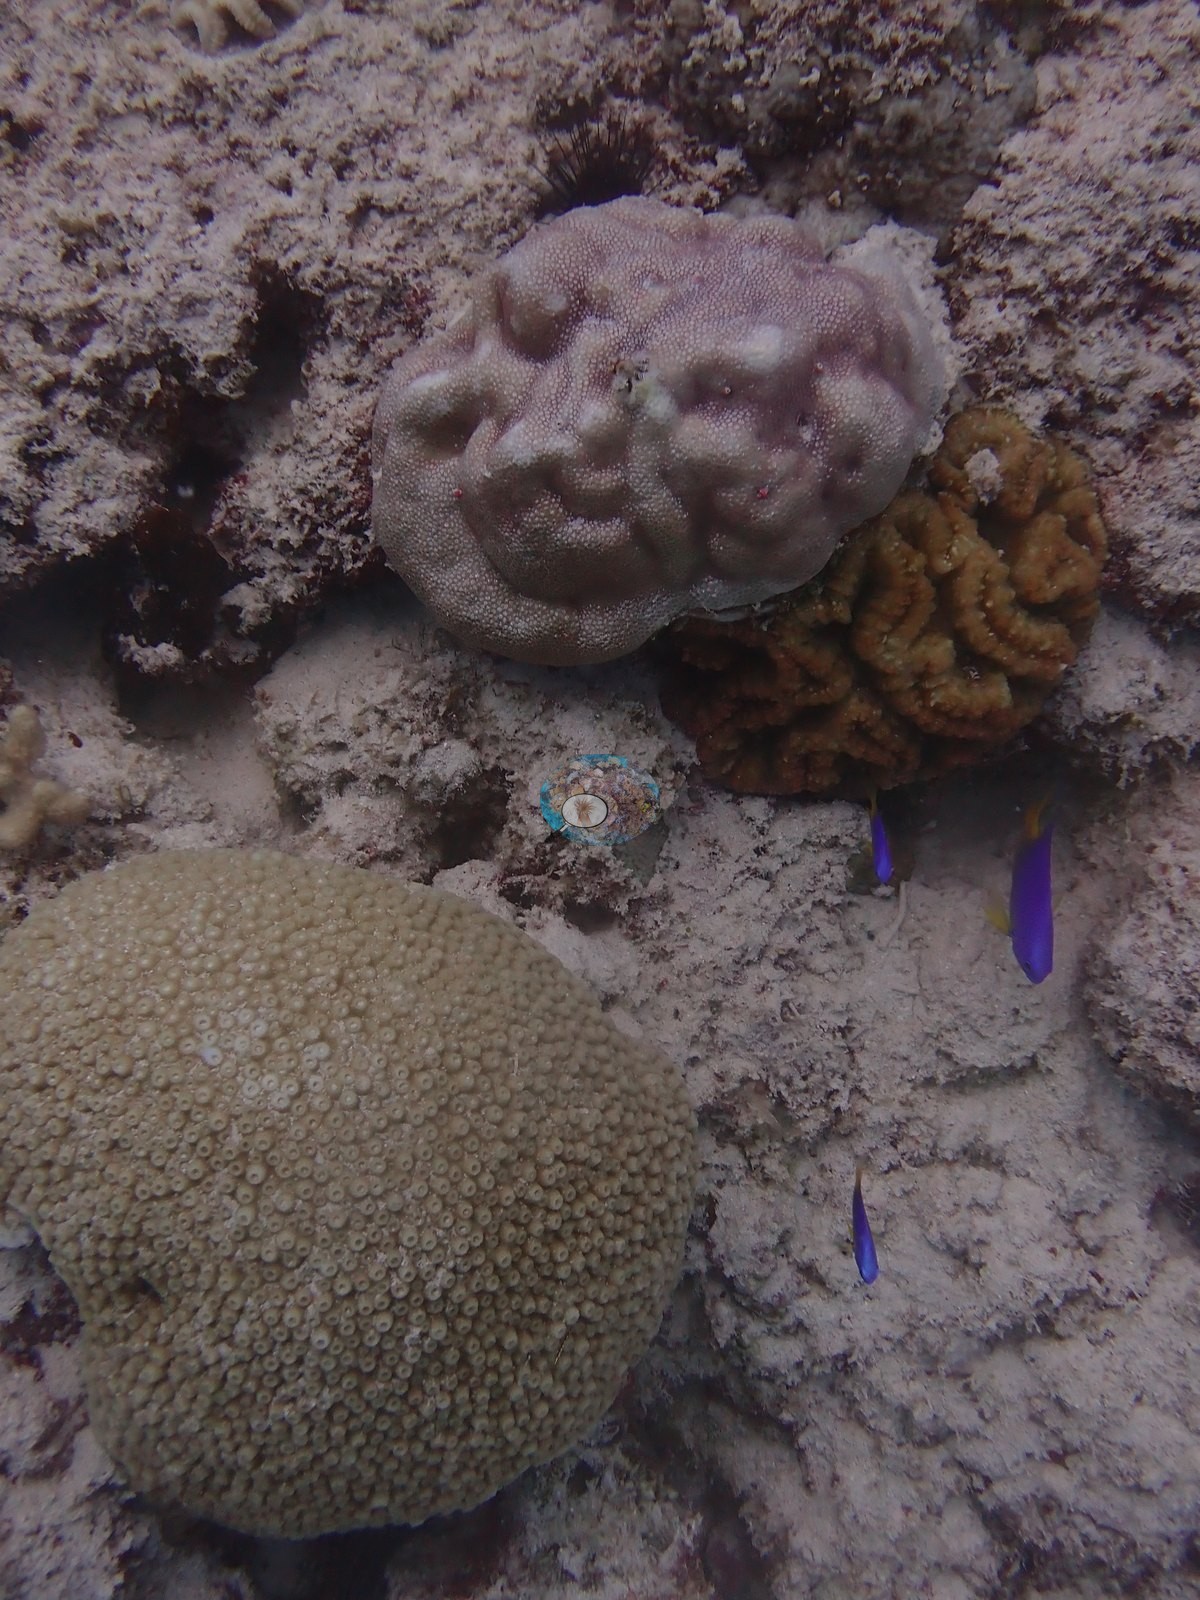
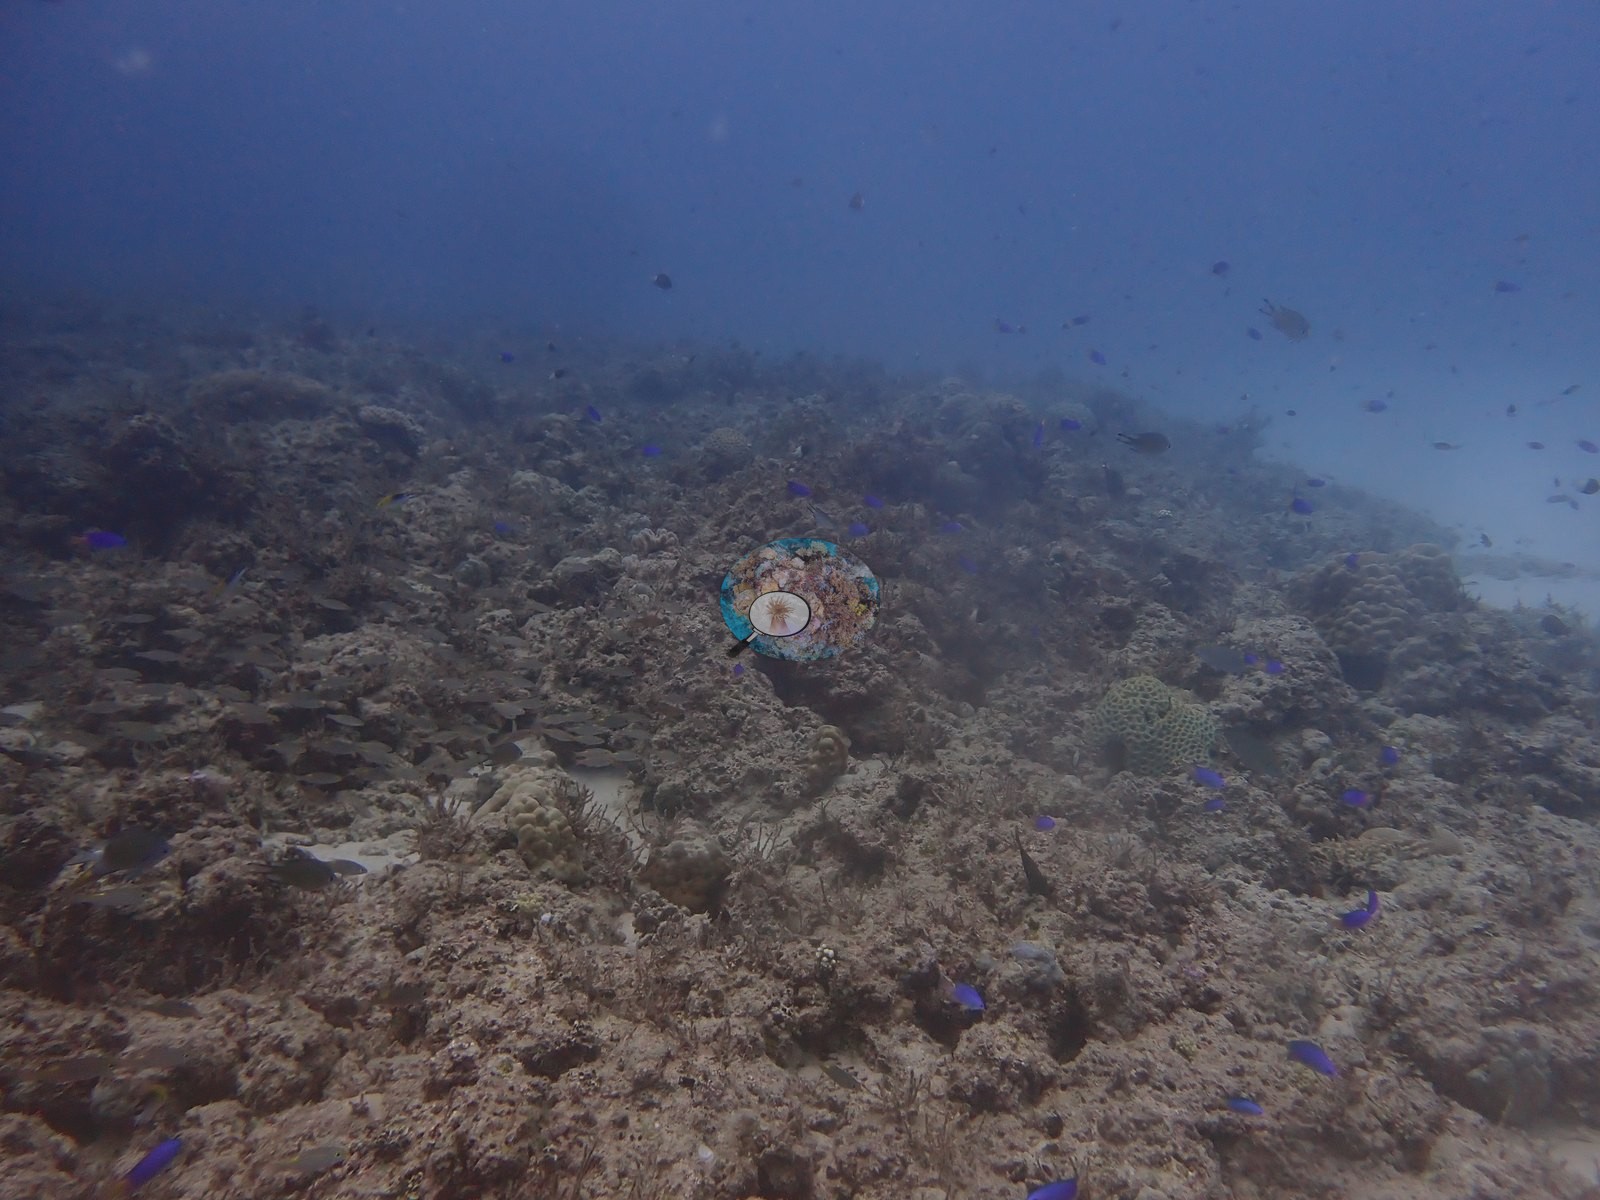
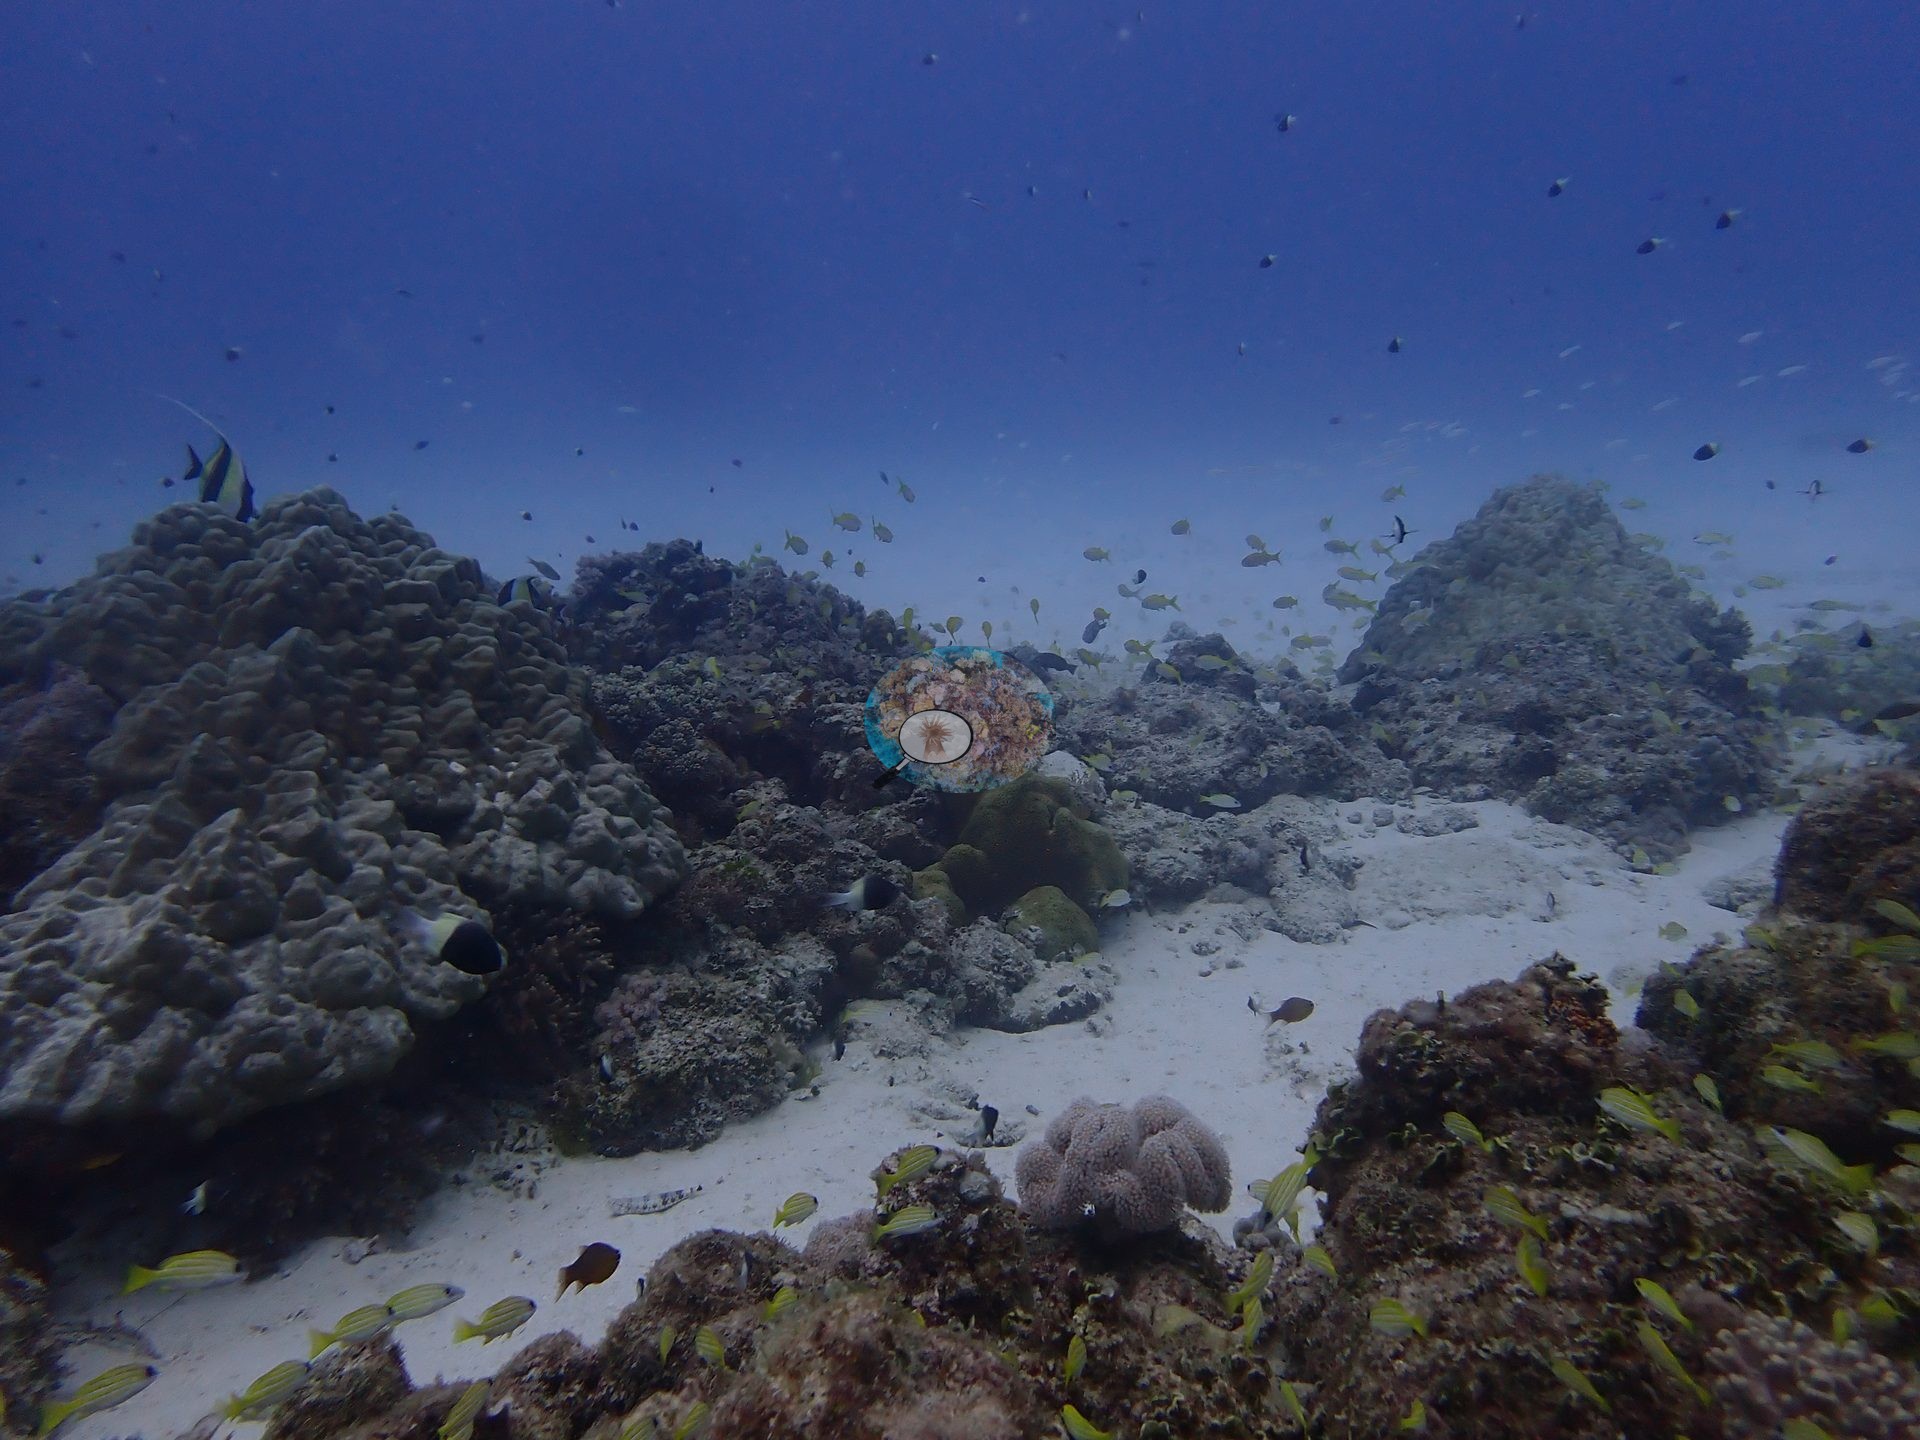
The larger colonies were massive Porites and brain coral forms consistent with Dipsastraea/Favites, together with smaller branching and digitate growth compatible with Acropora or Pocillopora, occasional foliose plates, and fungiids scattered across the rubble (e.g., Image 2, Image 6, Image 7).
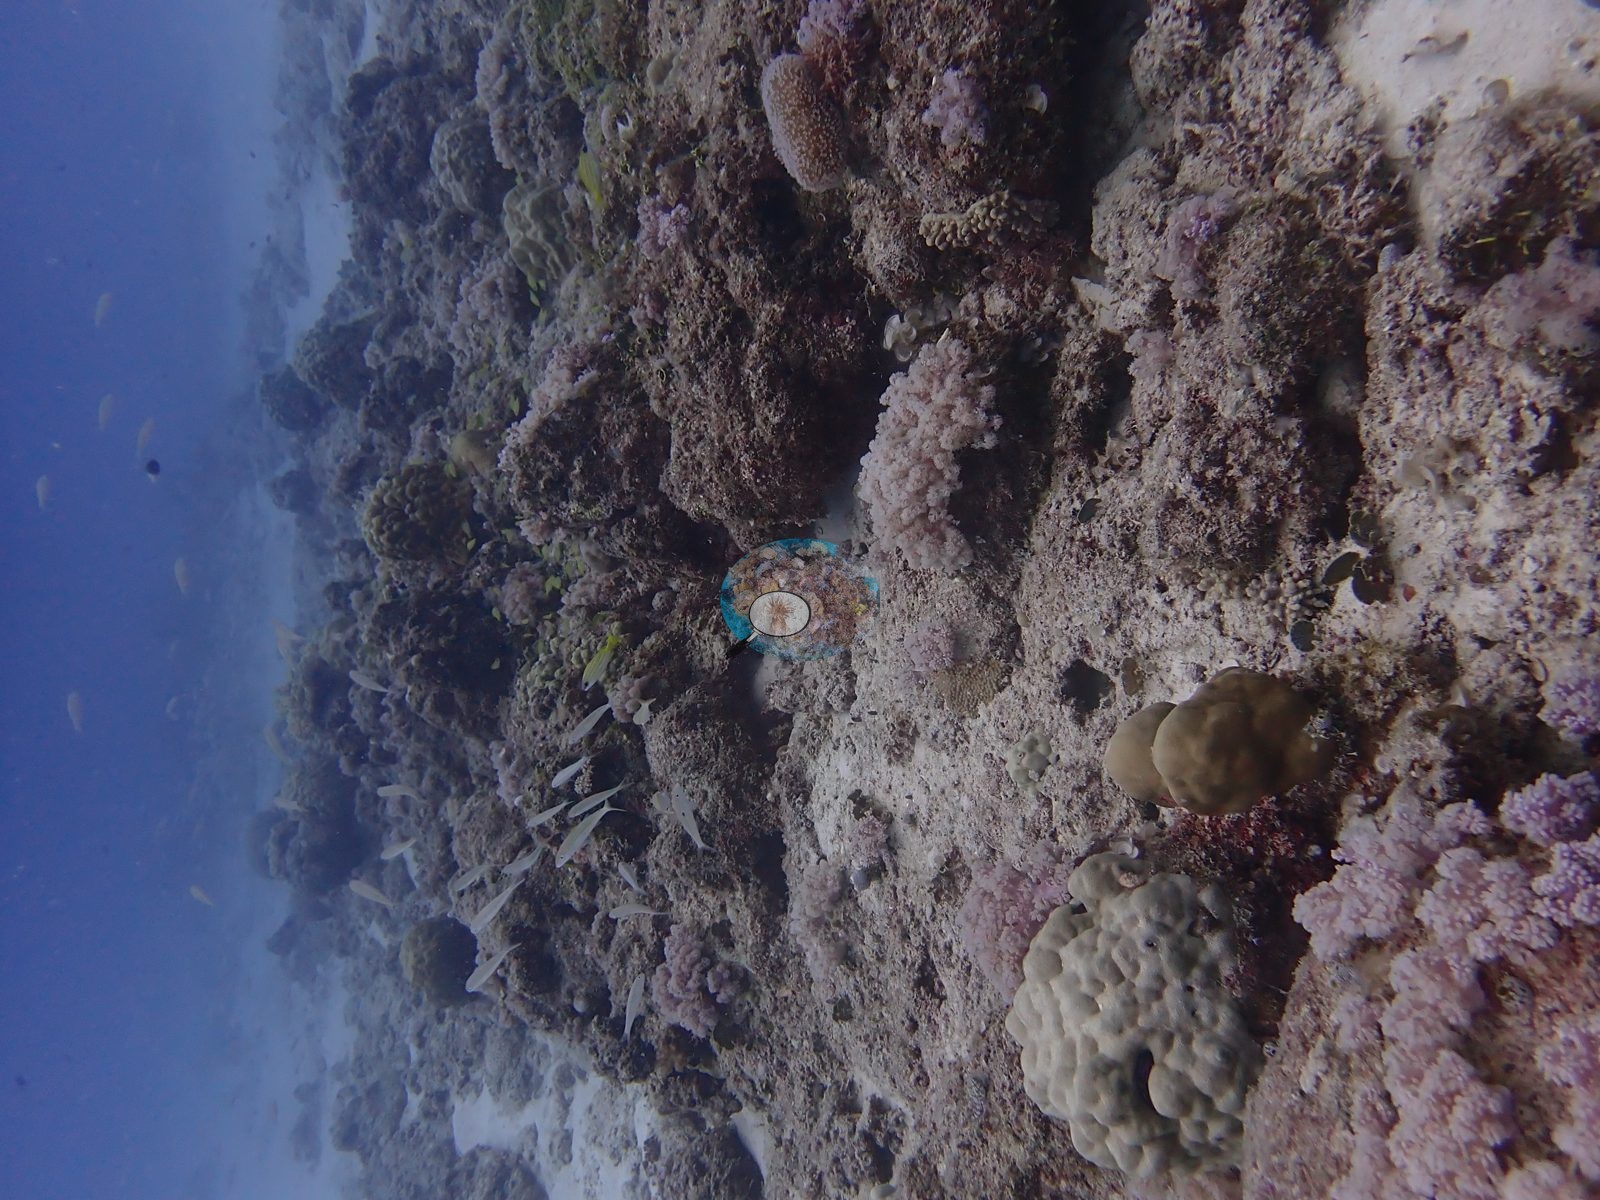
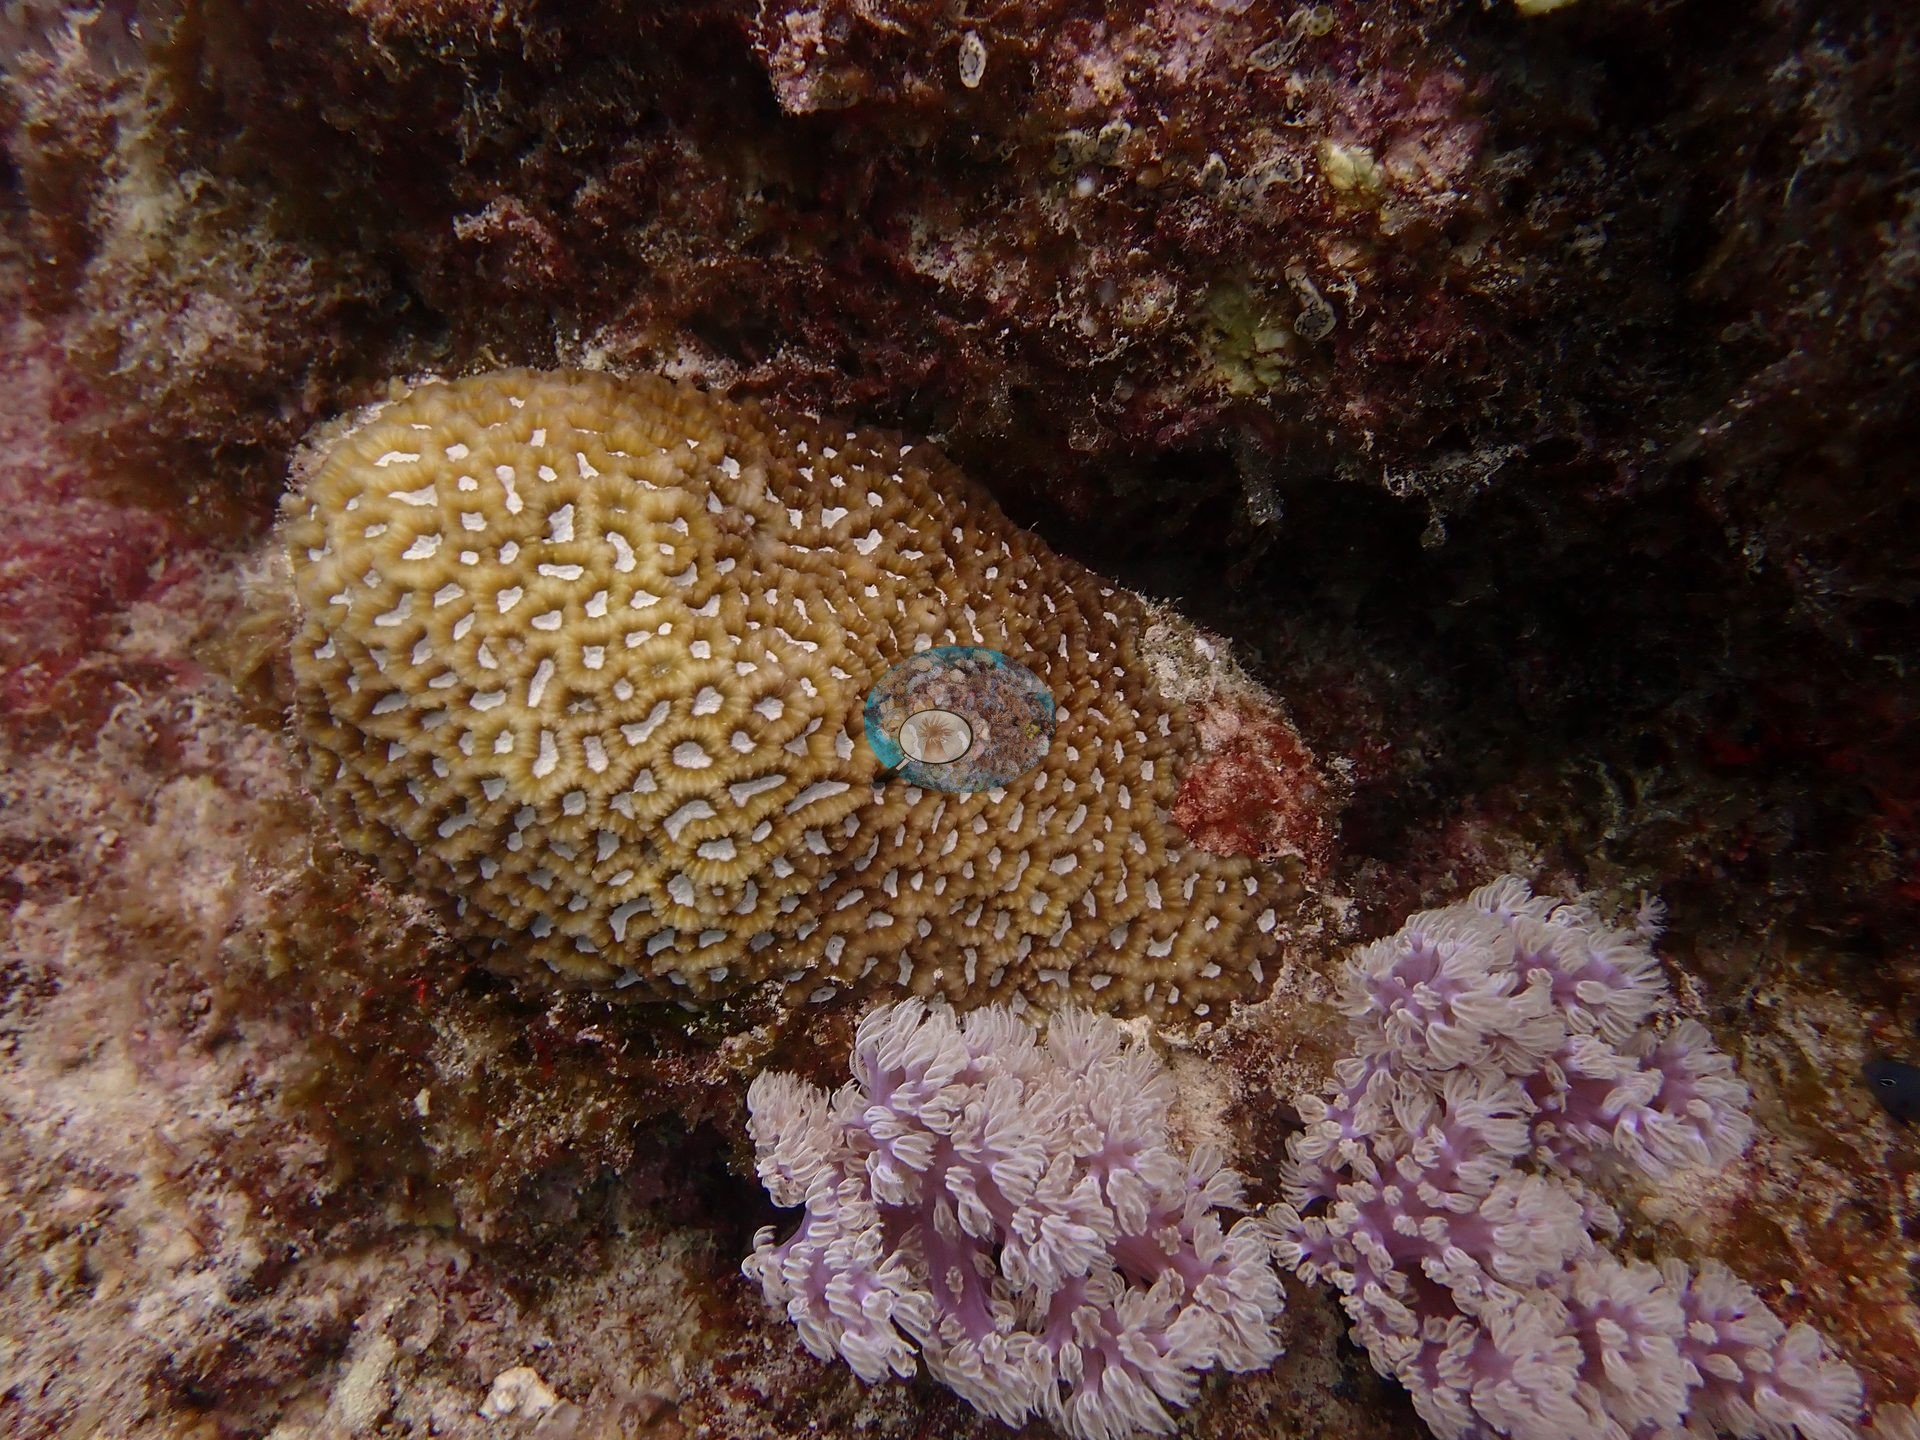
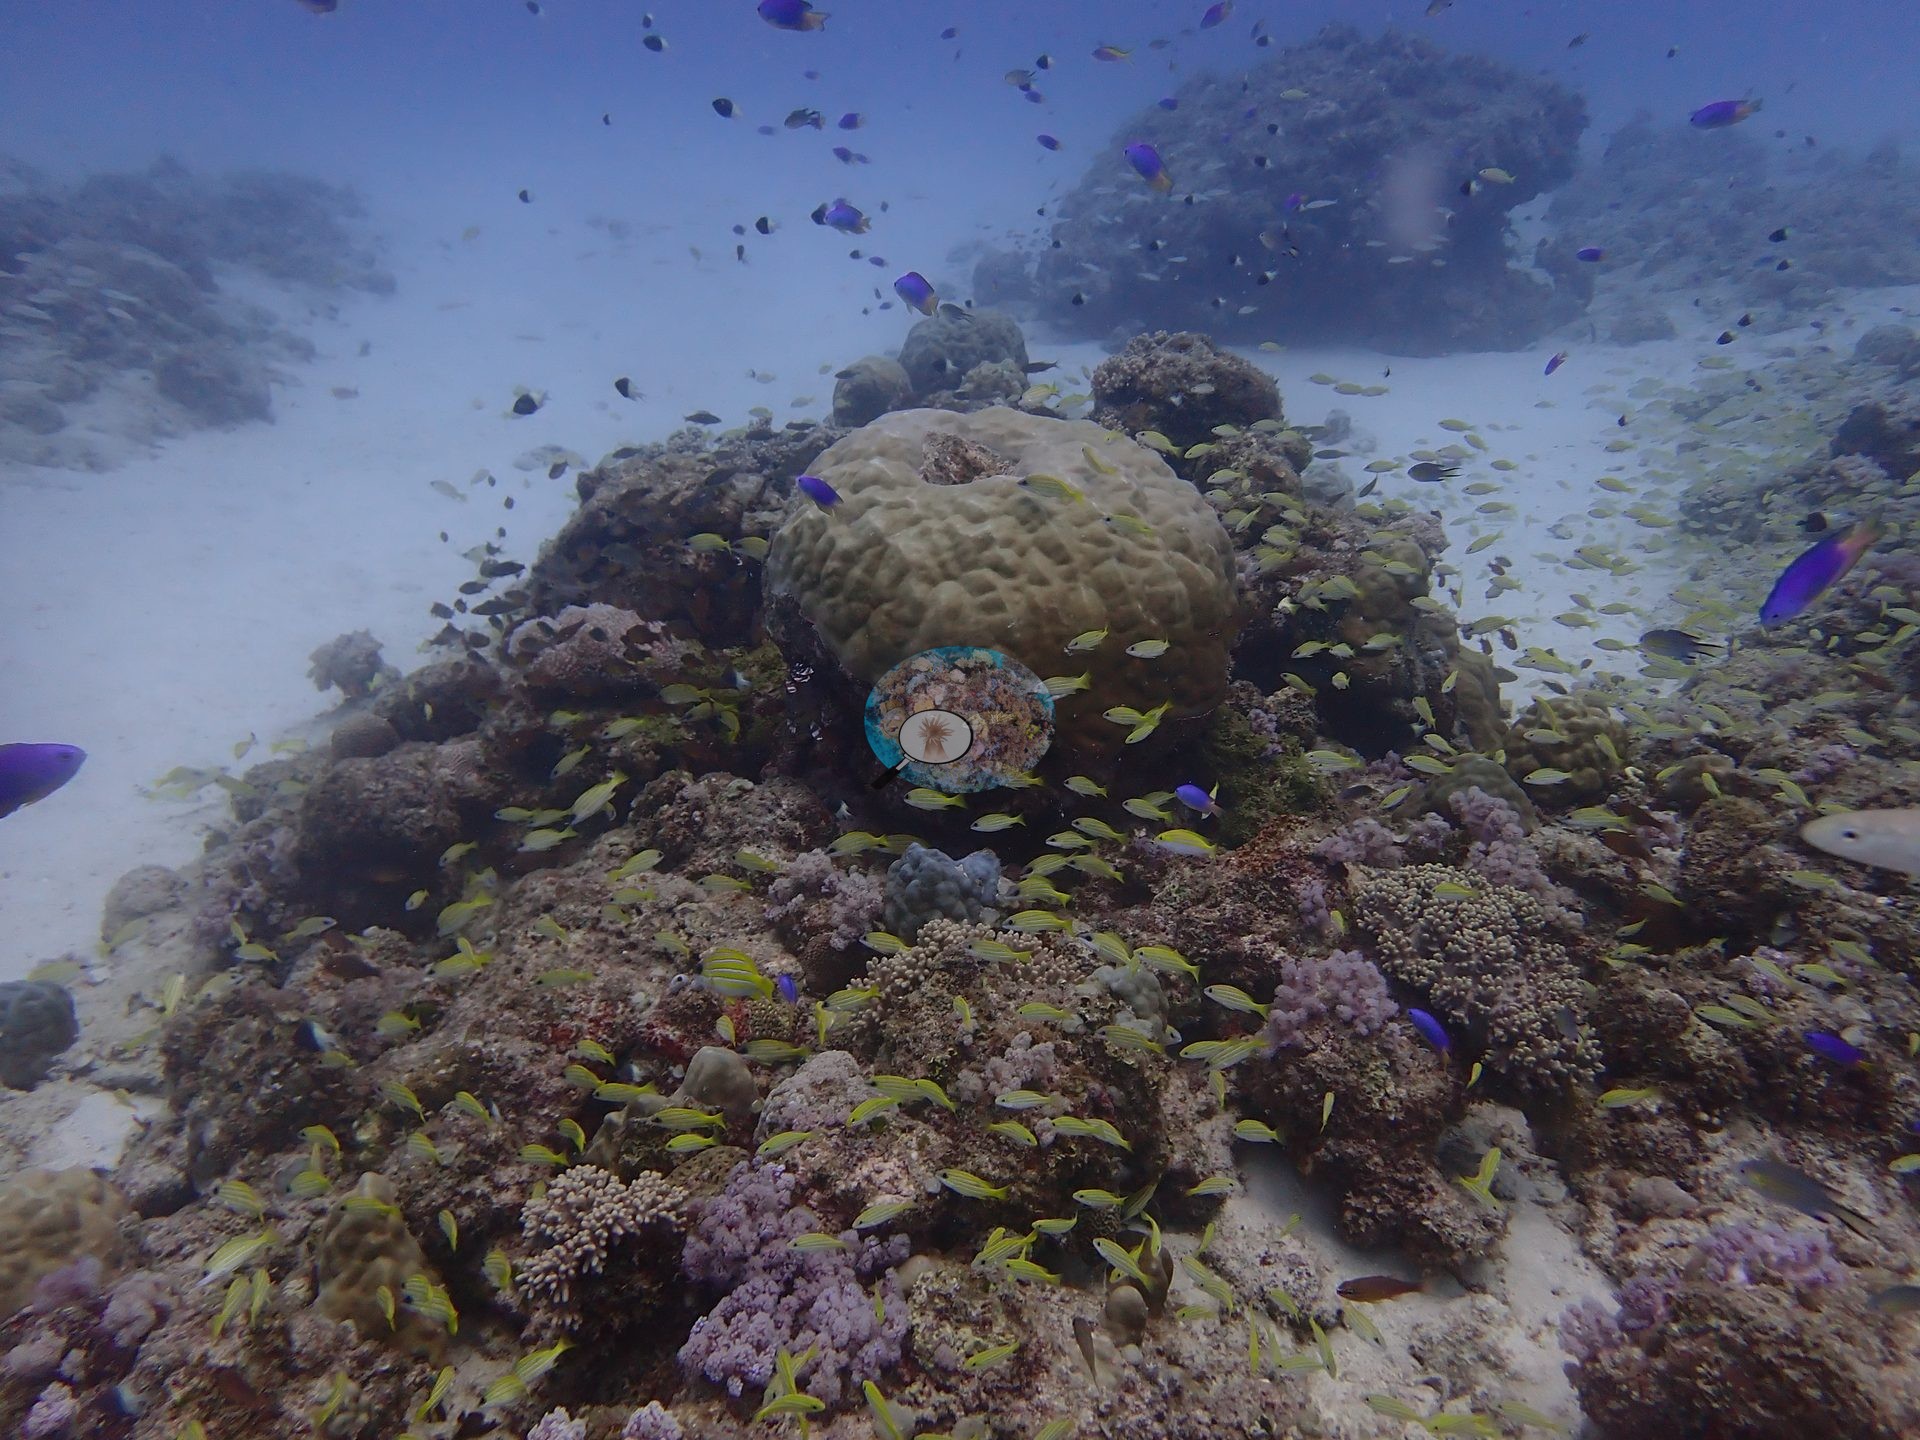
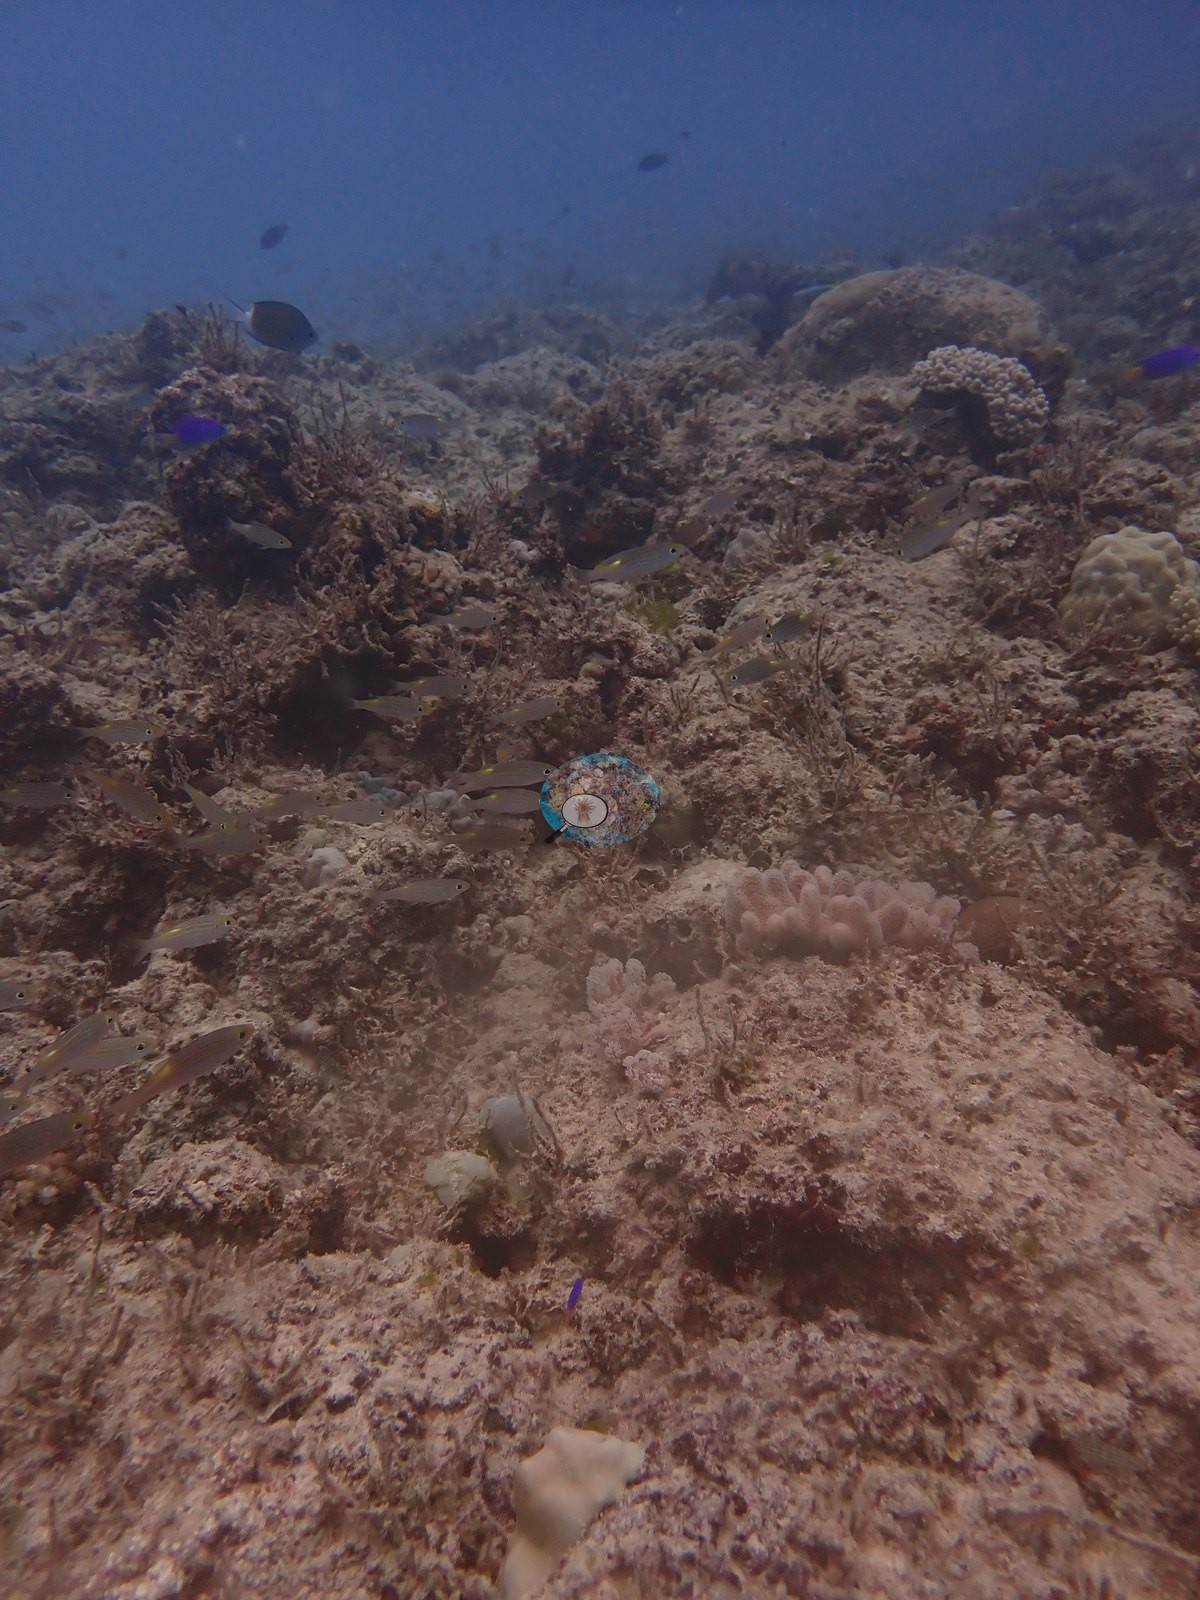
Live coral cover was highly patchy, with isolated healthy colonies set against an otherwise bare, sediment-covered substrate (e.g., Image 3, Image 11).
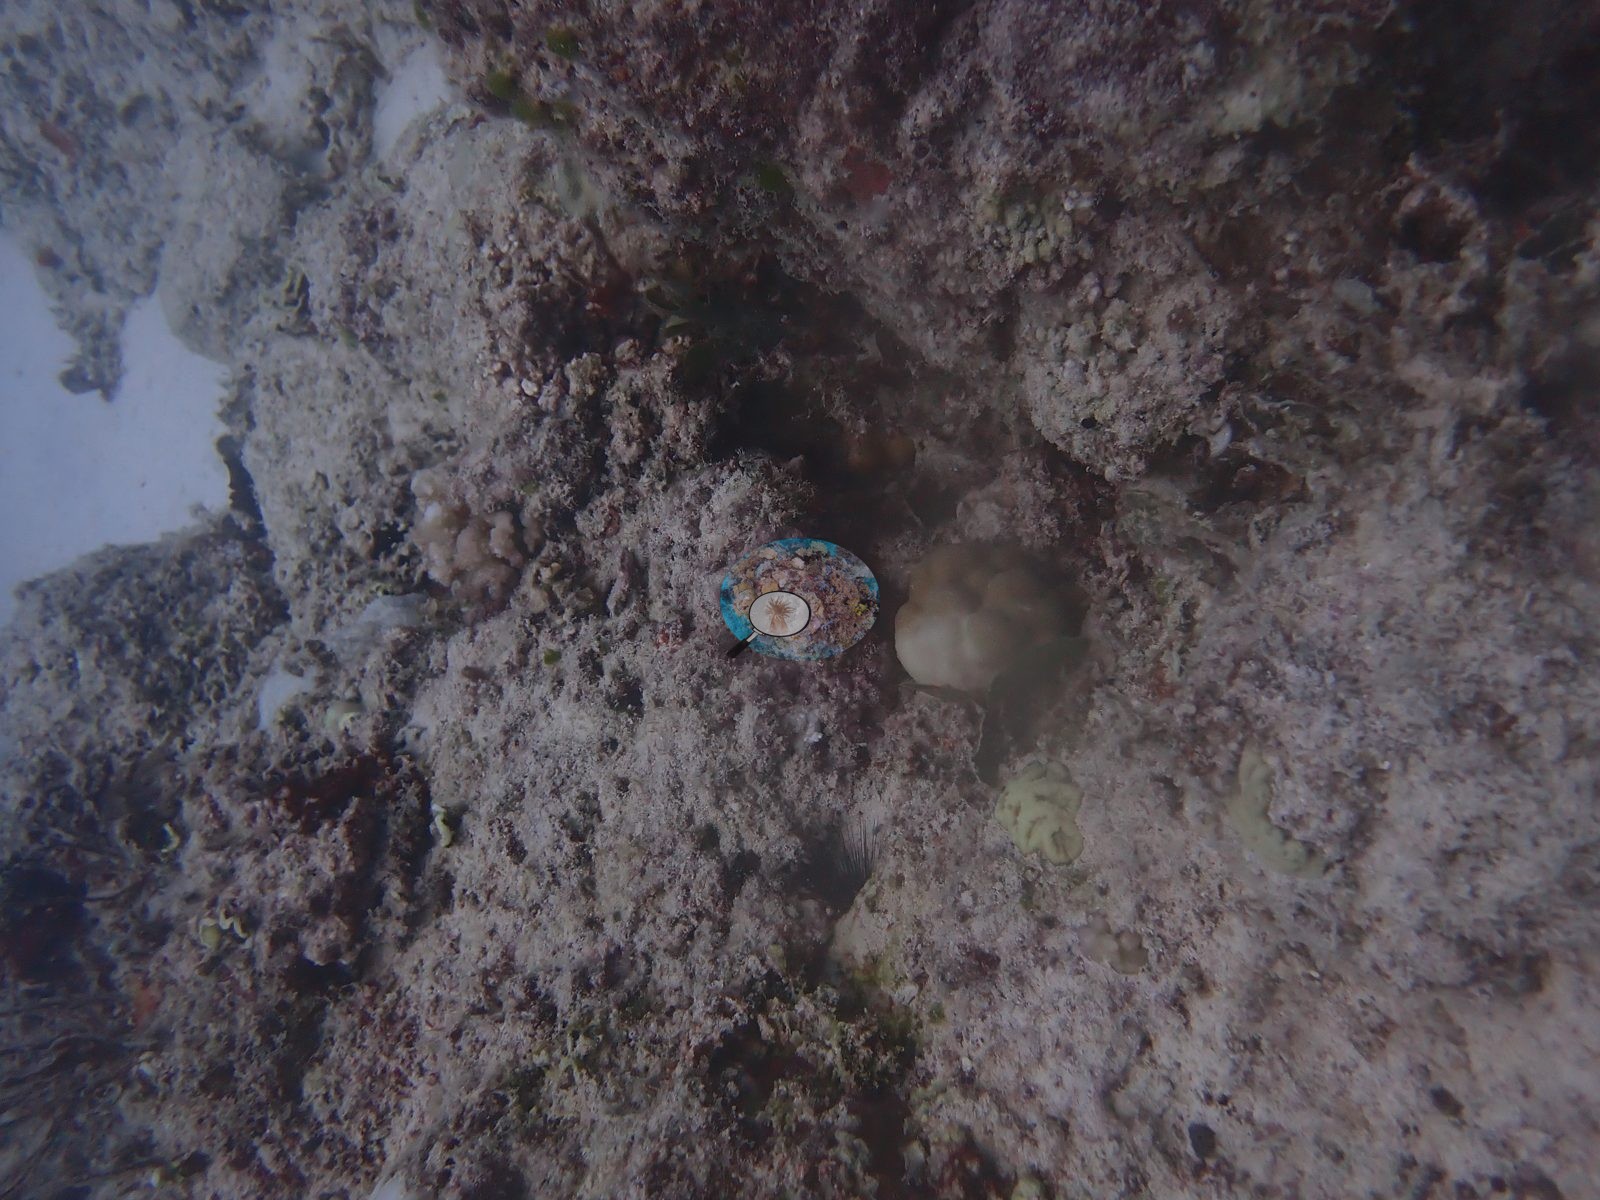
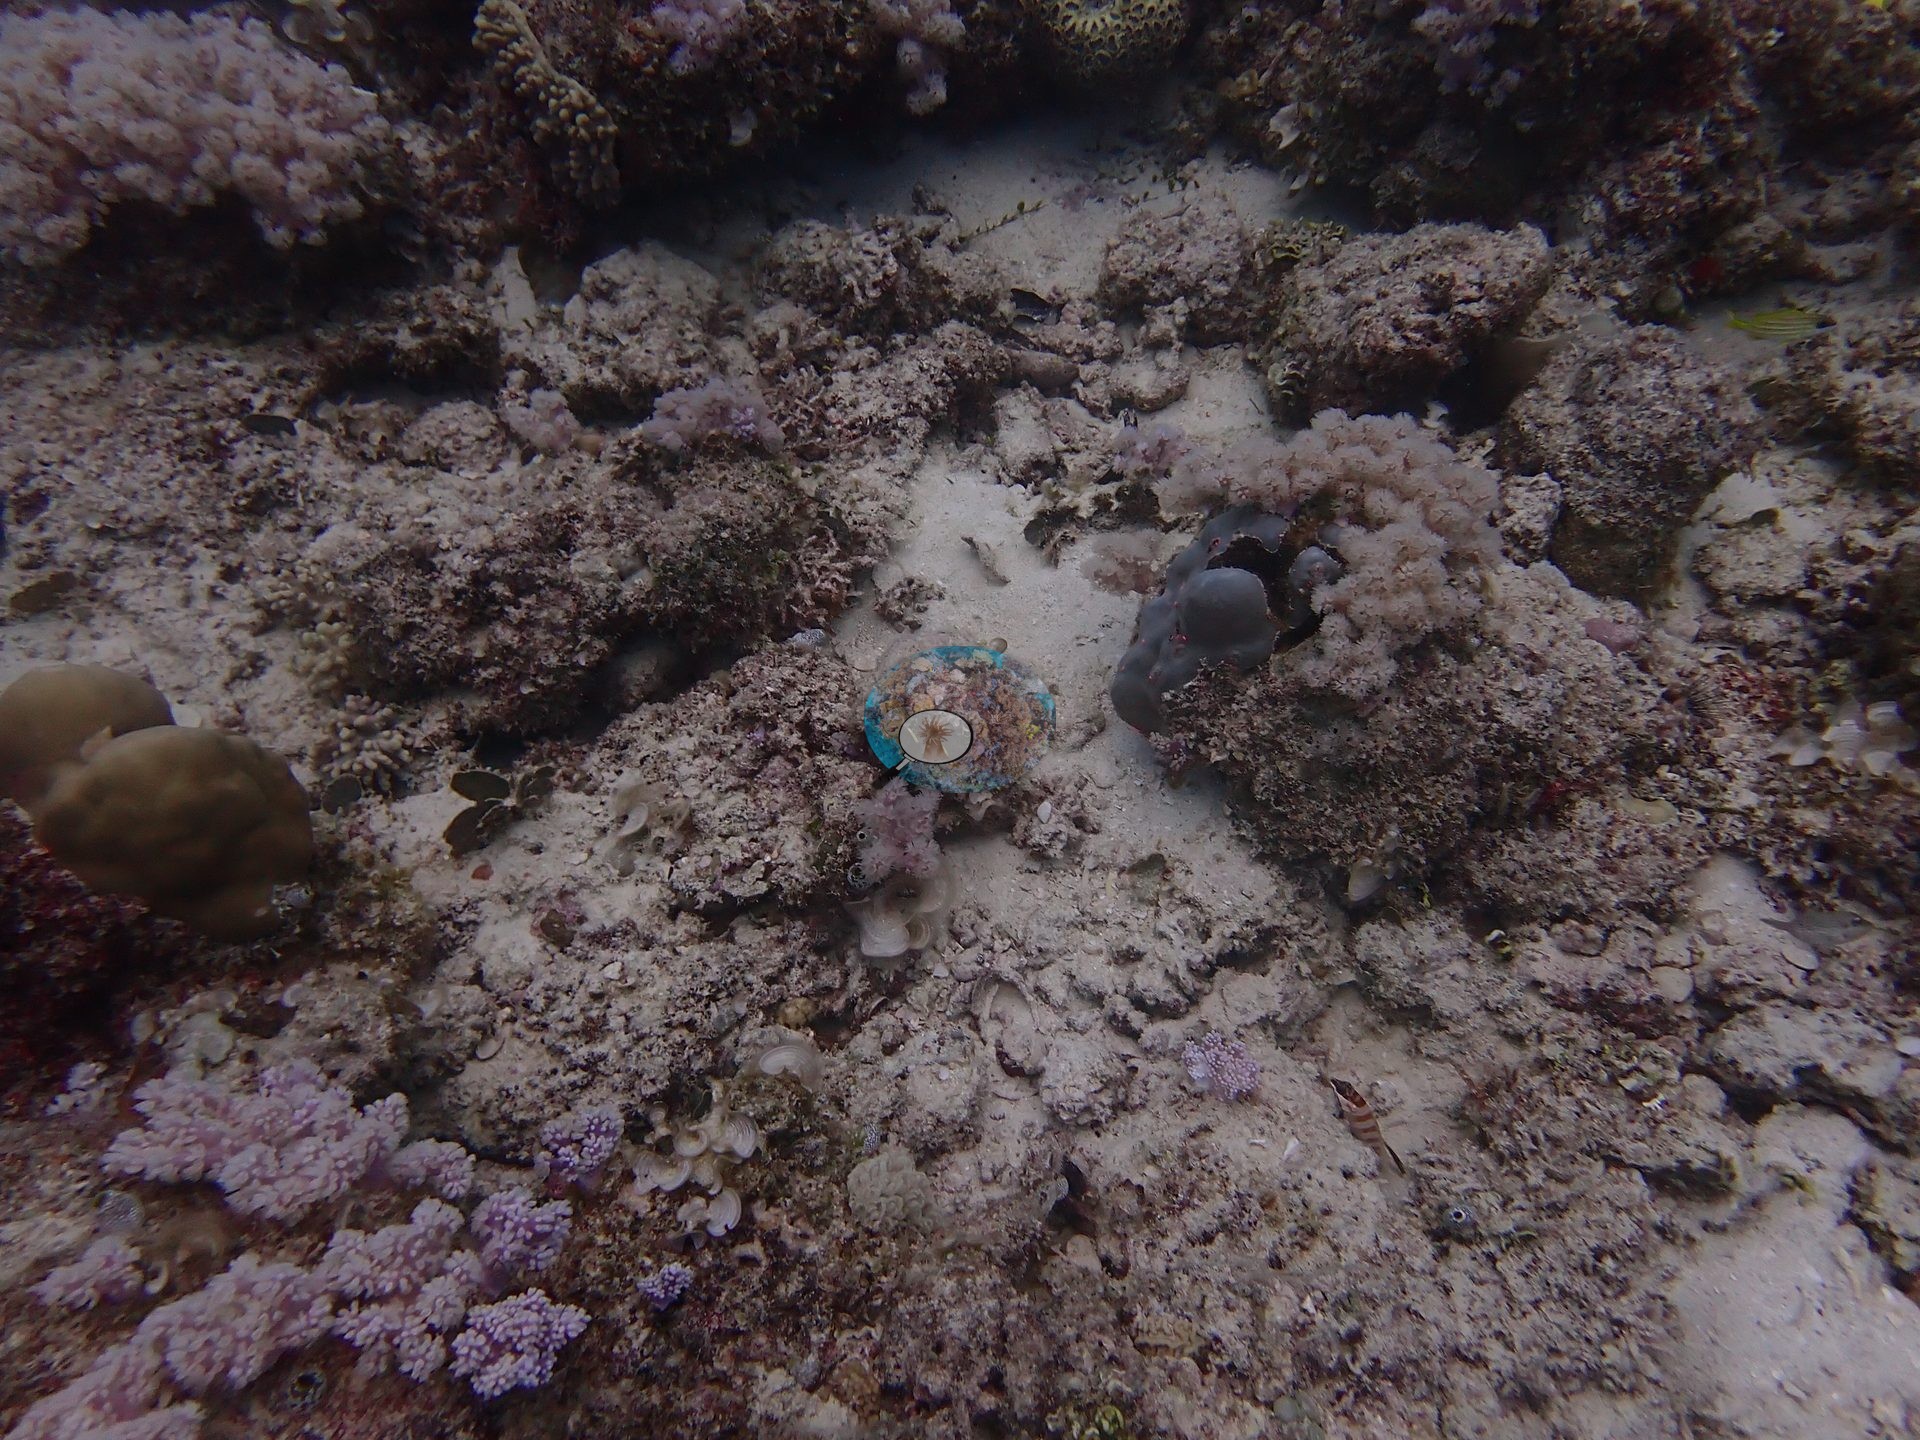
Coral cover
Coral cover: 5.4% — the site cover estimate from Anderson Mayfield's Mauritius manuscript (his manual point count and CoralNet, weighted equally); the manual point count alone is 7.0%. The earlier four-method average for this site was 15.0%; every method is compared in the table below. The figure pools a manual annotation, CoralNet point counts, an in-house DINOv3 point classifier, and a CoralSCOP computer vision over Anderson's own frames. The methods have different denominators and sampling footprints, so this is a provisional photo-derived index rather than a diver survey, and the agreement between the four is the real measure of confidence at this site. Anderson keeps an eye out for newer CV models and will refresh this CoralSCOP and DINOv3 figure once a more trustworthy option is available.
Stressors
No widespread bleaching was evident, though a few colonies showed pale or whitened polyps that image quality alone cannot reliably distinguish from natural coloration (e.g., Image 20).
No crown-of-thorns starfish (COTS) or other corallivores evident.
Fish and other fauna
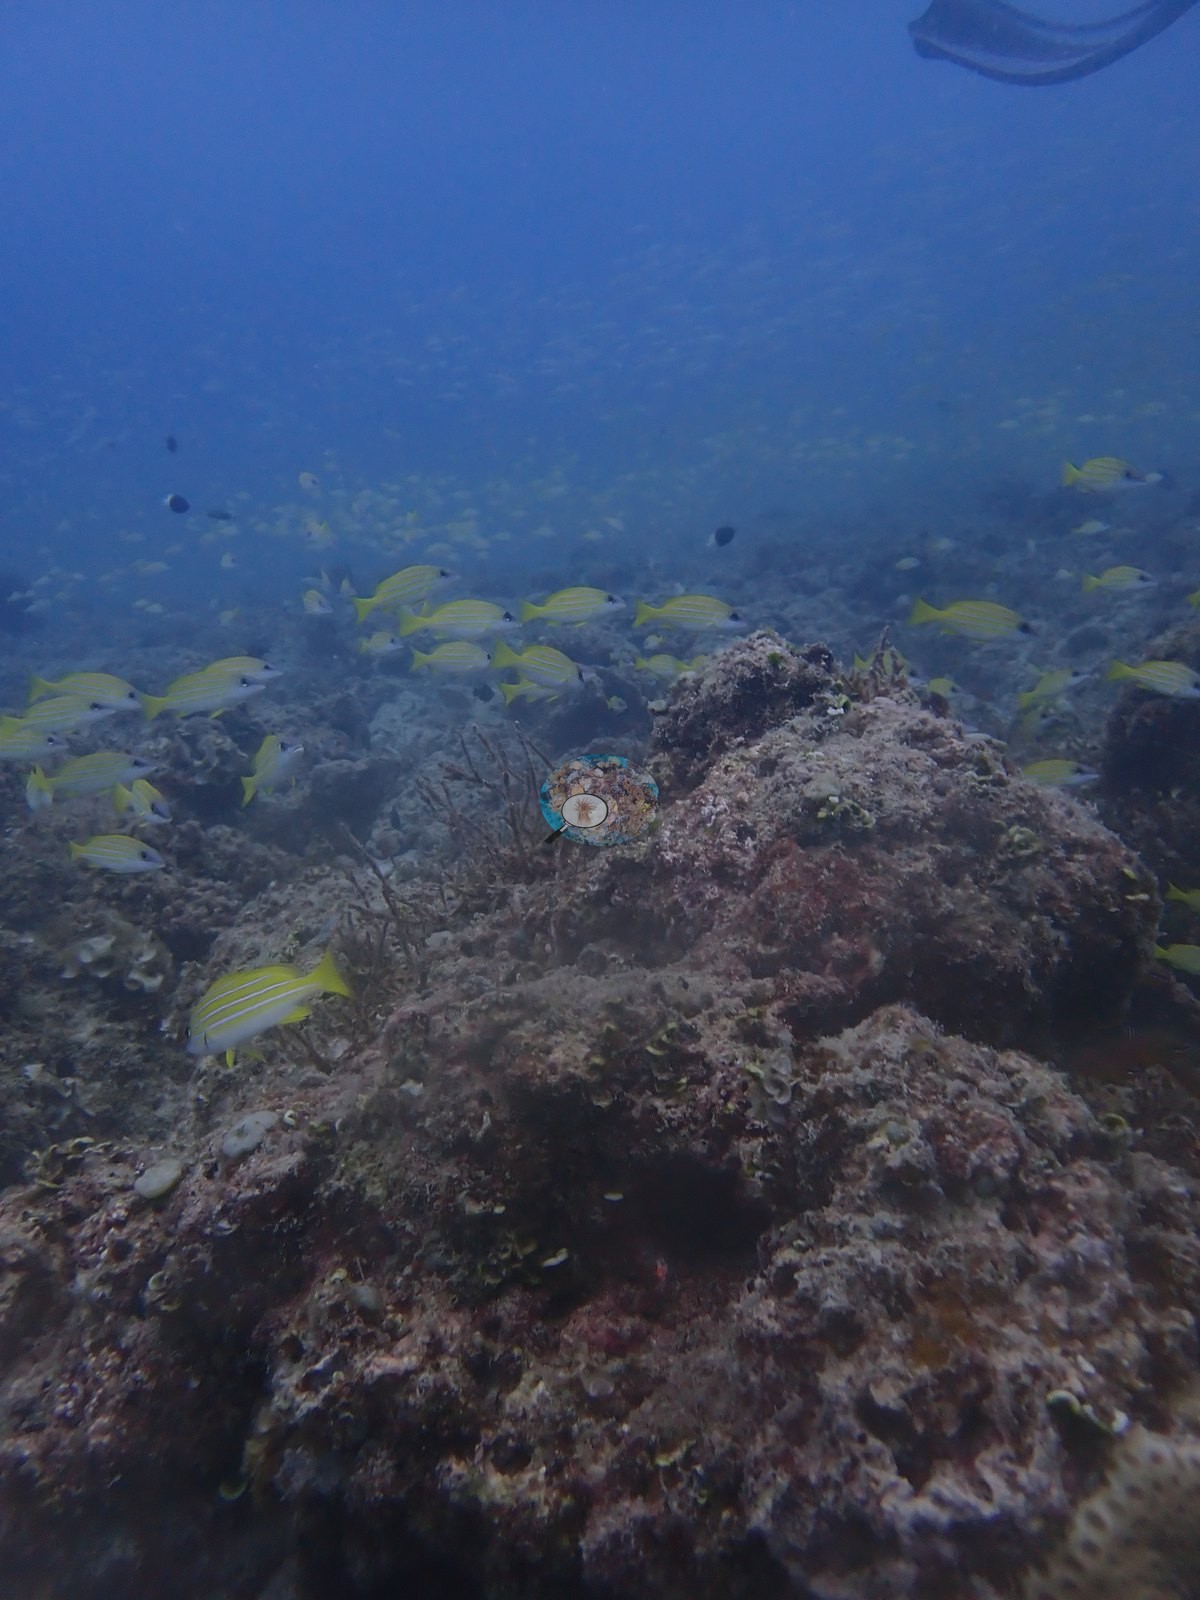
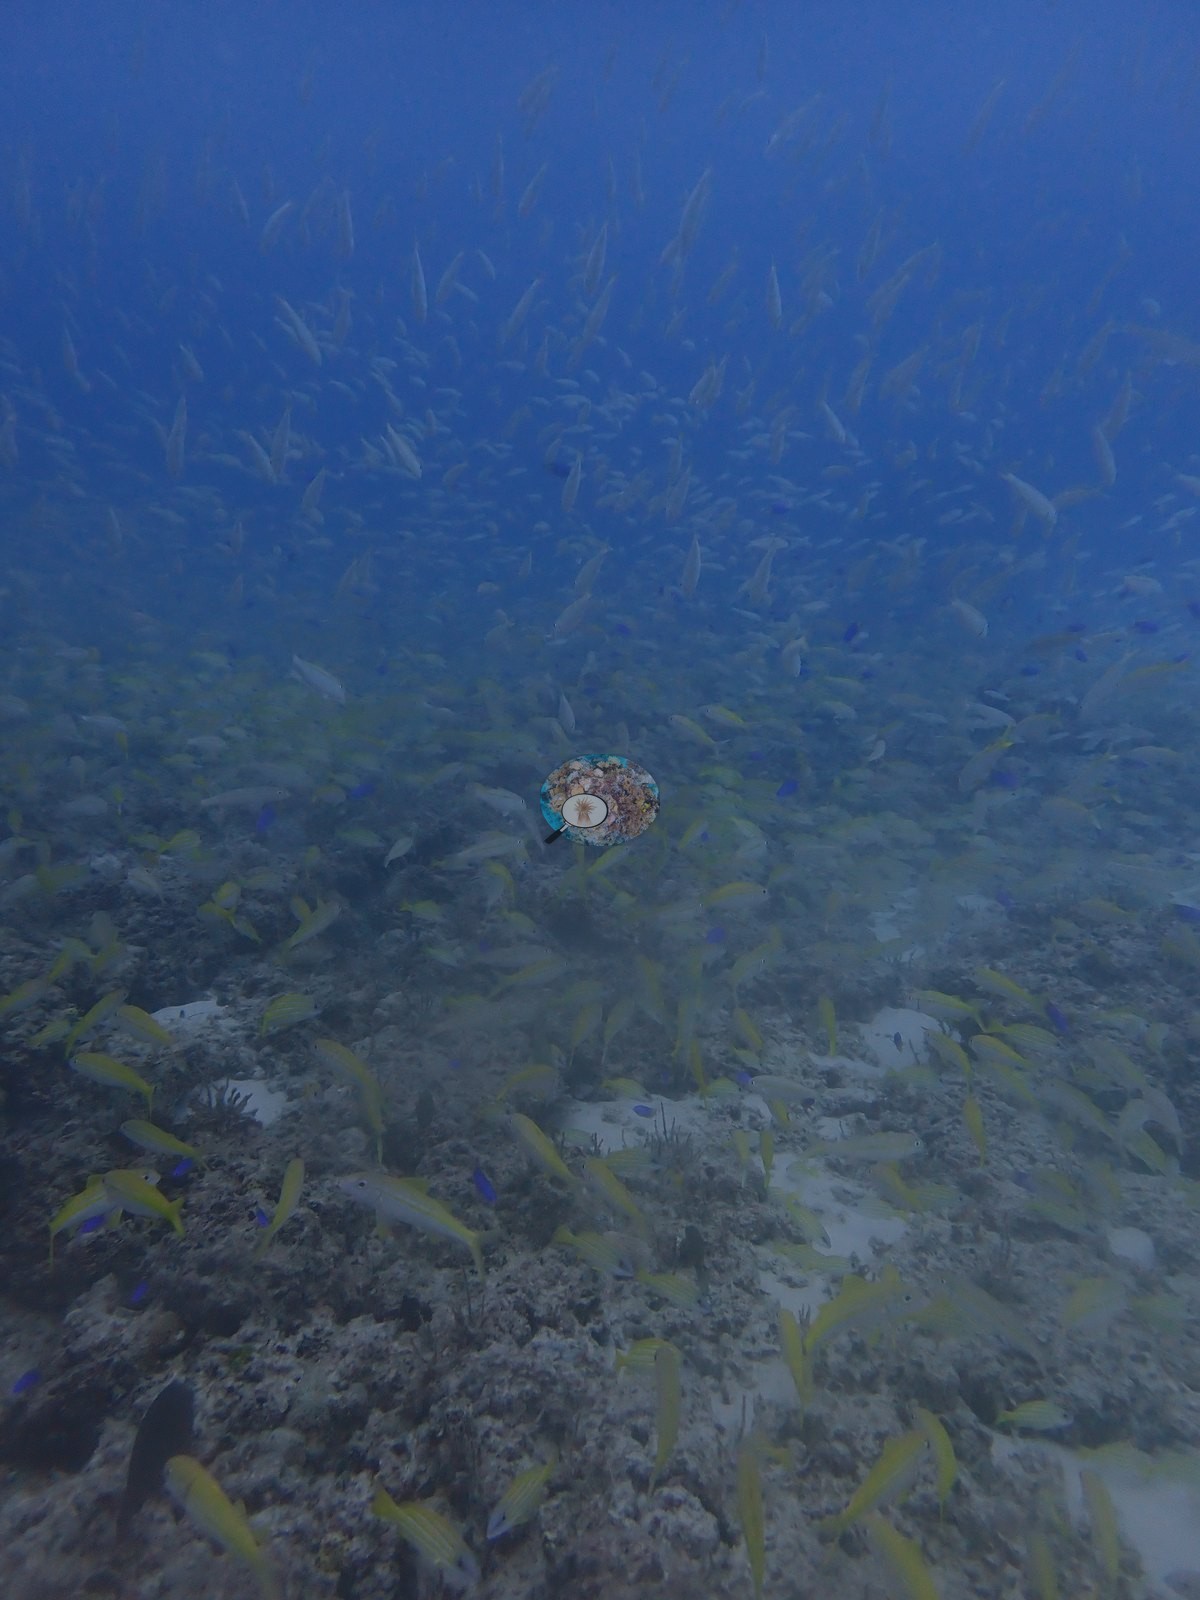
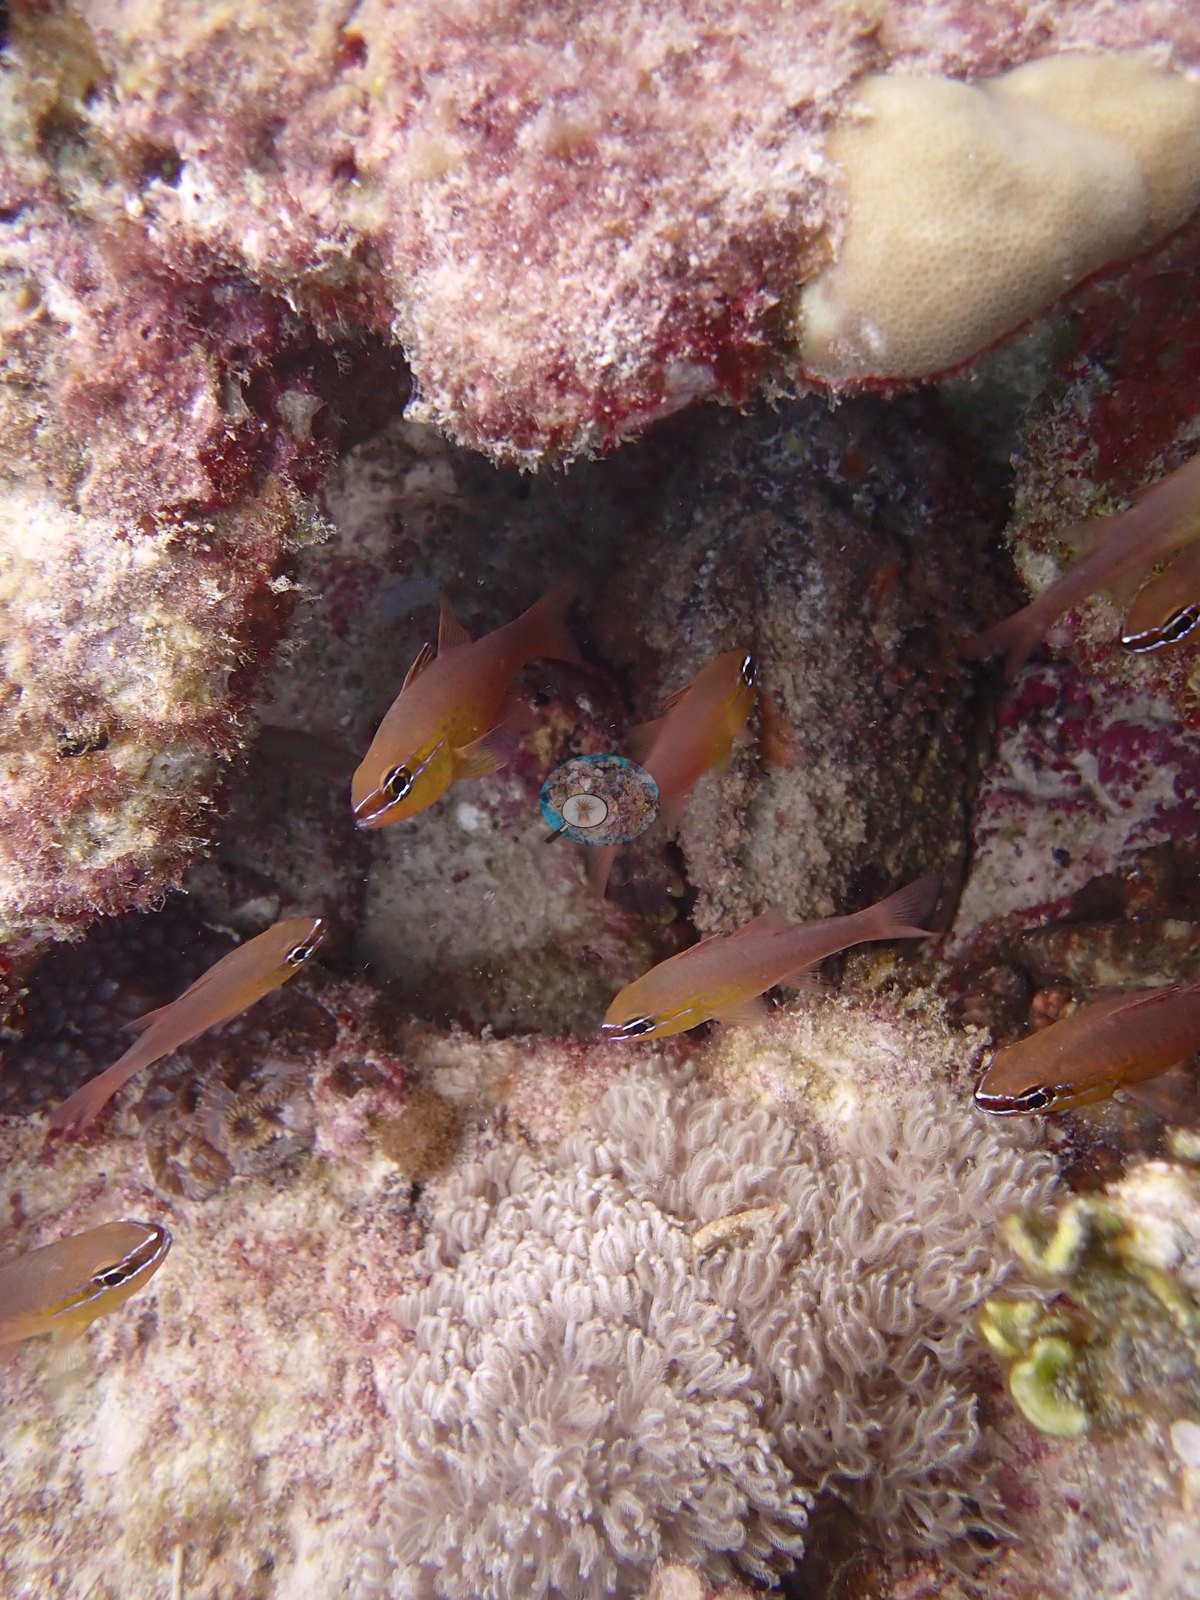
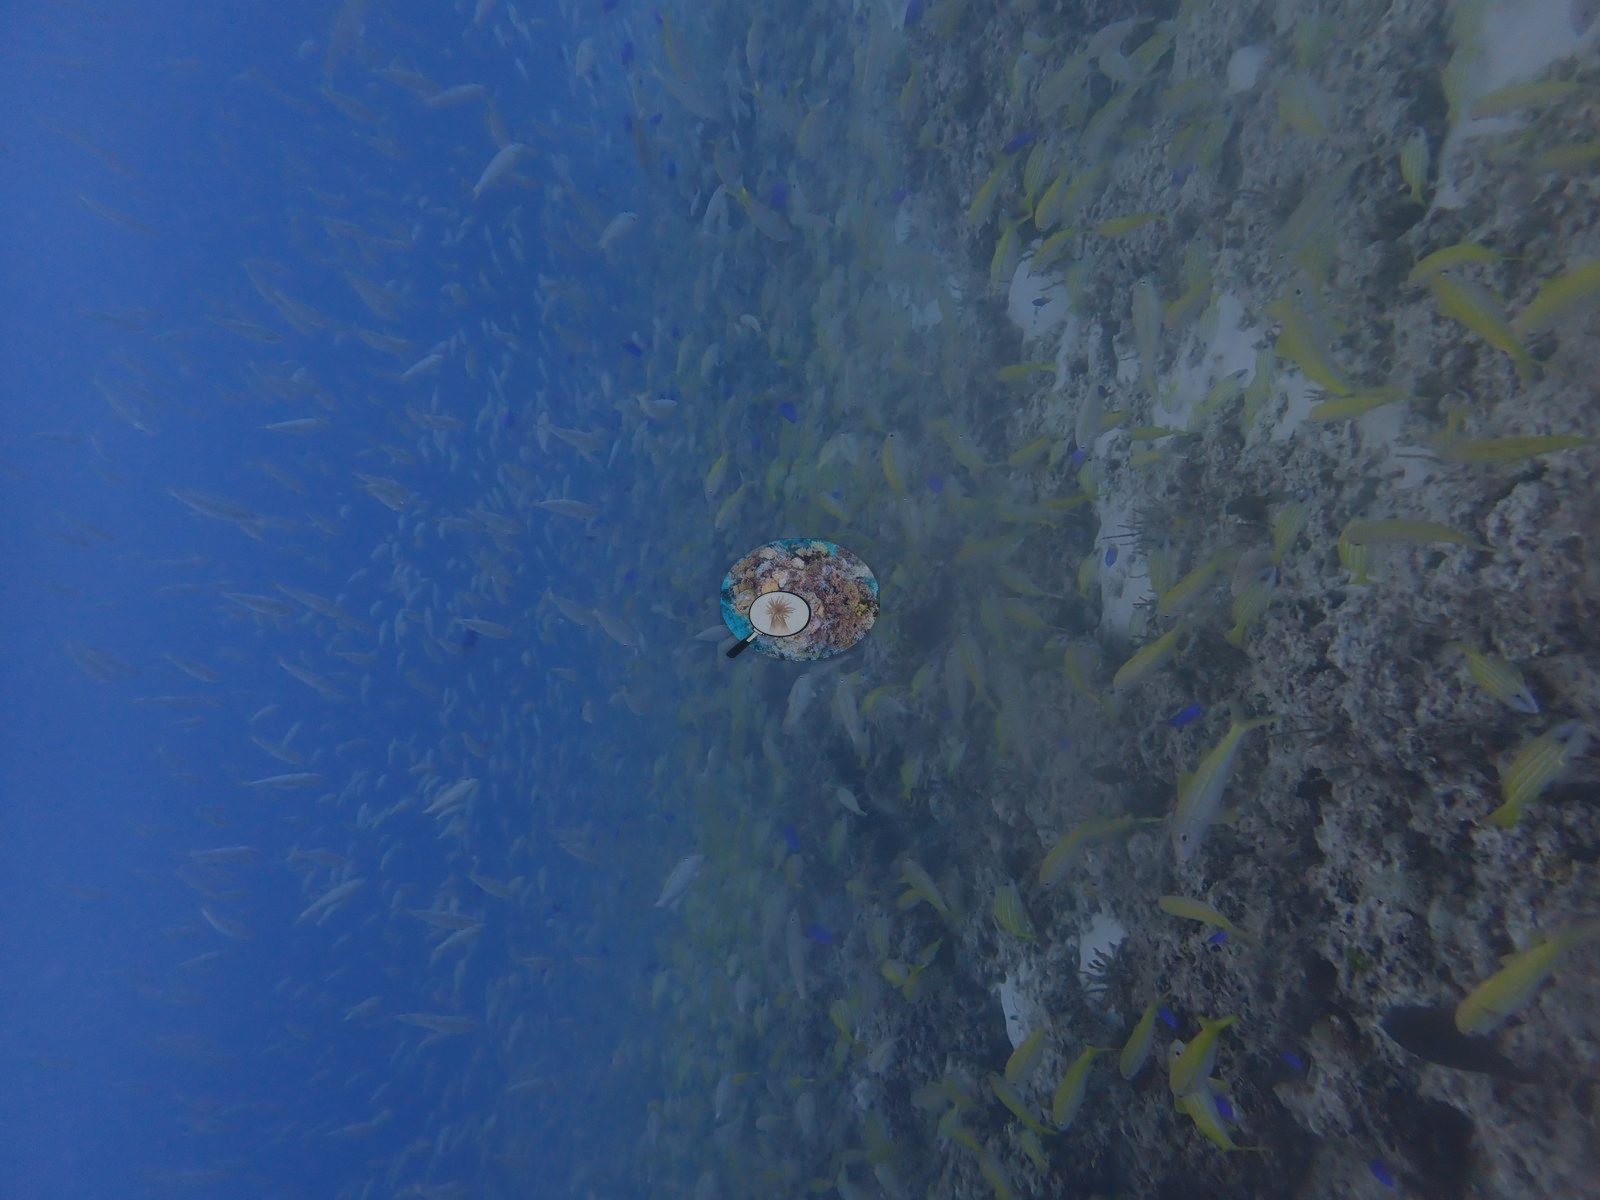
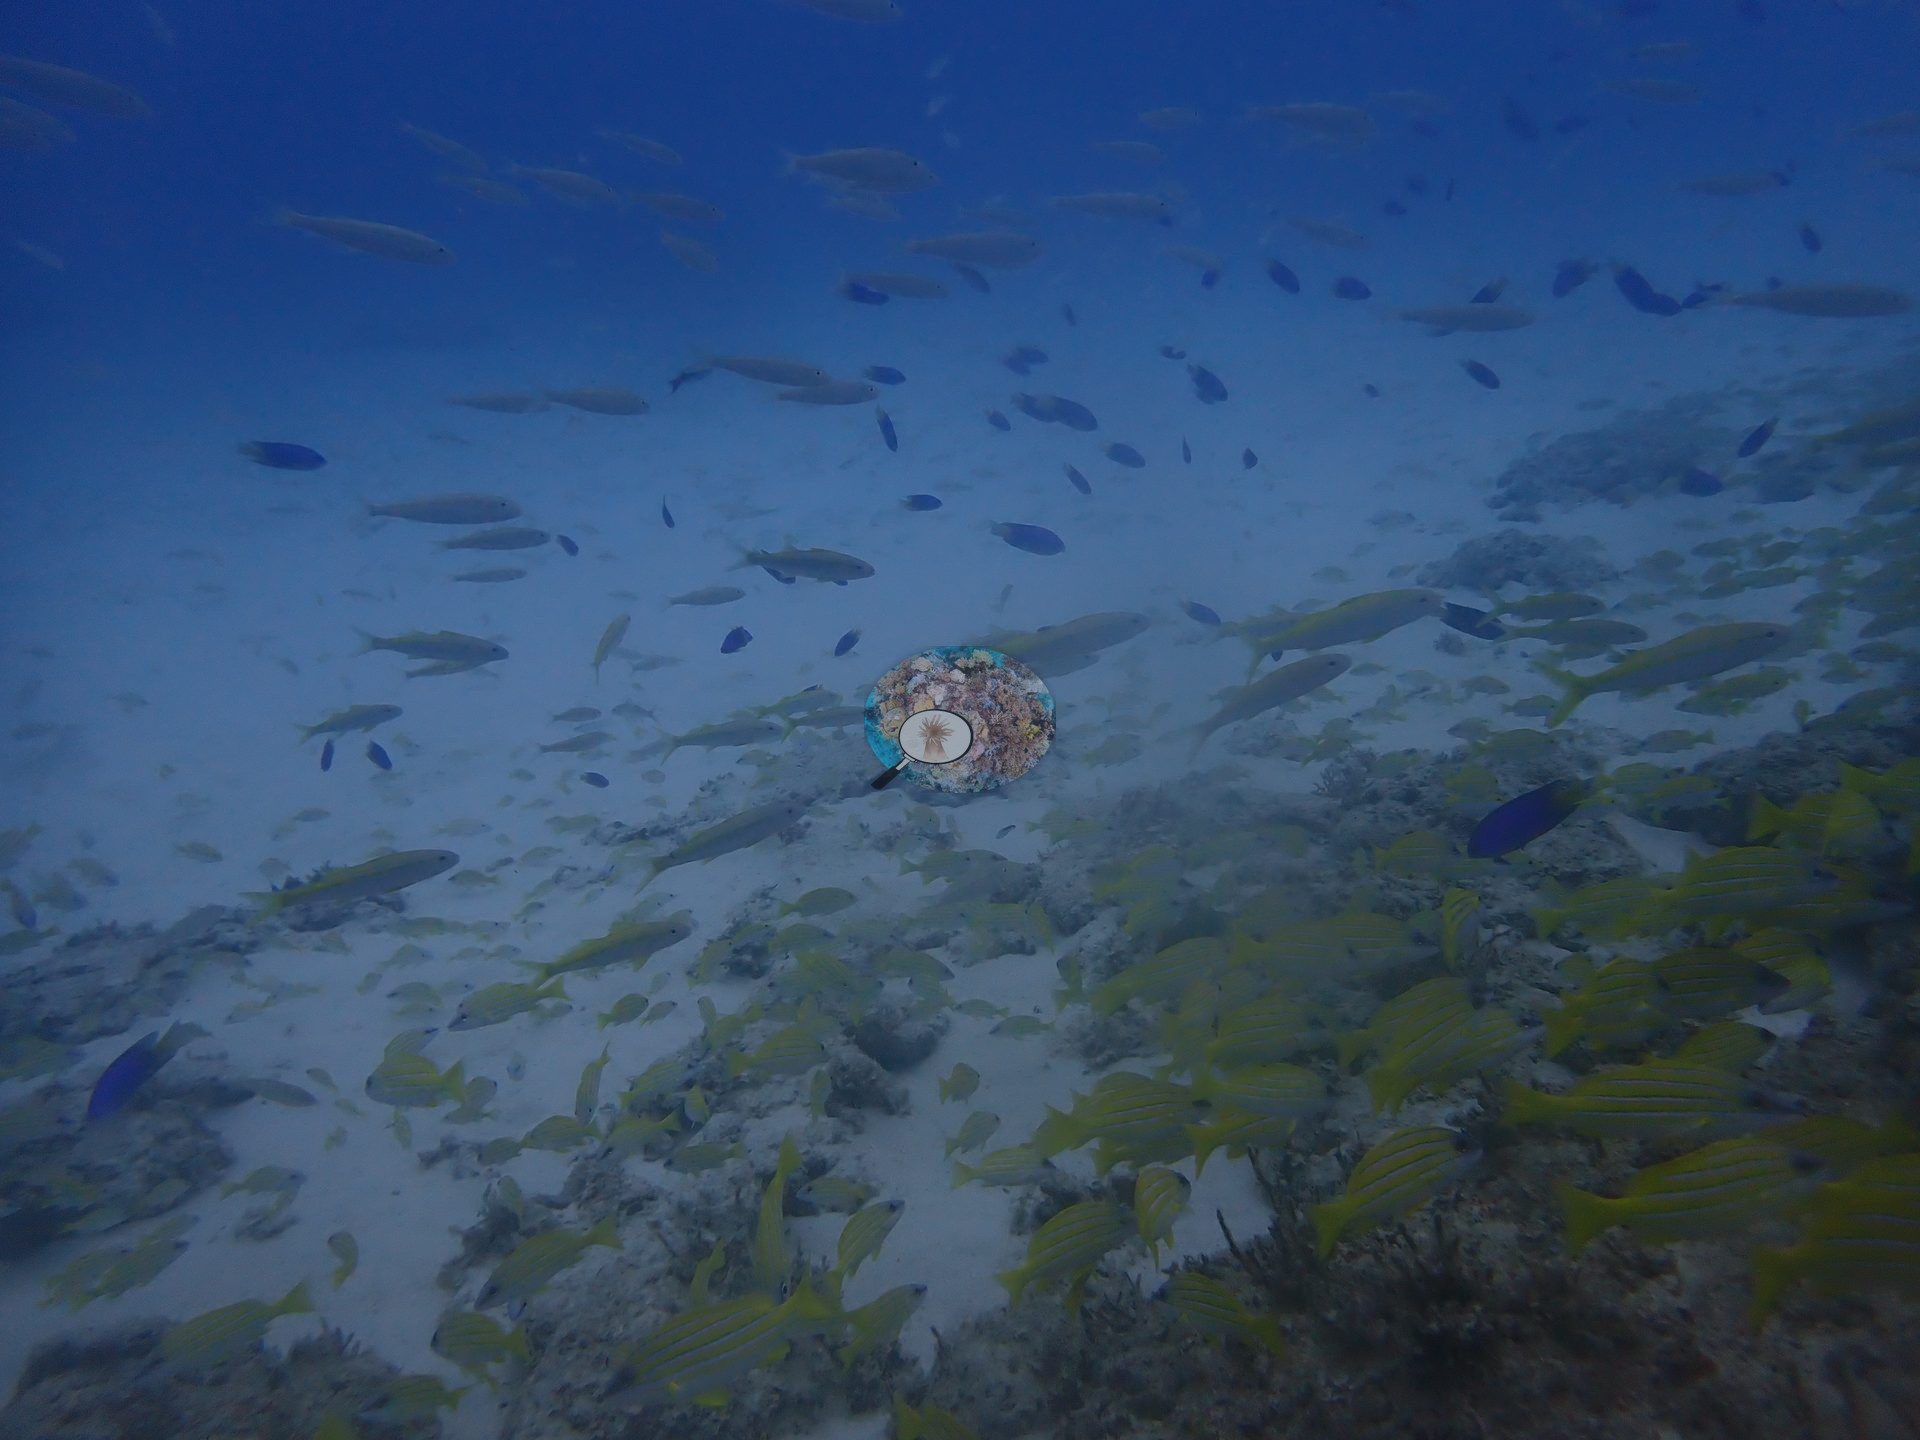
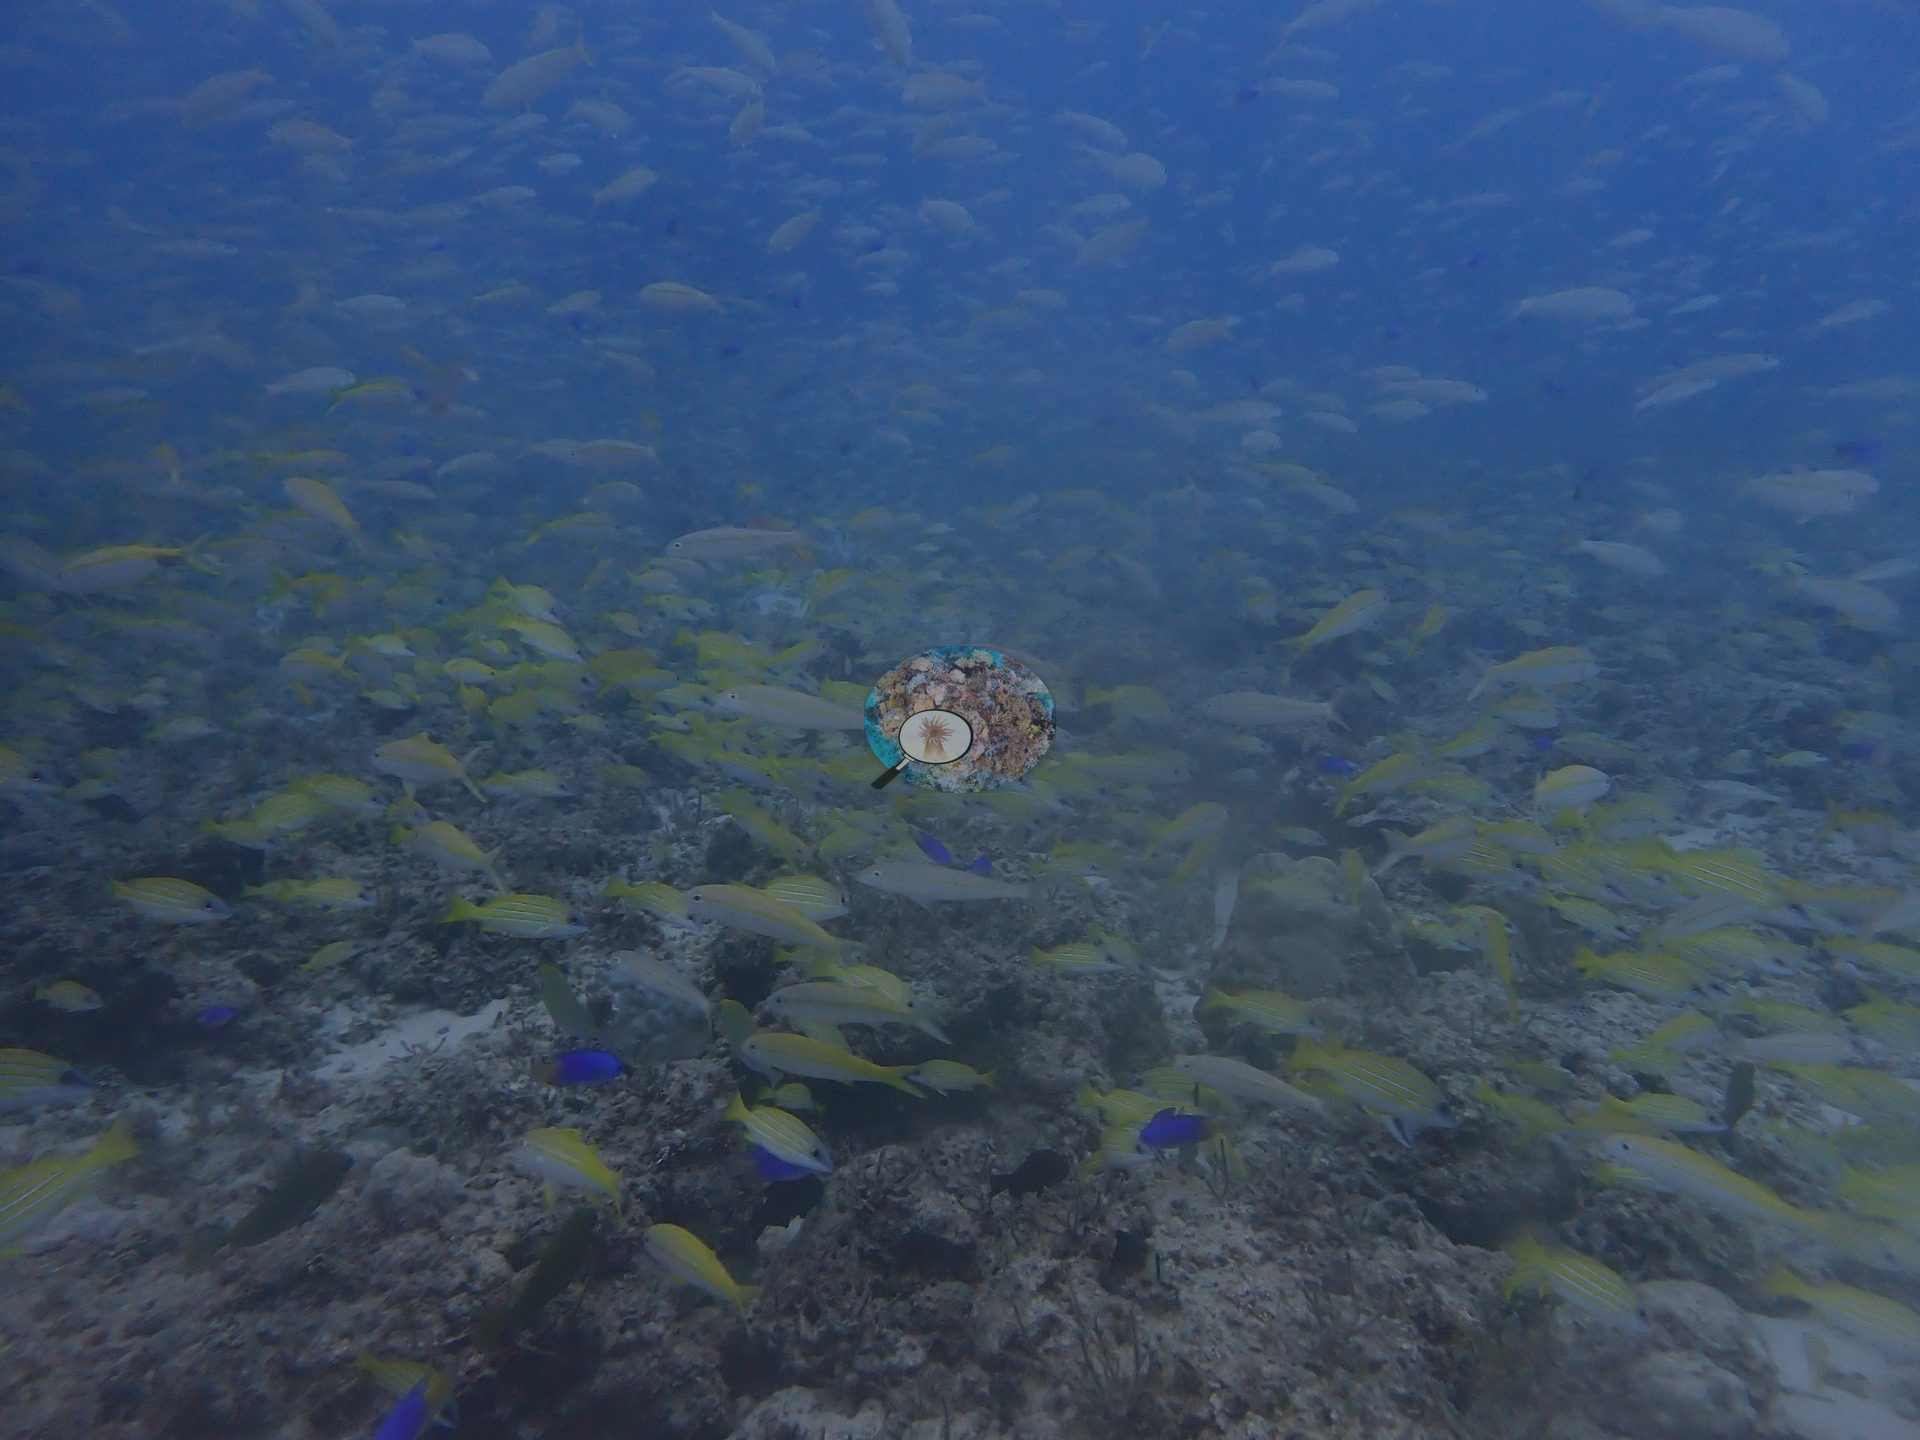
Dense schools of bluestripe snapper and silvery fusilier-type fish moved over the reef flat, accompanied by clouds of small blue damselfish (e.g., Image 1, Image 4, Image 16, Image 17, Image 19).
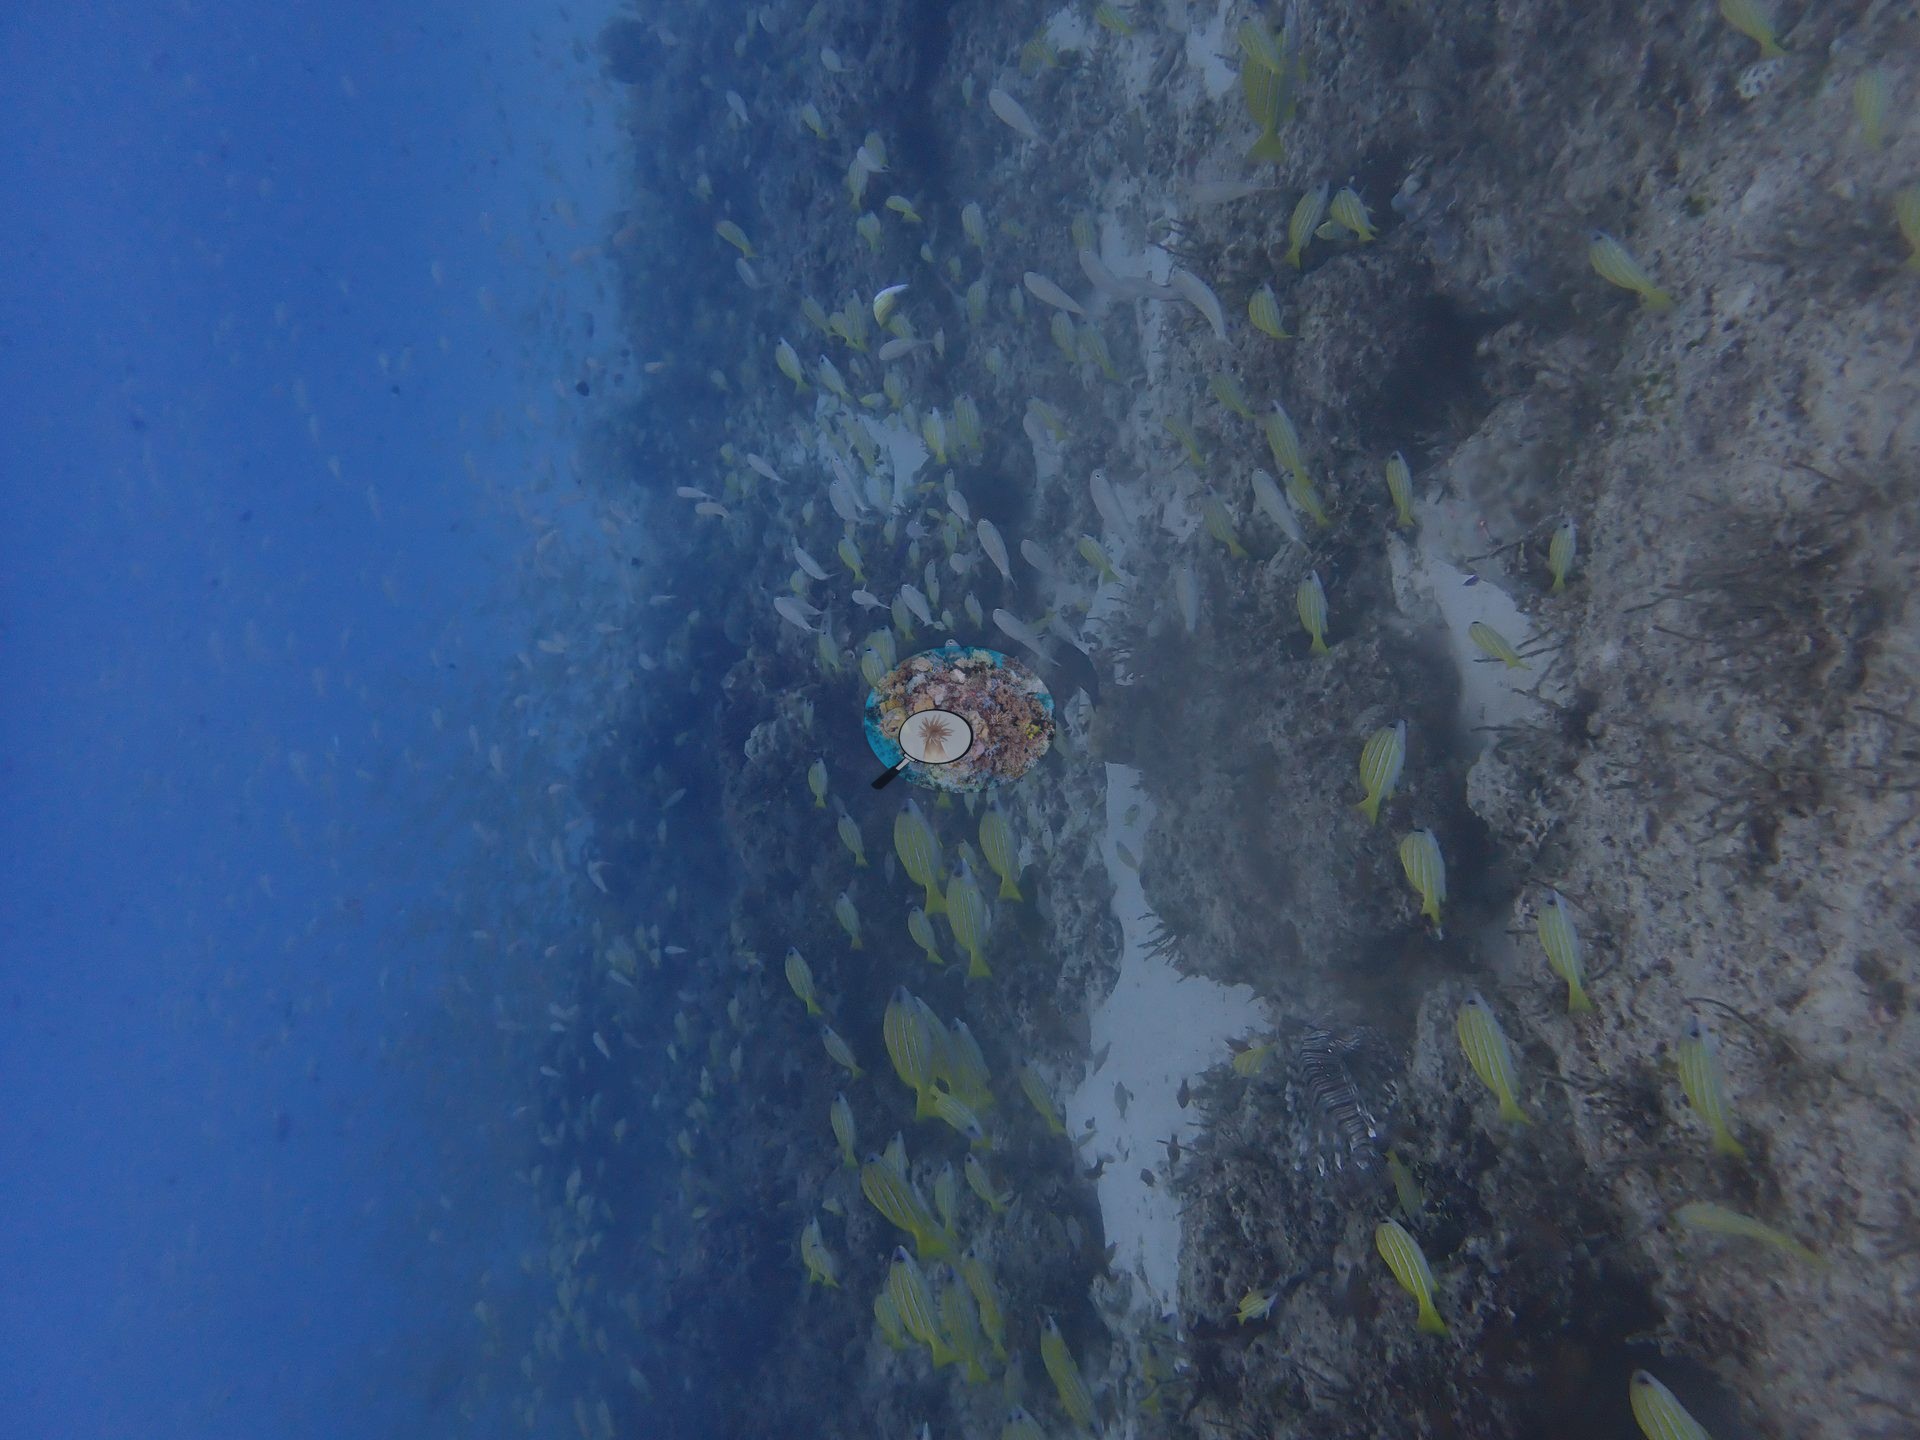
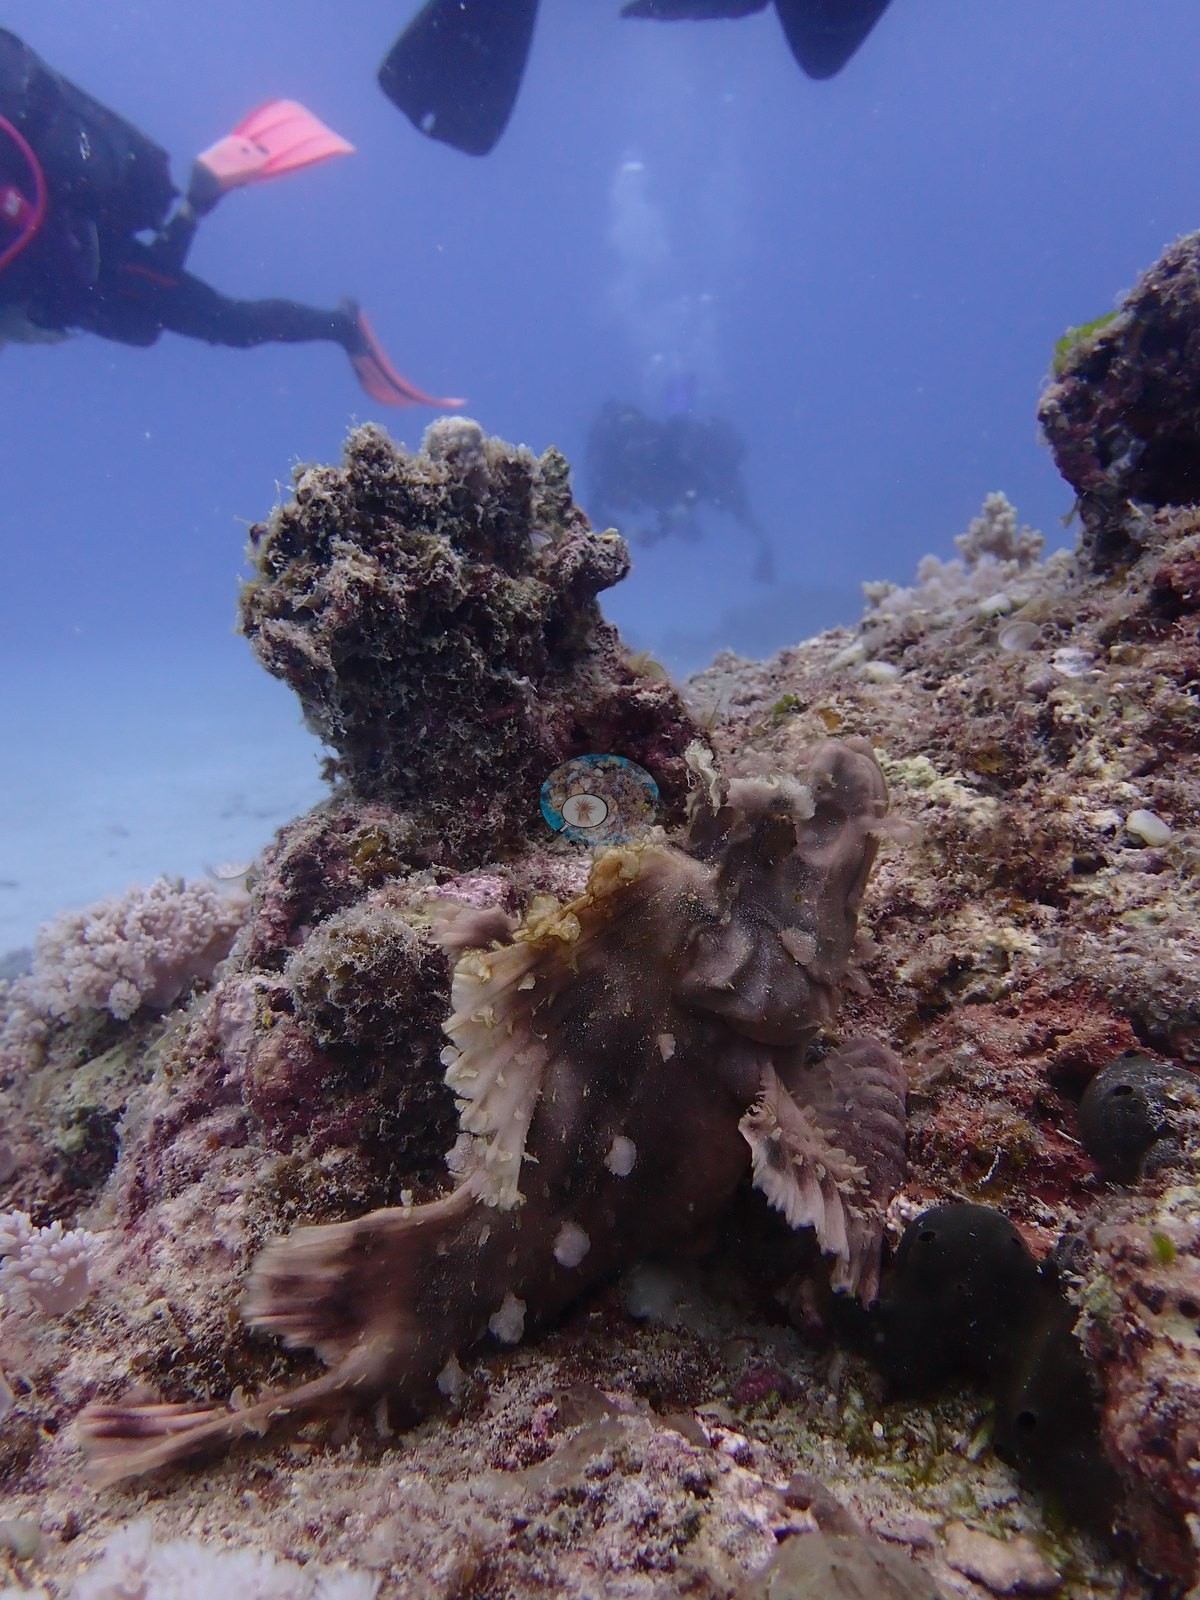
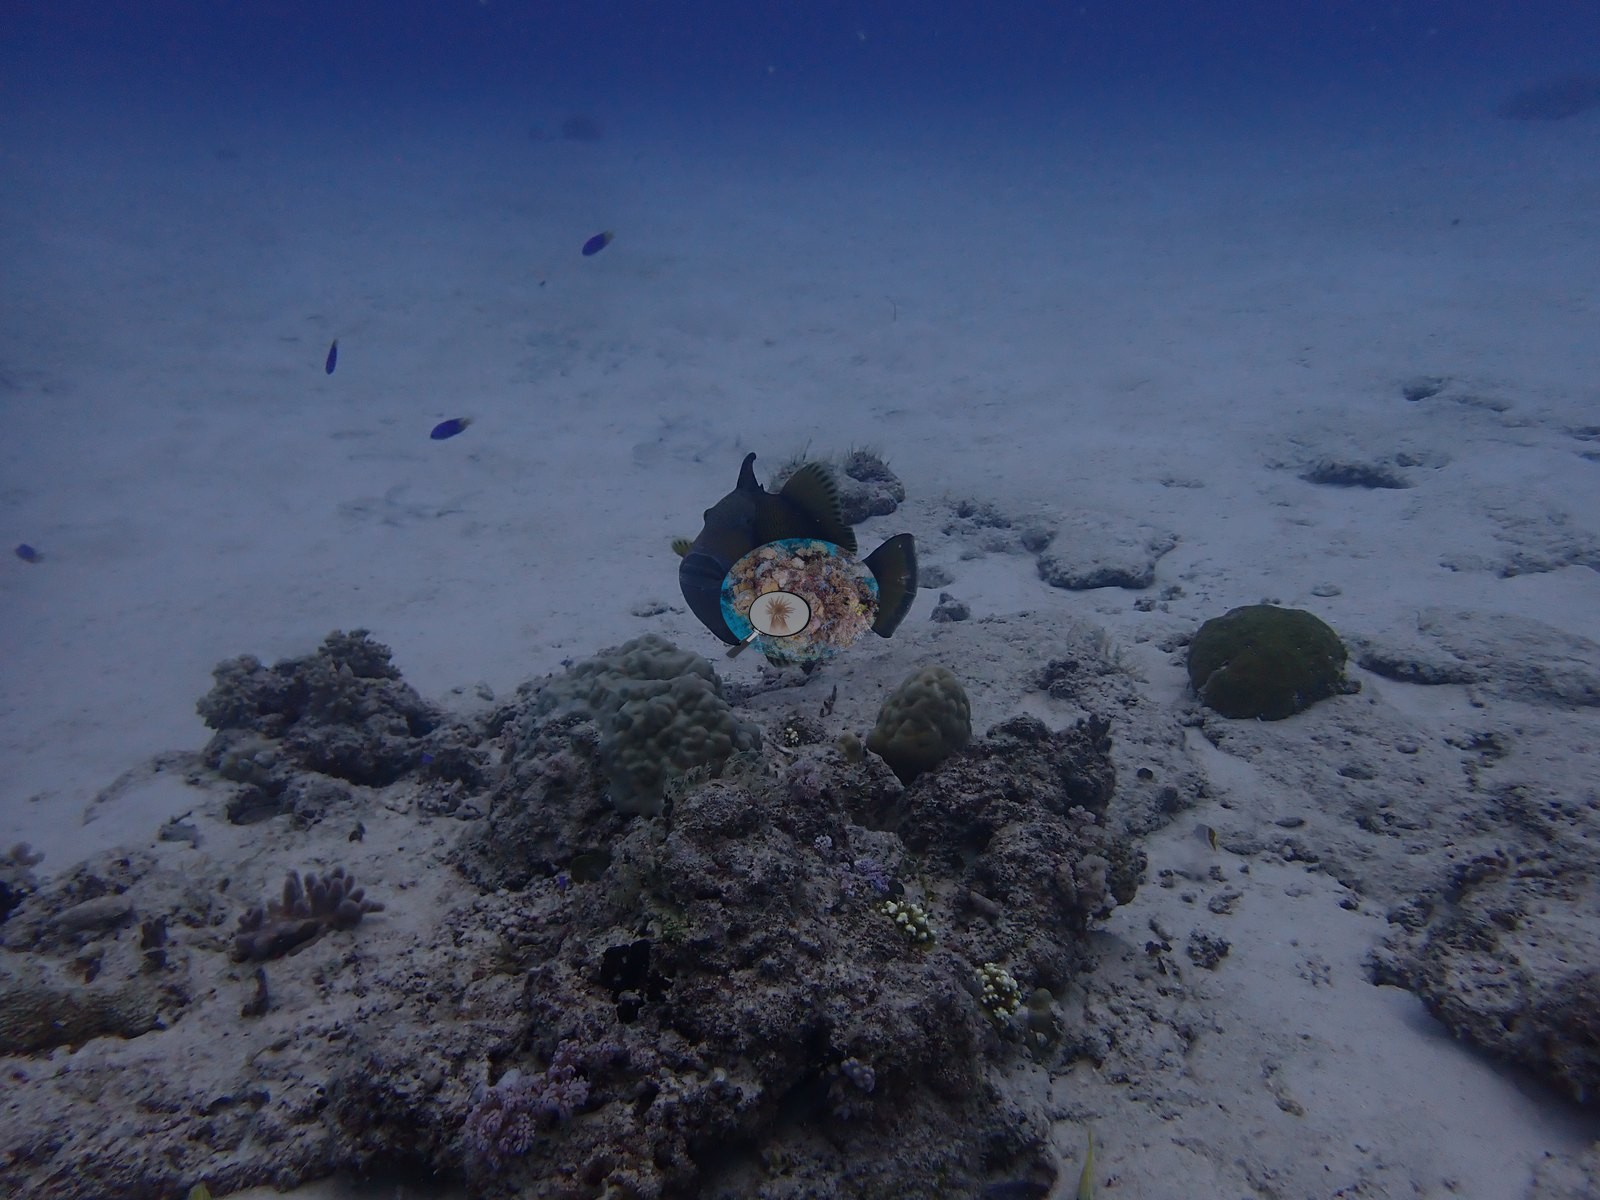
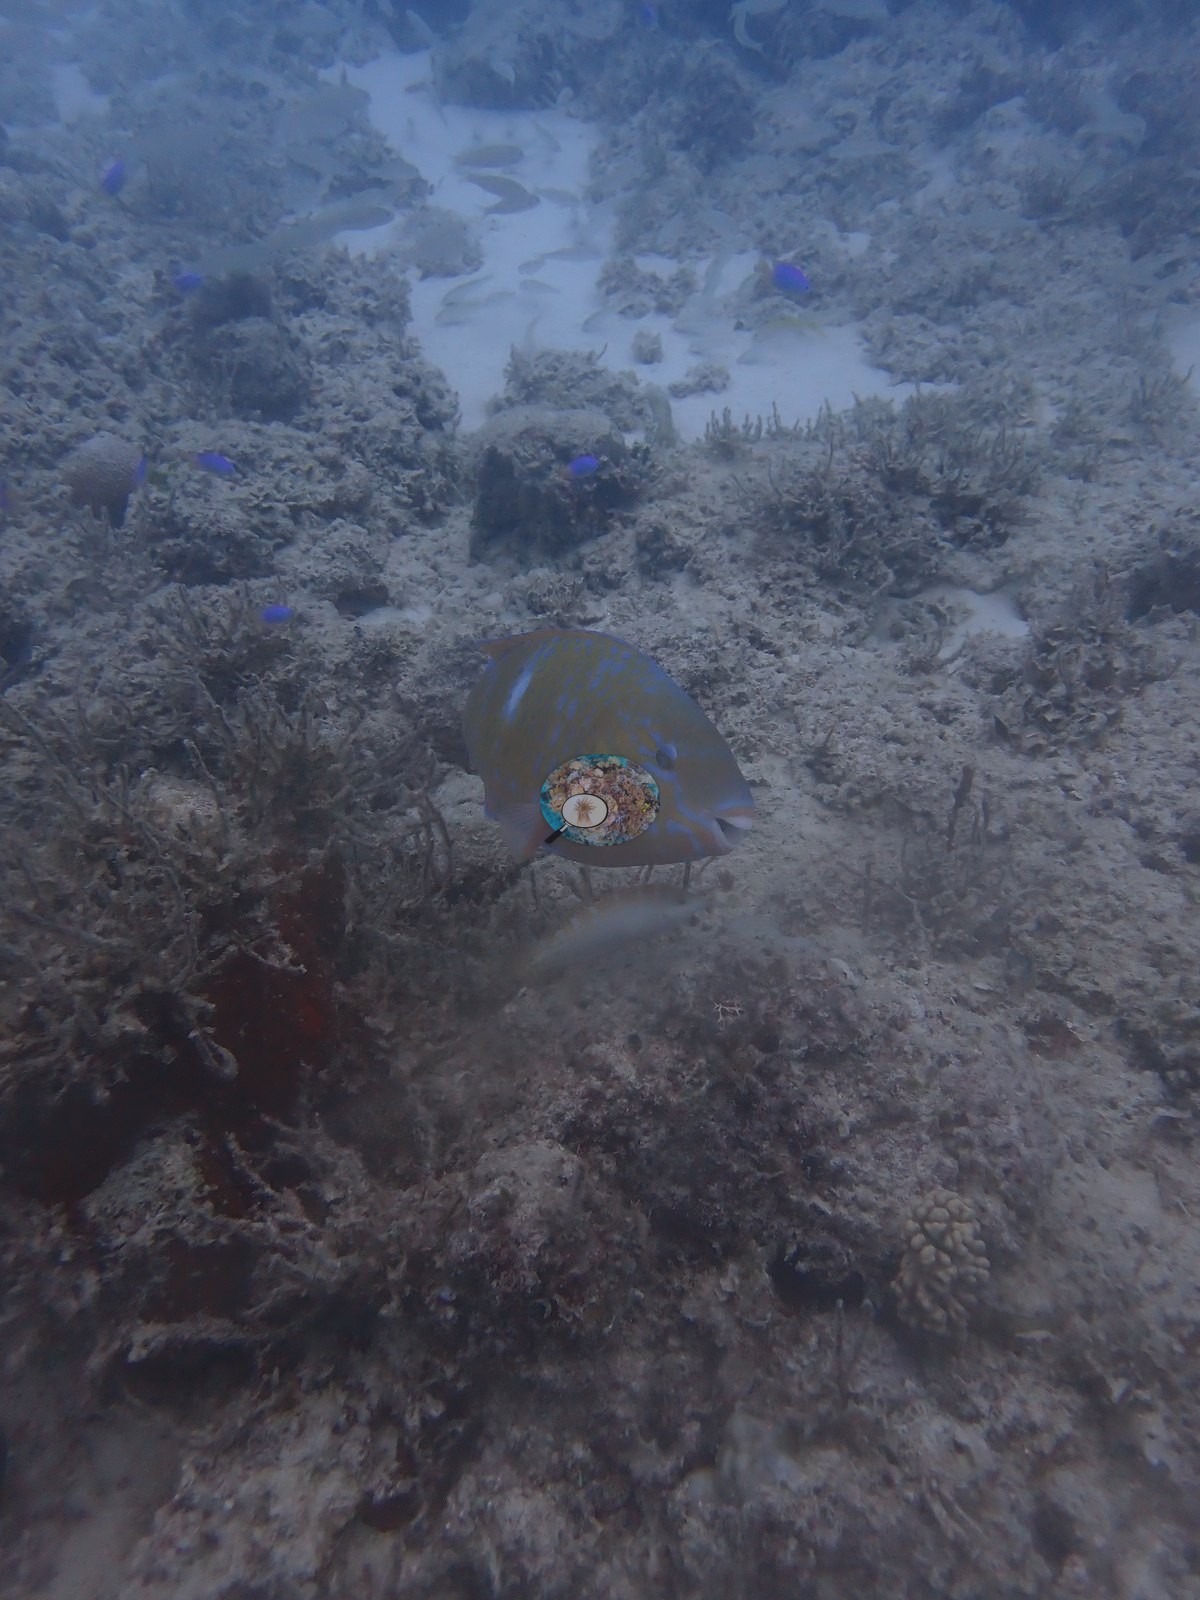
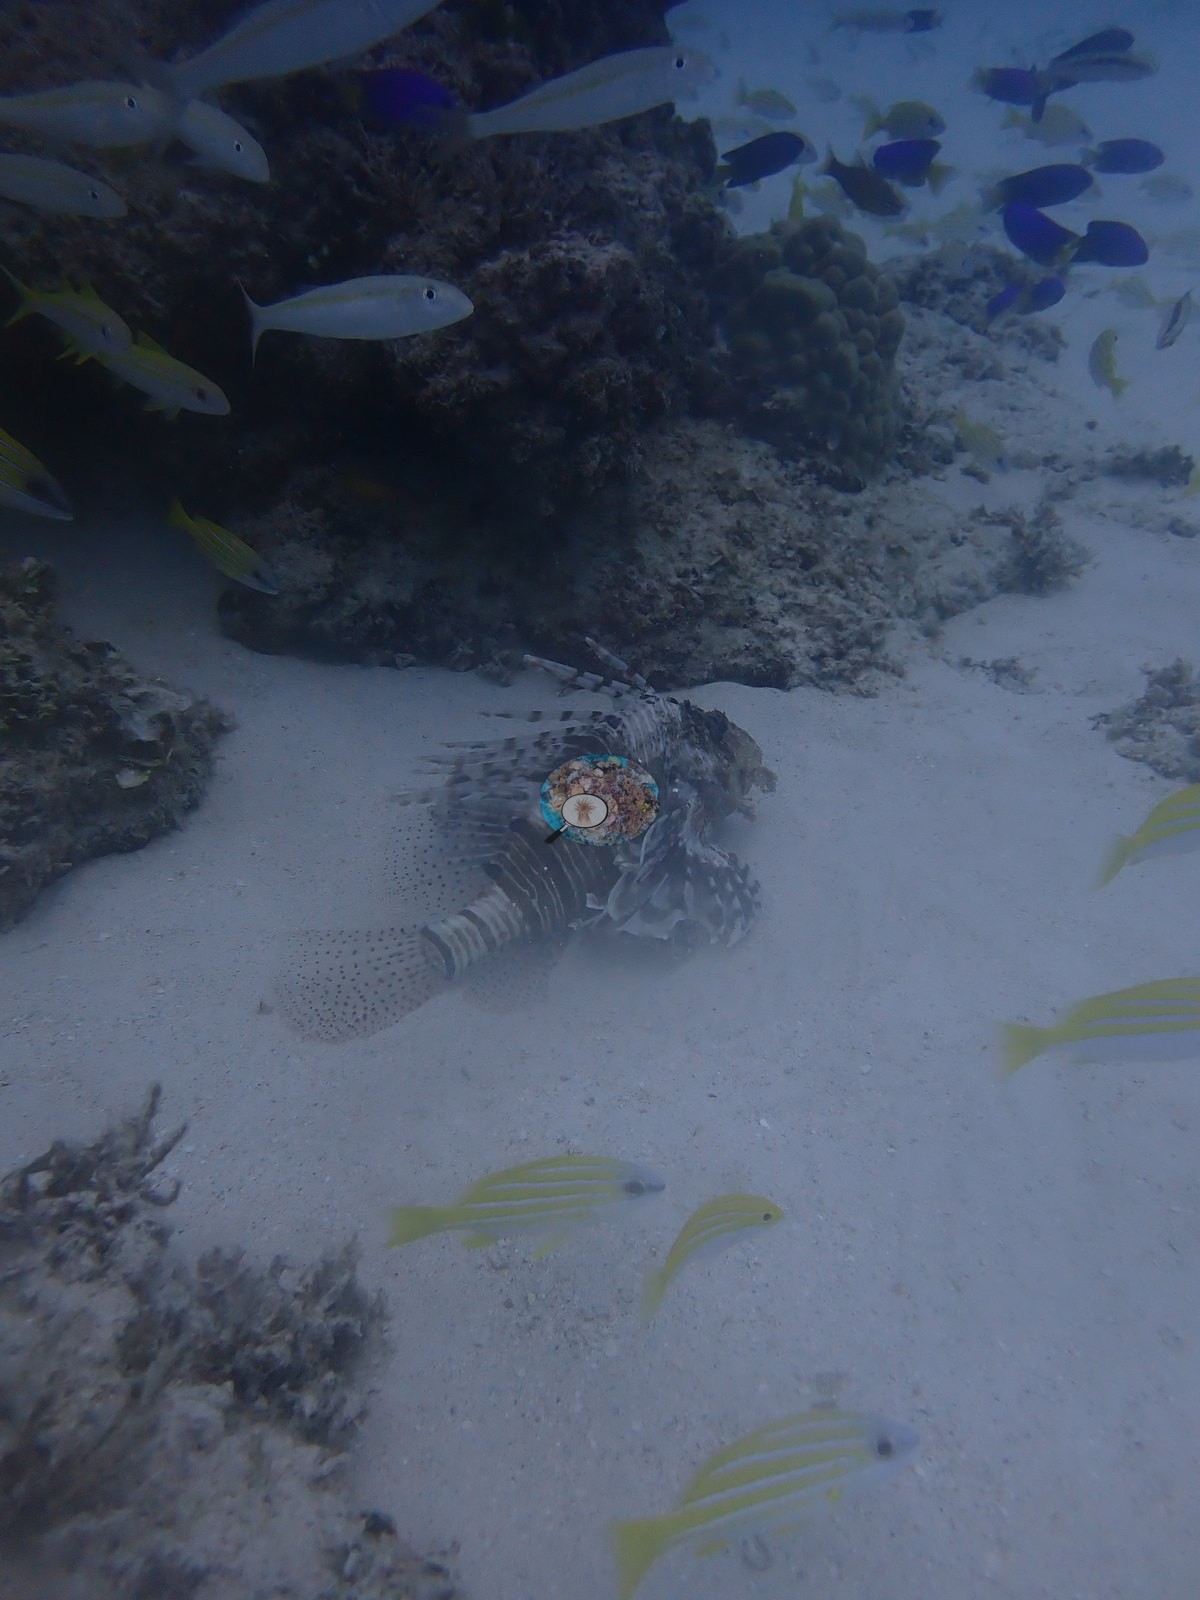
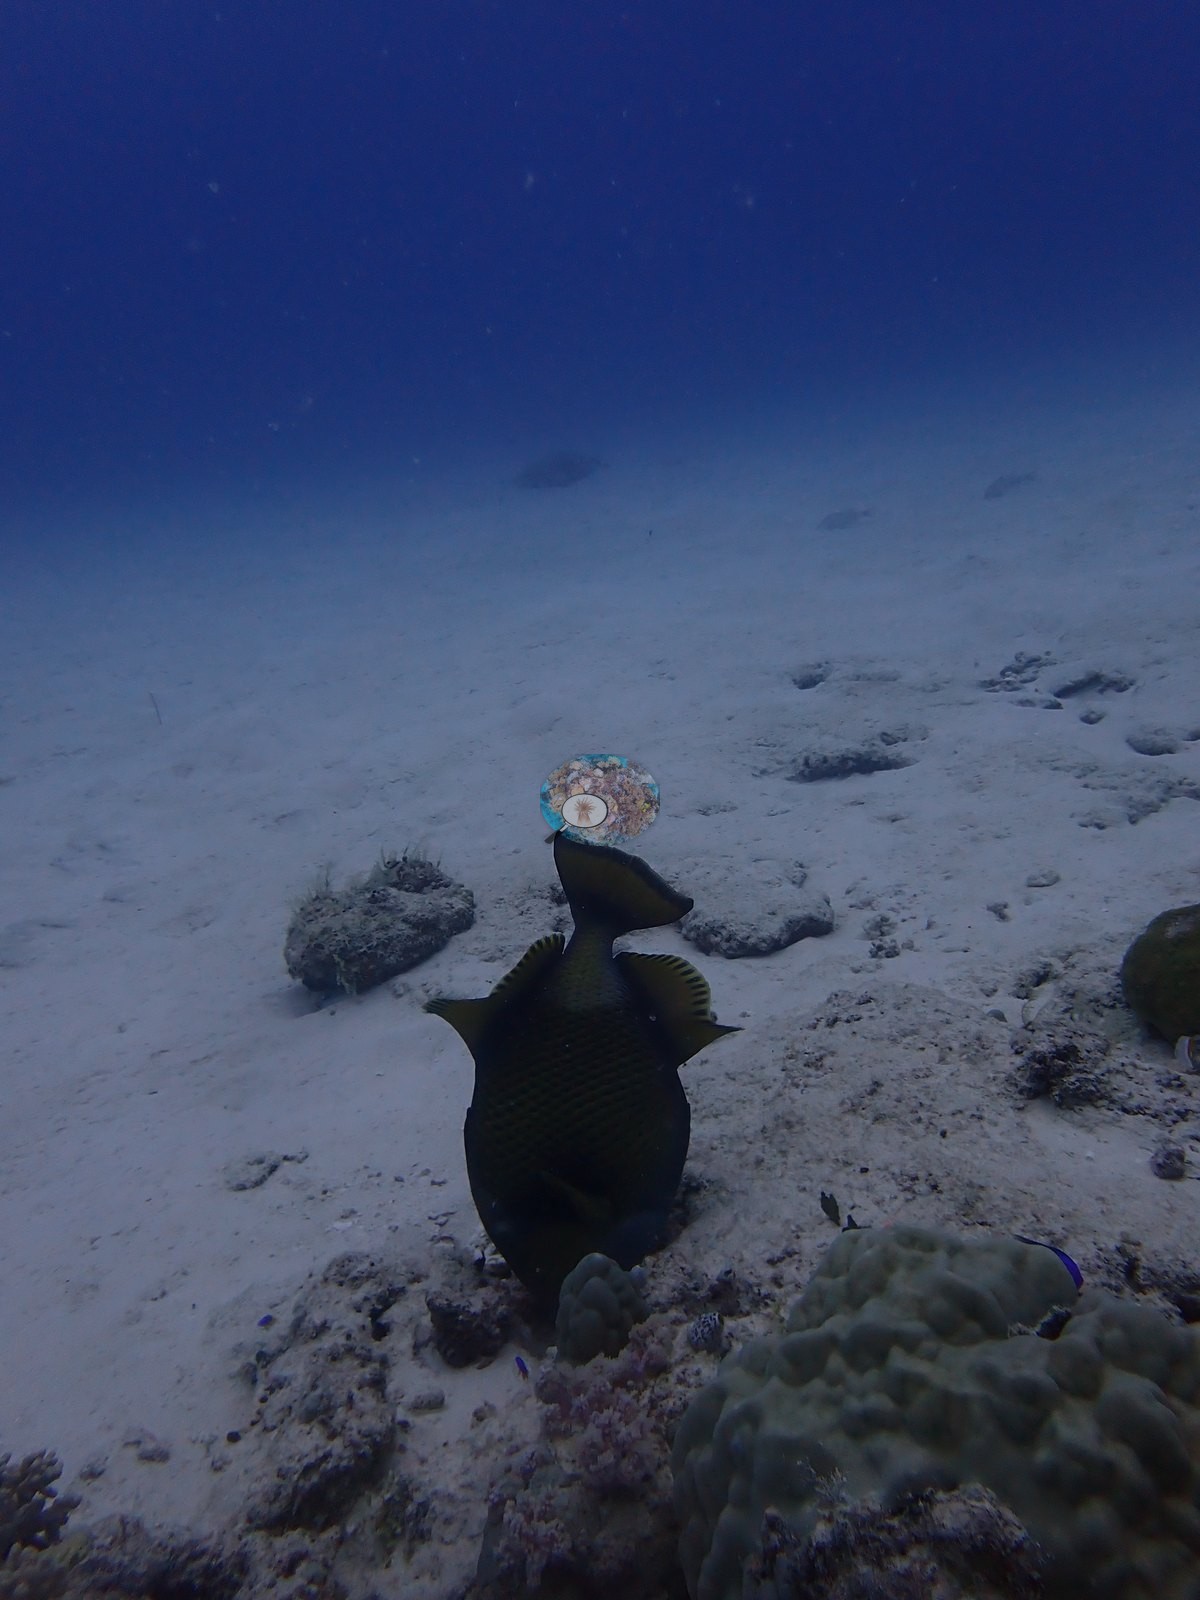
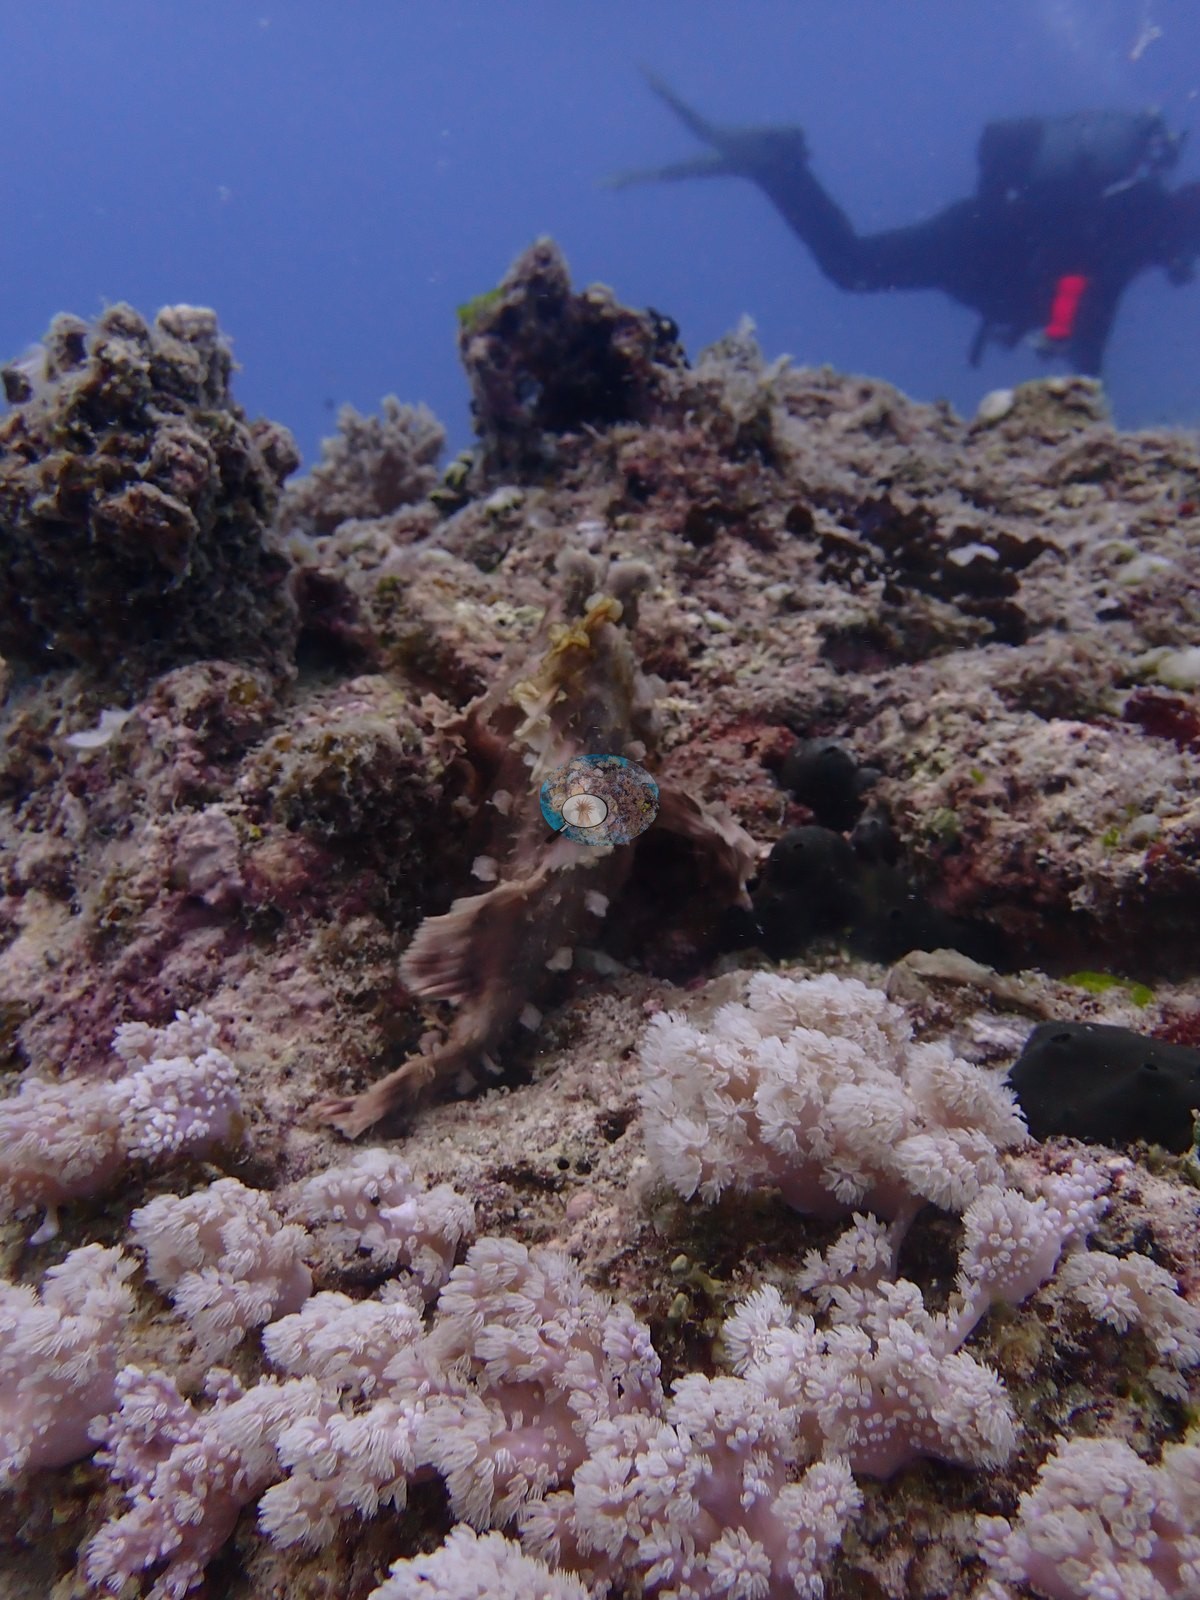
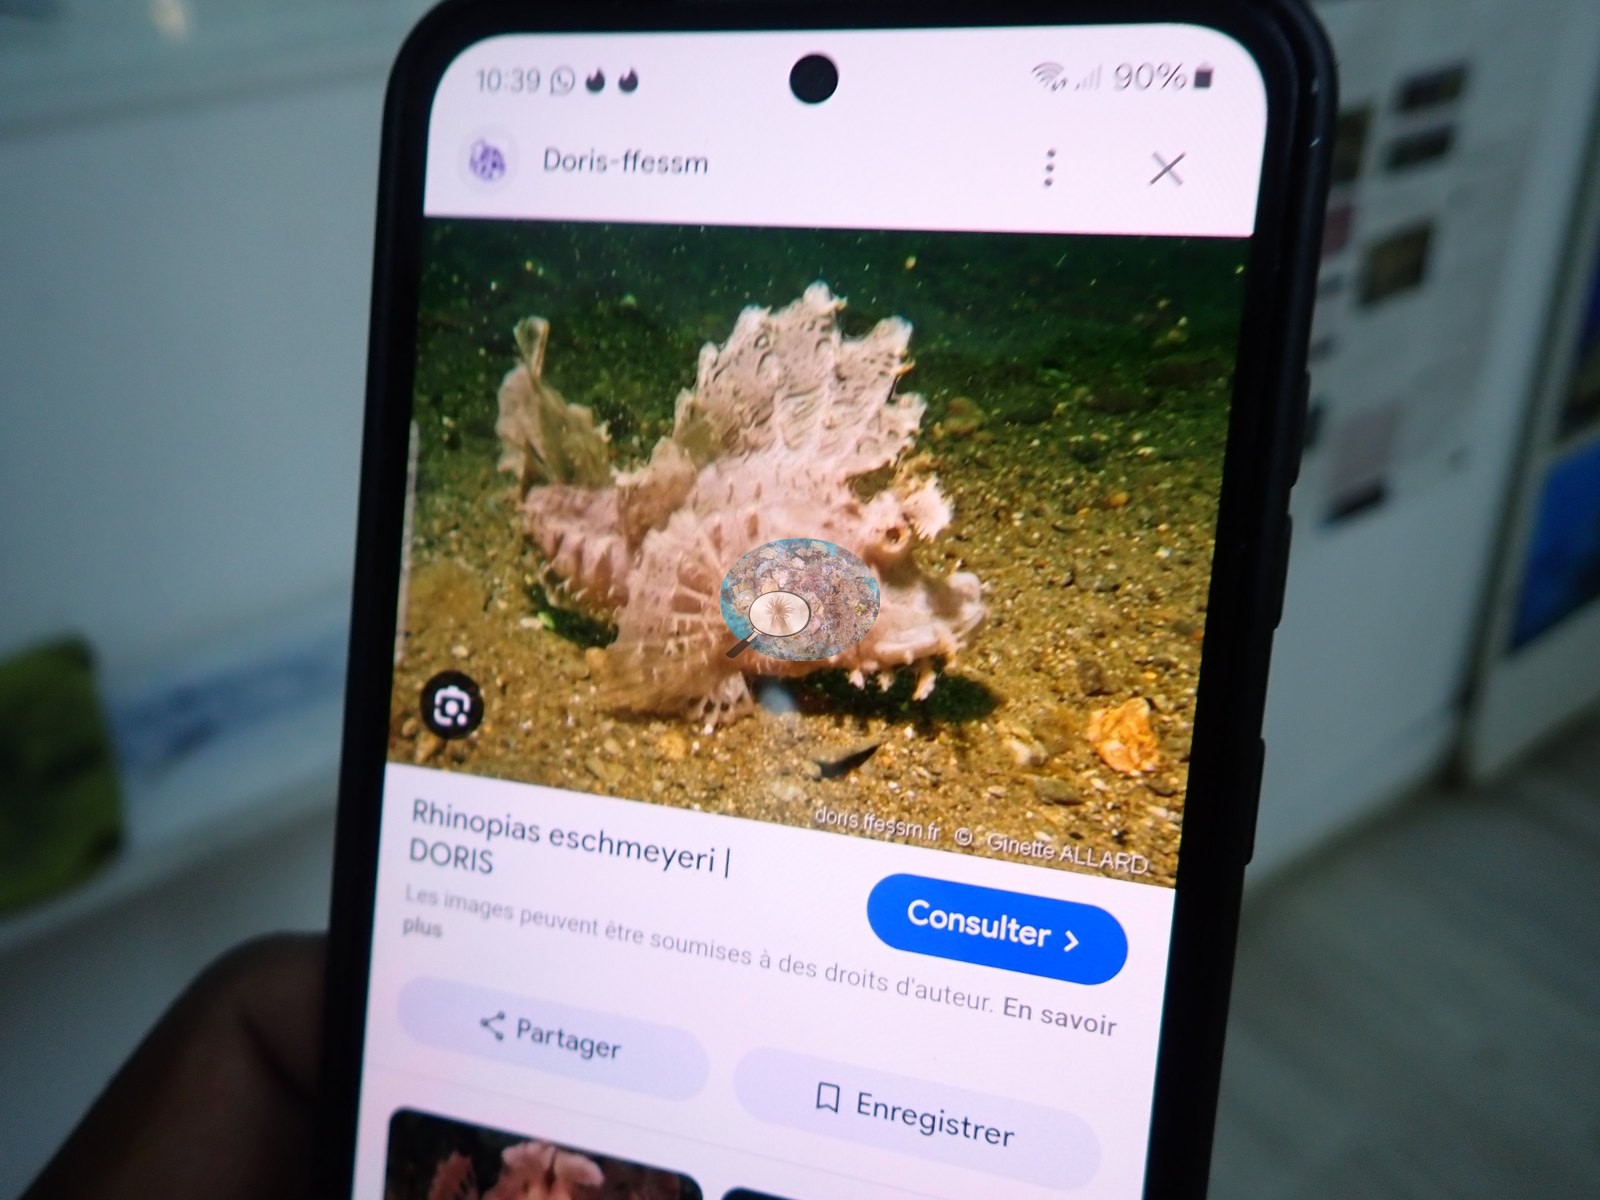
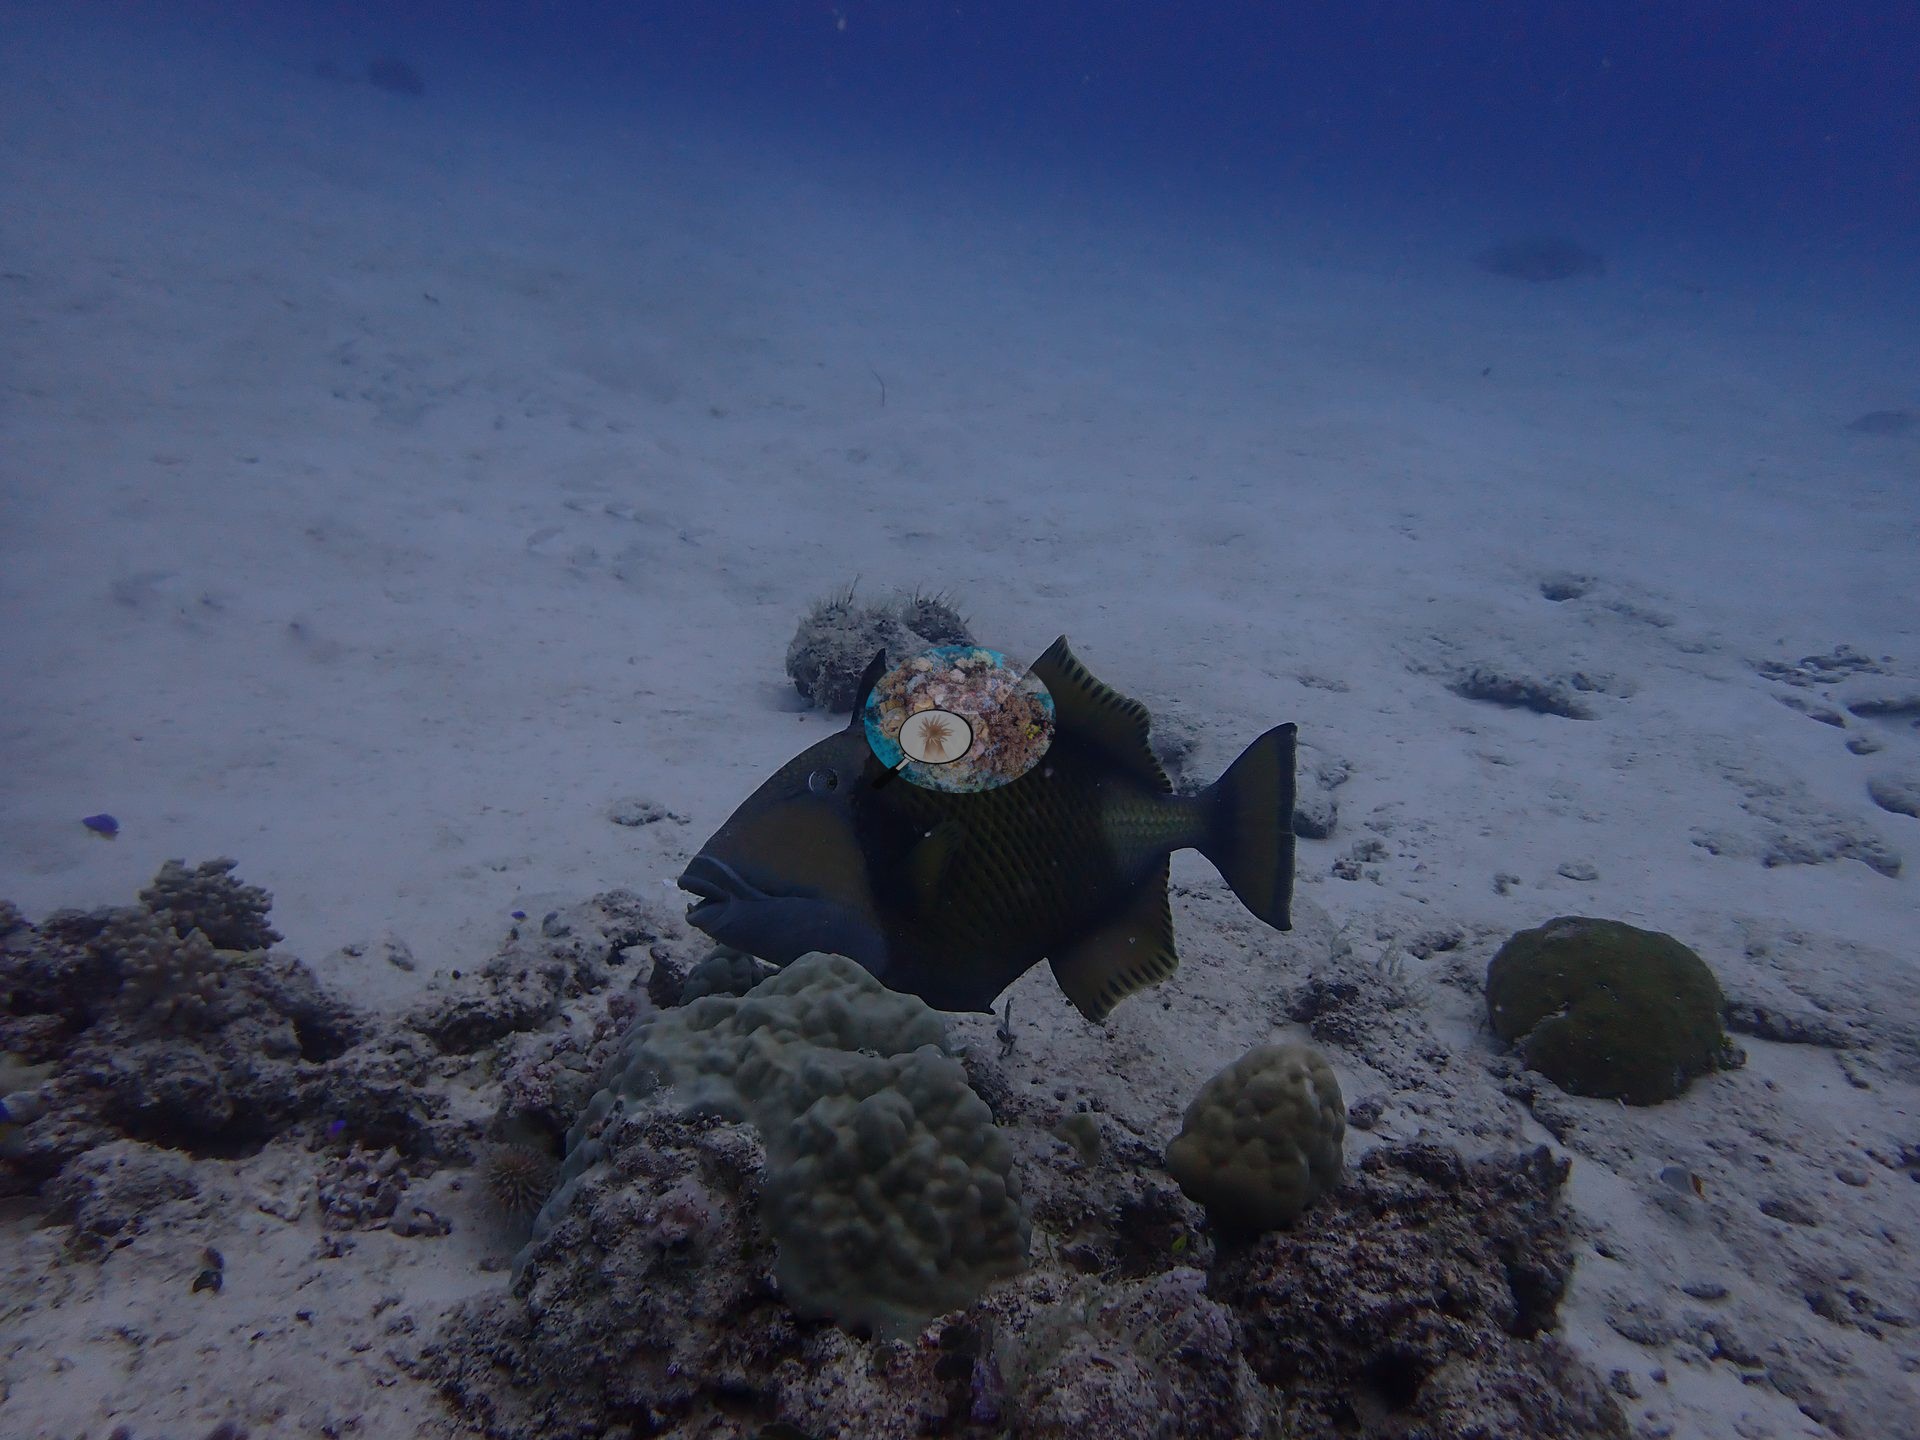
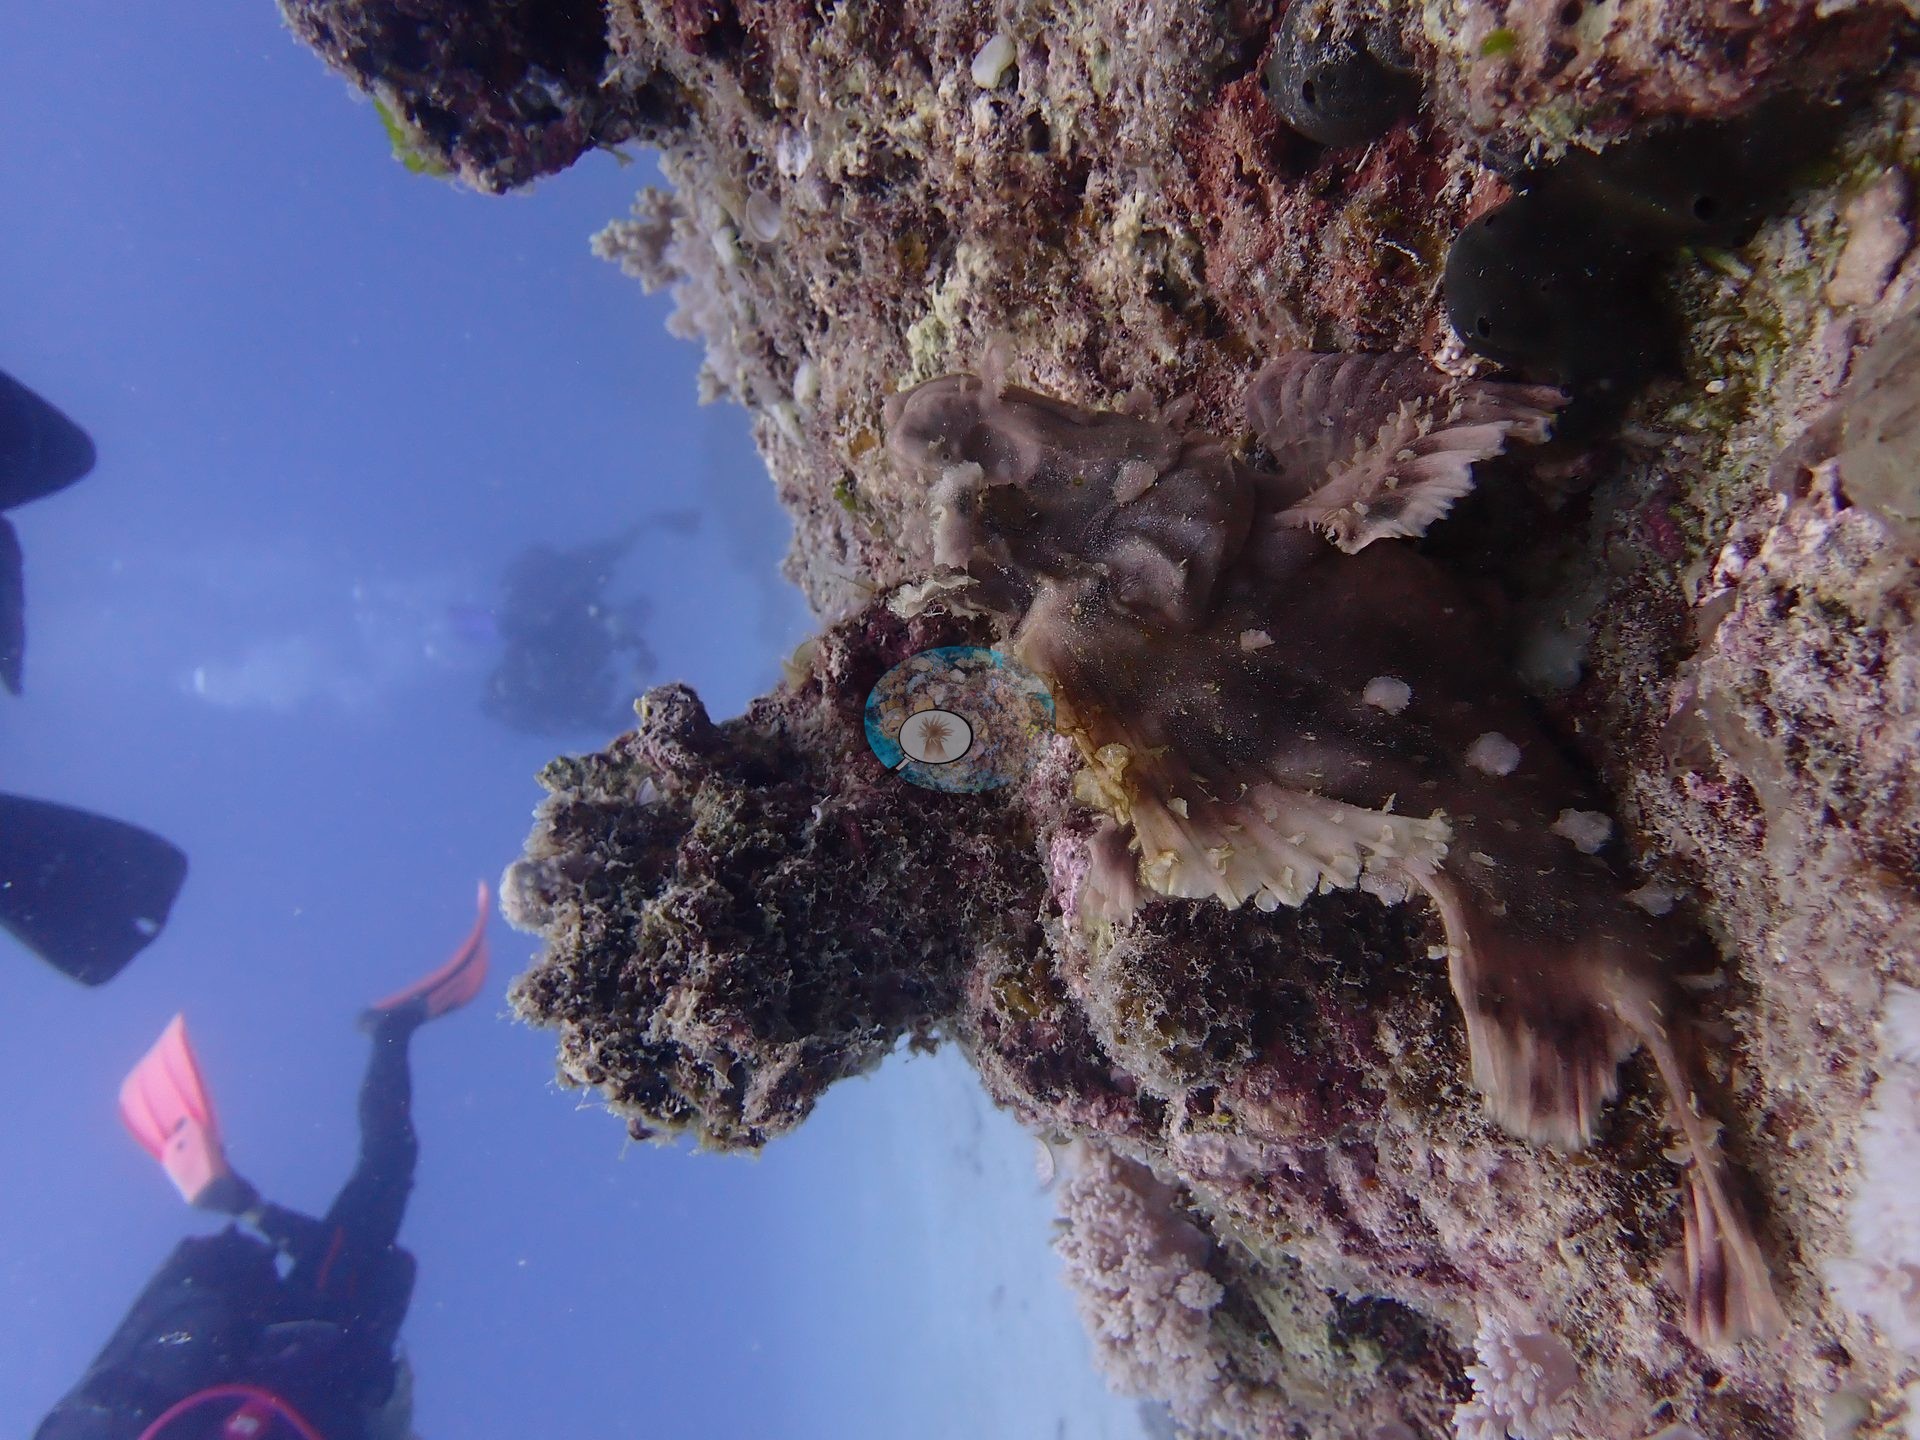
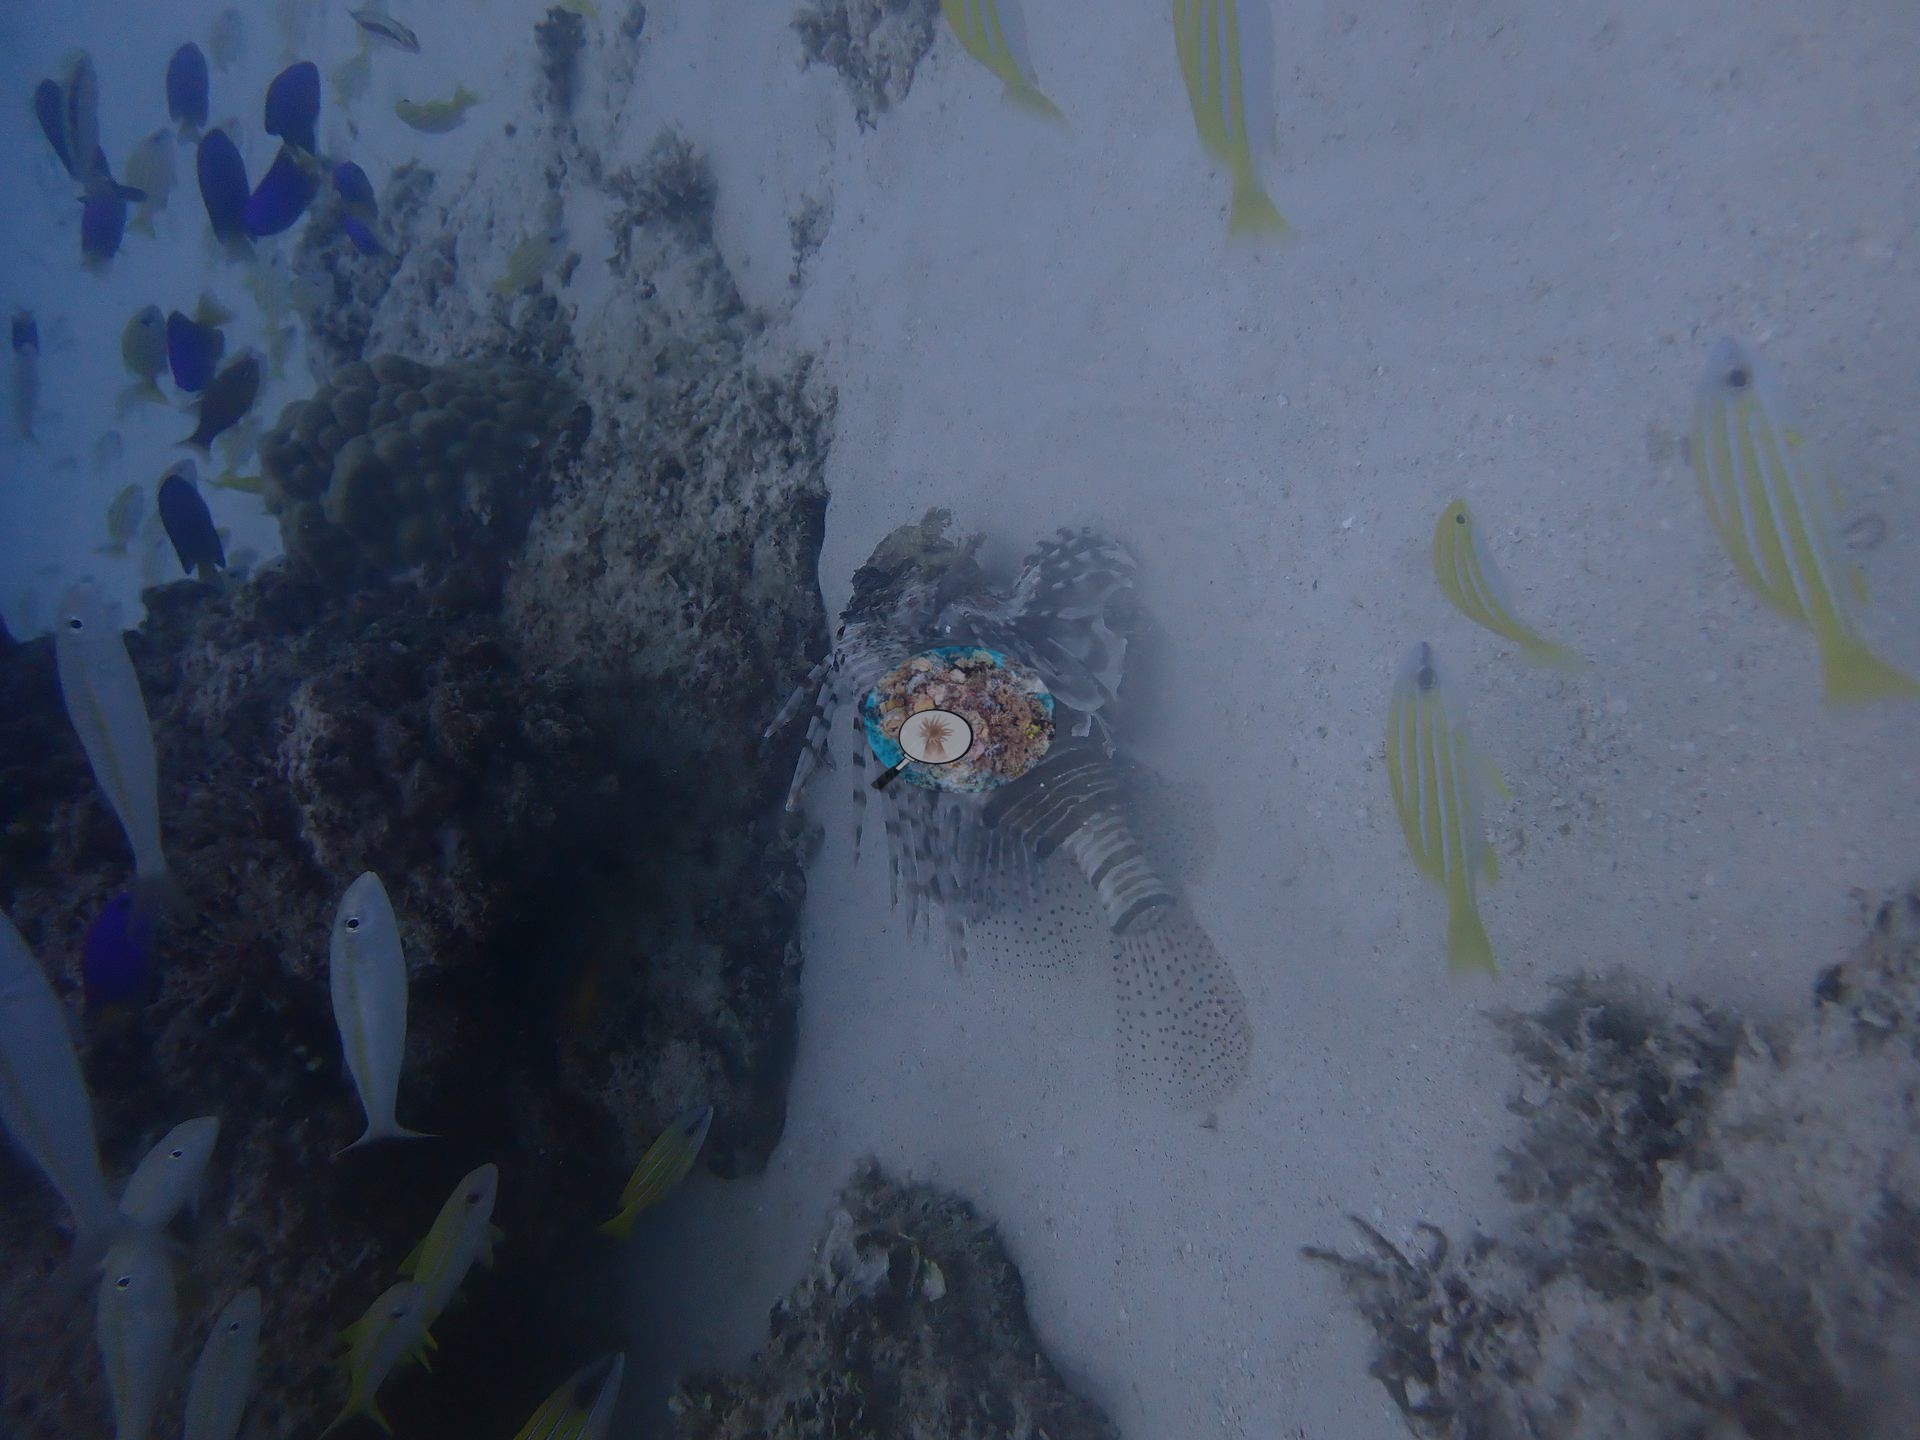
Individually notable sightings included a large spotted porcupinefish, a triggerfish, a lionfish, and a well-camouflaged leaf scorpionfish (e.g., Image 8, Image 9, Image 18).
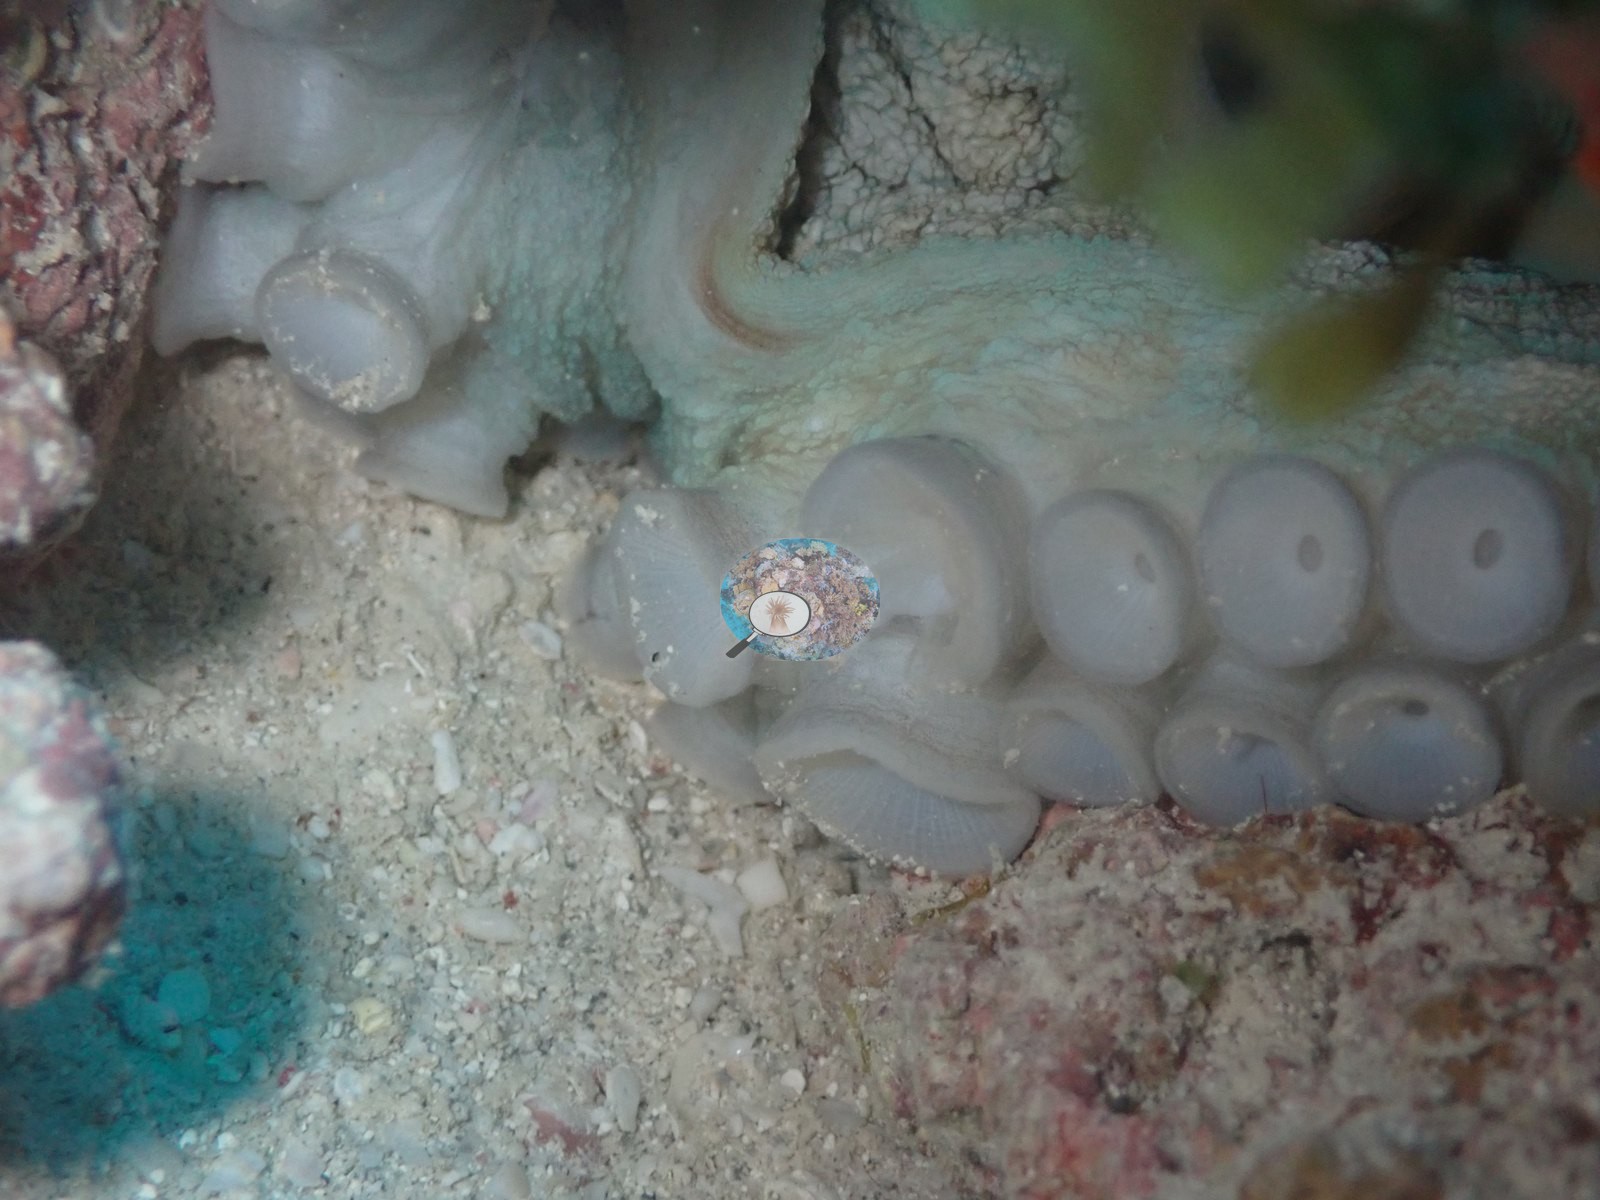
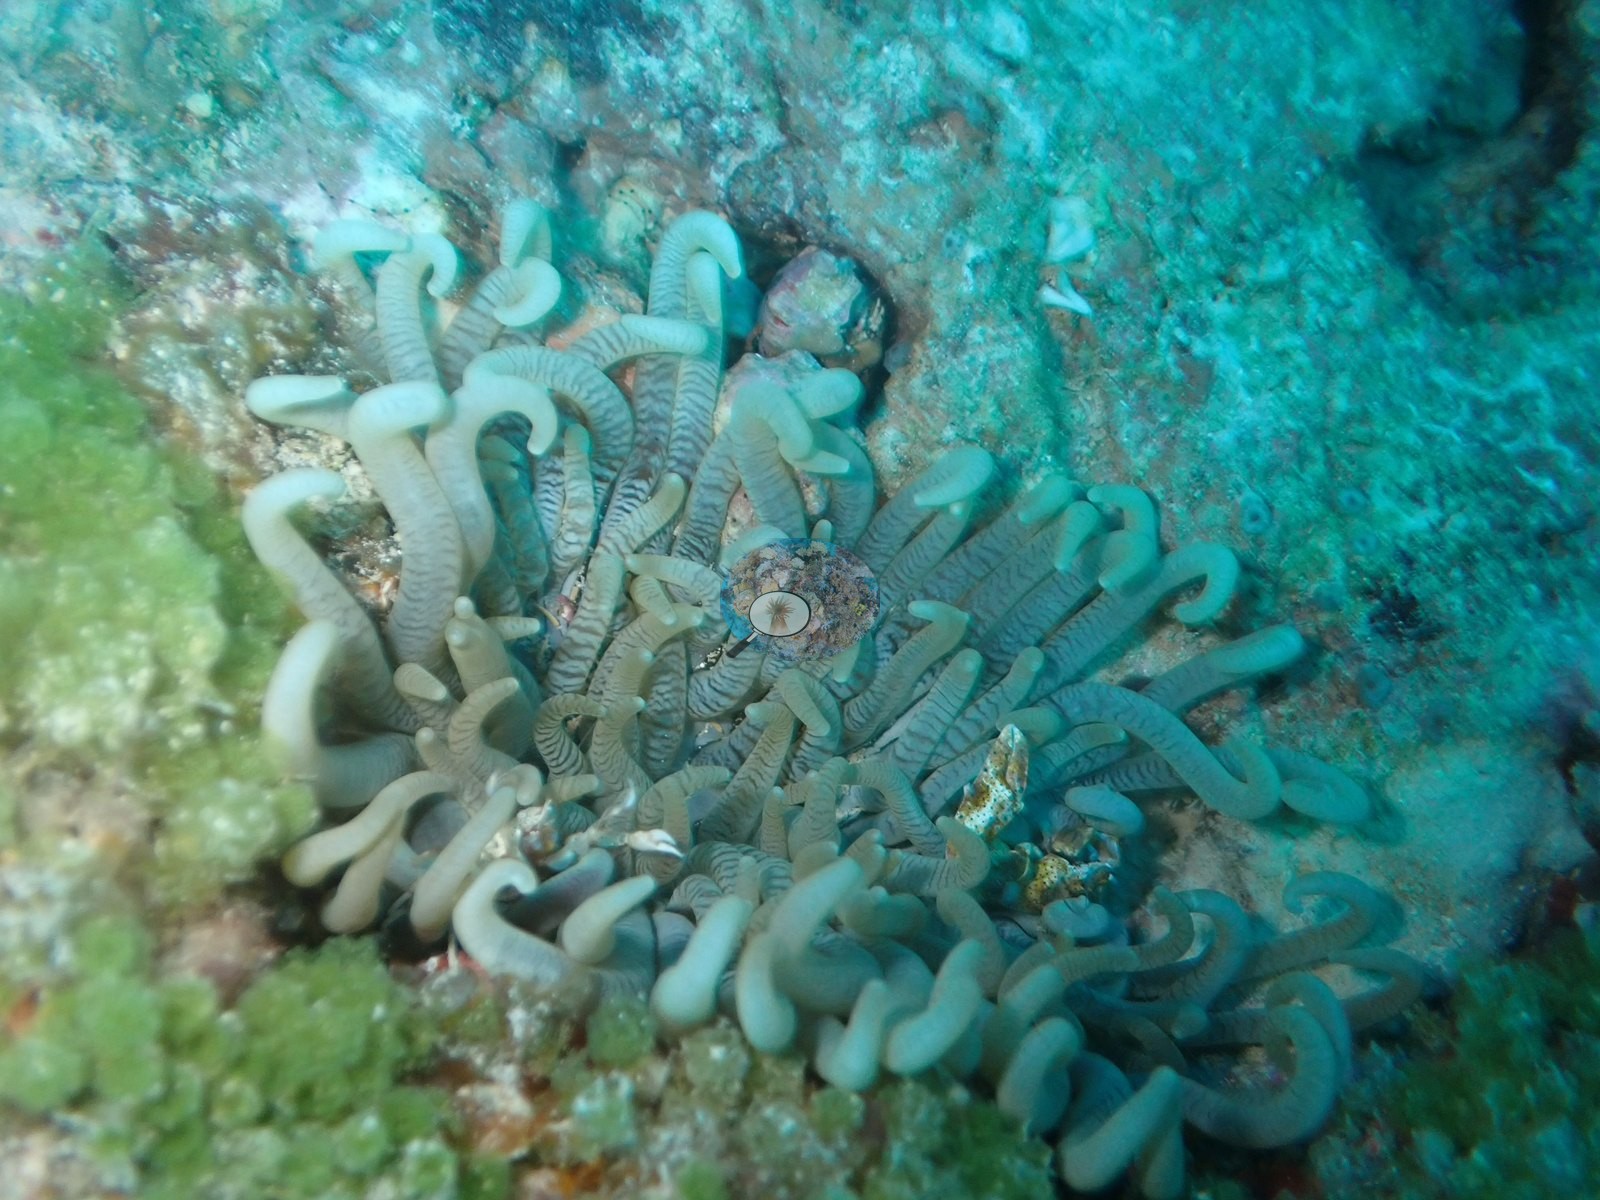
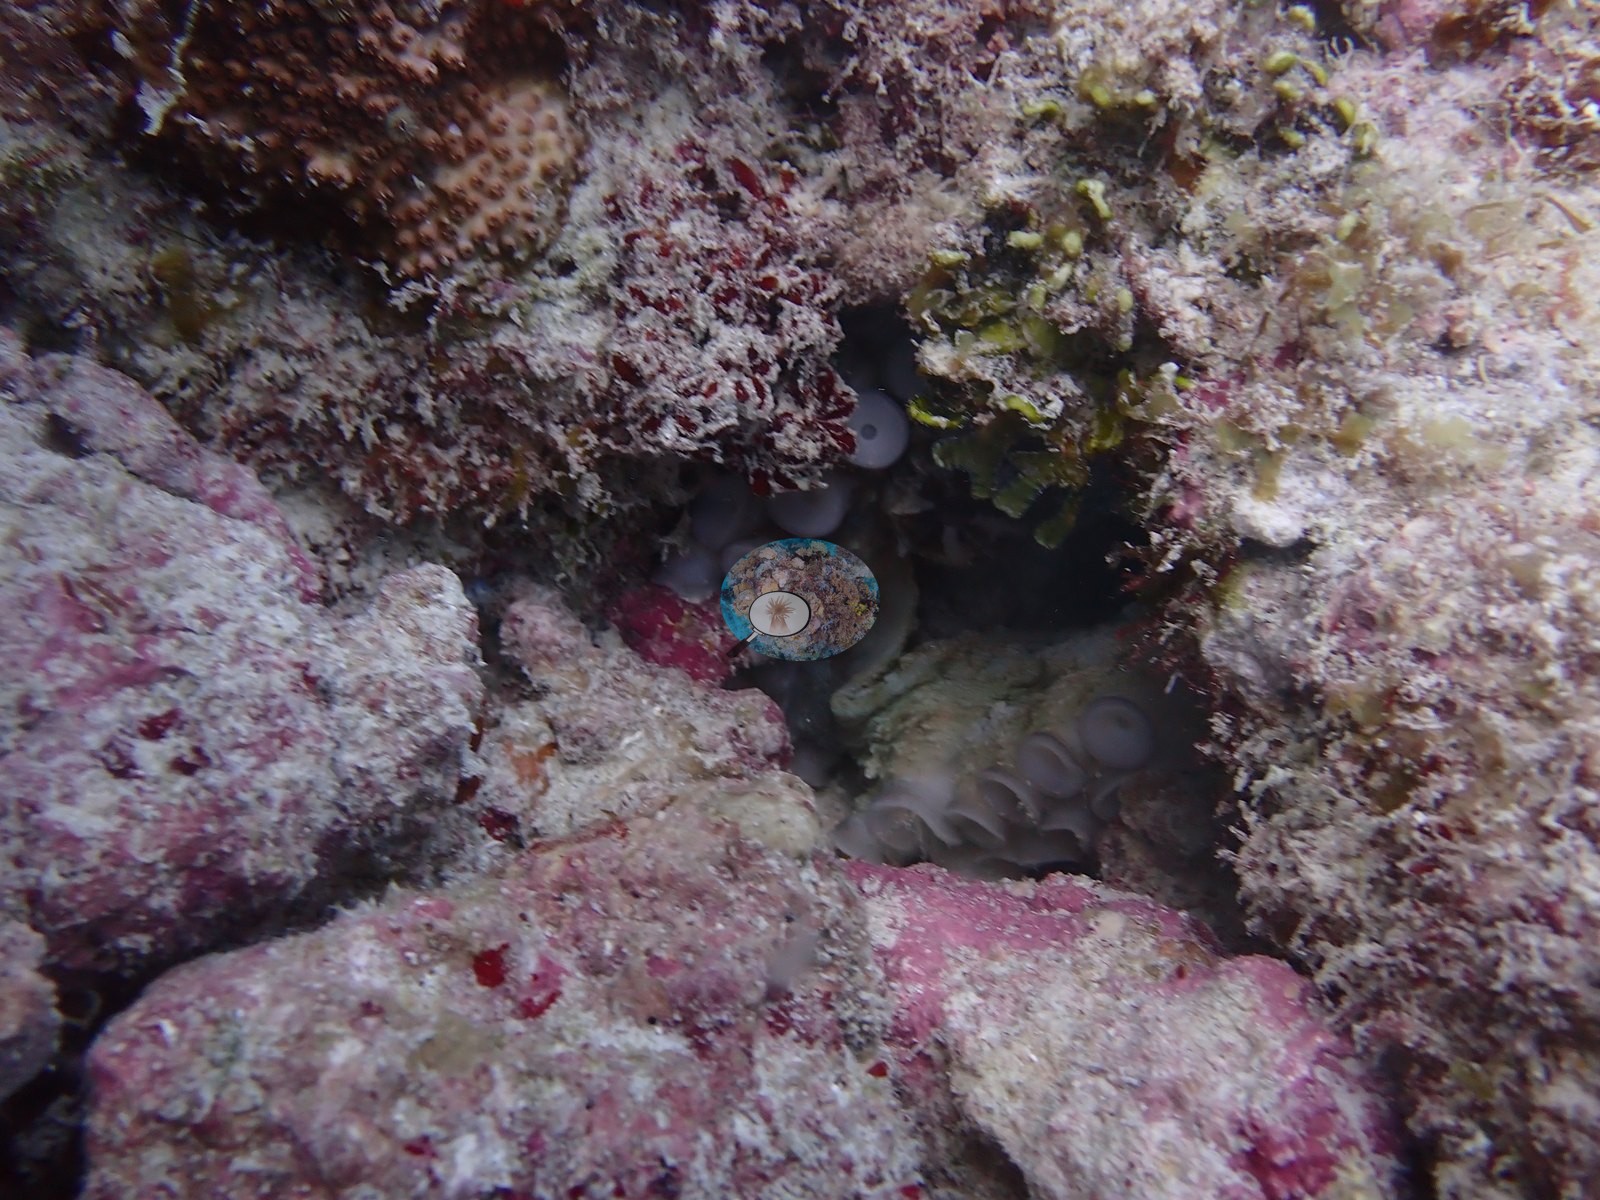
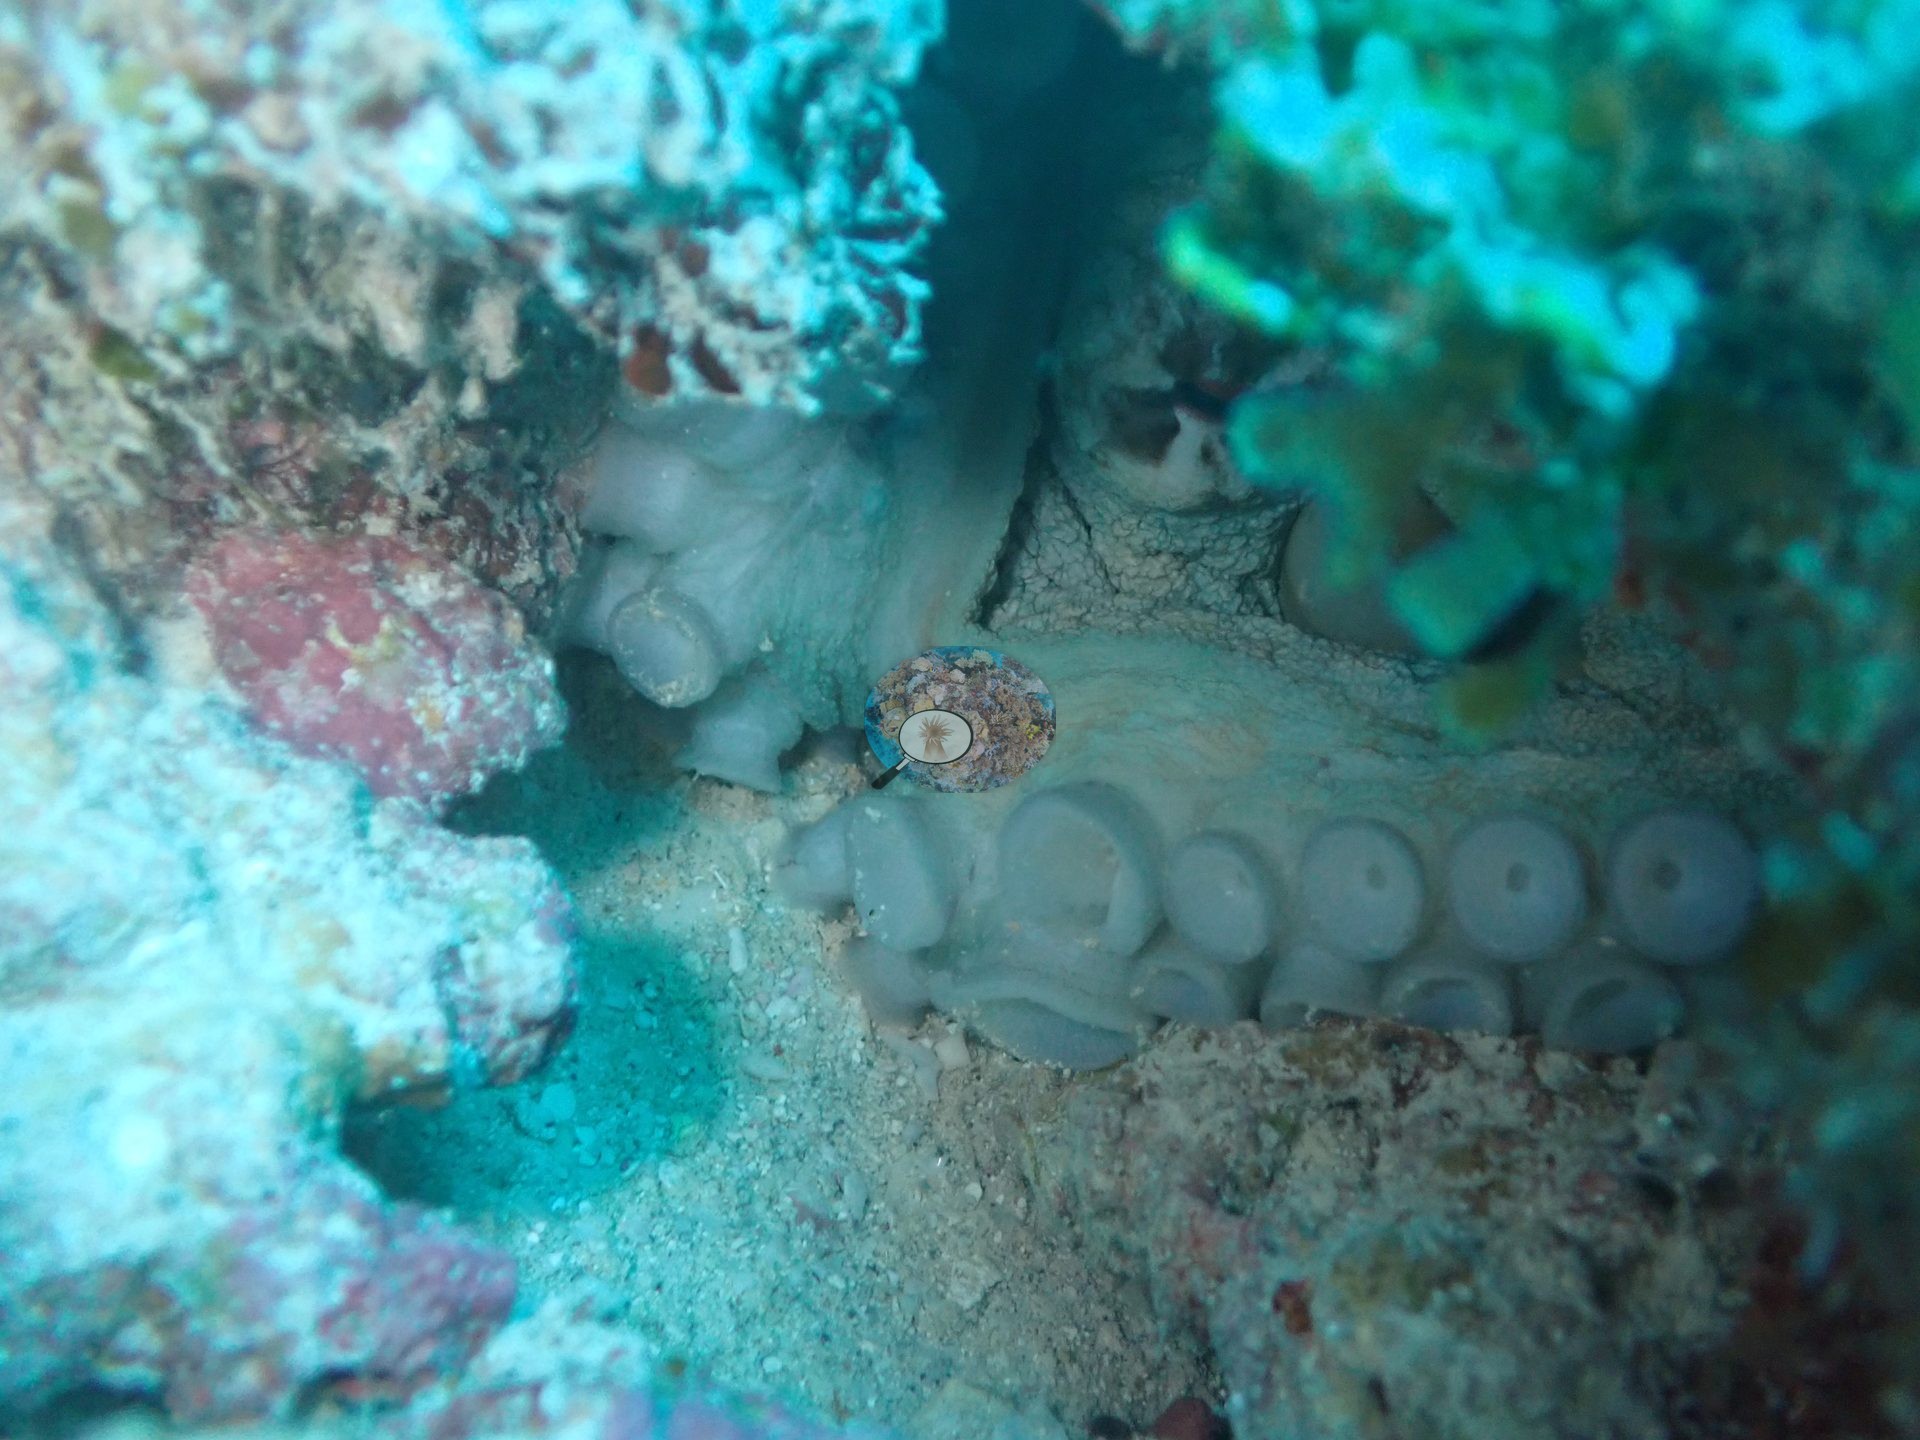
Other fauna included an octopus, a giant clam, a long-spined black sea urchin, and garden eels over the sand (e.g., Image 12).
Comparisons with other data
A published figure above about 70% usually reflects the surveyors choosing the most coral-rich part of the reef, so read it as a best-patch number rather than a site mean.
CV model comparison
More info
The settled rule would raise every Mauritius site by 0–3.7 pp. Awaiting Anderson's ruling. The Claude row is the manuscript's Claude (with image context) value, scored on the same manual-reference frames as the manual count (v42 Table 3); the last of its five context batches had been seen before, so it is not fully blind. Anemone Garden is flagged non-reef in the source (anemone habitat); its manual value stands but carries no error term. CoralSCOP (SAM-based mask-sum), edited photos: n/a — no edited copies exist; EDITED_UNEDITED_RULES.md records Mauritius as verified 347/347 unedited| Method | Hard-coral cover (%) |
|---|---|
| Site cover estimate | 5.4 |
| Manual (draft manuscript) | 7.0 |
| CoralNet | 10.6 |
| In-house DINOv3 | 21.9 |
| CoralSCOP unedited | 20.5 |
| Claude | 7.4 |
Independent surveys nearby
| Agency / program | Year(s) | Stations / distance | Link |
|---|---|---|---|
| Global bleaching + environmental database | 2016 | 1 station, 1.32 km | Records ↓ |
| Original collectors (compiled by McClanahan et al. 2016) | 2016 | 1 station, 4.90 km | Records ↓ |
| Reef Check | 1999–2000 | 2 stations, 0.33–3.70 km | Records ↓ |
| WCS via MERMAID | 2016 | 1 station, 1.32 km | Records ↓ |
 Dr. Coral (CRD)Year-average (no detectable trend)
Within 5 km, 5 independent survey stations recorded hard coral cover in 7 records between 1999 and 2016. Of the 1 station surveyed in more than one year, 1 declined between their first and latest surveys. The longest record, Island Reef (Reef Check, 0.33 km away), went from 61% in 1999 to 30% in 2000. The most recent nearby survey is from 2016, so these values predate recent heat stress. This site's own estimate (5.4%) sits 24.6 points below the range of these surveys (30–61%, excluding 3 best-patch values above 70% that are not a site mean); the methods differ, so the comparison is context, not a like-for-like test.
Collected by other programs using different methods (Reef Check uses point-intercept transects; MERMAID is a data platform: each MERMAID row names the organization that did the survey, and its method is in the row's hover text), so these are context for the figures above, not a like-for-like comparison. Where a station was surveyed more than once the range is shown. Station names are not dive-site names. Values marked best patch exceed 70%: surveyors usually chose the richest area, so they are not site means.
| Agency | Site / location | Date | Hard coral cover (%) | Distance | Link |
|---|---|---|---|---|---|
| Reef Check | Island Reef | 1999–2000 | 30–61% (2 surveys) | 0.33 km | — |
| Reef Check | Island Reef, Anse La Raie | 1999 | 46% | 3.70 km | — |
| WCS via MERMAID | Bain Boeuf | 2016 | 71% (2 images) best patch | 1.32 km | Briand J, Darling E. 2016. 2016 bleaching surveys. MERMAID |
| Original collectors (compiled by McClanahan et al. 2016) | ALR/ALBC (Mauritius) | 2016 | 89% best patch | 4.90 km | — |
| Global bleaching + environmental database | Bain Boeuf | 2016-03-18 | 71% best patch | 1.32 km | — |
Data & links
- CoralNet image repository for this region ↗
- Photo portfolio ↗
- Coral Reef Diagnostics page for this area ↗
All images from Coral Reef Diagnostics. Data are from Coral Reef Diagnostics and the organizations named in the data-sources table above.
© Coral Reef Diagnostics.