
Regional summary of 6 dive sites. Figures are averages across the sites that report them (n = sites with a value); each site's own page has its individual values. Part of the Maldives overview.
⬇ Download this region as a report card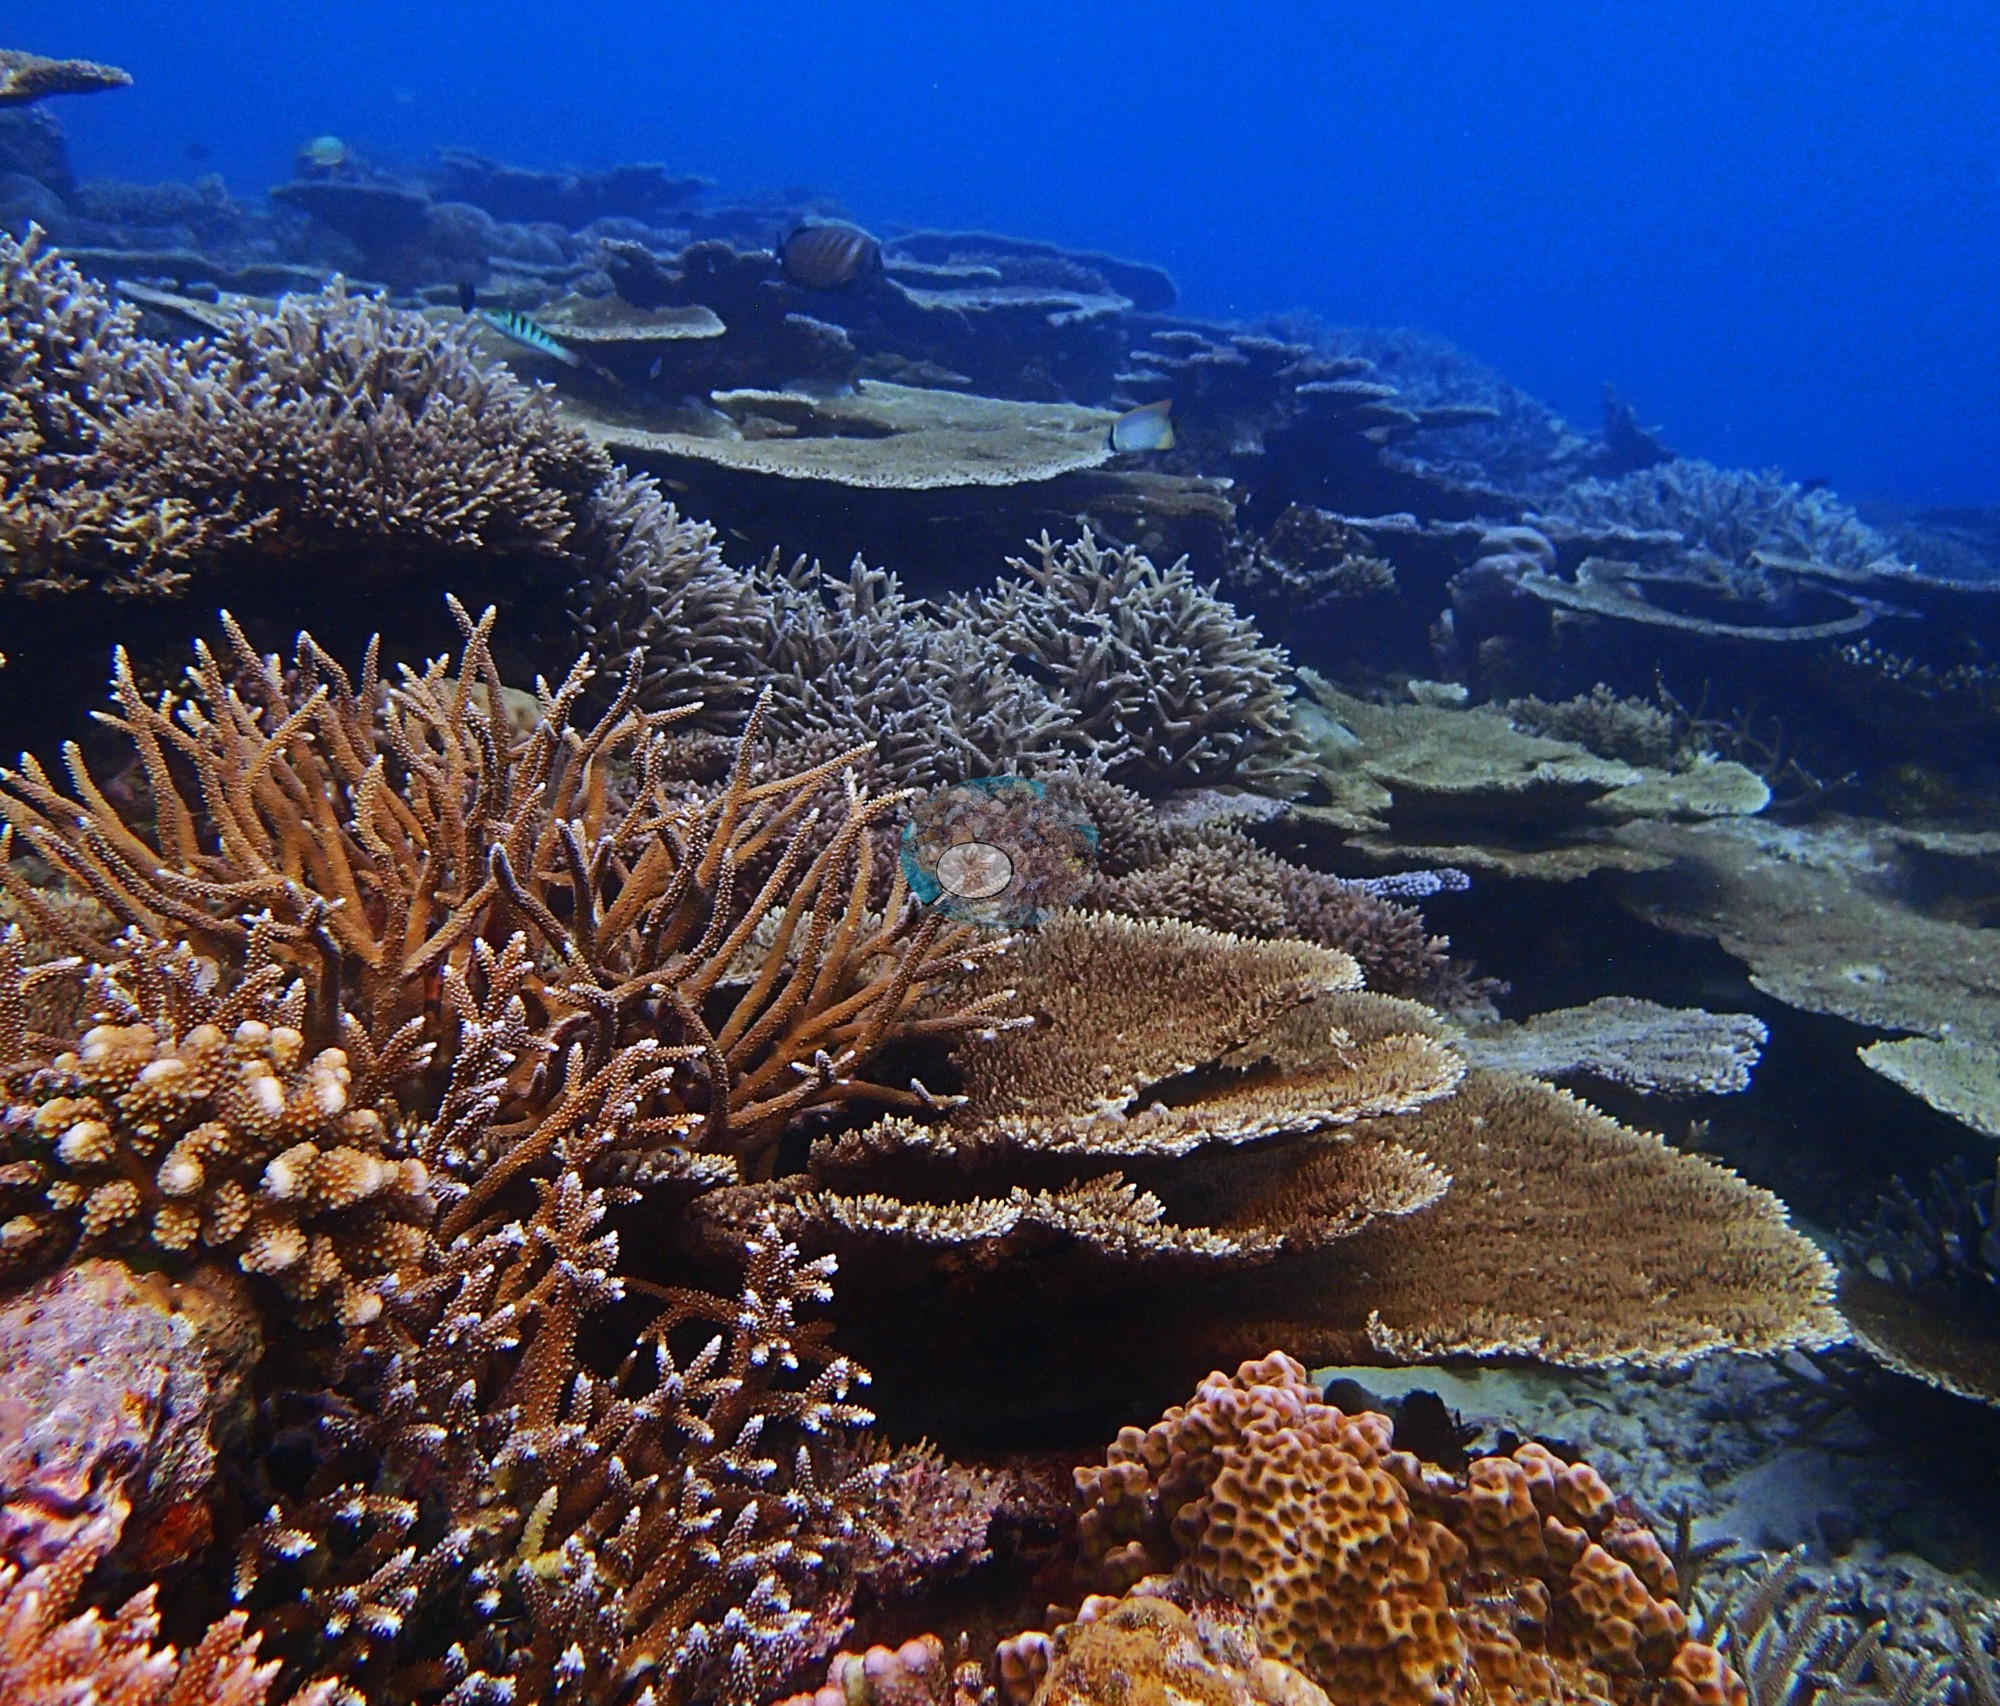

Baa Atoll's staghorn carpets, tiered table corals, and plate-coral slopes were photographed on January 2016 research dives, about three months before El Niño bleaching struck. Early stress was already visible, including a crown-of-thorns starfish, while four other northern atolls have no site photographs yet.
Heat stress
Long-term record: 3 years since 1985 reached 8 or more °C-weeks at NOAA’s Maldives station. Download the annual DHW data (CSV).
6 sites in this region — click a marker to open that site.
Regional setting
The Maldives are a chain of 22 atolls running some 800 km from north to south, the central and largest section of the Chagos–Laccadive Ridge, which traces the path of the Réunion hotspot (Spalding et al. 2001). The atolls rise steeply from the ridge in two parallel rows, and the northern end of the chain holds the world's biggest surface-level atolls: Thiladhunmathi and Miladhunmadulu, two names for a single atoll structure, together cover some 3,680 km². The atlas map of this sector also shows Ihavandhipolhu, Makunudu, North, and South Malosmadulu, and Fadhipolhu atolls, along with several early protected dive sites, among them Anemone City, Dhigali Haa, Kuredhu Express, and Fushivaru Thila, gazetted in 1995 or 1999. Atoll rims are broad reef flats cut by deep channels, and the 15–55 m lagoons hold patch reefs, knolls, and faros, ring-shaped reefs like miniature atolls that are rare outside the Maldives. At least 209 scleractinian species are recorded nationally, with diversity highest in the south. Coral cover on atoll edges, faros, and lagoon knolls had exceeded 60% to at least 20 m, but in 1998 some areas lost up to 90% of their hermatypic corals. Spalding et al. (2001) estimate about 8,920 km² of reef for the Maldives as a whole, and Souter et al. (2021) give 6,372 km² for the Maldives ecoregion from a newer map.
Wilkinson (2006), summarizing the 2004 status report, describes encouraging recovery in the Maldives after 1998, but also a slide in the priority given to monitoring, with tourist resorts managing many marine protected areas and filling gaps left by limited national funding. Souter et al. (2021) show Maldivian coral cover recovering until about 2015 and falling after the 2016 bleaching, which across South Asia killed over 42% of living hard coral. In 1998 the most susceptible genera had been Acropora and Echinopora; mortality in 2016 was lower, partly because less coral remained and partly because the survivors included more bleaching-resistant species. Localized bleaching from 2017 to 2019 prolonged the decline. Souter et al. (2021) also flag sea-level rise as a serious danger for Maldivian island communities.
Overview
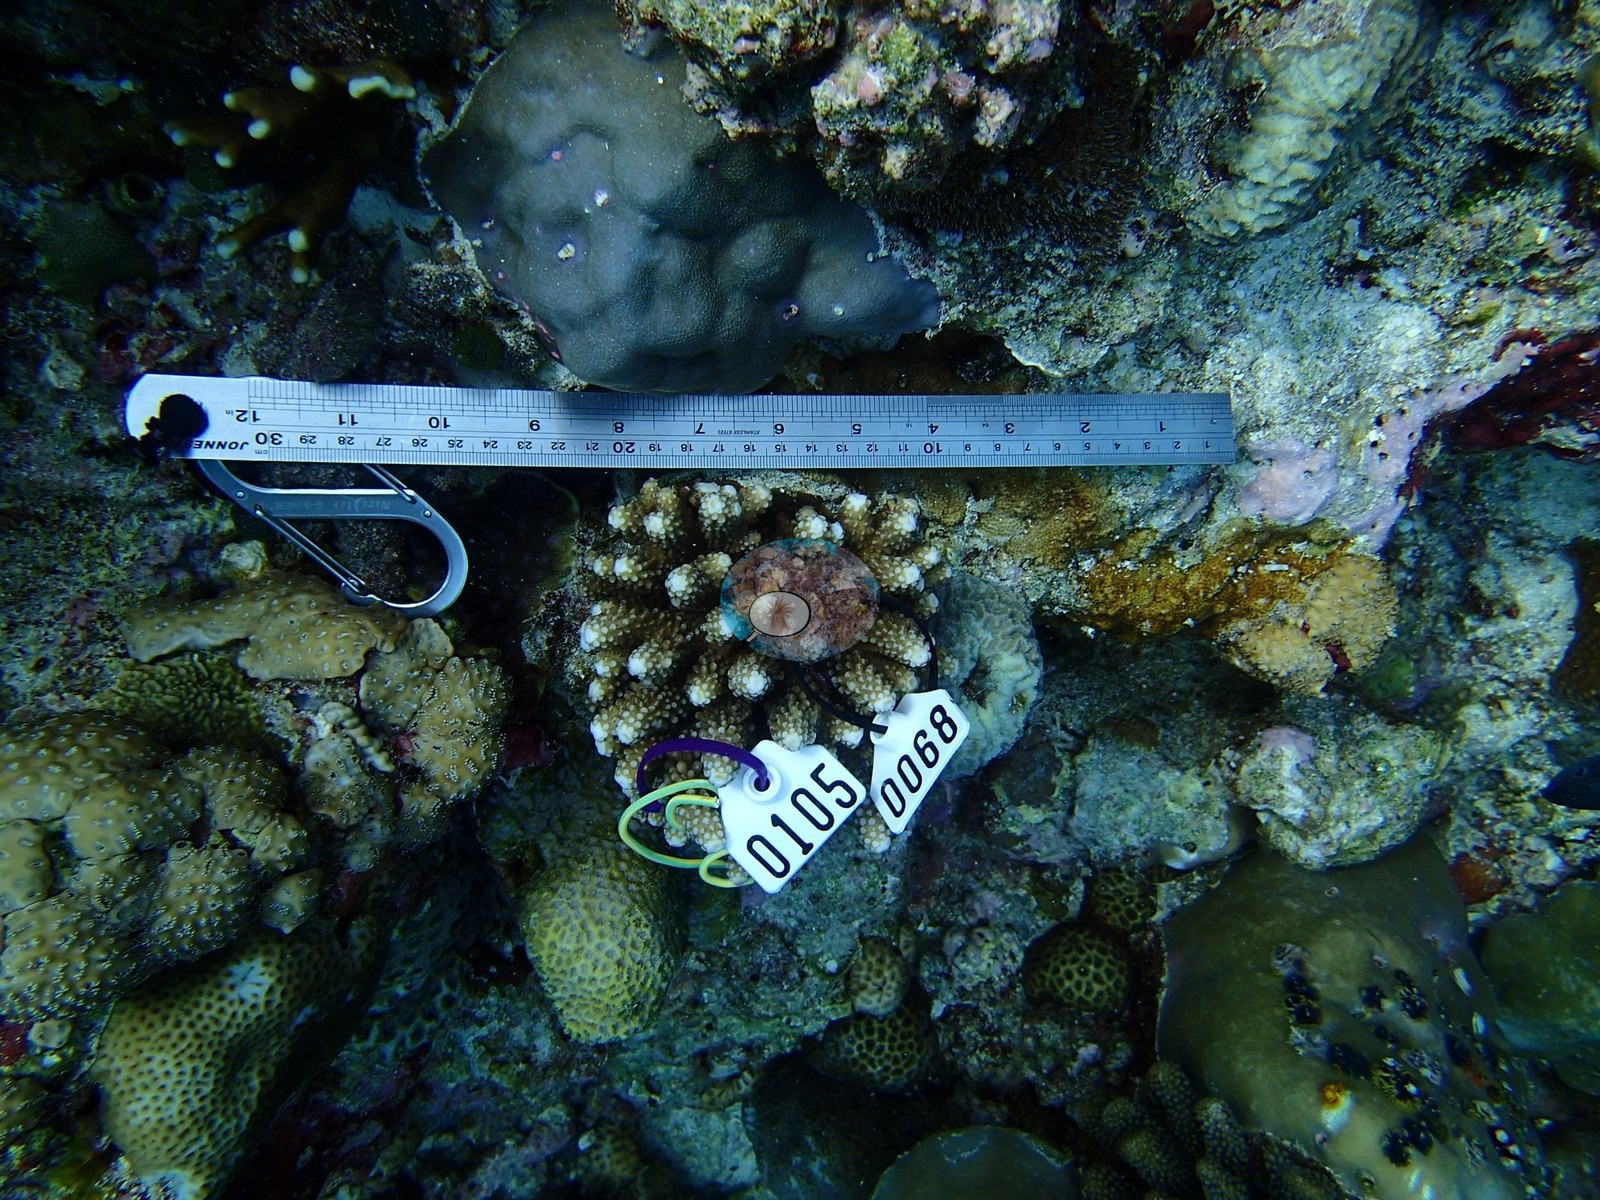
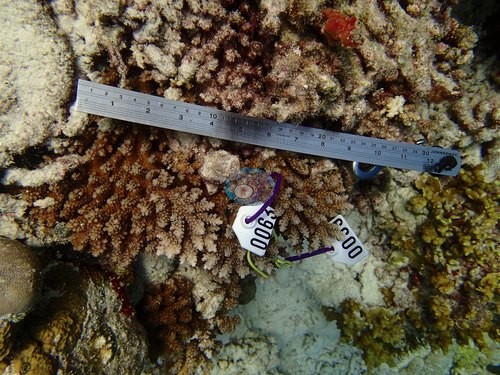
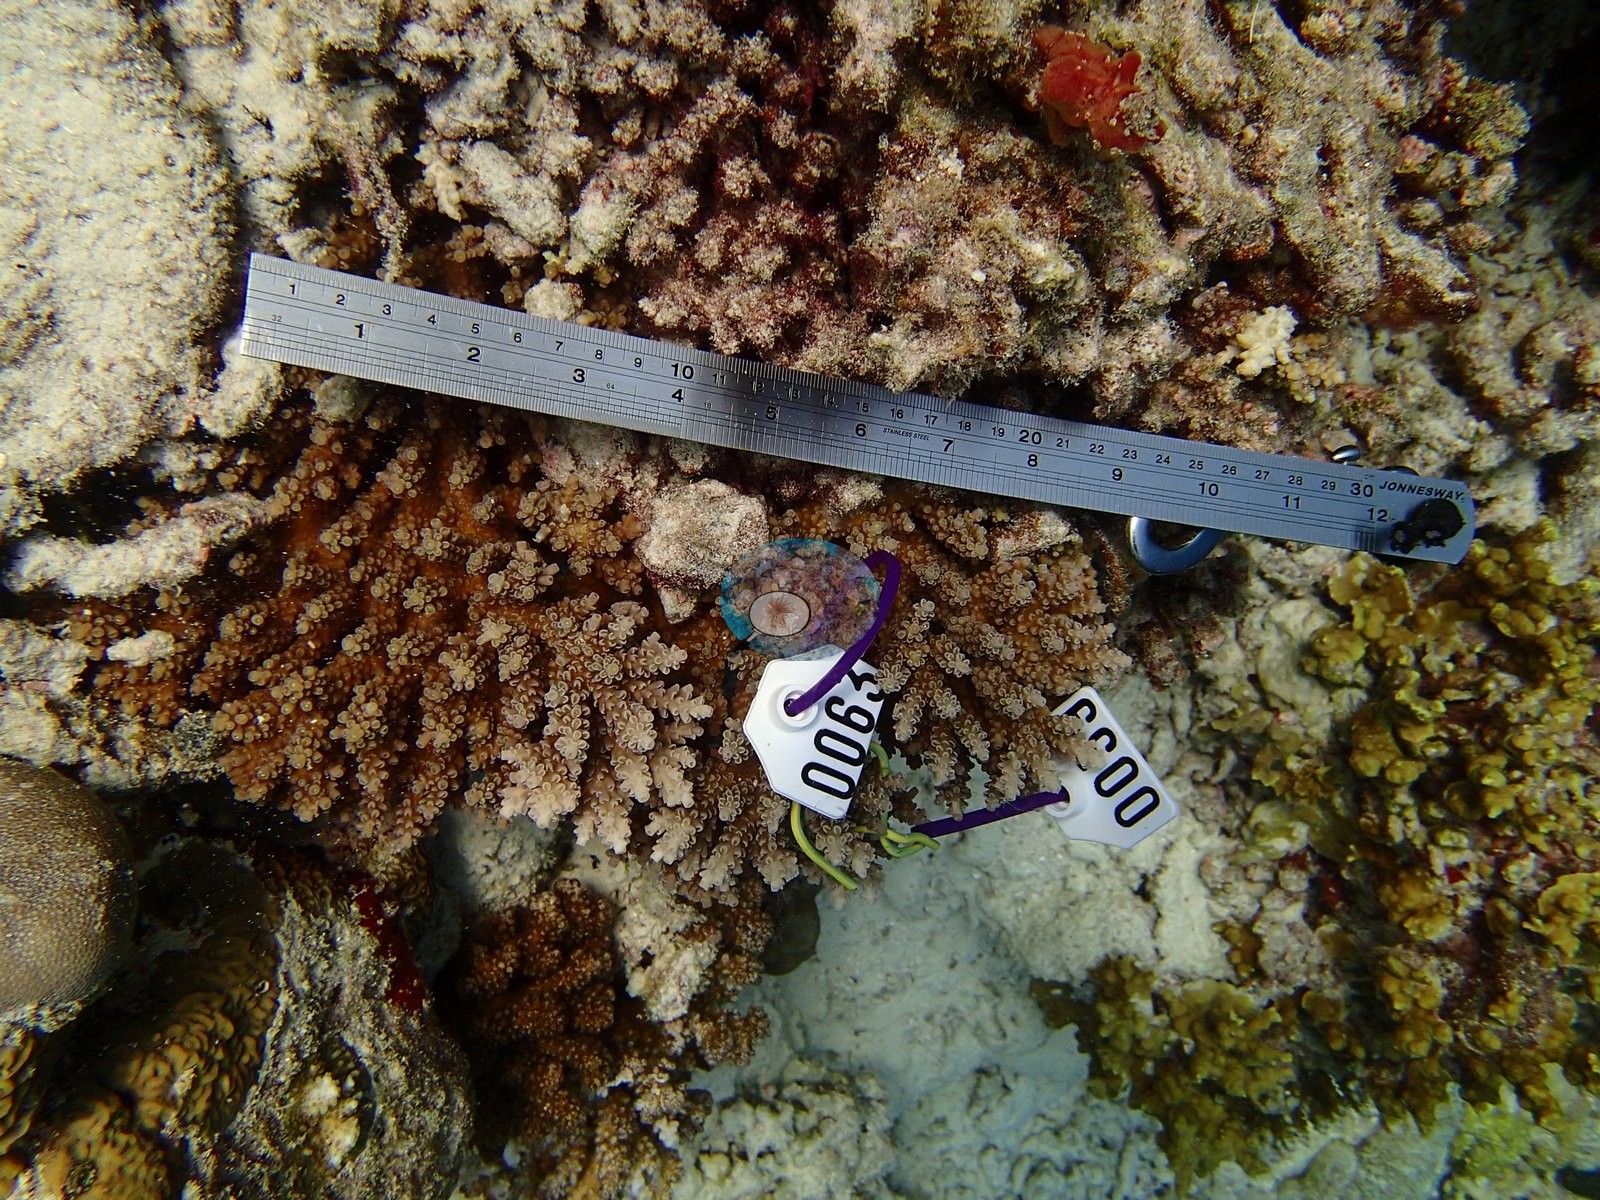
The northern Maldives unit combines four atoll-level pins that carry no photographs of their own (Haa Alif, Noonu, Raa, and Lhaviyani) with five photographed pins in Baa Atoll. All of the Baa photographs come from research dives in January 2016, when coral colonies were tagged with numbered plates and measured against rulers along transect lines. The pins describe these frames as a portrait of the reefs about three months before the 2016 El Niño bleached the vast majority of corals on Baa's study reefs.
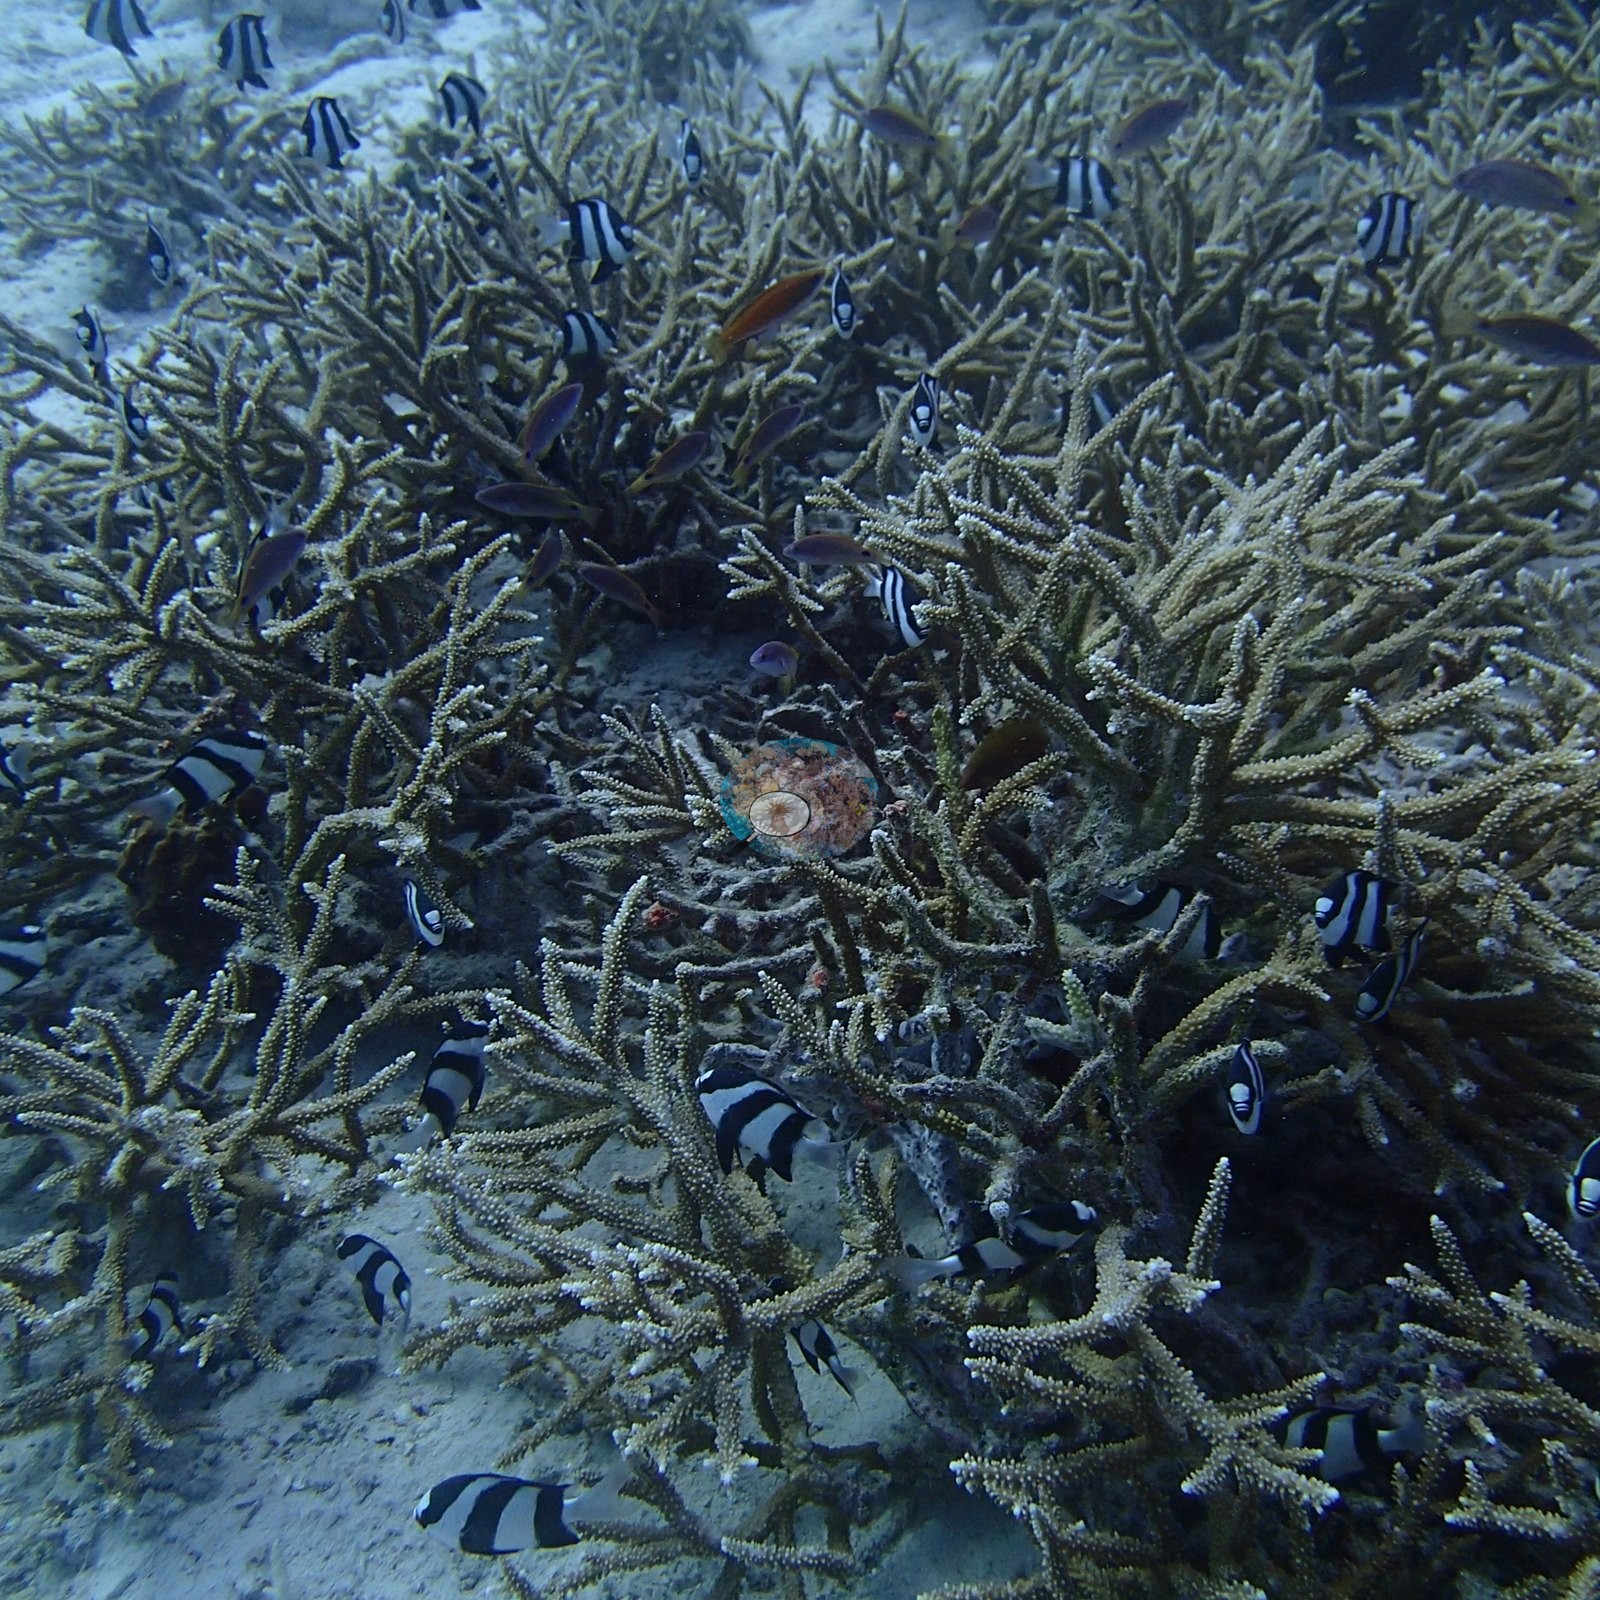
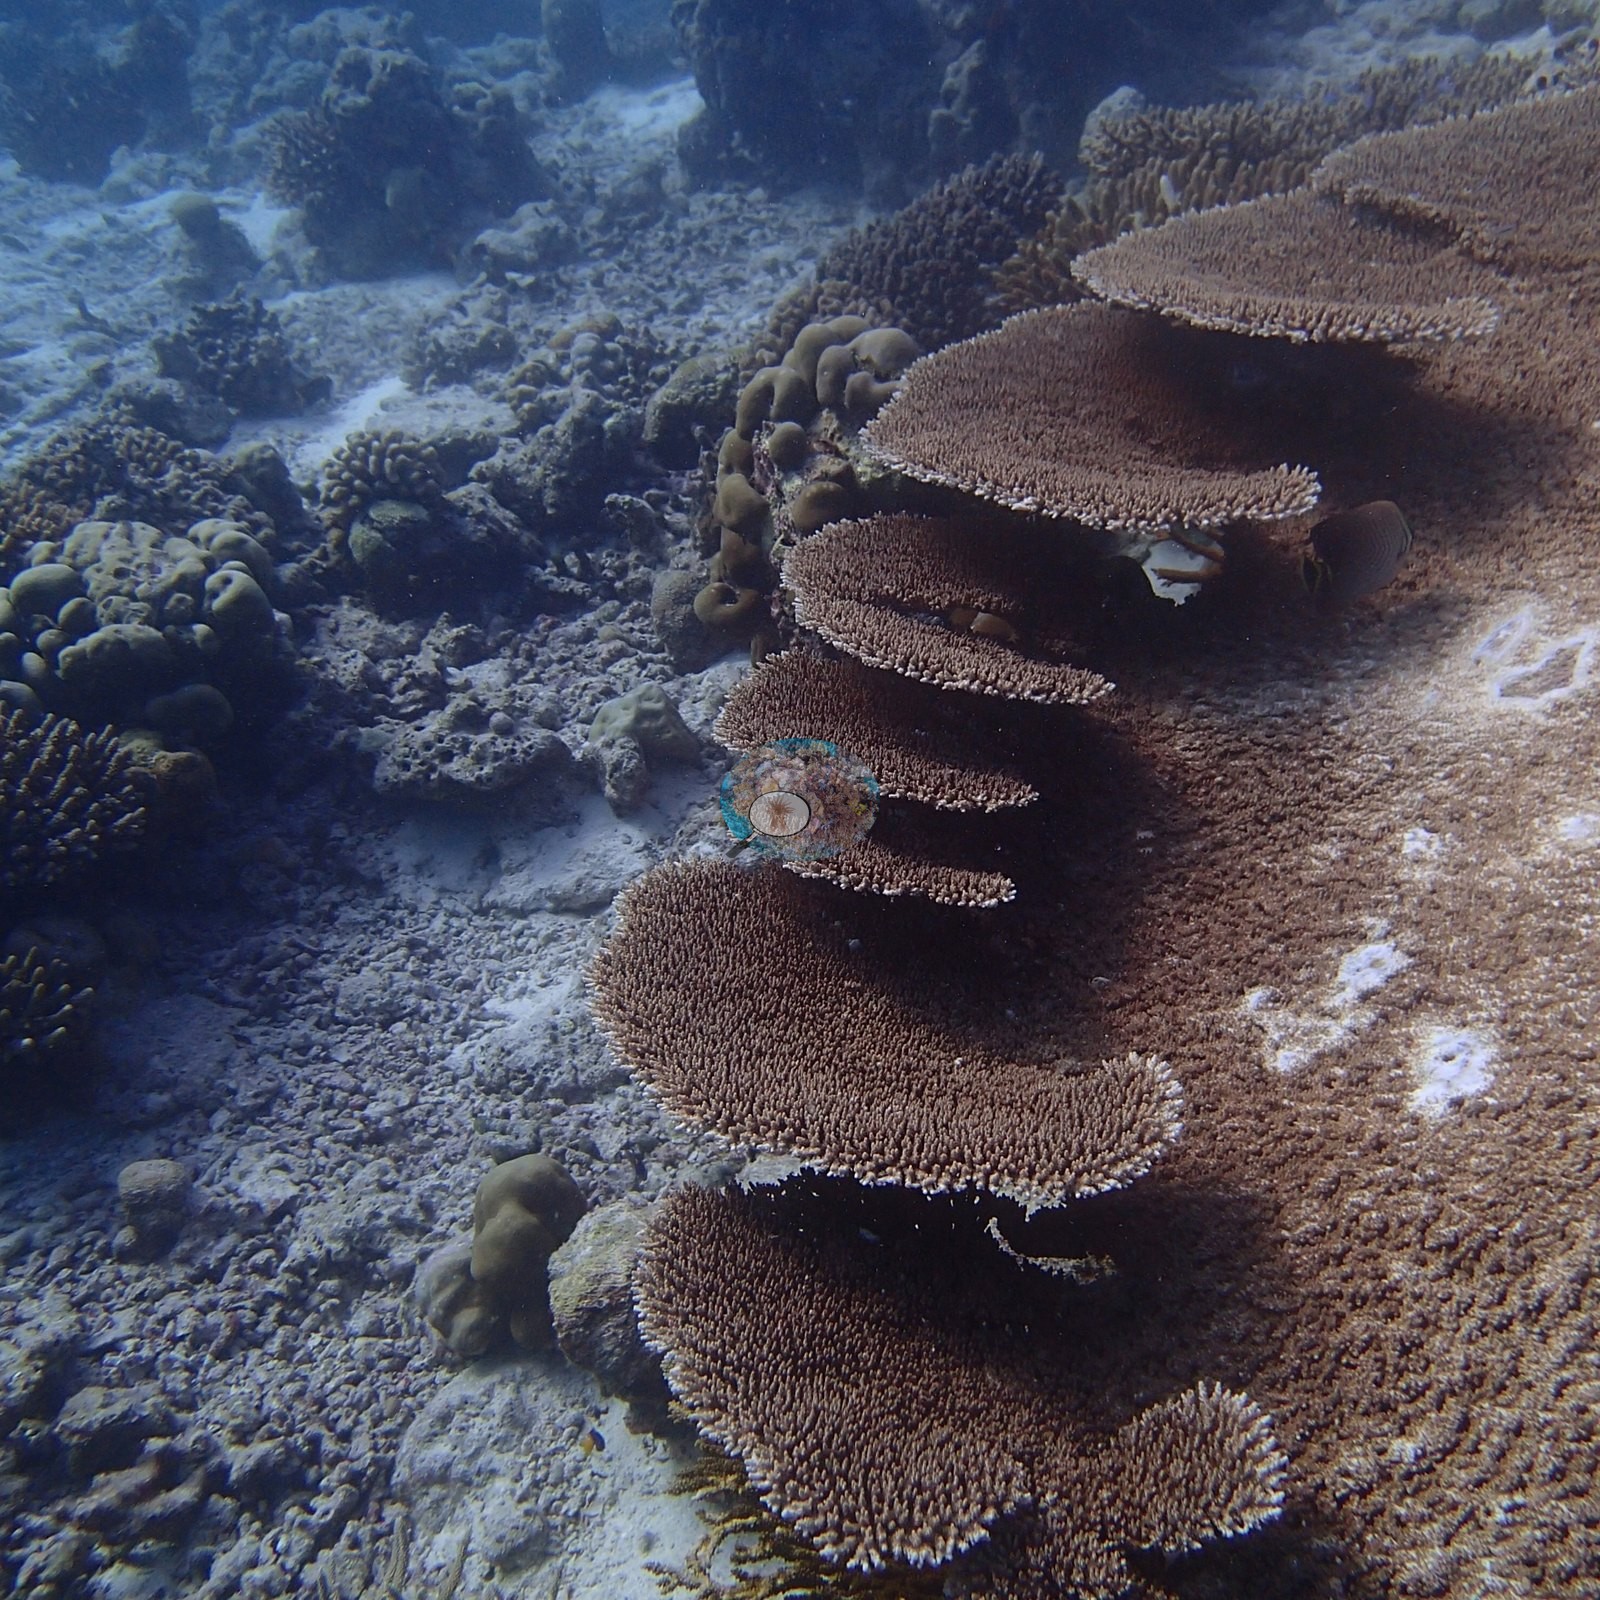
The Baa reefs vary in character. Off Landaa Giraavaru, the bottom is an unbroken carpet of staghorn thickets and meter-wide table corals stacked in tiers. Kashidhoo Faru is a rolling slope covered in whorled plate-coral rosettes and staghorn thickets with lilac-blue tips. Gaagandufaruhuraa is a shallow reef terrace off a small island, where a rubble-strewn flat drops steeply into blue water, with cauliflower pocilloporids, staghorn, boulder corals, and leather corals. The Anantara Kihavah pin combines a house reef, whose bommies are carpeted in sea anemones around a coral nursery, with a sheer outer wall faced in yellow soft corals. The Baa Atoll (Hanifaru) pin holds three further monitoring sites whose exact reefs could not be geocoded. They range from a high-relief reef front with table Acropora, staghorn, and cauliflower Pocillopora to a gentle field of Porites domes and leather corals.
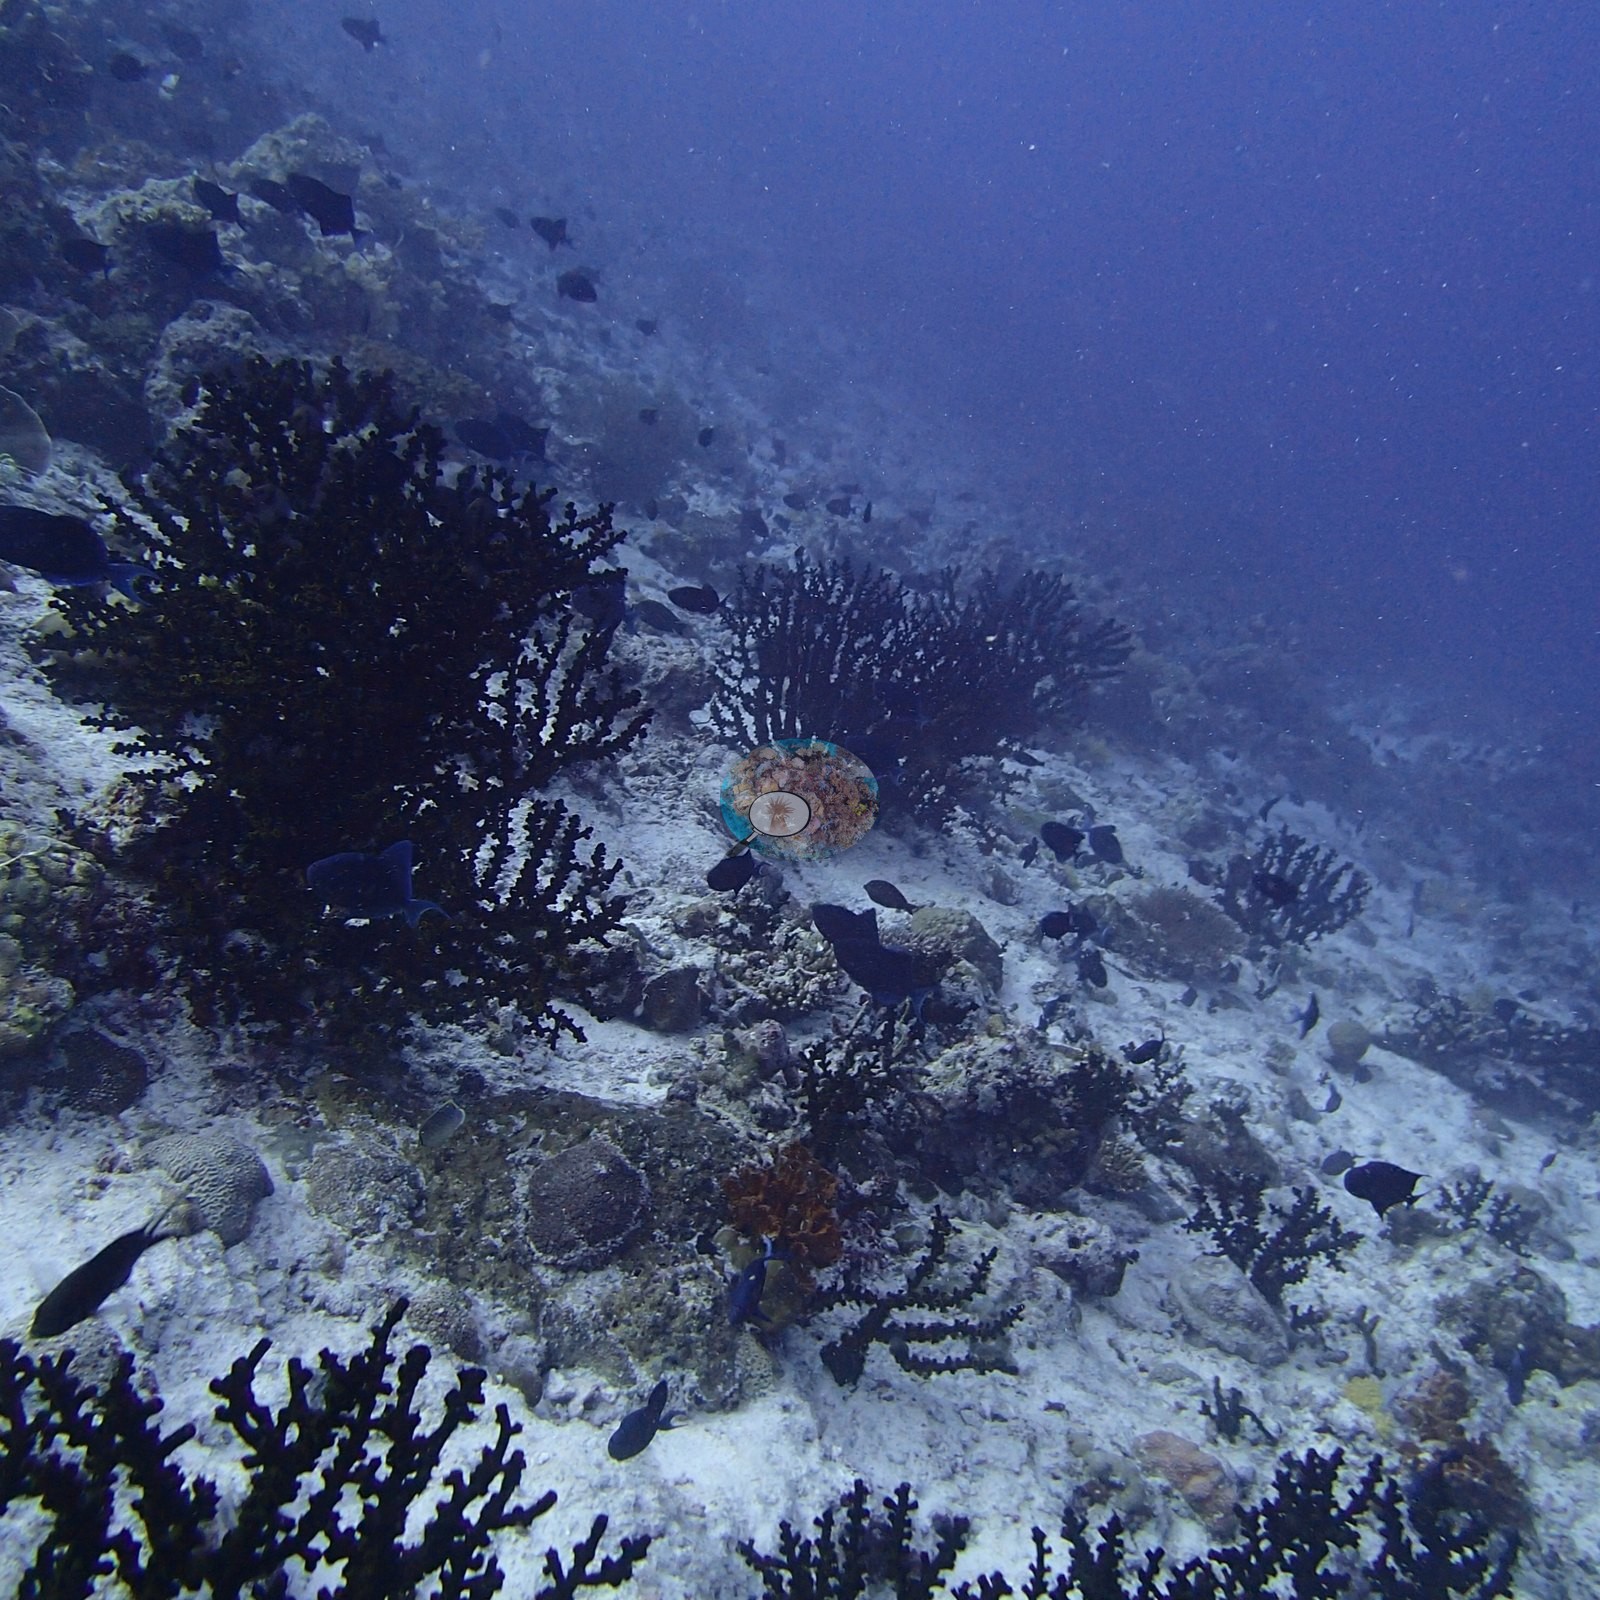
Photo-derived cover indices ranged from 17.0% at Kihavah to 44.5% at Gaagandufaruhuraa across the five photographed pins. These are computer-vision estimates, not diver surveys, and at Landaa Giraavaru the two methods disagree by about 15 percentage points. Signs of stress were already visible in January 2016. A crown-of-thorns starfish sat below table corals with fresh white feeding scars on the Kihavah wall, and scattered bone-white branch tips appeared among the tagged colonies at the last Baa monitoring site. A nurse shark resting under a ledge and a bannerfish school were recorded on the Baa reef front.
Highlights
- Four Seasons Landaa Giraavaru: an unbroken staghorn and table-coral carpet, photographed in January 2016.
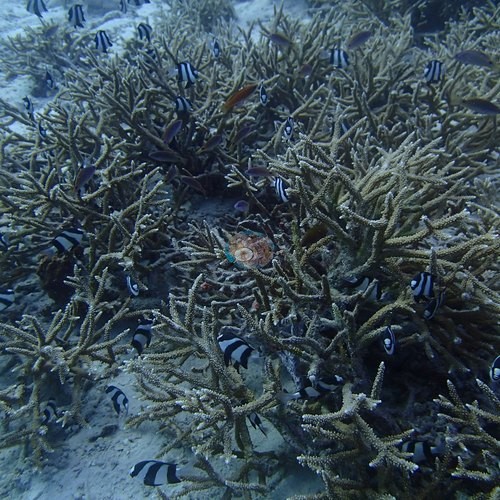 photo: Maldives - Four Seasons Landaa Giraavaru
 - Gaagandufaruhuraa had the highest photo-derived cover index in the unit, 44.5%.
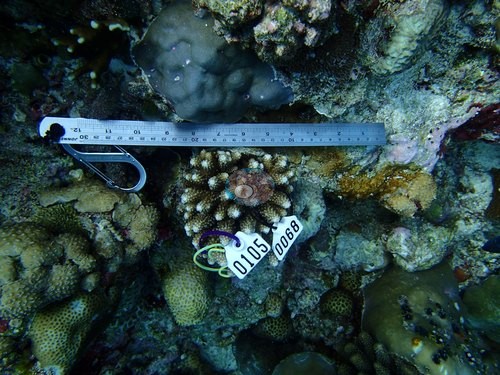 photo: Maldives - Gaagandufaruhuraa
 - All photographed sites are January 2016 monitoring baselines with tagged, ruler-measured colonies.
- Kihavah's outer wall is faced in yellow soft corals; a crown-of-thorns starfish was photographed below scarred table corals.
- Haa Alif, Noonu, Raa, and Lhaviyani carry no site photographs yet.
މިއީ އިނގިރޭސި ބަހުން ލިޔެފައިވާ ޚުލާޞާގެ މެޝިން ތަރުޖަމާއެކެވެ. ރަސްމީ ނުސްހާއަކީ އިނގިރޭސި ނުސްހާއެވެ. AI translation of this summary, low confidence and not yet reviewed by a native speaker; the English is authoritative.
Regional setting
ދިވެހިރާއްޖެއަކީ އުތުރުން ދެކުނަށް ގާތްގަނޑަކަށް 800 km ދިގުކޮށް ހުރި 22 އަތޮޅުގެ ރޮނގެކެވެ. މިއީ Réunion ހޮޓްސްޕޮޓްގެ މަގު ދައްކުވައިދޭ Chagos–Laccadive Ridge ގެ މެދުގައިވާ އެންމެ ބޮޑު ބައެވެ (Spalding et al. 2001). އަތޮޅުތައް ރިޖުން ފުންކޮށް އަރާފައިވަނީ އެއްކޮޅަށް ދާ ދެ ރޮނގަކަށެވެ. ރޮނގުގެ އުތުރު ކޮޅުގައި ހުރީ ކަނޑުގެ ސަތަހަށް އަރާފައިވާ، ދުނިޔޭގެ އެންމެ ބޮޑު އަތޮޅުތަކެވެ. ތިލަދުންމަތި (Thiladhunmathi) އާއި މިލަދުންމަޑުލު (Miladhunmadulu) އަކީ އެއް އަތޮޅު އޮނިގަނޑަކަށް ކިޔާ ދެ ނަމެވެ. މި ދެބައި ޖުމްލަކޮށް ގާތްގަނޑަކަށް 3,680 km² ގެ ބޮޑުމިނެއް ނިވާކުރެއެވެ. އެޓްލަސްގެ މި ސަރަހައްދުގެ ޗާޓުގައި އިހަވަންދިއްޕޮޅު (Ihavandhipolhu)، މަކުނުޑު (Makunudu)، އުތުރު އަދި ދެކުނު މާޅޮސްމަޑުލު (North and South Malosmadulu)، އަދި ފާދިއްޕޮޅު (Fadhipolhu) އަތޮޅުތައް ވެސް ދައްކާފައިވެއެވެ. އަދި 1995 ނުވަތަ 1999 ގައި ހިމާޔަތްކުރެވުނު ފުރަތަމަ ޑައިވް ސައިޓްތަކުގެ ތެރެއިން ބައެއް ސައިޓް ވެސް ދައްކާފައިވެއެވެ. އޭގެ ތެރޭގައި Anemone City، Dhigali Haa، Kuredhu Express، އަދި Fushivaru Thila ހިމެނެއެވެ. އަތޮޅުގެ ބޭރު ގޮށަކީ ފުން ކަނޑުތަކުން ކެނޑިފައިވާ ފުޅާ ފަރުގެ ފަޅުތަކެވެ. 15–55 m ފުން ވިލުތަކުގައި ކުދި ފަރުތައް، ނޮލްތައް، އަދި ފަރޯ (faro) ހުރެއެވެ. ފަރޯއަކީ ކުދި އަތޮޅެއްގެ ސިފައިގައި ވަށްކޮށް ހުންނަ ފަރުތަކެއް ކަމަށާއި، މިފަދަ ފަރުތައް ދިވެހިރާއްޖެއިން ބޭރުގައި ފެންނަނީ ވަރަށް މަދުންނެވެ. ޤައުމީ ގޮތުން މަދުވެގެން 209 ބާވަތެއްގެ ސްކްލެރެކްޓީނިއަން (scleractinian) ހިރިގާ ރެކޯޑްކުރެވިފައިވާއިރު، އެންމެ ގިނަ ތަފާތު ބާވަތްތައް ހުރީ ދެކުނުގައެވެ. އަތޮޅުގެ ގޮށްތަކުގައާއި، ފަރޯތަކުގައާއި، ވިލުގެ ނޮލްތަކުގައި ހިރިގާ ނިވާކުރާ މިންވަރު (coral cover)، މަދުވެގެން 20 m ފުނާ ހަމައަށް 60% އިން މަތިވެފައި ވިއެވެ. ނަމަވެސް 1998 ގައި ބައެއް ސަރަހައްދުތަކުގެ ފަރުބިނާކުރާ (hermatypic) ހިރިގާގެ 90% އާ ހަމައަށް ނެތިގެން ދިޔައެވެ. Spalding et al. (2001) ލަފާކުރާ ގޮތުގައި މުޅި ދިވެހިރާއްޖޭގައި ގާތްގަނޑަކަށް 8,920 km² ގެ ފަރު ހުރެއެވެ. Souter et al. (2021) އާ ޗާޓެއް ބޭނުންކޮށްގެން ދިވެހިރާއްޖޭގެ އިކޯރީޖަނަށް 6,372 km² ދެއެވެ.
2004 ގެ ހާލަތު ރިޕޯޓު ޚުލާޞާކުރަމުން Wilkinson (2006) ބަޔާންކުރަނީ، 1998 ގެ ފަހުން ދިވެހިރާއްޖޭގެ ފަރުތައް ހިތްވަރުލިބޭ ގޮތަކަށް އަލުން ރަނގަޅުވަމުން ދިޔަ ކަމެވެ. ނަމަވެސް މޮނިޓަރކުރުމަށް ދެވޭ އިސްކަން ދަށްވަމުން ދިޔަ ކަމާއި، ގިނަ ބަހުރީ ހިމާޔަތްކުރެވިފައިވާ ސަރަހައްދުތައް ހިންގަމުން ދިޔައީ ފަތުރުވެރިކަމުގެ ރިސޯޓްތަކުން ކަމާއި، ދައުލަތުން ލިބޭ ފަންޑު މަދުވުމުން ދިމާވި ހުސްކަން ފުރިހަމަކުރީ ވެސް އެ ރިސޯޓްތަކުން ކަމަށް ބުނެއެވެ. Souter et al. (2021) ދައްކާ ގޮތުގައި ދިވެހިރާއްޖޭގެ ހިރިގާ ނިވާކުރާ މިންވަރު ގާތްގަނޑަކަށް 2015 އާ ހަމައަށް އަލުން ރަނގަޅުވަމުން ދިޔައިރު، 2016 ގެ ހިރިގާ ހުދުވުމުގެ ފަހުން ދަށްވެގެން ދިޔައެވެ. އެ ހިރިގާ ހުދުވުމުން ދެކުނު އޭޝިއާގައި ދިރިހުރި ހަރު ހިރިގާގެ 42% އަށްވުރެ ގިނައިން މަރުވިއެވެ. 1998 ގައި އެންމެ ގިނައިން އަސަރުކުރި ޖިނަސްތަކަކީ Acropora އާއި Echinopora އެވެ. 2016 ގައި މަރުވި މިންވަރު ދަށްވީ، ބައެއް ވަރަކަށް ބާކީ ހުރި ހިރިގާ މަދުވުމުގެ ސަބަބުން އަދި ބައެއް ވަރަކަށް ދިރިހުރި ހިރިގާތަކުގެ ތެރޭގައި ހުދުވުމާ ކެތްތެރިވާ ބާވަތްތައް ގިނަވުމުގެ ސަބަބުންނެވެ. 2017 އިން 2019 އަށް ހިނގި ސަރަހައްދީ ހިރިގާ ހުދުވުމުން މި ދަށްވުން ދިގުދެމިގެން ދިޔައެވެ. Souter et al. (2021) ވެސް ކަނޑުގެ ފެން އުފުލިގެން ދިއުމަކީ ދިވެހި ރަށްރަށުގެ މުޖުތަމަޢުތަކަށް ބޮޑު ނުރައްކަލެއް ކަމުގައި ފާހަގަކޮށްފައިވެއެވެ.
Overview
އުތުރު ދިވެހިރާއްޖޭގެ މި ޔުނިޓުގައި، އަމިއްލަ ފޮޓޯއެއް ނެތް އަތޮޅު ފެންވަރުގެ ހަތަރު ޕިނާއި، ބާ އަތޮޅު (Baa Atoll) ގައިވާ ފޮޓޯ ނަގާފައިވާ ފަސް ޕިން ހިމެނެއެވެ. ހަތަރު ޕިނަކީ ހާ އަލިފު (Haa Alif)، ނޫނު (Noonu)، ރާ (Raa)، އަދި ޅަވިޔަނި (Lhaviyani) އެވެ. ބާ އަތޮޅުގެ ހުރިހާ ފޮޓޯއެއް ނަގާފައިވަނީ 2016 ގެ ޖަނަވަރީގައި ކުރި ދިރާސާގެ ފީނުންތަކުގައެވެ. އެ ފީނުންތަކުގައި ހިރިގާގެ ކޮލޯނީތަކަށް ނަންބަރު ޖަހާފައިވާ ޕްލޭޓް ޓެގްކޮށް، ޓްރާންސެކްޓް ލައިންތަކުގެ ދިގުމިނުގައި ރޫލަރުން މިނިއެވެ. ޕިންތަކުގައި މި ފޮޓޯތައް ބަޔާންކޮށްފައިވަނީ، 2016 ގެ އެލްނީނޯއިން ބާ އަތޮޅުގެ ދިރާސާކުރި ފަރުތަކުގެ ހިރިގާގެ ބޮޑު އަޣްލަބިއްޔަތެއް ހުދުކުރުމުގެ ގާތްގަނޑަކަށް ތިން މަސް ކުރިން ފަރުތައް ހުރި ގޮތުގެ ތަސްވީރެއްގެ ގޮތުގައެވެ.
ބާ އަތޮޅުގެ ފަރުތަކުގެ ސިފަ ތަފާތެވެ. Landaa Giraavaru ކައިރީގައި އަޑީގައި ހުރީ ނުކެނޑި ފެތުރިފައިވާ ސްޓެގްހޯން ހިރިގާގެ ގަނޑުތަކާއި، މަތިމަތިން ހުރި، އެއް މީޓަރު ފުޅާ ޓޭބަލް ހިރިގާއެވެ. Kashidhoo Faru އަކީ ވަށްވަށަށް އެތުރިފައިވާ ޕްލޭޓް ހިރިގާގެ ރޯޒެޓްތަކާއި، ކޮޅުތައް ލައިލެކް-ނޫ ކުލައިގެ ސްޓެގްހޯން ހިރިގާގެ ގަނޑުތަކުން ނިވާވެފައިވާ، މަތިވެ ދަށްވާ ބިމެކެވެ. Gaagandufaruhuraa އަކީ ކުދި ރަށެއްގެ ކައިރީގައިވާ ތިލަ ފަރުގެ ފަށެއް (terrace) އެވެ. އެތަނުގައި ހިރިގާ ކުދިކުދިވެފައި ހުރި ފަޅެއް ނޫ ފެނަށް ފުންކޮށް ވެއްޓިގެން ދެއެވެ. އަދި ކޮލީފްލާވަރ ސިފައިގެ pocilloporid ހިރިގާ، ސްޓެގްހޯން، ބޯލްޑަރ ހިރިގާ، އަދި ލެދަރ ހިރިގާ ހުރެއެވެ. Anantara Kihavah ޕިނުގައި ހައުސް ރީފާއި، ބޭރު ފުށުގެ ސީދާ ފާރެއް ހިމެނެއެވެ. ހައުސް ރީފުގެ ބޮމީތައް ހިރިގާ ނާސަރީއެއްގެ ވަށައިގެން ސީ އެނިމޯނީ (sea anemone) ން ނިވާވެފައި ހުރެއެވެ. ބޭރު ފާރުގައި ރީނދޫ ސޮފްޓް ކޯރަލް ހުރެއެވެ. ބާ އަތޮޅު (Hanifaru) ޕިނުގައި، ސީދާ ފަރު ދަނެ ޖިއޯކޯޑް ނުކުރެވުނު، އިތުރު ތިން މޮނިޓަރިންގ ސައިޓް ހިމެނެއެވެ. އެ ސައިޓްތައް ތަފާތުވަނީ، ޓޭބަލް Acropora، ސްޓެގްހޯން، އަދި ކޮލީފްލާވަރ Pocillopora ހުރި އުސް ފަރުގެ ކުރިމަތިން ފެށިގެން، ޑޯމް (dome) ސިފައިގެ Porites އާއި ލެދަރ ހިރިގާ ހުރި ލަސްލަހުން ފުންވާ ބިމަކާ ހަމައަށެވެ.
ފޮޓޯ ނަގާފައިވާ ފަސް ޕިނުގައި، ފޮޓޯއިން ހޯދި ހިރިގާ ނިވާކުރާ މިންވަރުގެ އިންޑެކްސް، Kihavah ގައި 17.0% އިން ފެށިގެން Gaagandufaruhuraa ގައި 44.5% އާ ހަމައަށް ތަފާތުވިއެވެ. މިއީ ފީނާ މީހުން ކުރި ސާވޭއެއް ނޫން، ކޮމްޕިއުޓަރ ވިޜަން ބޭނުންކޮށްގެން ލެވުނު ލަފާކުރުންތަކެކެވެ. Landaa Giraavaru ގައި މި ދެ ގޮތުގެ ނަތީޖާ ގާތްގަނޑަކަށް 15 ޕަސެންޓޭޖް ޕޮއިންޓް ތަފާތުވެއެވެ. 2016 ގެ ޖަނަވަރީގައި ވެސް ދަތިކަމުގެ (stress) ނިޝާނާތައް ފެނެން ފަށައިފިއެވެ. Kihavah ގެ ފާރުގައި، ކާފައިވާ އާ ހުދު ފާހަގަތައް ހުރި ޓޭބަލް ހިރިގާގެ ދަށުގައި crown-of-thorns ސްޓާފިޝްއެއް ހުއްޓެވެ. އަދި ބާ އަތޮޅުގެ އެންމެ ފަހު މޮނިޓަރިންގ ސައިޓްގައި، ޓެގްކުރި ކޮލޯނީތަކުގެ ތެރޭގައި ކަށި-ހުދު ކުލައިގެ ގޮފިތަކުގެ ކޮޅުތައް ތަންތަނުގައި ފެނުނެވެ. ބާ އަތޮޅުގެ ފަރުގެ ކުރިމަތީގައި، ހިލައެއްގެ ދަށުގައި އަރާމުކުރަމުން އޮތް ނިދަން މިޔަރެއް އަދި ބެނަރފިޝްގެ (bannerfish) ގިނަ ބައެއް ރެކޯޑްކުރެވުނެވެ.
Highlights
- Four Seasons Landaa Giraavaru: ނުކެނޑި ފެތުރިފައިވާ ސްޓެގްހޯން އާއި ޓޭބަލް ހިރިގާގެ ފަށެއް، 2016 ގެ ޖަނަވަރީގައި ފޮޓޯ ނަގާފައި.
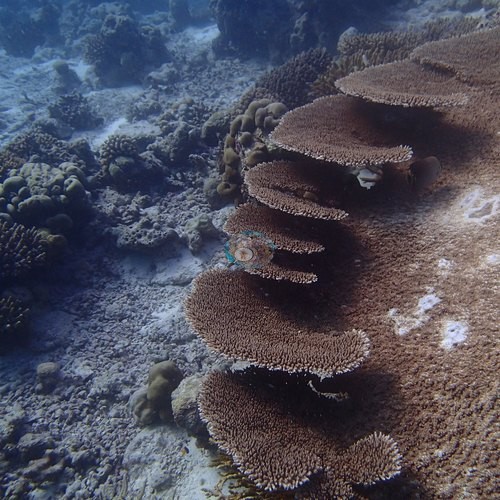 photo: Maldives - Four Seasons Landaa Giraavaru
 - މި ޔުނިޓުގައި ފޮޓޯއިން ހޯދި ނިވާކުރާ މިންވަރުގެ އެންމެ މަތީ އިންޑެކްސް، 44.5%، ހުރީ Gaagandufaruhuraa ގައެވެ.
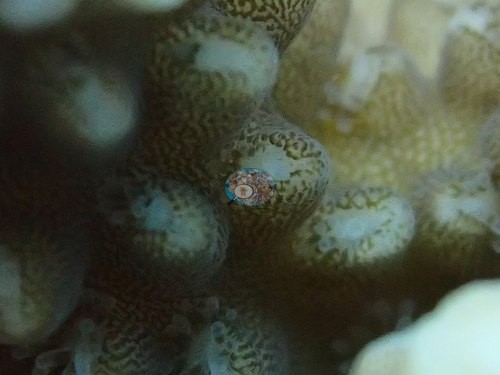 photo: Maldives - Gaagandufaruhuraa
 - ފޮޓޯ ނަގާފައިވާ ހުރިހާ ސައިޓެއް ވެސް 2016 ގެ ޖަނަވަރީގެ މޮނިޓަރިންގ ބޭސްލައިނެއް ކަމުގައި ވާއިރު، އެ ސައިޓްތަކުގެ ކޮލޯނީތައް ޓެގްކޮށް ރޫލަރުން މިނިފައިވެއެވެ.
- Kihavah ގެ ބޭރު ފާރުގައި ރީނދޫ ސޮފްޓް ކޯރަލް ހުރެއެވެ؛ ފާހަގަތައް ހުރި ޓޭބަލް ހިރިގާގެ ދަށުގައި crown-of-thorns ސްޓާފިޝްއެއްގެ ފޮޓޯ ނަގާފައިވެއެވެ.
- ހާ އަލިފު، ނޫނު، ރާ، އަދި ޅަވިޔަނީގެ ސައިޓް ފޮޓޯ އަދި ނެތެވެ.
Notable observations
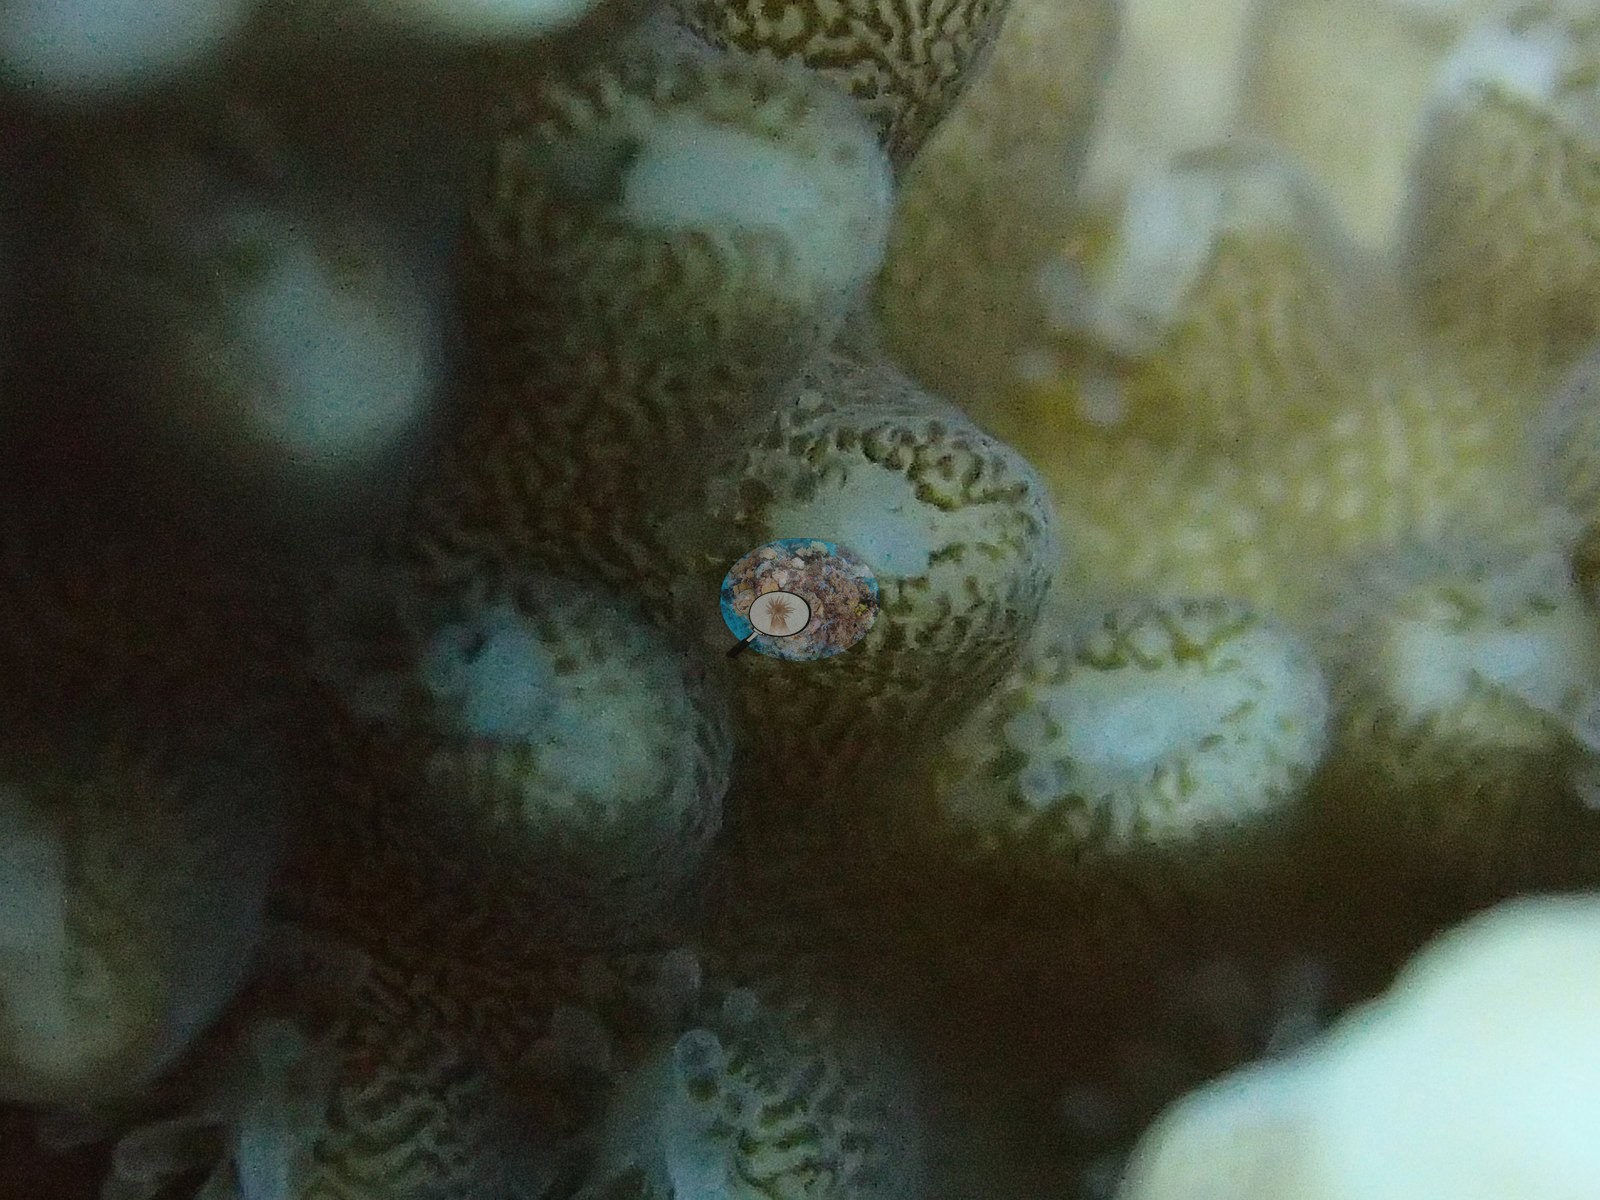
- Maldives - Anantara Kihavah house reef & Golden Wall: crown-of-thorns starfish (COTS): a crown-of-thorns starfish out on the rubble below a couple of table corals bearing its stark white feeding scars (January 2016).
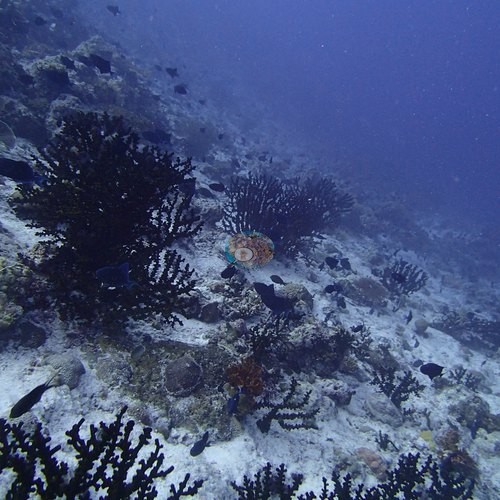
- Maldives - Baa Atoll (Hanifaru): Bleaching: scattered bone-white branch tips among the tagged colonies at site 10, 'the first hint of trouble' (January 2016).
Coral cover over time (pooled)
Sites in this region
- Maldives - Anantara Kihavah house reef & Golden Wall — 17% coral cover
- Maldives - Baa Atoll (Hanifaru) — 27% coral cover
- Maldives - Four Seasons Landaa Giraavaru — 37% coral cover
- Maldives - Gaagandufaruhuraa — 45% coral cover
- Maldives - Kashidhoo Faru — 26% coral cover
- Maldives - Raa Atoll
Nearby external survey stations
25 independent survey records within 5 km of a site in this region (deduplicated across sites).
Show all 25 records
- Coral Reef CPR — Huruvahli (Raa) (2016): 49% hard coral cover
- Coral Reef CPR — Huruvahli NW (Raa) (2016): 20% hard coral cover
- Coral Reef CPR — Huruvahli SW (Raa) (2016): 20% hard coral cover
- Coral Reef CPR — Huruvahli lagoon (Raa) (2016): 62% hard coral cover
- Coral Reef CPR — Villingili (Raa) (2016): 39% hard coral cover
- Coral Reef CPR — Villingili (Raa) (2016): 38% hard coral cover
- Reef Check — LGT1 (2007): 27% hard coral cover, 0.27 km from Maldives - Four Seasons Landaa Giraavaru
- Reef Check — LGT1 (2008): 44% hard coral cover, 0.27 km from Maldives - Four Seasons Landaa Giraavaru
- Reef Check — LGT1 (2009): 29% hard coral cover, 0.27 km from Maldives - Four Seasons Landaa Giraavaru
- Reef Check — LGT1 (2009): 35% hard coral cover, 0.27 km from Maldives - Four Seasons Landaa Giraavaru
- Reef Check — LGT2 (2007): 25% hard coral cover, 0.25 km from Maldives - Four Seasons Landaa Giraavaru
- Reef Check — LGT2 (2008): 48% hard coral cover, 0.25 km from Maldives - Four Seasons Landaa Giraavaru
- Reef Check — LGT2 (2008): 37% hard coral cover, 0.26 km from Maldives - Four Seasons Landaa Giraavaru
- Reef Check — LGT2 (2009): 40% hard coral cover, 0.25 km from Maldives - Four Seasons Landaa Giraavaru
- Reef Check — LGT3 (2007): 21% hard coral cover, 0.21 km from Maldives - Four Seasons Landaa Giraavaru
- Reef Check — LGT3 (2008): 36% hard coral cover, 0.21 km from Maldives - Four Seasons Landaa Giraavaru
- Reef Check — LGT3 (2009): 32% hard coral cover, 0.21 km from Maldives - Four Seasons Landaa Giraavaru
- Reef Check — LGT3 (2009): 29% hard coral cover, 0.21 km from Maldives - Four Seasons Landaa Giraavaru
- Reef Check — LGT4 (2007): 10% hard coral cover, 0.18 km from Maldives - Four Seasons Landaa Giraavaru
- Reef Check — LGT4 (2007): 14% hard coral cover, 0.18 km from Maldives - Four Seasons Landaa Giraavaru
- Reef Check — LGT4 (2008): 16% hard coral cover, 0.18 km from Maldives - Four Seasons Landaa Giraavaru
- Reef Check — LGT4 (2009): 21% hard coral cover, 0.18 km from Maldives - Four Seasons Landaa Giraavaru
- ReefCloud — Kendhoo (2011): 21% hard coral cover, 4.96 km from Maldives - Baa Atoll (Hanifaru)
- ReefCloud — Kendhoo (2012): 19% hard coral cover, 4.96 km from Maldives - Baa Atoll (Hanifaru)
- ReefCloud — Kendhoo (2016): 13% hard coral cover, 4.96 km from Maldives - Baa Atoll (Hanifaru)
All images from Coral Reef Diagnostics. Data are from Coral Reef Diagnostics and Reef Check Foundation.
 © Coral Reef Diagnostics.
References
- Souter D, et al. (eds) (2021) Status of Coral Reefs of the World: 2020. International Coral Reef Initiative / Global Coral Reef Monitoring Network. [PDF]
- Spalding MD, et al. (2001) World Atlas of Coral Reefs. University of California Press, Berkeley. [PDF]
- Wilkinson C (2006) Status of coral reefs of the world: summary of threats and remedial action. In: Côté IM, Reynolds JD (eds) Coral Reef Conservation. Cambridge University Press, Cambridge. [PDF]