
Maldives - Baa Atoll site 9
Part of the regional summaries: Maldives - North (Haa Alif to Baa / Lhaviyani) and Maldives
More info
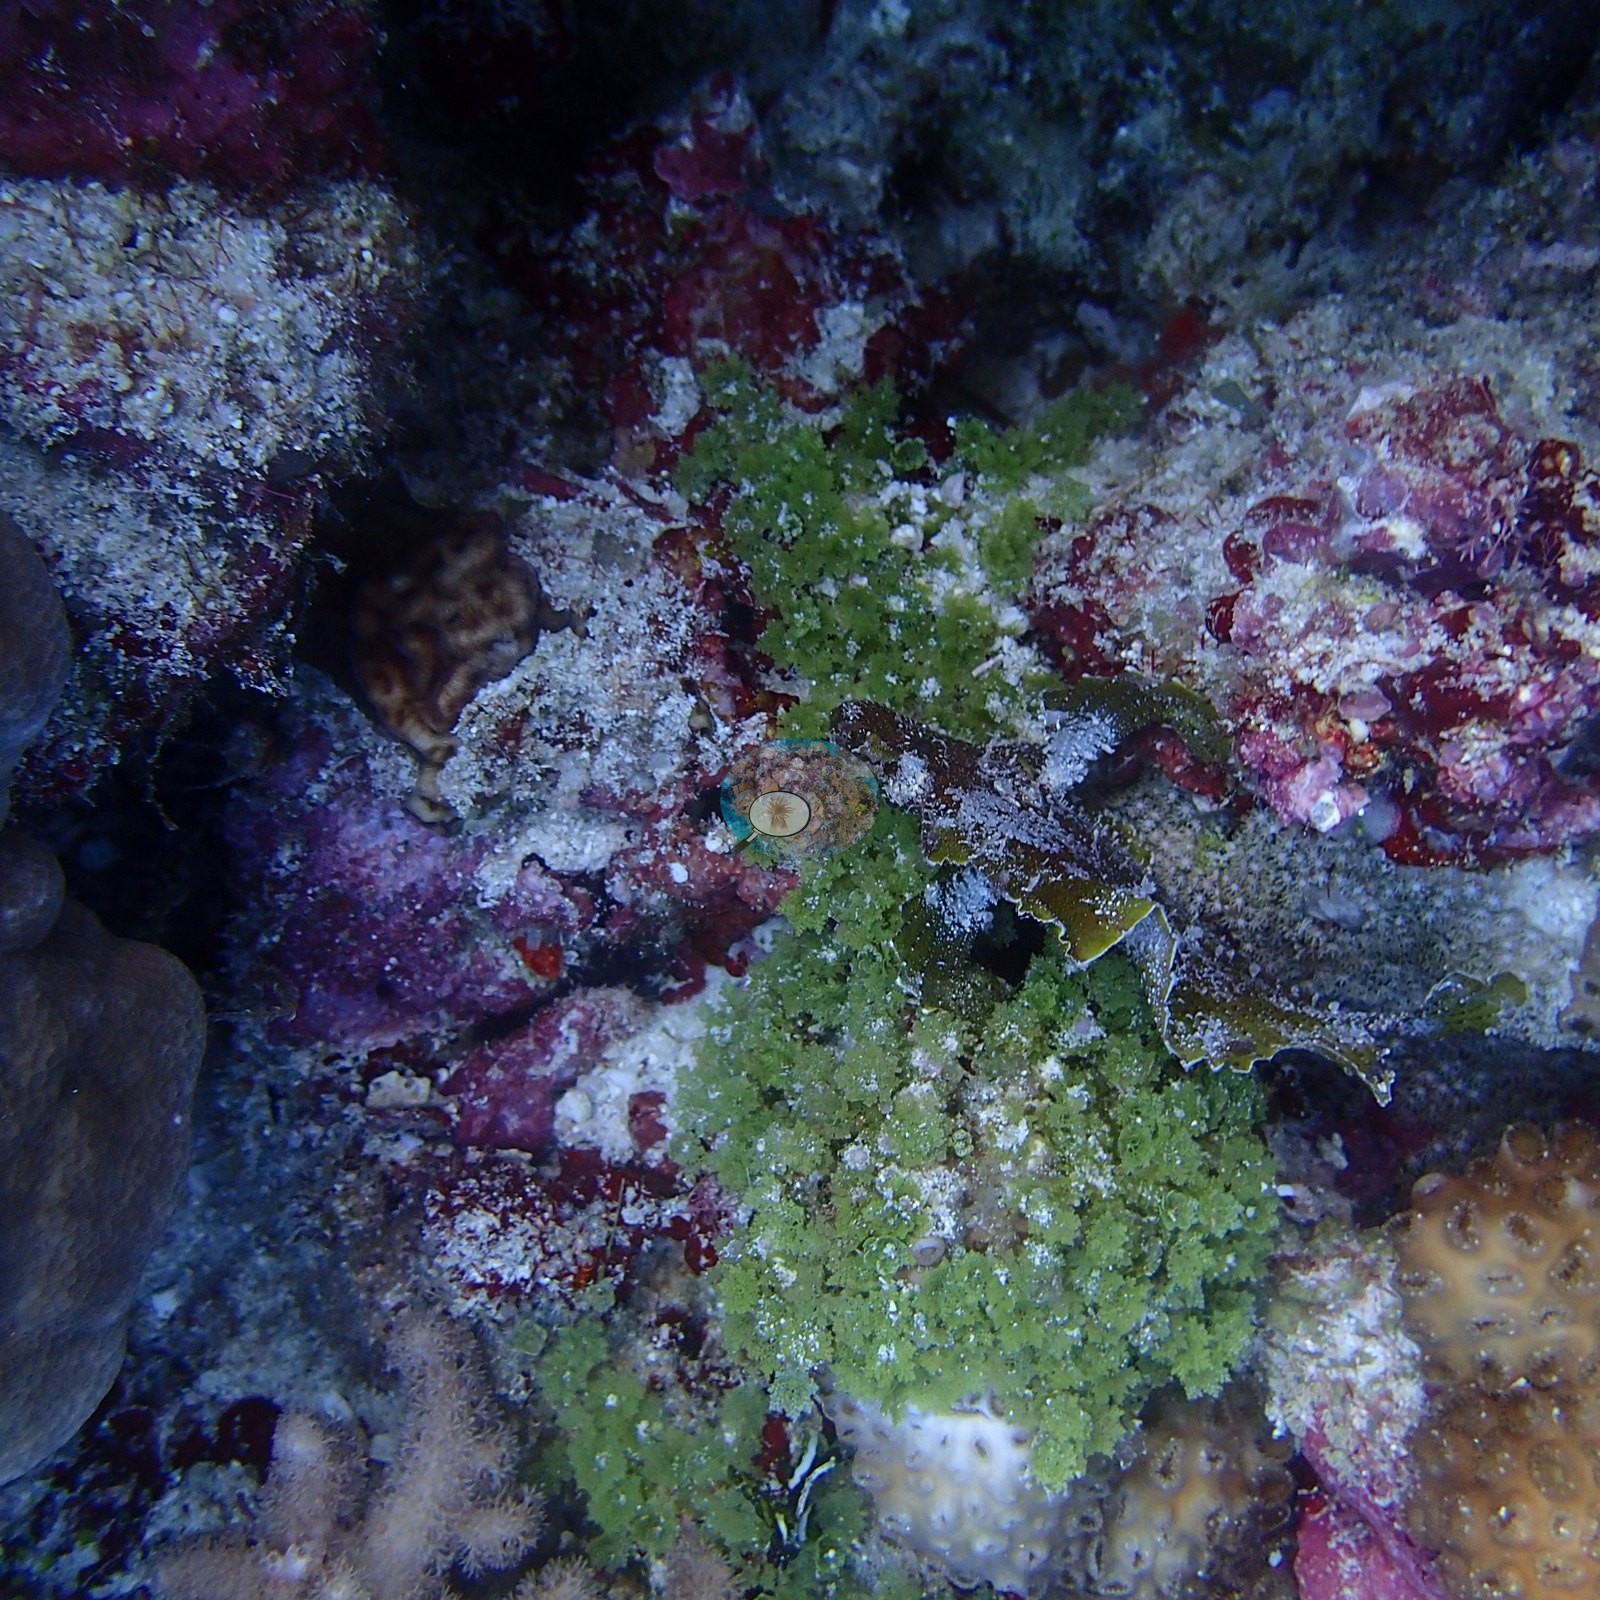
Maldives (NOAA CRW virtual station)A January 2016 Baa Atoll research dive (site 9) on a sheer vertical wall in crystal-clear water, with big Porites domes, rock crusted with pink coralline algae, and honeycomb faviids, where Anderson tagged and sampled colonies roughly three months before the 2016 El Niño bleaching event.
2016 ގެ ޖަނަވަރީގައި ބ. އަތޮޅު (Baa Atoll) ގައި ކުރި ދިރާސާގެ ފީނުމެކެވެ (site 9). މި ފީނުނީ ވަރަށް ސާފު ފެނެއްގައި، ސީދާ ތިރިއަށް ދާ ފާރެއްގައެވެ. އެތަނުގައި ގުނބަޒުގެ ސިފައިގައިވާ ބޮޑެތި Porites، ފިޔާތޮށި ކުލައިގެ coralline algae އިން ނިވާވެފައިވާ ހިލަ، އަދި ހަނީކޯމް (honeycomb) ސިފައިގެ faviid ހިރިގާ ހުރިއެވެ. 2016 ގެ El Niño ހިރިގާ ހުދުވުމުގެ ހާދިސާއަށް ގާތްގަނޑަކަށް ތިން މަސް ކުރިން، Anderson މިތާގައި ކޮލޯނީތައް ޓެގްކޮށް ސާމްޕަލް ނެގިއެވެ.
AI translation of this summary; the English is authoritative. (low confidence)
One other CRD dive site with its own page within 5 km shown in orange — click a marker to open its page.
8 of the 11 photographs on this page are shown beside the text that discusses them under "Site description" below.
Site description
General benthic features
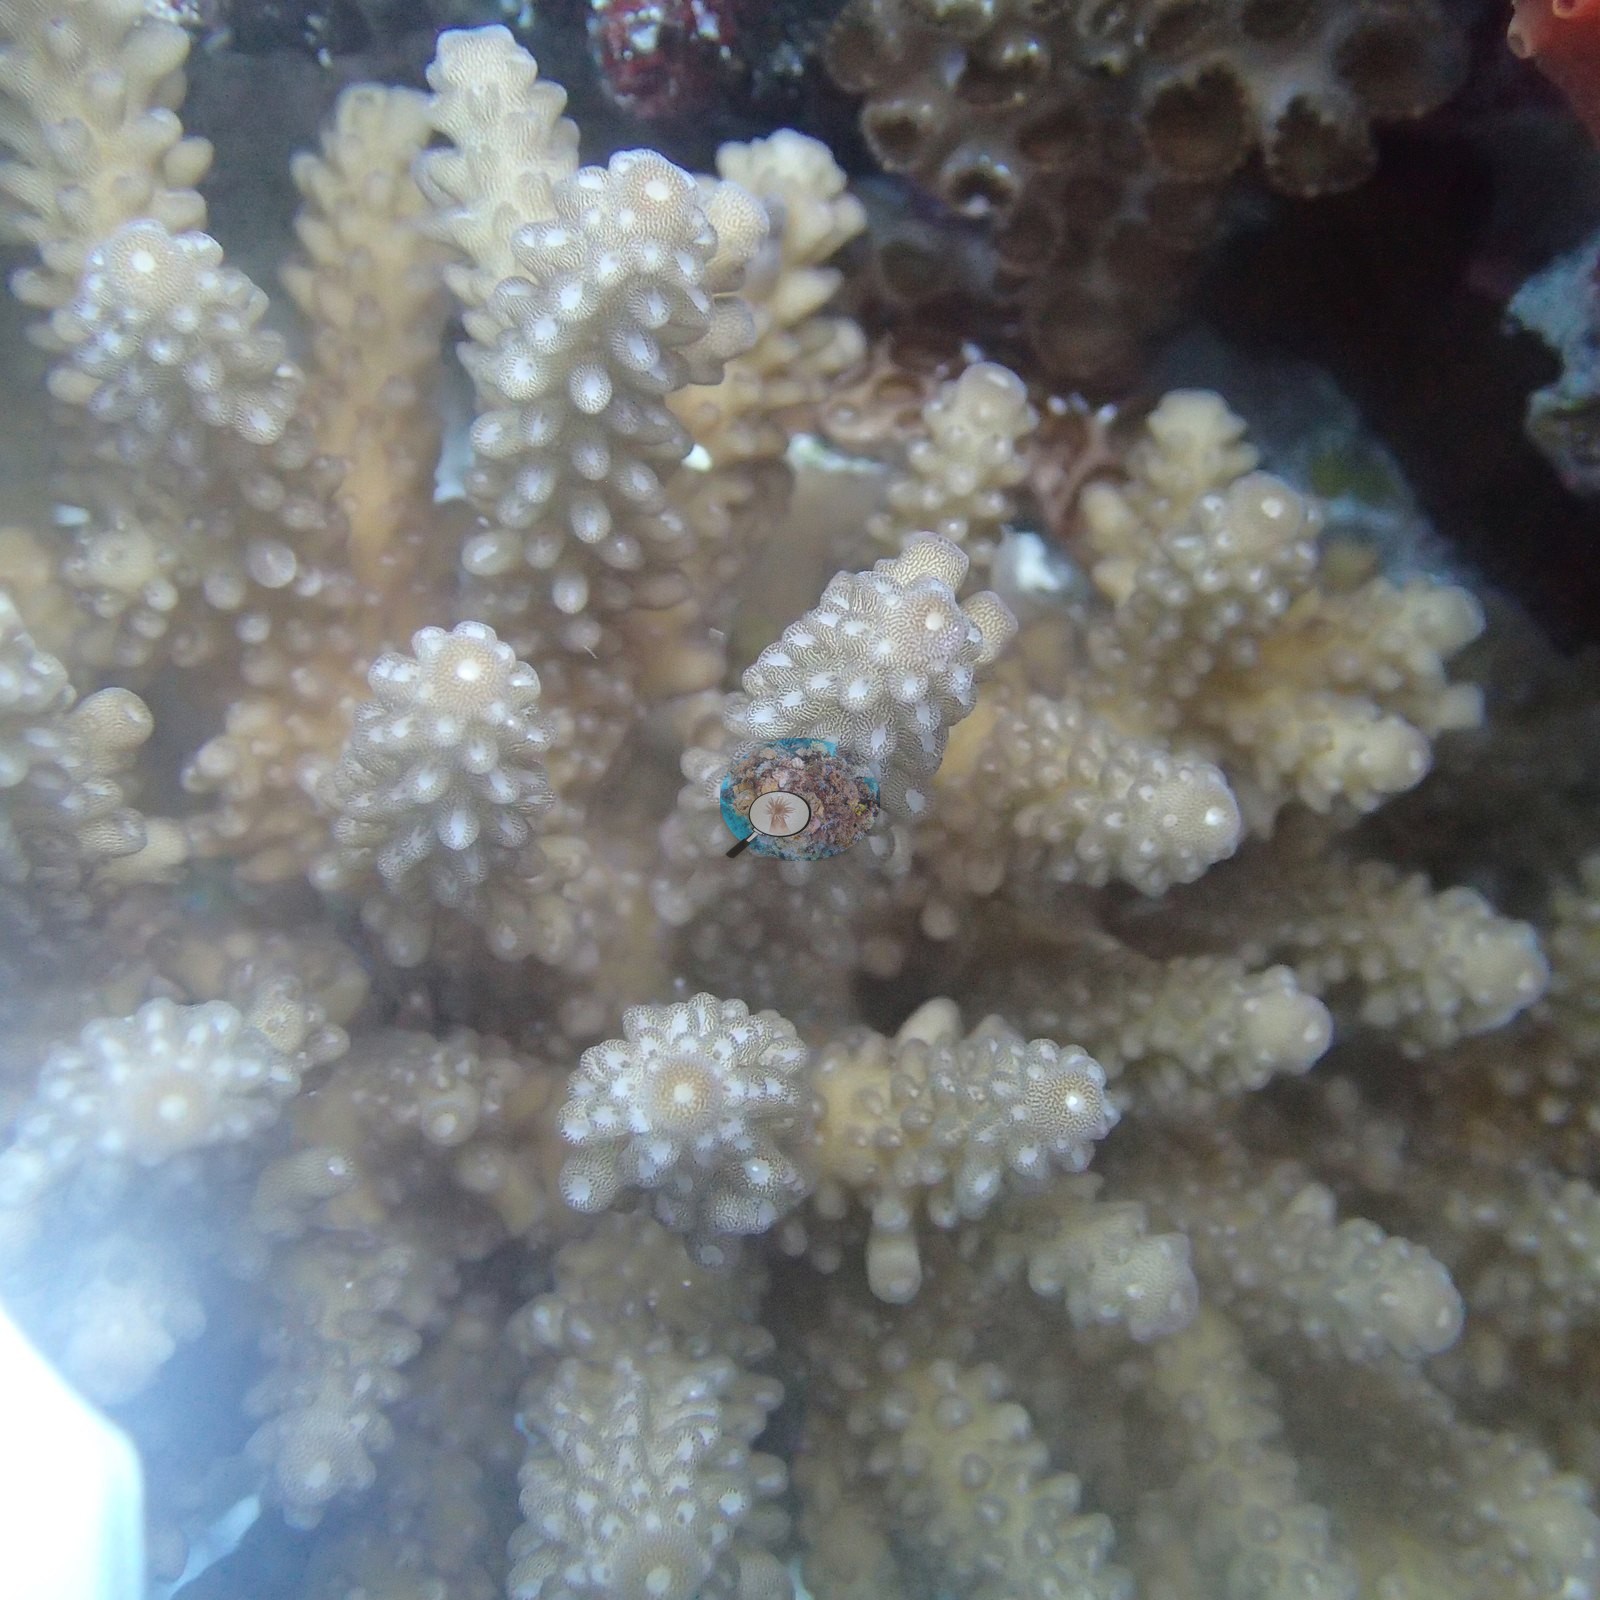
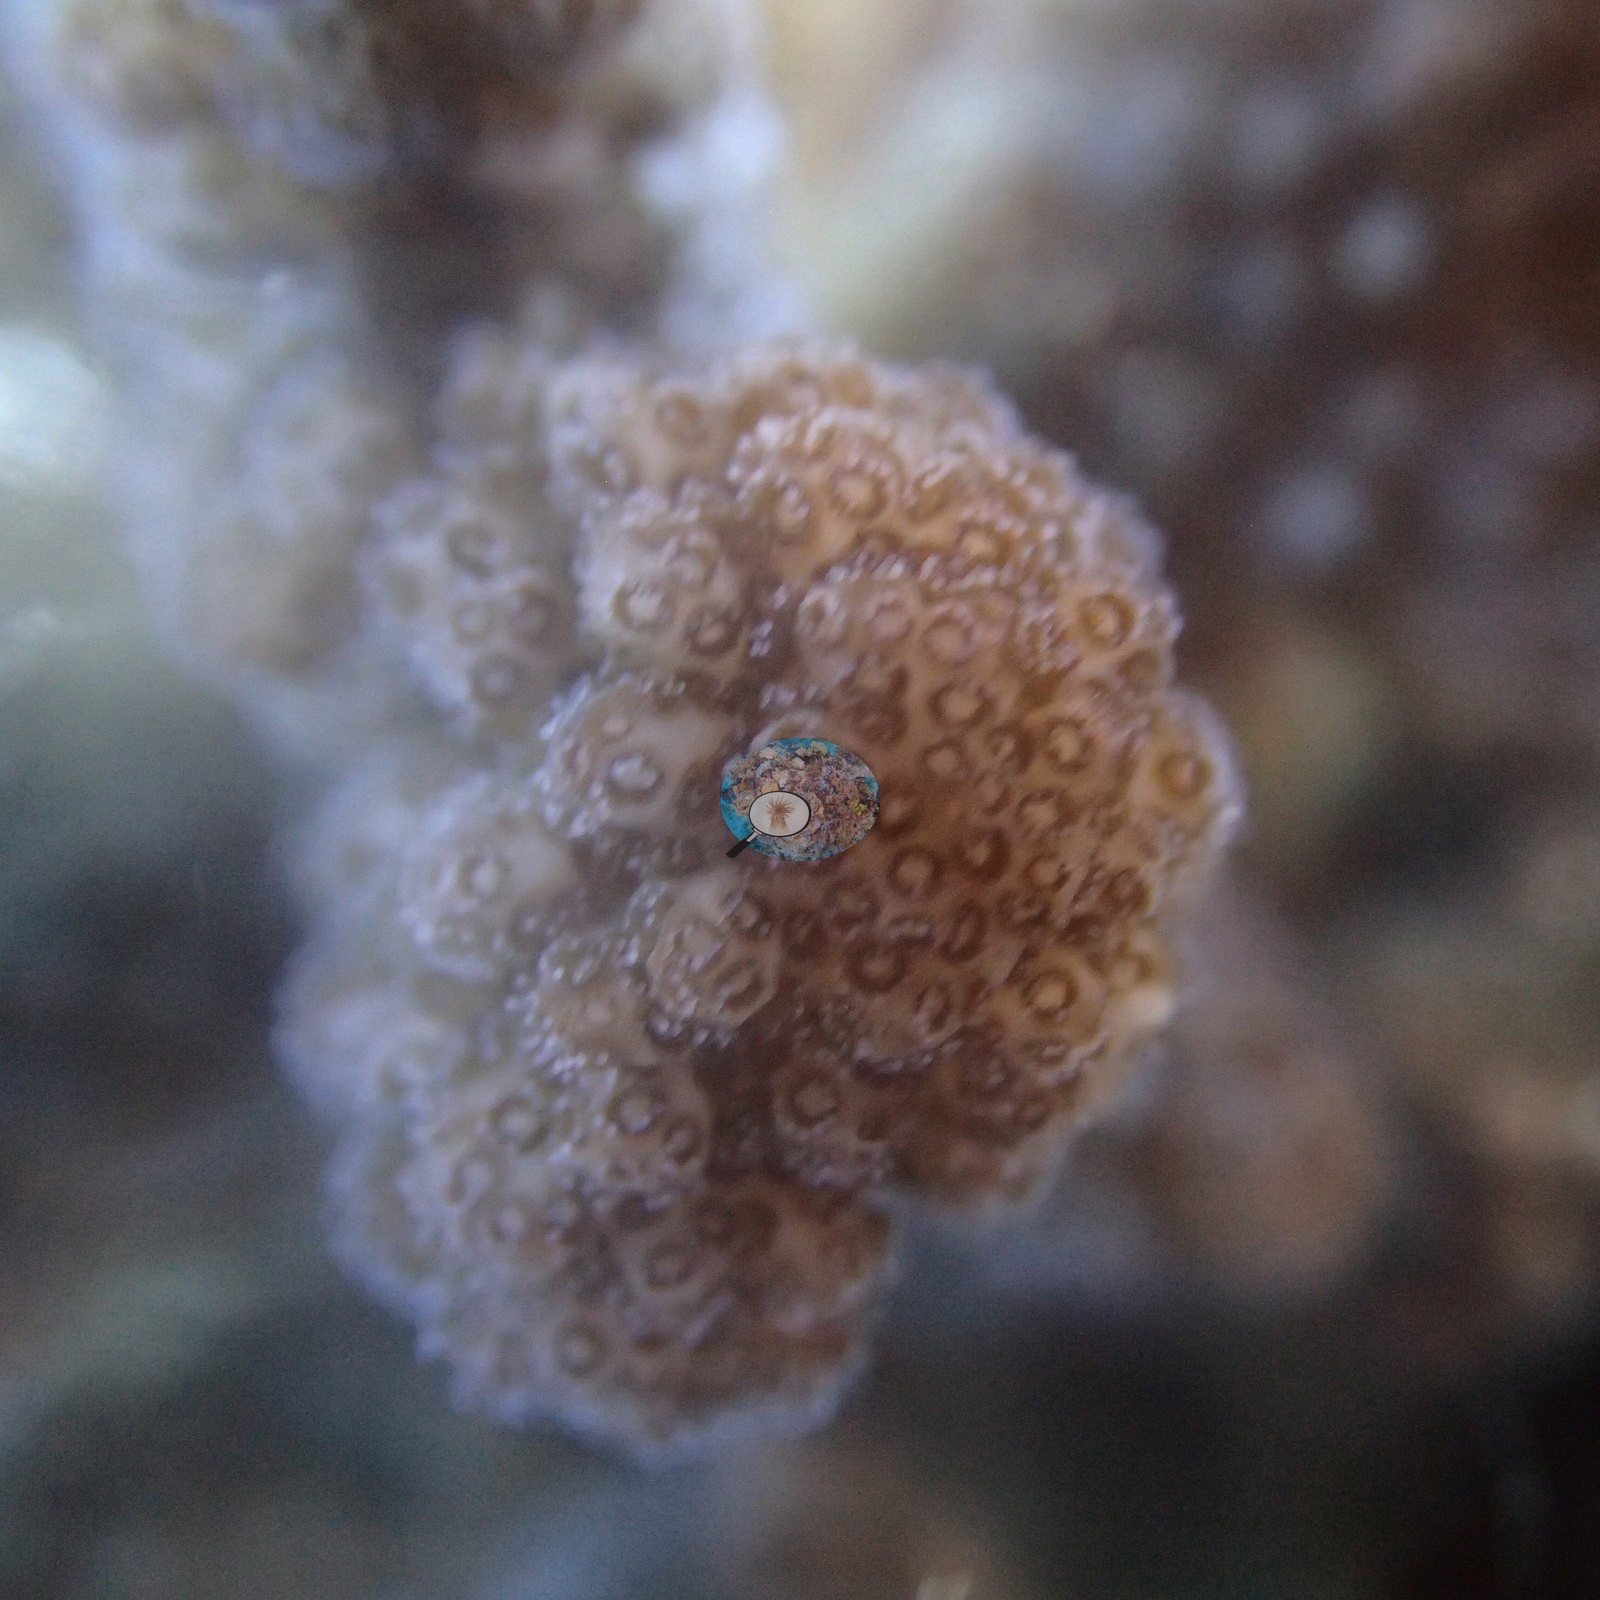
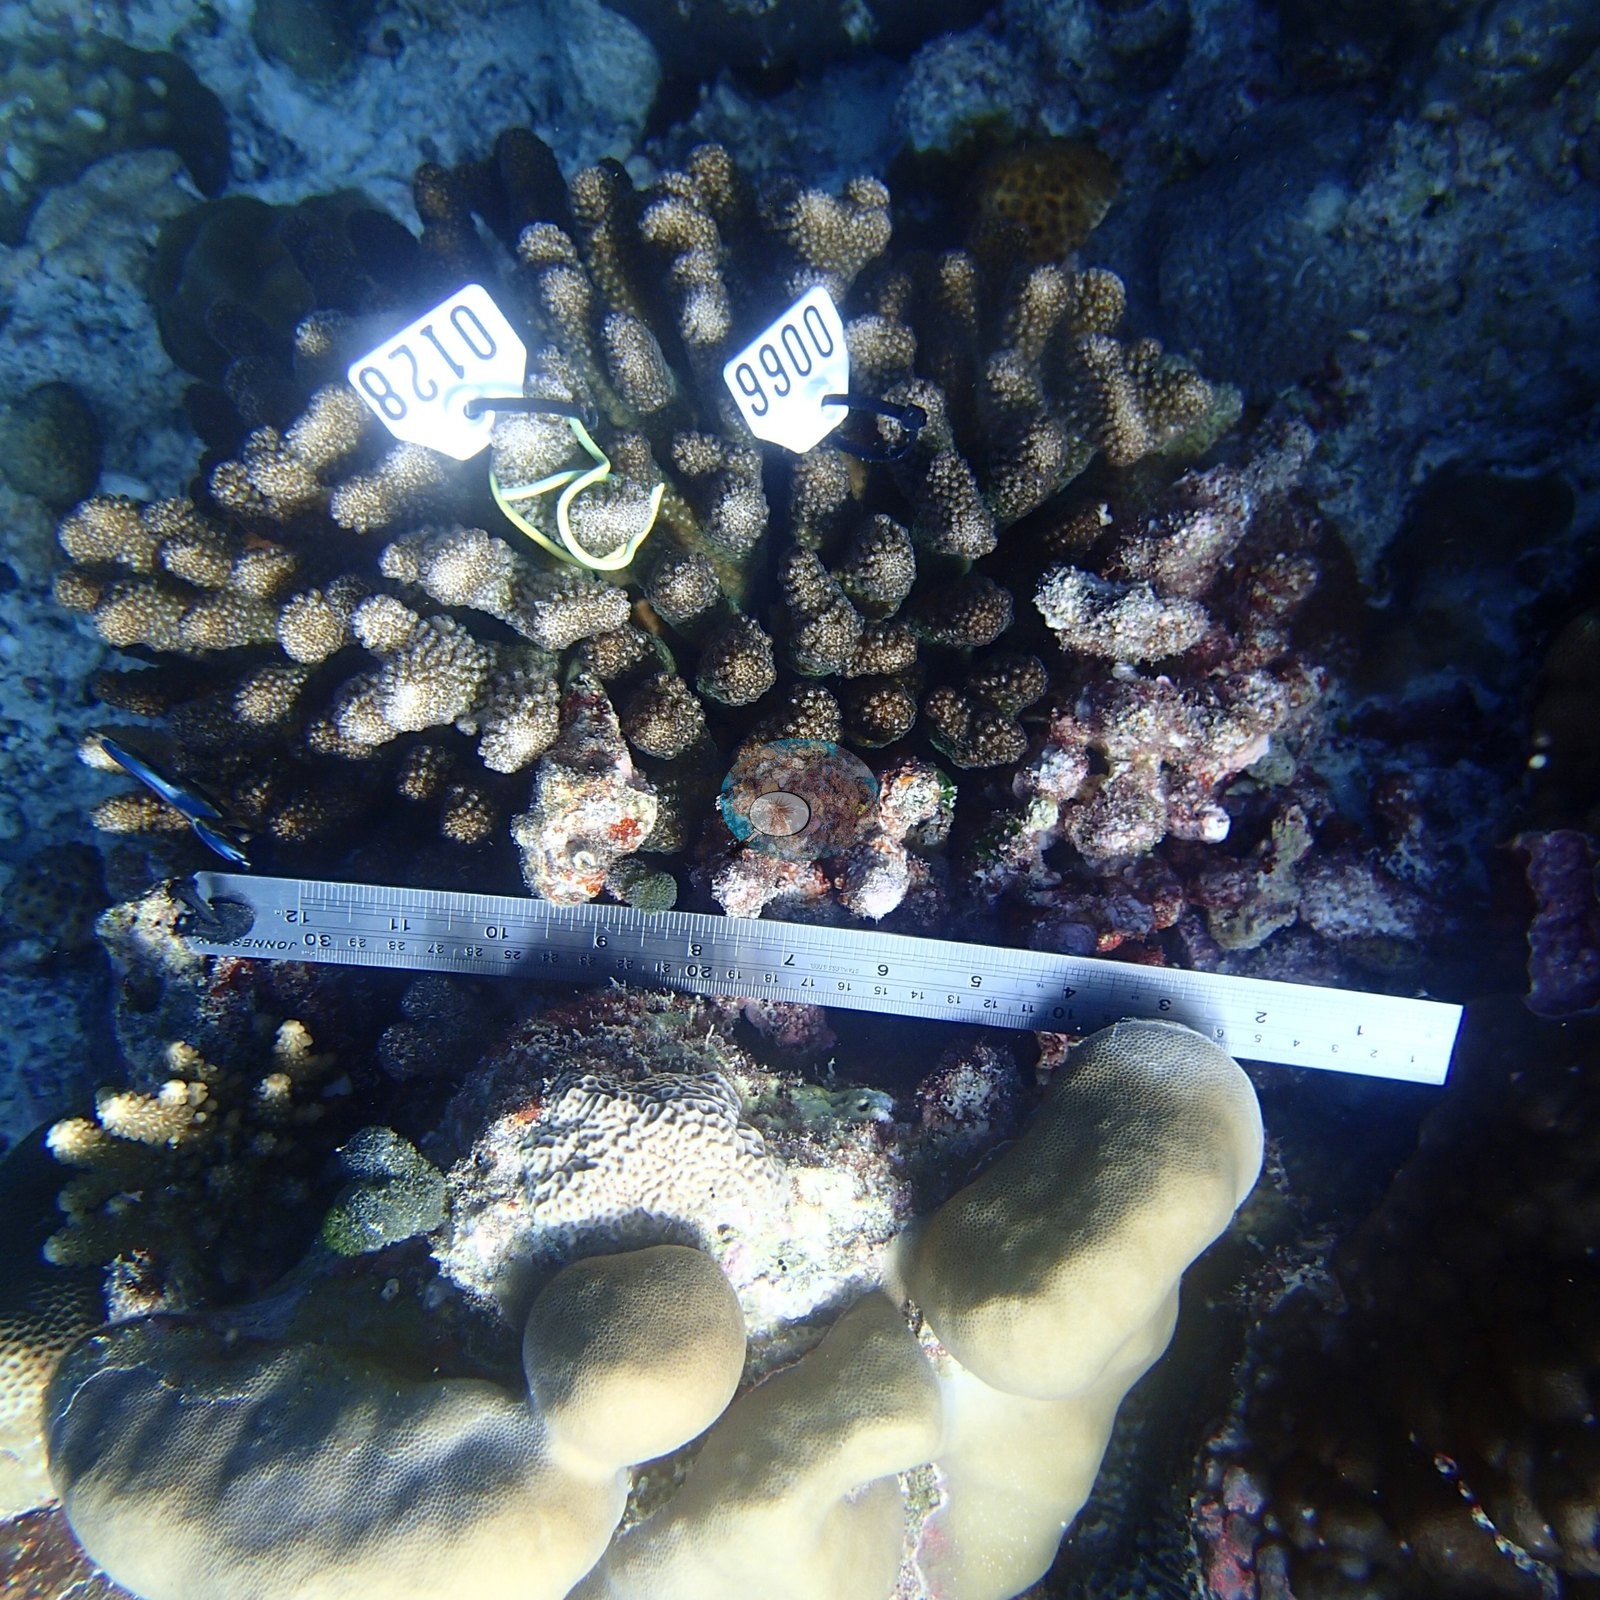
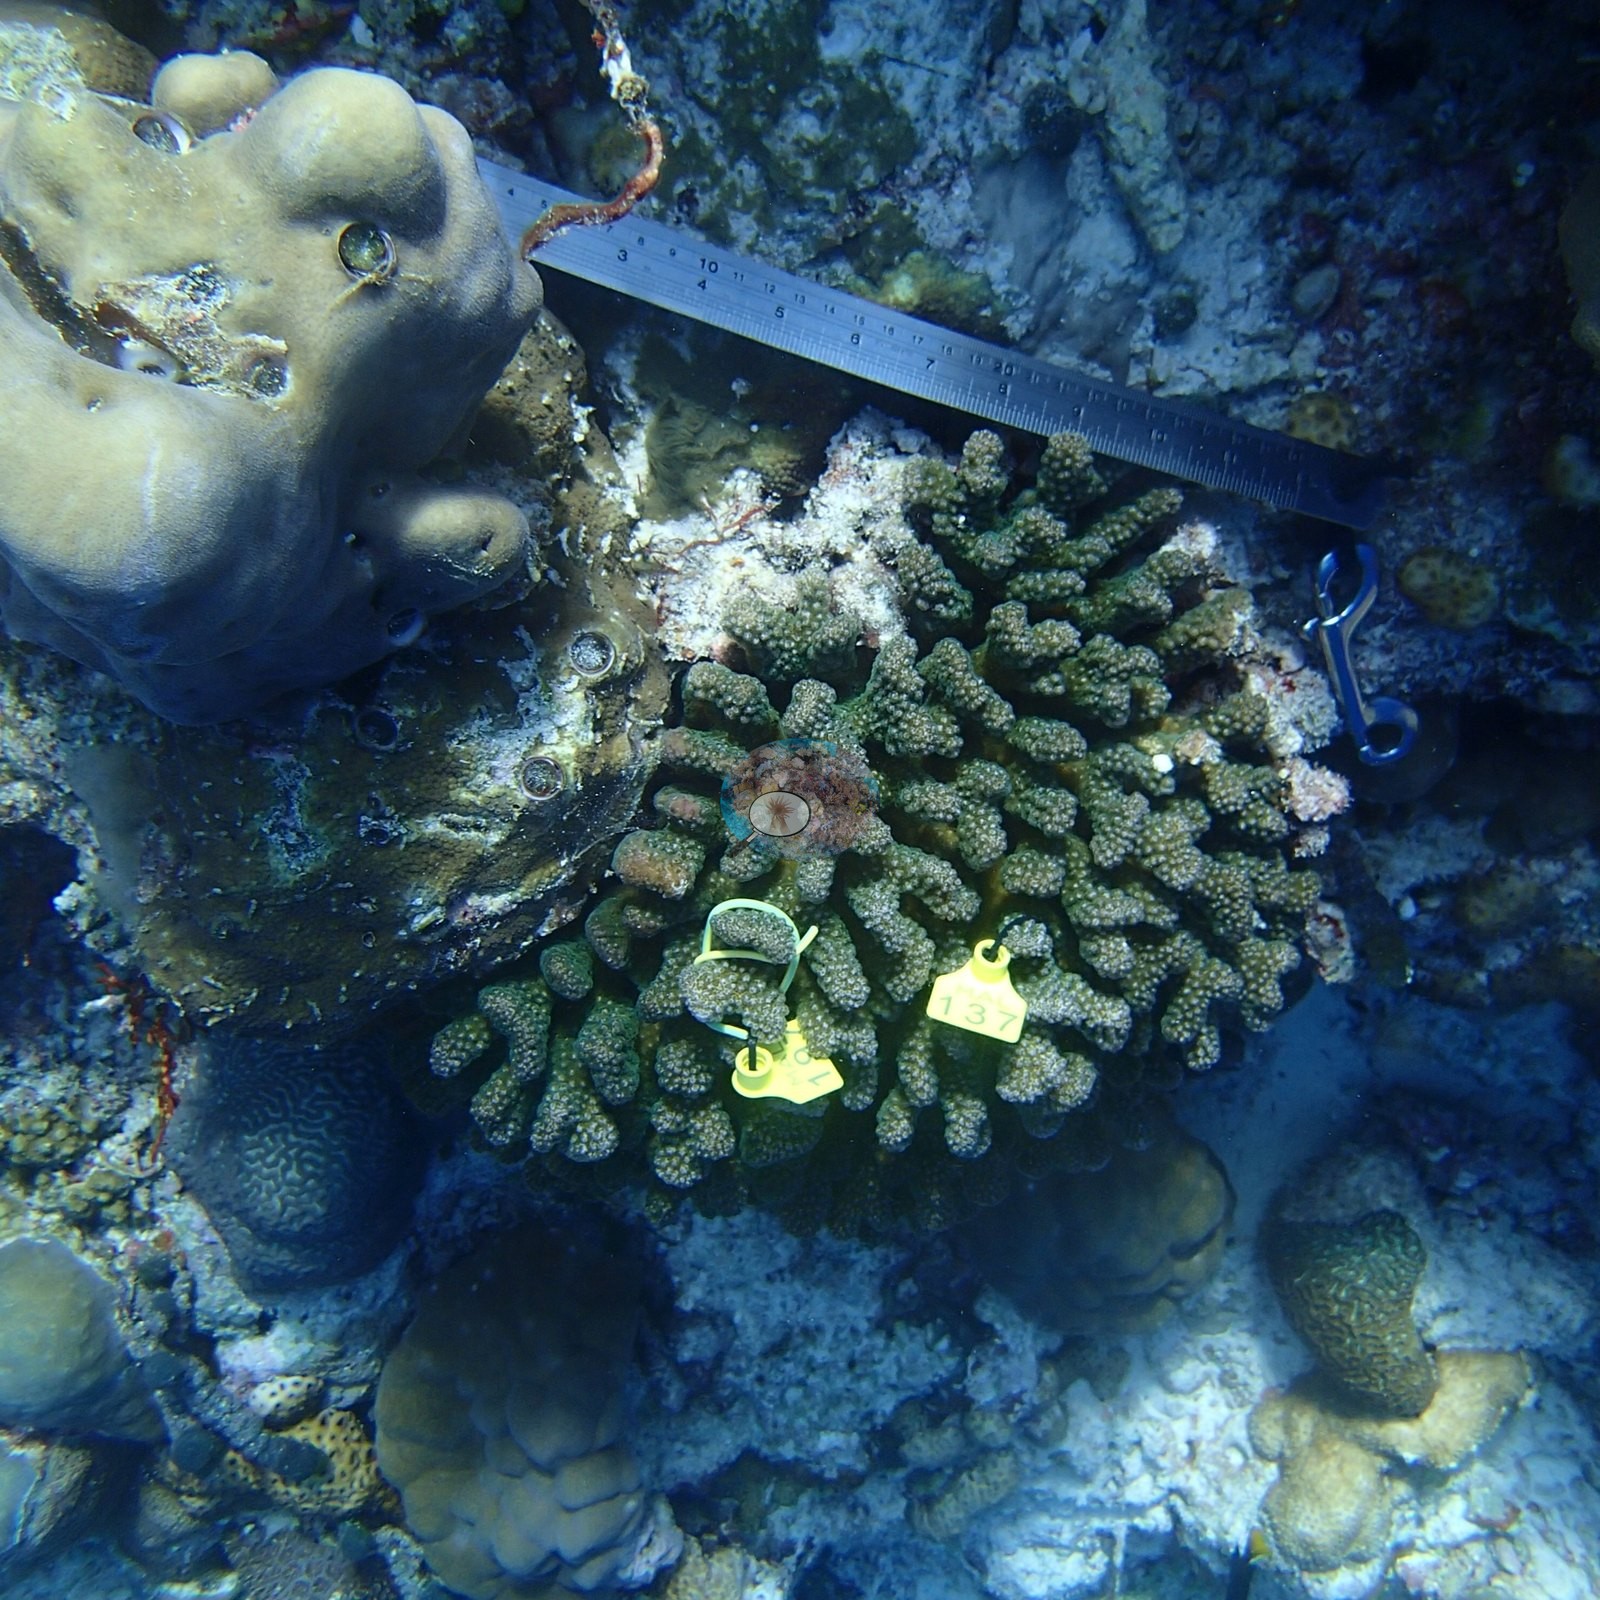
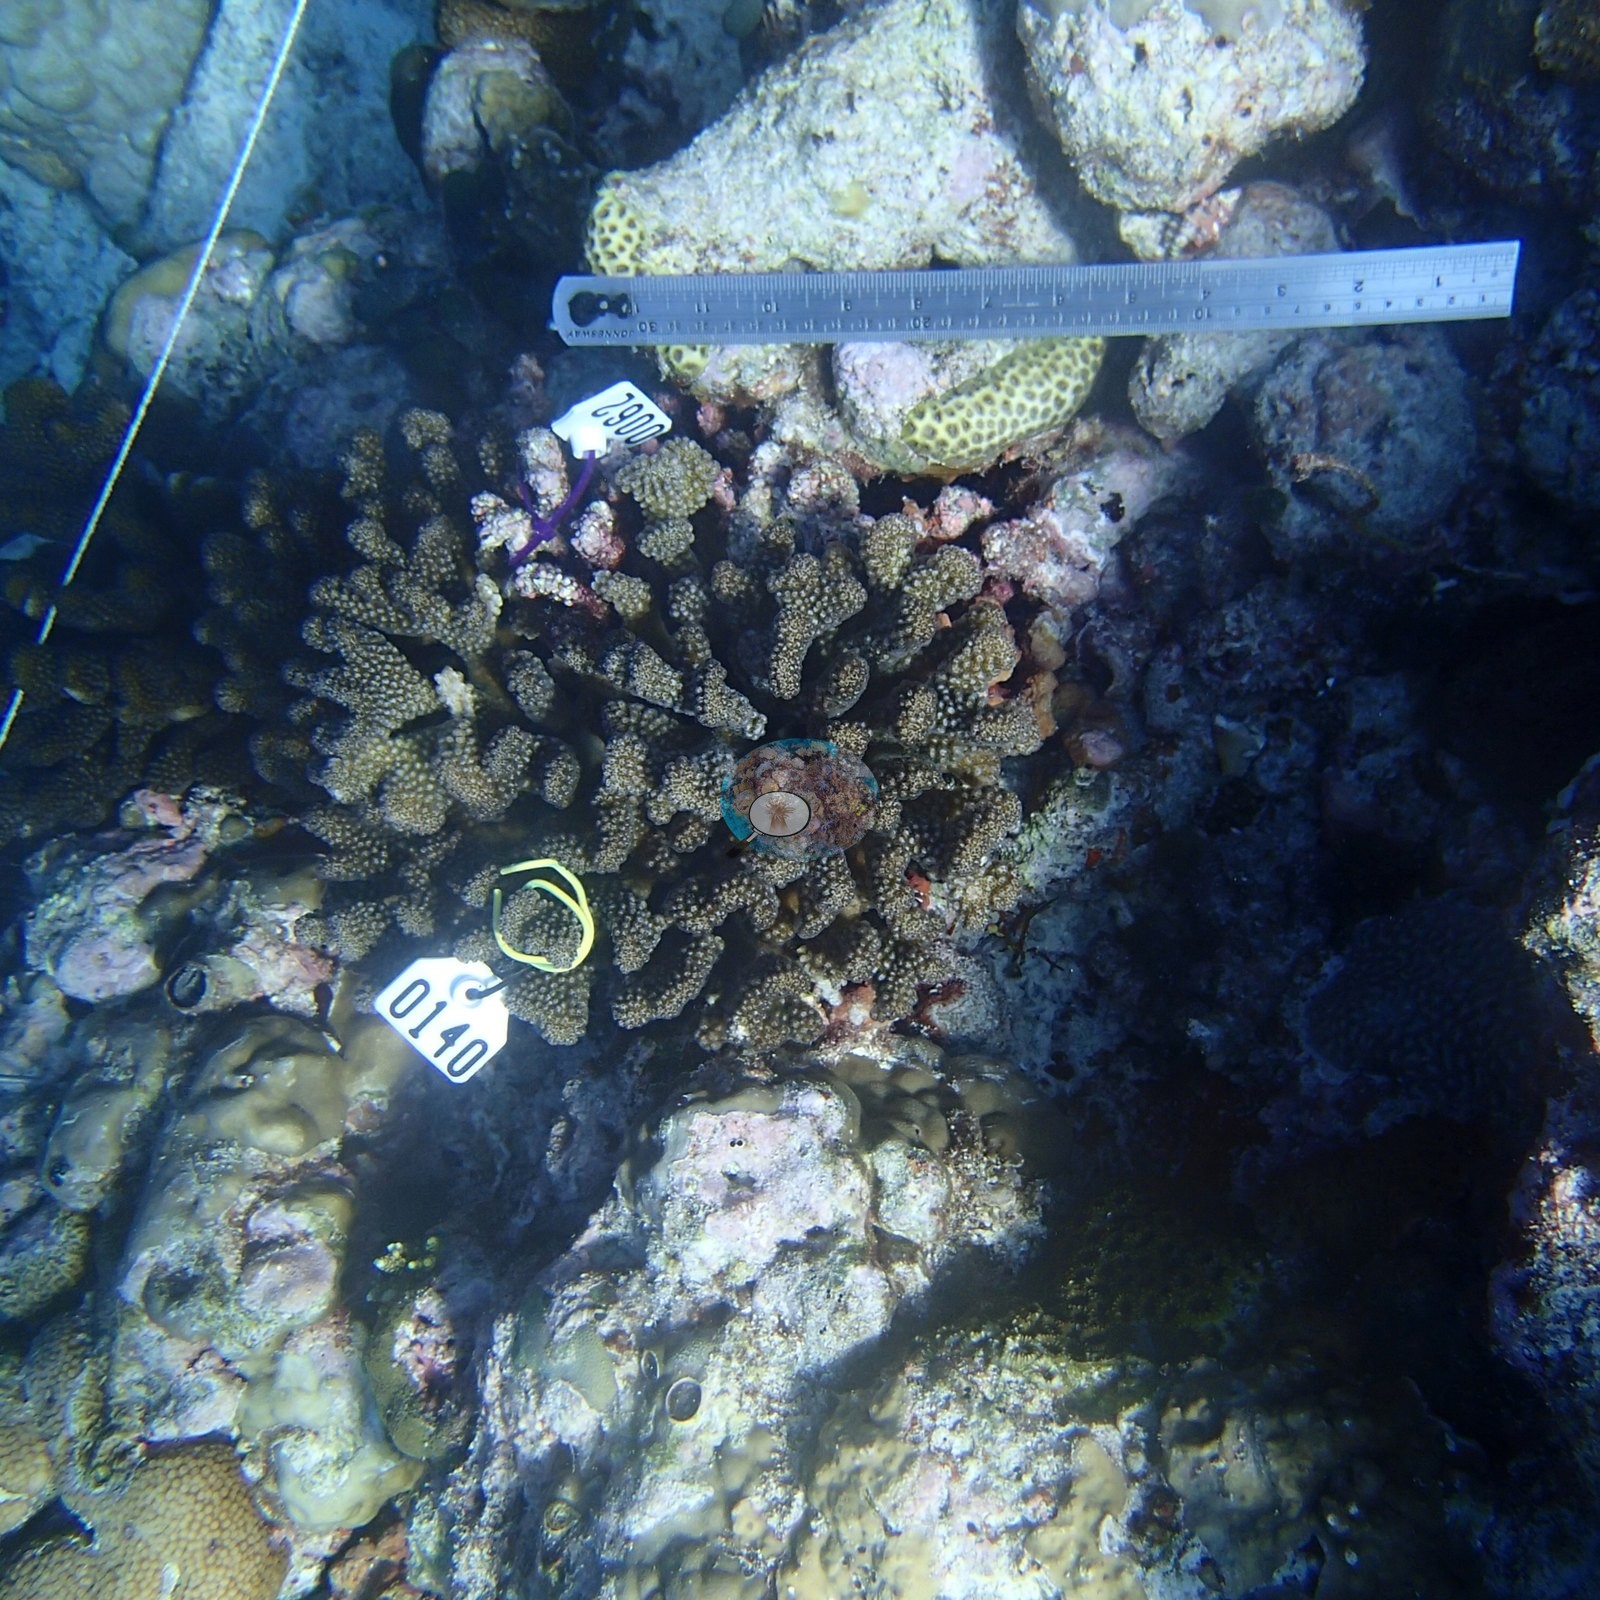
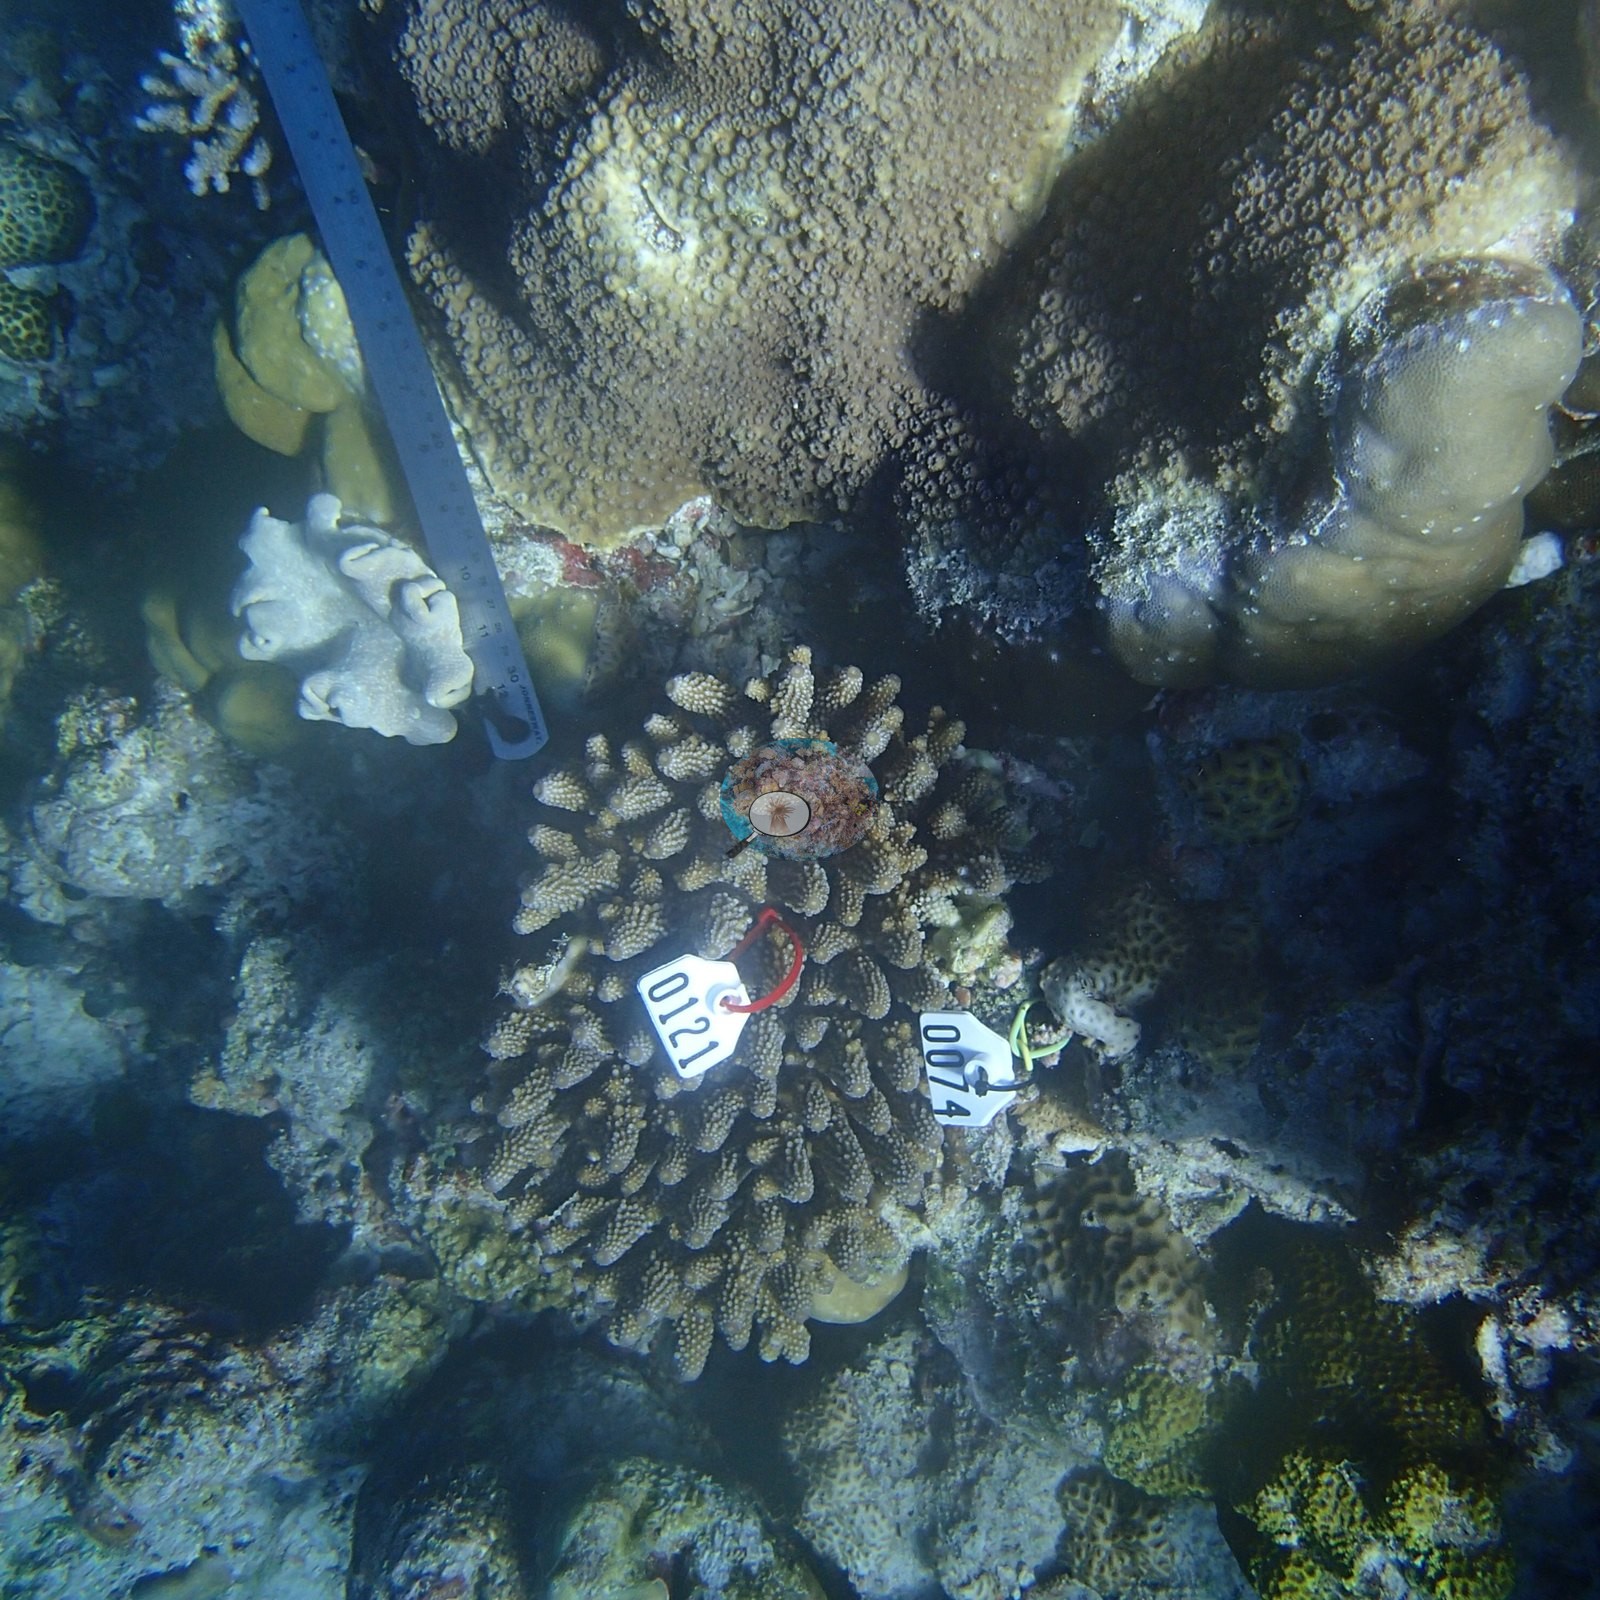
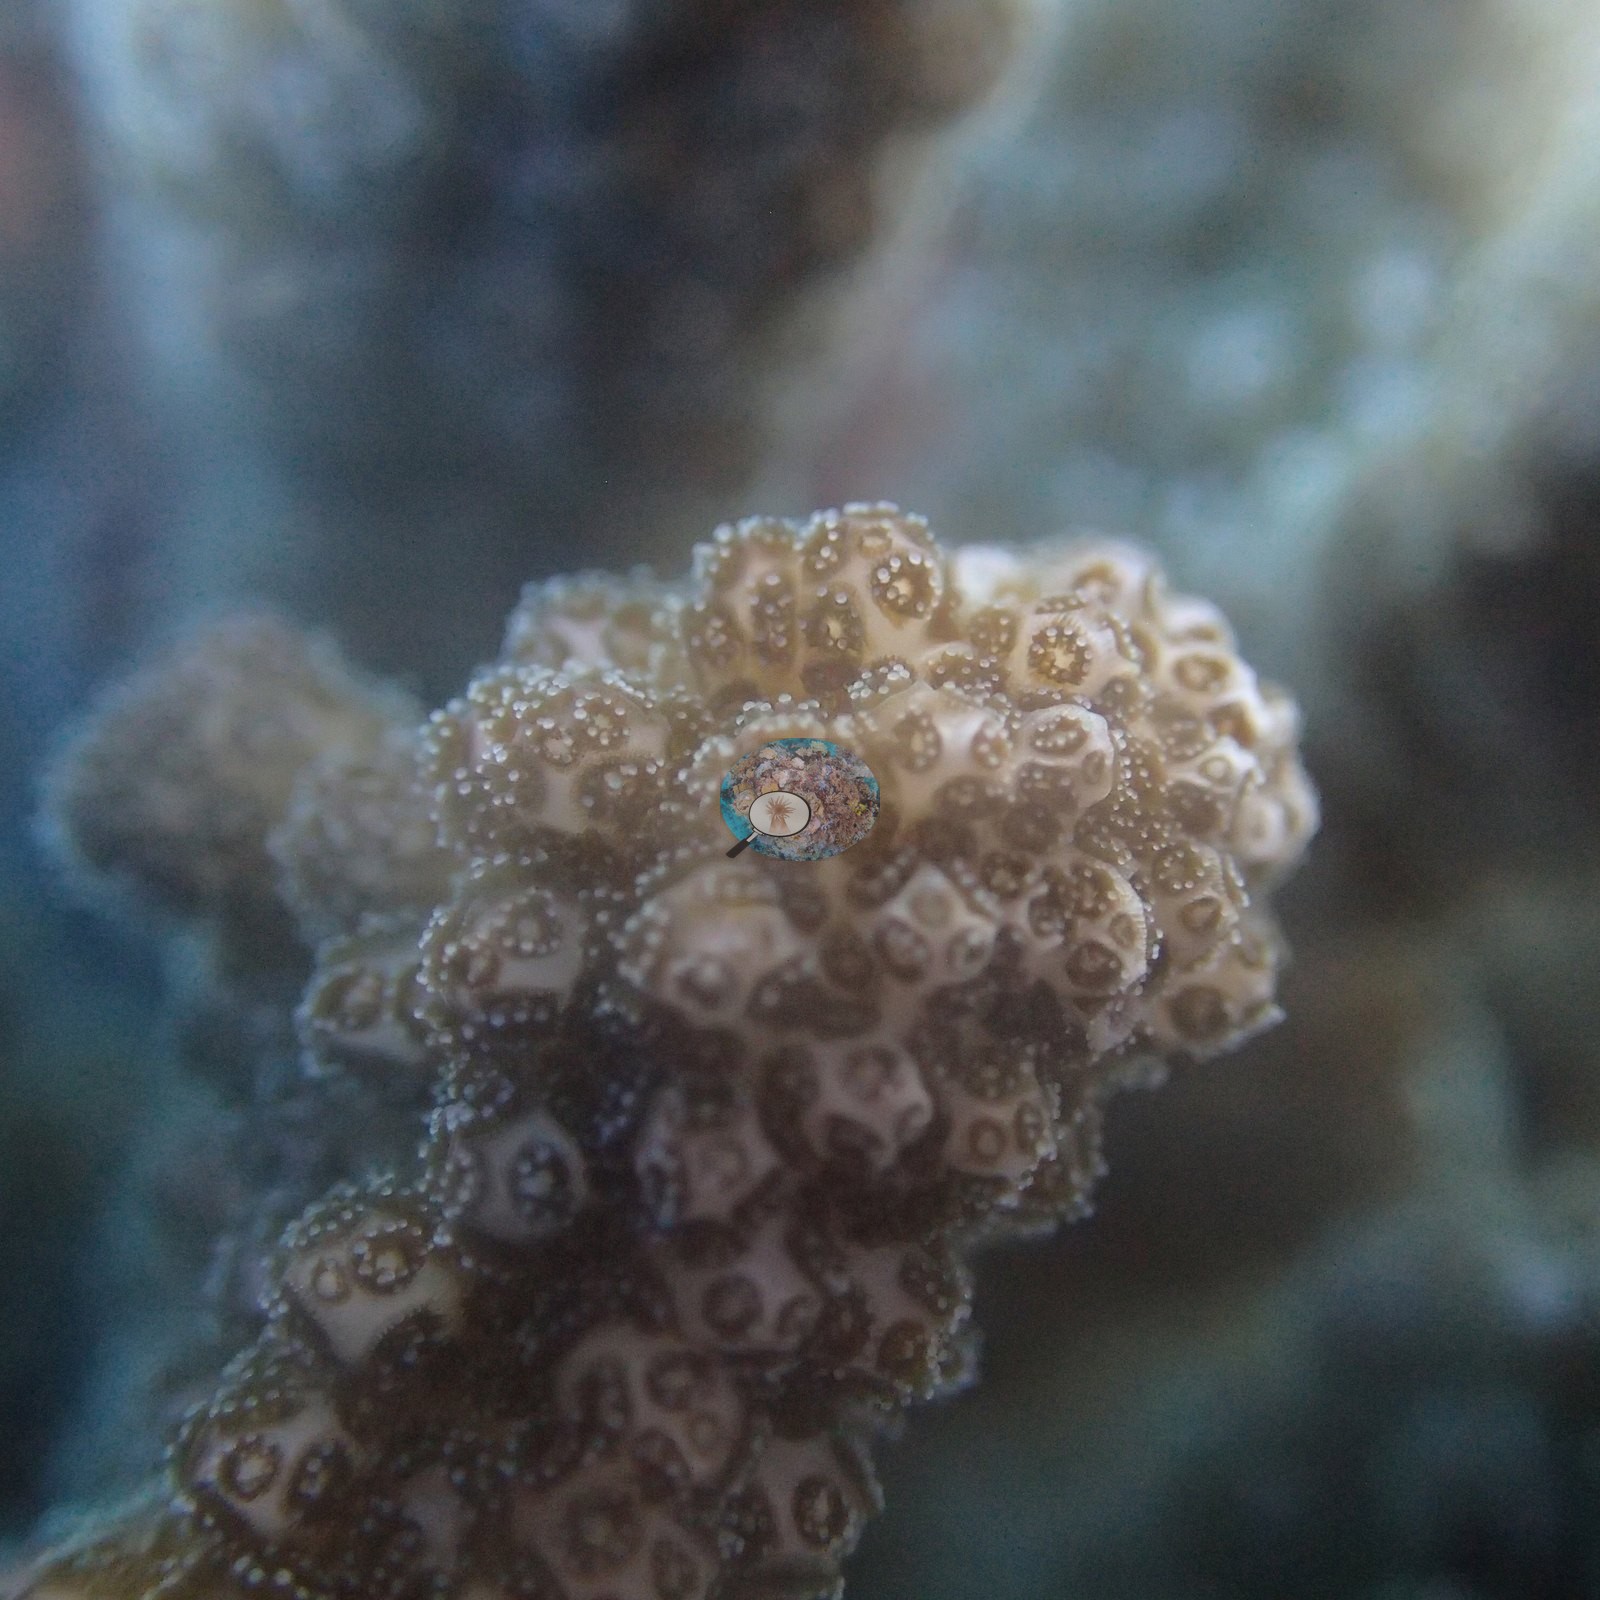
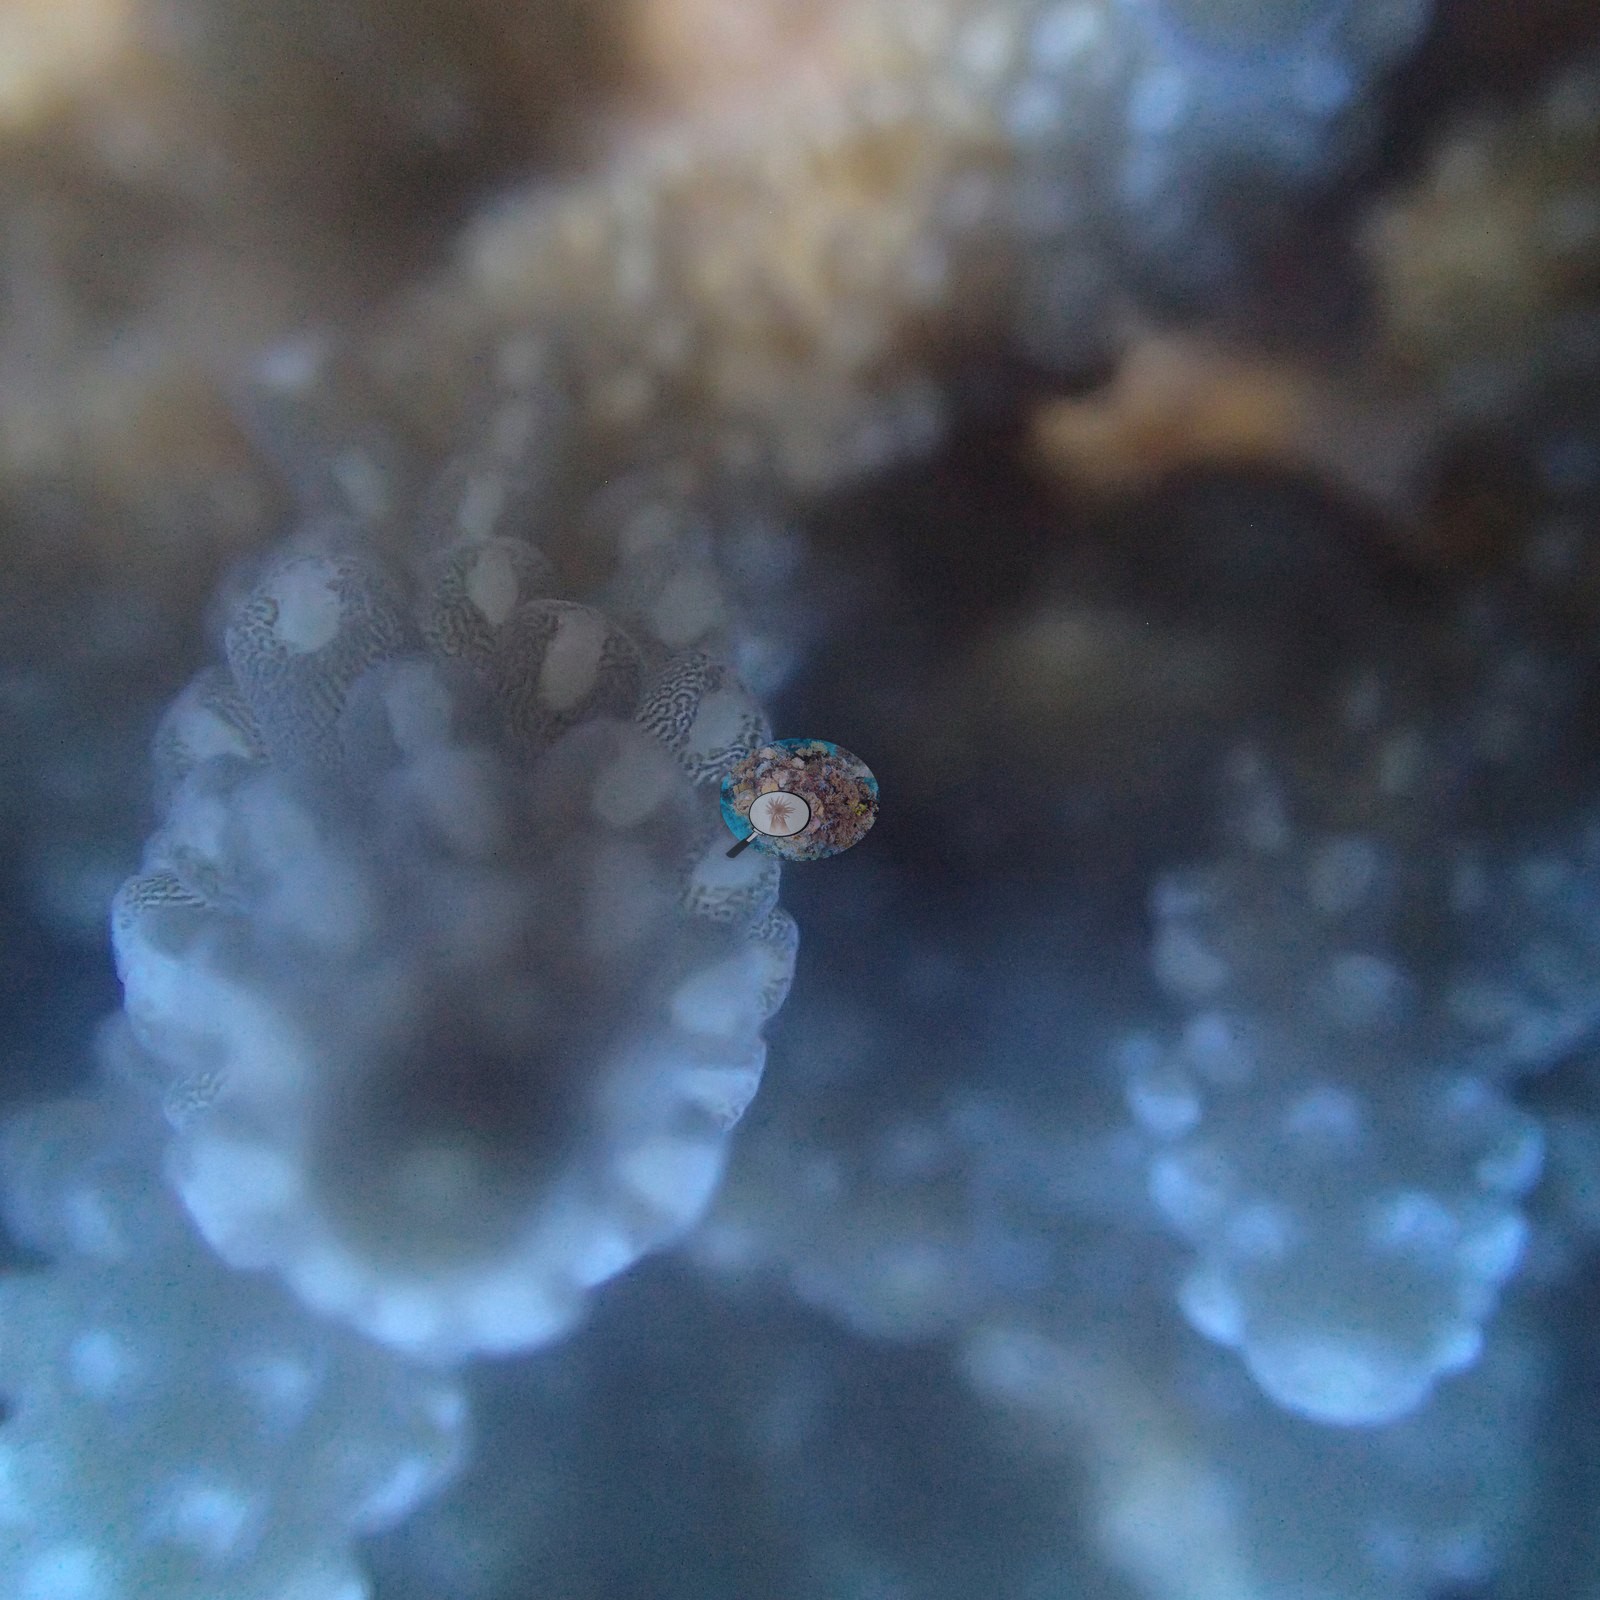
A sheer vertical wall in what Anderson's sample sheet calls "crystal clear water," with 30–35 m visibility, big Porites domes, rock crusted with pink coralline algae, honeycomb faviids, and a maze-patterned coral compatible with Psammocora (e.g., Image 15, Image 16, Image 17, Image 18); a tagged colony sampled here (e.g., Image 21) and close-ups of sampled colonies (e.g., Image 22, Image 23).
Coral cover
- Reference: Claude CV point count (this site's photos)
- Coral cover: 39%, a photo-based estimate: Claude's visual estimate of live hard coral on 20 of Anderson's January 2016 habitat photographs from research site 9, before the 2016 bleaching (SE 1.7 percentage points; n = 20 photos). Most frames are oblique views, which tend to overstate cover, so treat it as approximate.
- Atoll-wide context, not a survey of this site: Coral Reef CPR point-intercept transects pooled across Baa Atoll read 64% in April 2016, during the bleaching (n=40 transects), and 35% in July 2016, after it (n=50 transects); we were part of the CPR team.
Stressors
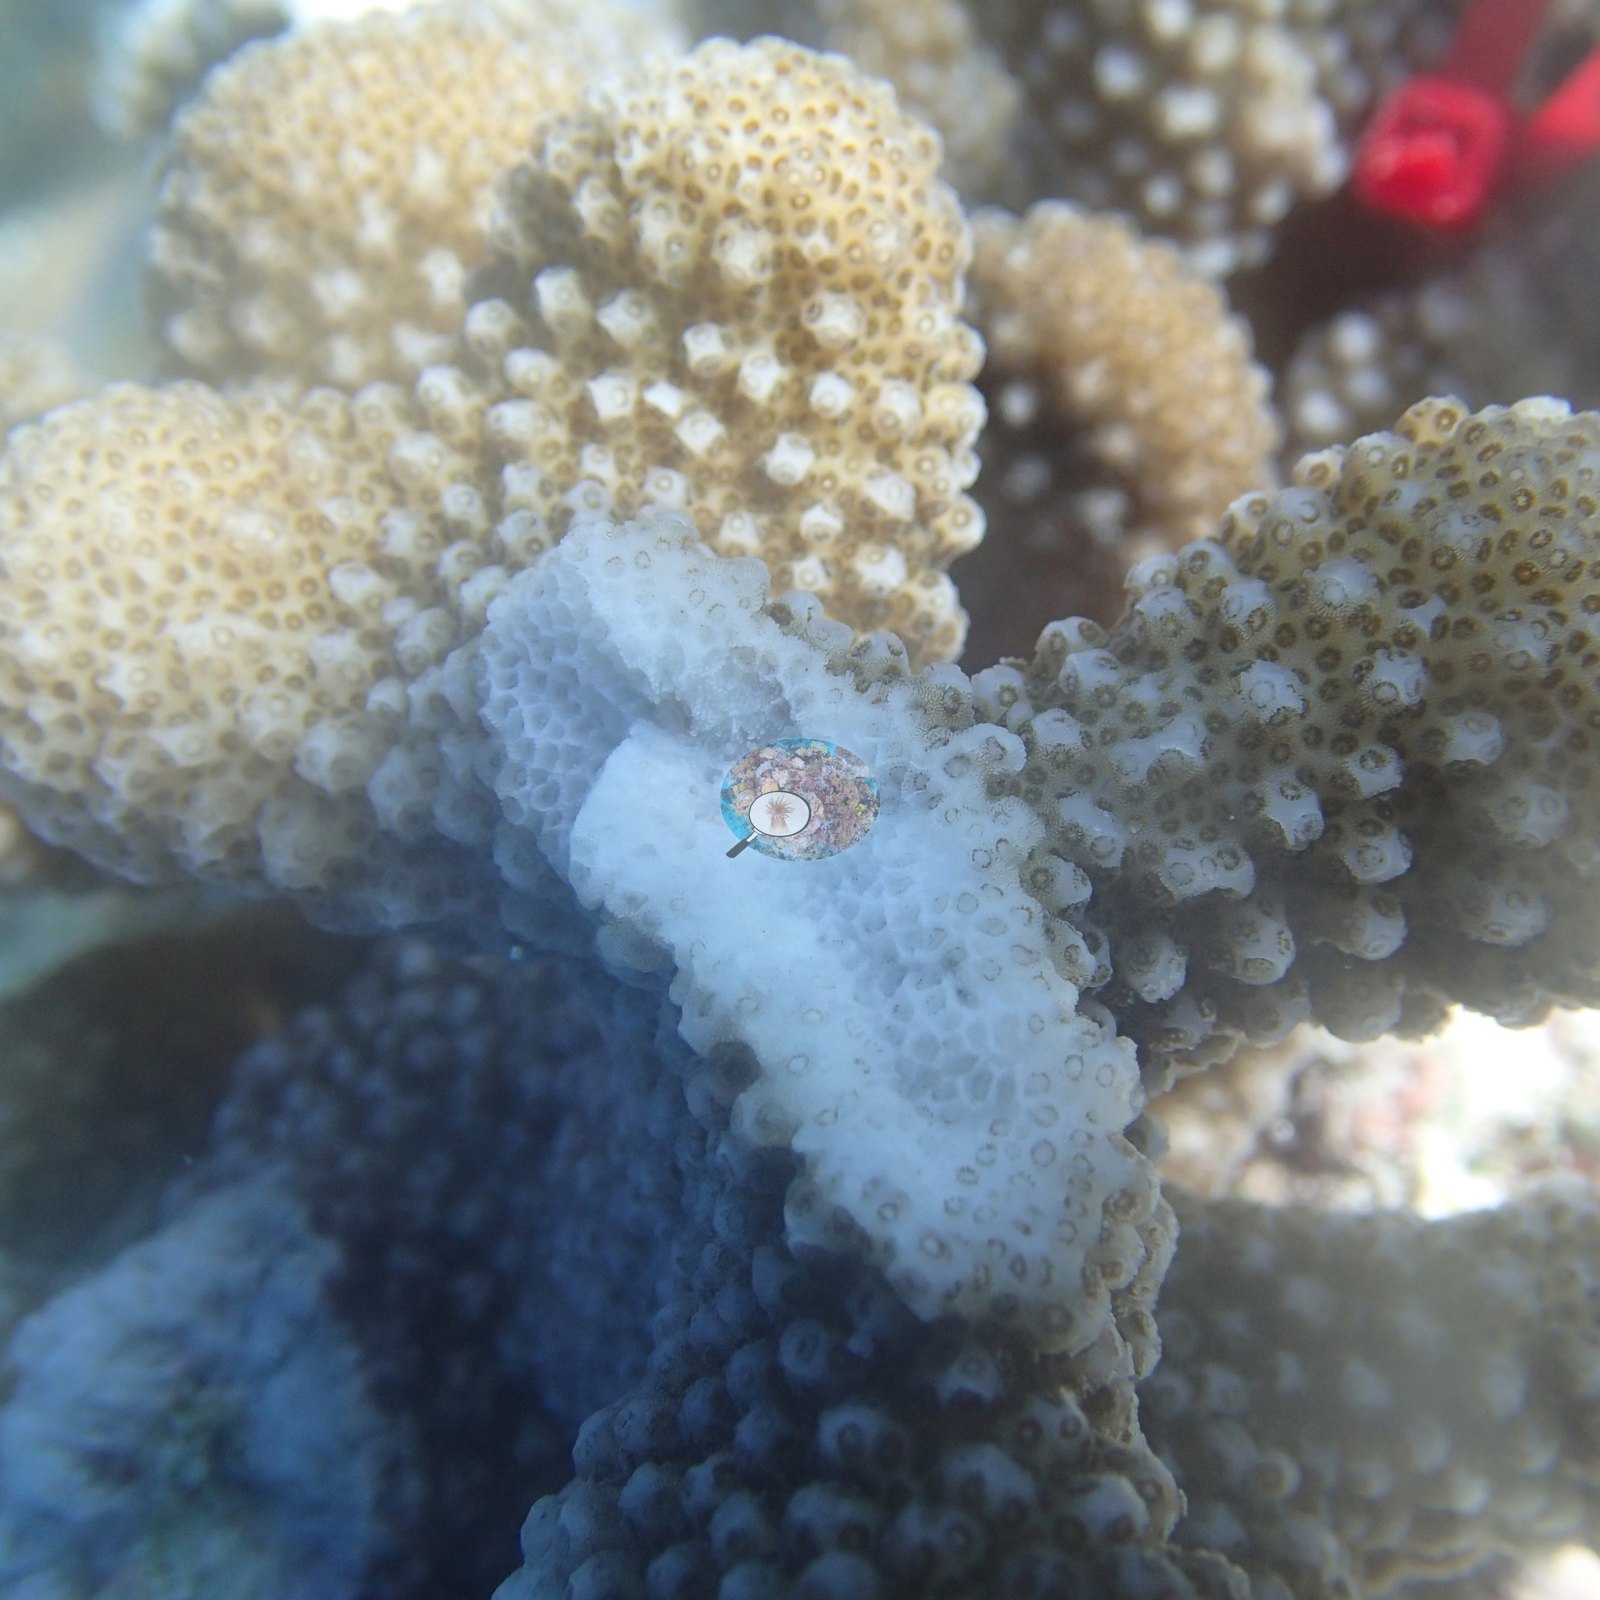
This was tagged-and-measured monitoring work, photographed roughly three months before the 2016 El Niño bleaching event across Baa's study reefs. On one tagged colony Anderson's sample sheet notes that large branches had been broken off; the freshly broken ends are stark white, and the cause of the breakage is not stated (e.g., Image 46).
No crown-of-thorns starfish (COTS) or other corallivores were evident.
Comparisons with other data
We found no other surveys at this site as of 2026. If you would like to share yours, please email us.
Other notes
Research site 9 of the January 2016 Maldives monitoring trip (sites 6 and 7 are the Gaagandufaruhuraa and Kashidhoo Faru pins; sites 8 and 10 have their own pins). The reef is not named in the field records.
CV model comparison
More info
Computer-vision estimates from this site's own photographs are listed in the comparison table below, alongside the headline rather than merged into it.More info
The Coral Reef CPR transects (64% in April and 35% in July 2016) pool every Baa Atoll transect across five or six reef names; they are atoll-wide context, not a survey of this site, and are never averaged with the headline.| Method | Hard coral cover (%) | Photos (n) ± SE |
|---|---|---|
| Transect, July 2016, pooled Baa Atoll (atoll-wide context) | 34.9 | |
| Claude, January 2016 photos (photo-based estimate; headline) | 38.8 | n = 20 · SE 1.7 |
| Transect, April 2016, pooled Baa Atoll (atoll-wide context) | 64.3 |
See a more detailed, stand-alone version of this table.
Data & links
All images from Coral Reef Diagnostics. Data are from Coral Reef Diagnostics and Coral Reef CPR.
© Coral Reef Diagnostics.