
Saint Vincent and the Grenadines

Regional summary of 5 dive sites. Figures are averages across the sites that report them (n = sites with a value); each site's own page has its individual values.
⬇ Download this region as a report card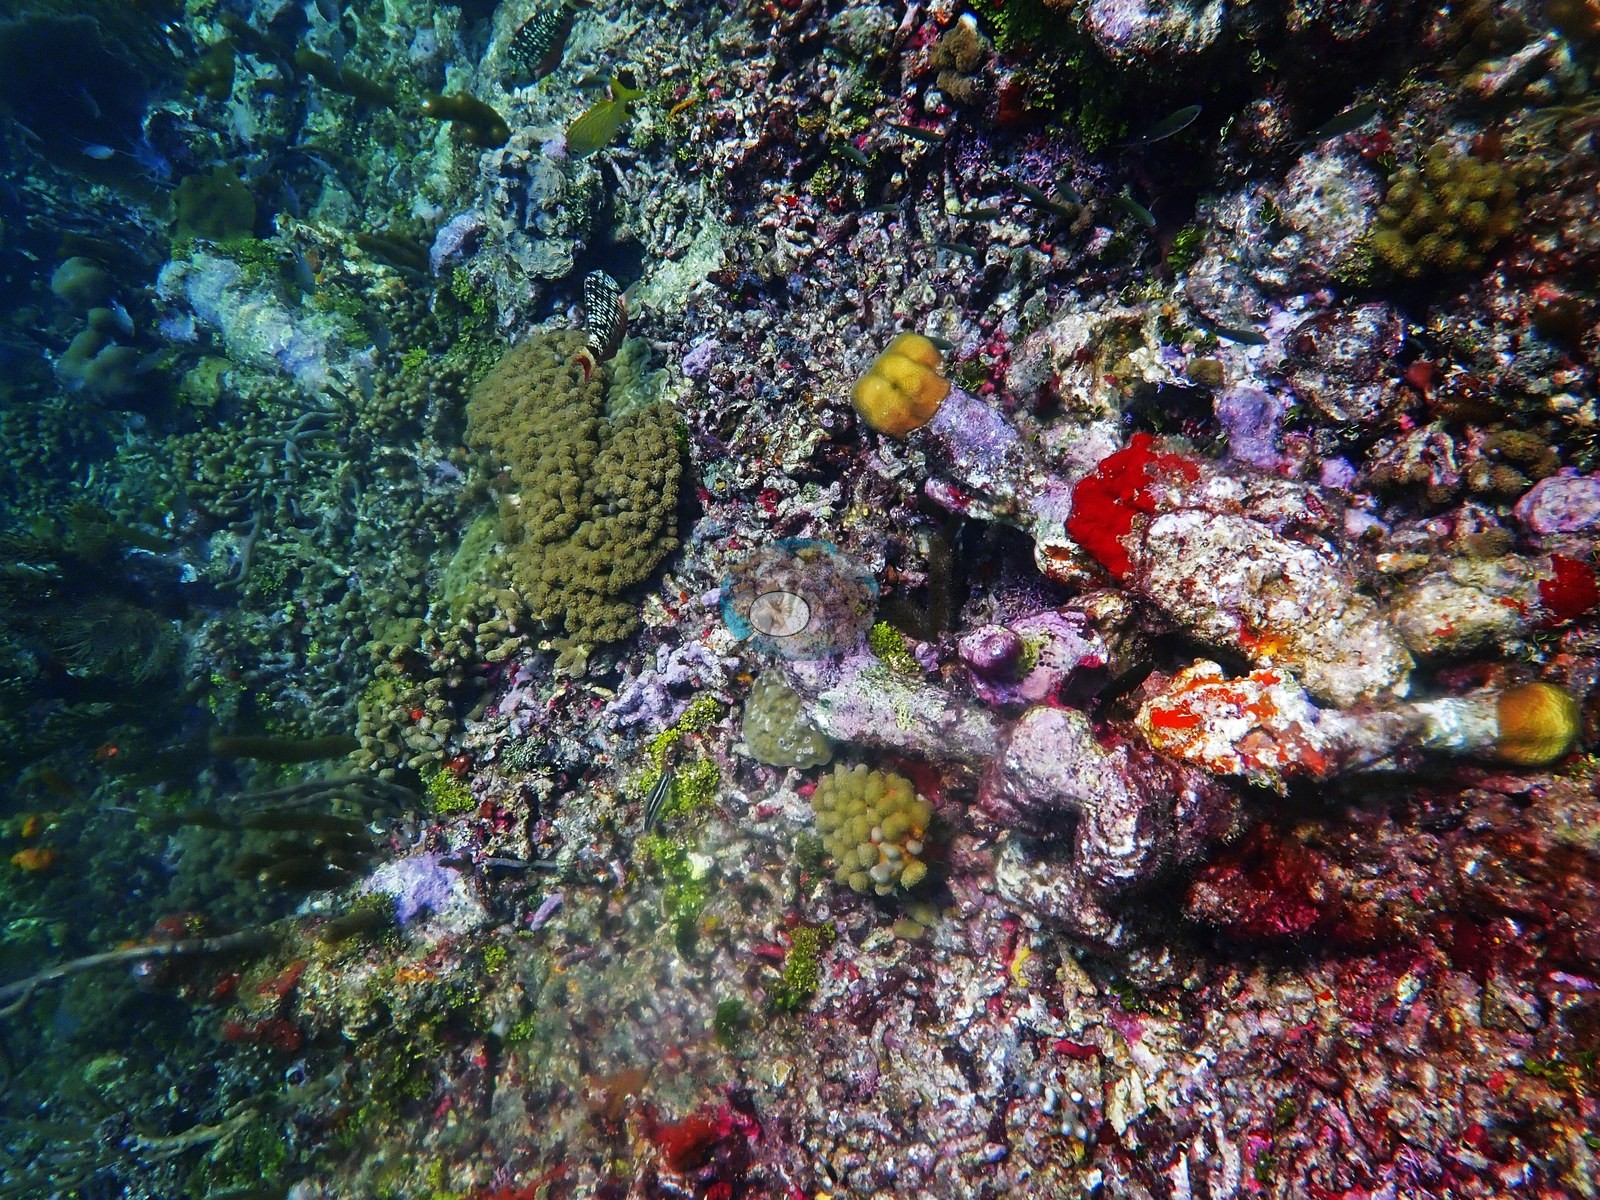

Around Mayreau and the Tobago Cays, Anderson's 2019 work centered on a natural volcanic CO2 seep, dived 16 times as an ocean-acidification analog site. The reefs there are sponge-and-gorgonian reefs with subordinate stony corals, and a nearby wreck is packed with spiny lobsters. Computer-vision coral cover from Anderson's photographs runs from 4.9% on the wreck to 30% at a second vent.
Heat stress
Long-term record: 12 years since 1985 reached 8 or more °C-weeks at NOAA’s Windward Caribbean Islands station. Download the annual DHW data (CSV).
5 sites in this region — click a marker to open that site.
Regional setting
St. Vincent is among the youngest of the large volcanic islands in the Windward Group. The Soufrière volcano forms its northern end and last erupted in 1979, and volcanic activity through the late Pleistocene and Recent is thought to explain why its reefs are so poorly developed (Wells 1988; Spalding et al. 2001). The exposed north and east coasts have no reefs, and only small fringing reefs occur on the south, southeast, and west coasts. The roughly 28 rocky Grenadines to the south are a different setting. Three quarters of their platform lies 36–40 m deep without shallow reefs, but large bank barrier reef complexes have grown on the windward sides of Mayreau, Union, and nearby islands, their shallower parts often dominated by Acropora palmata above deeper head-coral zones (Wells 1988). In the Tobago Cays, each cay has its own fringing reef, Horseshoe Reef arcs around them to the east, and World's End Reef lies farther out (Spalding et al. 2001). Lewis recorded 30 coral species there in 1975, with Montastraea annularis dominating the fore-reef slope, but observations in 1980–84 found that most large A. palmata colonies had died at reefs such as Catholic Rock and Petit Tabac (Wells 1988). Spalding et al. (2001) report that the Tobago Cays had since deteriorated further through storm damage, white band disease, fishing gear, and anchors, and pollution from visiting yachts, and estimate about 140 km² of reef for St. Vincent and the Grenadines.
Souter et al. (2021) report recent trends only for the Eastern and Southern Caribbean as a whole, a subregion that groups the Lesser Antilles with Trinidad and Tobago, Aruba, Bonaire, Curaçao, and Venezuela. Across it, mean hard coral cover fell from about 26.2% in 1999 to 14.5% in 2019, the largest decline among the five Caribbean subregions, while algal cover nearly tripled between 1987 and 2019 to reach 48.3%. For the Caribbean as a whole, the same report links these losses to the 2005 mass bleaching, hurricanes, polluted, and nutrient-enriched coastal water, and overfishing of herbivores such as parrotfishes, and it names invasive lionfish, Sargassum influxes since 2011, and stony coral tissue loss disease (SCTLD) as newer threats; SCTLD, first seen in Florida in 2014, had been confirmed in 19 Caribbean countries and territories by October 2021. Earlier, Wilkinson (2006), drawing on the 2004 Caribbean Reefs at Risk assessment, placed the Lesser Antilles among the areas most threatened by coastal development and singled out its high islands for land-based pollution and sediment.
Overview
The four Saint Vincent and the Grenadines sites lie around Mayreau and the Tobago Cays in the southern Grenadines and date from a working trip between 26 September and 1 October 2019. The main focus was the natural volcanic CO2 seep off Mayreau, a shallow, silty patch reef dived 16 times to roughly 23-24 m. There, tagged colonies of Porites astreoides, Montastraea cavernosa, and Orbicella faveolata were sampled along a vent-to-control gradient for the Enochs et al. 2020 acidification study. The other sites are Mayreau Gardens nearby, the Horseshoe Reef arc that encloses the Tobago Cays lagoon, and a wreck off Mayreau dived at dusk on the final day. Logged depths ran from 11.3 m at the Mayreau Shipwreck to 24.1 m at Mayreau Gardens; Horseshoe Reef has no depth or underwater photographs, only topside views of the reef line.
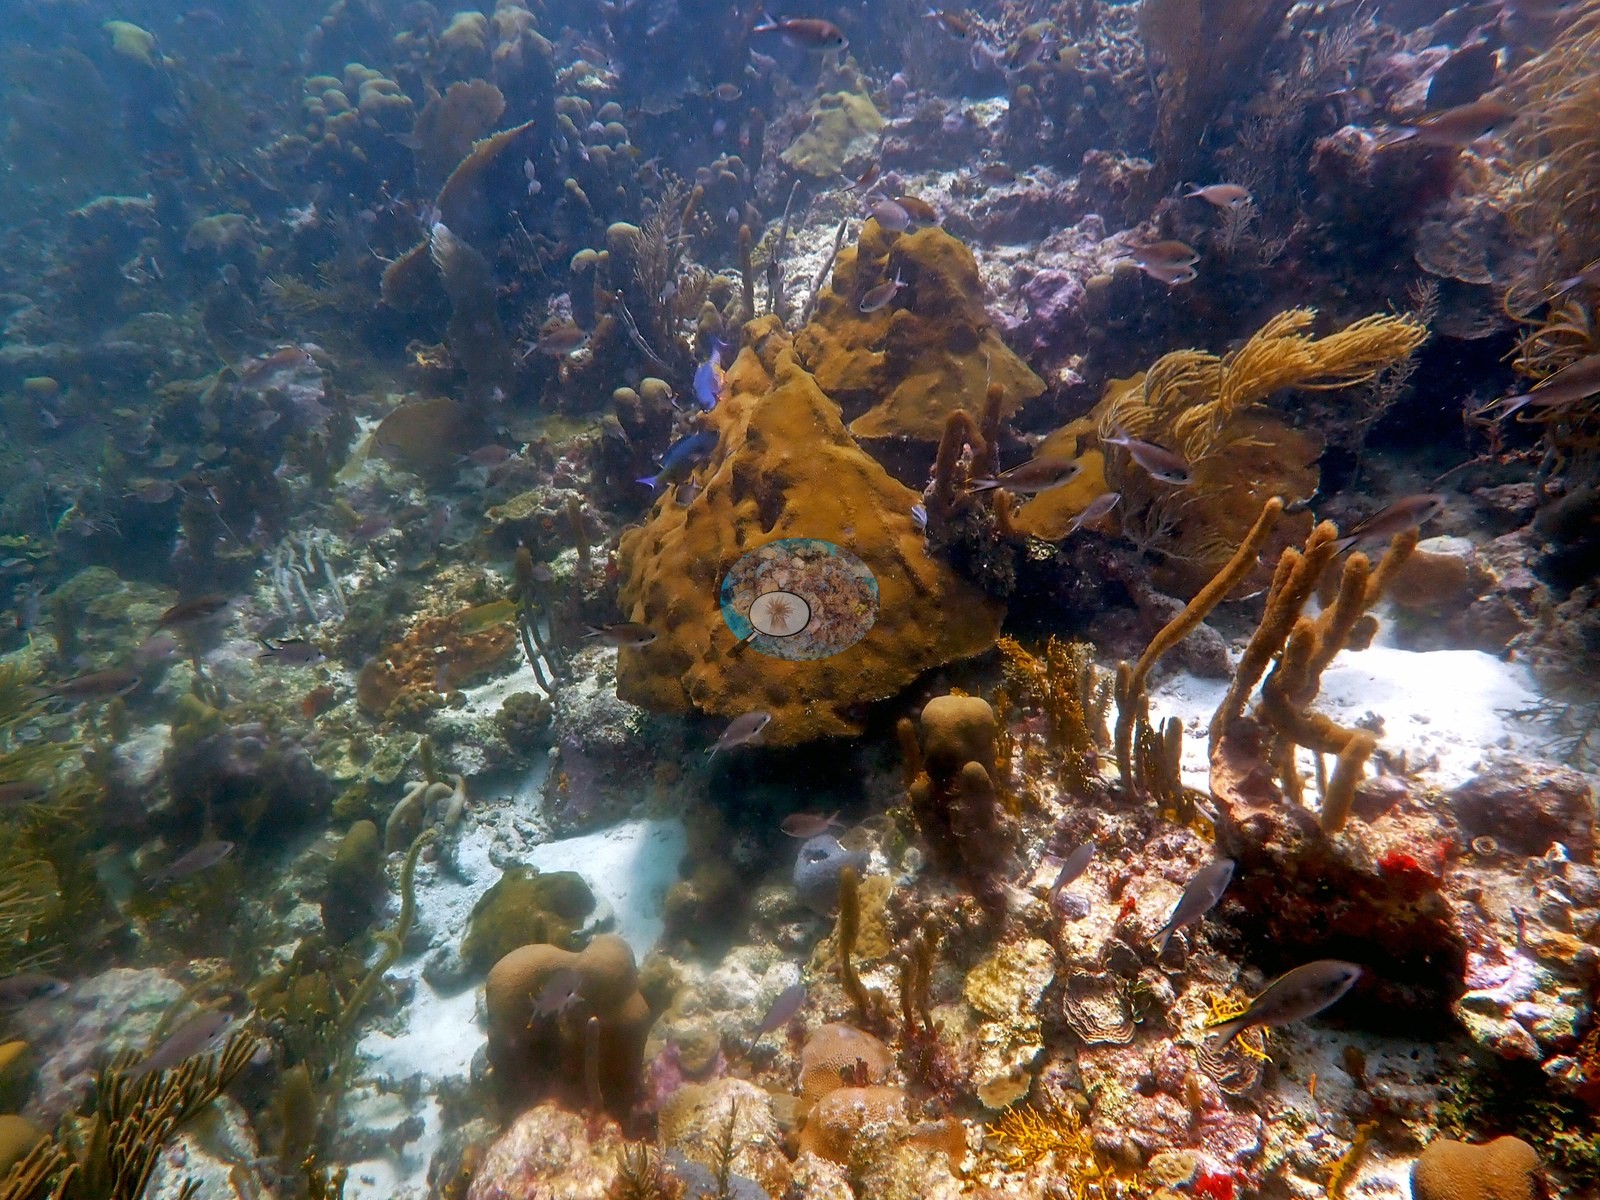
The reefs photographed around Mayreau are sponge-and-gorgonian reefs rather than coral-framework reefs. Big brown tube and vase sponges, red and orange encrusting sponges, and a forest of sea rods, sea plumes, and sea fans rise off low, algal-crusted carbonate pavement, with crinoids in the crevices and white sand in the hollows. Stony corals are present but subordinate, as mounding, encrusting, and small brain-type heads. The dive notes for Mayreau Gardens also describe a lusher patch with boulder star coral, orange elkhorn-like colonies, and sea fans. Water was green and somewhat turbid in several frames.
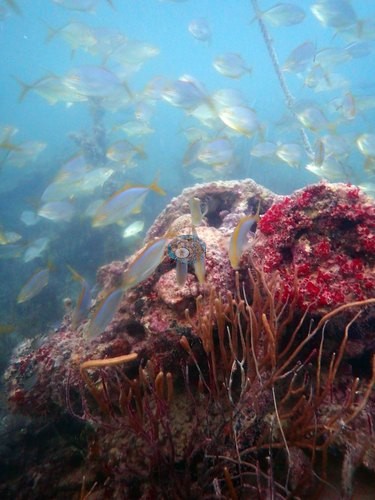
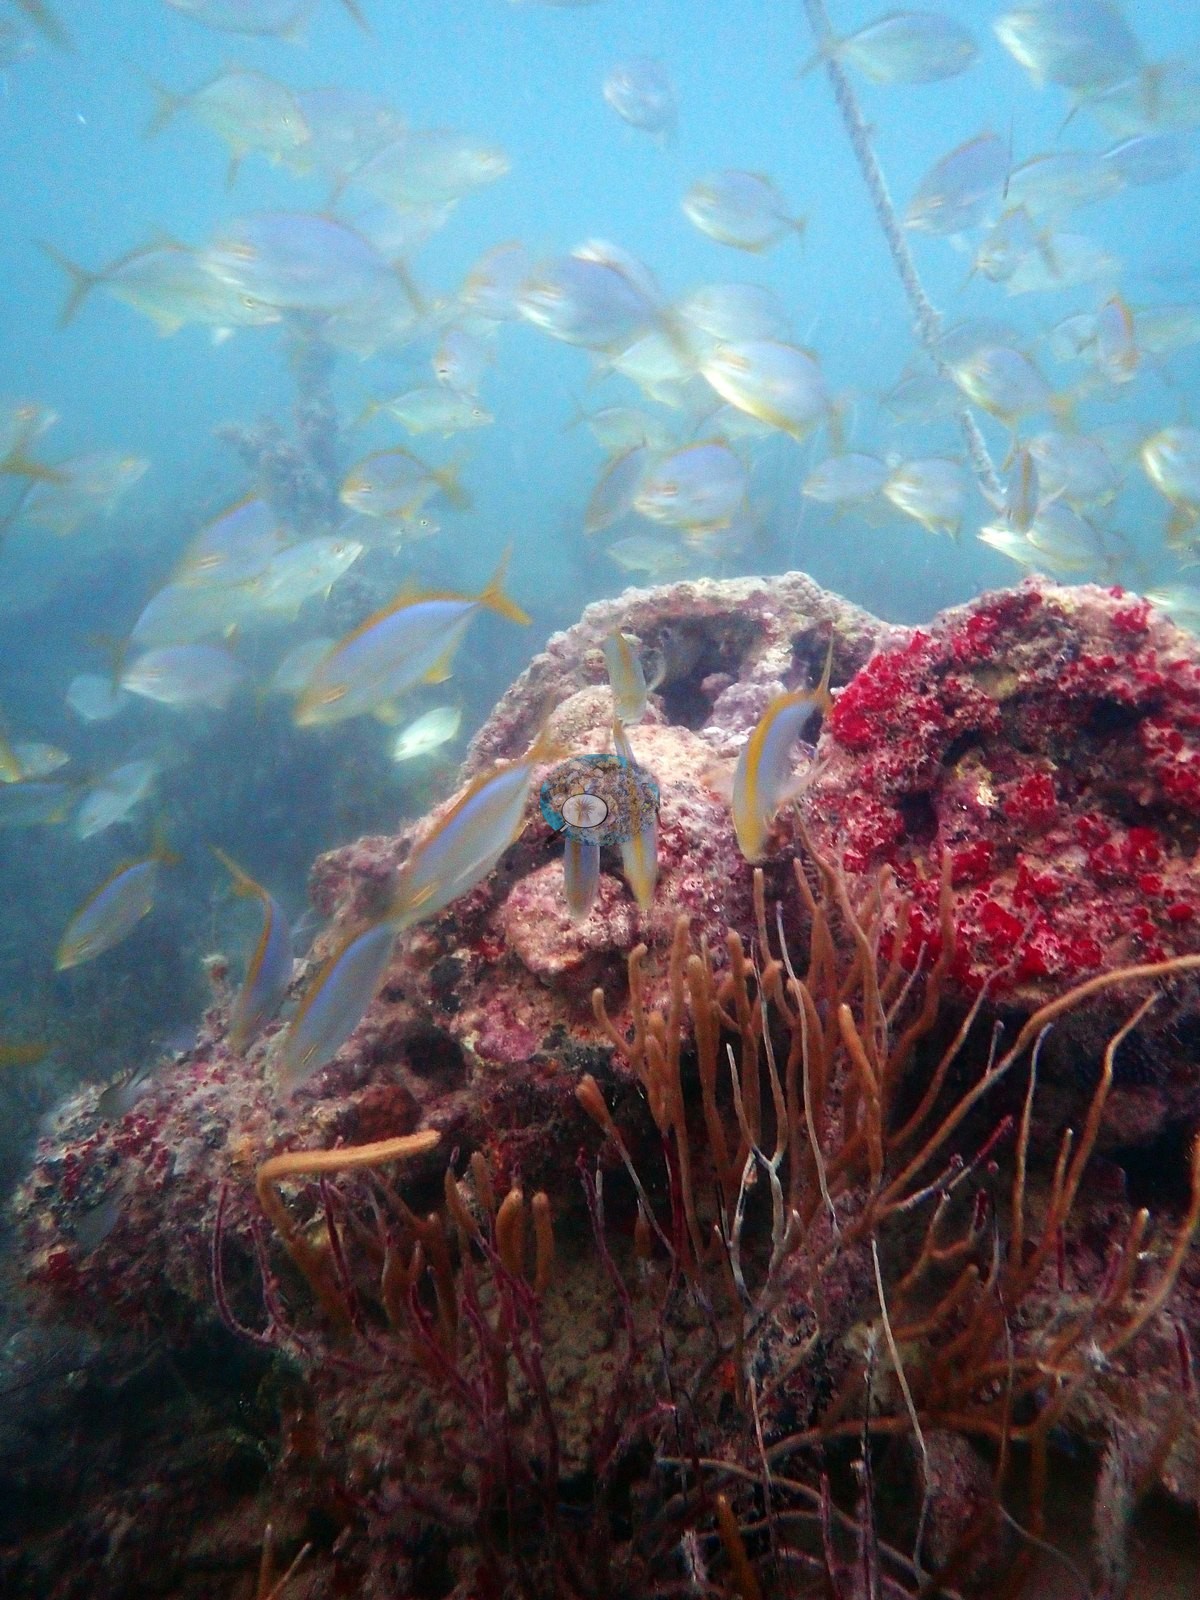
The wreck, tentatively identified as the 1918 Puruni at about 11 m, carries only sparse coral colonization: small encrusting Siderastrea and Porites astreoides patches, a few brain corals, and sea fans and whip gorgonians. It holds a remarkable density of Caribbean spiny lobster in nearly every crevice. No bleaching, disease, or corallivores were observed there. Fish life was the standout at Mayreau Gardens, with clouds of small blue planktivores and a hundreds-strong school hanging over a thick carpet of green macroalgae. Blind computer-vision point counts of Anderson's edited photographs put coral cover at 23% (median 18%) at the CO2 vent site, 7.0% at Mayreau Gardens, where most frames are fish and open-water shots, 4.9% on the wreck, where low cover is expected, and 30% (median 25%) at a second vent found about 600 m to the south-southwest on the first dive of the trip; Horseshoe Reef has only topside photos. Enochs et al. (2020) describe high hard and soft coral cover around the vents but give no number.
Highlights
- Natural volcanic carbon dioxide seep off Mayreau, dived 16 times in 2019 and used as an ocean-acidification analog site
- Tagged Porites astreoides, Montastraea cavernosa, and Orbicella faveolata sampled along a vent-to-control gradient
- Sponge-and-gorgonian reef structure, with stony corals subordinate
- Mayreau wreck (tentatively the 1918 Puruni) packed with Caribbean spiny lobster, including a mother-and-young pair
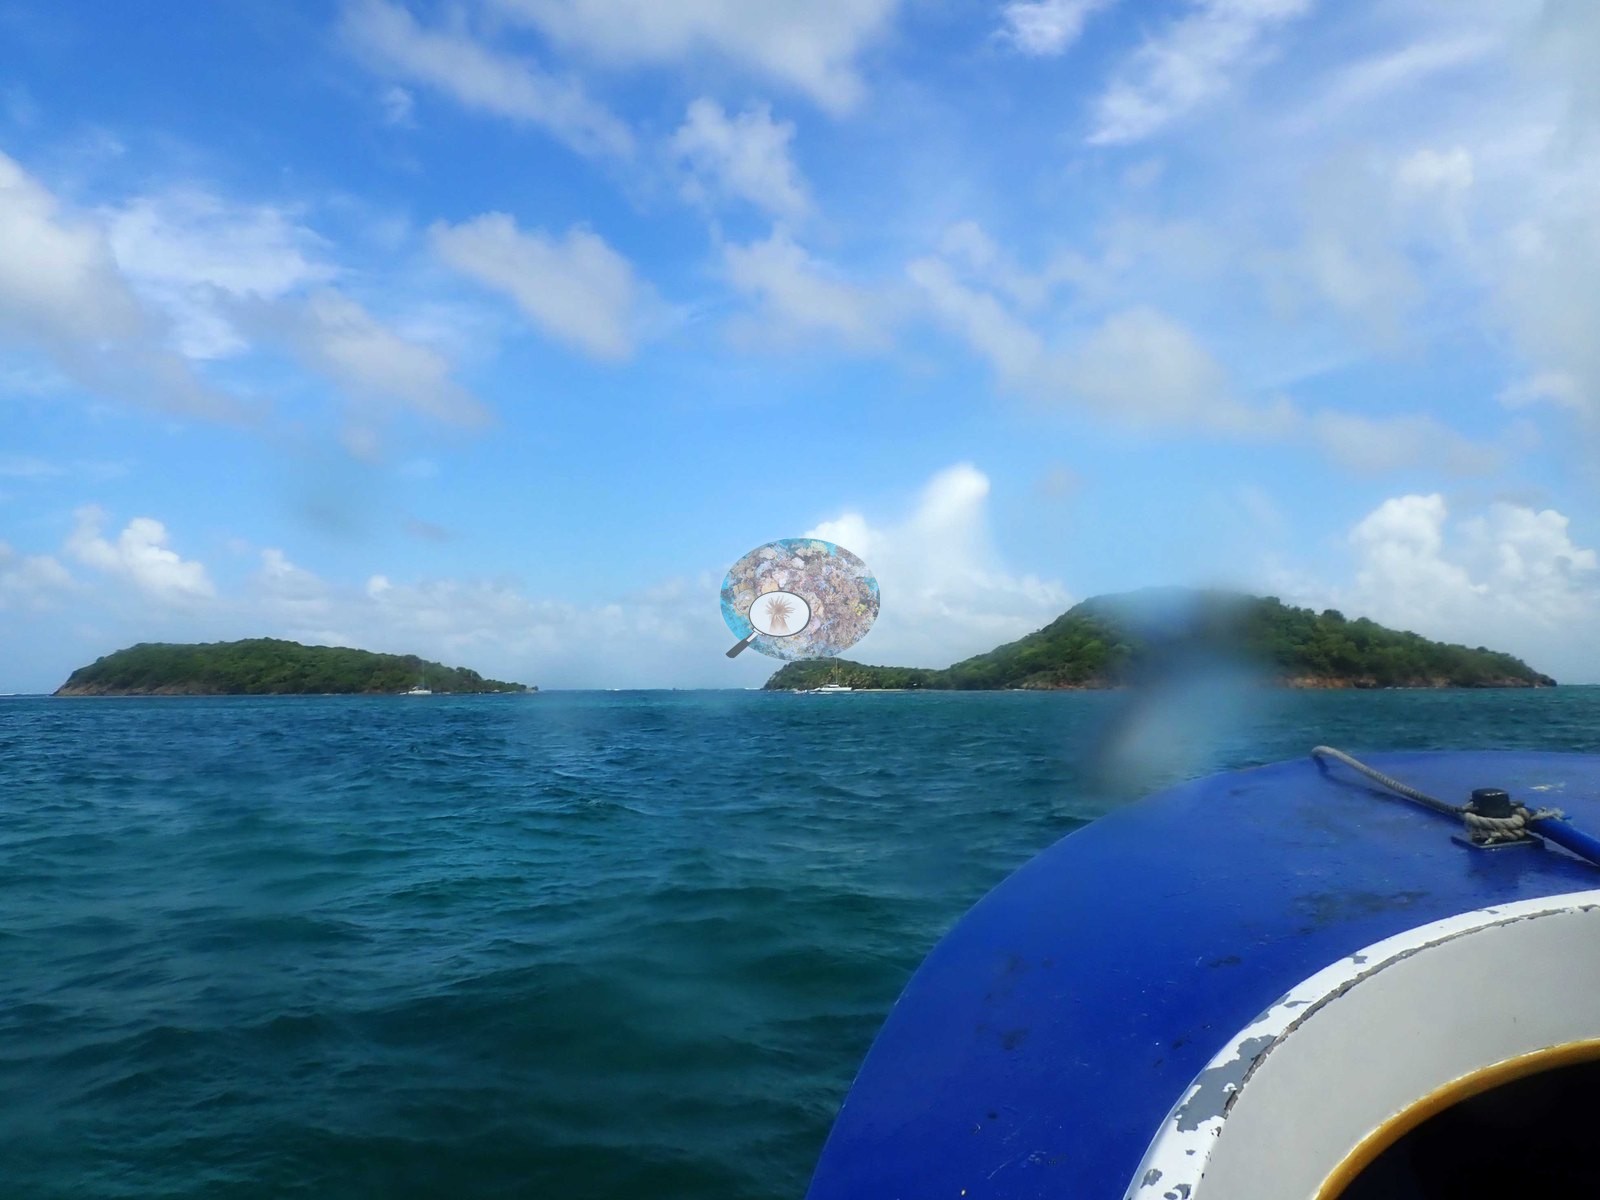
- Horseshoe Reef, the barrier arc enclosing the Tobago Cays lagoon
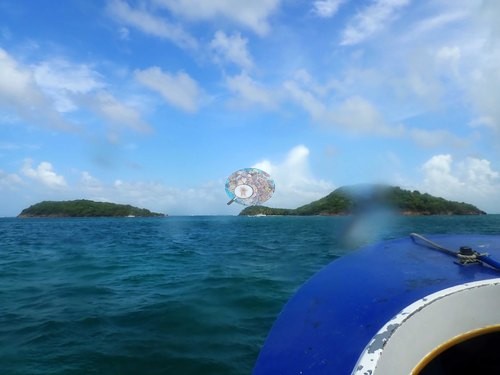 photo: SVG - Tobago Cays (Horseshoe Reef)
Notable observations
- SVG - Mayreau Gardens (CO2 vent site): Natural acidification: a volcanic CO2 seep with extreme periodic pH swings (Enochs et al. 2020), where tagged colonies were sampled along a vent-to-control gradient. The attached photographs show the surrounding sponge-and-gorgonian reef and turbid green water, not the bubble streams.
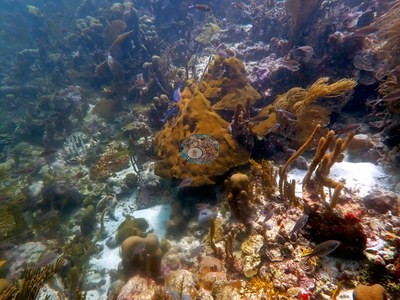
- SVG - Mayreau Shipwreck: Unusual sighting: a remarkable density of Caribbean spiny lobster (Panulirus argus) in nearly every crevice and porthole of the wreck, including a mother-and-young pair. No bleaching, disease, or corallivores observed.
Coral cover over time (pooled)
Sites in this region
- SVG - Mayreau Gardens — 7.0% coral cover
- SVG - Mayreau Gardens (CO2 vent site) — 23% coral cover
- SVG - Mayreau Gardens (second vent) — 30% coral cover
- SVG - Mayreau Shipwreck — 4.9% coral cover
- SVG - Tobago Cays (Horseshoe Reef) — 11% (nearby survey, not this site: AGRRA, Horse Shoe Reef station, 2019-07-20, 1.20 km away)
Nearby external survey stations
38 independent survey records within 5 km of a site in this region (each record counted once).
Show all 38 records
- AGRRA — Horse Shoe Reef (2019): 11% hard coral cover, 1.20 km from SVG - Tobago Cays (Horseshoe Reef)
- AGRRA — Horseshoe REEF-SE (2015): 5.6% hard coral cover, 0.72 km from SVG - Tobago Cays (Horseshoe Reef)
- AGRRA — Horseshoe REEF-SE (2018): 11% hard coral cover, 0.72 km from SVG - Tobago Cays (Horseshoe Reef)
- AGRRA — Horseshoe REEF-SE (2018): 8.2% hard coral cover, 0.72 km from SVG - Tobago Cays (Horseshoe Reef)
- AGRRA — Horseshoe Reef marine protected area (MPA) Site (2015): 12% hard coral cover, 1.18 km from SVG - Tobago Cays (Horseshoe Reef)
- AGRRA — Horseshoe Reef MPA site (2018): 12% hard coral cover, 1.18 km from SVG - Tobago Cays (Horseshoe Reef)
- AGRRA — NE Palm Island (2015): 1.5% hard coral cover, 4.31 km from SVG - Mayreau Gardens (second vent)
- AGRRA — Petit Rameau (2015): 34% hard coral cover, 1.06 km from SVG - Tobago Cays (Horseshoe Reef)
- AGRRA — Petit Rameau (2018): 44% hard coral cover, 1.06 km from SVG - Tobago Cays (Horseshoe Reef)
- AGRRA — Petit Rameau (2018): 39% hard coral cover, 1.06 km from SVG - Tobago Cays (Horseshoe Reef)
- AGRRA — Roundabout Reef (2015): 5.2% hard coral cover, 4.79 km from SVG - Mayreau Gardens (second vent)
- AGRRA — Roundabout Reef (2018): 9.2% hard coral cover, 4.79 km from SVG - Mayreau Gardens (second vent)
- AGRRA — TaiChi Reef (2019): 13% hard coral cover, 1.67 km from SVG - Tobago Cays (Horseshoe Reef)
- AGRRA — World's End Reef-S (2015): 3.0% hard coral cover, 2.90 km from SVG - Tobago Cays (Horseshoe Reef)
- AGRRA — World's End Reef-S (2018): 8.3% hard coral cover, 2.90 km from SVG - Tobago Cays (Horseshoe Reef)
- AGRRA — World's End Reef-SE (2015): 3.9% hard coral cover, 3.72 km from SVG - Tobago Cays (Horseshoe Reef)
- AGRRA — World's End Reef-SE (2018): 3.0% hard coral cover, 3.72 km from SVG - Tobago Cays (Horseshoe Reef)
- Literature: Deschamps et al. 2003 — Horseshoe Reef fore reef, Tobago Cays Marine Park [3-4 m] (1999): 30% hard coral cover, 1.43 km from SVG - Tobago Cays (Horseshoe Reef)
- Literature: Deschamps et al. 2003 — Horseshoe Reef fore reef, Tobago Cays Marine Park [9-11 m] (1999): 40% hard coral cover, 1.43 km from SVG - Tobago Cays (Horseshoe Reef)
- Reef Check — Horseshoe (outside) (2007): 16% hard coral cover, 1.40 km from SVG - Tobago Cays (Horseshoe Reef)
- Reef Check — Horseshoe Reef Back Reef (2005): 24% hard coral cover, 1.06 km from SVG - Tobago Cays (Horseshoe Reef)
- Reef Check — Horseshoe Reef Back Reef (2005): 28% hard coral cover, 1.06 km from SVG - Tobago Cays (Horseshoe Reef)
- Reef Check — Horseshoe Reef Back Reef (2007): 31% hard coral cover, 1.06 km from SVG - Tobago Cays (Horseshoe Reef)
- Reef Check — Petit Bateau (2005): 14% hard coral cover, 0.36 km from SVG - Tobago Cays (Horseshoe Reef)
- Reef Check — Petit Bateau (2005): 16% hard coral cover, 0.36 km from SVG - Tobago Cays (Horseshoe Reef)
- Reef Check — Petit Bateau (2007): 19% hard coral cover, 0.36 km from SVG - Tobago Cays (Horseshoe Reef)
- Reef Check — Petit Tabac (2005): 10% hard coral cover, 1.02 km from SVG - Tobago Cays (Horseshoe Reef)
- Reef Check — Petit Tabac (2005): 11% hard coral cover, 1.02 km from SVG - Tobago Cays (Horseshoe Reef)
- Reef Check — Petit Tabac (2007): 11% hard coral cover, 1.02 km from SVG - Tobago Cays (Horseshoe Reef)
- XL Catlin Seaview Survey — transect 22011 (2013): 3.0% hard coral cover, 4.73 km from SVG - Mayreau Gardens (second vent)
- XL Catlin Seaview Survey — transect 22012 (2013): 2.7% hard coral cover, 4.98 km from SVG - Mayreau Gardens
- XL Catlin Seaview Survey — transect 22013 (2013): 1.1% hard coral cover, 4.12 km from SVG - Tobago Cays (Horseshoe Reef)
- XL Catlin Seaview Survey — transect 22014 (2013): 5.4% hard coral cover, 1.84 km from SVG - Tobago Cays (Horseshoe Reef)
- XL Catlin Seaview Survey — transect 22015 (2013): 1.2% hard coral cover, 2.12 km from SVG - Tobago Cays (Horseshoe Reef)
- XL Catlin Seaview Survey — transect 22016 (2013): 7.5% hard coral cover, 1.96 km from SVG - Tobago Cays (Horseshoe Reef)
- XL Catlin Seaview Survey — transect 22017 (2013): 8.5% hard coral cover, 0.16 km from SVG - Mayreau Gardens (CO2 vent site)
- XL Catlin Seaview Survey — transect 22018 (2013): 6.1% hard coral cover, 0.24 km from SVG - Mayreau Gardens (CO2 vent site)
- XL Catlin Seaview Survey — transect 22019 (2013): 11% hard coral cover, 0.25 km from SVG - Mayreau Gardens (CO2 vent site)
All images from Coral Reef Diagnostics. Data are from Coral Reef Diagnostics and Reef Check Foundation, Atlantic and Gulf Rapid Reef Assessment (AGRRA), and XL Catlin Seaview Survey (University of Queensland).
© Coral Reef Diagnostics.
References
- Souter D, et al. (eds) (2021) Status of Coral Reefs of the World: 2020. International Coral Reef Initiative / Global Coral Reef Monitoring Network. [PDF]
- Spalding MD, et al. (2001) World Atlas of Coral Reefs. University of California Press, Berkeley. [PDF]
- Wells SM (ed.) (1988) Coral Reefs of the World. Volume 1: Atlantic and Eastern Pacific. UNEP/IUCN, Cambridge. [PDF]
- Wilkinson C (2006) Status of coral reefs of the world: summary of threats and remedial action. In: Côté IM, Reynolds JD (eds) Coral Reef Conservation. Cambridge University Press, Cambridge. [PDF]
- Enochs IC, Formel N, Manzello D, Morris J, Mayfield AB, Boyd A, et al. (2020). Coral persistence despite extreme periodic pH fluctuations at a volcanically acidified Caribbean reef. Coral Reefs 39:523-528. DOI
- Deschamps A, Desrochers A, Klomp KD (2003). St. Vincent. A Rapid Assessment of the Horseshoe Reef, Tobago Cays Marine Park, St. Vincent, West Indies (Stony Corals, Algae and Fishes). Atoll Research Bulletin 496:438-459. DOI