

SVG - Mayreau Gardens

Part of the regional summary: Saint Vincent and the Grenadines
2019-09-30
2019-10-01
More info
Windward Caribbean Islands (NOAA CRW virtual station) · Eastern Caribbean ecoregion mean: 13.1 degree heating weeksA classic eastern Caribbean sponge-and-gorgonian reef off Mayreau in the Tobago Cays, where big brown tube and vase sponges and a forest of sea rods and fans rise over low pavement, with stony corals present but subordinate. A blind computer-vision point count of 33 photos puts coral cover around 7% (median 5%), mostly from fish and open-water frames. The fish life is the standout, including a hundreds-strong school hanging over green algae, and the wider area includes a natural volcanic CO2 seep.
Sixteen independent survey stations shown with the program’s logo — click one to see how far it is from this site.
Four other CRD dive sites within 5 km shown in orange — click a marker to open its page.
5 of the 50 photographs on this page are shown beside the text that discusses them under "Site description" below.
Site description
Setting
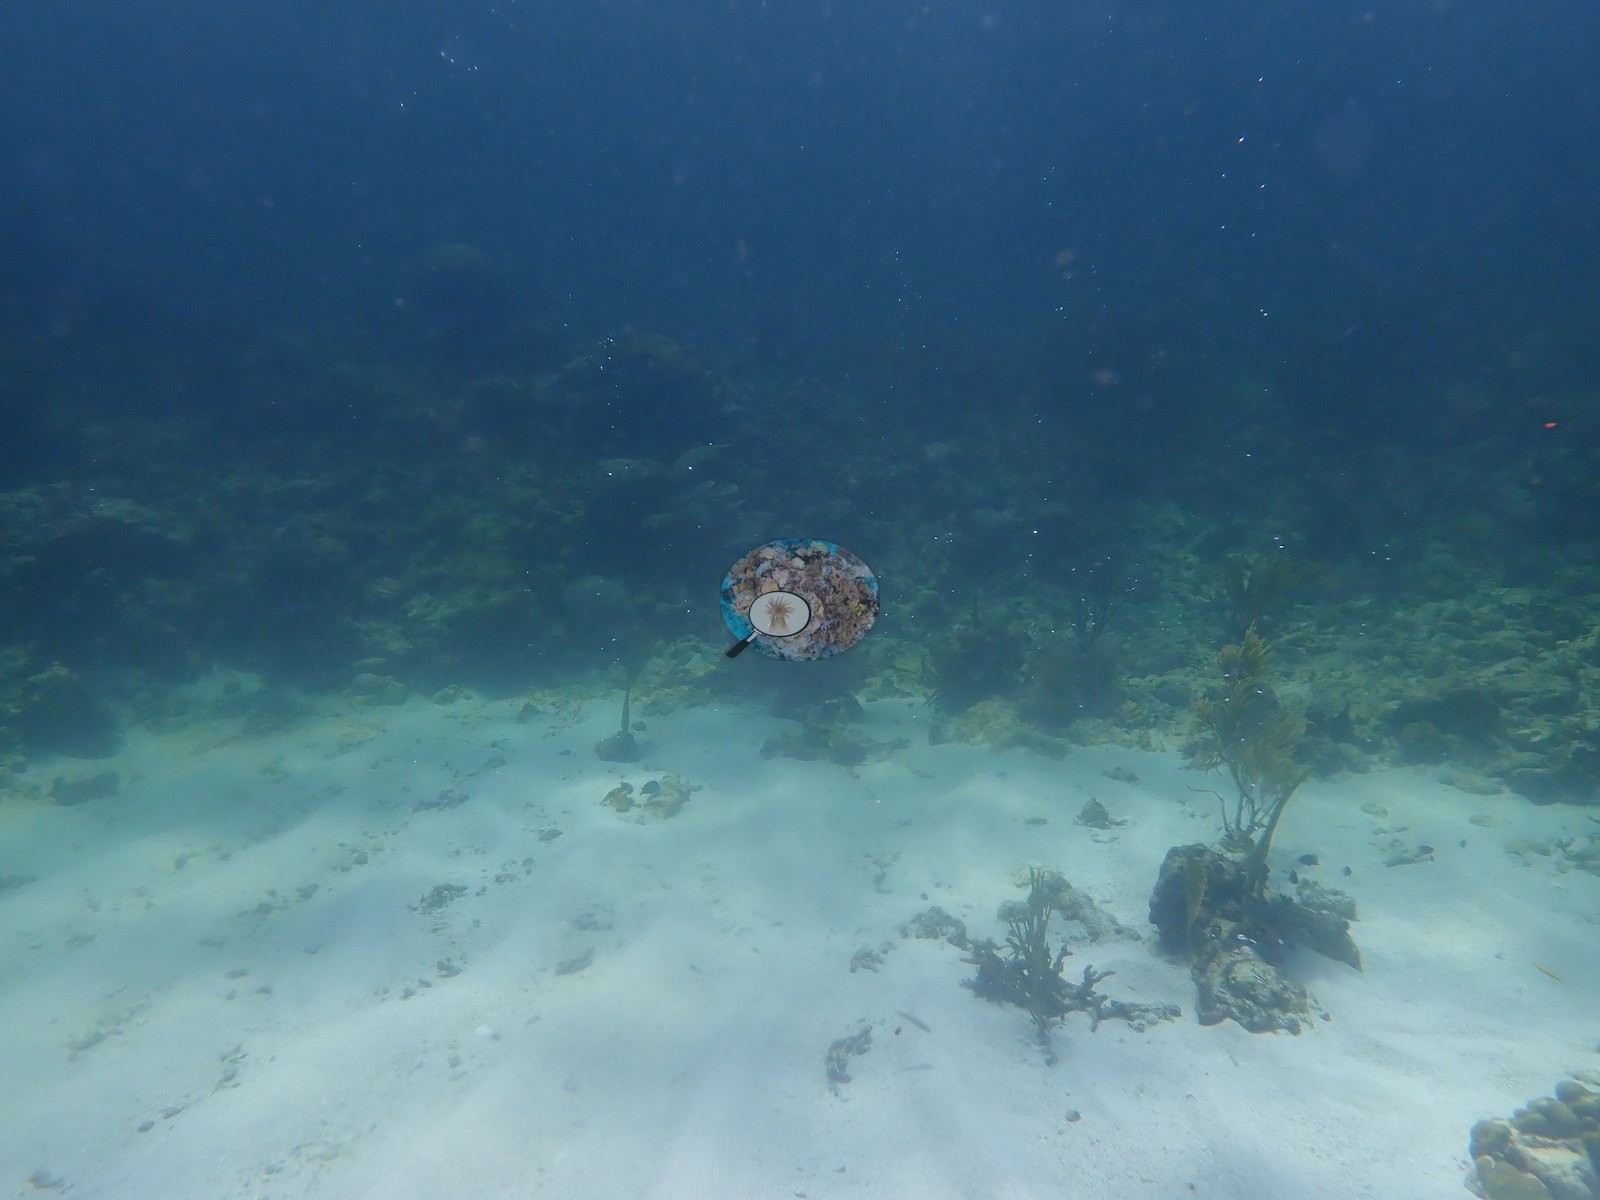
Mayreau Gardens sits off Mayreau in the Tobago Cays, dived on 26 September and 1 October 2019 to about 24 m. Water in several frames is green and slightly turbid, consistent with the silty patch-reef character of the wider vent area.
General benthic features
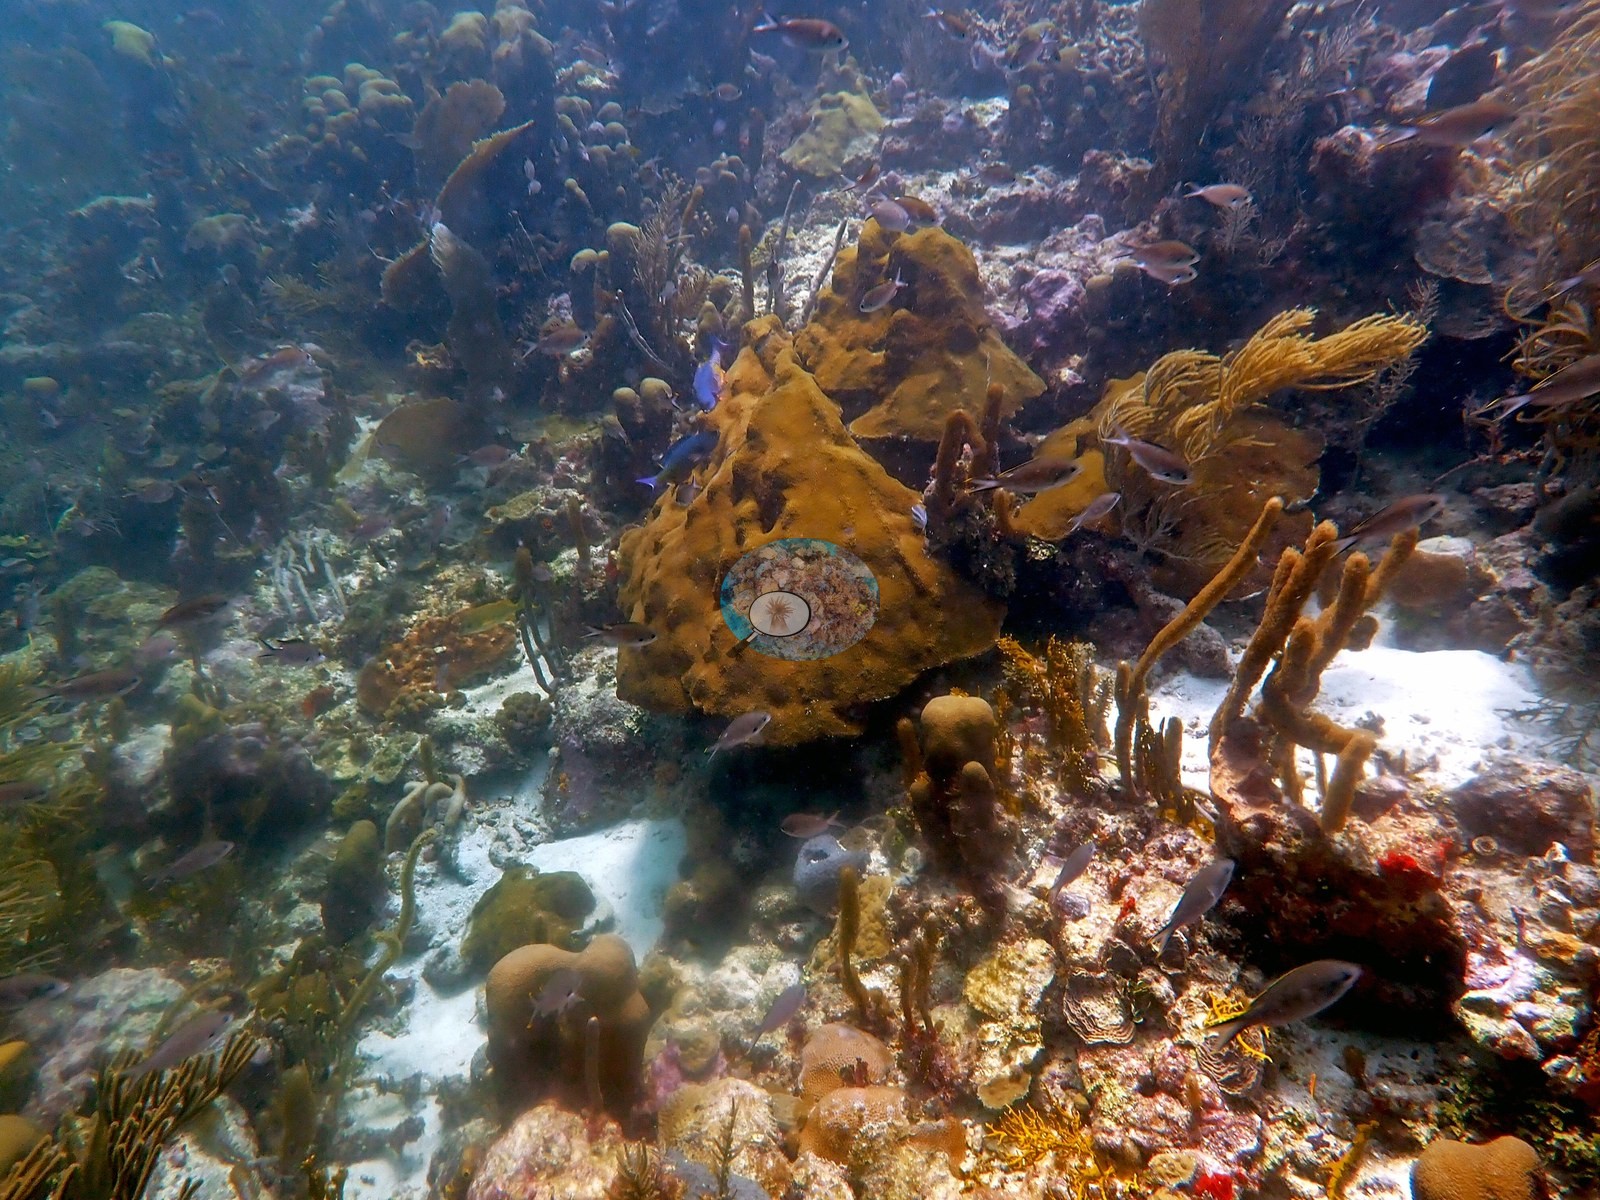
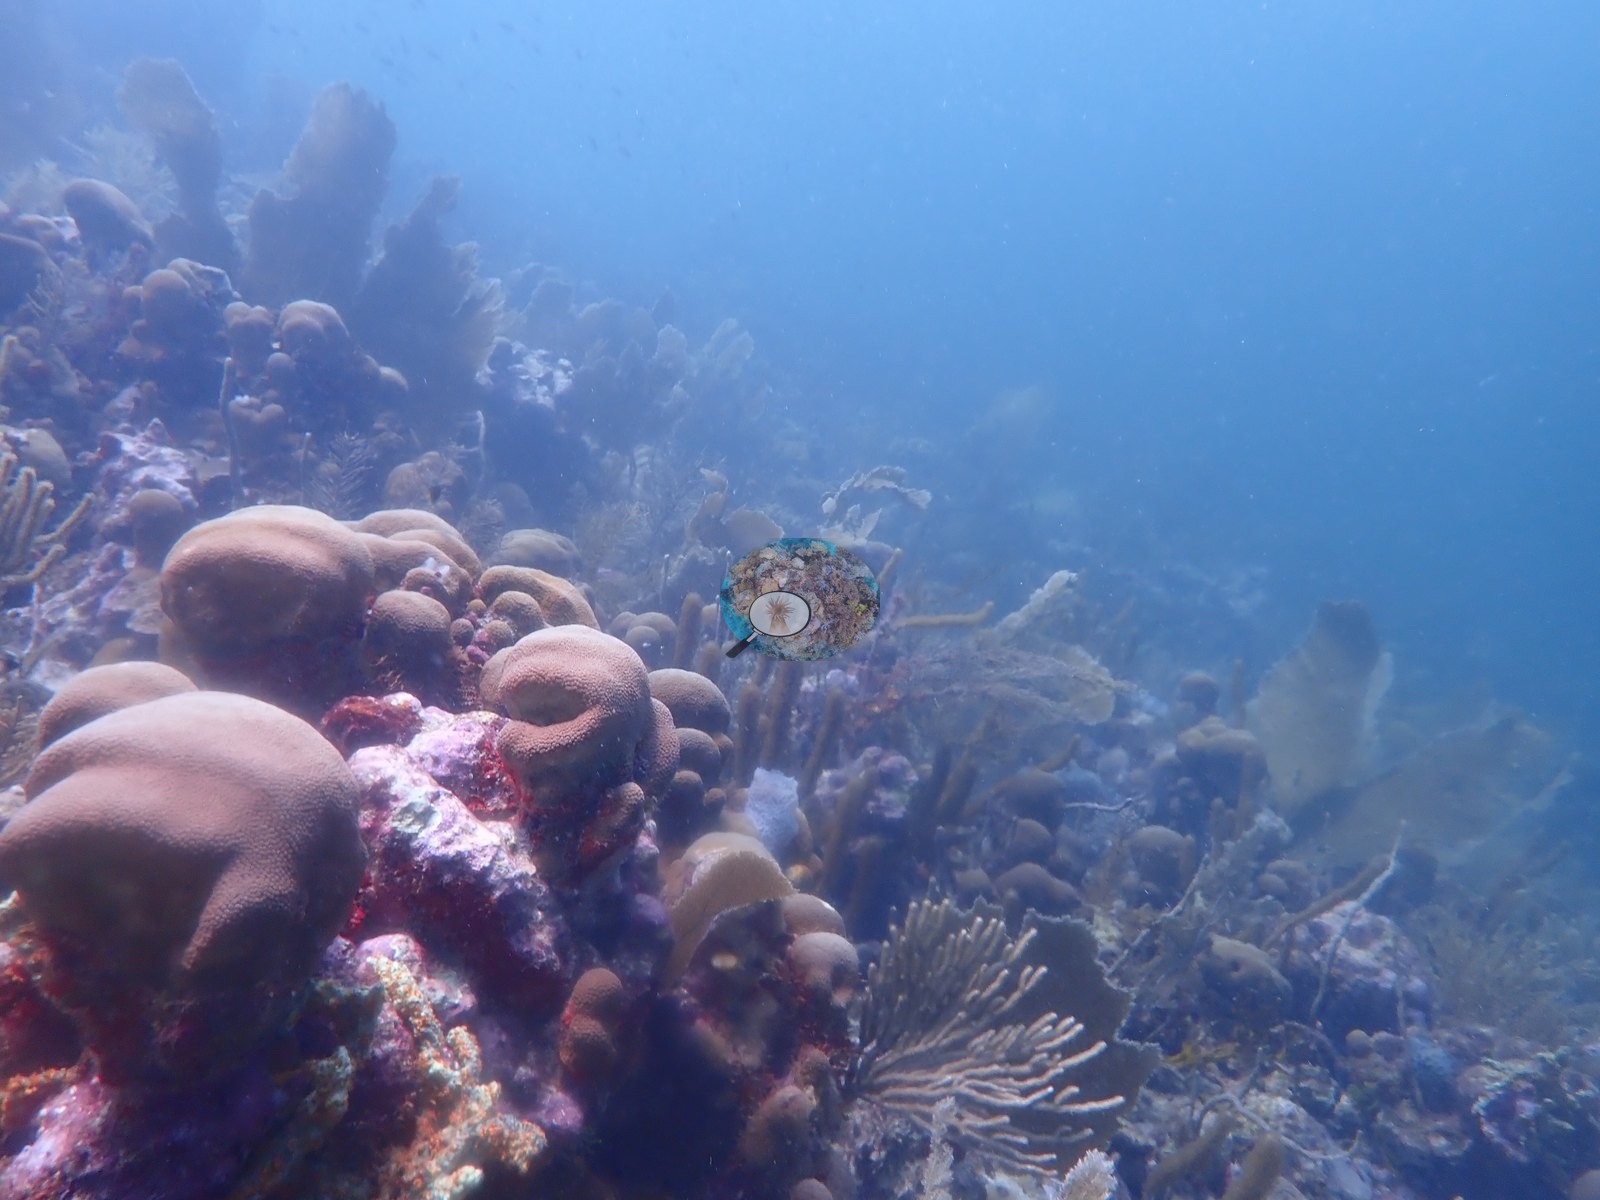
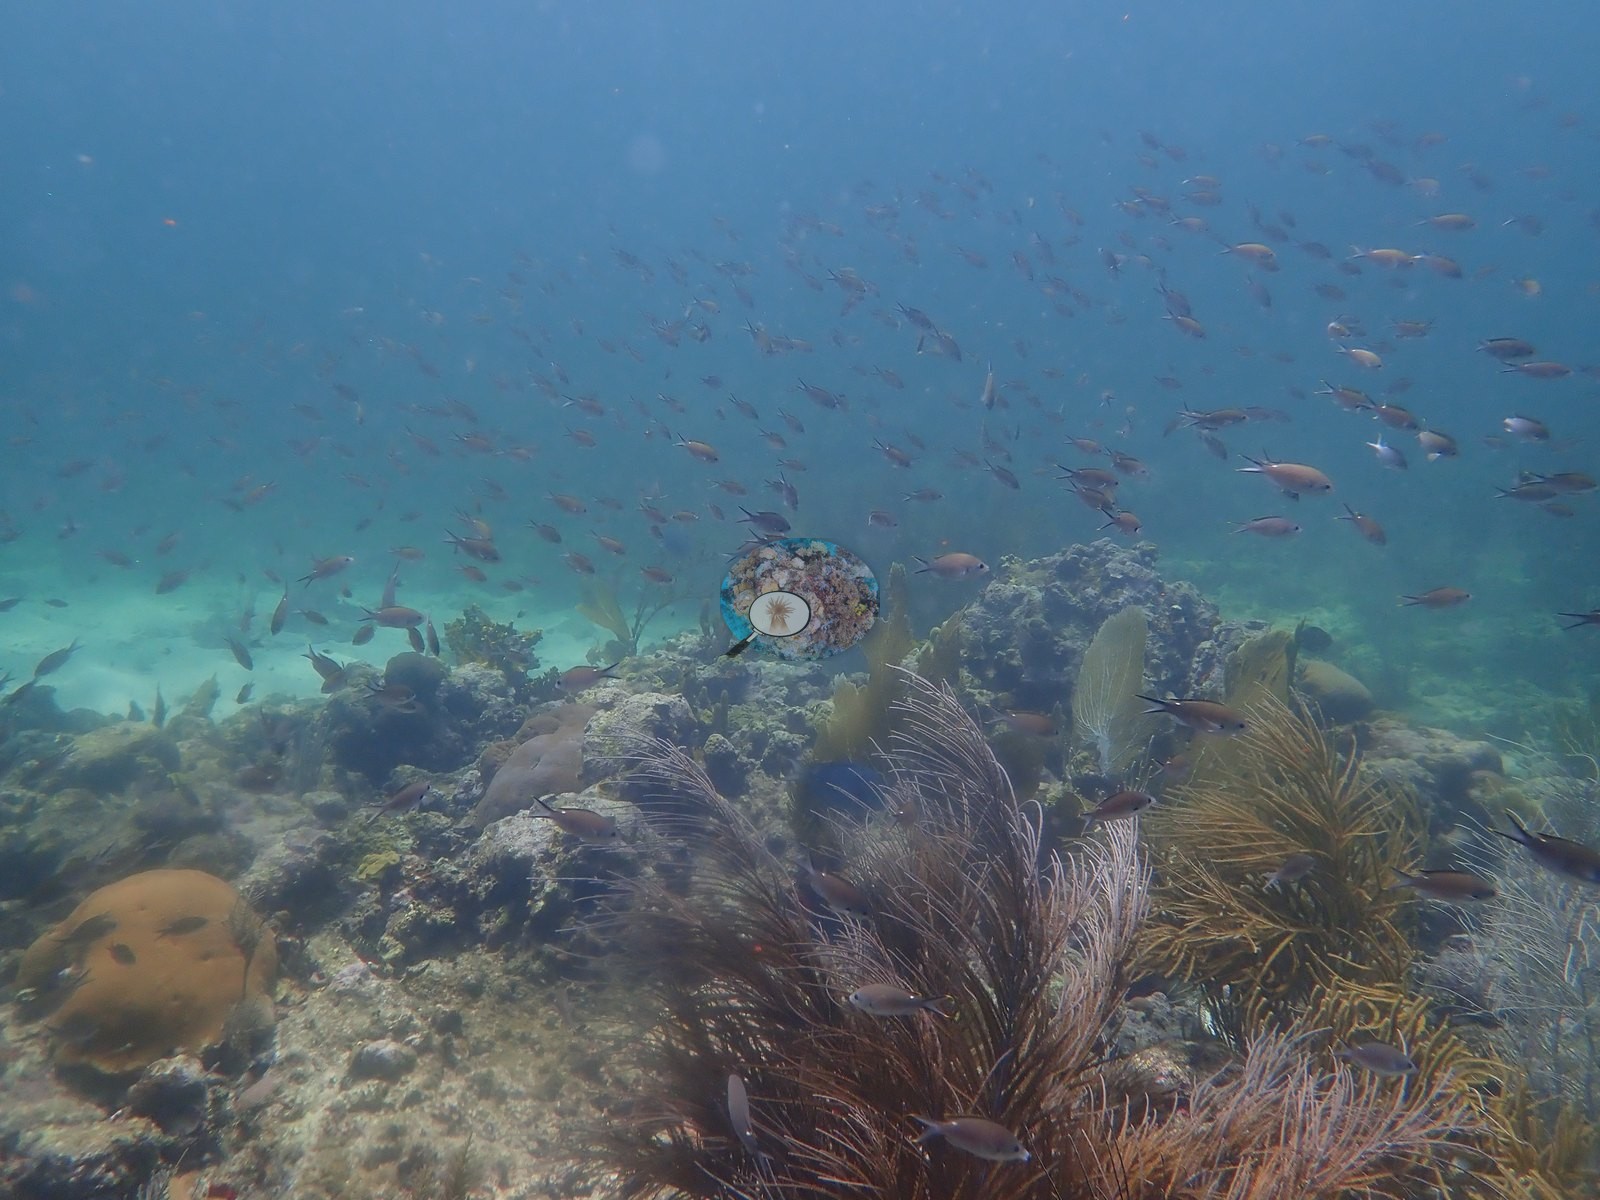
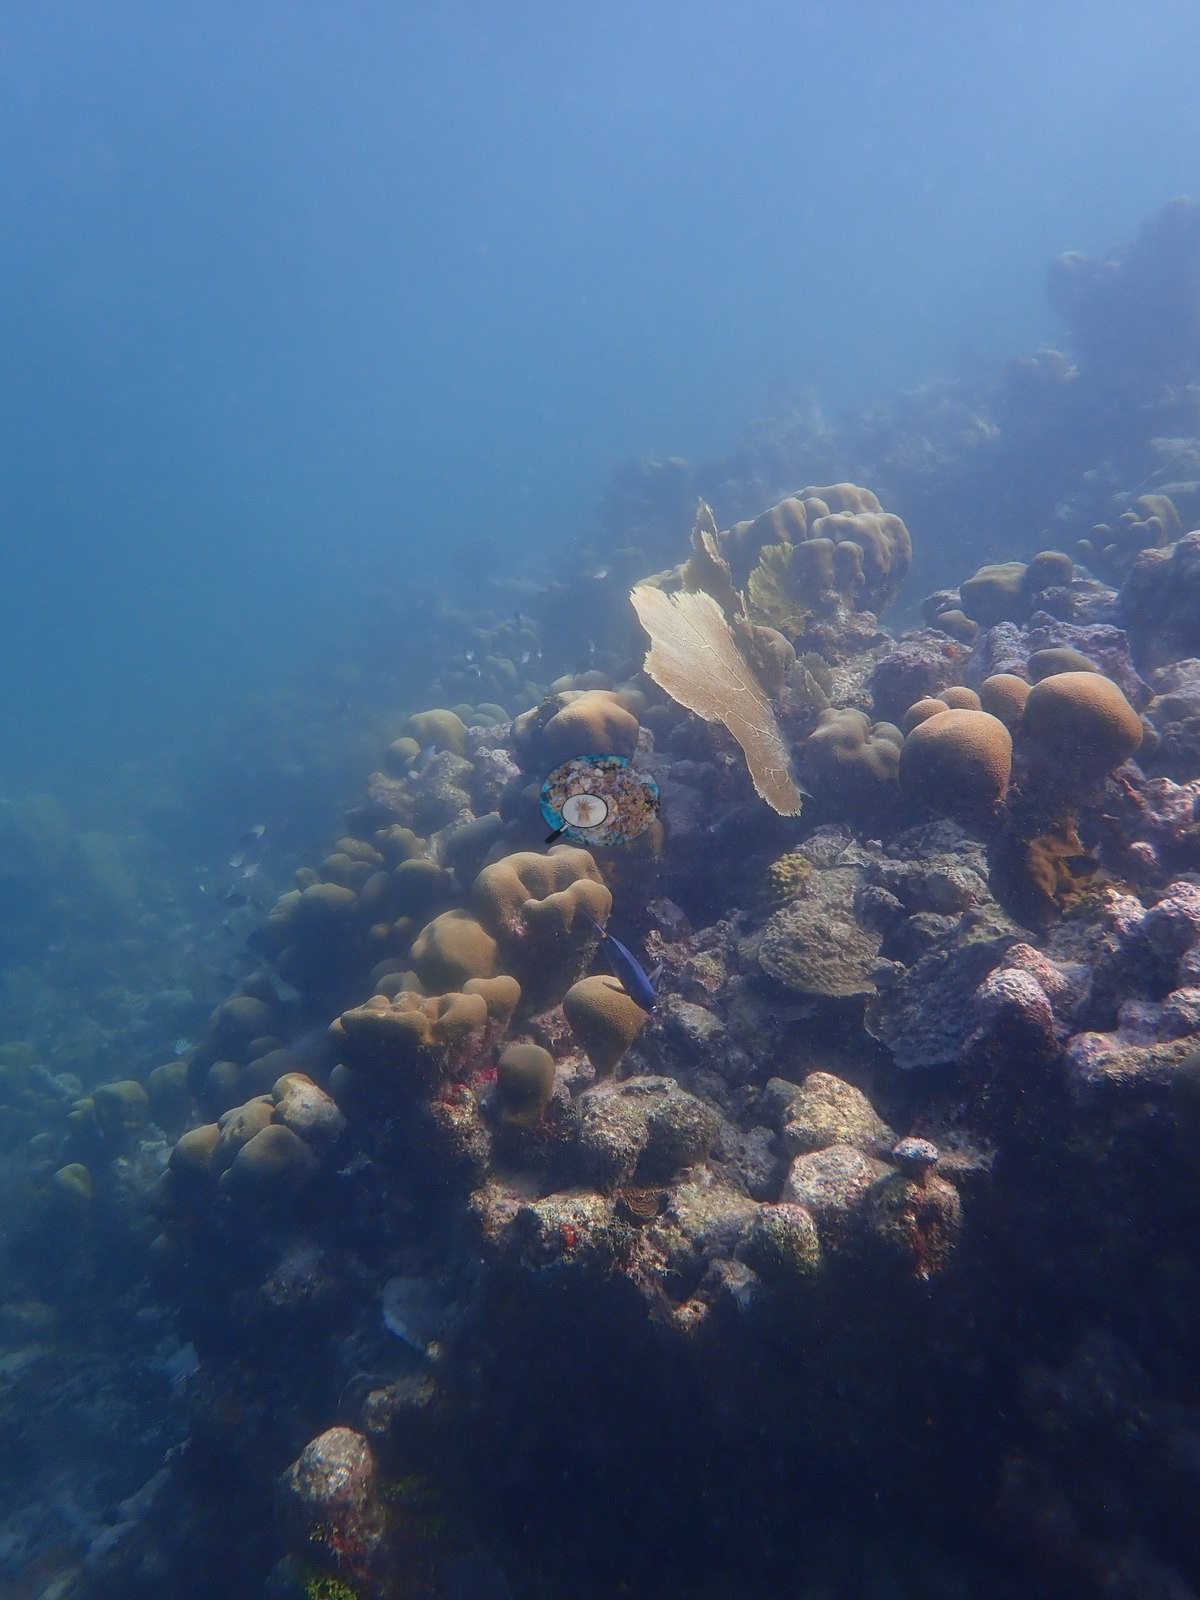
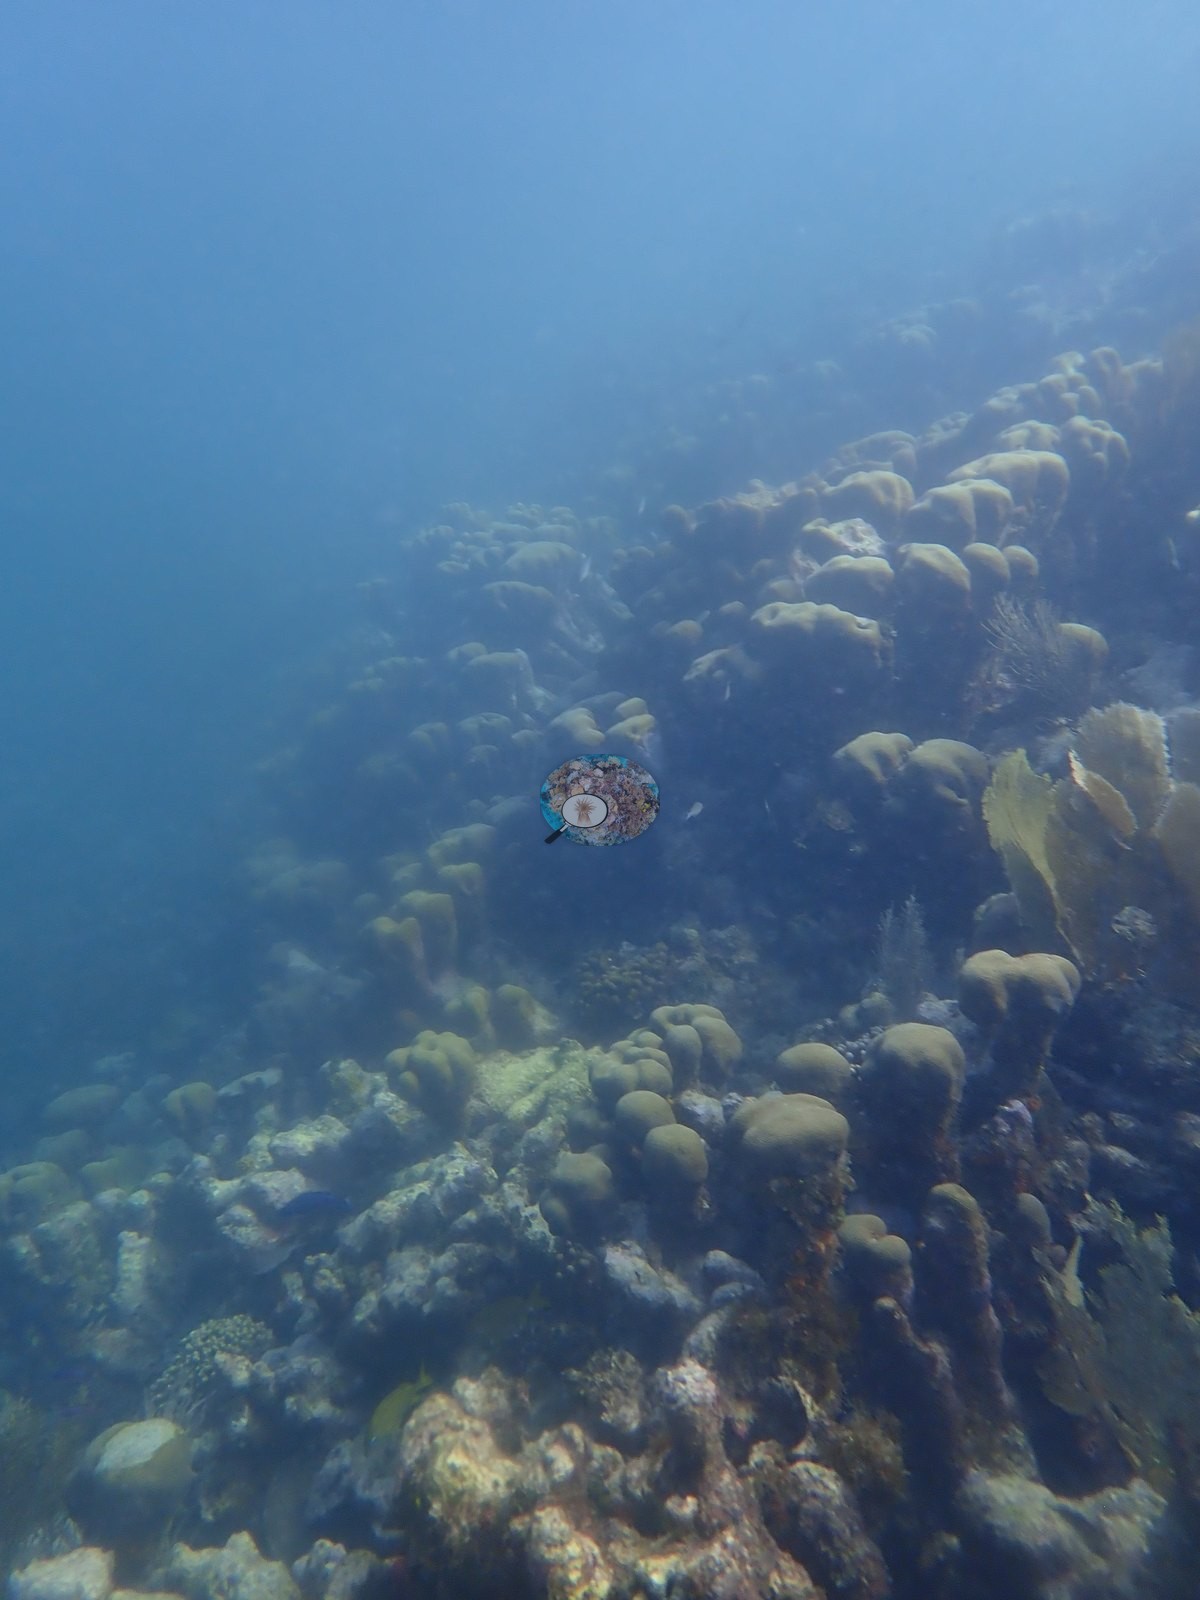
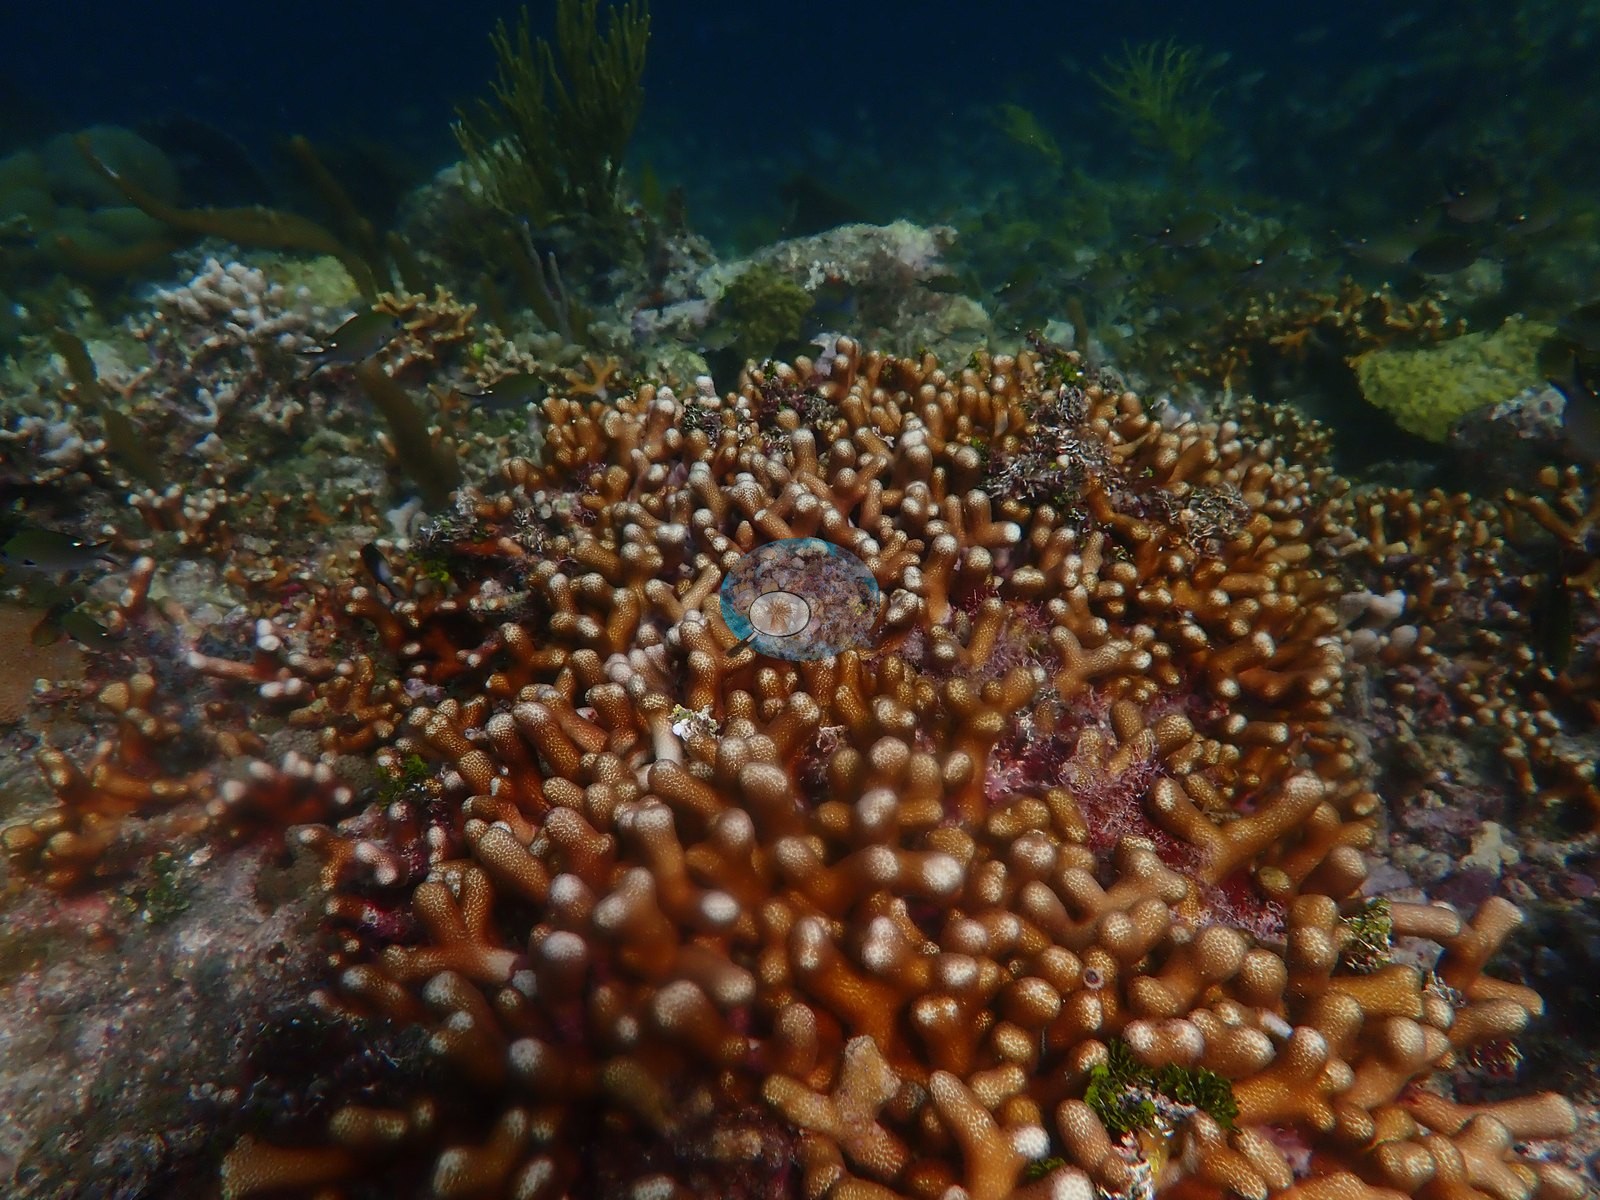
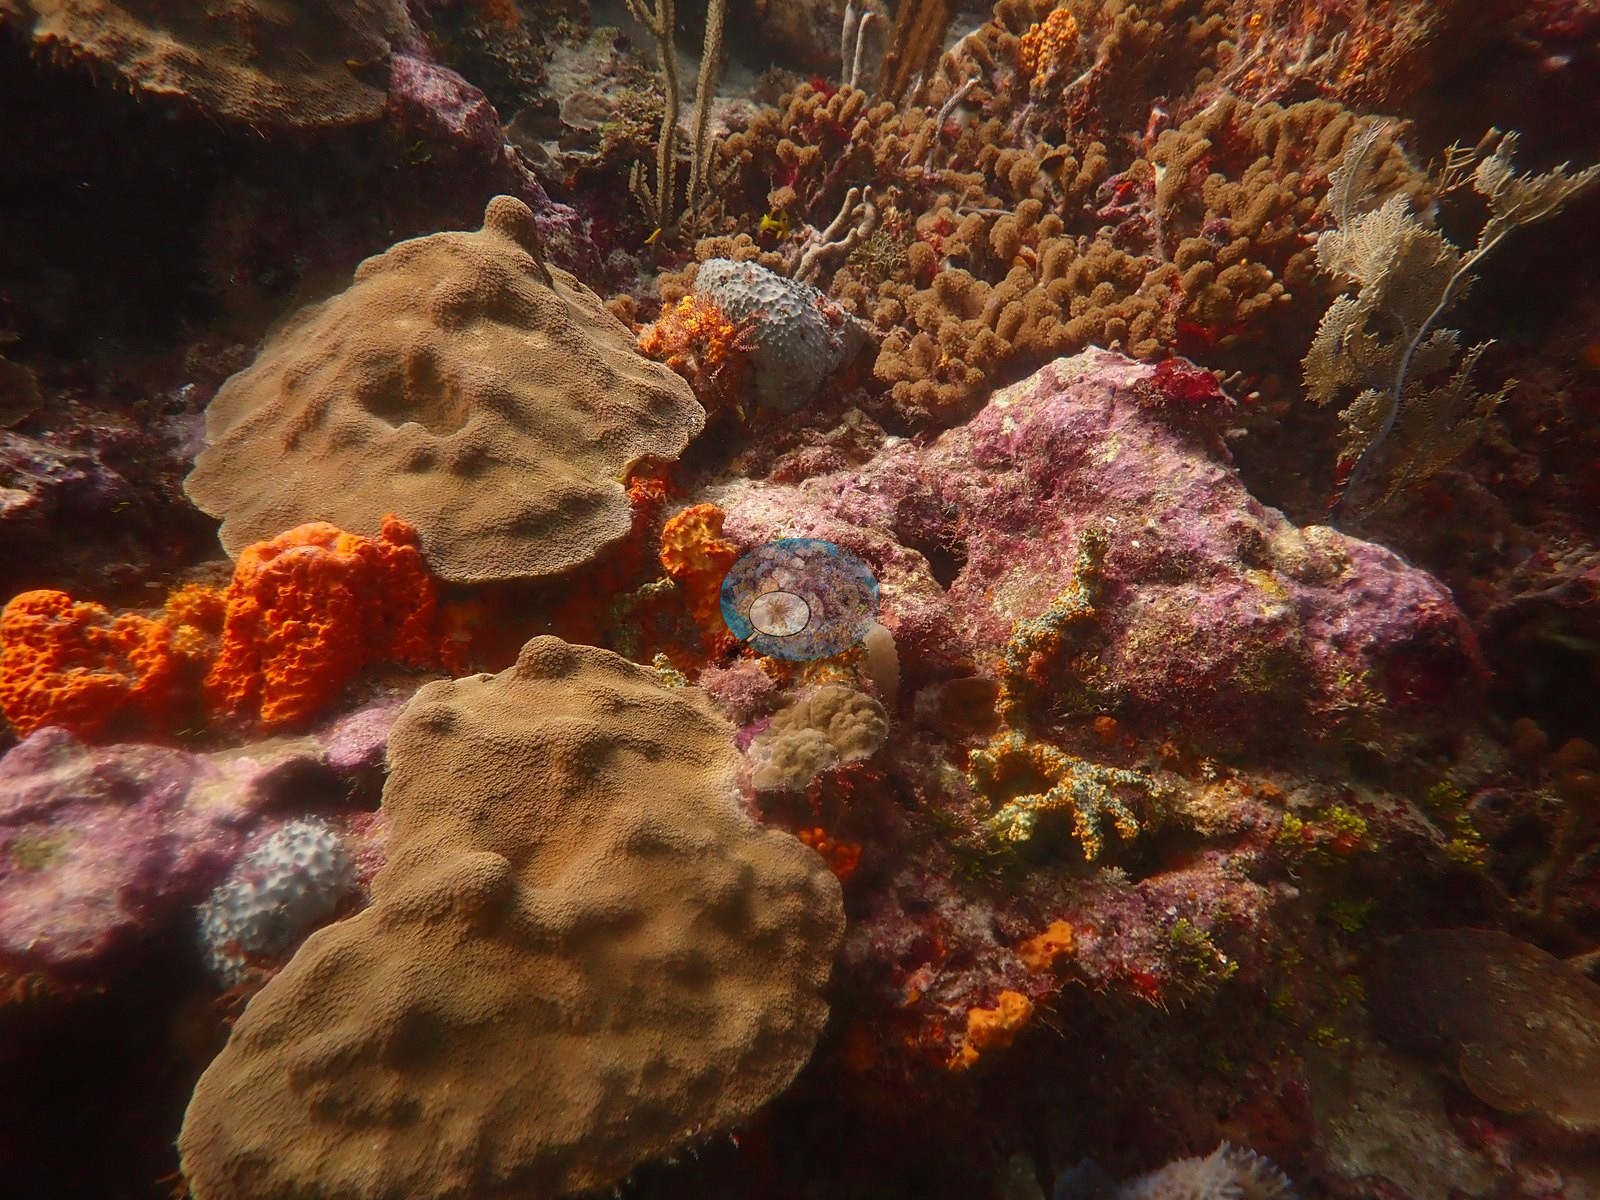
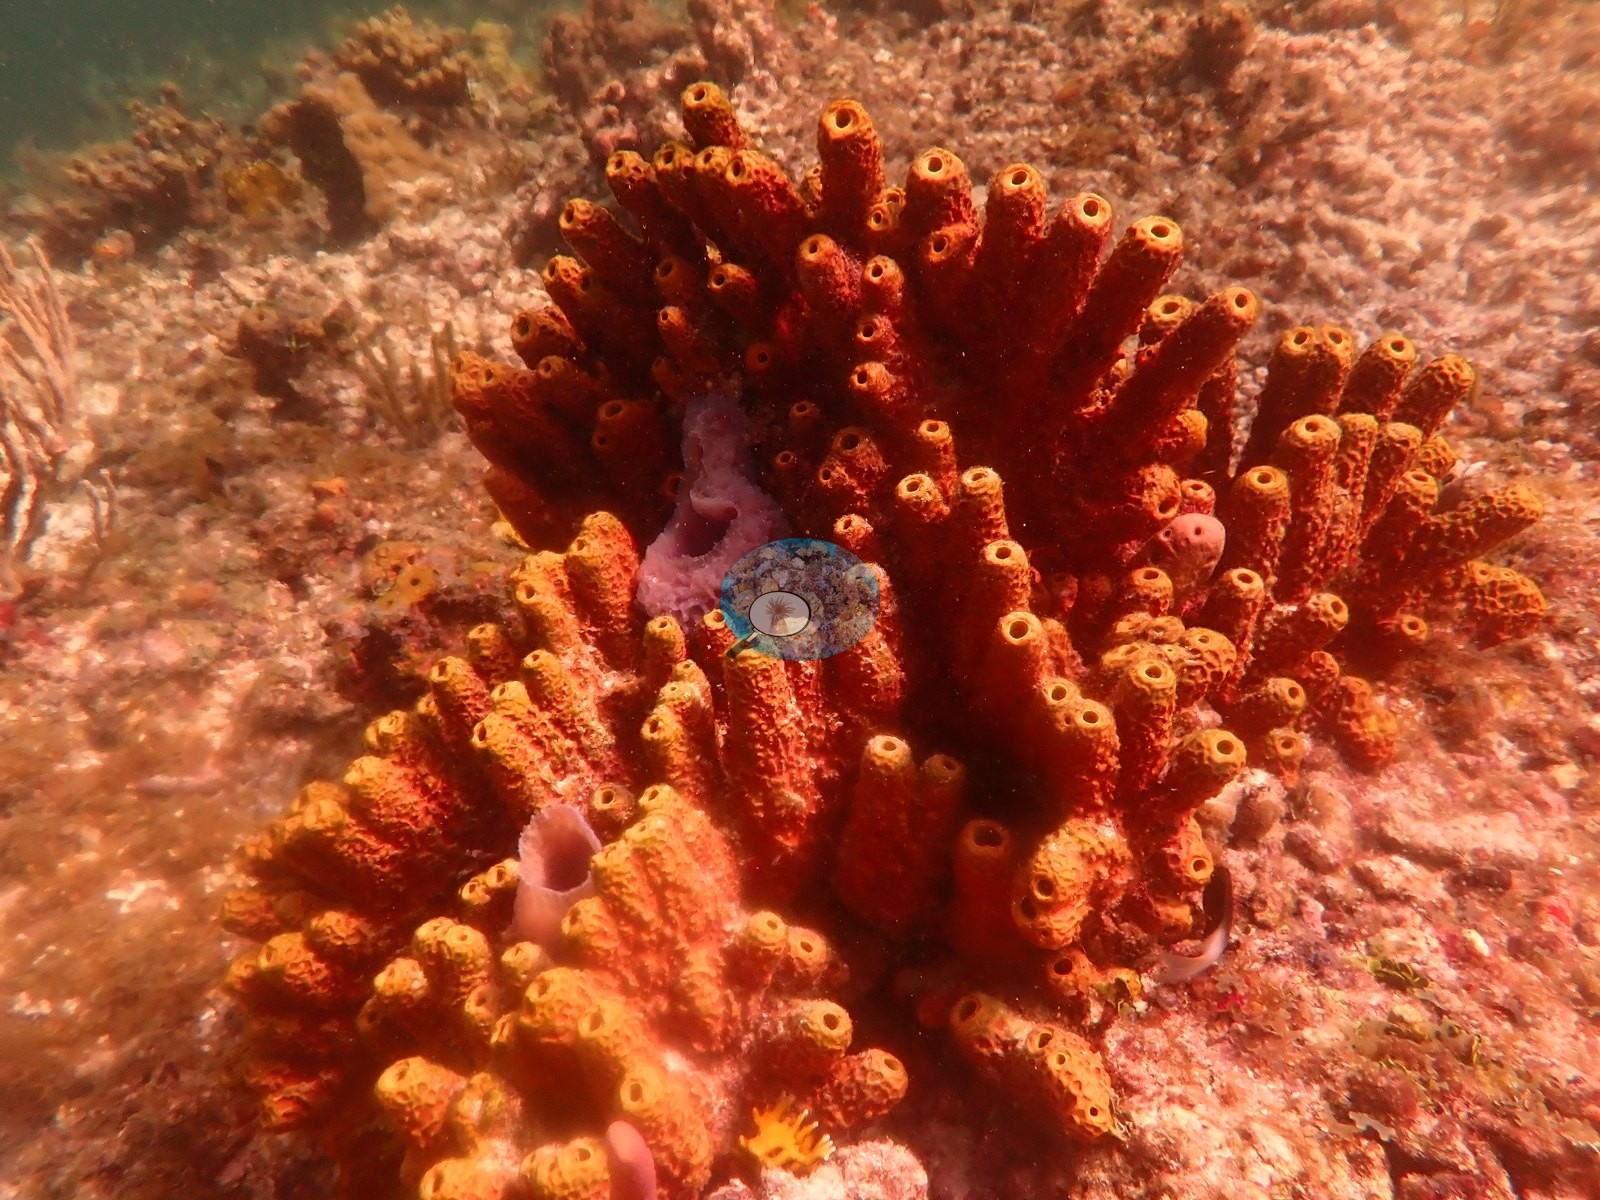
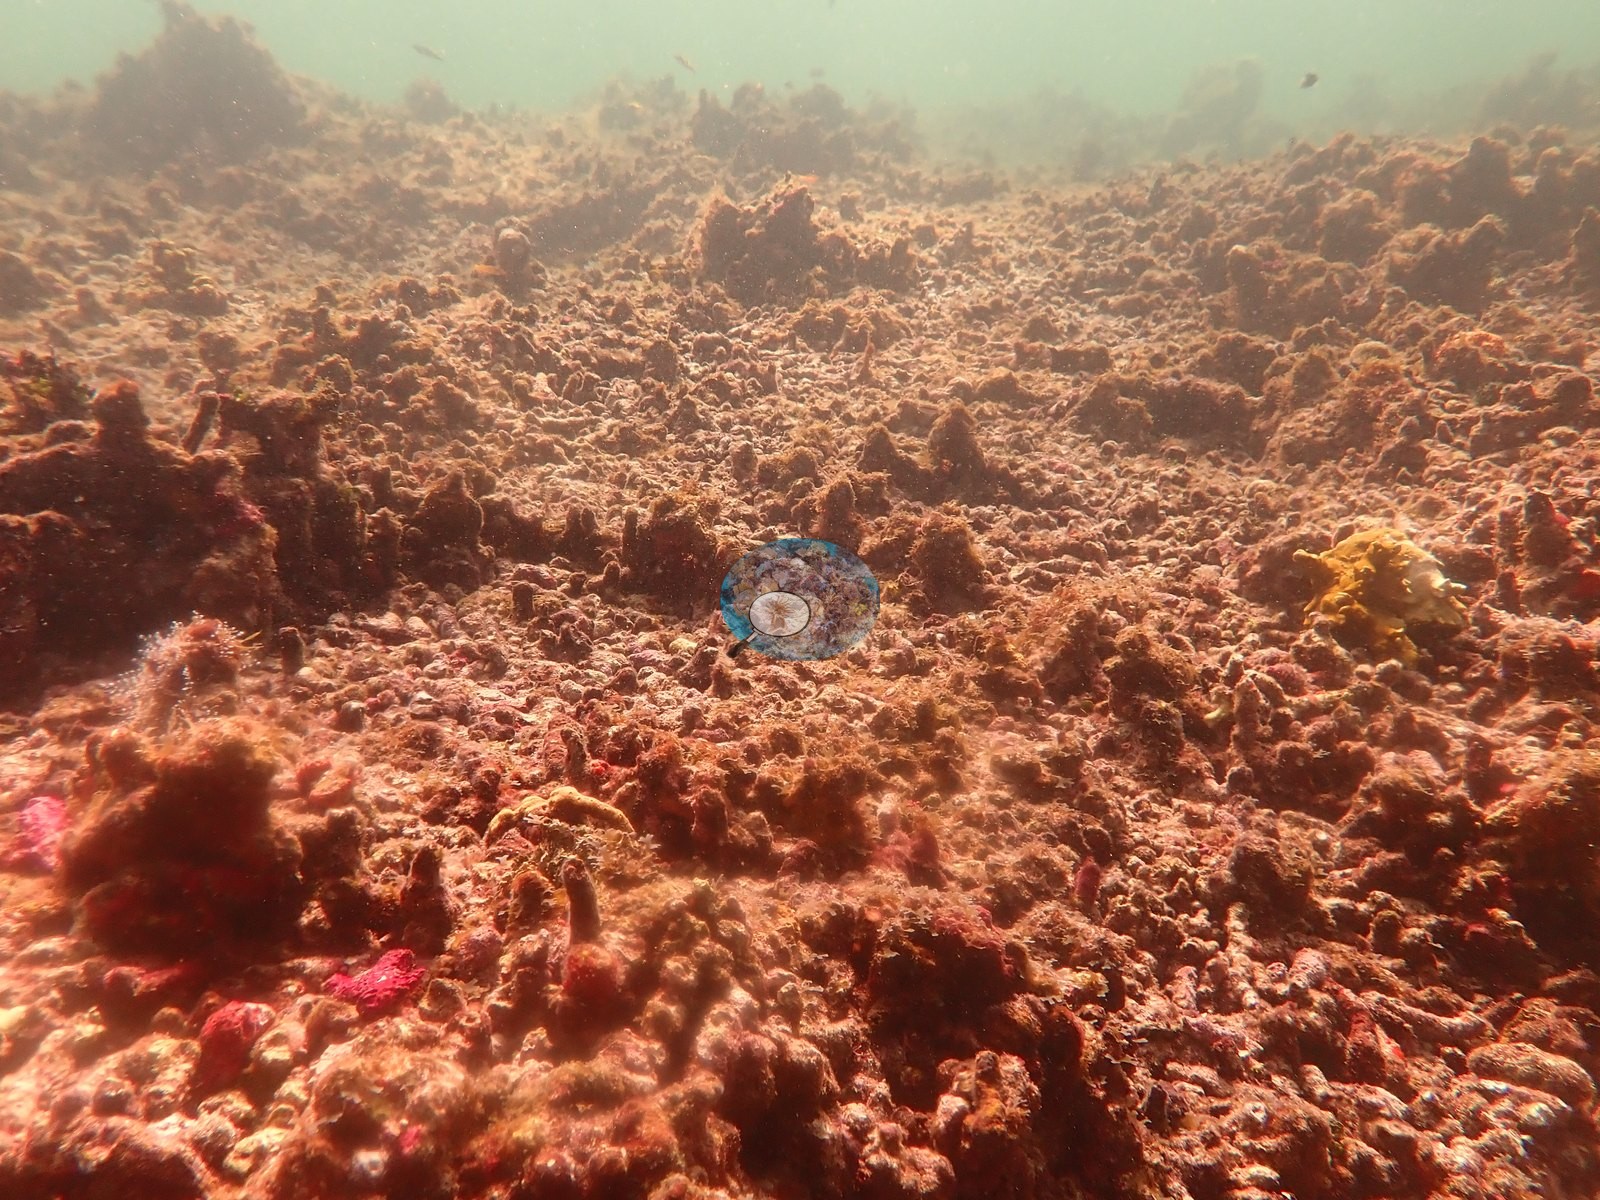
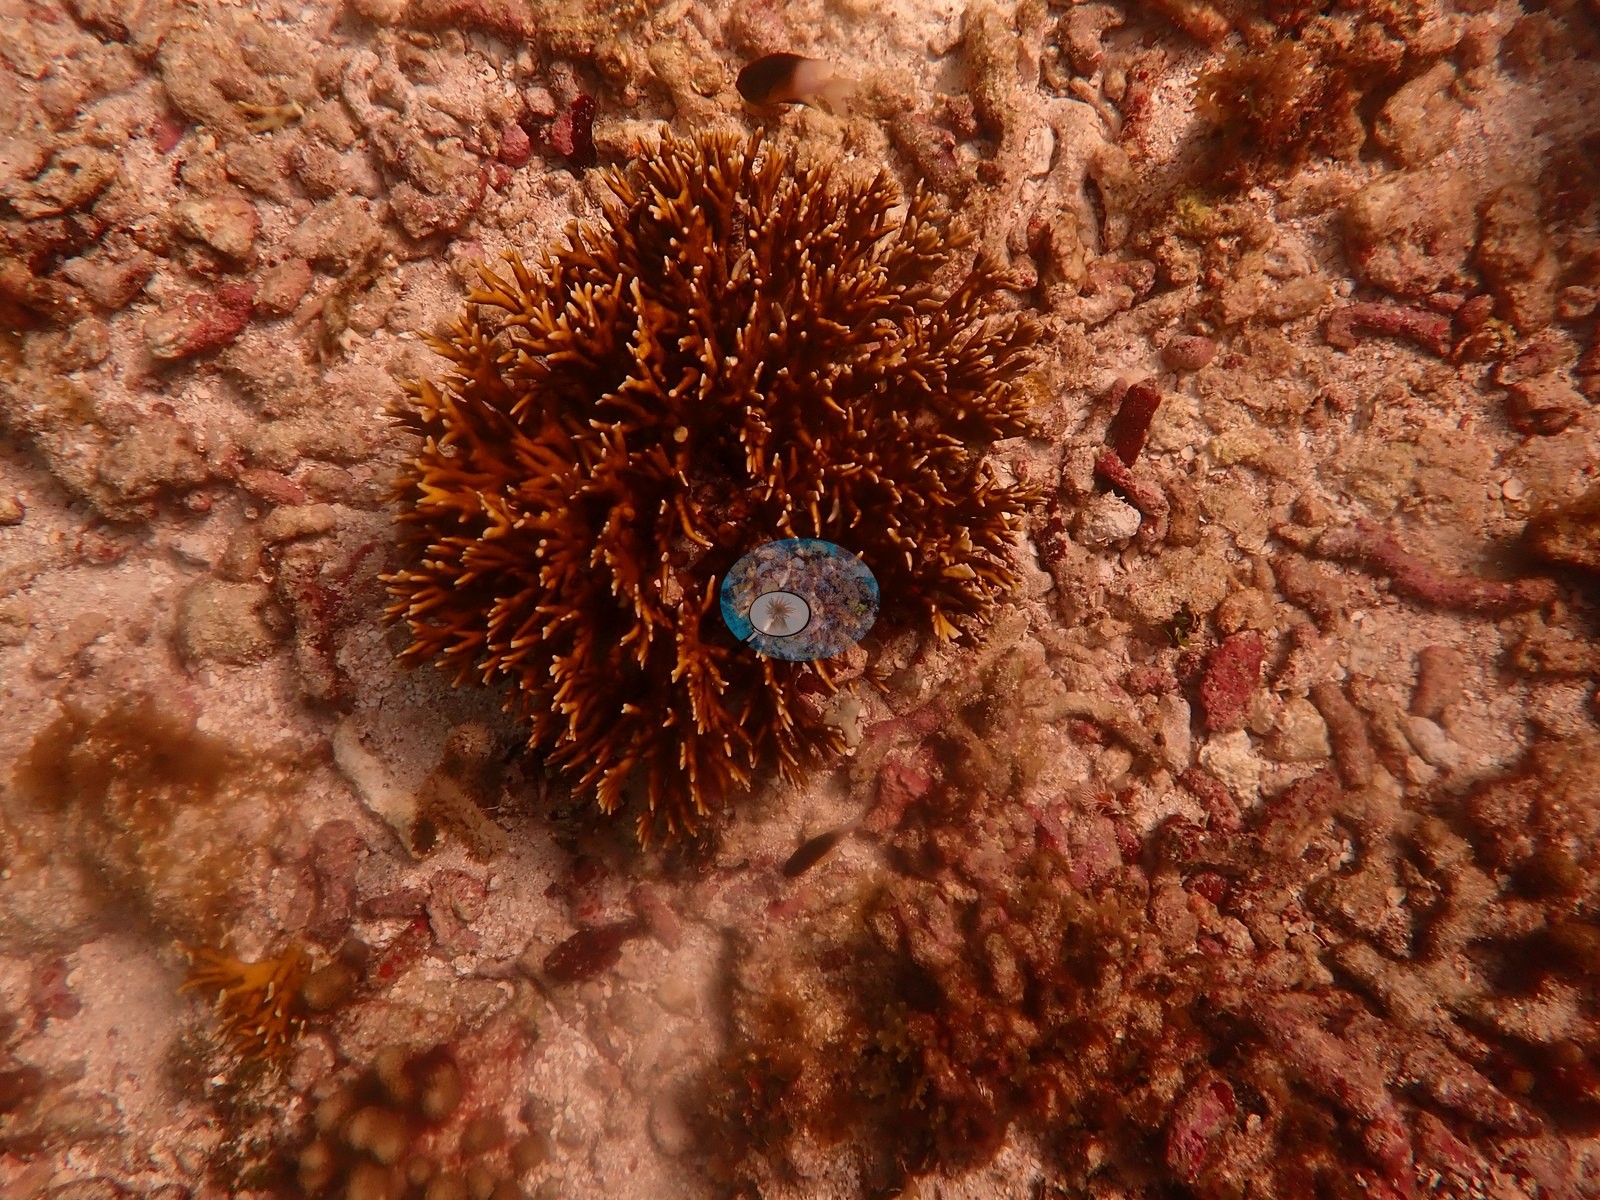
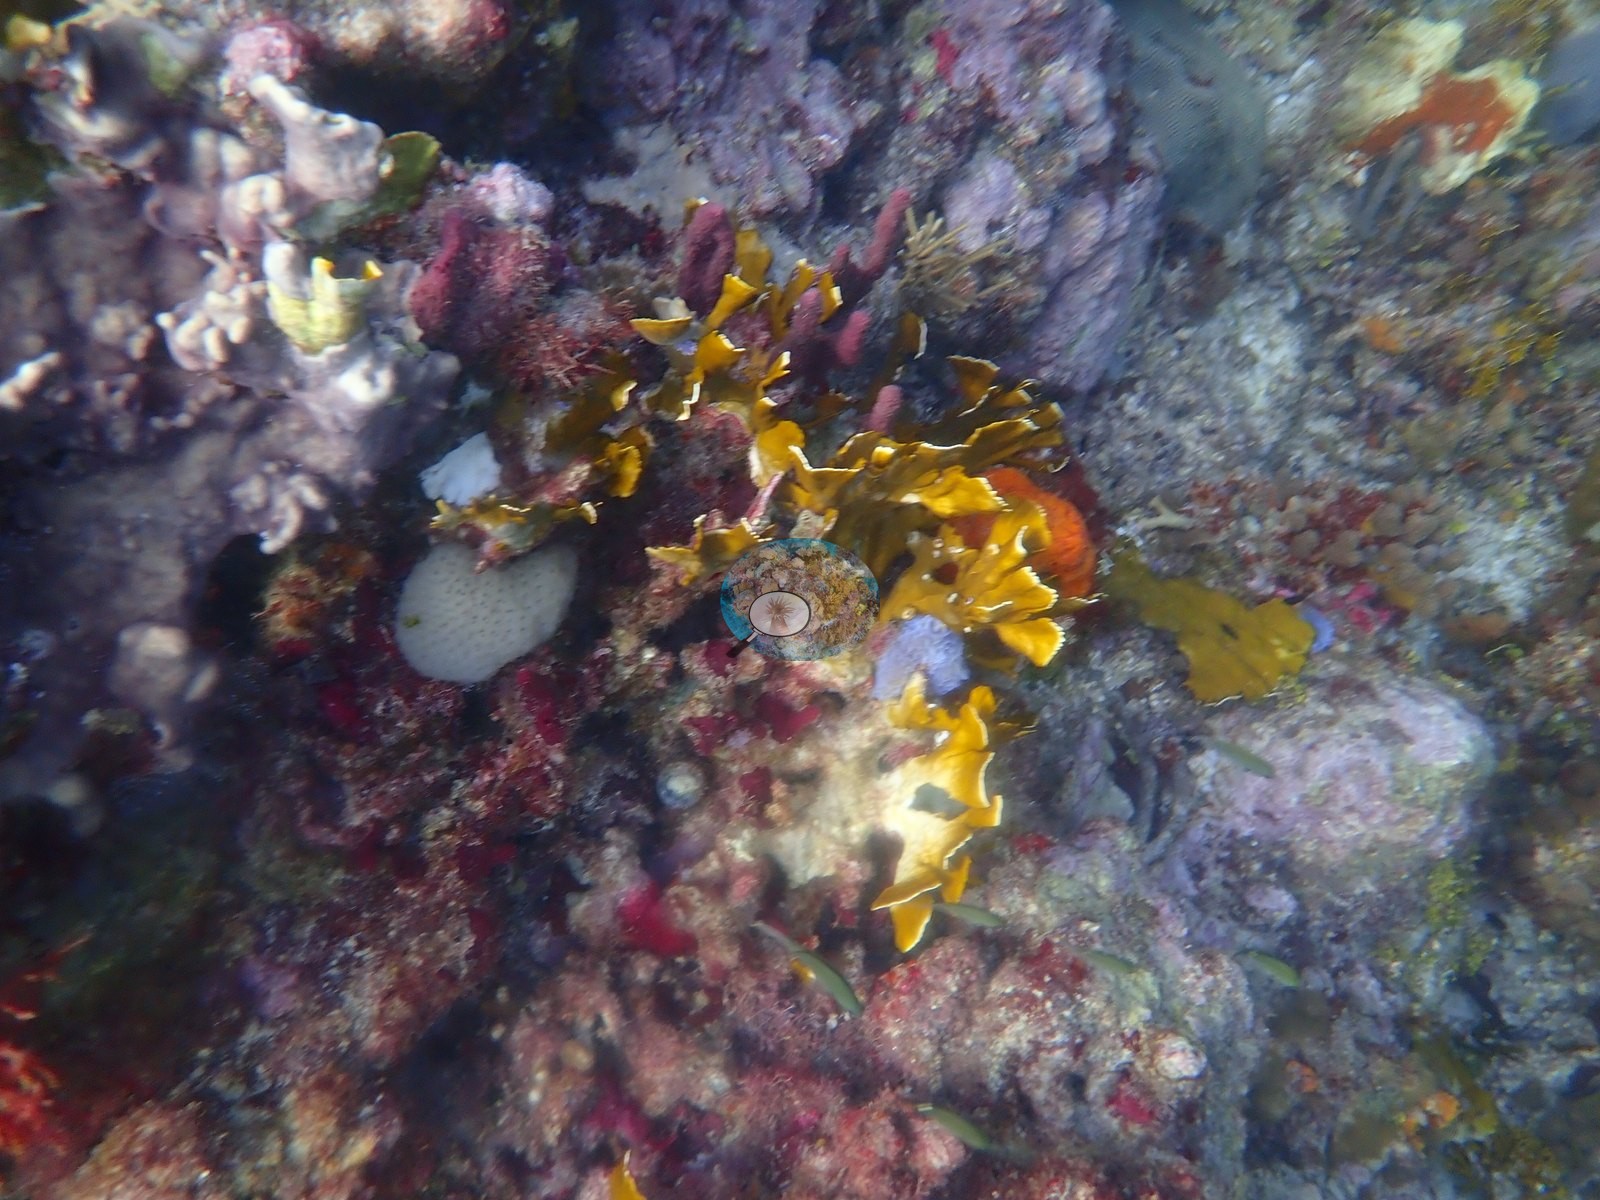
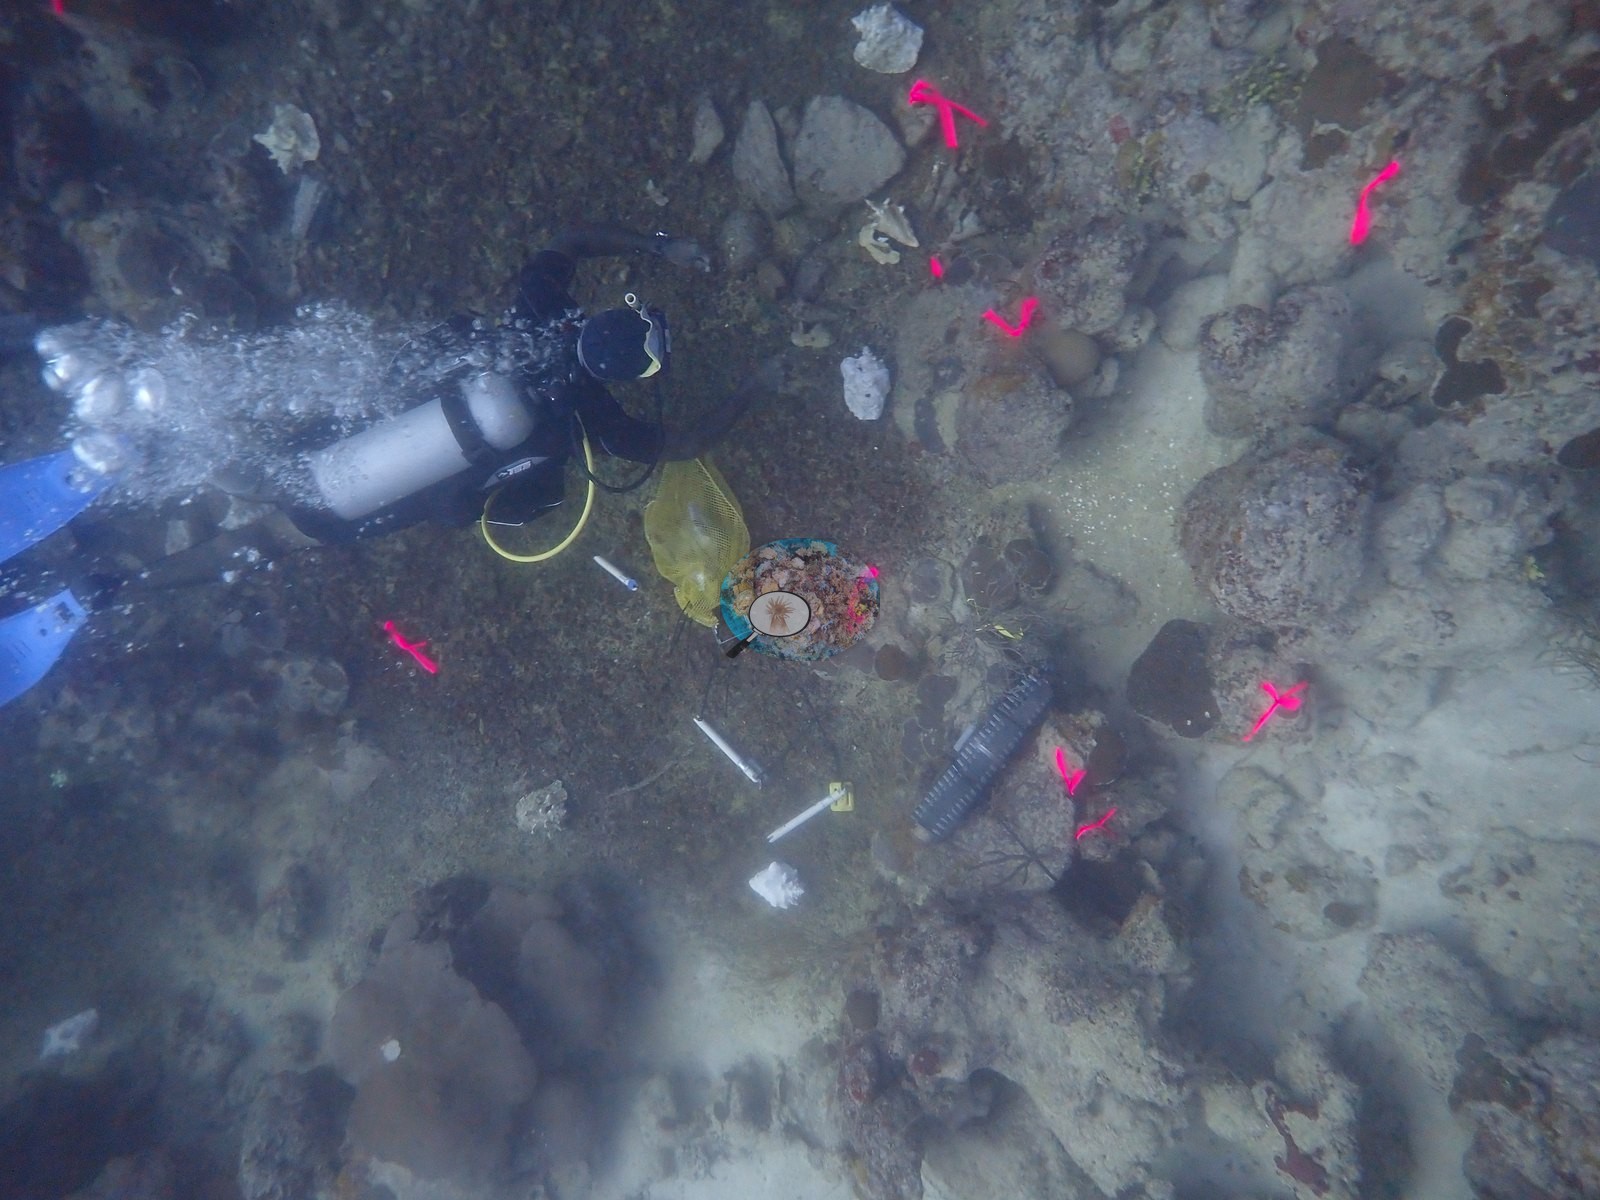
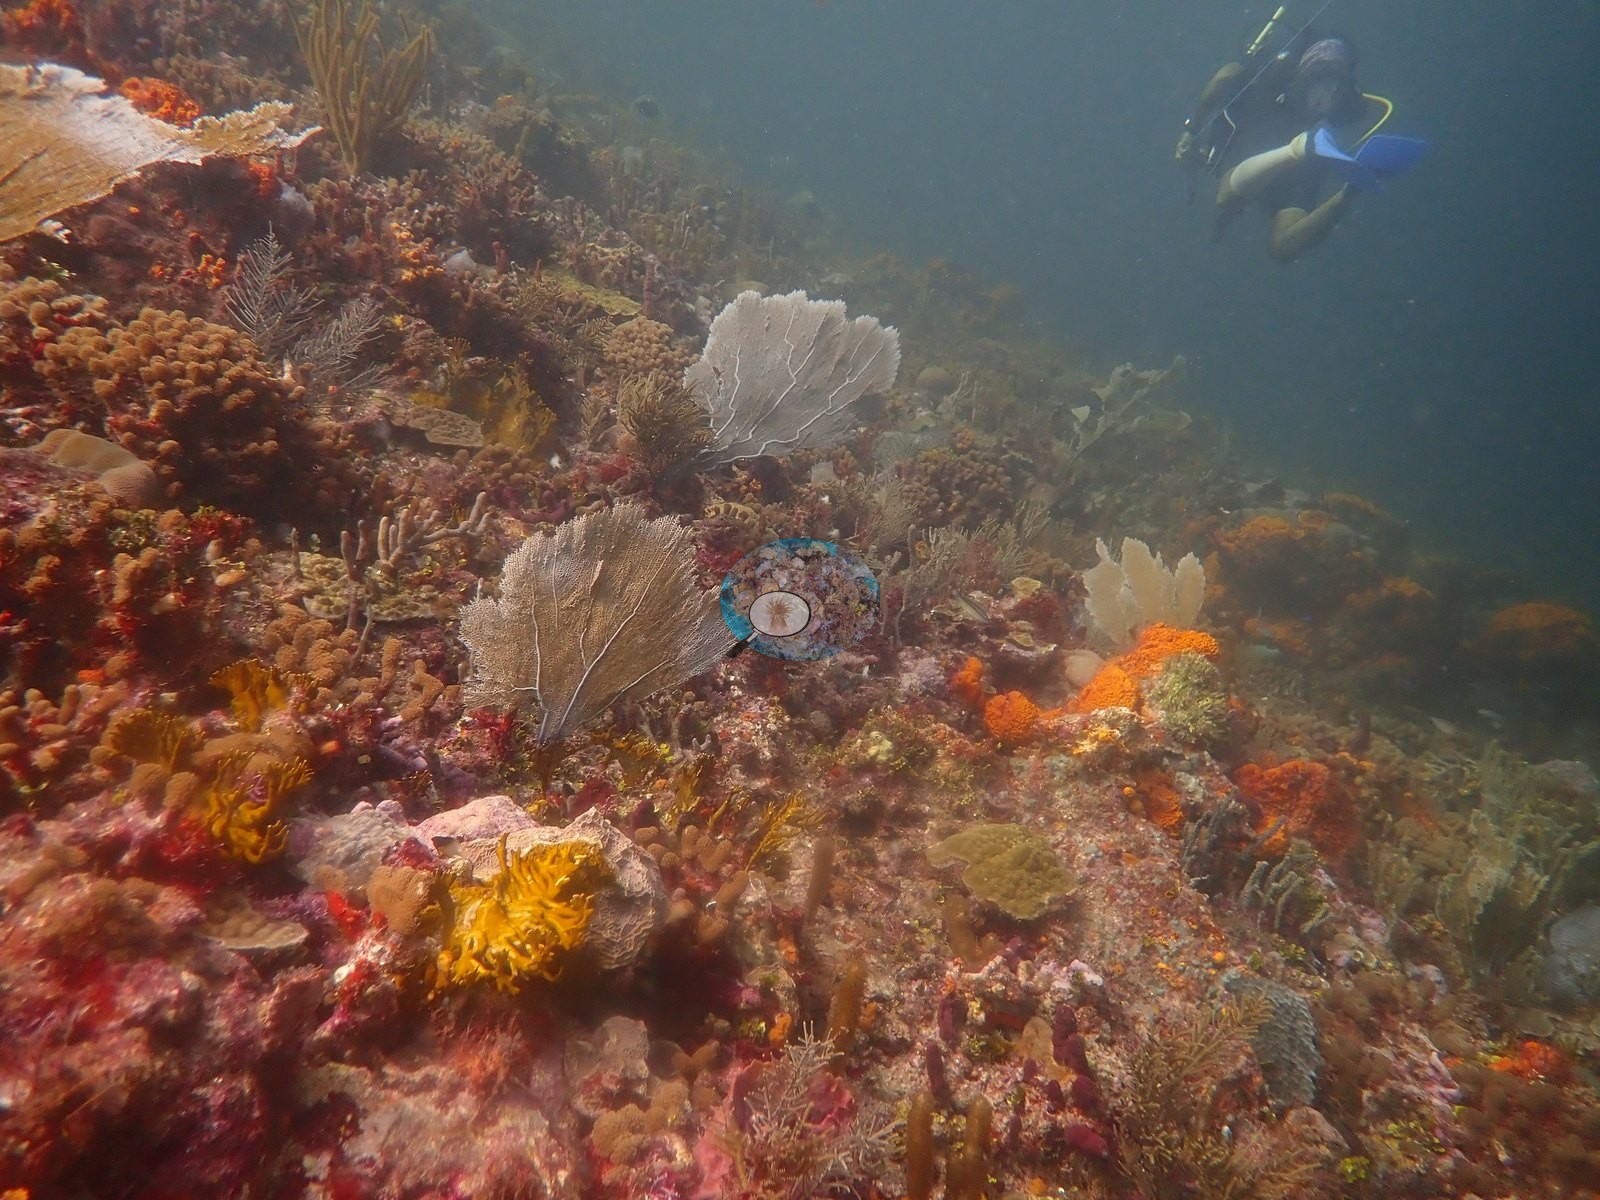
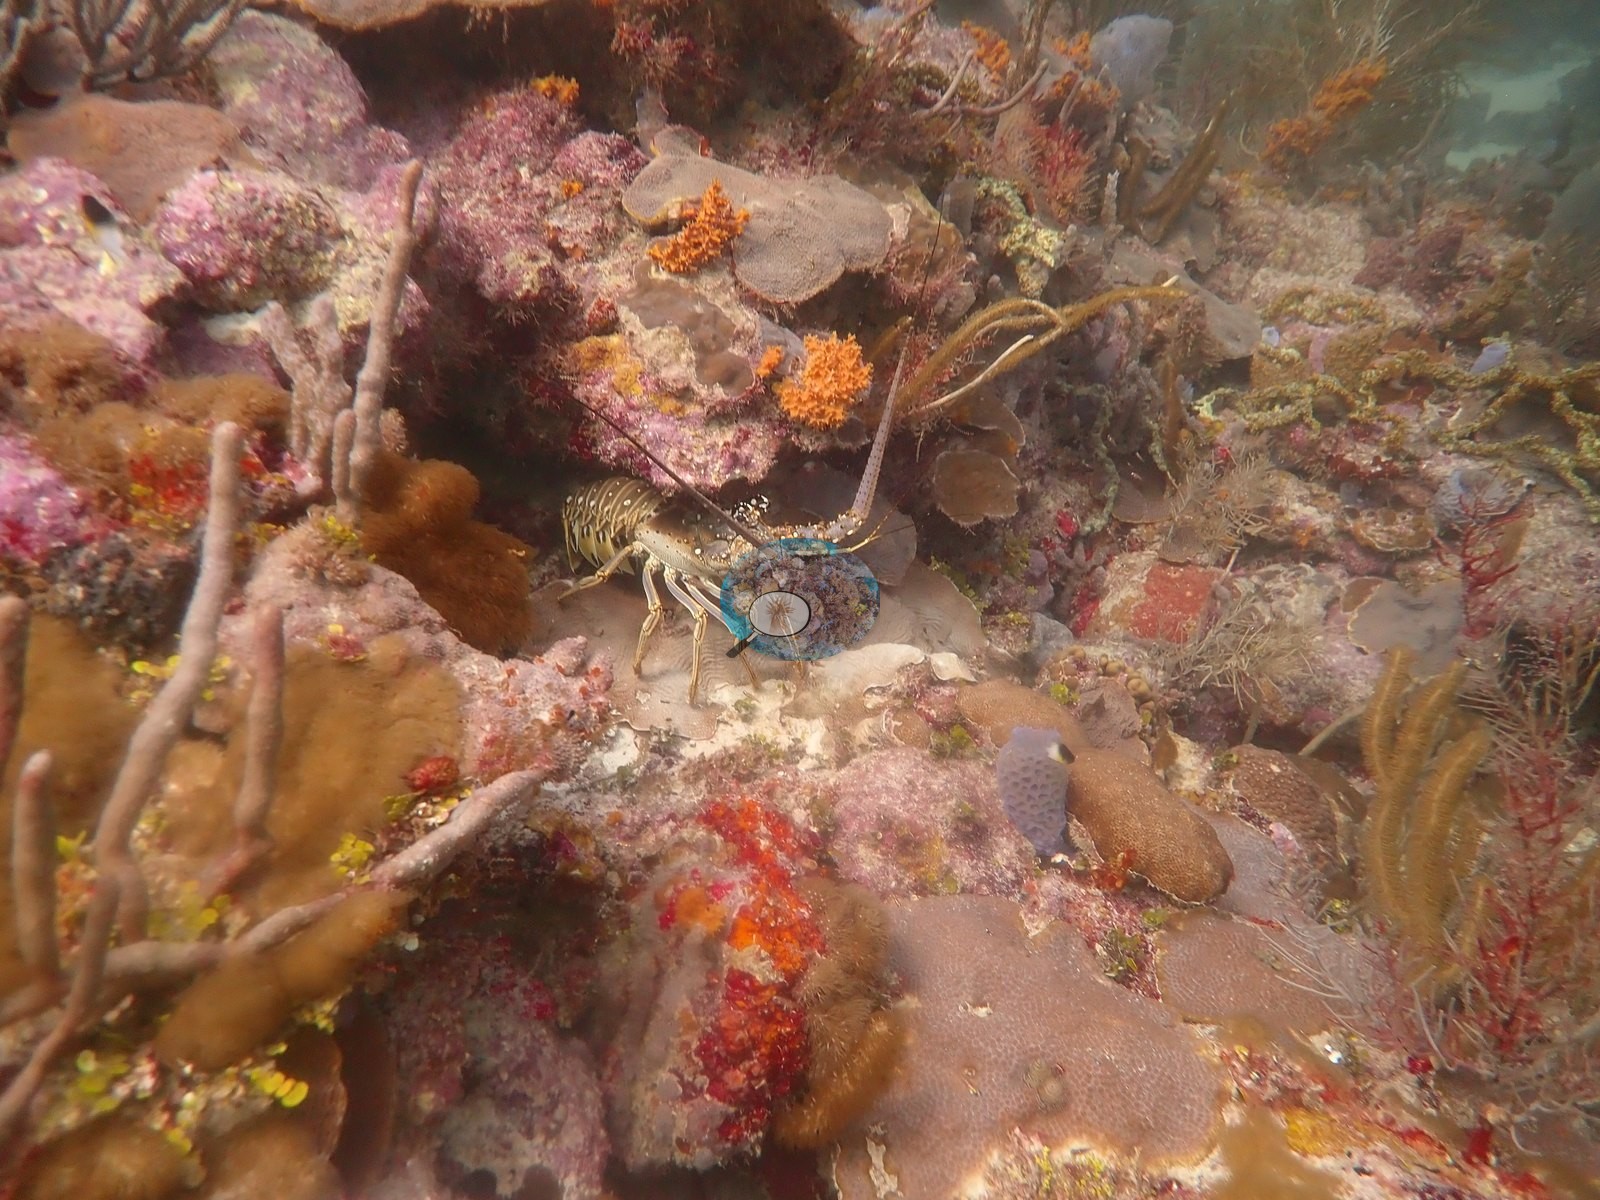
Anderson's frames show a classic eastern Caribbean sponge-and-gorgonian reef rather than a coral-framework one: the standing structure is dominated by big brown tube and vase sponges, red and orange encrusting sponges, and a forest of sea rods, sea plumes, and sea fans rising off low, algal-crusted carbonate pavement, with crinoids tucked into crevices (e.g., Image 1).
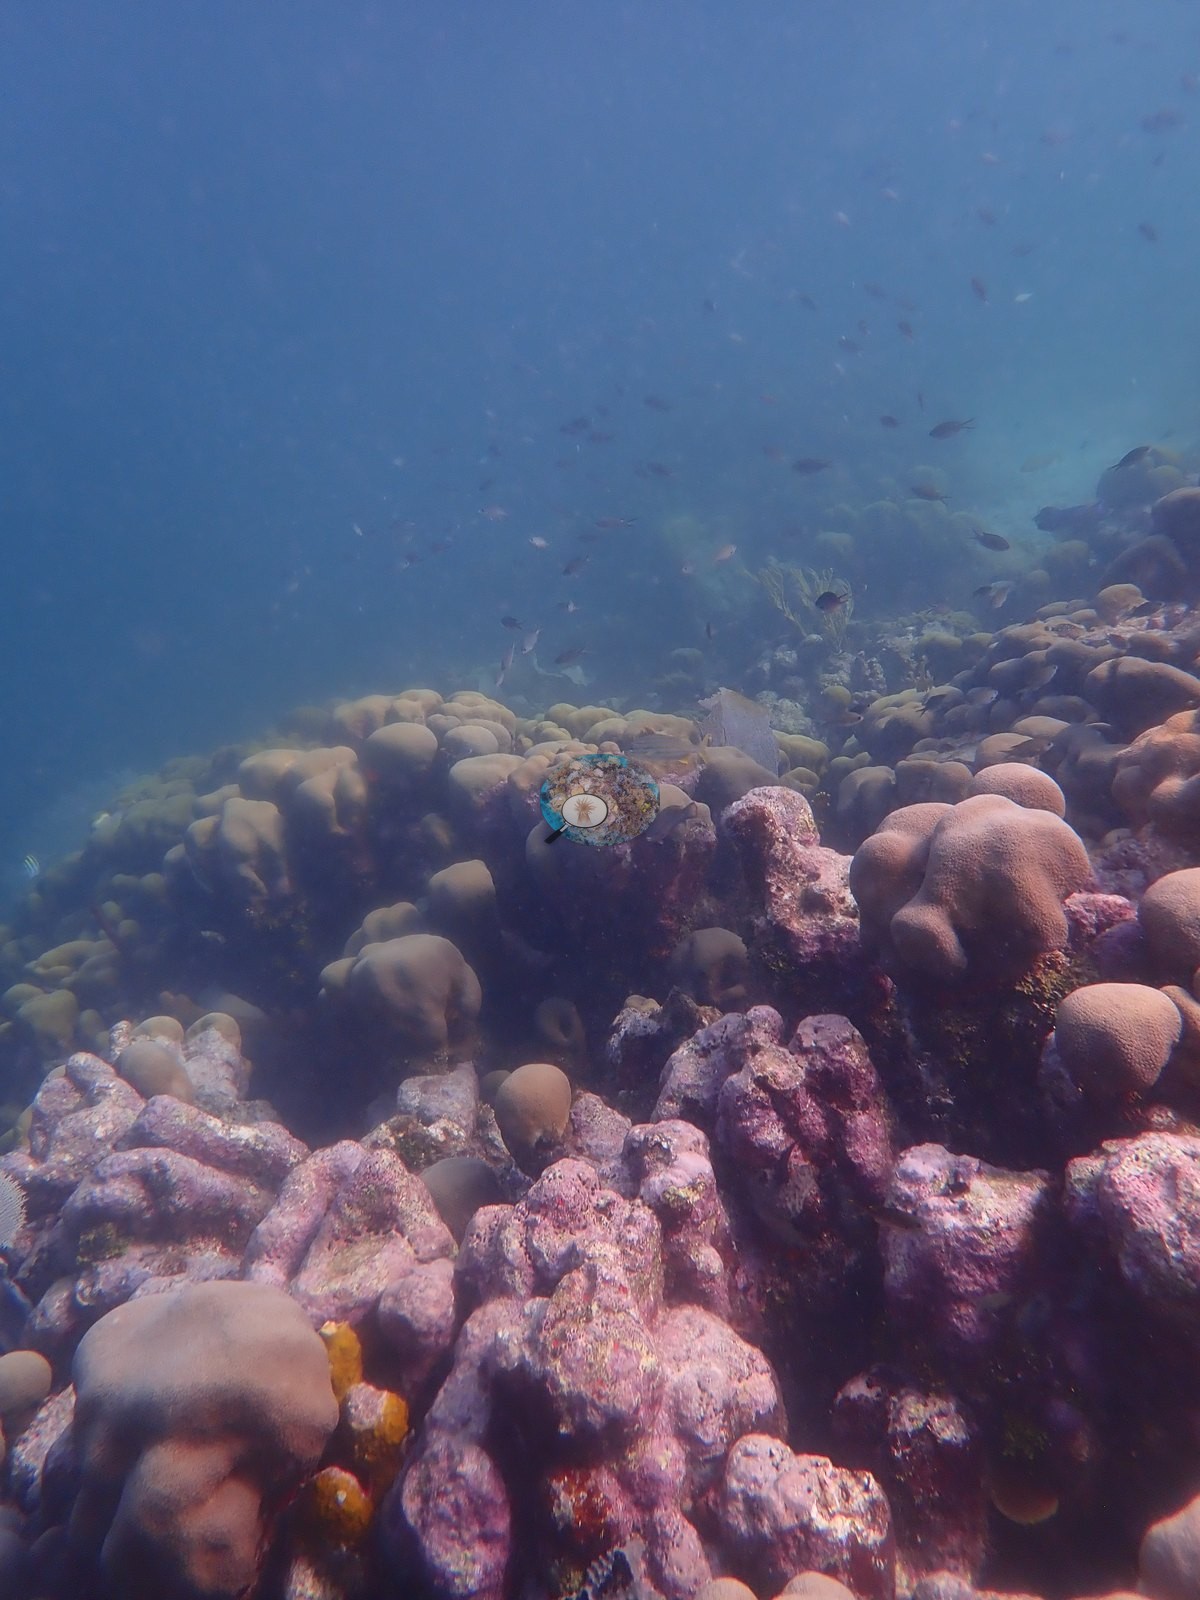
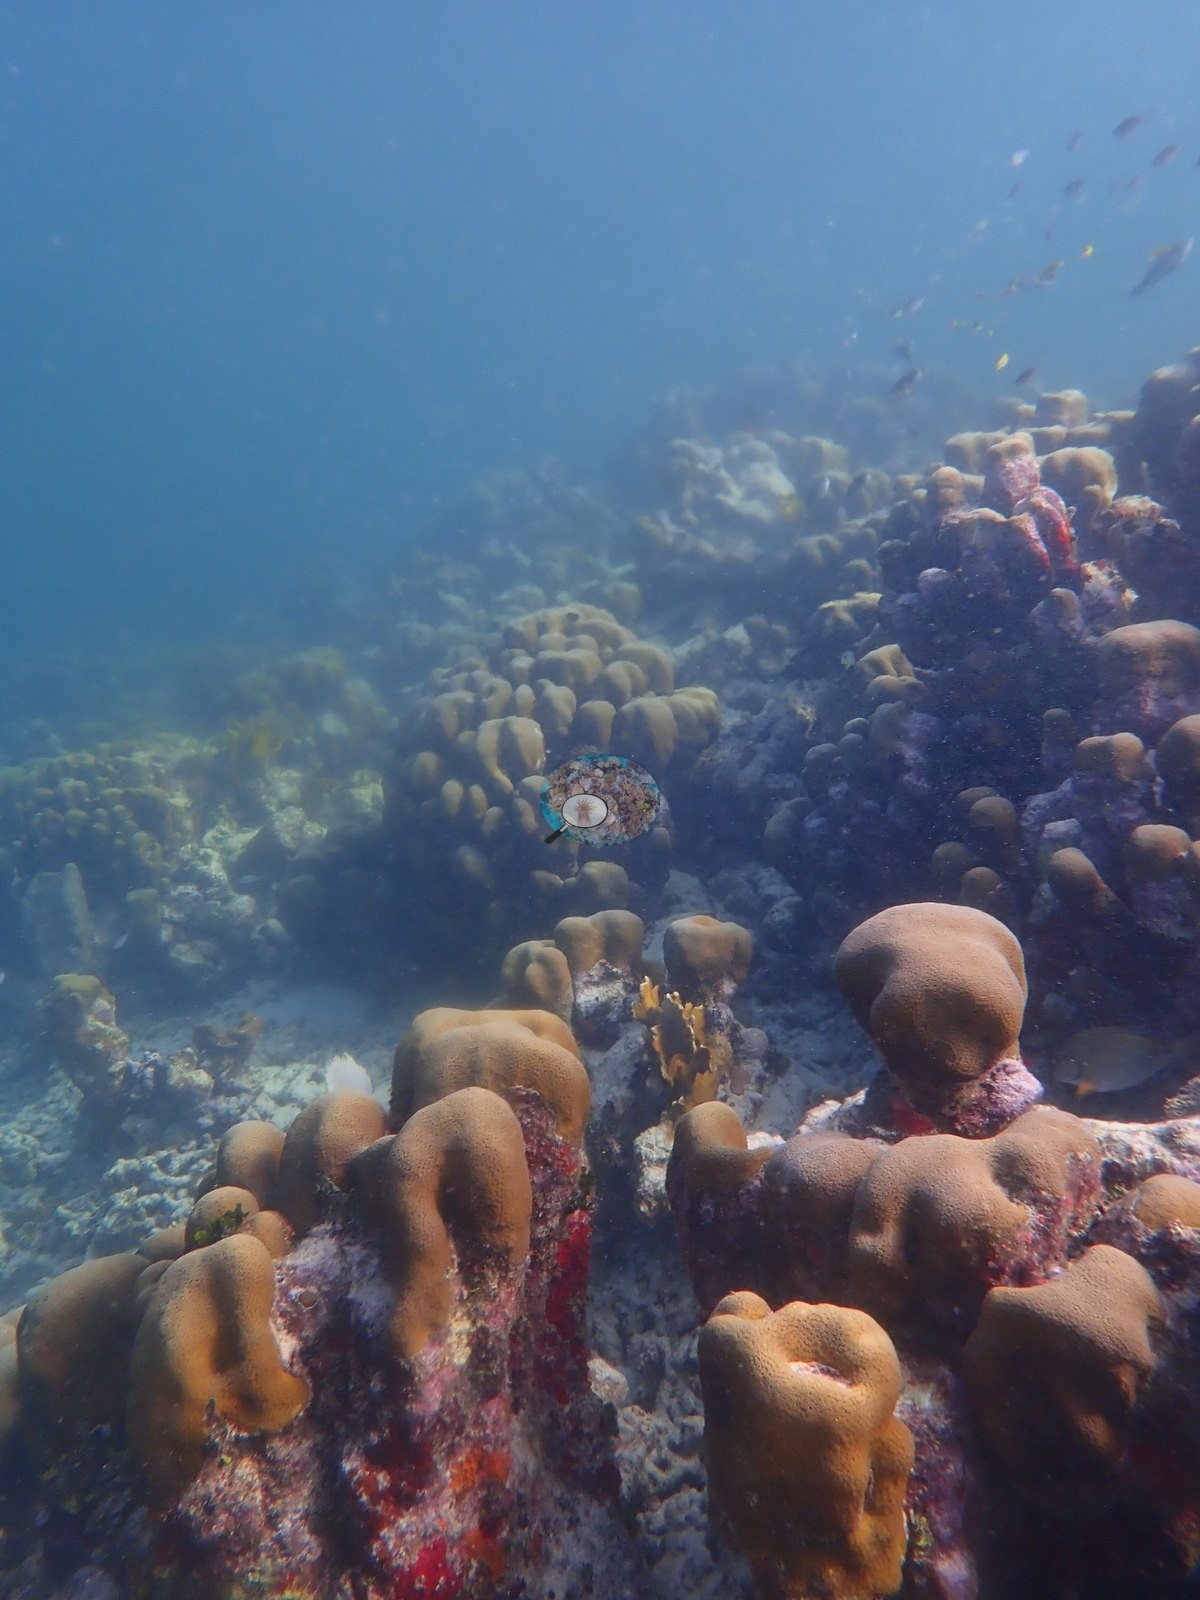
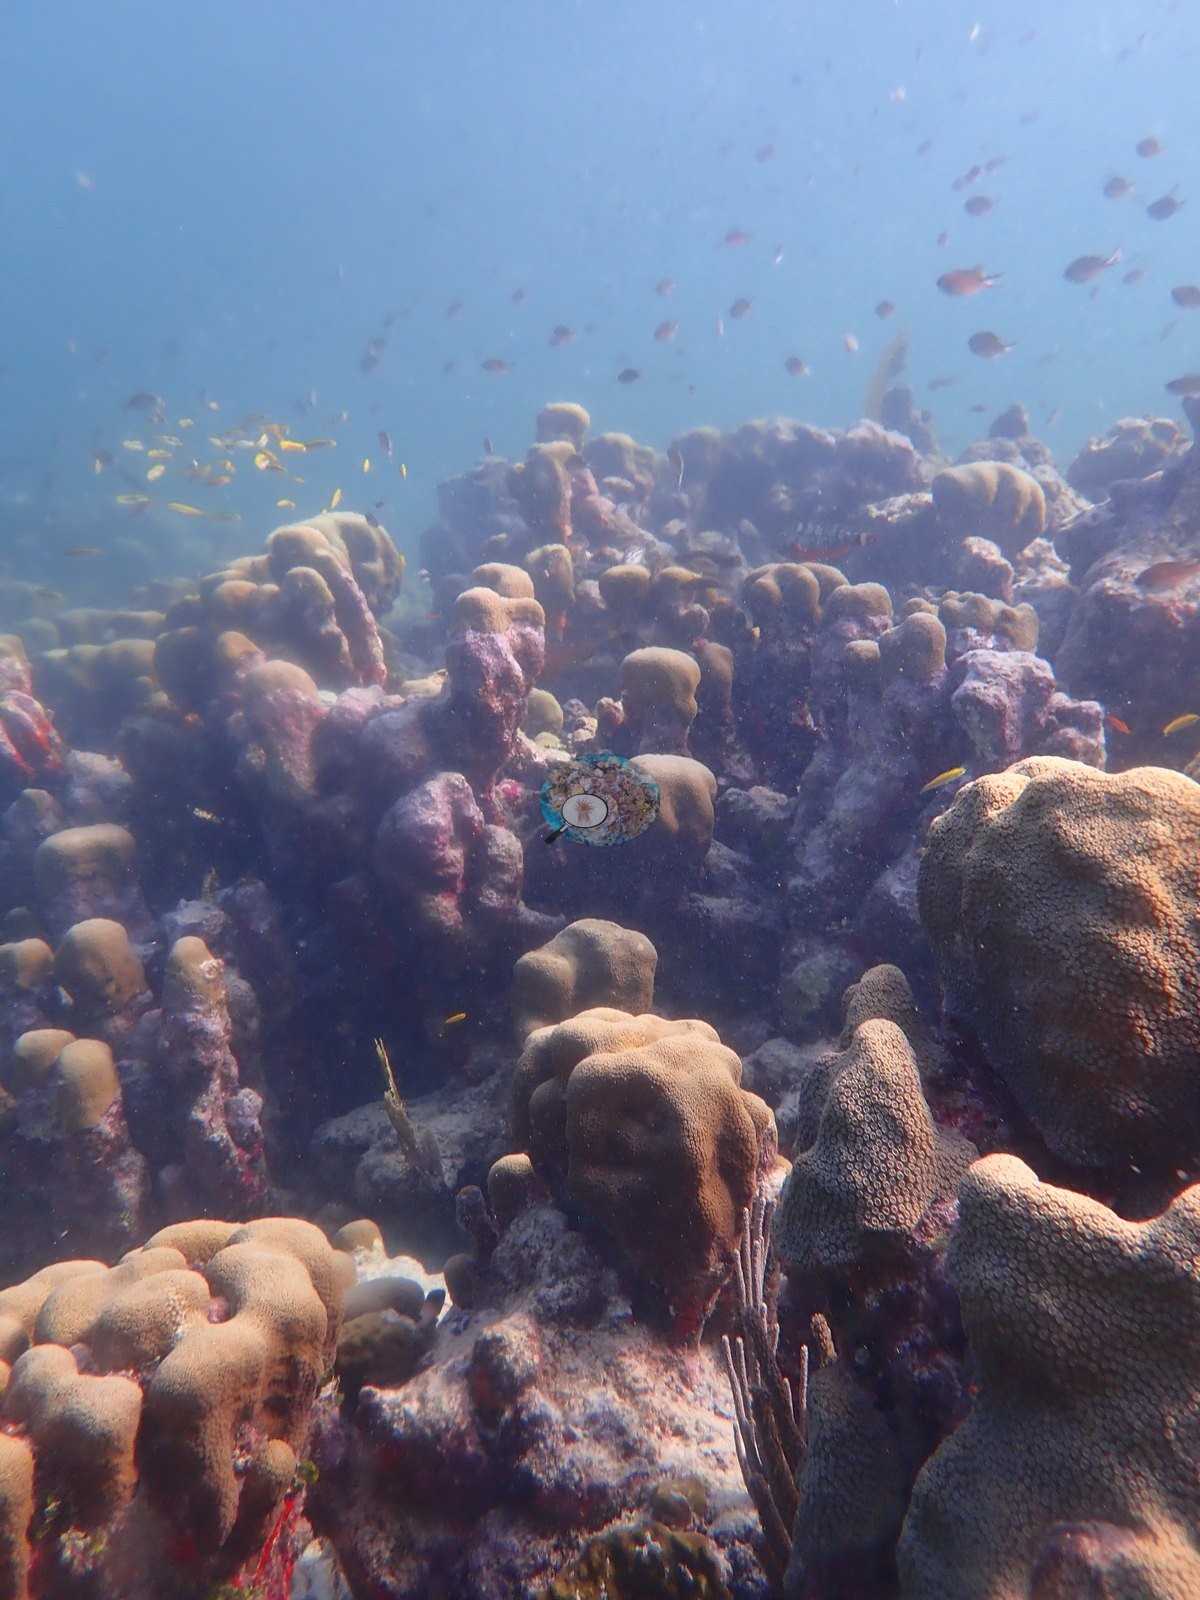
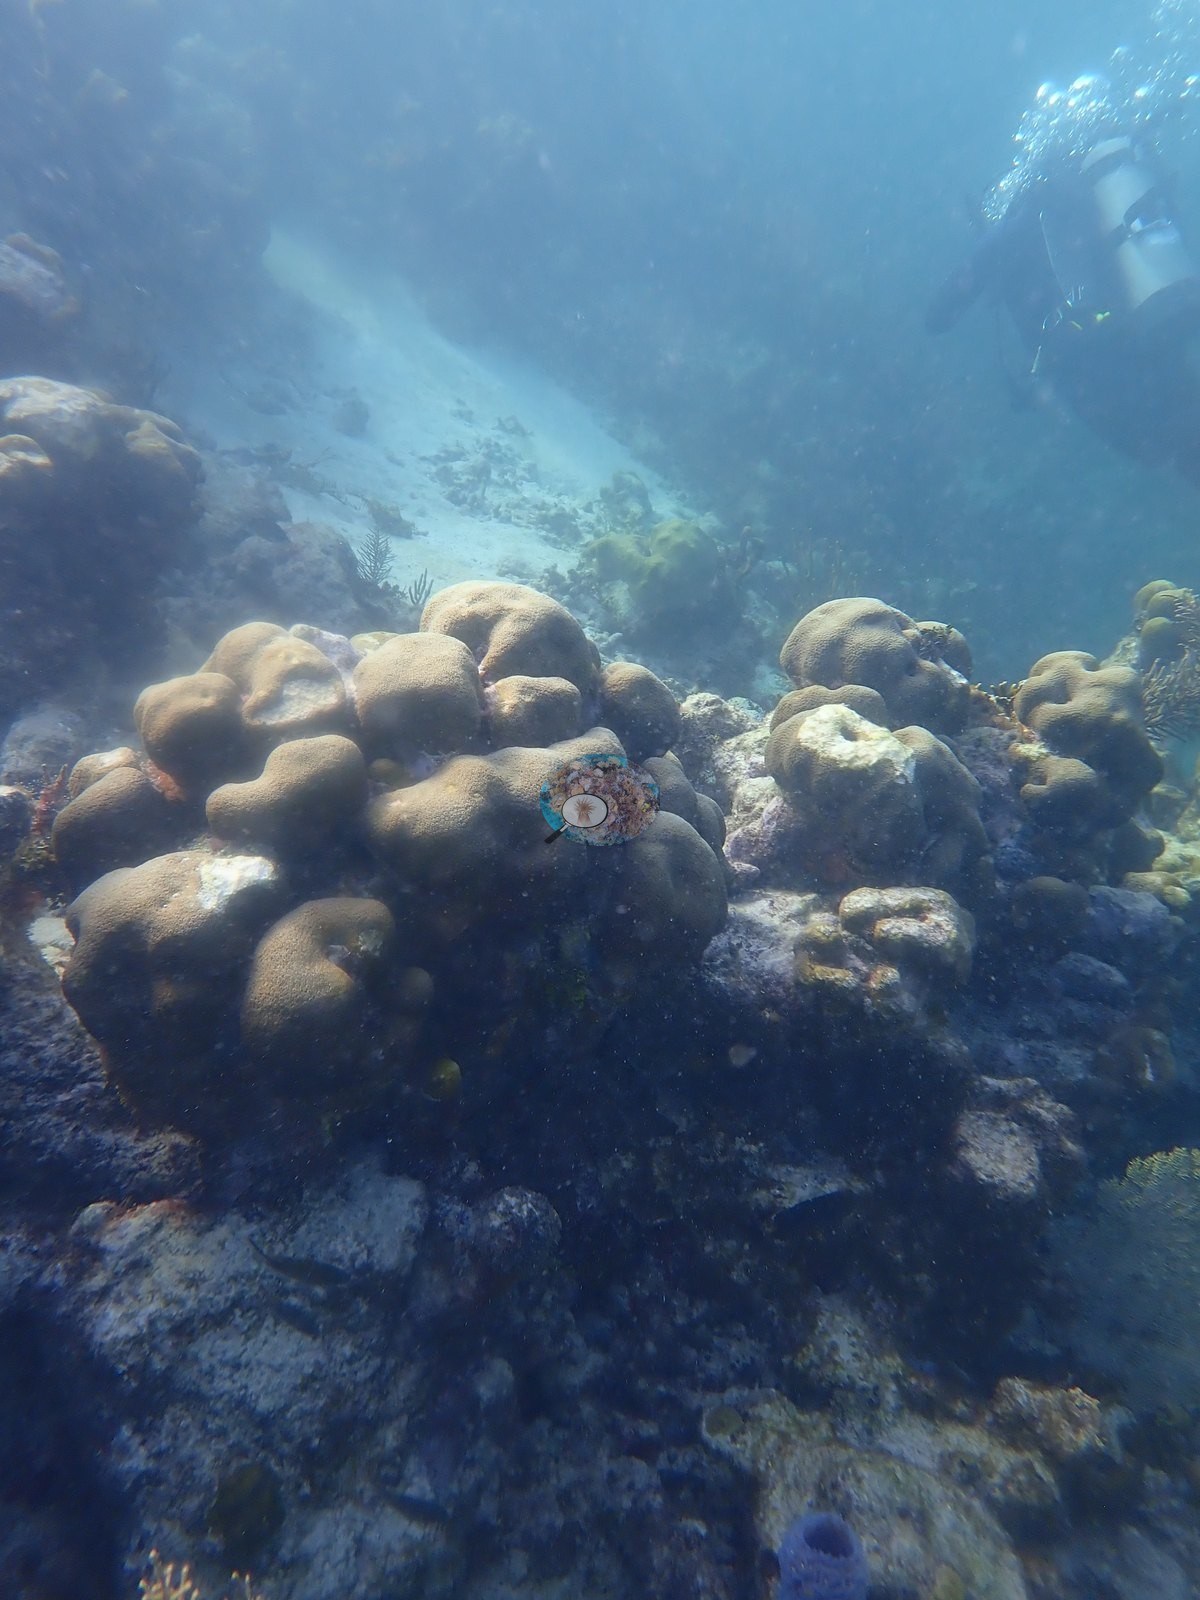
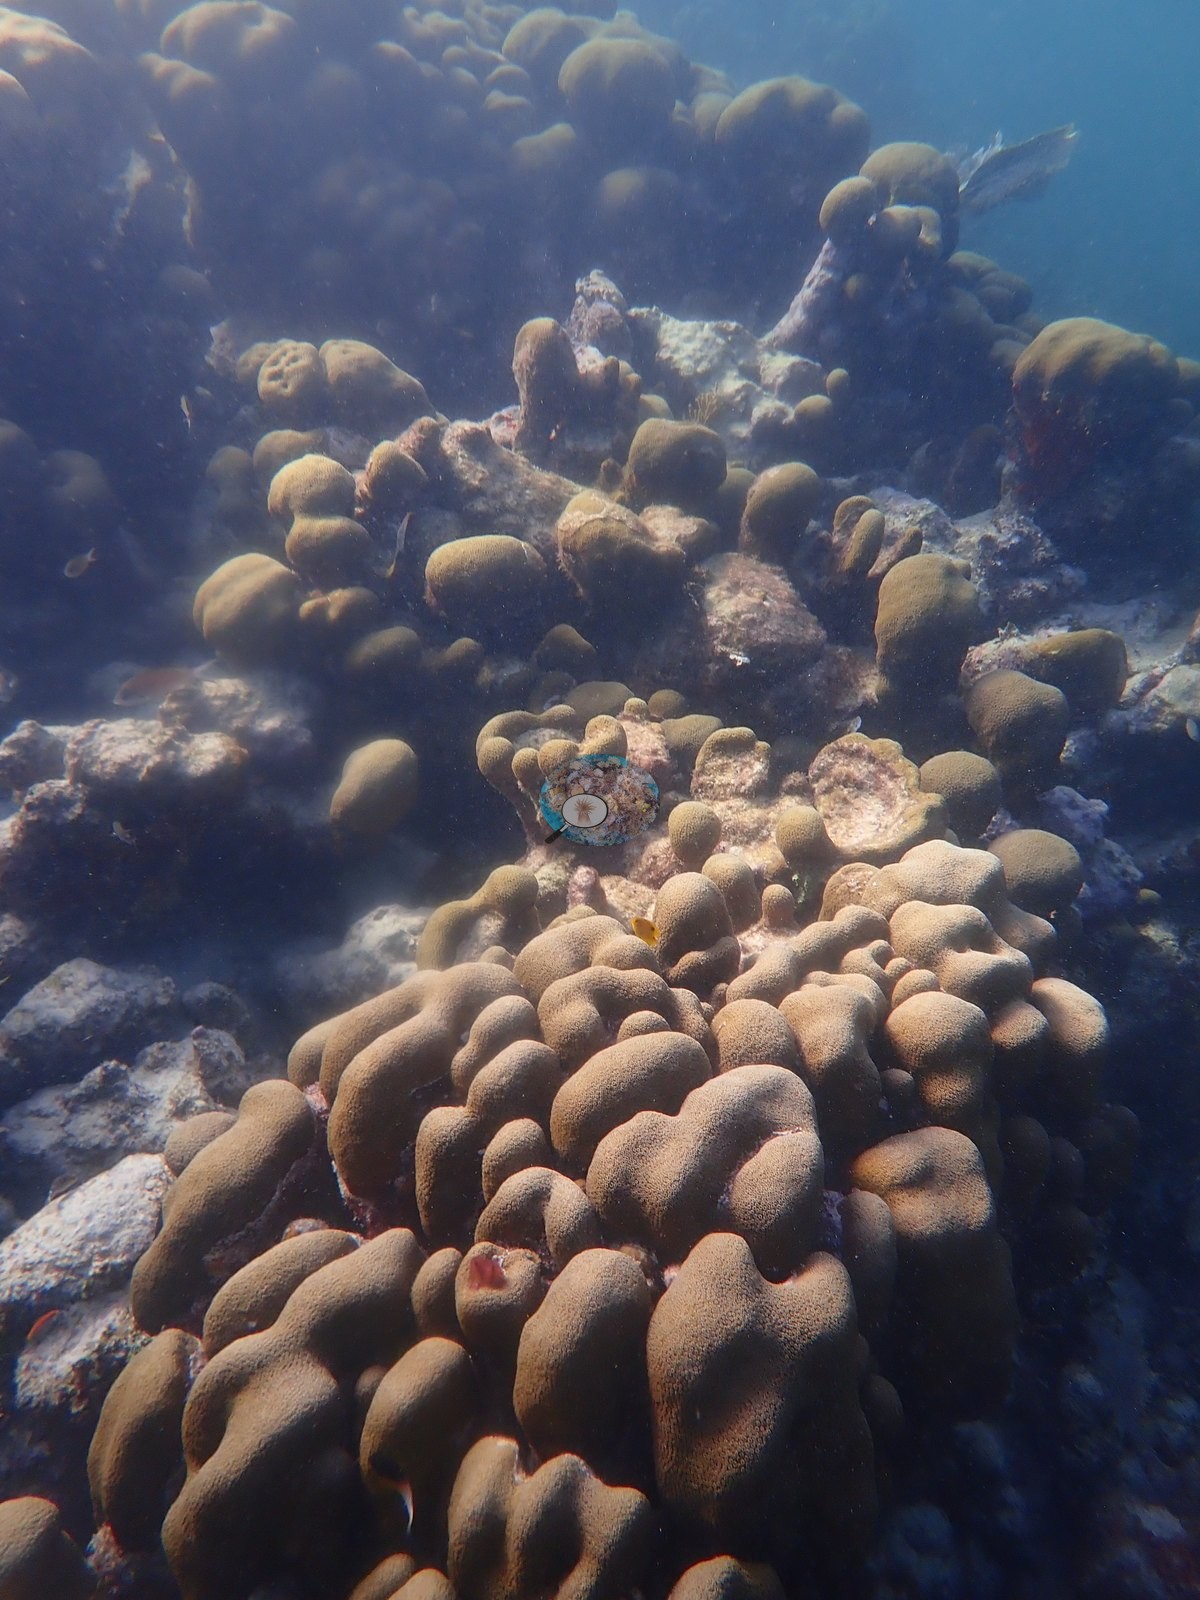
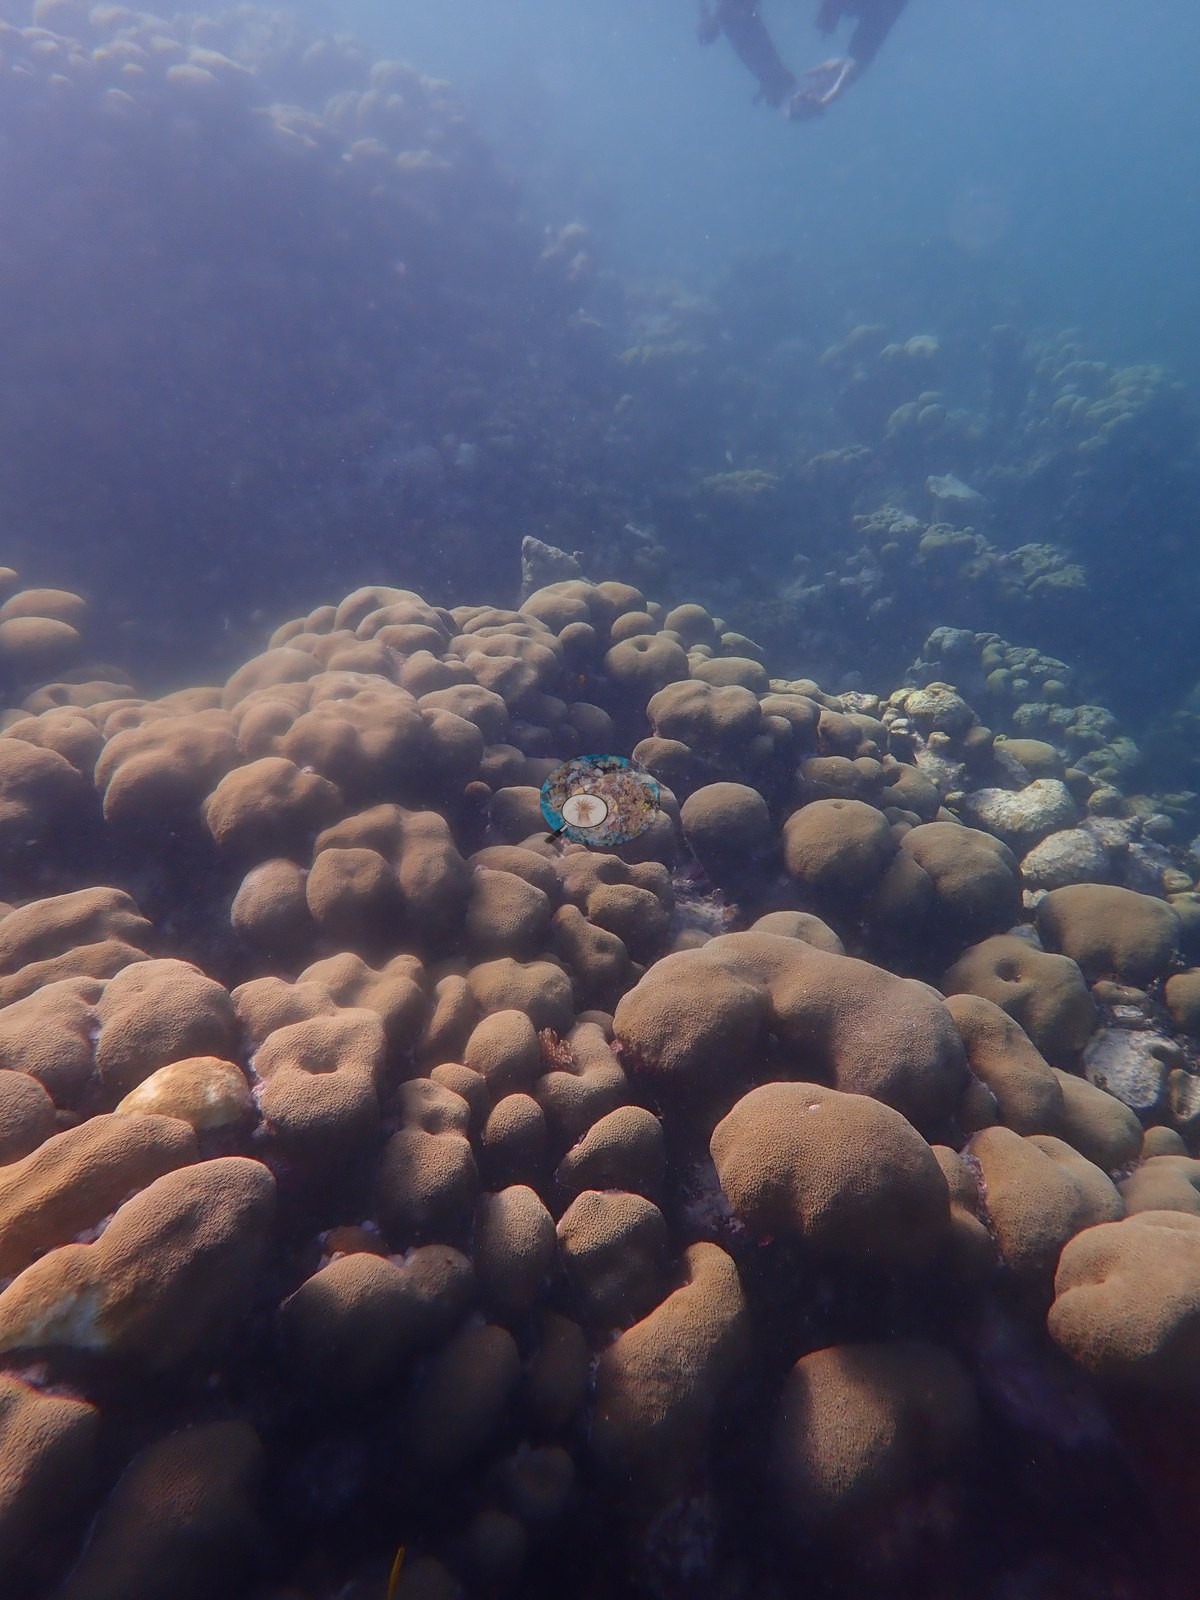
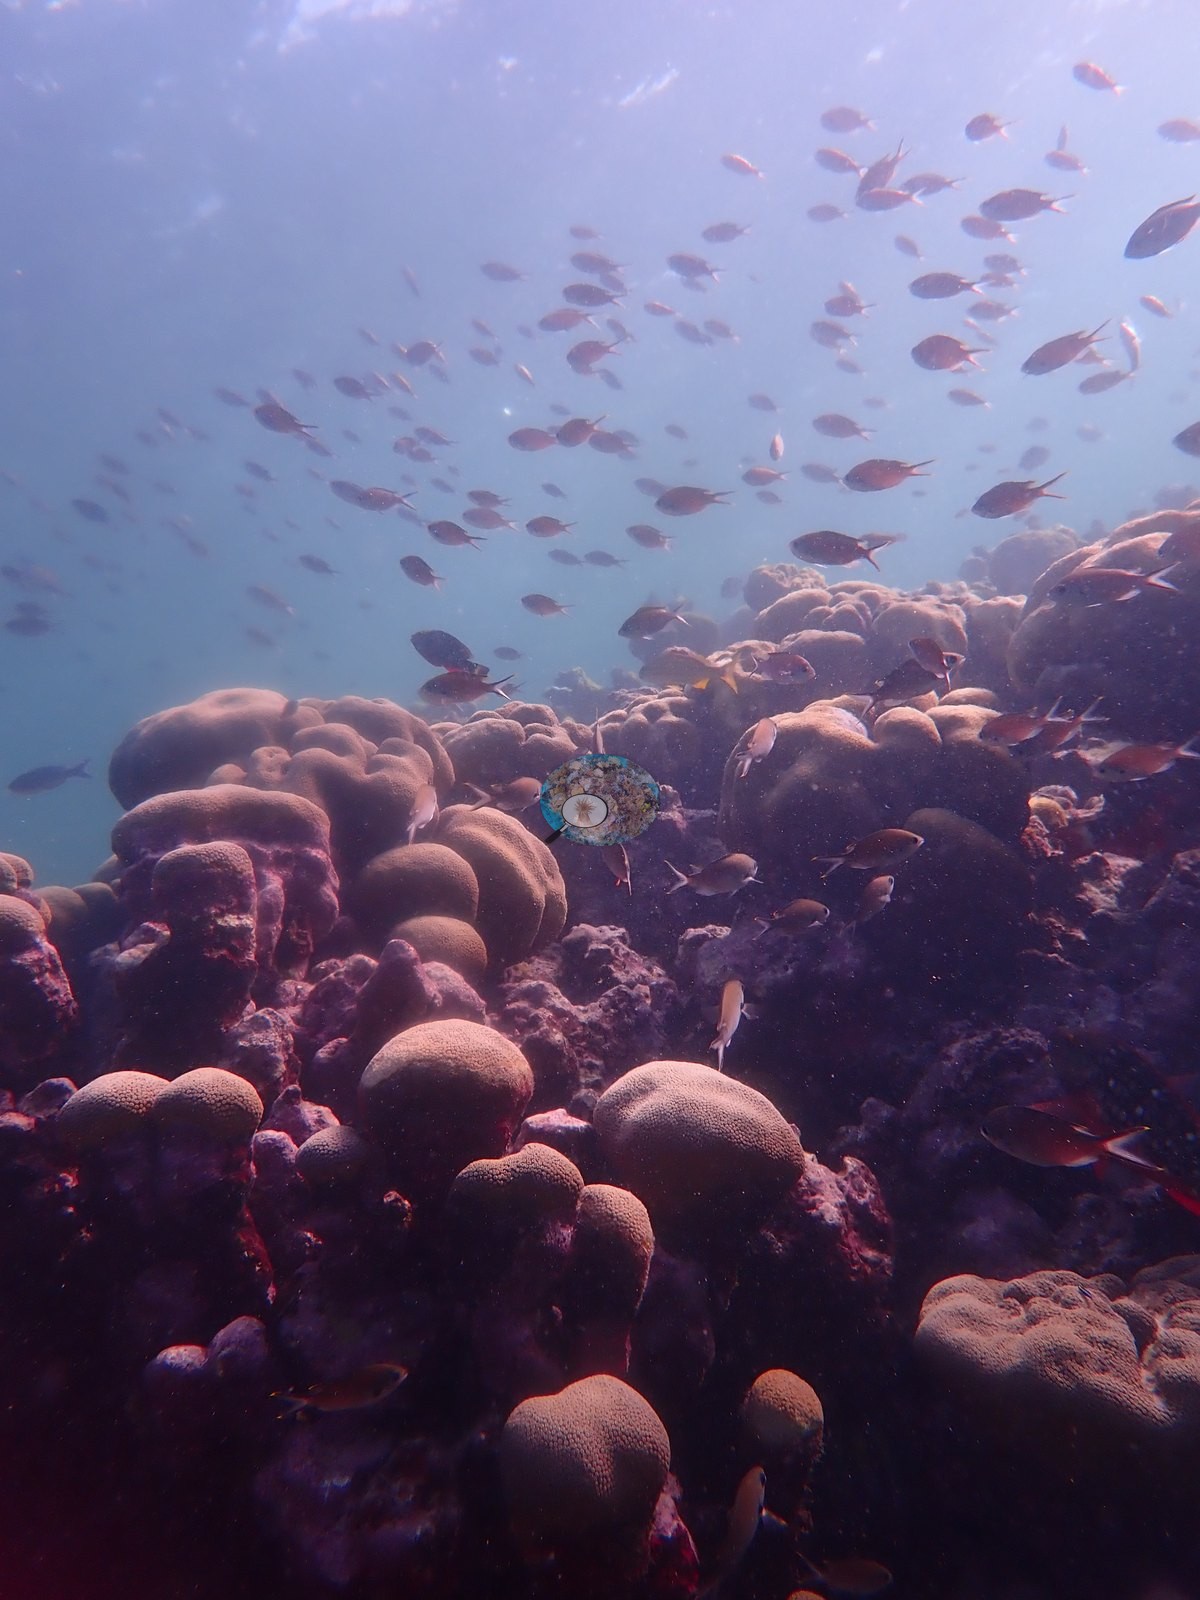
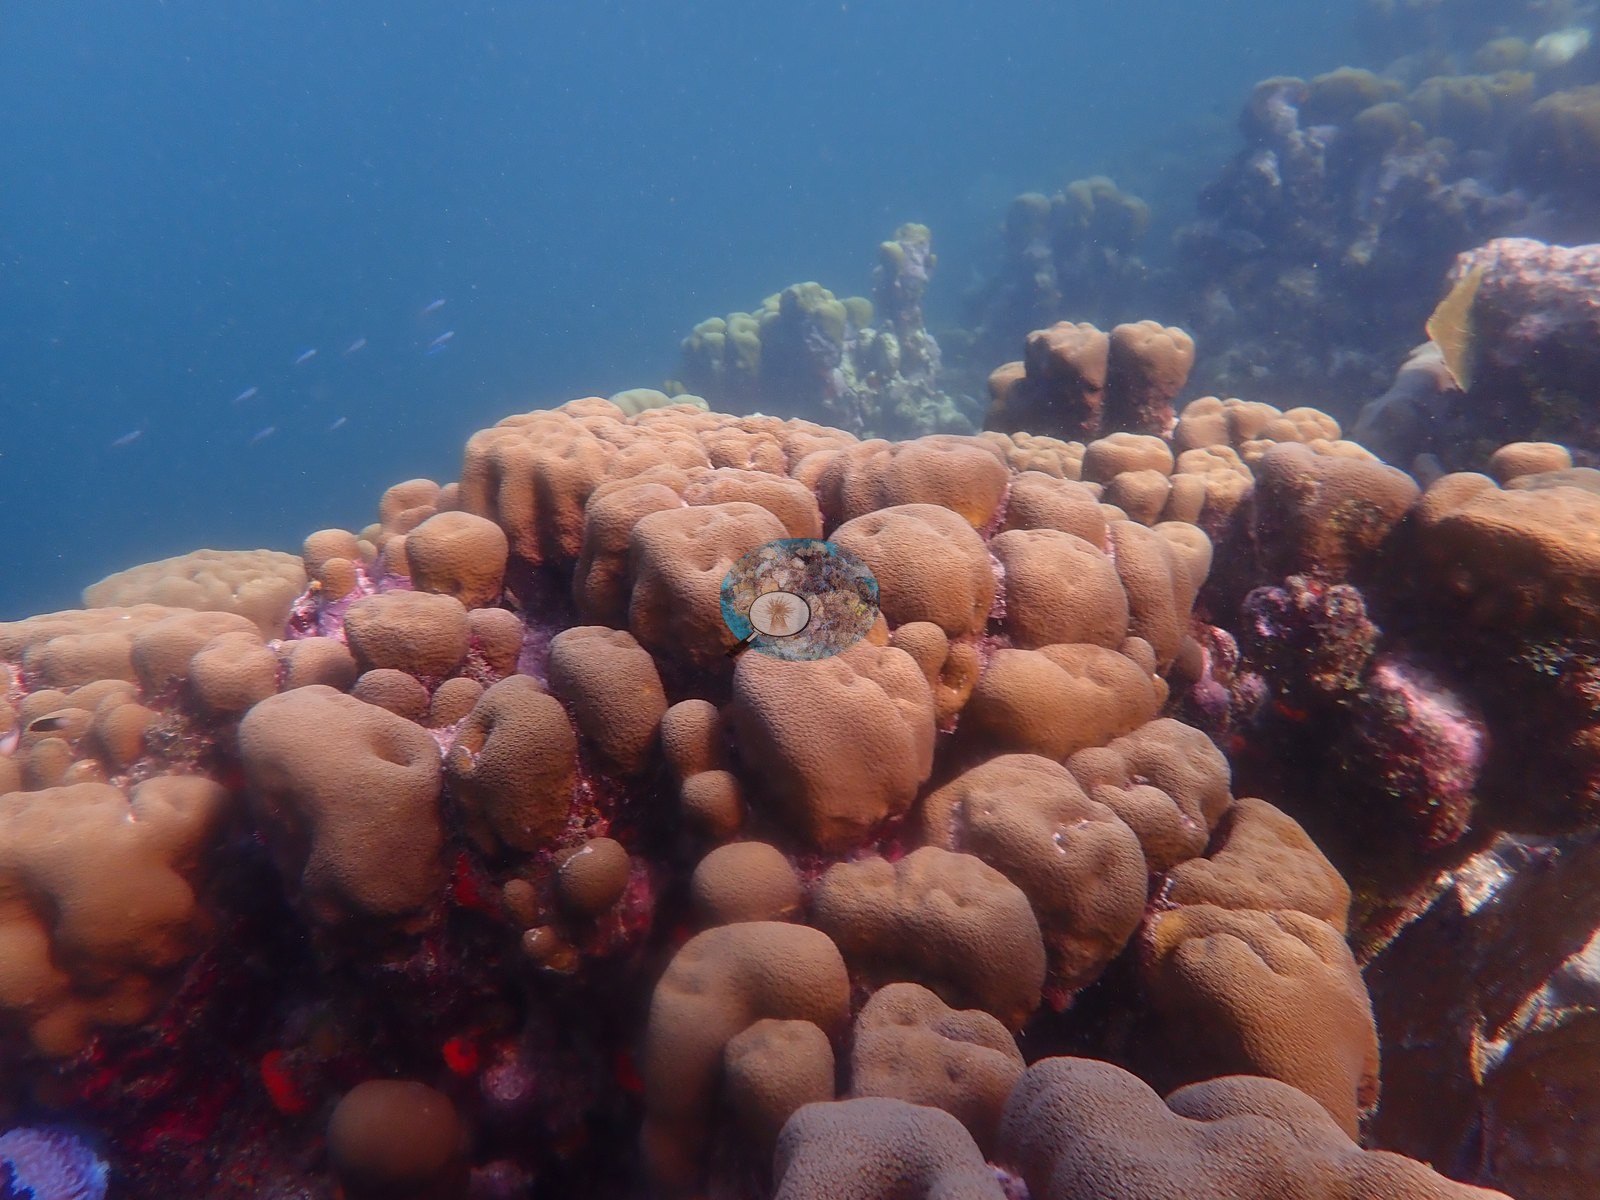
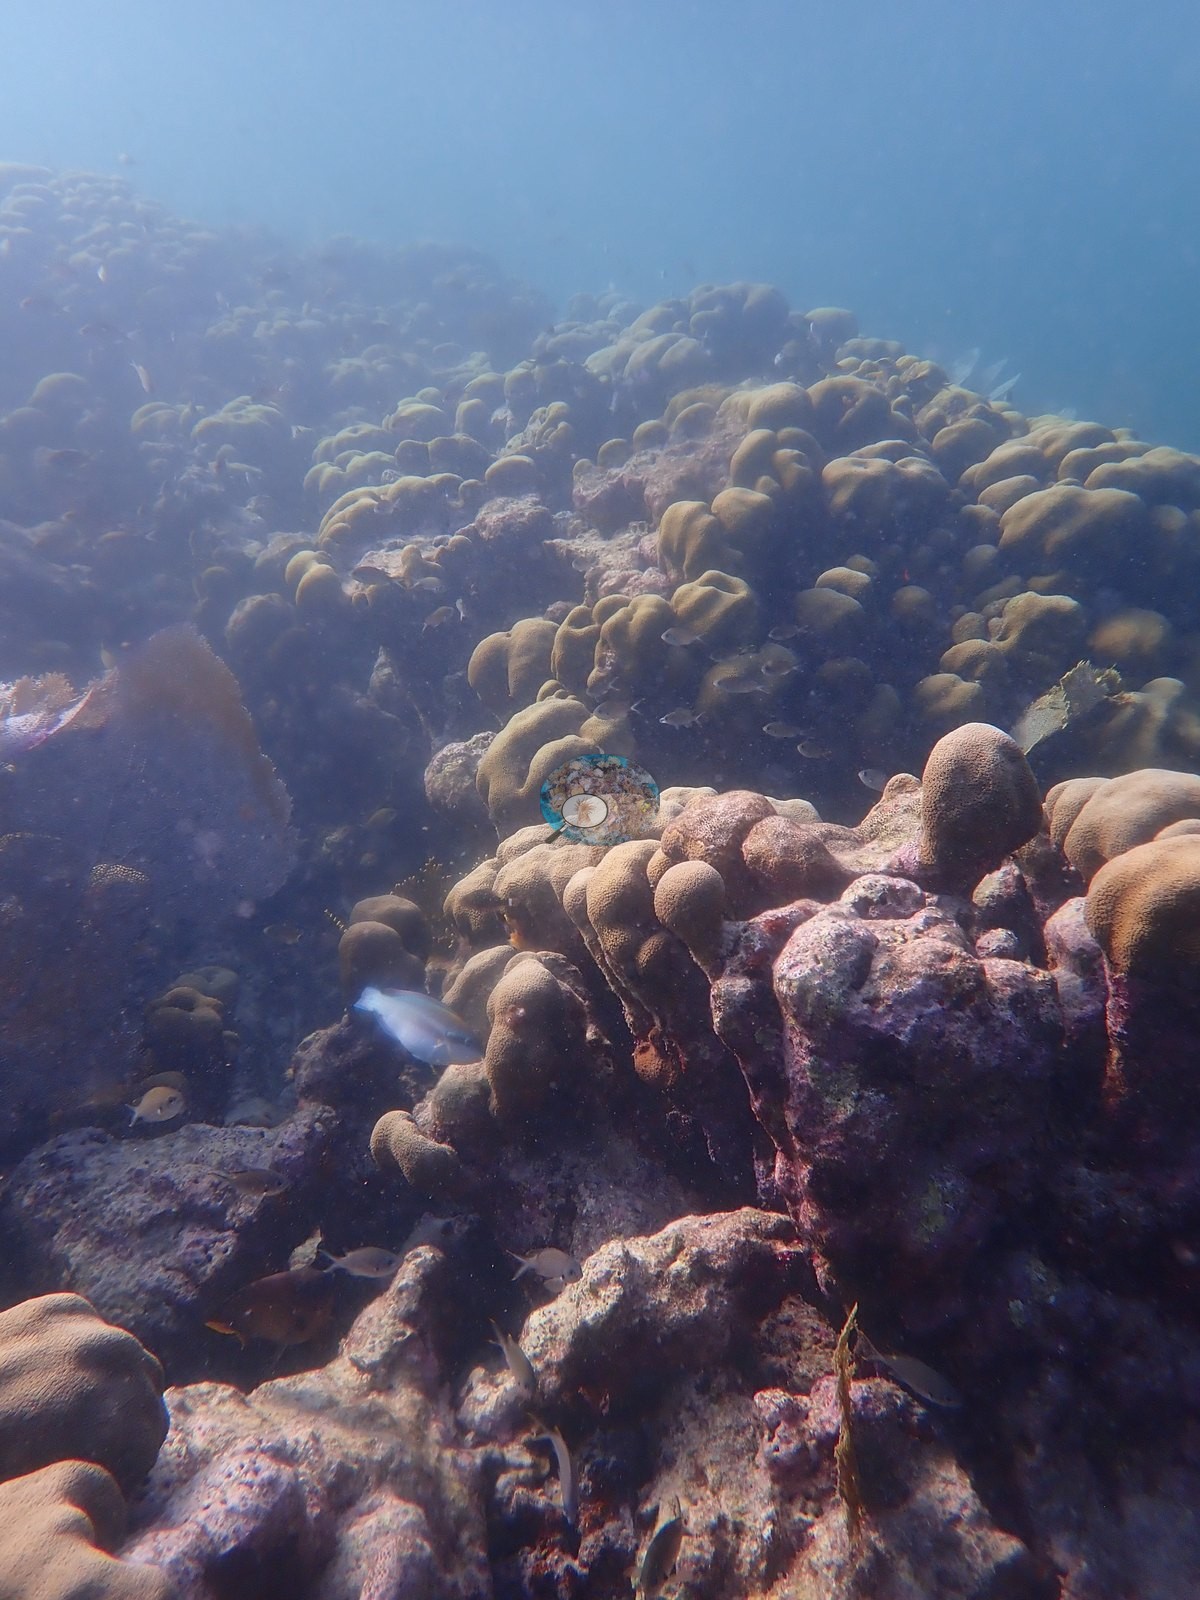
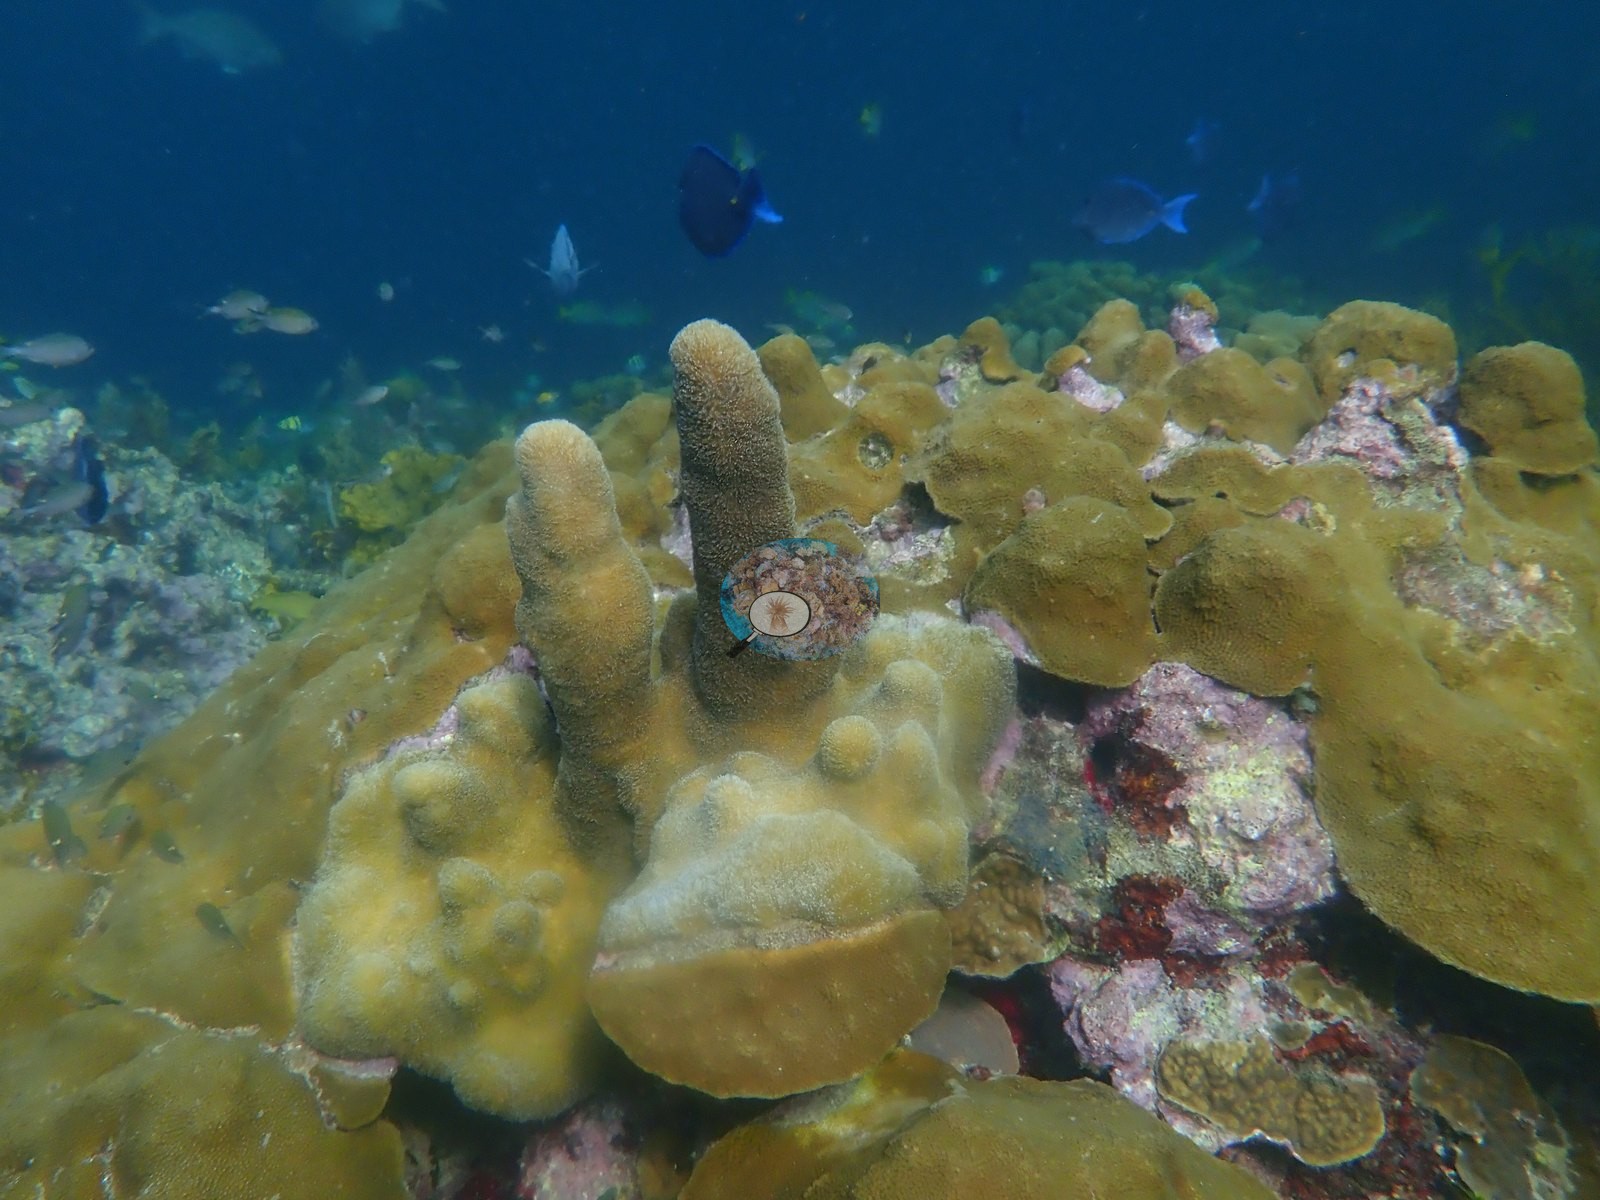
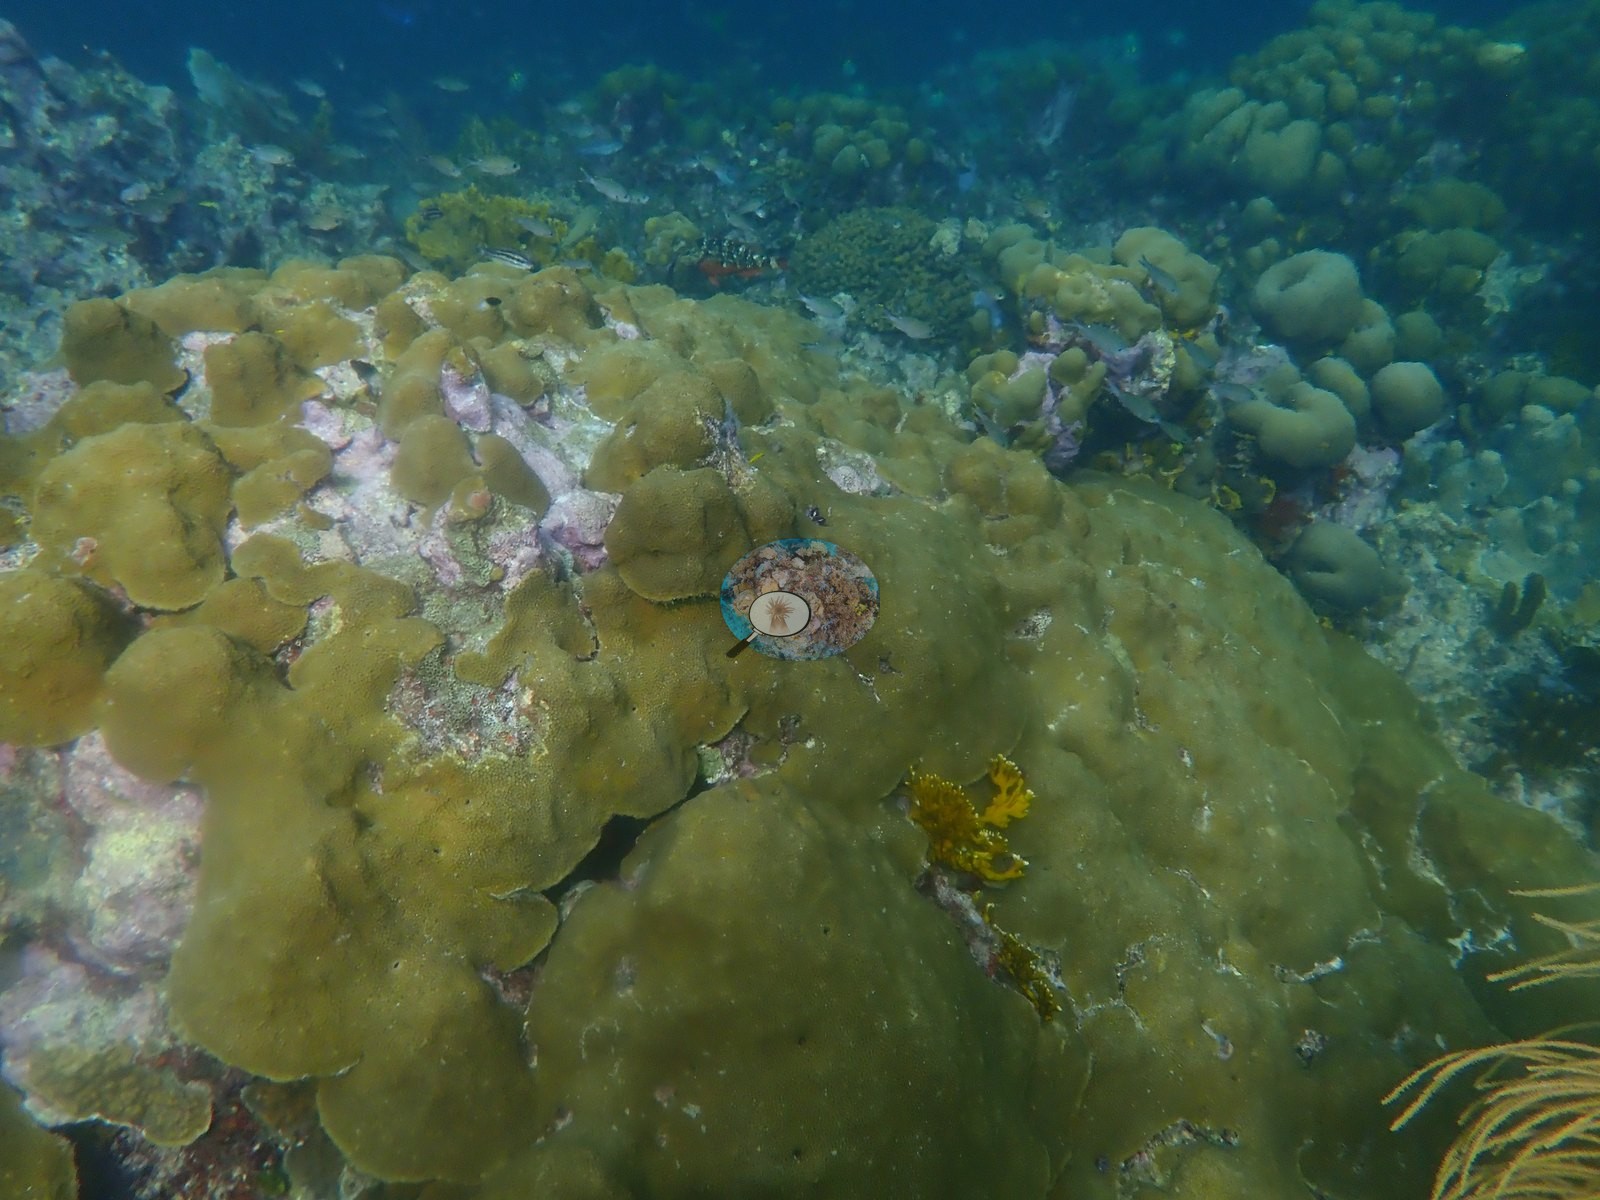
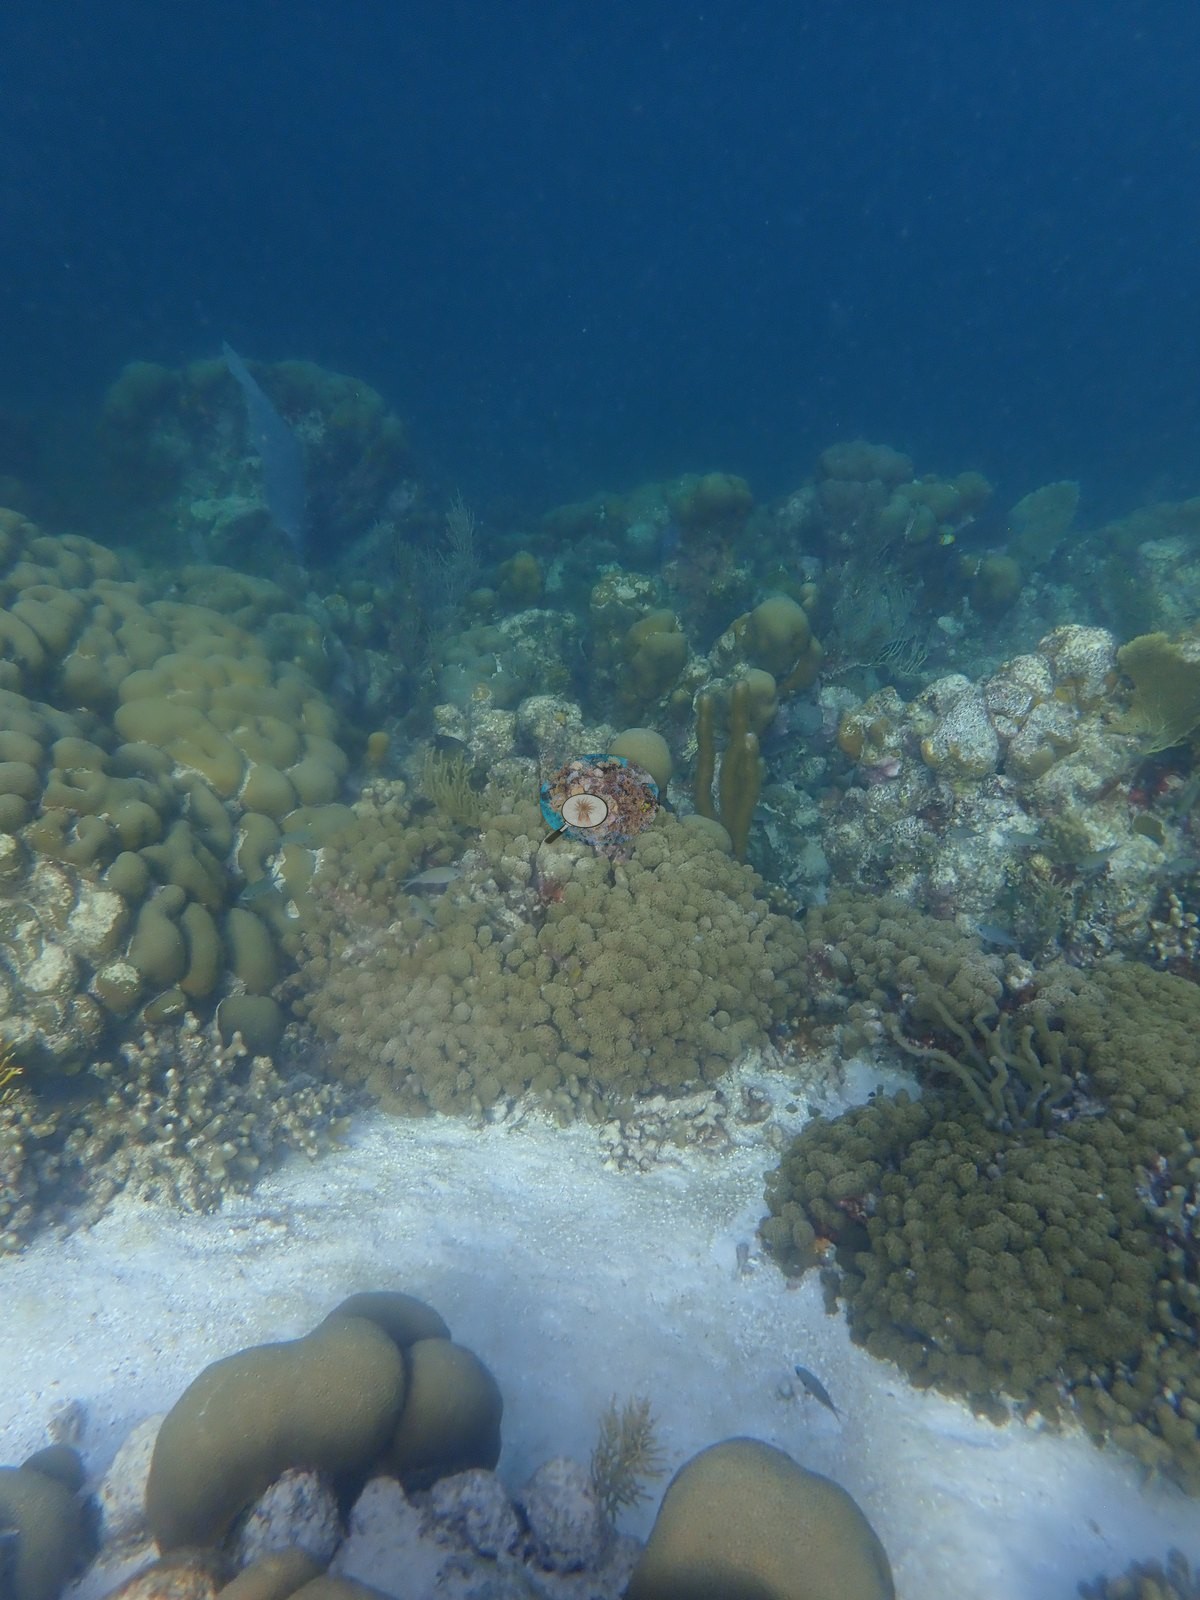
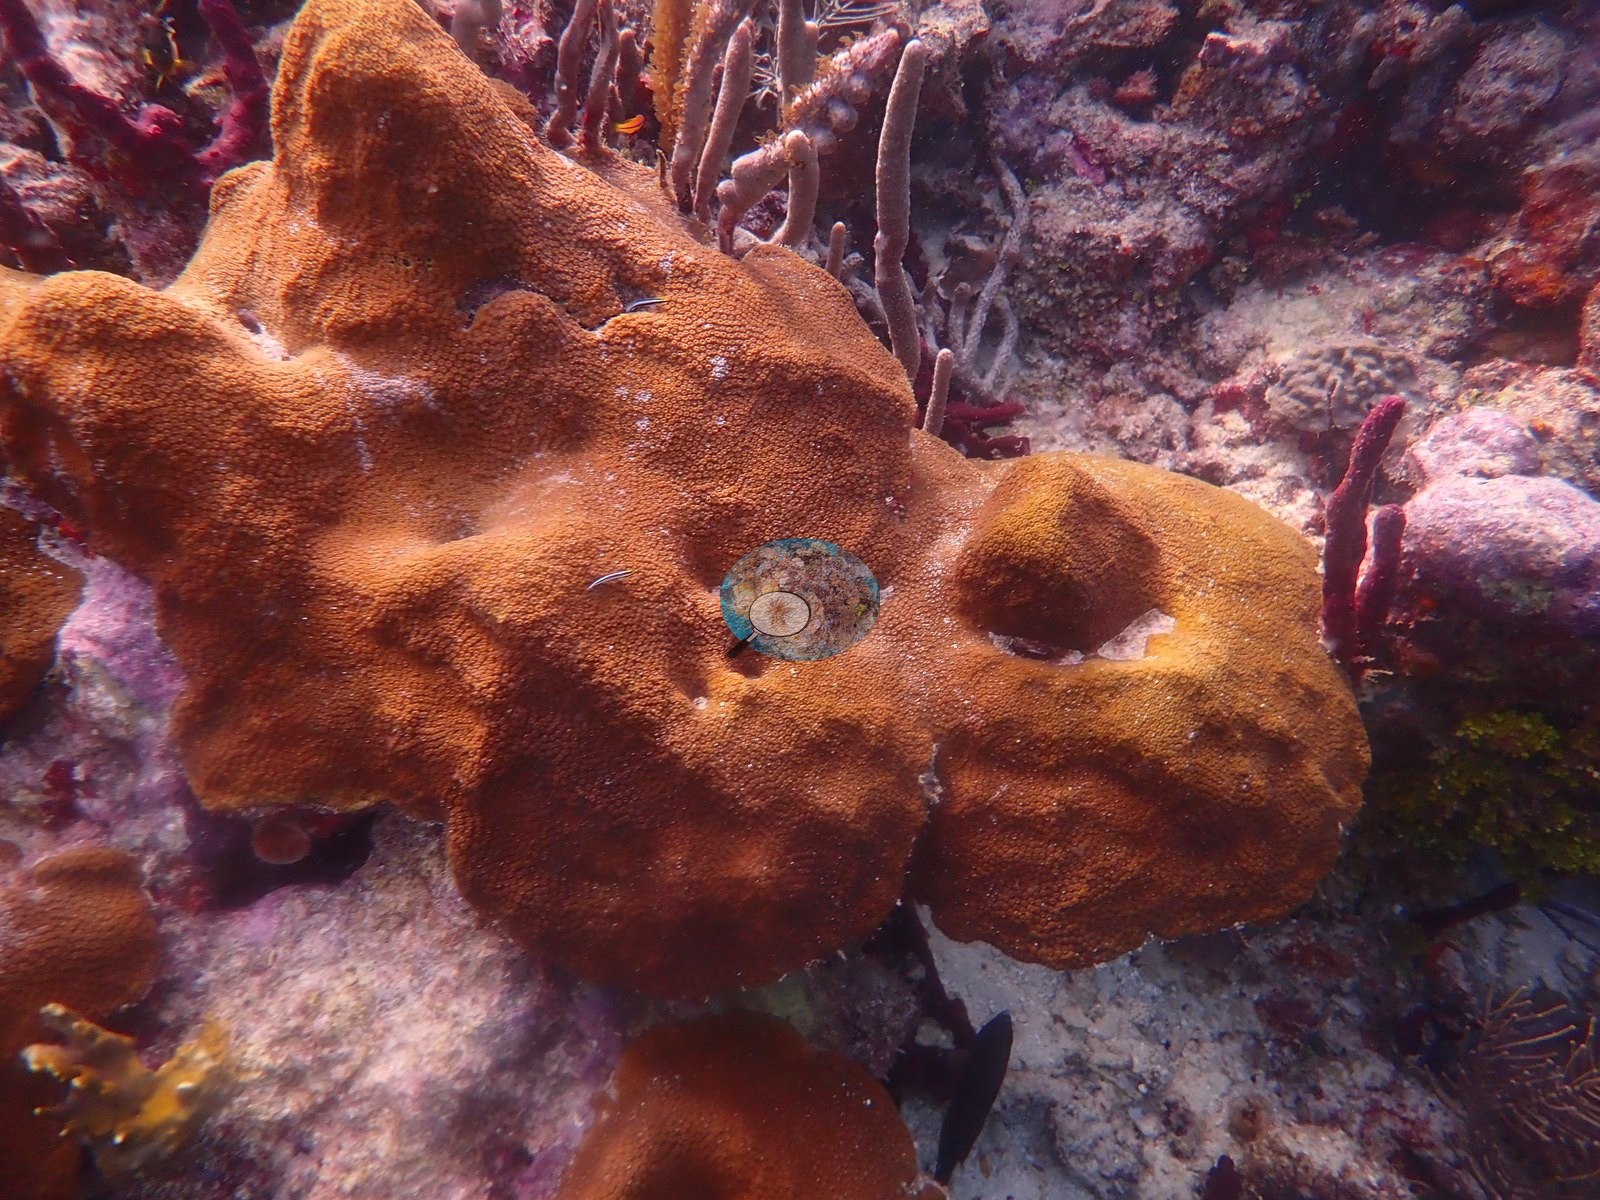
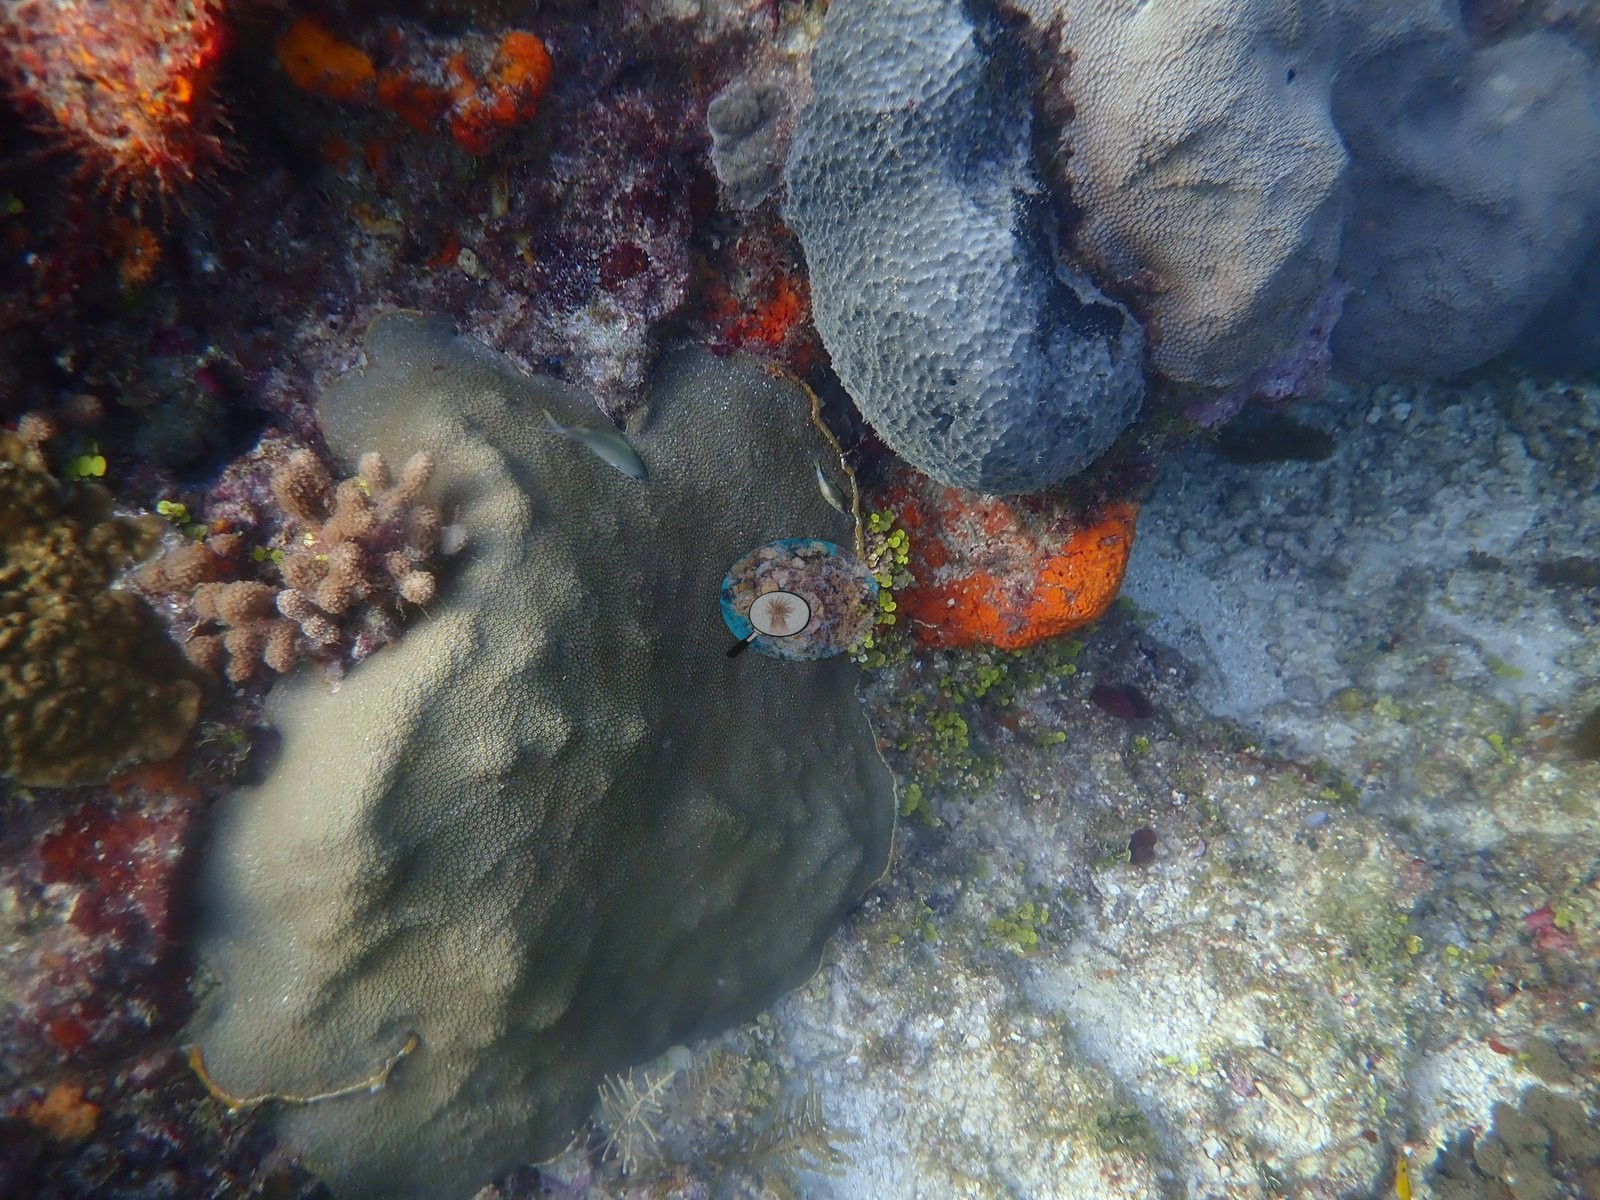
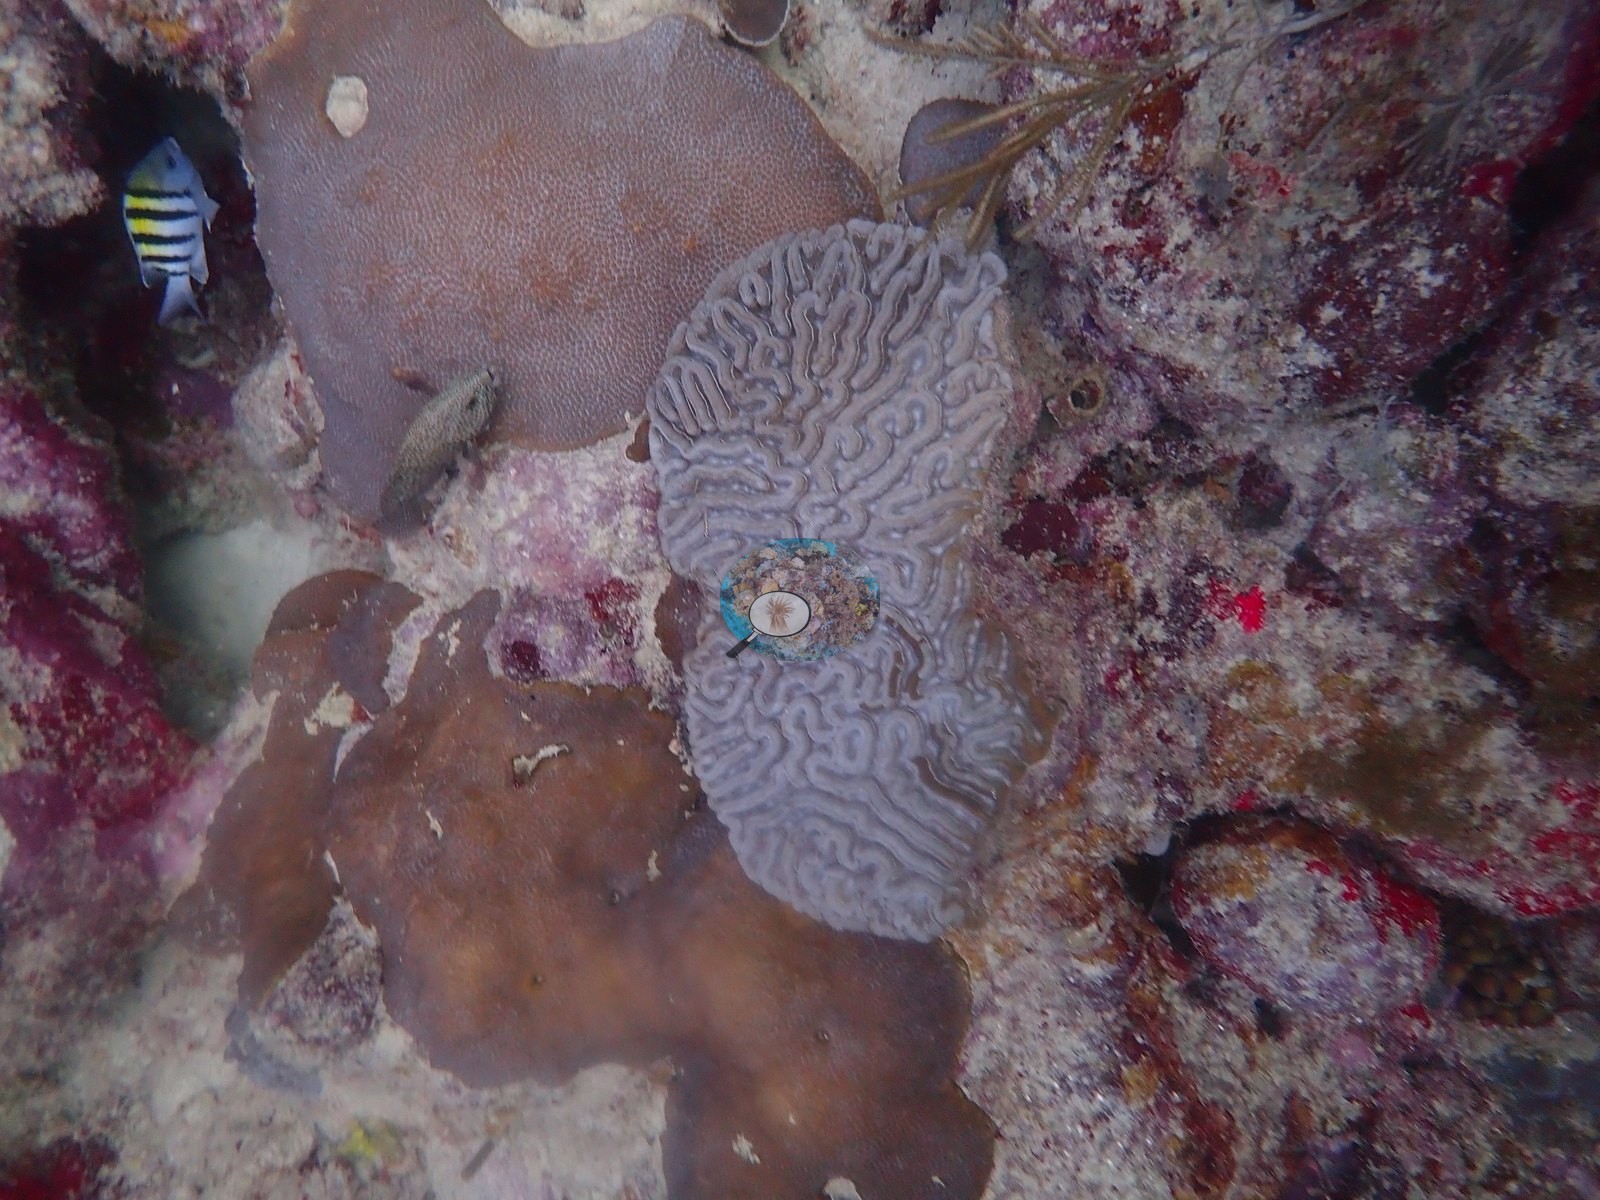
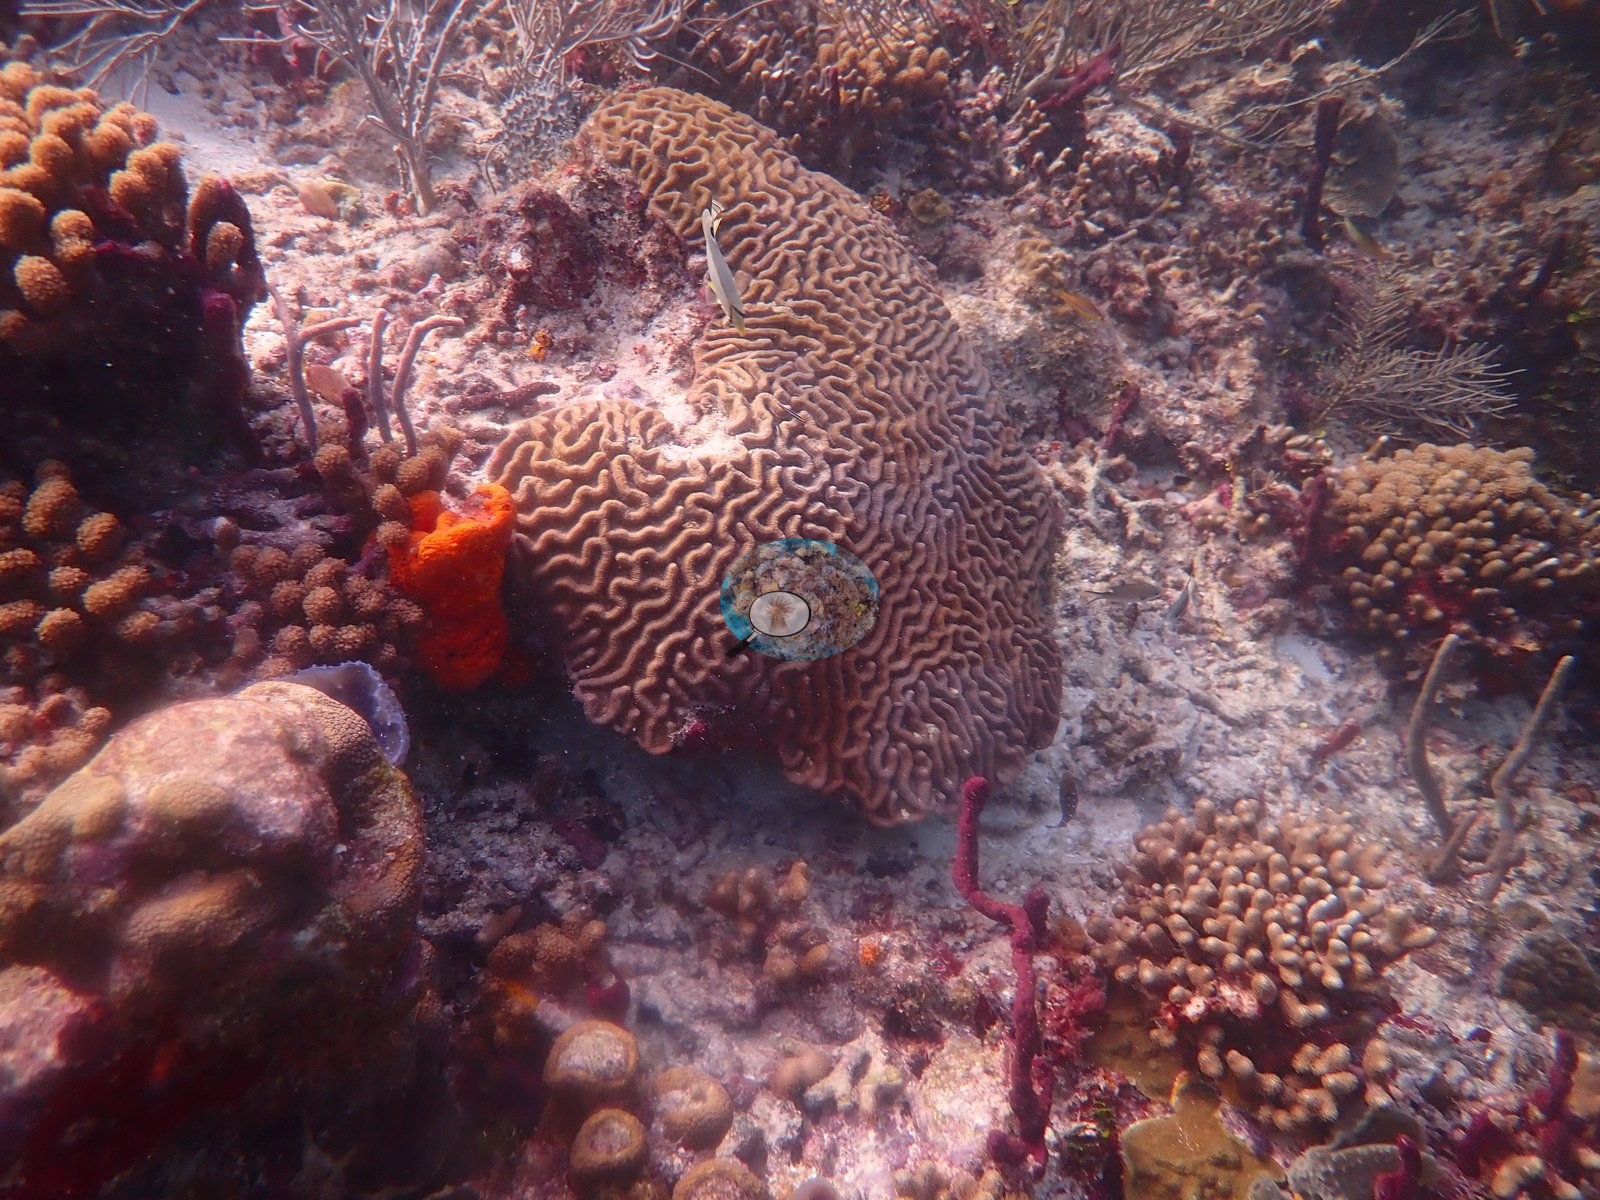
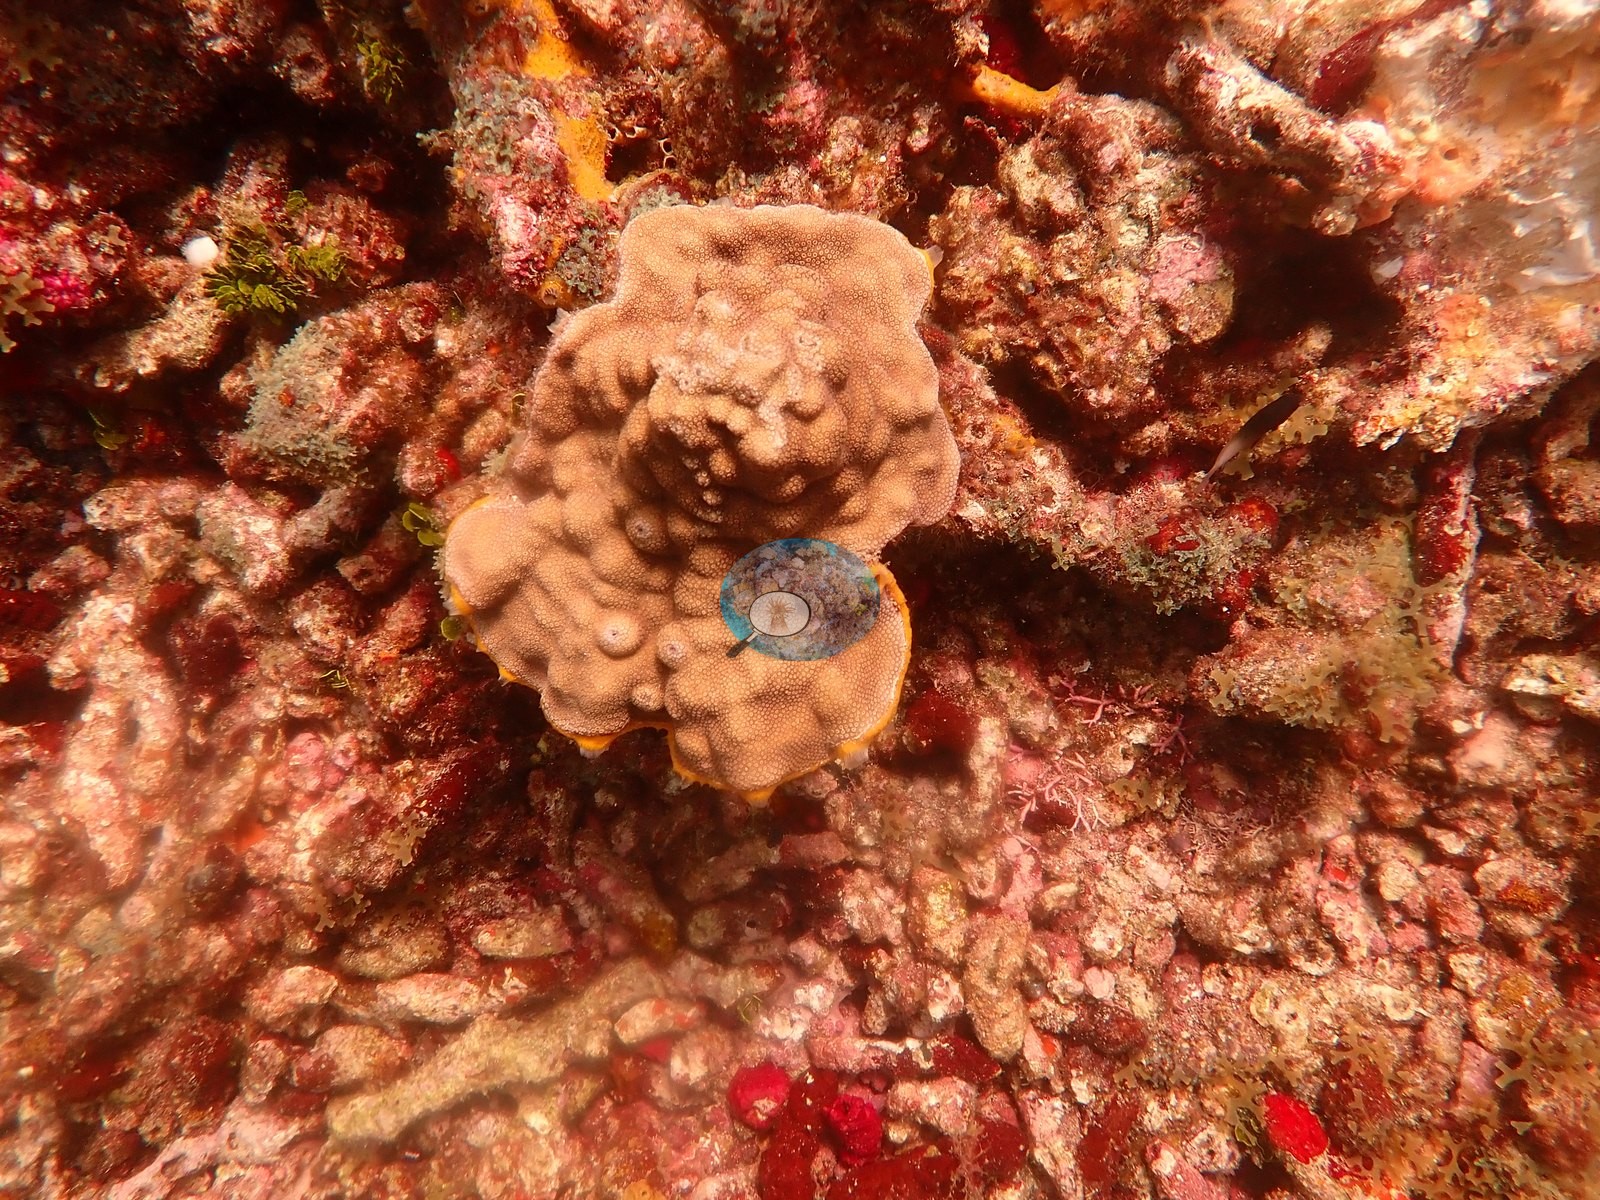
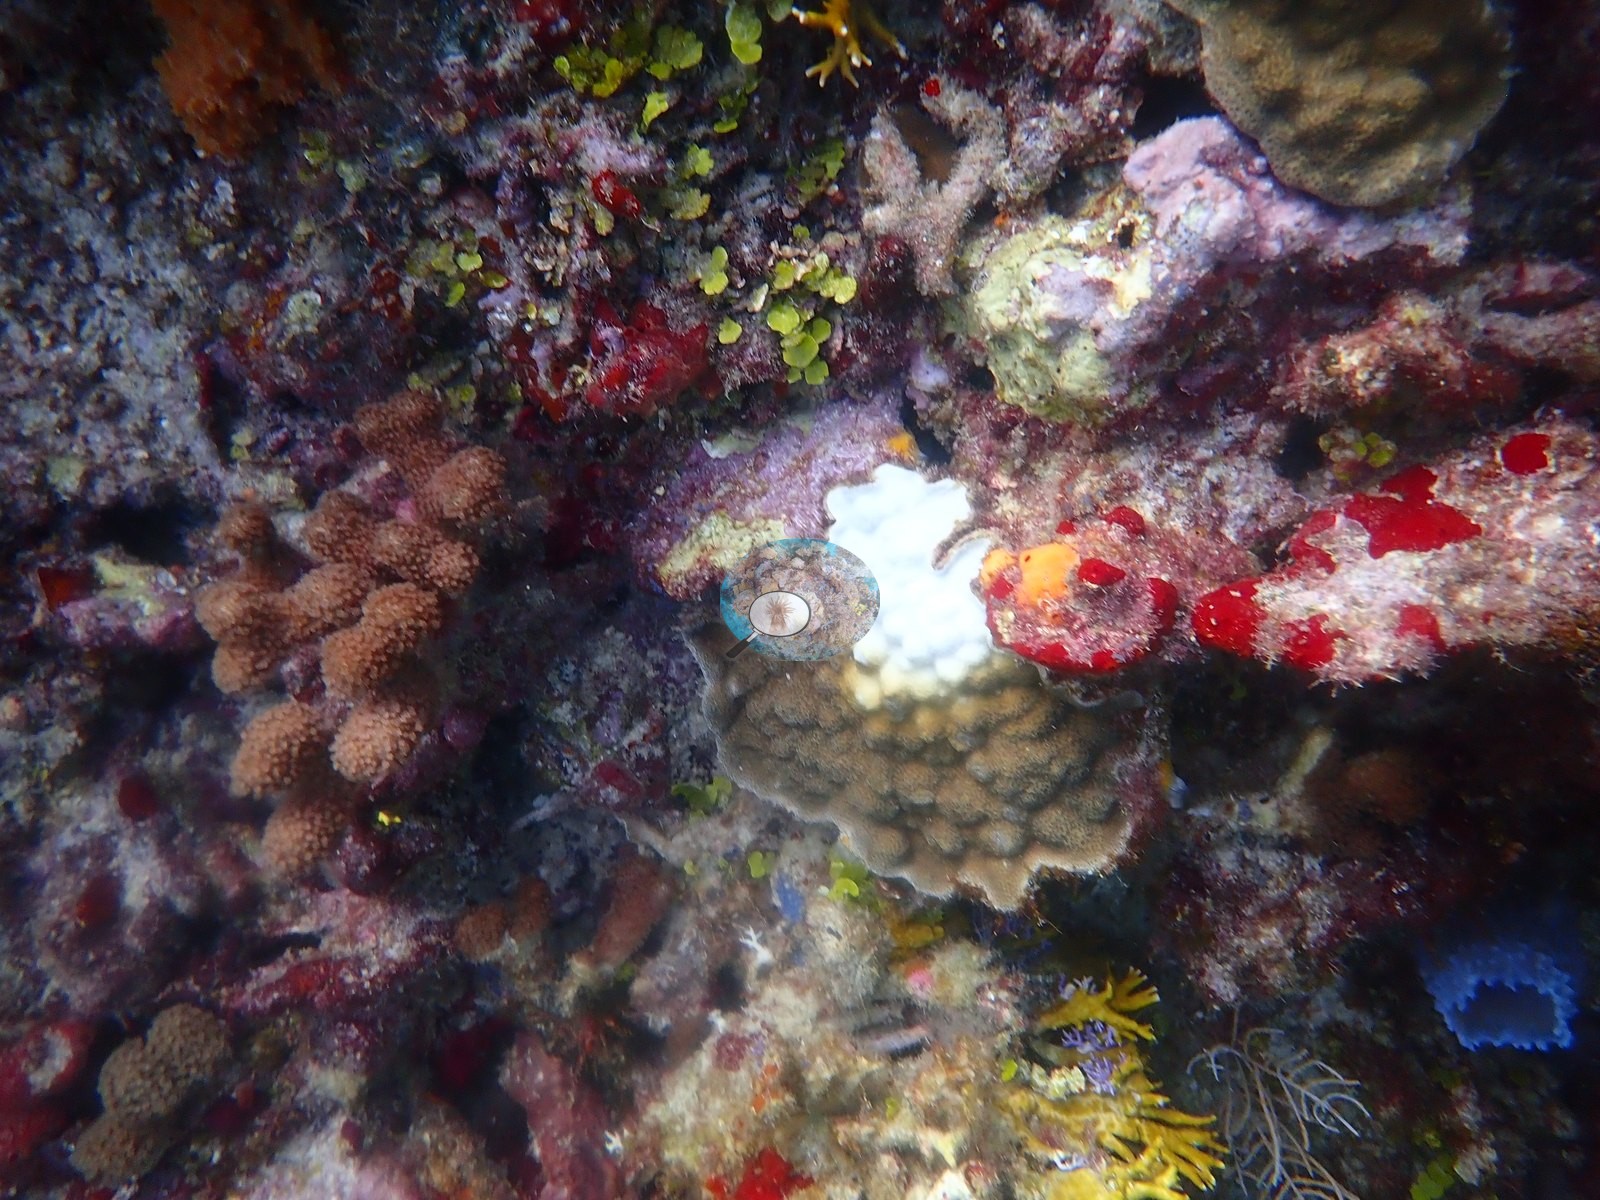
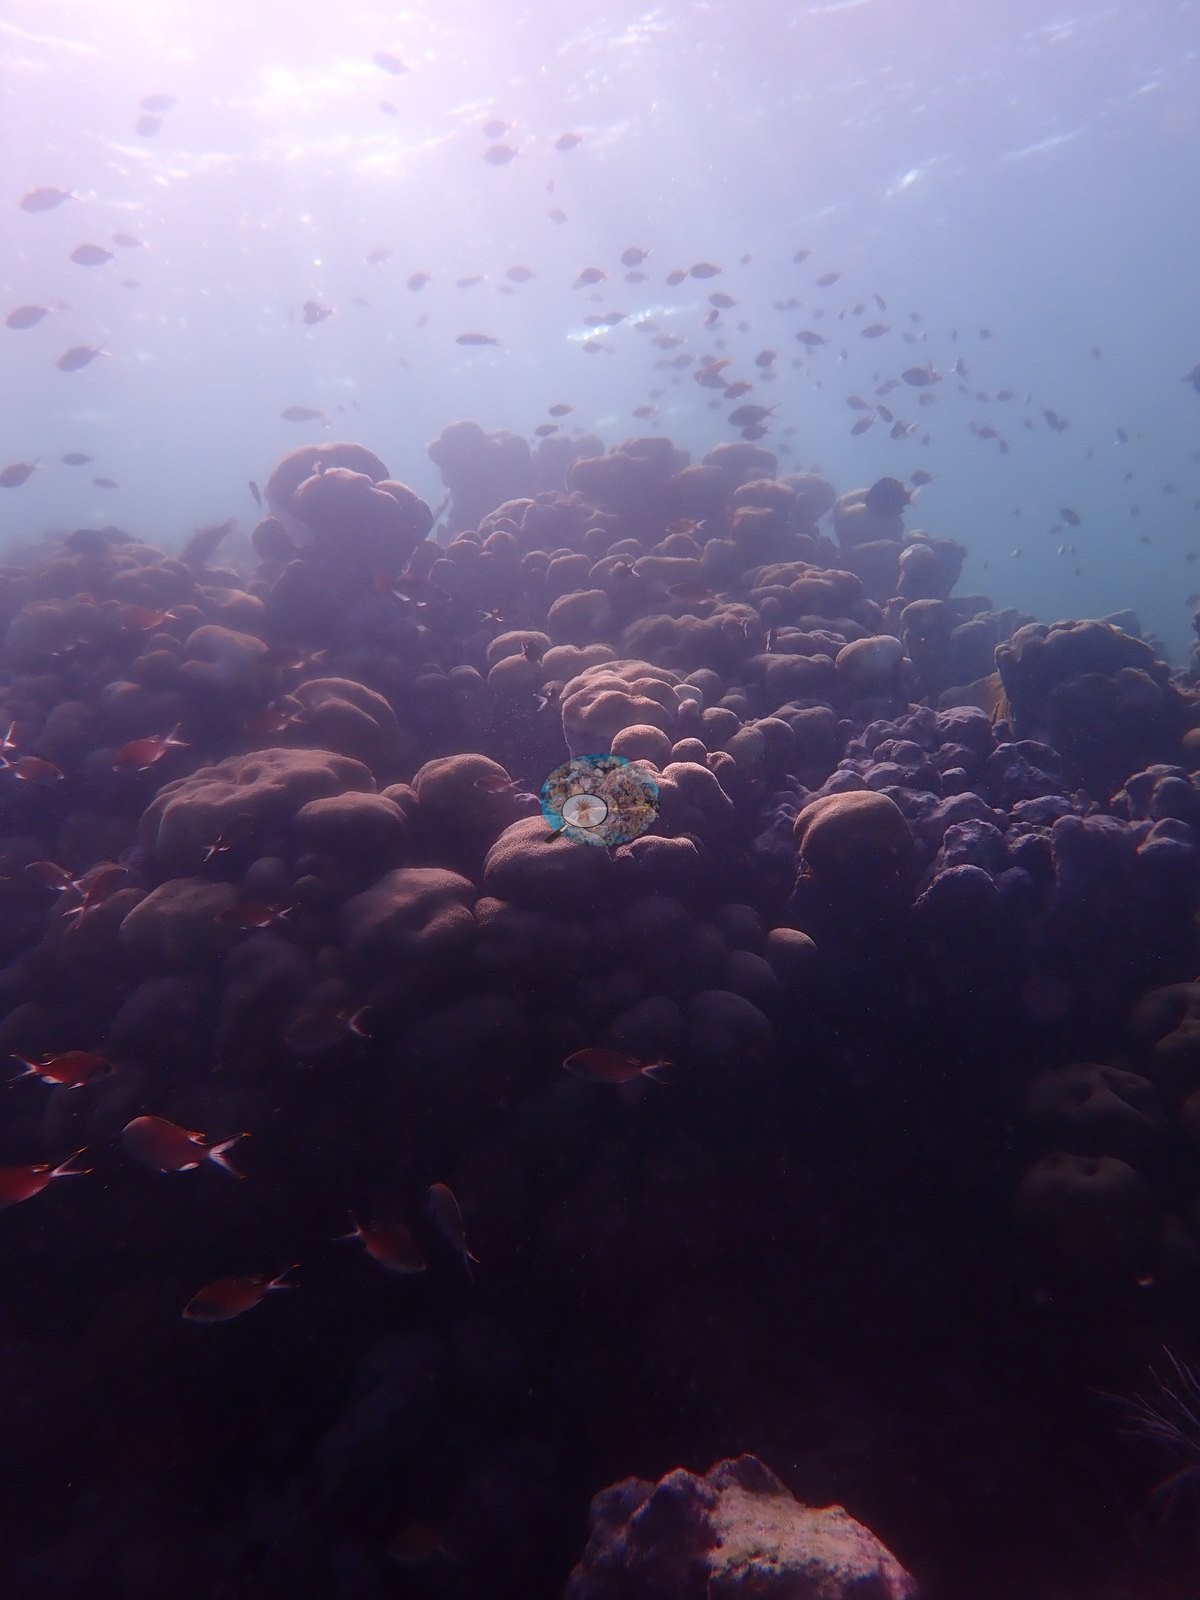
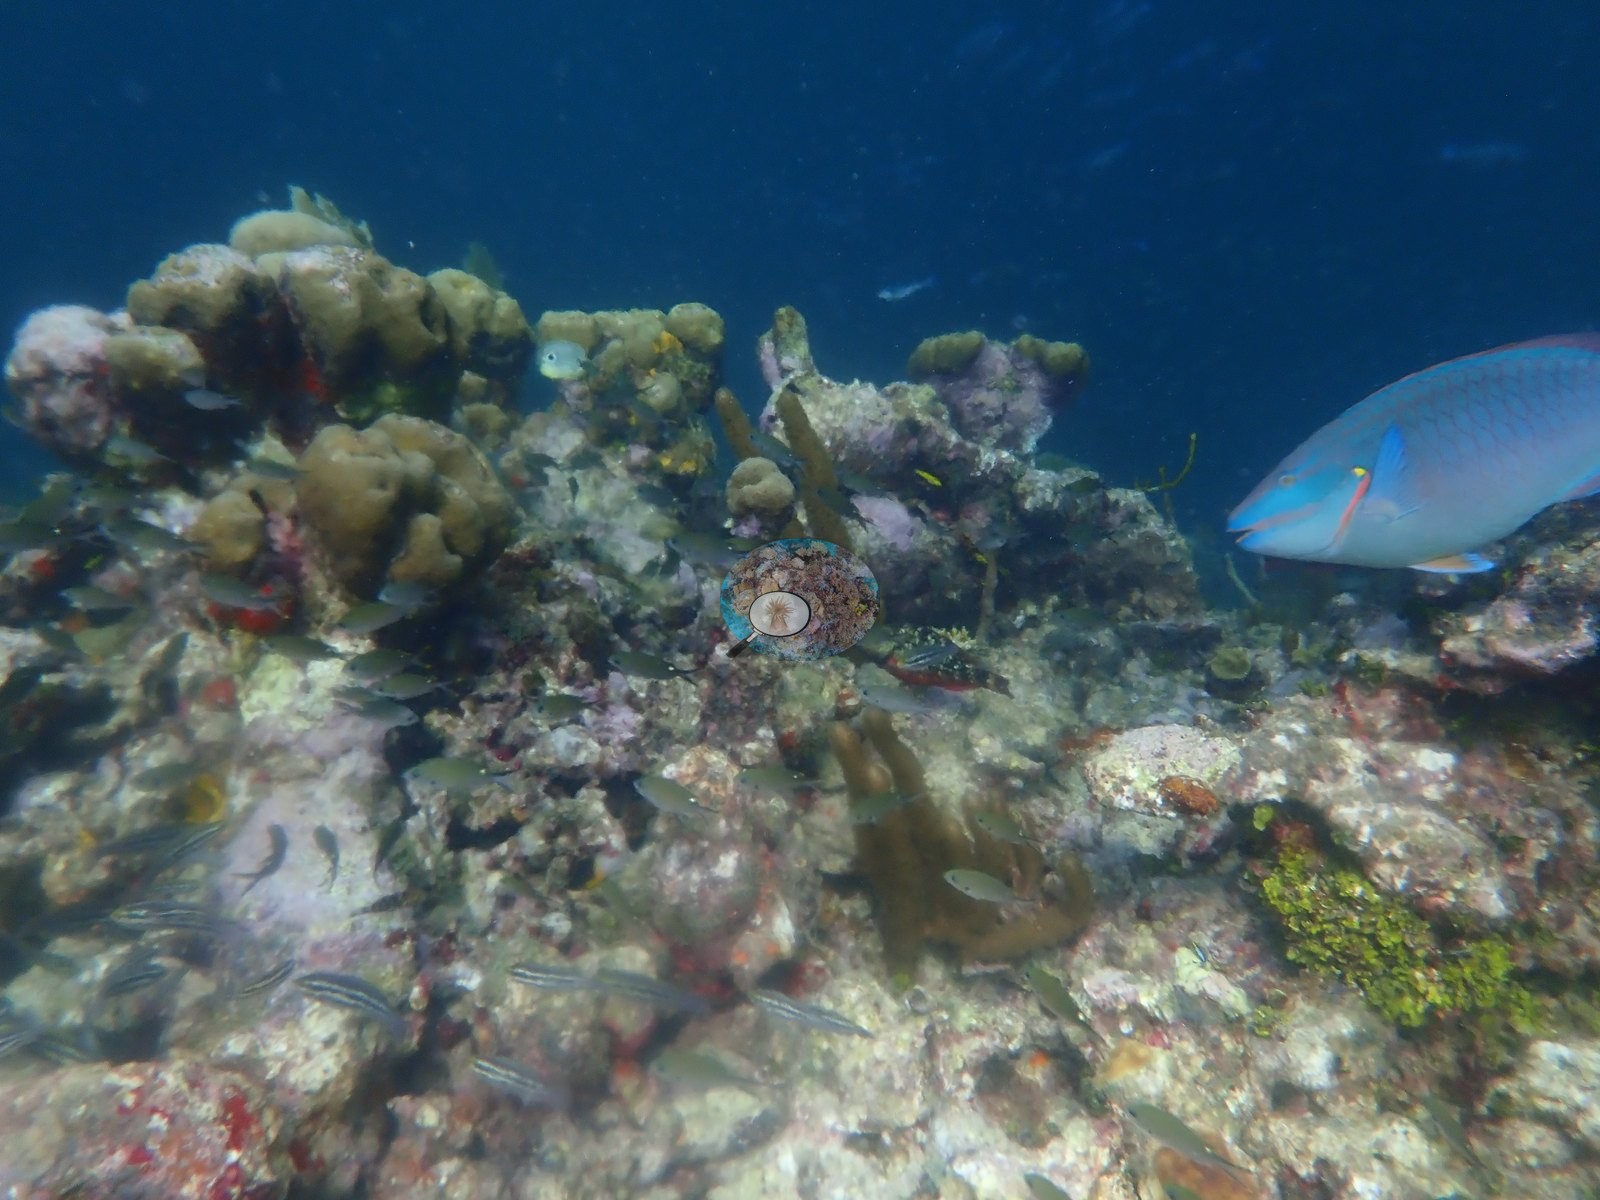
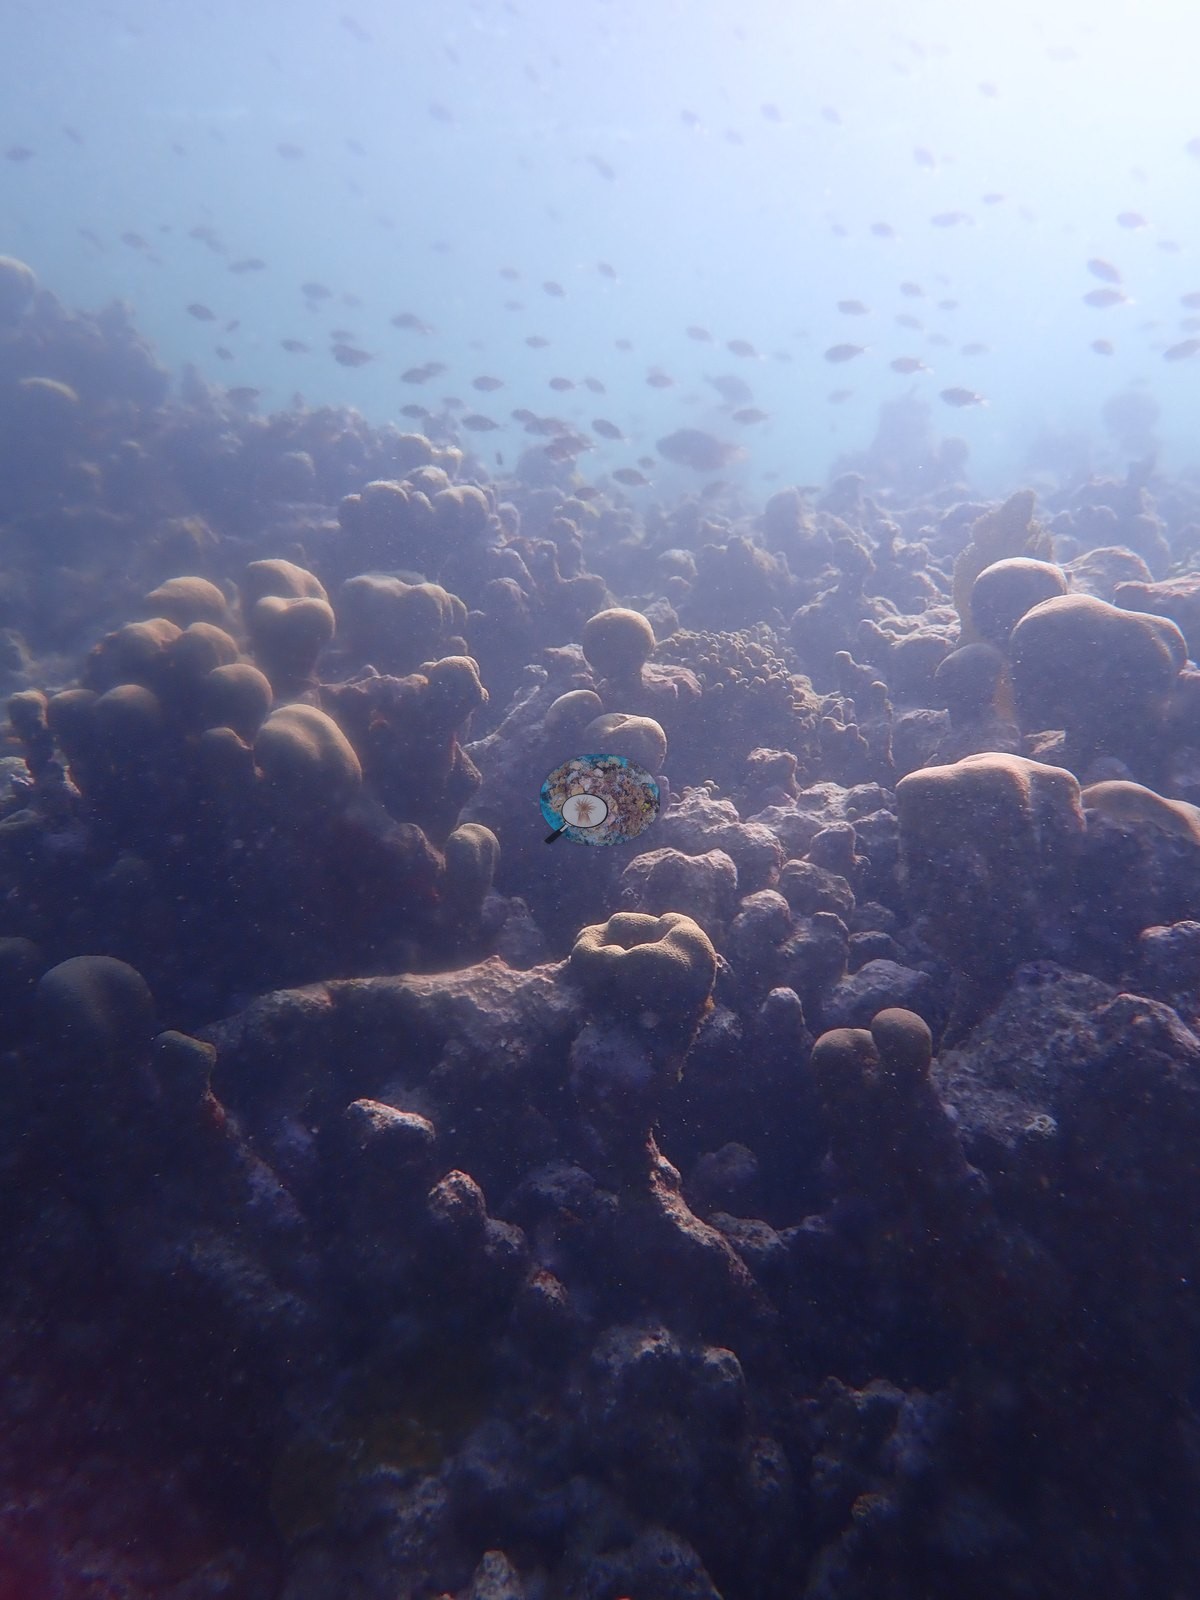
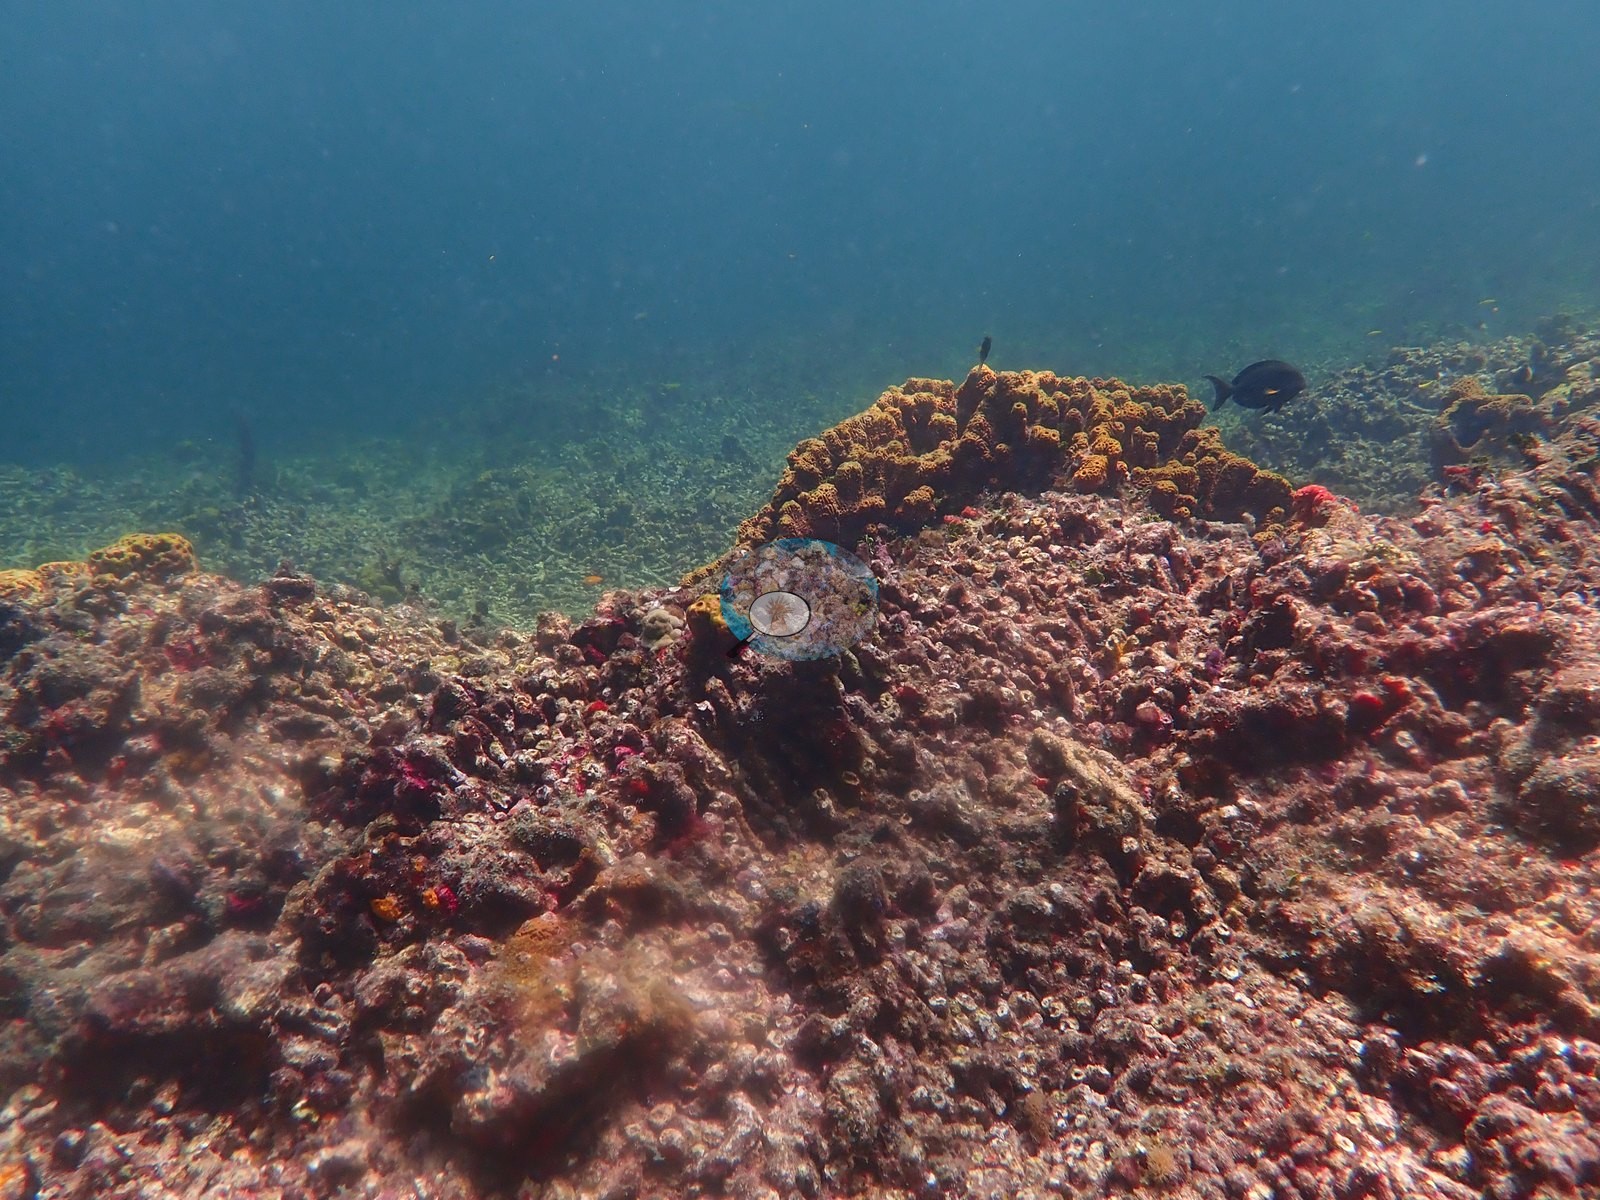
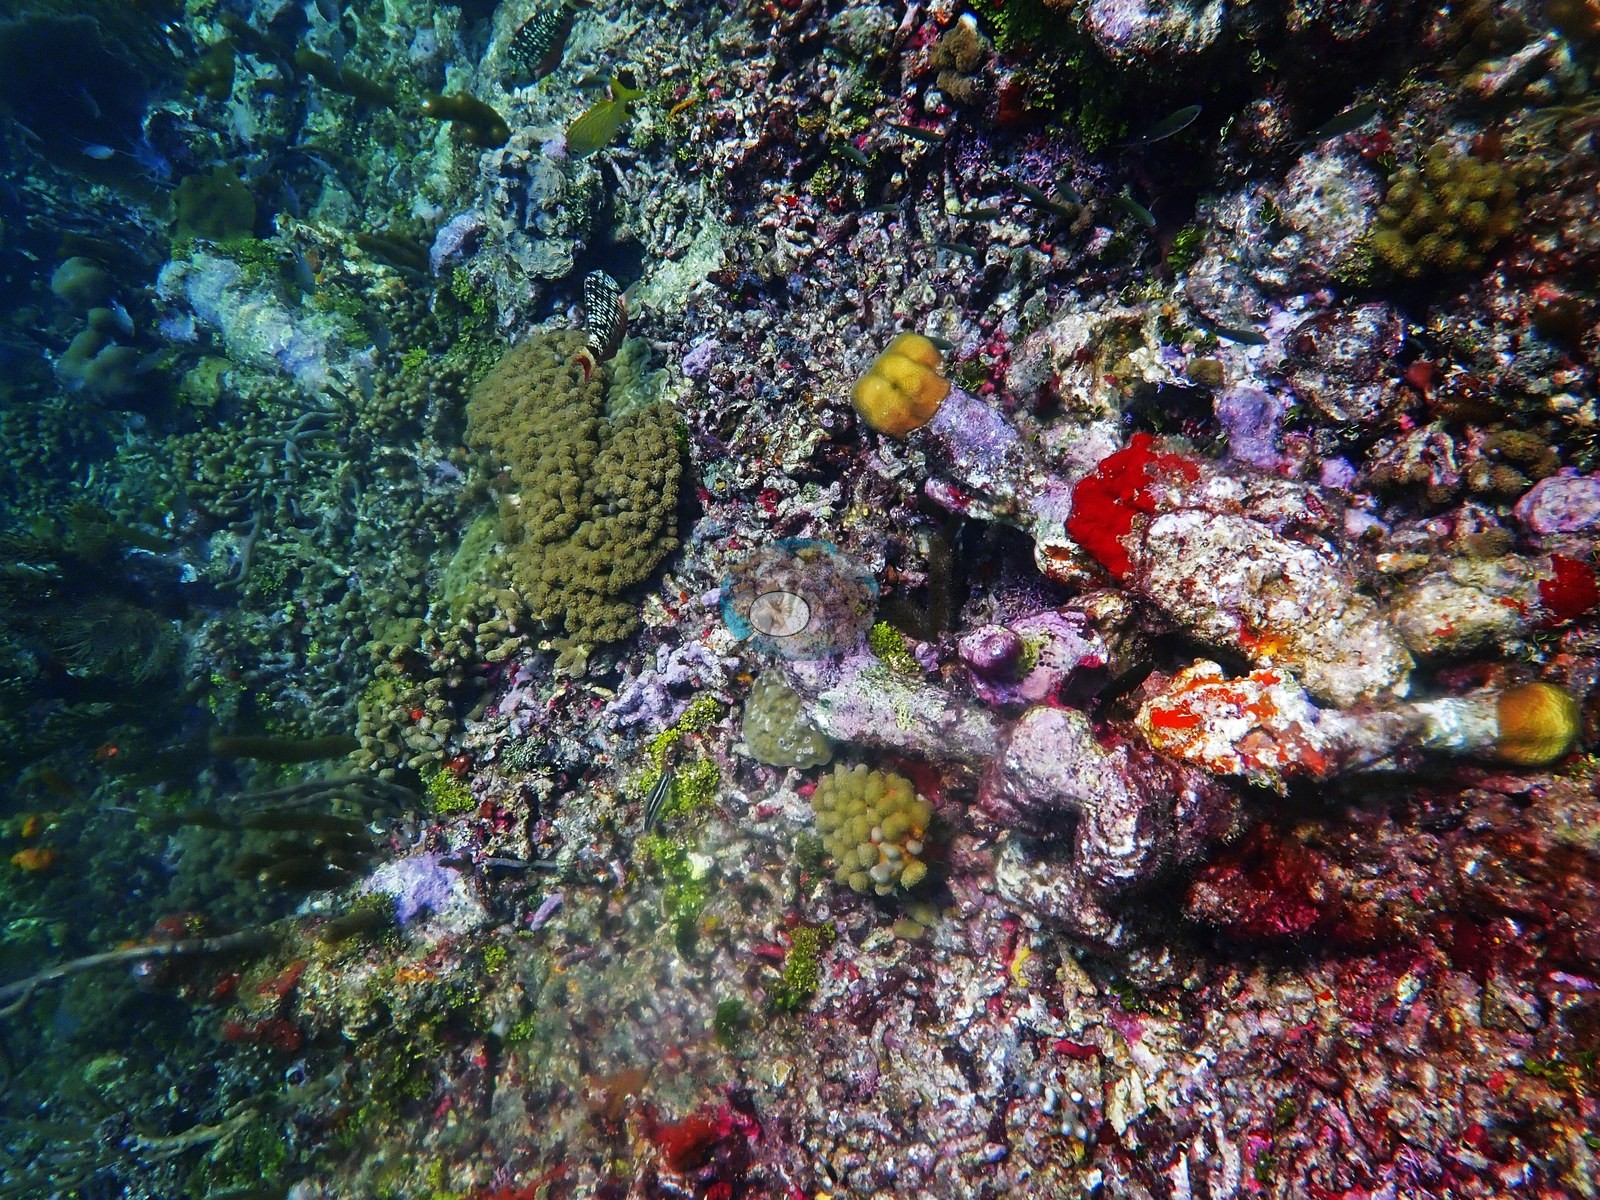
Stony corals are present but subordinate - mounding and encrusting heads, small brain-type colonies, and low knobby colonies scattered between the sponges, with clean white sand patches in the hollows (e.g., Image 3).
Coral cover
- Reference: Claude CV point count (this site's photos)
- Coral cover: 7.0% — a blind Claude computer-vision point count of 33 of Anderson's edited photographs (20 points per photo; water, fish, and obstructions excluded). The photos are from the 30 September 2019 dive; the median is 5.0%. Many of these frames are fish and open-water shots, so the low value reflects photo selection more than the reef itself.
Stressors
No corallivores evident.
Fish and other fauna
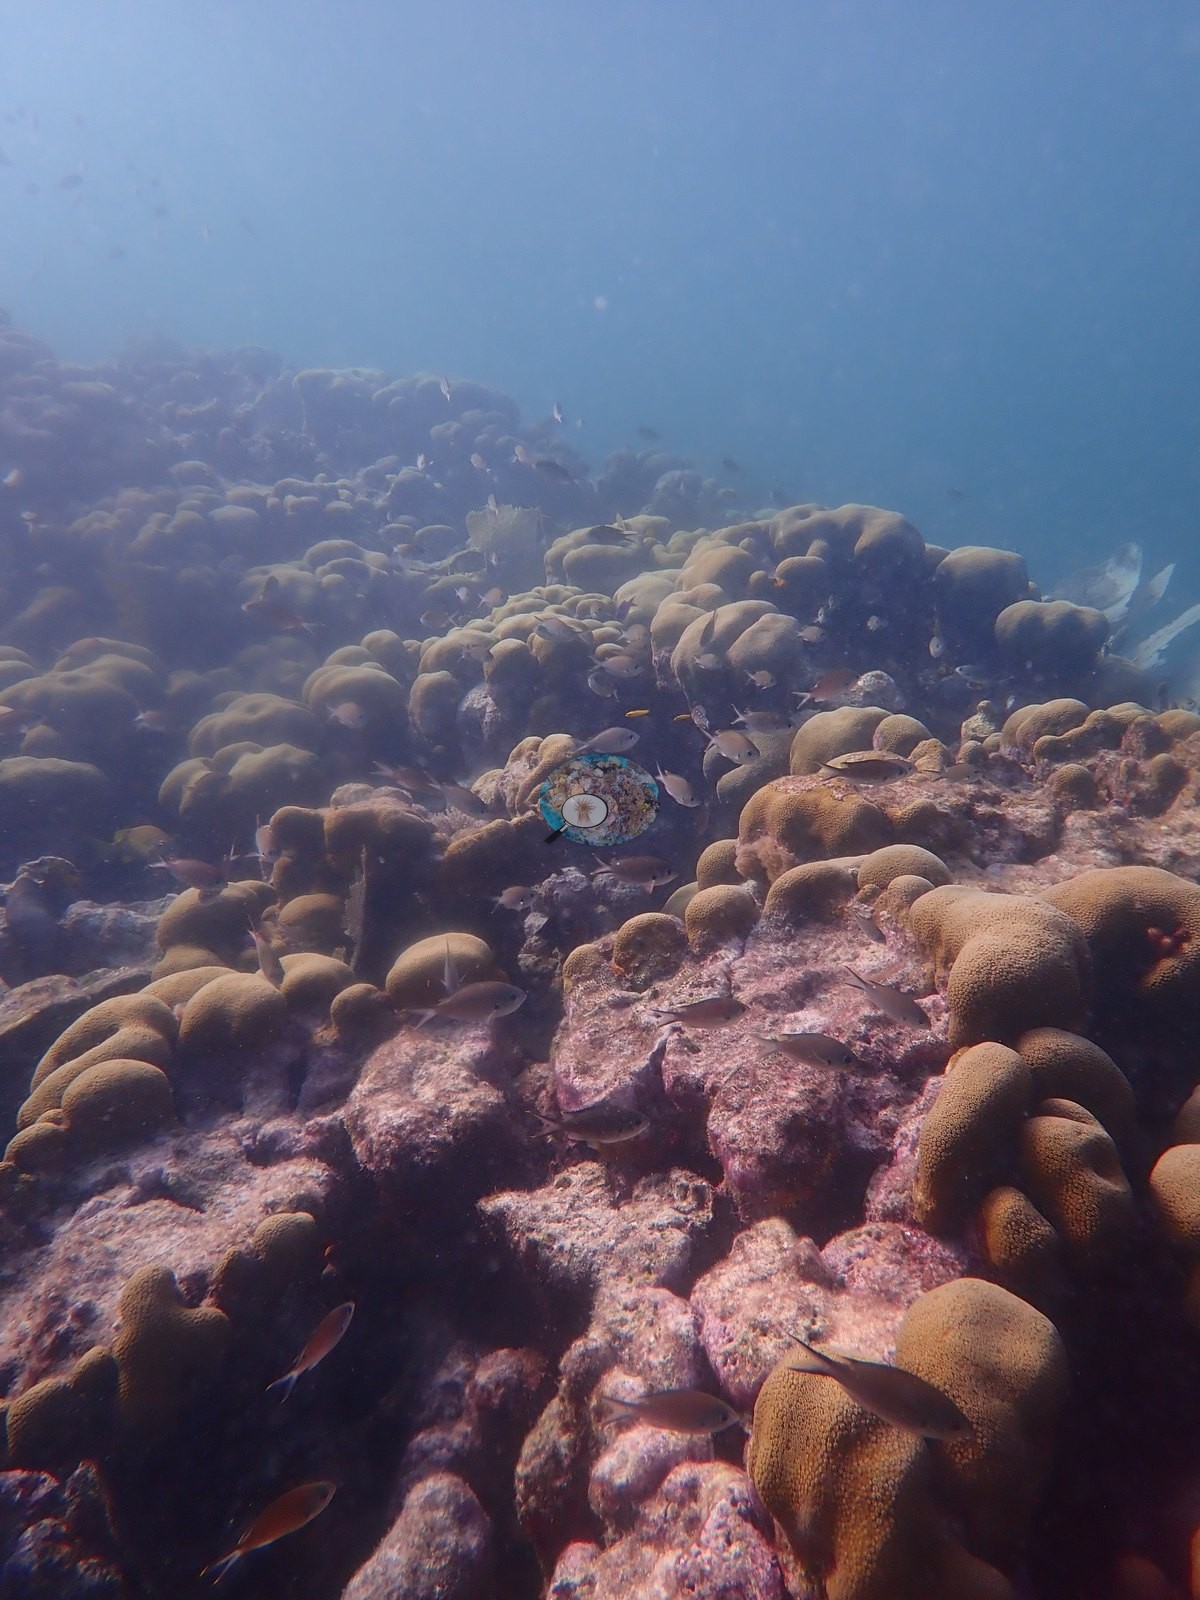
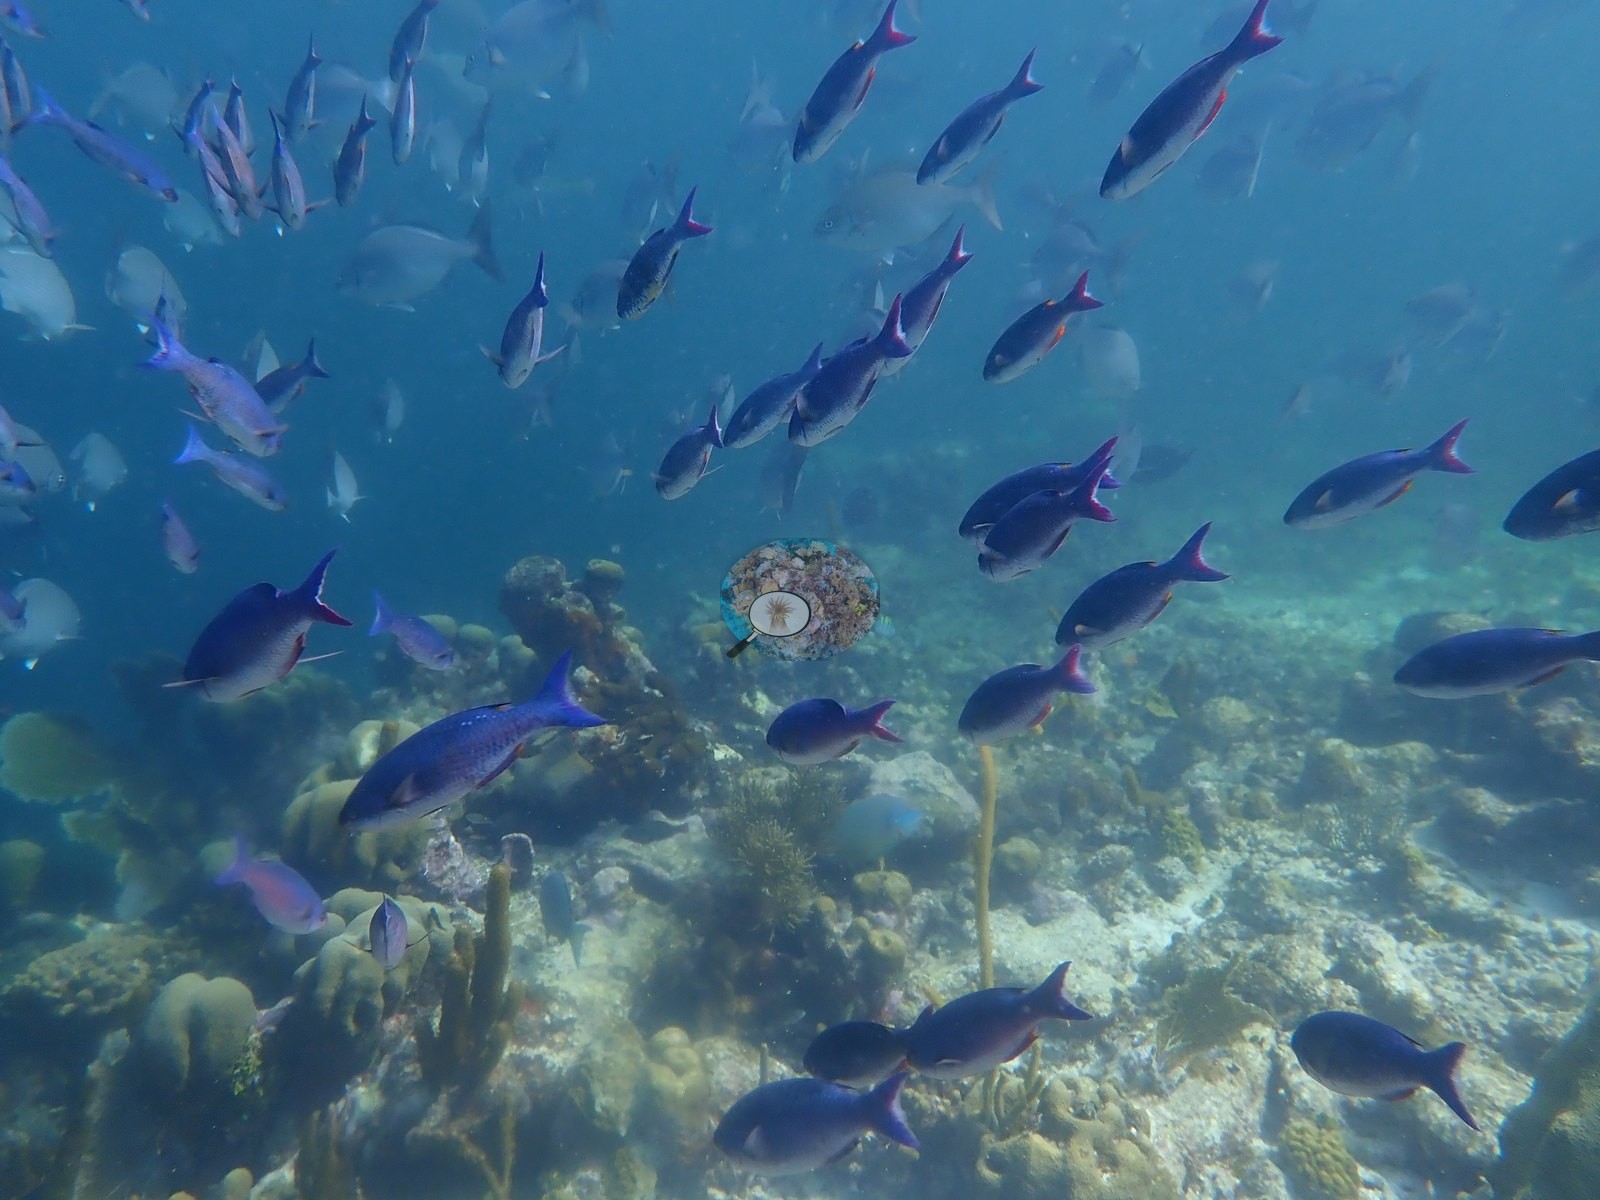
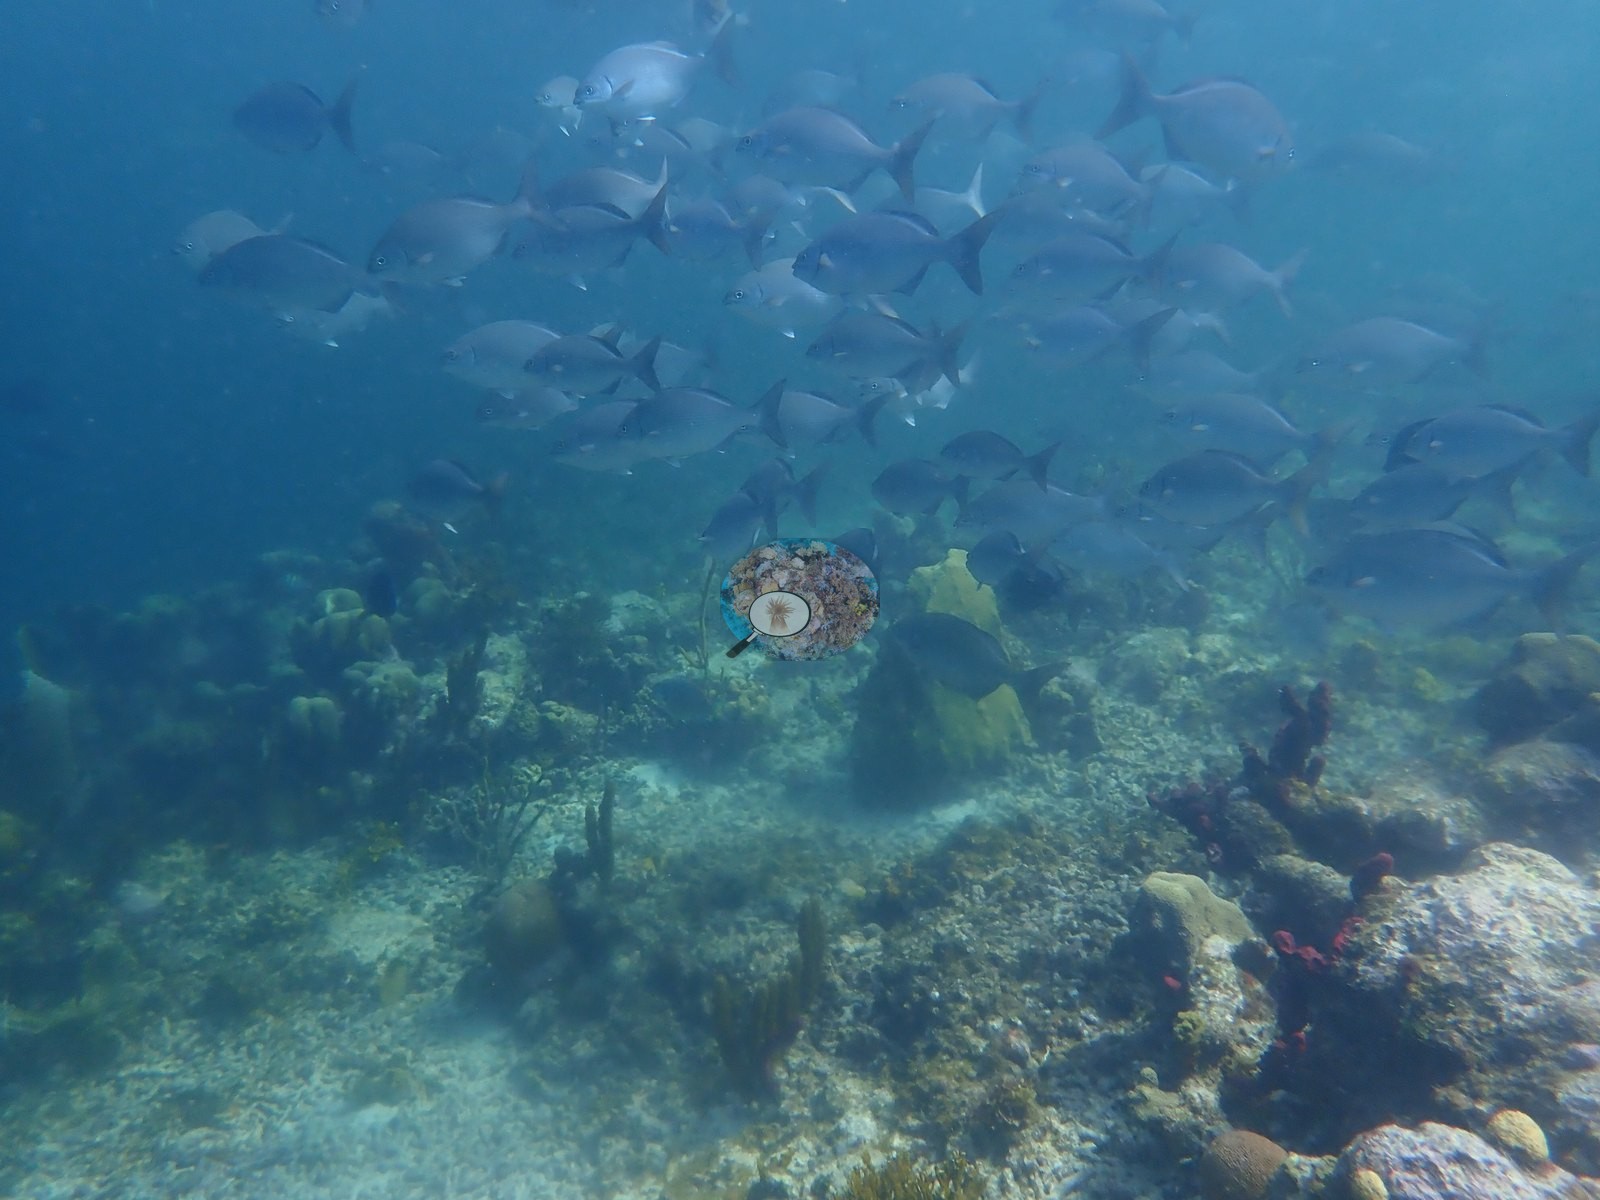
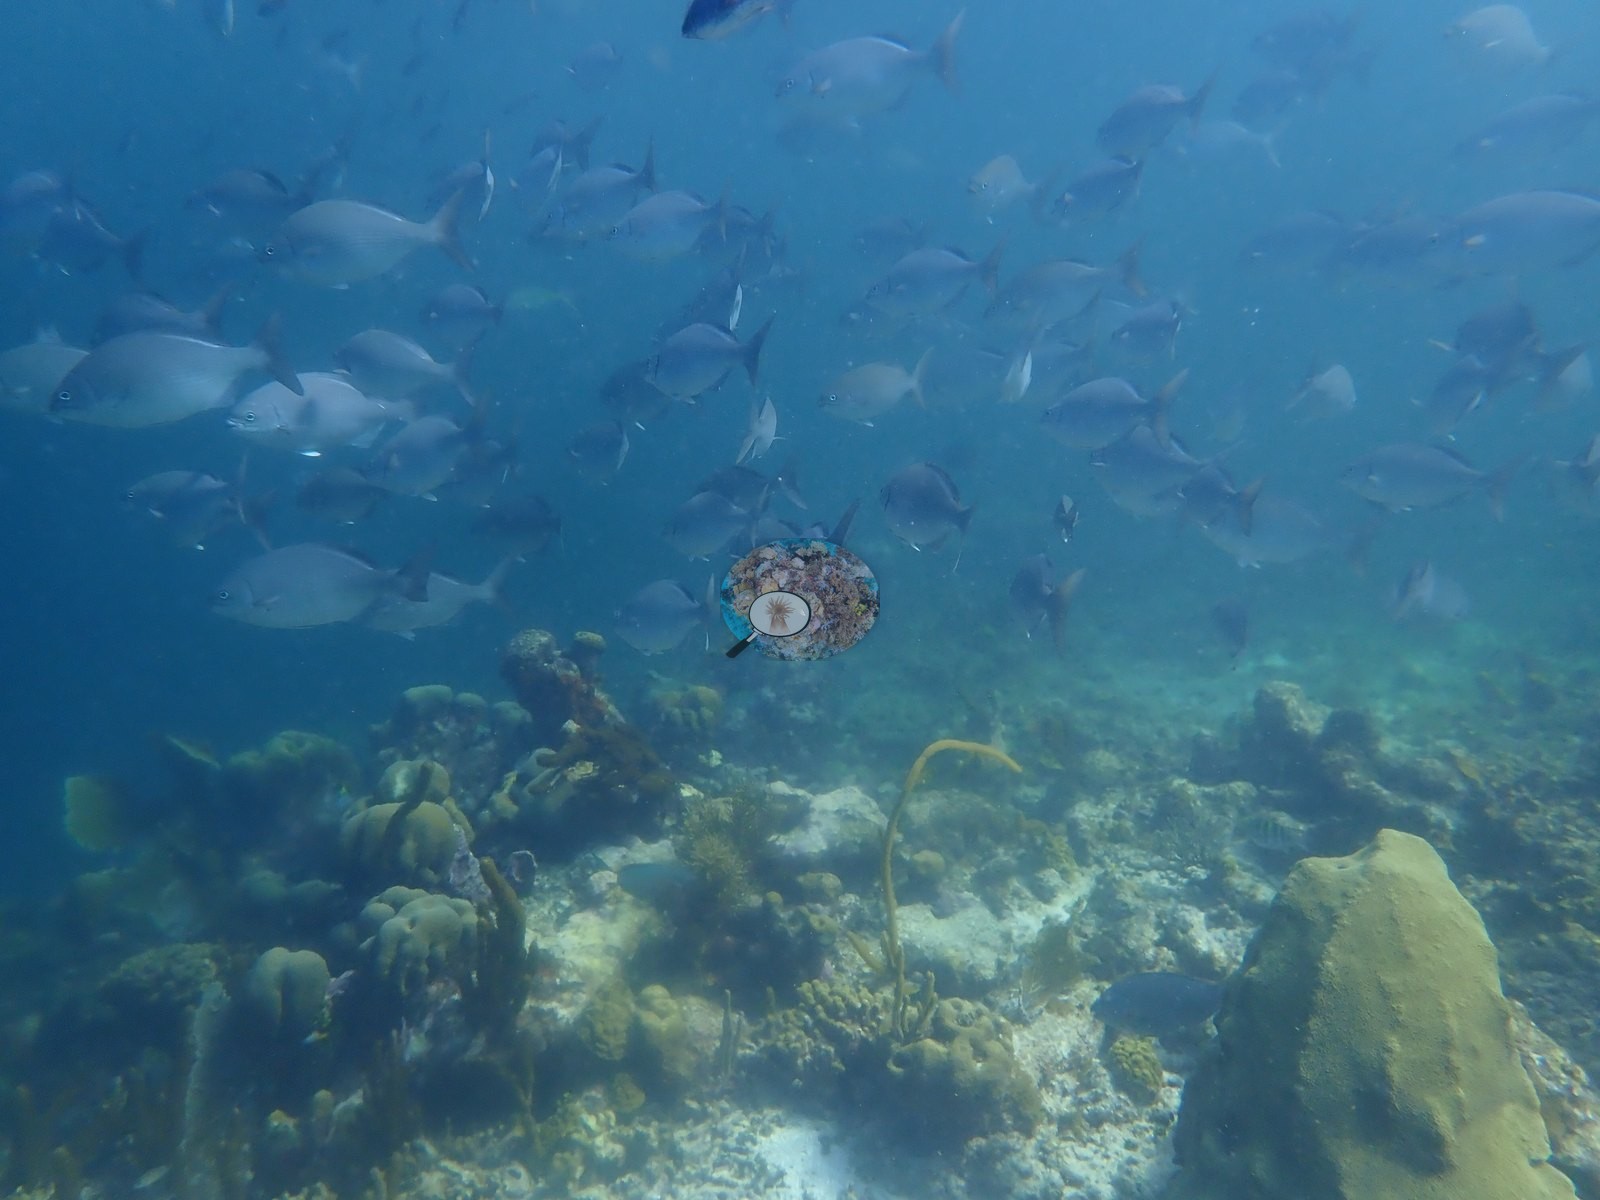
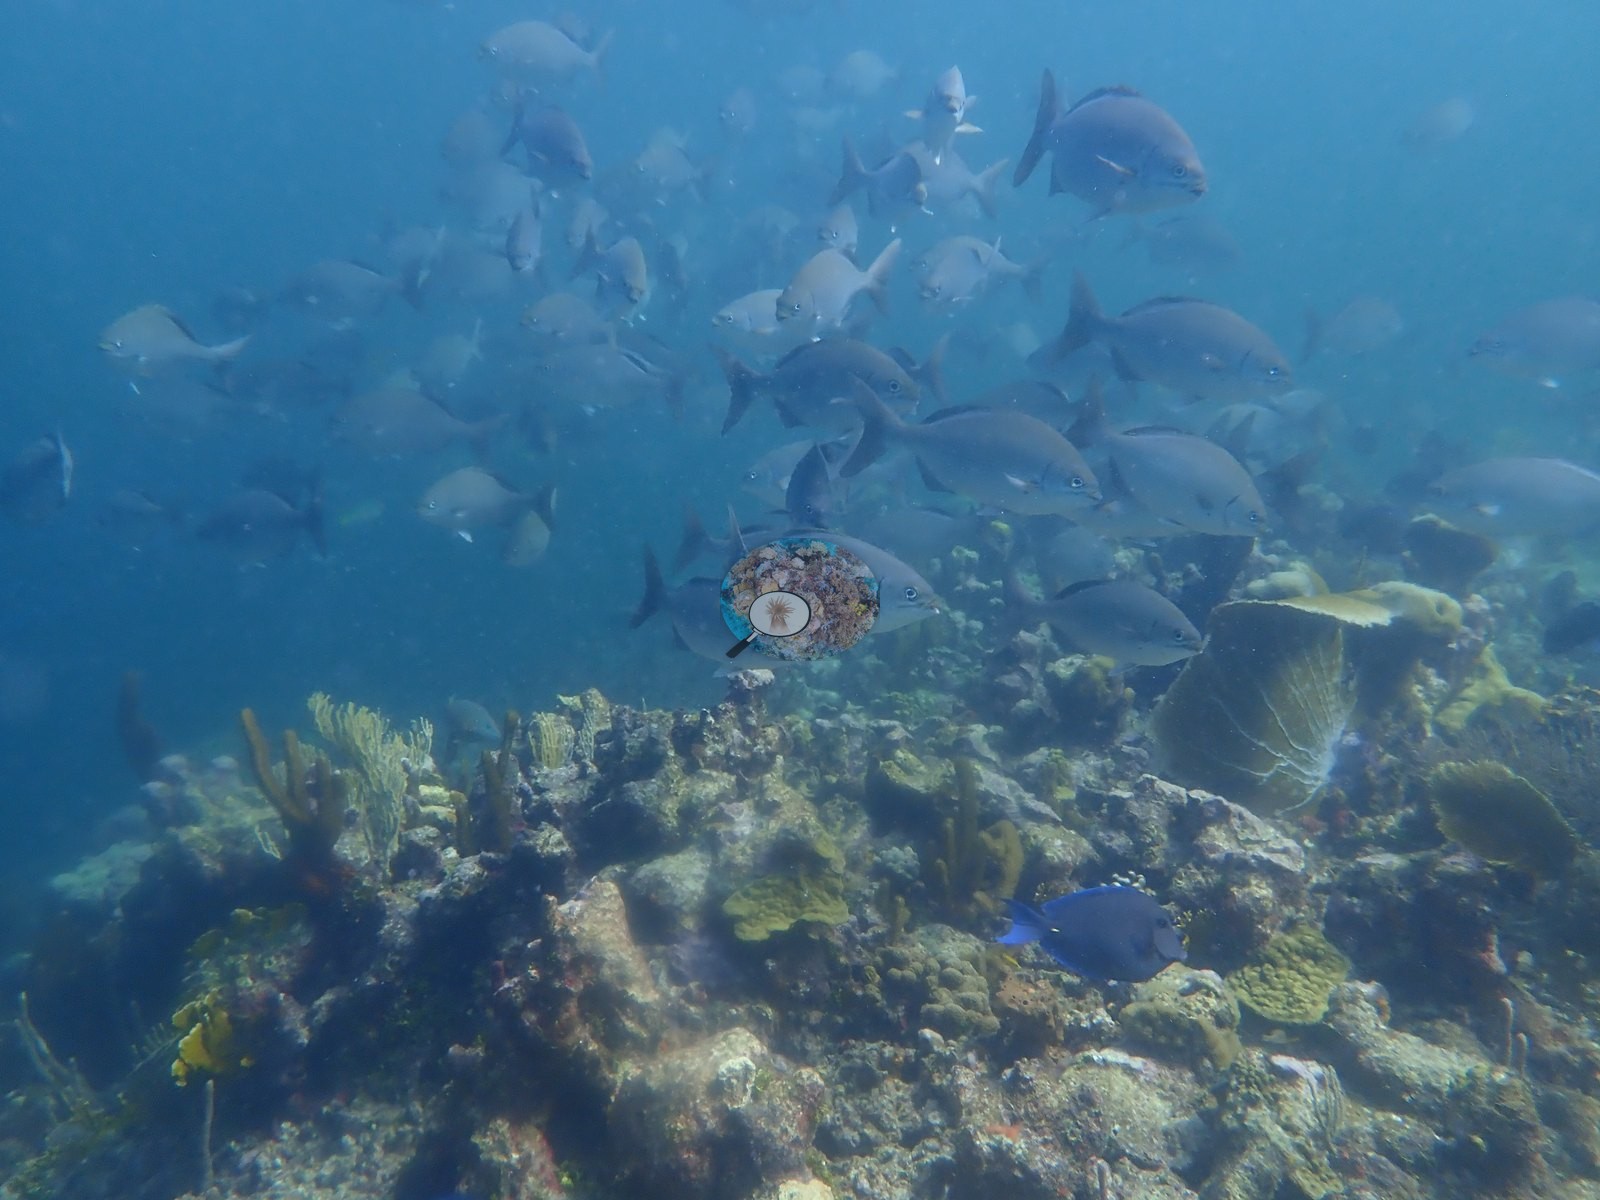
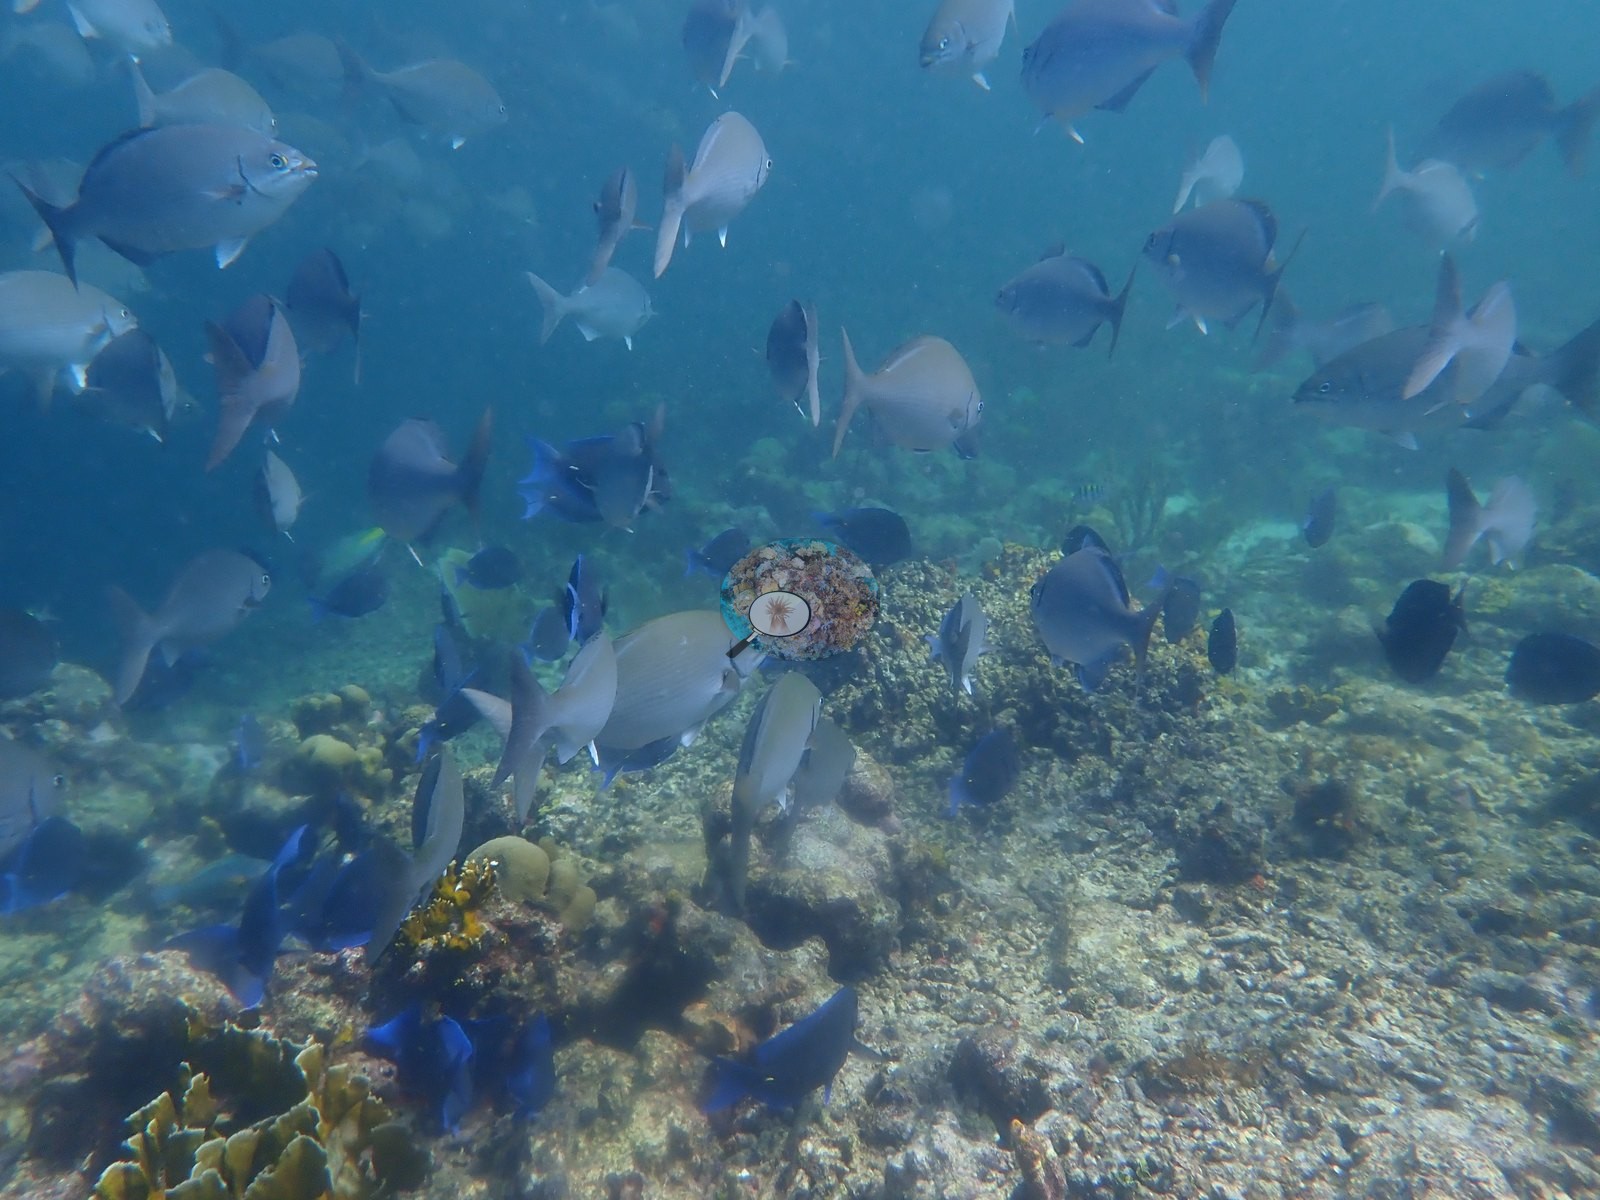
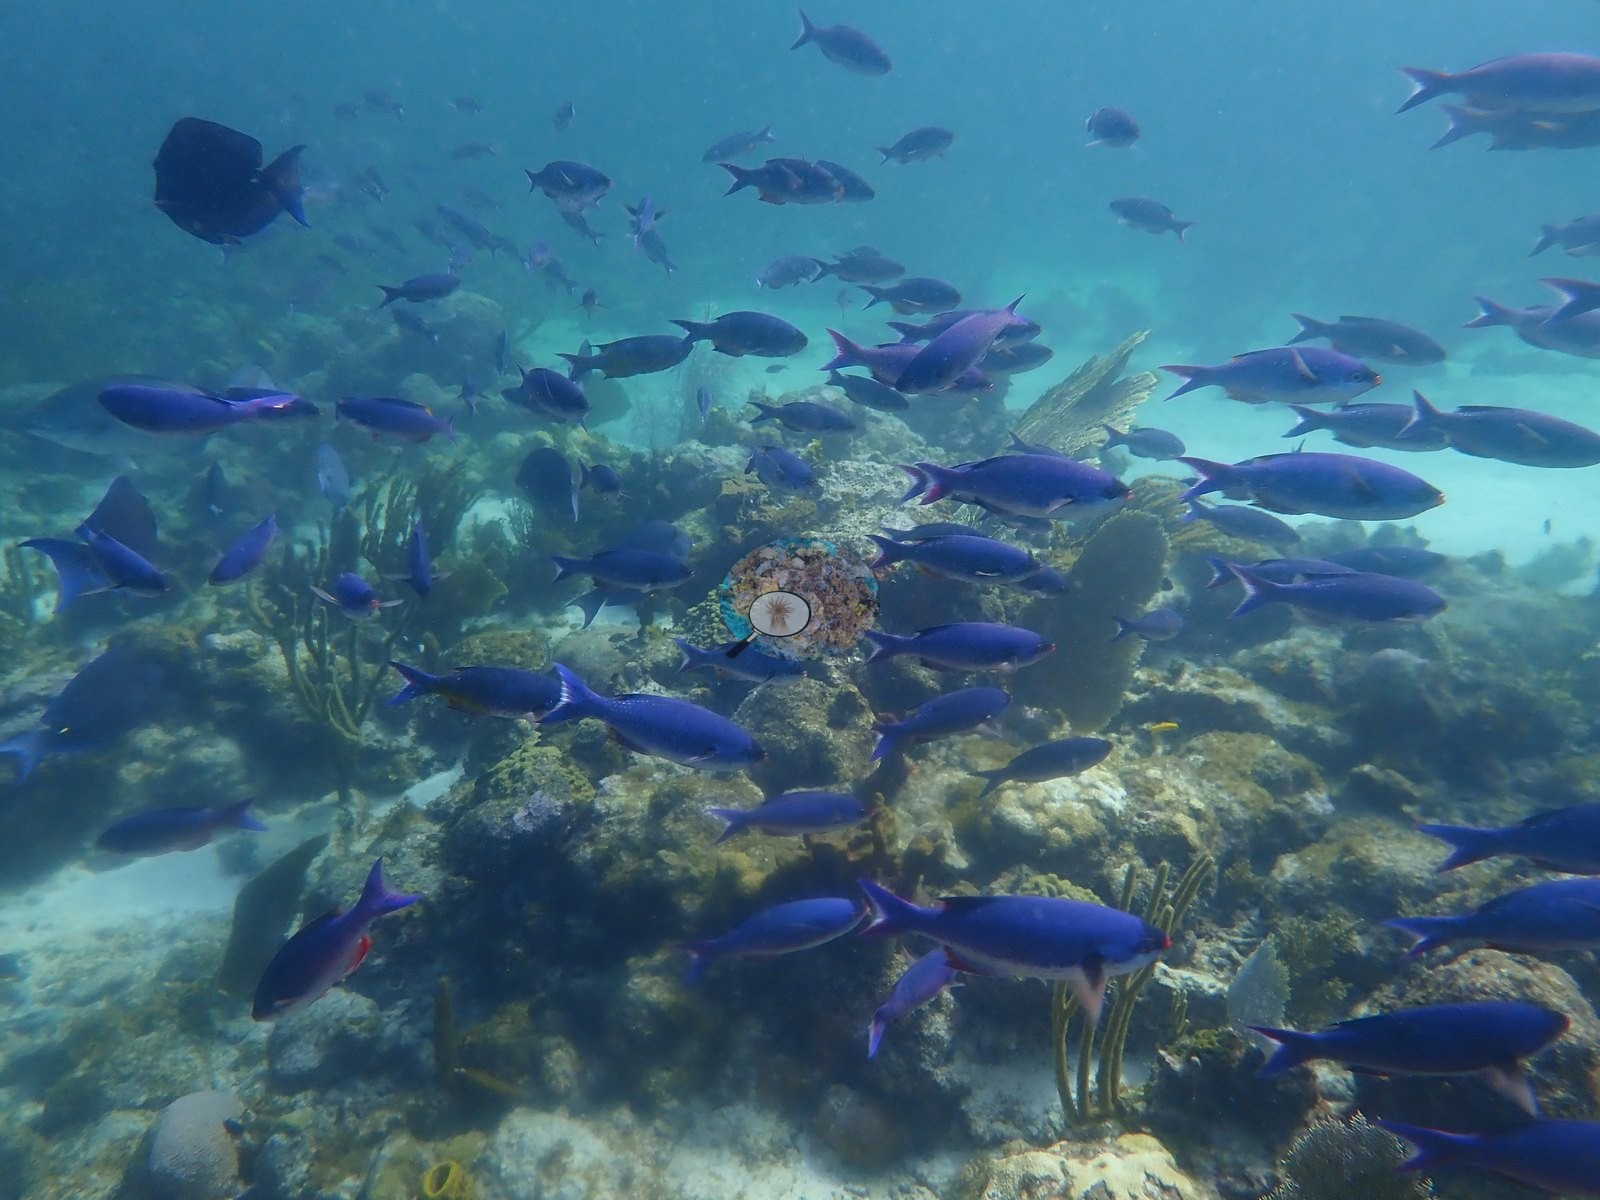
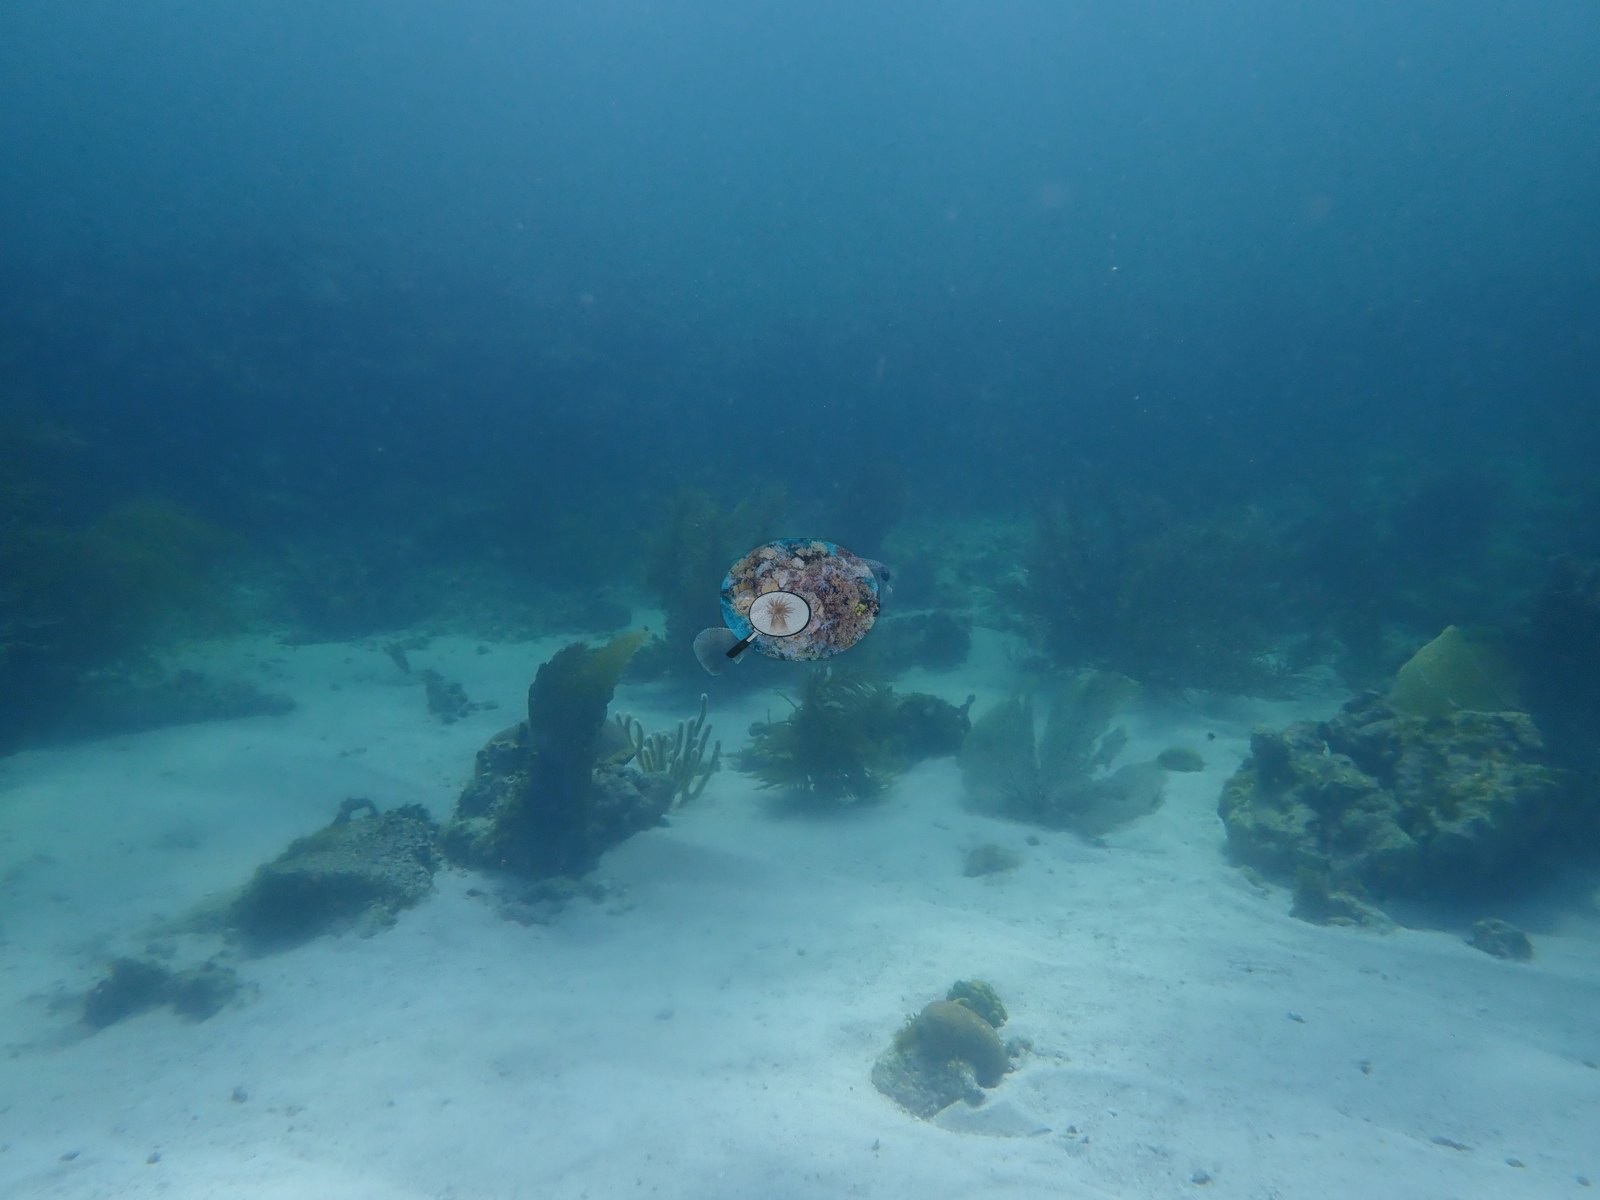
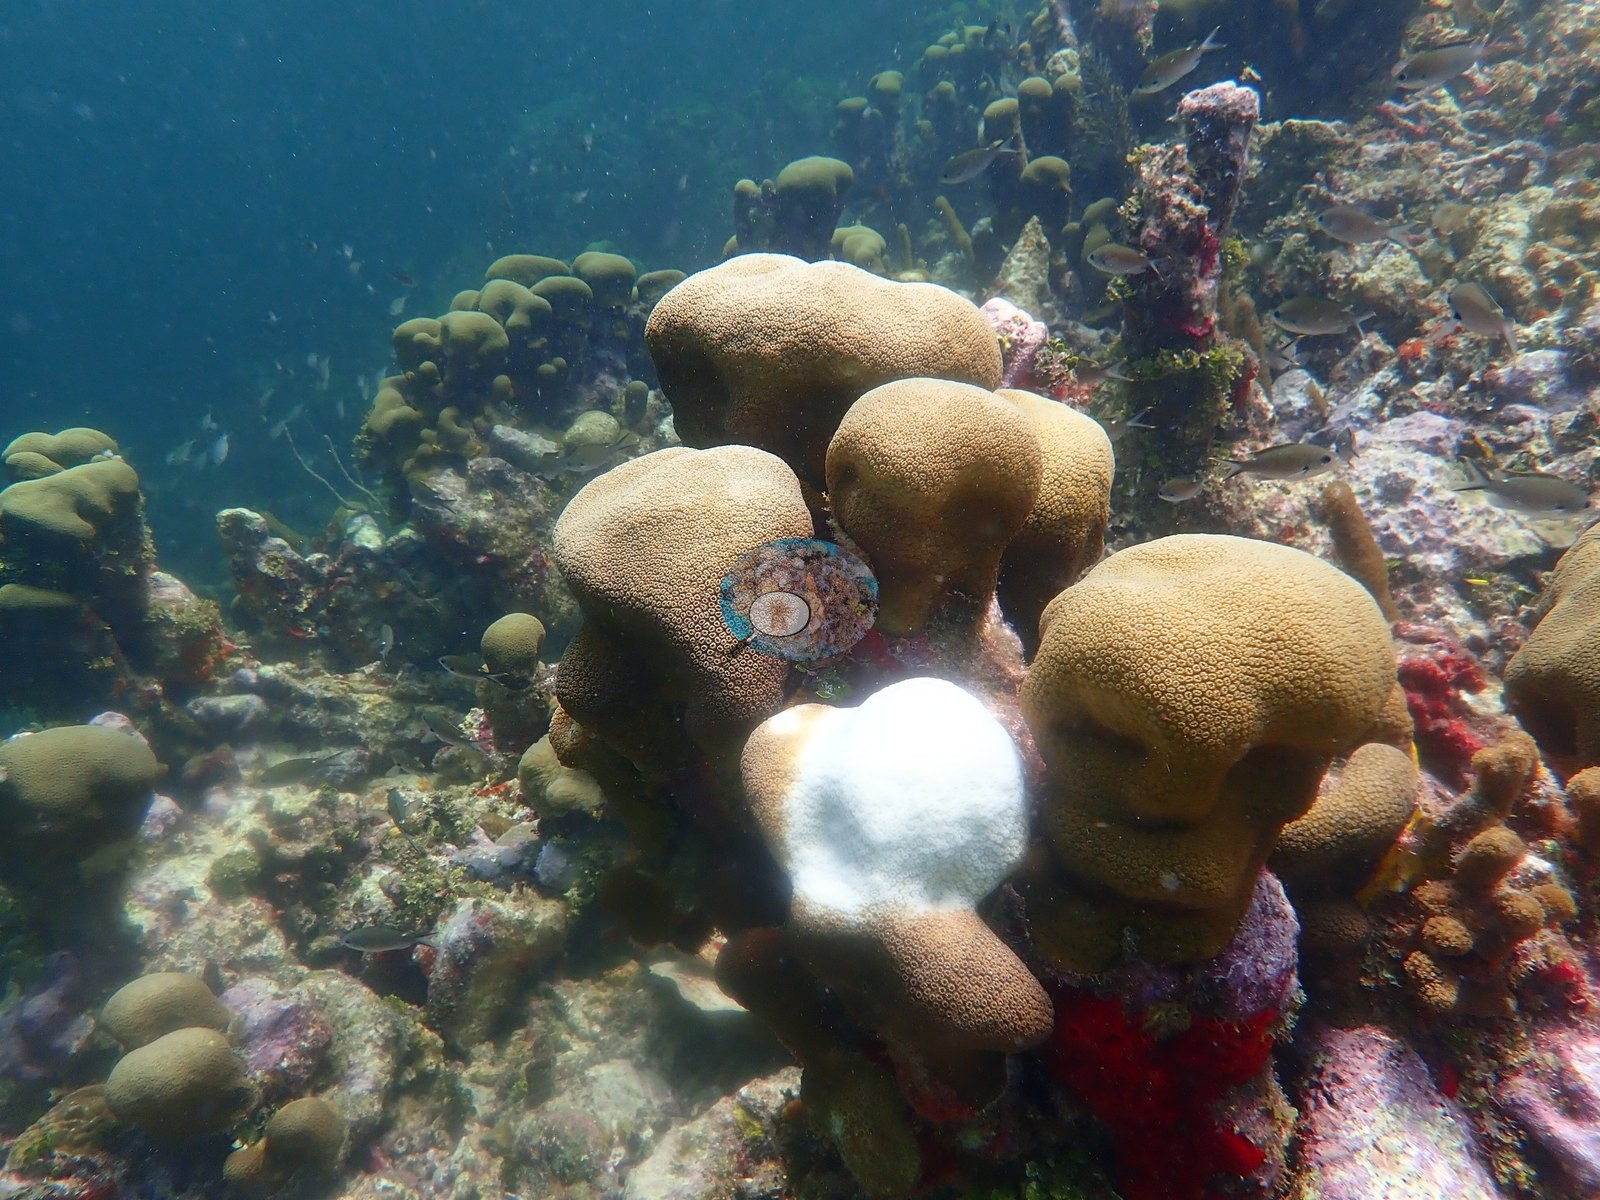
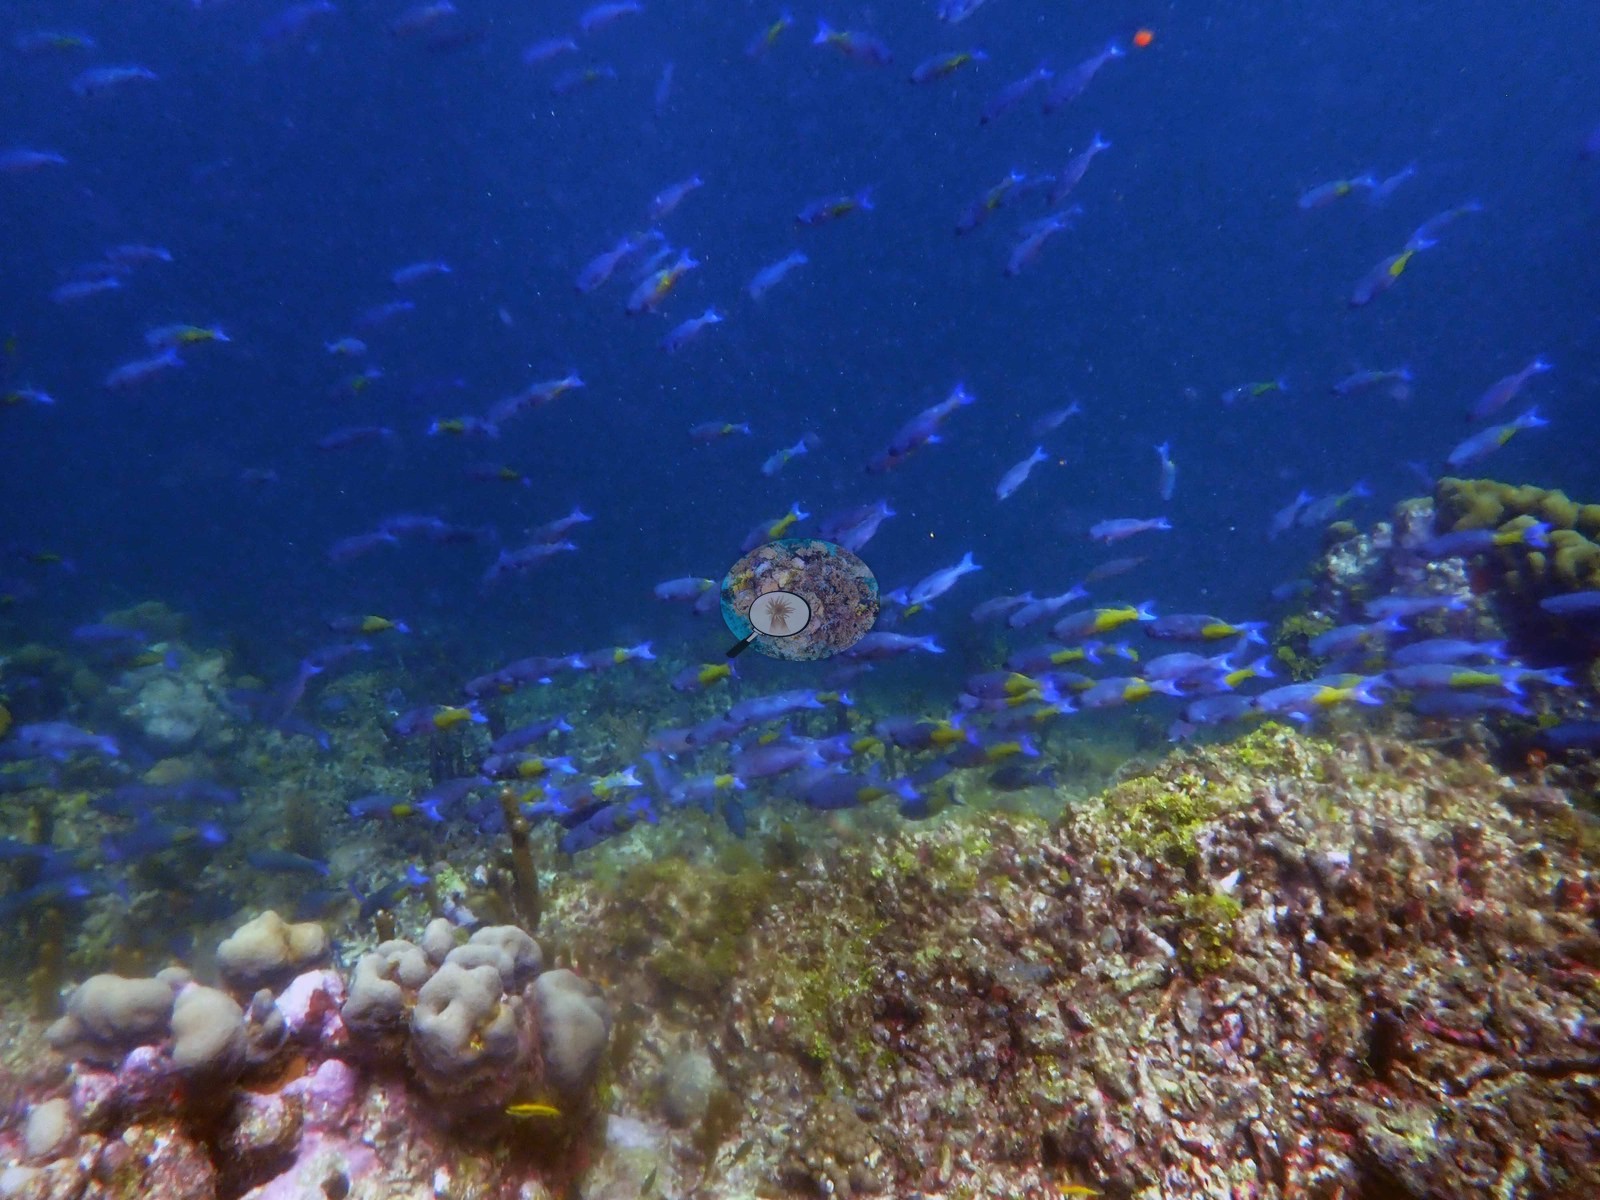
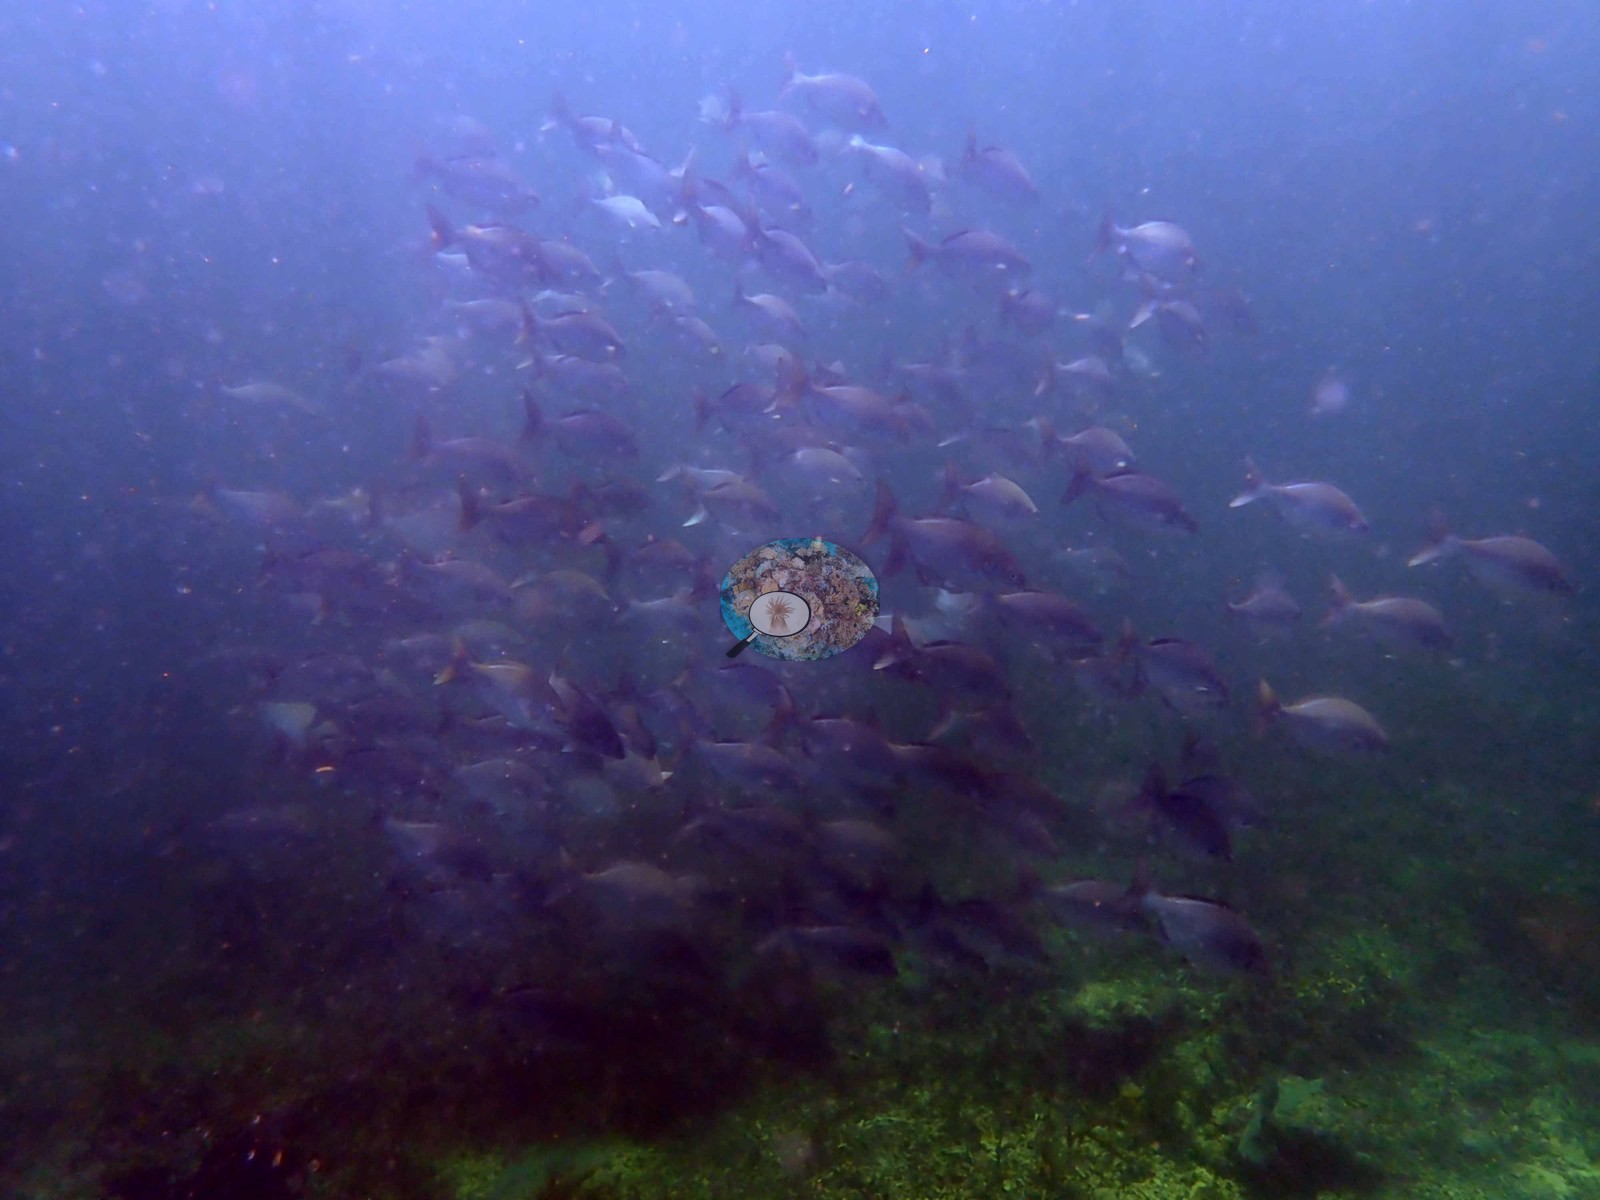
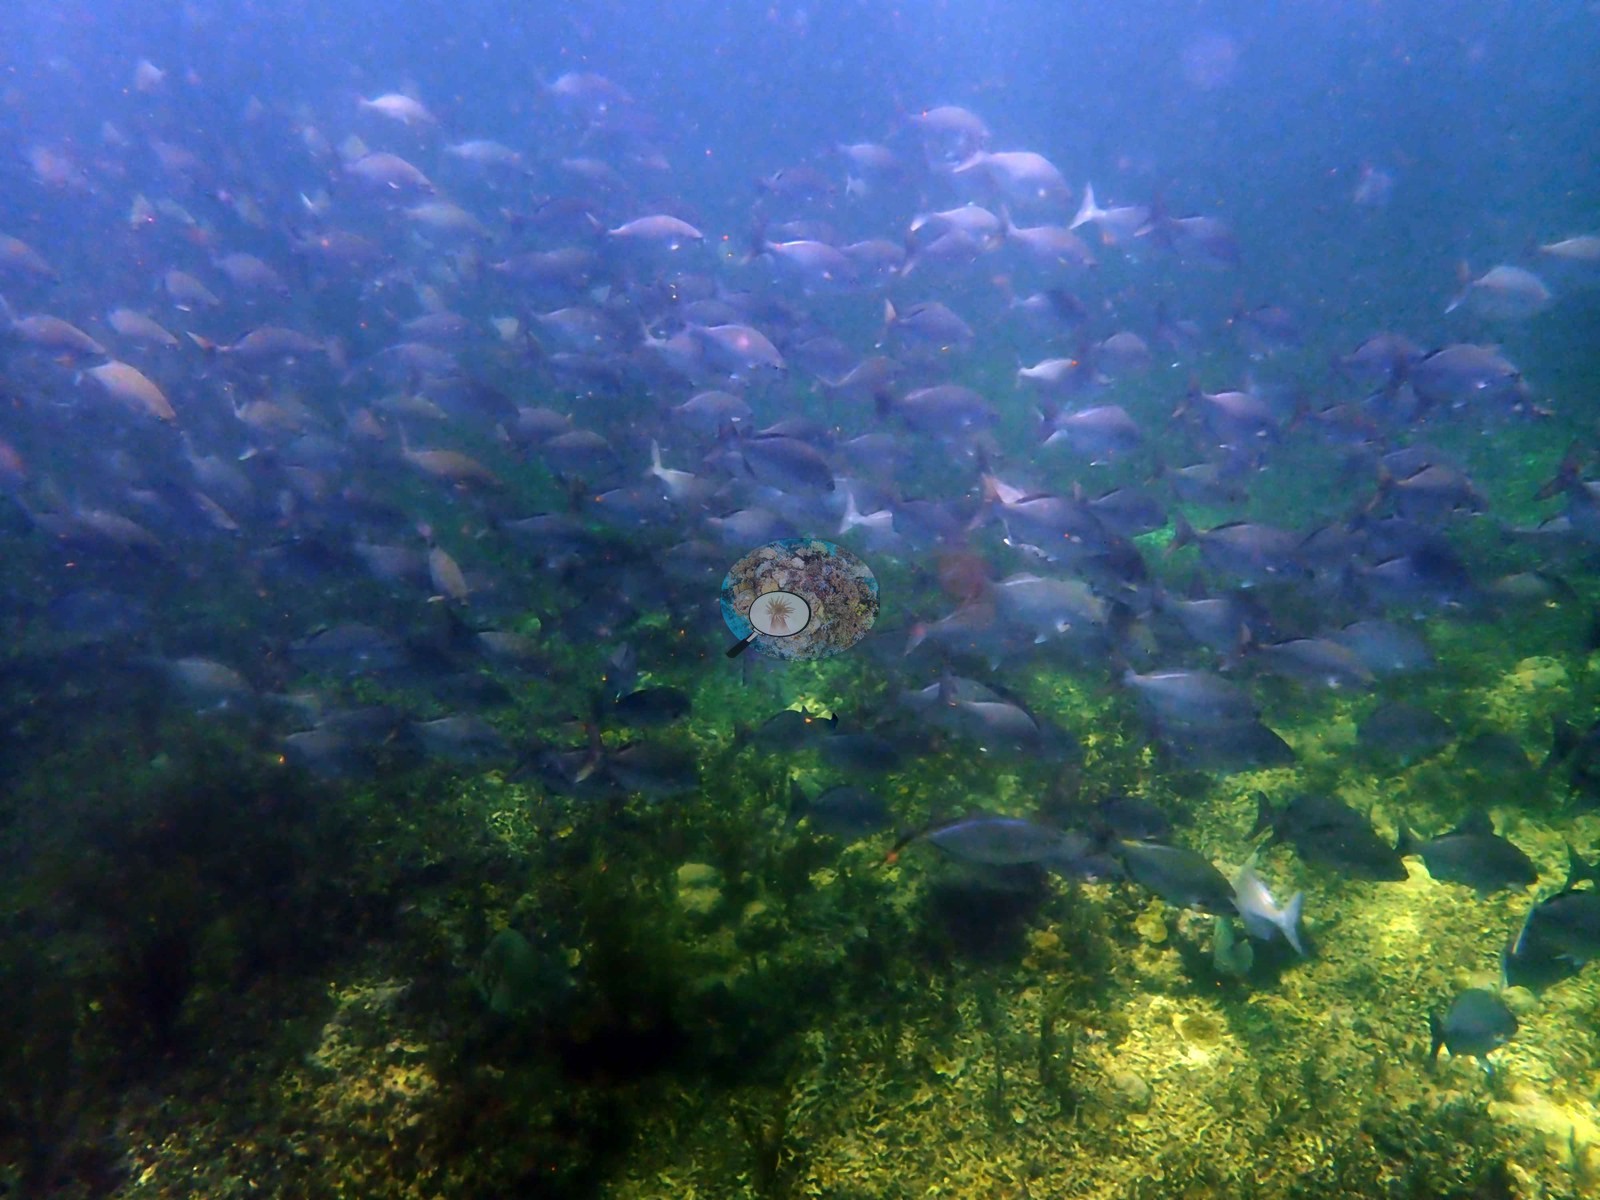
The fish life is the standout: clouds of small blue mid-water planktivores over the reef edge, a passing wall of blue-and-yellow schooling fish, and in two frames a dense, hundreds-strong school of silvery-purple fish hanging over a thick carpet of green macroalgae (e.g., Image 2, Image 4, Image 5).
Comparisons with other data
A shallow, silty patch reef off Mayreau in the Tobago Cays where a natural volcanic CO2 seep bubbles up through red-algae-covered rock, used as a natural ocean-acidification analog site with tagged coral colonies (Porites astreoides, Montastraea cavernosa, Orbicella faveolata) sampled along a vent-to-control gradient. Nearby "Mayreau Gardens" itself is described in the dive notes as a lusher patch with boulder star coral, orange elkhorn-like colonies, sea fans, and crinoids, hosting spiny lobster, and large schools of blue chromis and creole wrasse.
CV model comparison
More info
Many of these photos are fish and open-water shots, so the low value reflects photo selection more than the reef itself. No computer-vision method yet estimates coral cover accurately on new images, so treat this as indicative rather than a measurement; it is revised as the methods improve.More info
No diver transect exists for this trip, so treat the value as indicative: no computer-vision method yet estimates coral cover accurately on new images.| Method | Hard-coral cover (%) |
|---|---|
| Claude (edited photos) | 7.0 |
See a more detailed, stand-alone version of this table.
Independent surveys nearby
| Agency / program | Year(s) | Stations / distance | Link |
|---|---|---|---|
| AGRRA | 2015–2019 | 6 stations, 3.60–4.82 km | Records ↓ |
| Reef Check | 2005–2007 | 4 stations, 3.71–4.87 km | Records ↓ |
| XL Catlin Seaview Survey | 2013 | 6 stations, 1.70–4.98 km | Records ↓ |
 Coral Reef Diagnostics
Within 5 km, 16 independent survey stations recorded hard coral cover in 21 records between 2005 and 2019. Of the 5 stations surveyed in more than one year, 4 increased and 1 changed by less than 5 percentage points between their first and latest surveys. The longest record, Petit Rameau (AGRRA, 3.60 km away), went from 34% in 2015 to 44% in 2018. The most recent nearby survey is from 2019, so these values predate recent heat stress. This site's own estimate (7.0%) sits within the range of these surveys (2.7–44%); the methods differ, so the comparison is context, not a like-for-like test.
Collected by other programs using different methods (Reef Check uses point-intercept transects; AGRRA uses benthic point-intercept transects, reported here as live coral cover; the XL Catlin Seaview Survey uses photo-transects with automated image annotation), so these are context for the figures above, not a like-for-like comparison. Where a station was surveyed more than once the range is shown. Station names are not dive-site names.
Show all 16 independent survey records
| Agency | Site / location | Date | Hard coral cover (%) | Distance | Link |
|---|---|---|---|---|---|
| Reef Check | Petit Bateau | 2005–2007 | 14–19% (2 surveys) | 3.71 km | — |
| Reef Check | Horseshoe Reef Back Reef | 2005–2007 | 24–31% (2 surveys) | 4.64 km | — |
| Reef Check | Petit Tabac | 2005–2007 | 10–11% (2 surveys) | 4.85 km | — |
| Reef Check | Horseshoe (outside) | 2007 | 16% | 4.87 km | — |
| XL Catlin Seaview Survey | transect 22019 | 2013 | 11% | 1.70 km | doi:10.14264/uql.2019.930 |
| XL Catlin Seaview Survey | transect 22018 | 2013 | 6.1% | 1.72 km | doi:10.14264/uql.2019.930 |
| XL Catlin Seaview Survey | transect 22017 | 2013 | 8.5% | 1.80 km | doi:10.14264/uql.2019.930 |
| XL Catlin Seaview Survey | transect 22016 | 2013 | 7.5% | 3.34 km | doi:10.14264/uql.2019.930 |
| XL Catlin Seaview Survey | transect 22014 | 2013 | 5.4% | 3.79 km | doi:10.14264/uql.2019.930 |
| XL Catlin Seaview Survey | transect 22012 | 2013 | 2.7% | 4.98 km | doi:10.14264/uql.2019.930 |
| AGRRA | Petit Rameau | 2015–2018 | 34–44% (2 surveys) | 3.60 km | — |
| AGRRA | Horseshoe REEF-SE | 2015–2018 | 5.6–11% (2 surveys) | 4.61 km | — |
| AGRRA | Horseshoe Reef MPA Site | 2015 | 12% | 4.80 km | — |
| AGRRA | Horseshoe Reef MPA site | 2018 | 12% | 4.80 km | — |
| AGRRA | TaiChi Reef | 2019 | 13% | 4.17 km | — |
| AGRRA | Horse Shoe Reef | 2019 | 11% | 4.82 km | — |
Data & links
All images from Coral Reef Diagnostics. Data are from Coral Reef Diagnostics and the organizations named in the data sources above.
© Coral Reef Diagnostics.