

SVG - Mayreau Shipwreck

Part of the regional summary: Saint Vincent and the Grenadines
More info
Windward Caribbean Islands (NOAA CRW virtual station) · Eastern Caribbean ecoregion mean: 13.1 degree heating weeksThis wreck off Mayreau, tentatively identified as the 1918 Puruni though unconfirmed, carries sparse coral colonization - small encrusting Siderastrea and Porites astreoides patches and a few brain corals - but a remarkable density of Caribbean spiny lobster packed into nearly every crevice, including a mother-and-young pair. No bleaching or disease seen; a blind computer-vision count of 28 photos puts coral cover at about 4.9% (median 0%); on a wreck, low coral cover is expected.
Eighteen independent survey stations shown with the program’s logo — click one to see how far it is from this site.
Four other CRD dive sites within 5 km shown in orange — click a marker to open its page.
Site description
Setting
The wreck sits just off Mayreau in the Tobago Cays/Grenadines, a short boat ride from the Mayreau Gardens patch reef and the volcanic CO2 seep Anderson's team had spent the week sampling for the Enochs et al. 2020 acidification study -- this final-day dive, 1 Oct at dusk (17:29-17:53, ~11 m), was the trip's one deliberately recreational stop.
General benthic features
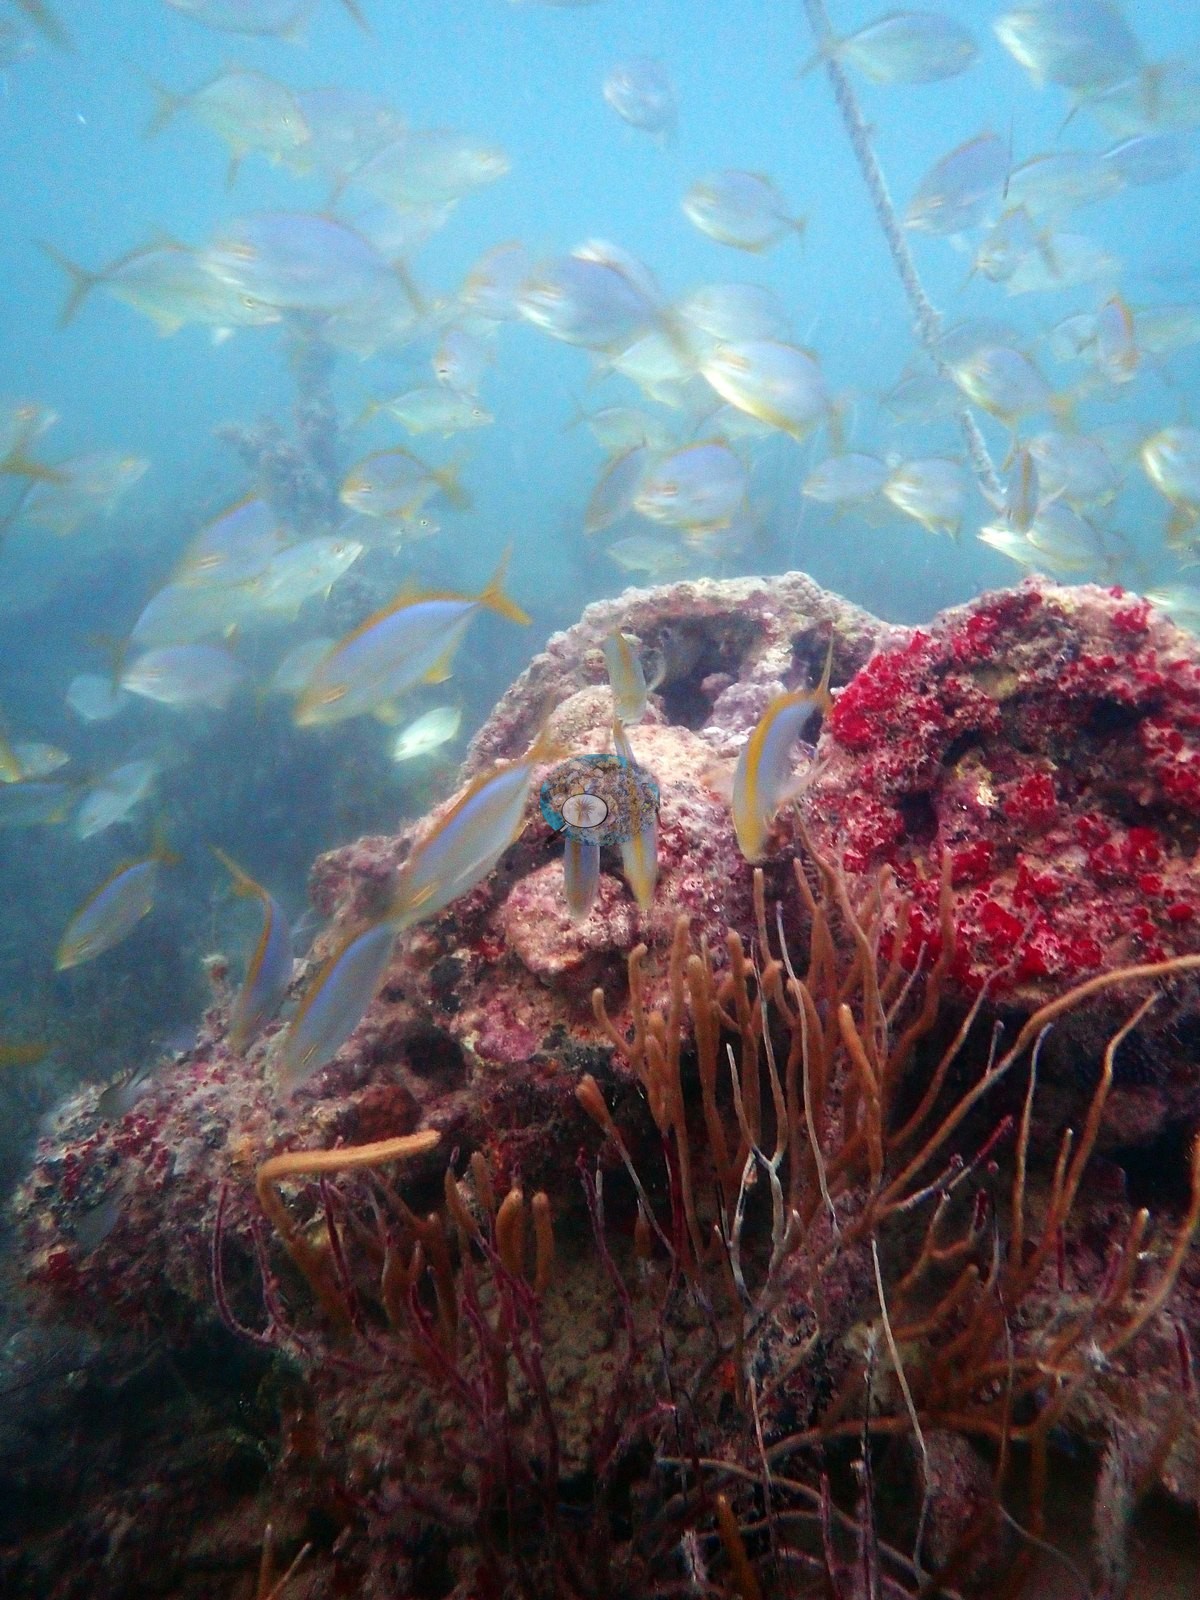
The photos show unmistakable wreck architecture: straight metal girders and hull plating draped in encrusting red sponge and coralline algae, a mooring line, dark swim-through cavities used as dens, and a curved, growth-crusted hull section breaking the water-column silhouette against the afternoon sun (e.g., Image 1).
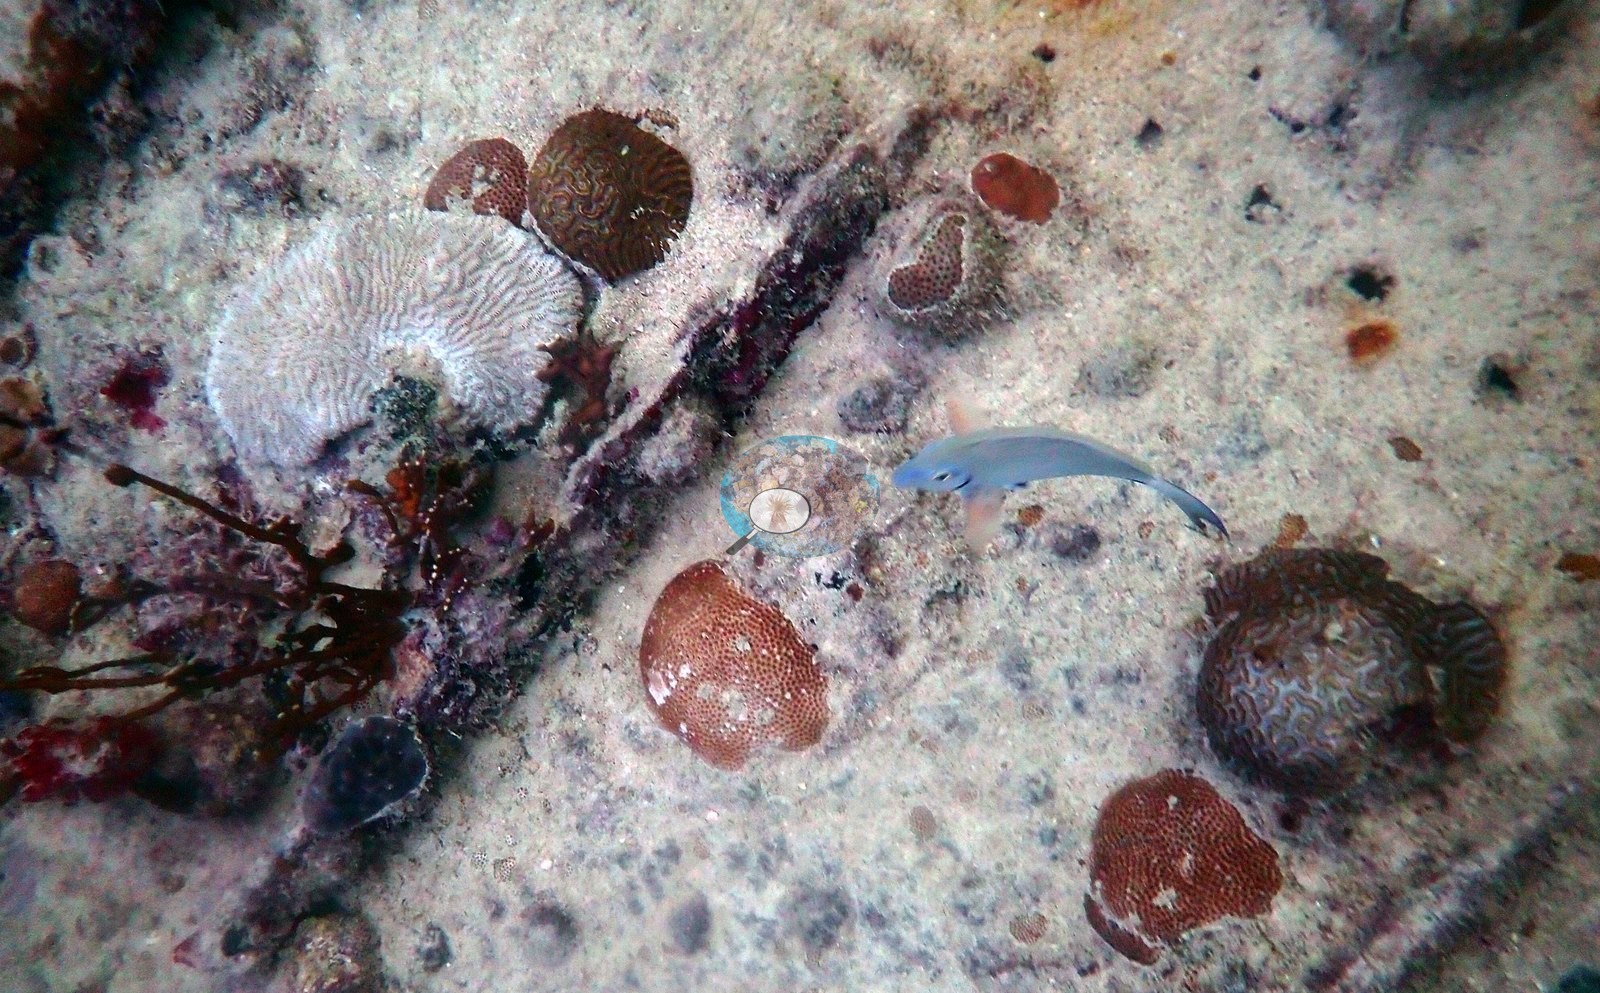
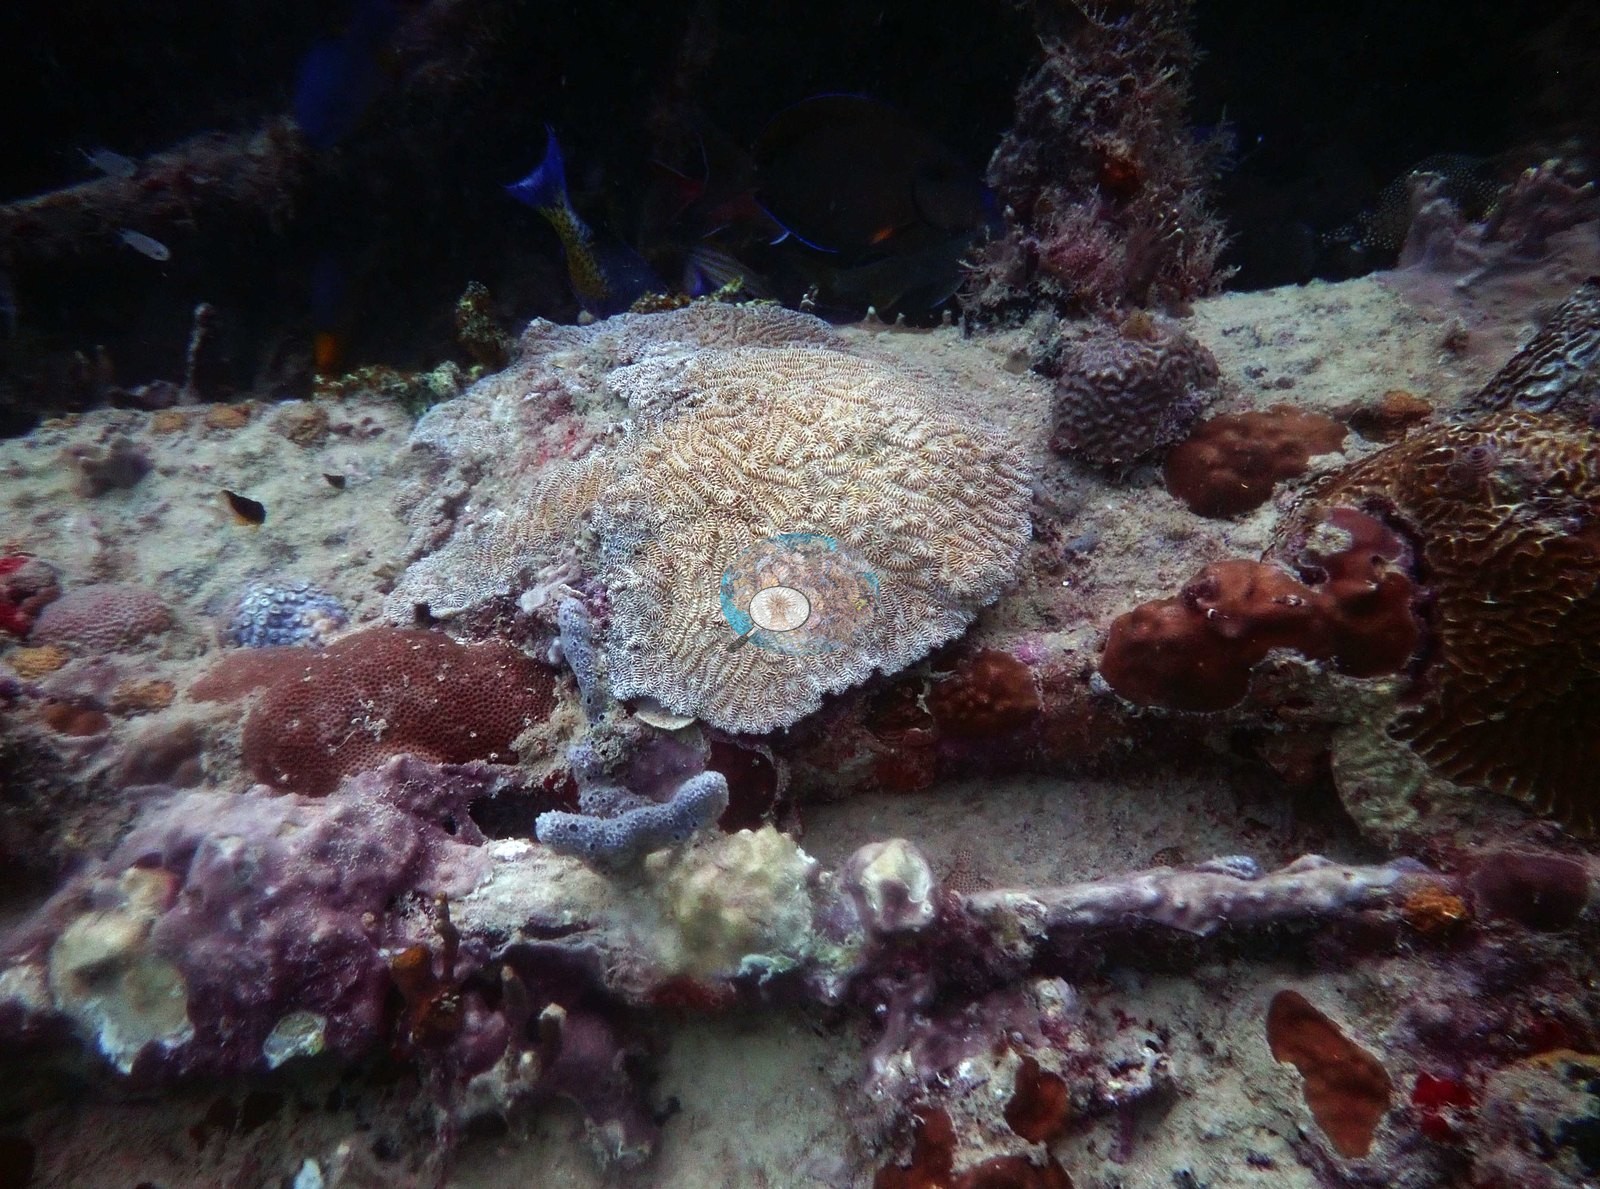
Colonization is present but sparse -- small encrusting Siderastrea and Porites astreoides patches, a few brain coral-like colonies (cf. Pseudodiploria), sea fans and whip gorgonians rising off the structure, generally pale-toned but not obviously bleached or diseased (e.g., Image 2, Image 5).
Coral cover
- Reference: Claude CV point count (this site's photos)
- Coral cover: 4.9% — a blind Claude computer-vision point count of 28 of Anderson's edited photographs (20 points per photo; water, fish, and obstructions excluded). The median is 0%; on a wreck, low coral cover is expected. 18 of the 28 photos show no coral at all (hull, sand, water); the value comes from colonies on the hull.
Stressors
No bleaching, disease, or corallivores observed.
Fish and other fauna
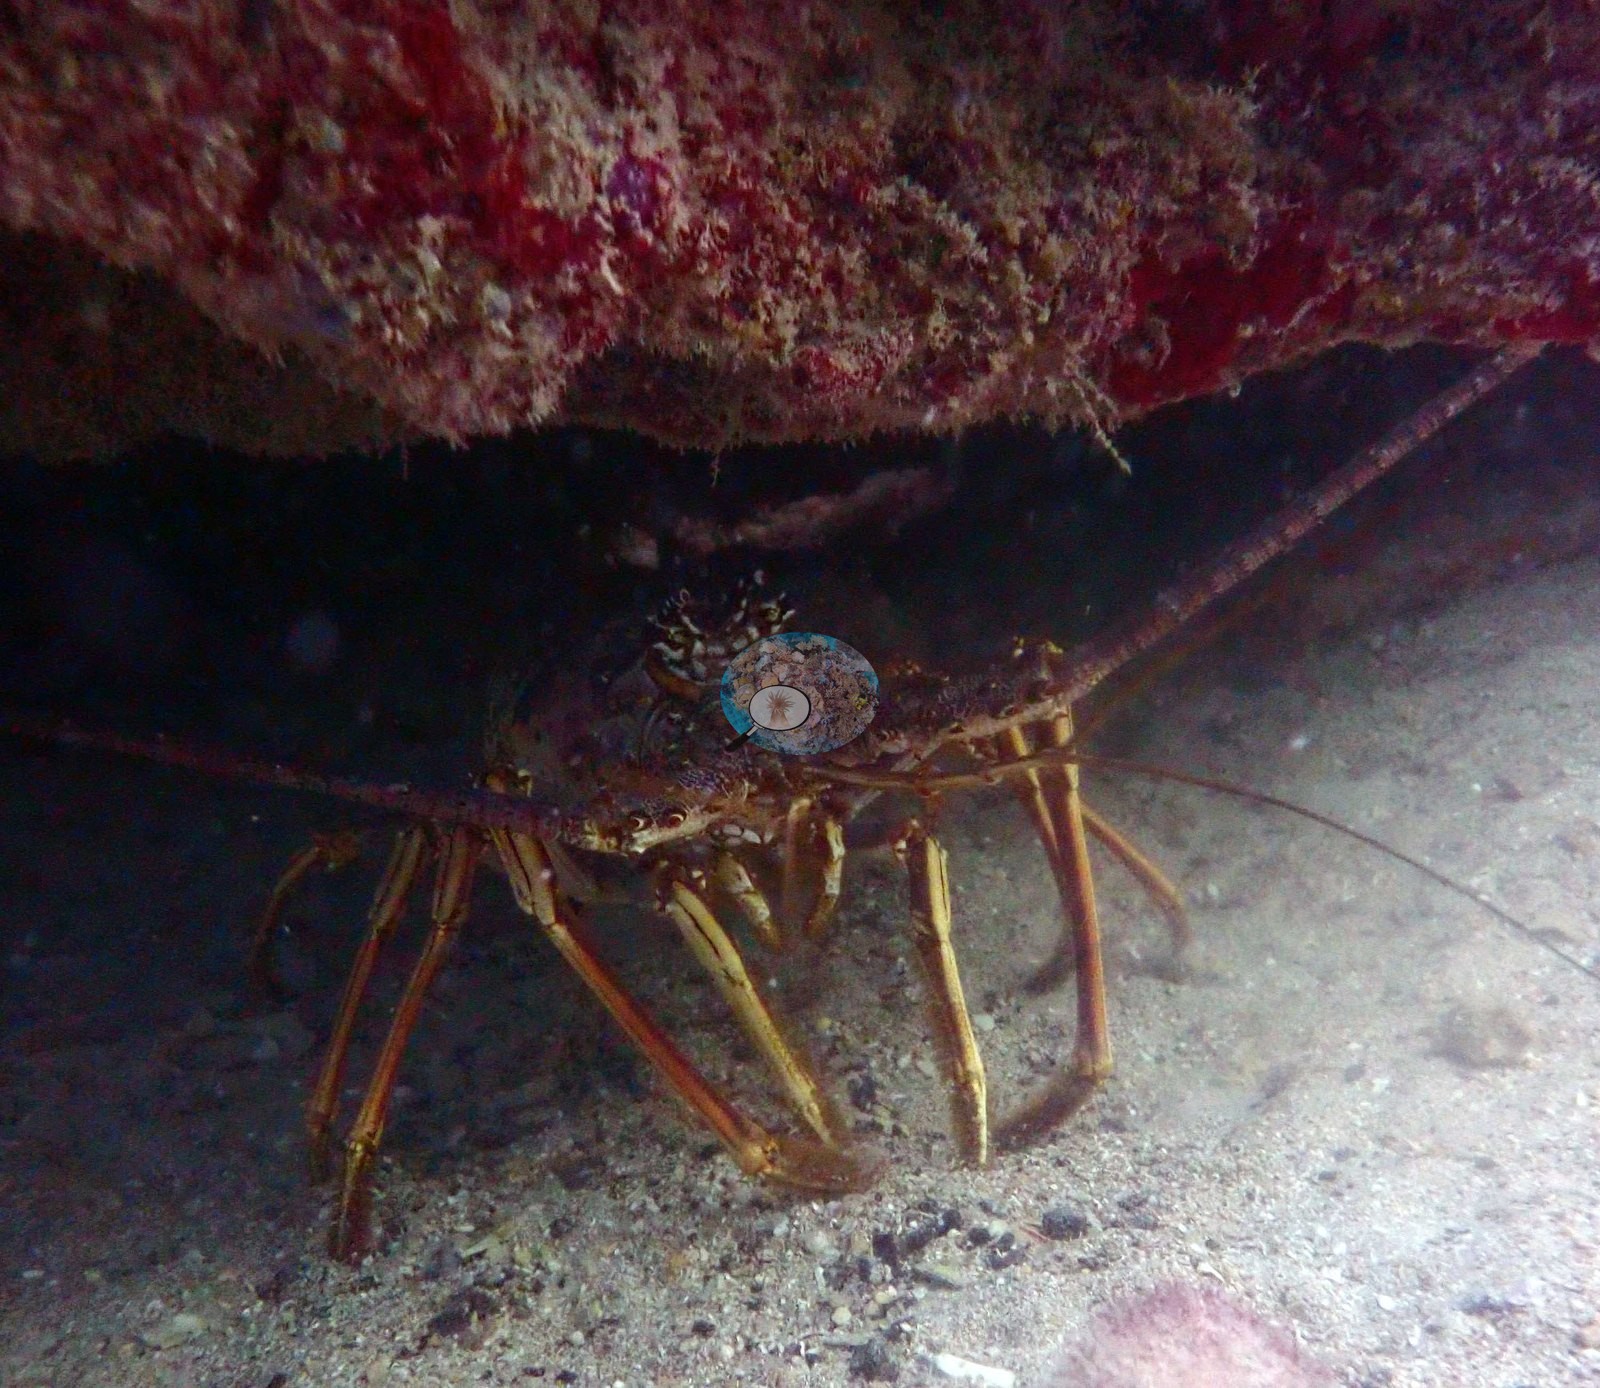
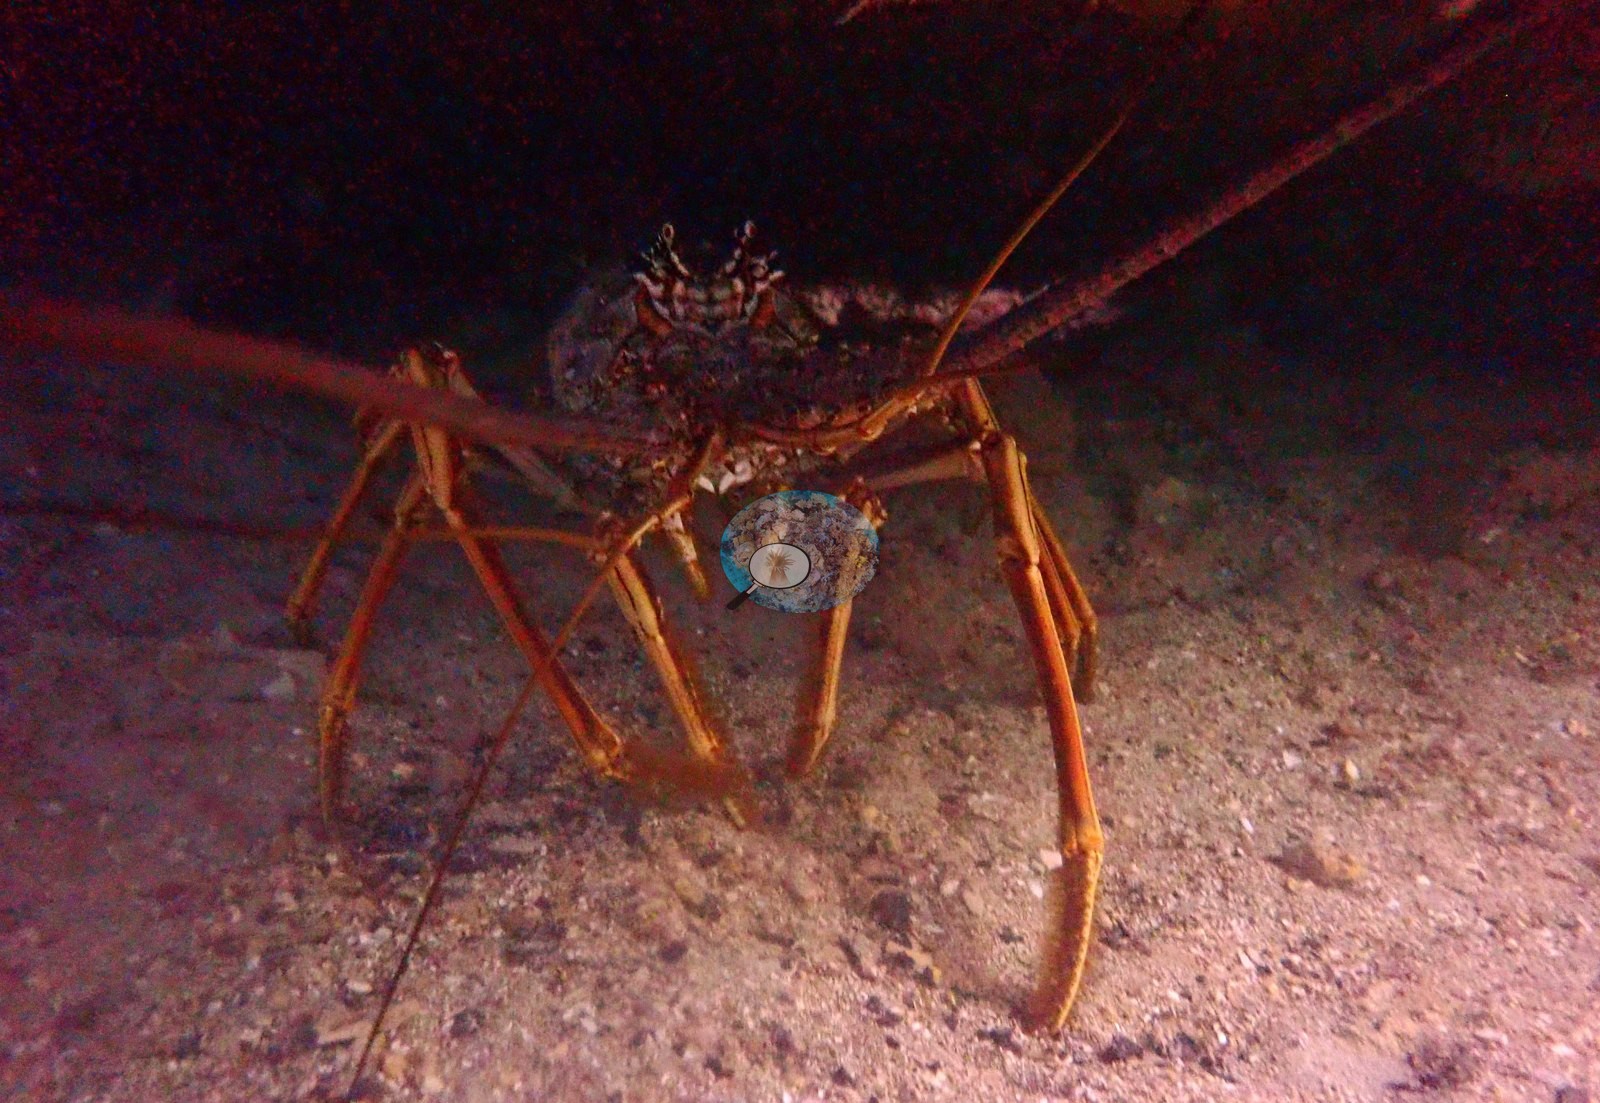
The standout subject, by far, is Caribbean spiny lobster (Panulirus argus): a remarkable density of them, including a mother-and-young pair, tucked into nearly every crevice and porthole (e.g., Image 3, Image 4).
Small reef fish round things out -- sergeant majors, grunts, a school of blue chromis or creole wrasse streaming through one dark opening.
Comparisons with other data
The 2005-2007 Reef Check numbers from Petit Bateau (13.8% in 2005 and 18.8% in 2007 - the 22 and 30 in the source are hard coral POINT COUNTS out of 160 substrate points, not percentages), 3.2 km away, are the closest regional coral-cover context available, but say nothing about the wreck itself, which has never been surveyed.
Other notes
Tentatively identified as the Puruni, a 1918 wreck reported at ~40 ft off Mayreau near Mayreau Gardens -- the depth and location line up closely, but no nameplate or hull marking is visible in any frame, so treat the identity as likely, not confirmed.
CV model comparison
More info
On a wreck, low coral cover is expected: 18 of the 28 photos show no coral (hull, sand, water), and the value comes from colonies on the hull. No computer-vision method yet estimates coral cover accurately on new images, so treat this as indicative rather than a measurement; it is revised as the methods improve.More info
No diver transect exists for this trip, so treat the value as indicative: no computer-vision method yet estimates coral cover accurately on new images.| Method | Hard-coral cover (%) |
|---|---|
| Claude (edited photos) | 4.9 |
See a more detailed, stand-alone version of this table.
Independent surveys nearby
| Agency / program | Year(s) | Stations / distance | Link |
|---|---|---|---|
| AGRRA | 2015–2019 | 6 stations, 3.13–4.34 km | Records ↓ |
| Literature: Deschamps et al. 2003 | 1999 | 2 stations, 4.76 km | Records ↓ |
| Reef Check | 2005–2007 | 4 stations, 3.22–4.39 km | Records ↓ |
| XL Catlin Seaview Survey | 2013 | 6 stations, 1.25–4.65 km | Records ↓ |
 Coral Reef DiagnosticsYear-average (no detectable trend)
Within 5 km, 18 independent survey stations recorded hard coral cover in 23 records between 1999 and 2019. Of the 5 stations surveyed in more than one year, 4 increased and 1 changed by less than 5 percentage points between their first and latest surveys. The longest record, Petit Rameau (AGRRA, 3.13 km away), went from 34% in 2015 to 44% in 2018. The most recent nearby survey is from 2019, so these values predate recent heat stress. This site's own estimate (4.9%) sits within the range of these surveys (1.2–44%); the methods differ, so the comparison is context, not a like-for-like test.
Collected by other programs using different methods (Reef Check uses point-intercept transects; AGRRA uses benthic point-intercept transects, reported here as live coral cover; the XL Catlin Seaview Survey uses photo-transects with automated image annotation), so these are context for the figures above, not a like-for-like comparison. Where a station was surveyed more than once the range is shown. Station names are not dive-site names.
Show all 18 independent survey records
| Agency | Site / location | Date | Hard coral cover (%) | Distance | Link |
|---|---|---|---|---|---|
| Literature: Deschamps et al. 2003 | Horseshoe Reef fore reef, Tobago Cays Marine Park [3-4 m] | 1999 | 30% | 4.76 km | — |
| Literature: Deschamps et al. 2003 | Horseshoe Reef fore reef, Tobago Cays Marine Park [9-11 m] | 1999 | 40% | 4.76 km | — |
| Reef Check | Petit Bateau | 2005–2007 | 14–19% (2 surveys) | 3.22 km | — |
| Reef Check | Horseshoe Reef Back Reef | 2005–2007 | 24–31% (2 surveys) | 4.16 km | — |
| Reef Check | Petit Tabac | 2005–2007 | 10–11% (2 surveys) | 4.36 km | — |
| Reef Check | Horseshoe (outside) | 2007 | 16% | 4.39 km | — |
| XL Catlin Seaview Survey | transect 22019 | 2013 | 11% | 1.25 km | doi:10.14264/uql.2019.930 |
| XL Catlin Seaview Survey | transect 22018 | 2013 | 6.1% | 1.26 km | doi:10.14264/uql.2019.930 |
| XL Catlin Seaview Survey | transect 22017 | 2013 | 8.5% | 1.34 km | doi:10.14264/uql.2019.930 |
| XL Catlin Seaview Survey | transect 22016 | 2013 | 7.5% | 2.92 km | doi:10.14264/uql.2019.930 |
| XL Catlin Seaview Survey | transect 22014 | 2013 | 5.4% | 3.36 km | doi:10.14264/uql.2019.930 |
| XL Catlin Seaview Survey | transect 22015 | 2013 | 1.2% | 4.65 km | doi:10.14264/uql.2019.930 |
| AGRRA | Petit Rameau | 2015–2018 | 34–44% (2 surveys) | 3.13 km | — |
| AGRRA | Horseshoe REEF-SE | 2015–2018 | 5.6–11% (2 surveys) | 4.12 km | — |
| AGRRA | Horseshoe Reef MPA Site | 2015 | 12% | 4.32 km | — |
| AGRRA | Horseshoe Reef MPA site | 2018 | 12% | 4.32 km | — |
| AGRRA | TaiChi Reef | 2019 | 13% | 3.73 km | — |
| AGRRA | Horse Shoe Reef | 2019 | 11% | 4.34 km | — |
Data & links
All images from Coral Reef Diagnostics. Data are from Coral Reef Diagnostics and the organizations named in the data sources above.
© Coral Reef Diagnostics.
References
- Deschamps A, Desrochers A, Klomp KD (2003). St. Vincent. A Rapid Assessment of the Horseshoe Reef, Tobago Cays Marine Park, St. Vincent, West Indies (Stony Corals, Algae and Fishes). Atoll Research Bulletin 496:438-459. DOI
- Enochs IC, Formel N, Manzello D, Morris J, Mayfield AB, Boyd A, et al. (2020). Coral persistence despite extreme periodic pH fluctuations at a volcanically acidified Caribbean reef. Coral Reefs 39:523-528. DOI
- Gonzalez-Rivero M, et al. (2019). Seaview Survey photo-quadrat and image classification dataset. The University of Queensland (UQ eSpace) data collection. DOI