

SVG - Mayreau Gardens (CO2 vent site)

Part of the regional summary: Saint Vincent and the Grenadines
2019-09-27
2019-09-28
2019-09-29
2019-09-30
2019-10-01
More info
Windward Caribbean Islands (NOAA CRW virtual station) · Eastern Caribbean ecoregion mean: 13.1 degree heating weeksA naturally acidified reef off Mayreau in the Grenadines, where volcanic CO2 seeps cause extreme pH swings; it was studied in Enochs et al. 2020 and dived 16 times in 2019. The surrounding reef is dominated by sponges and gorgonians on silty pavement, with stony corals reduced to small scattered heads and thick green algal turf in often murky water. A blind computer-vision point count of 66 photos puts coral cover around 23% (median 18%).
Twenty independent survey stations shown with the program’s logo — click one to see how far it is from this site.
Four other CRD dive sites within 5 km shown in orange — click a marker to open its page.
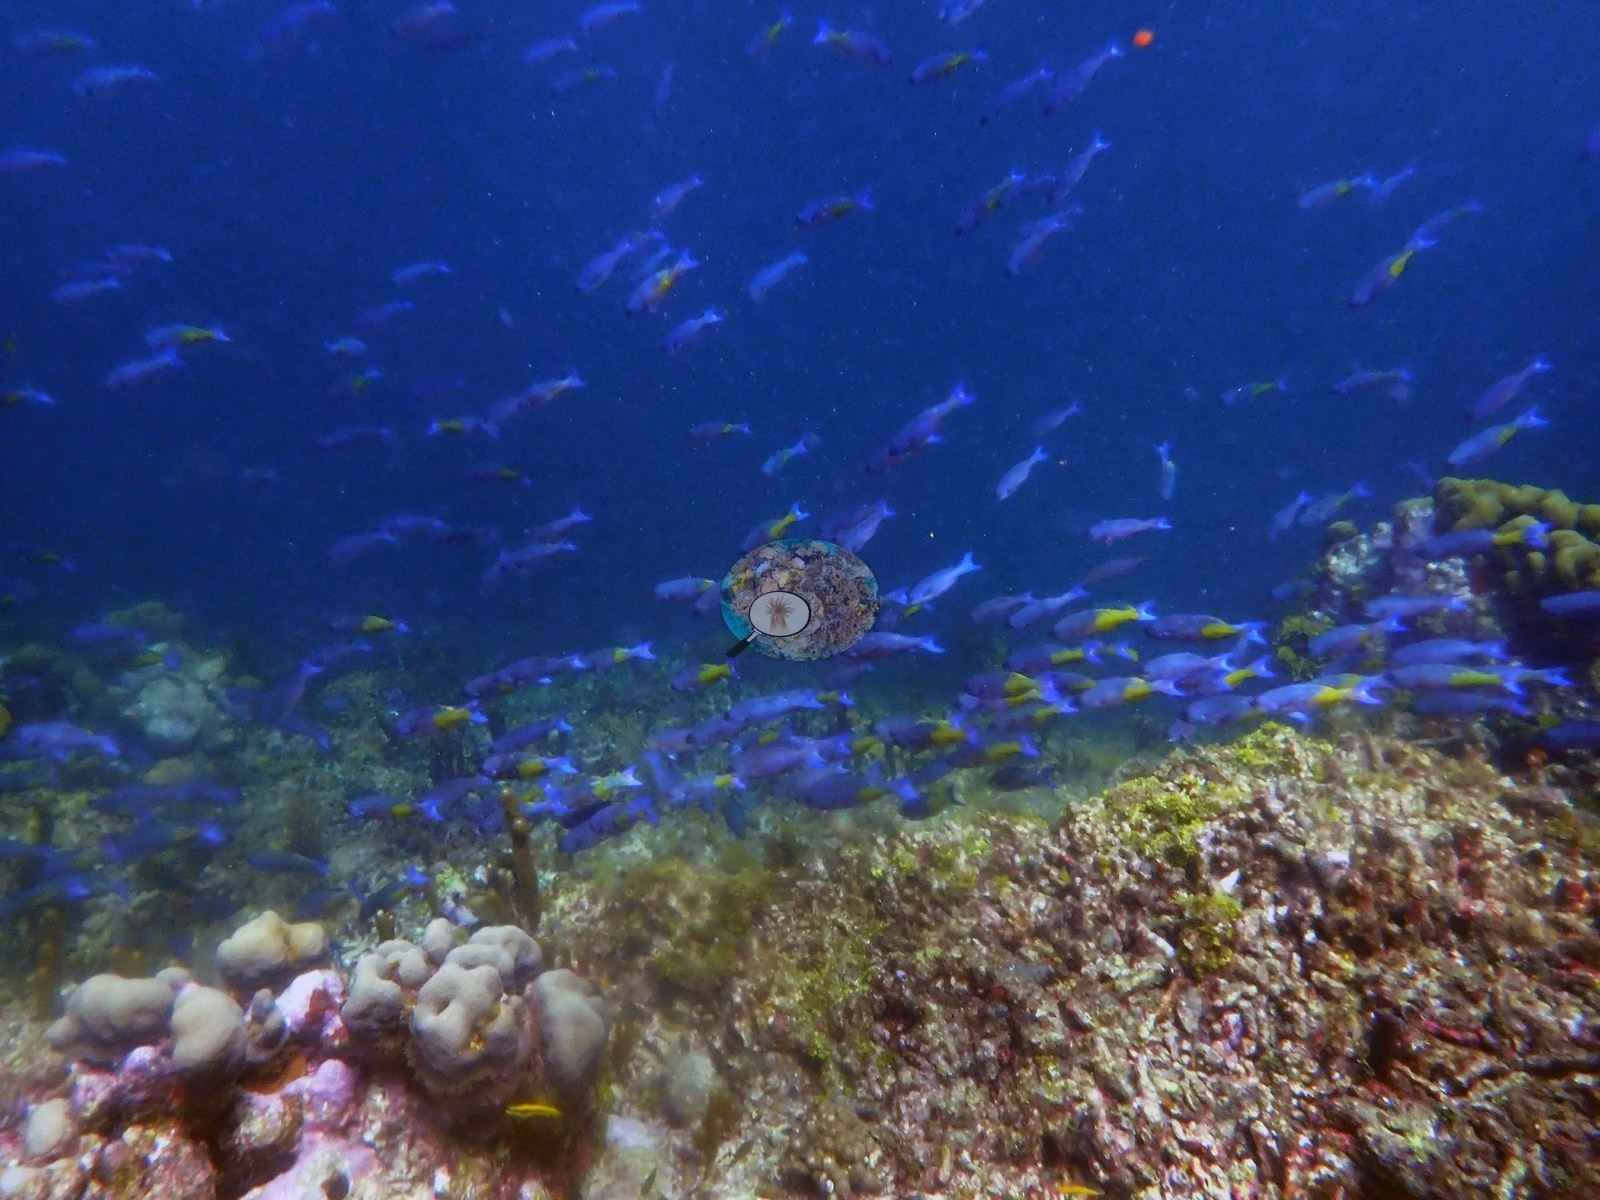
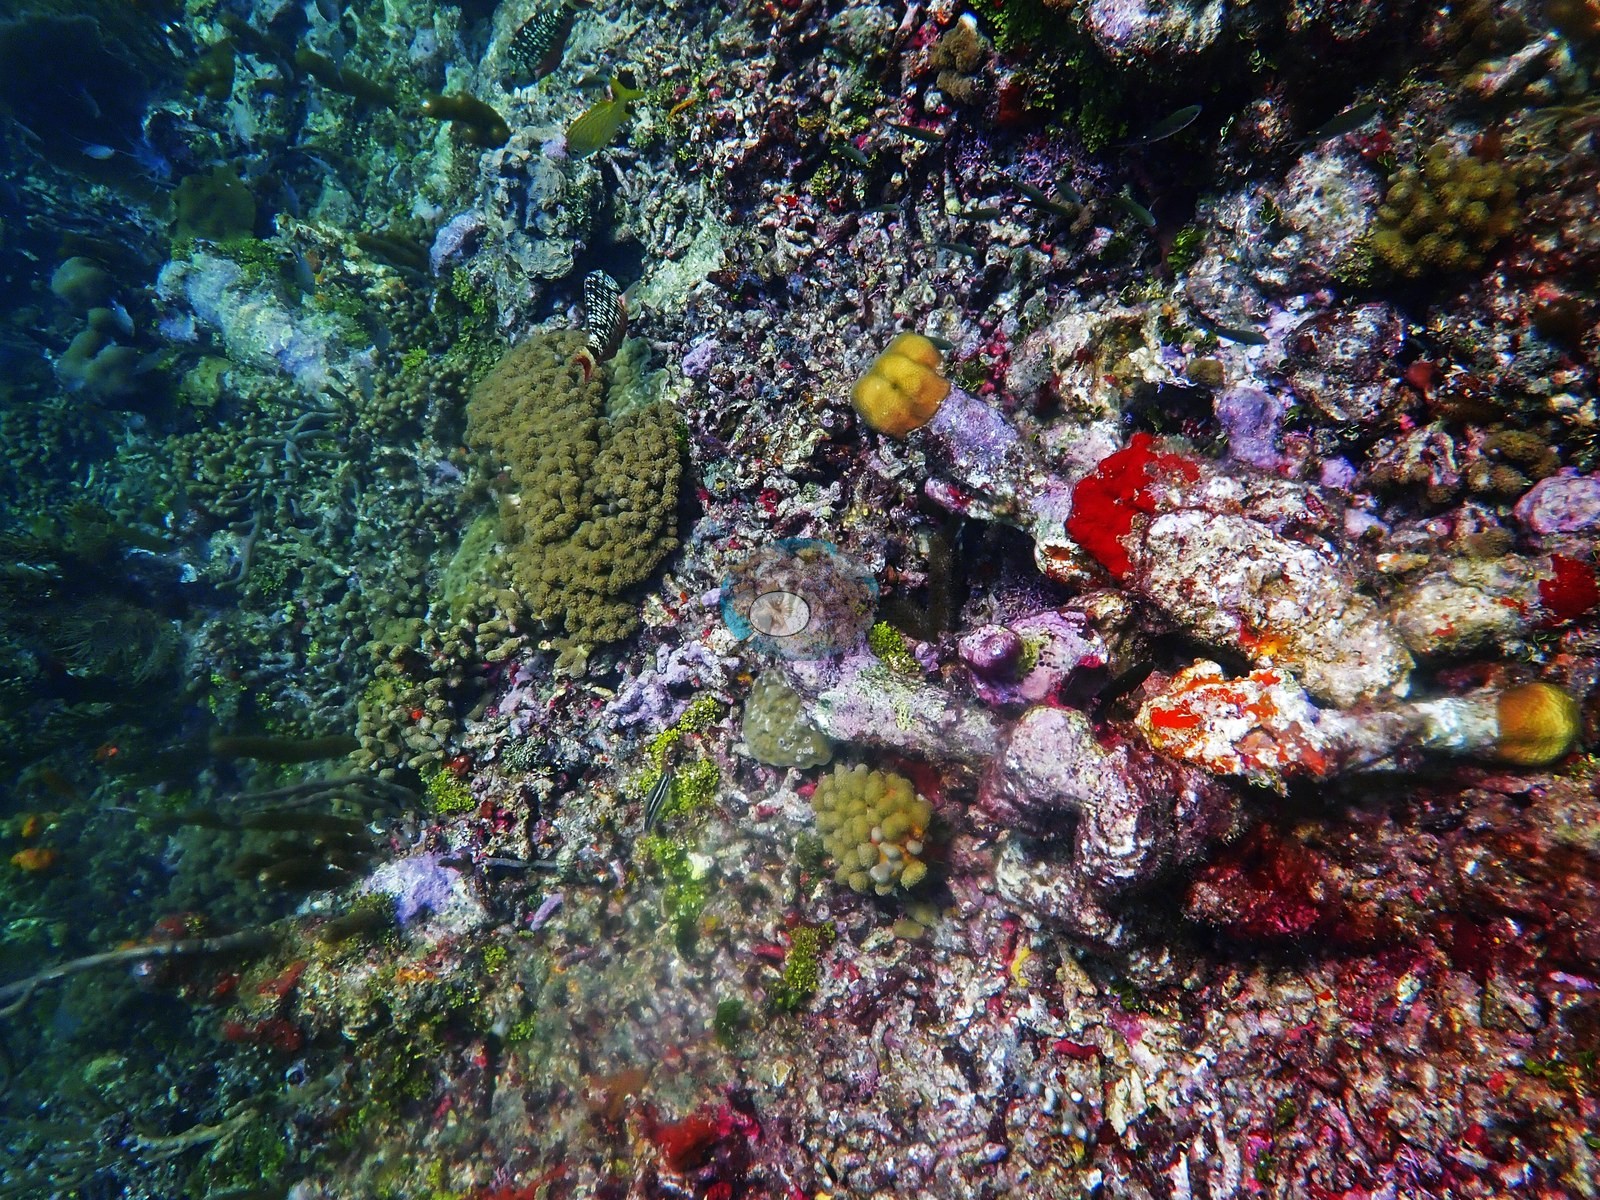
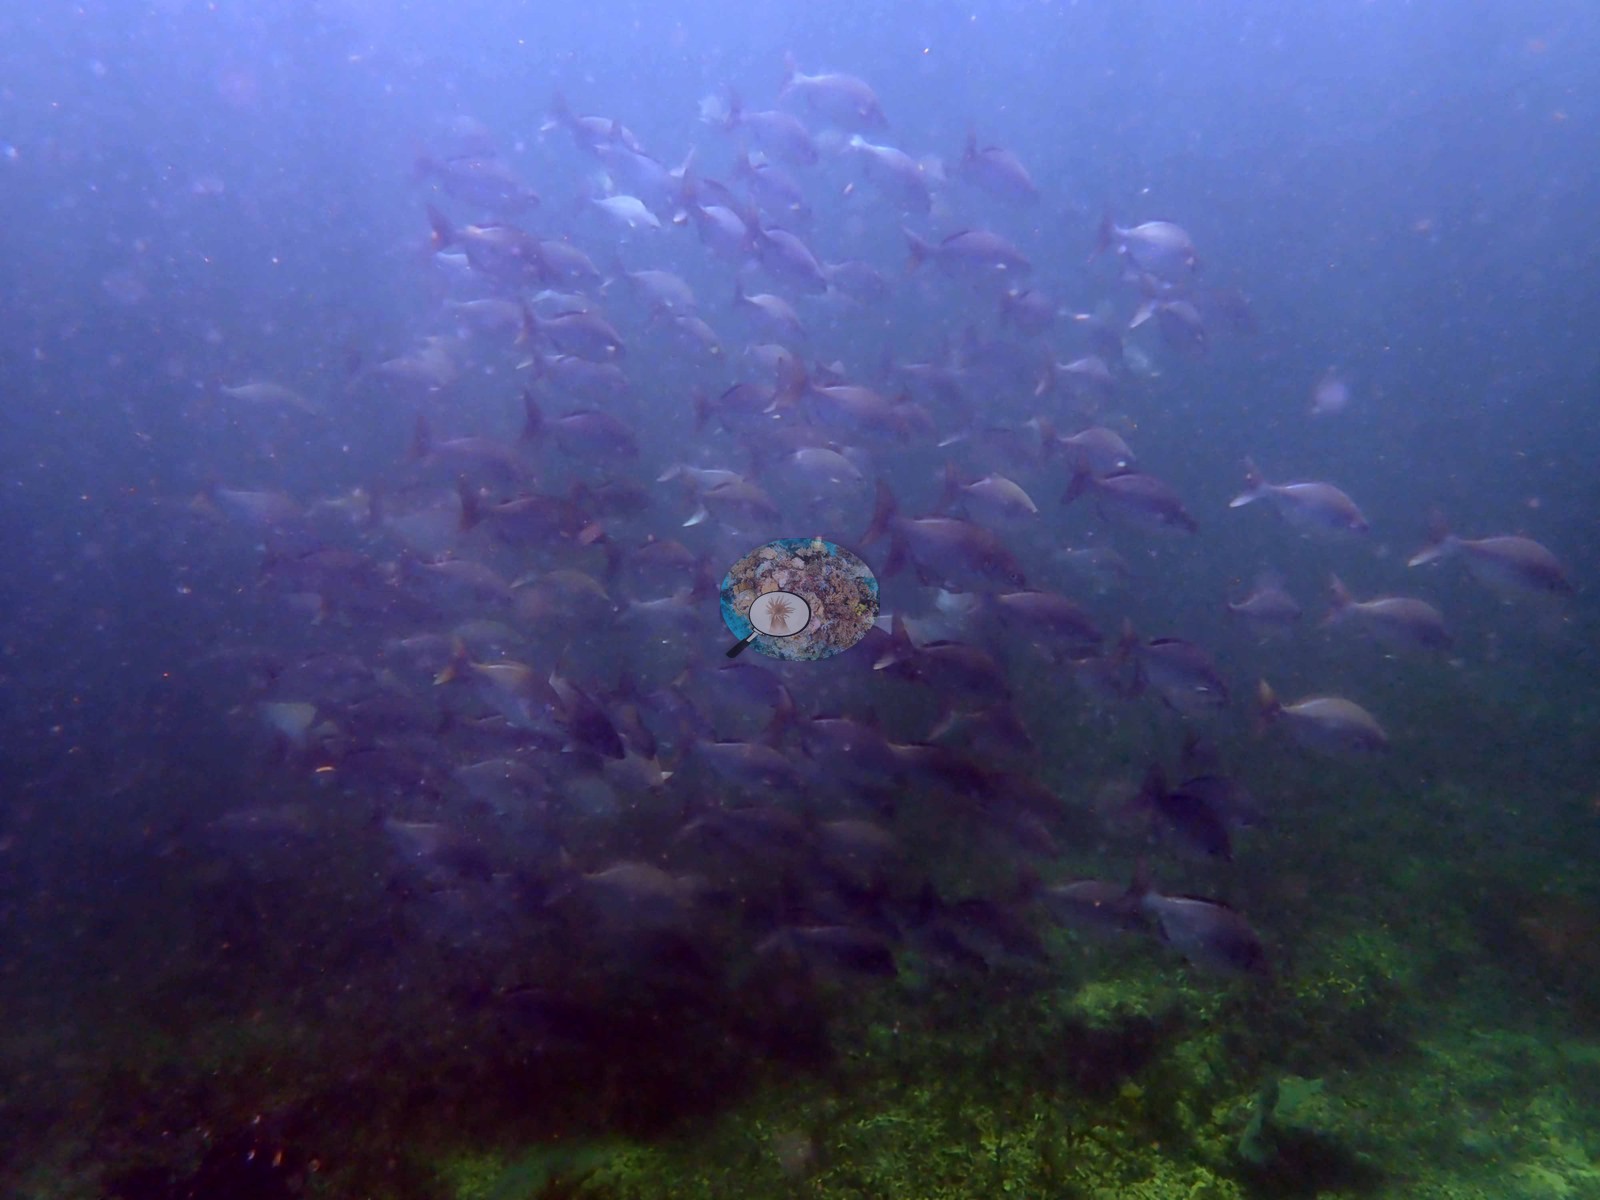
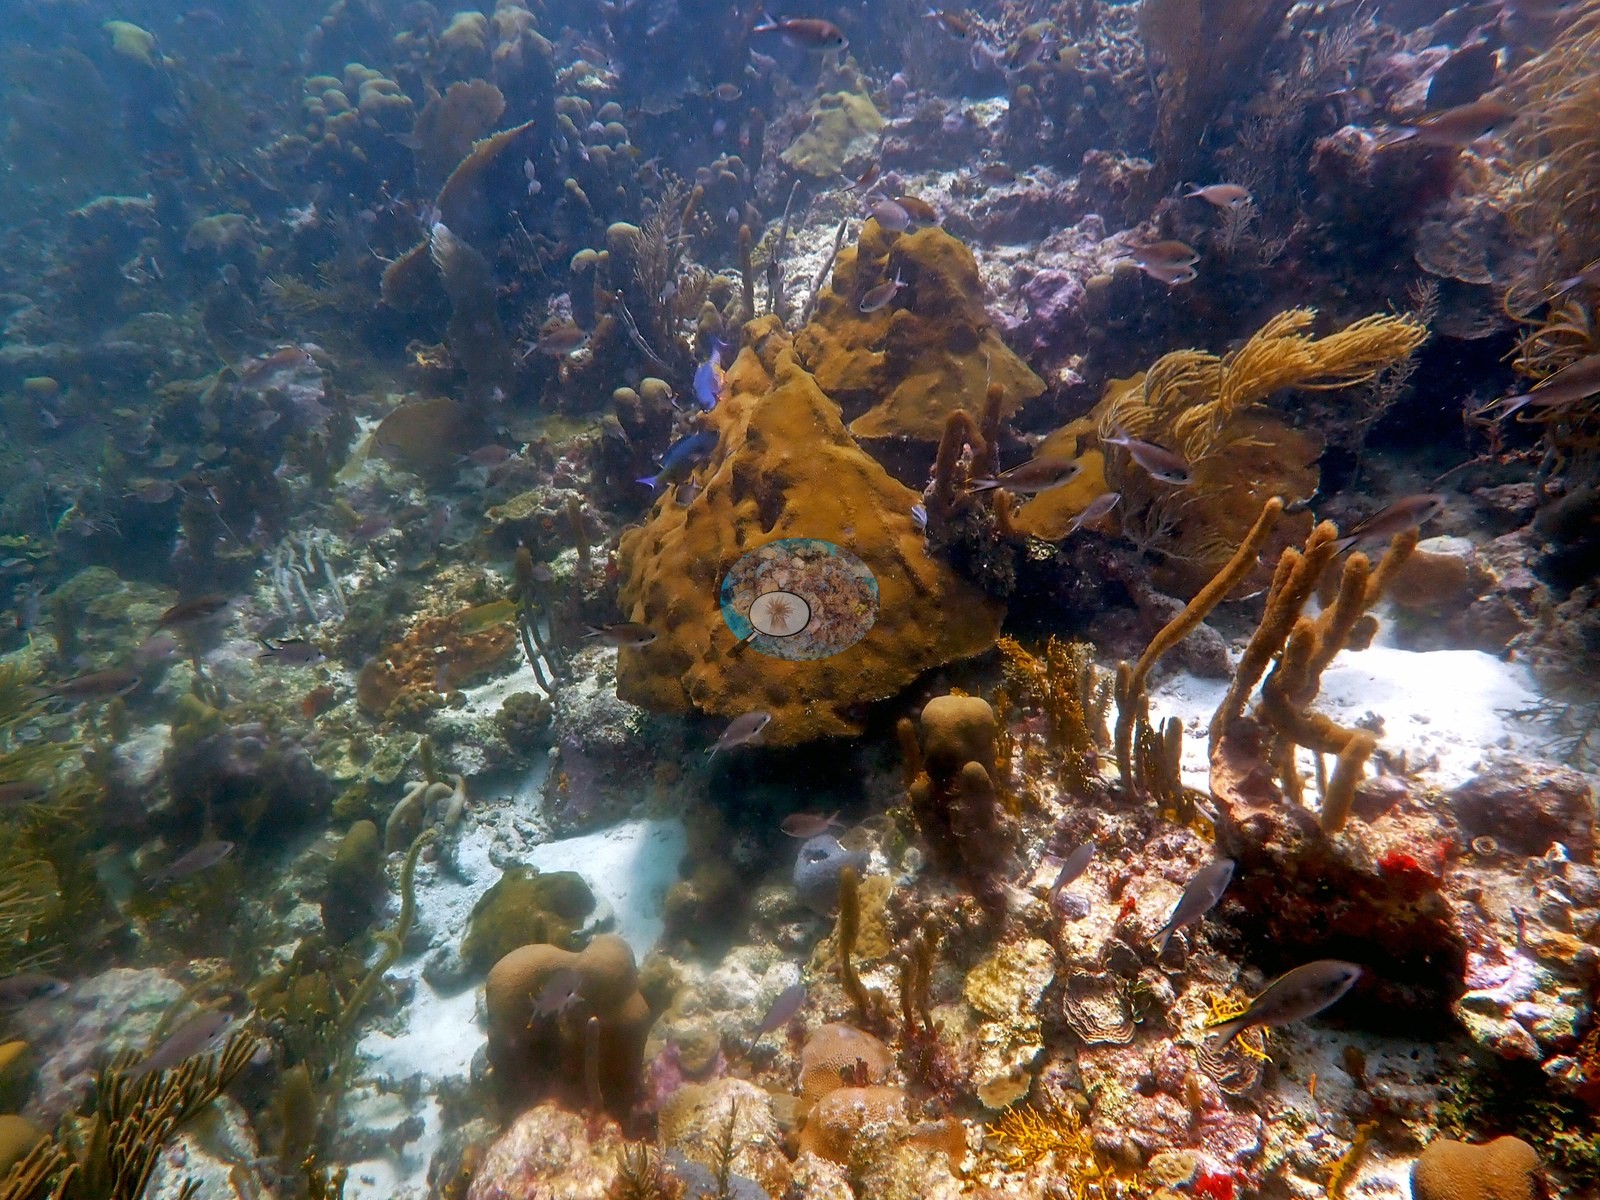
Site description
Setting
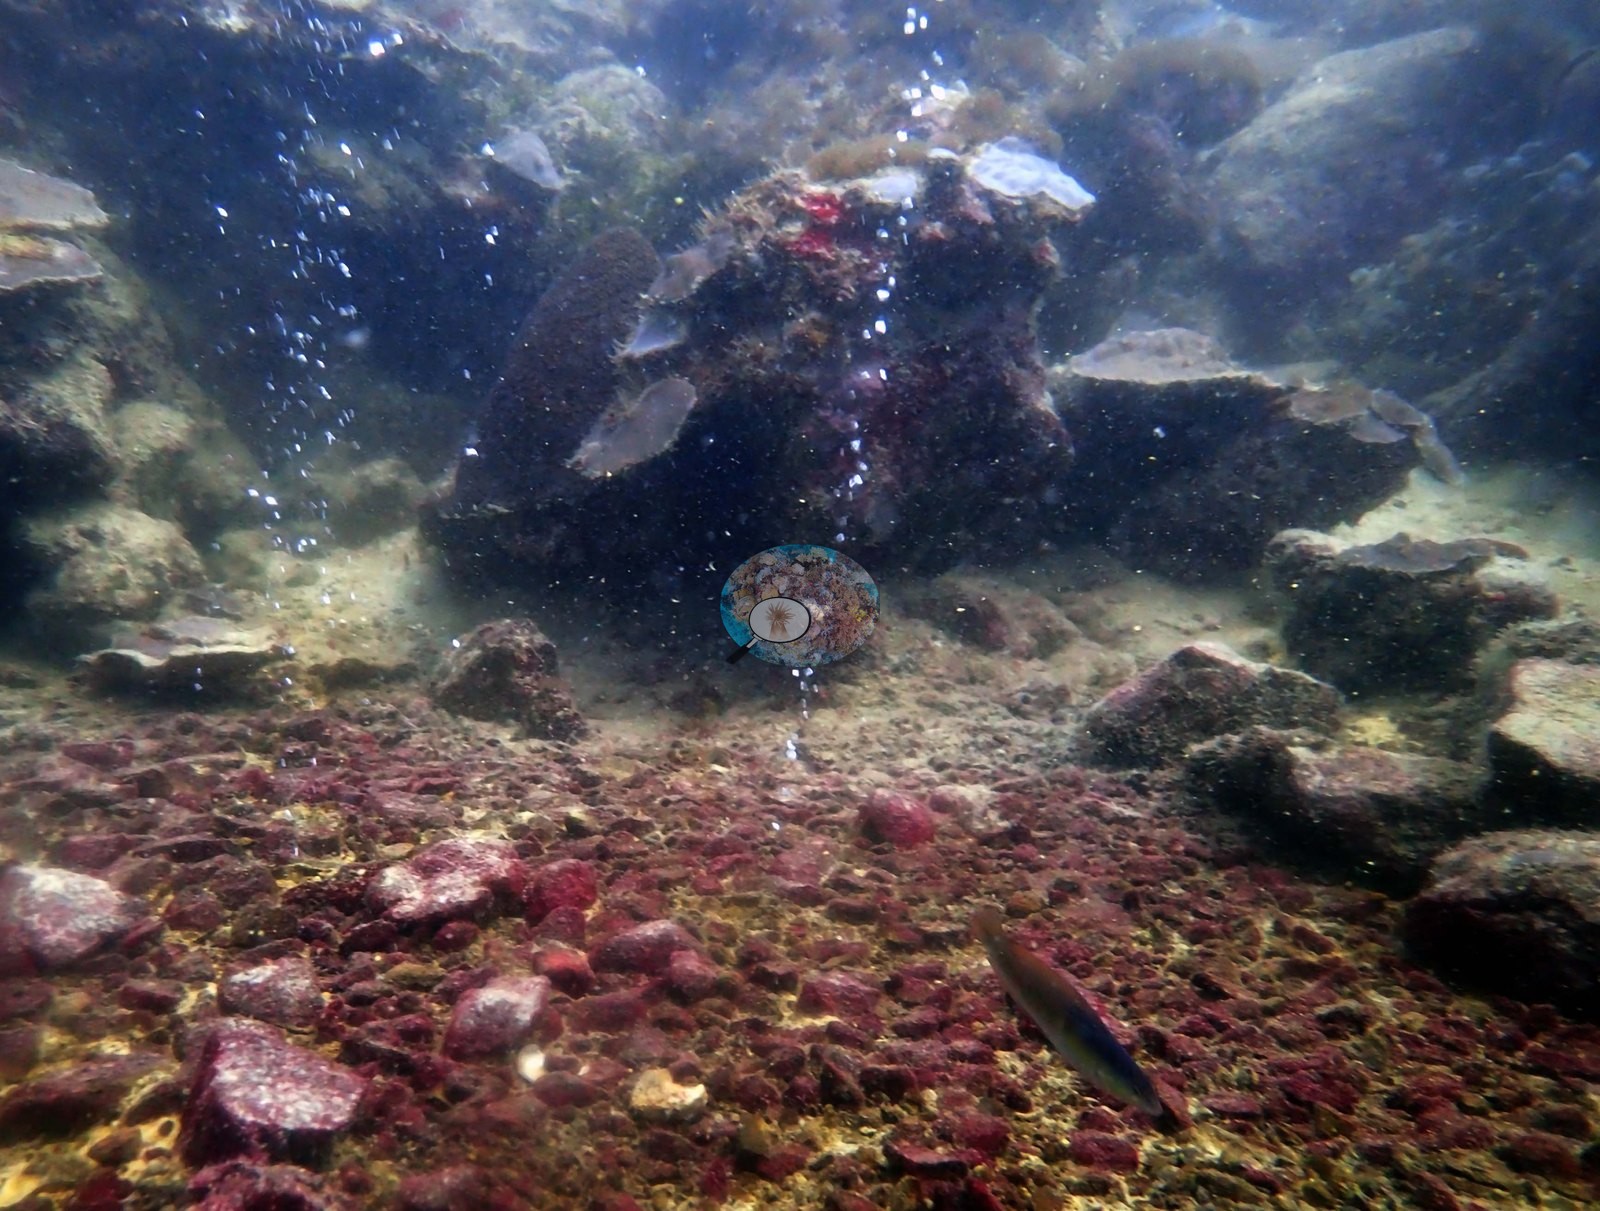
F1, the frame Anderson labels 'CO2 seep', shows the seep itself: two distinct strings of gas bubbles rising off a dark, undercut rocky outcrop, one from the shaded left flank and one from the middle of the mound, with small fish holding station in the plume. Visibility is poor and the water is green.
General benthic features
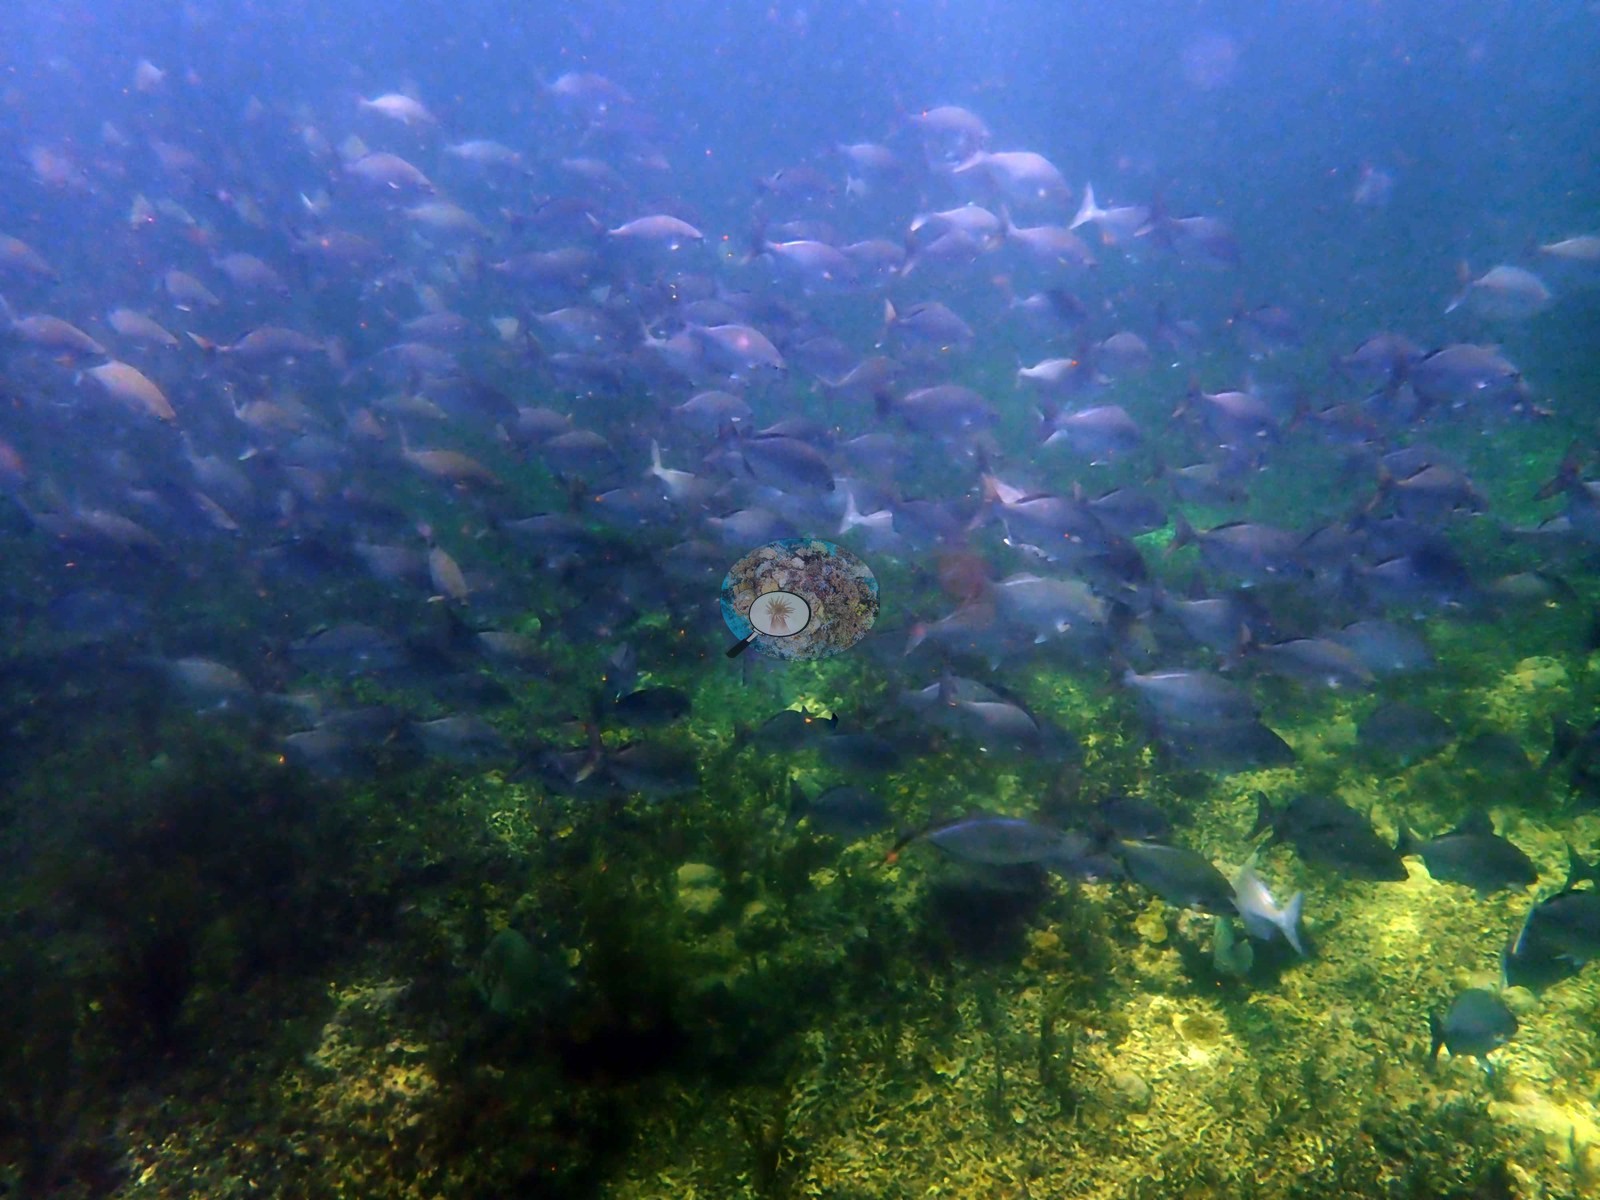
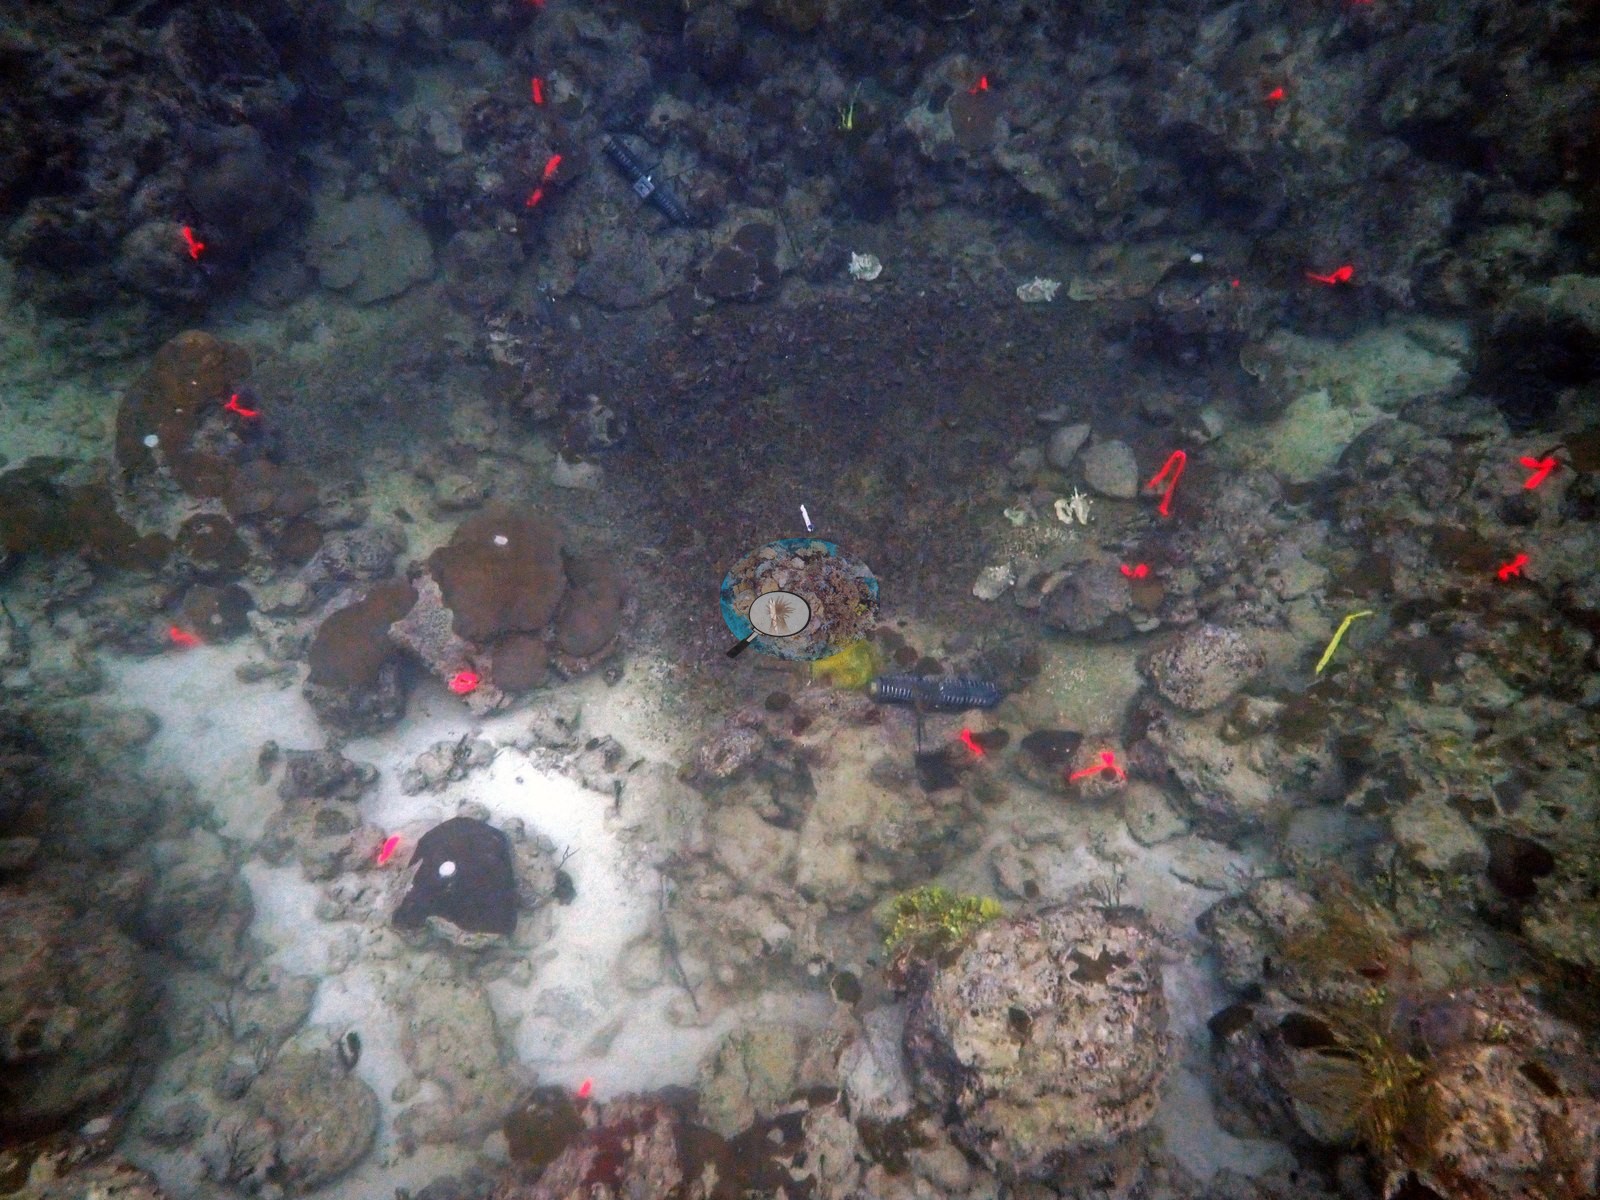
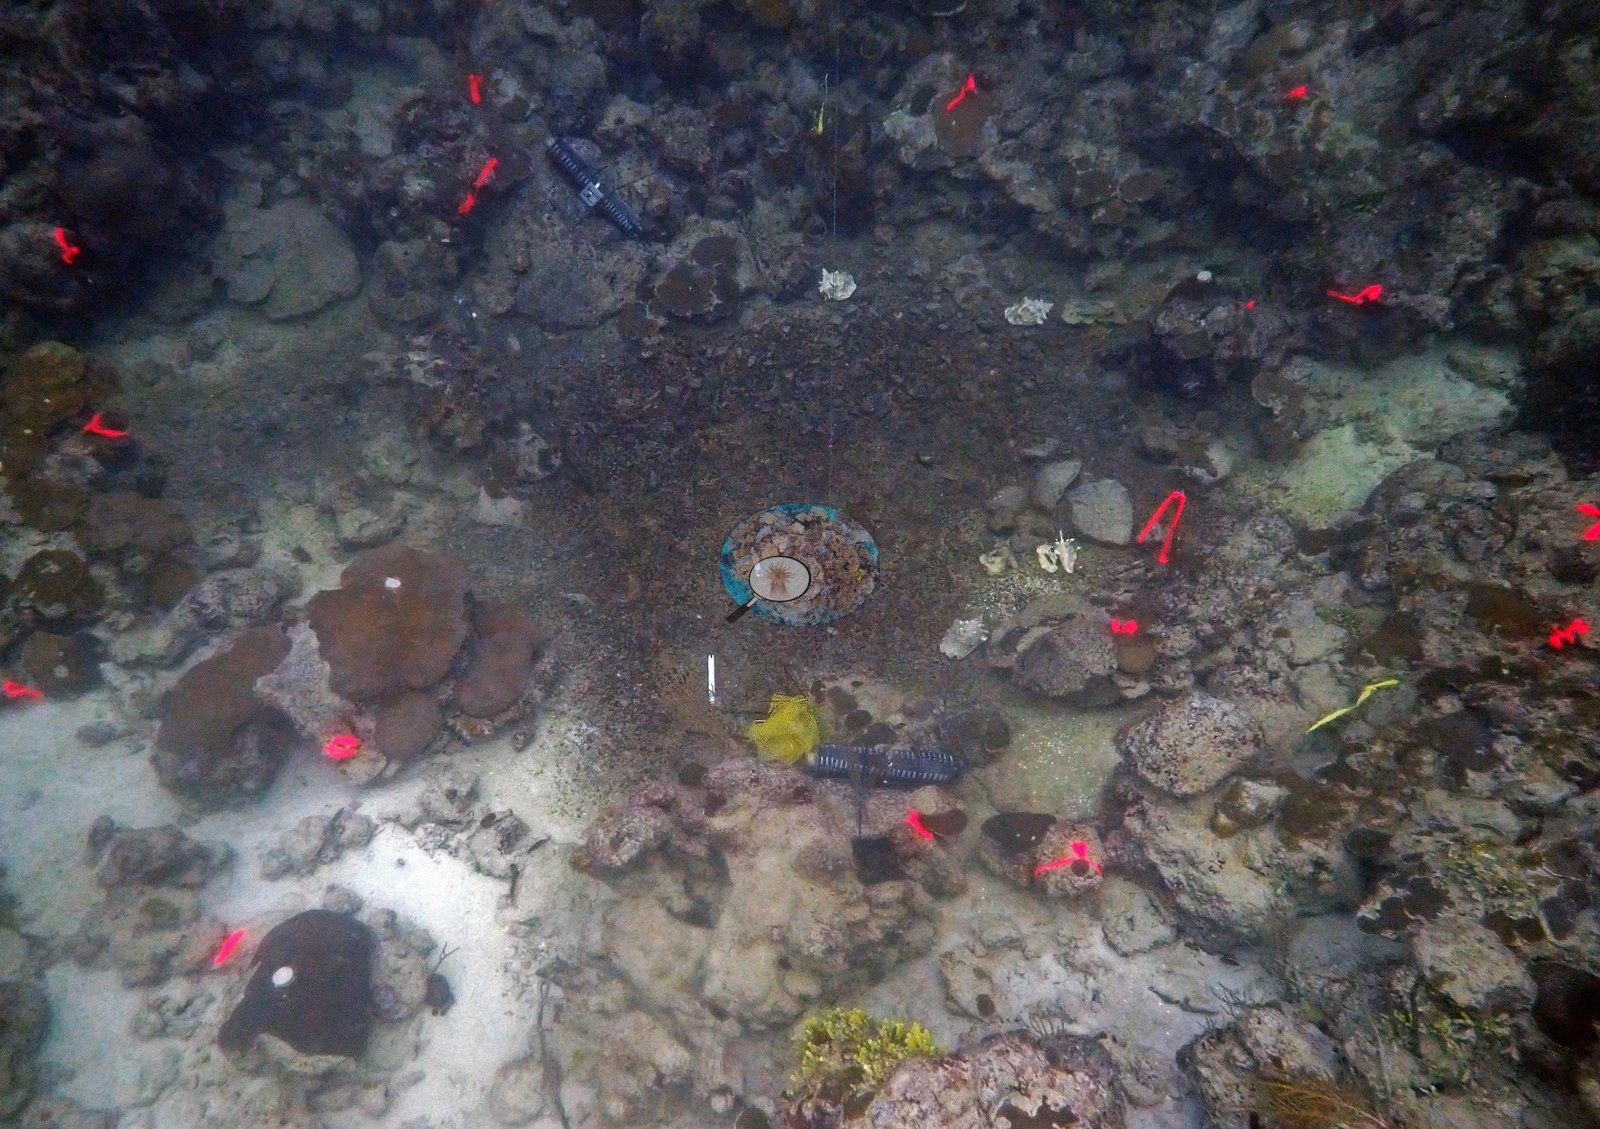
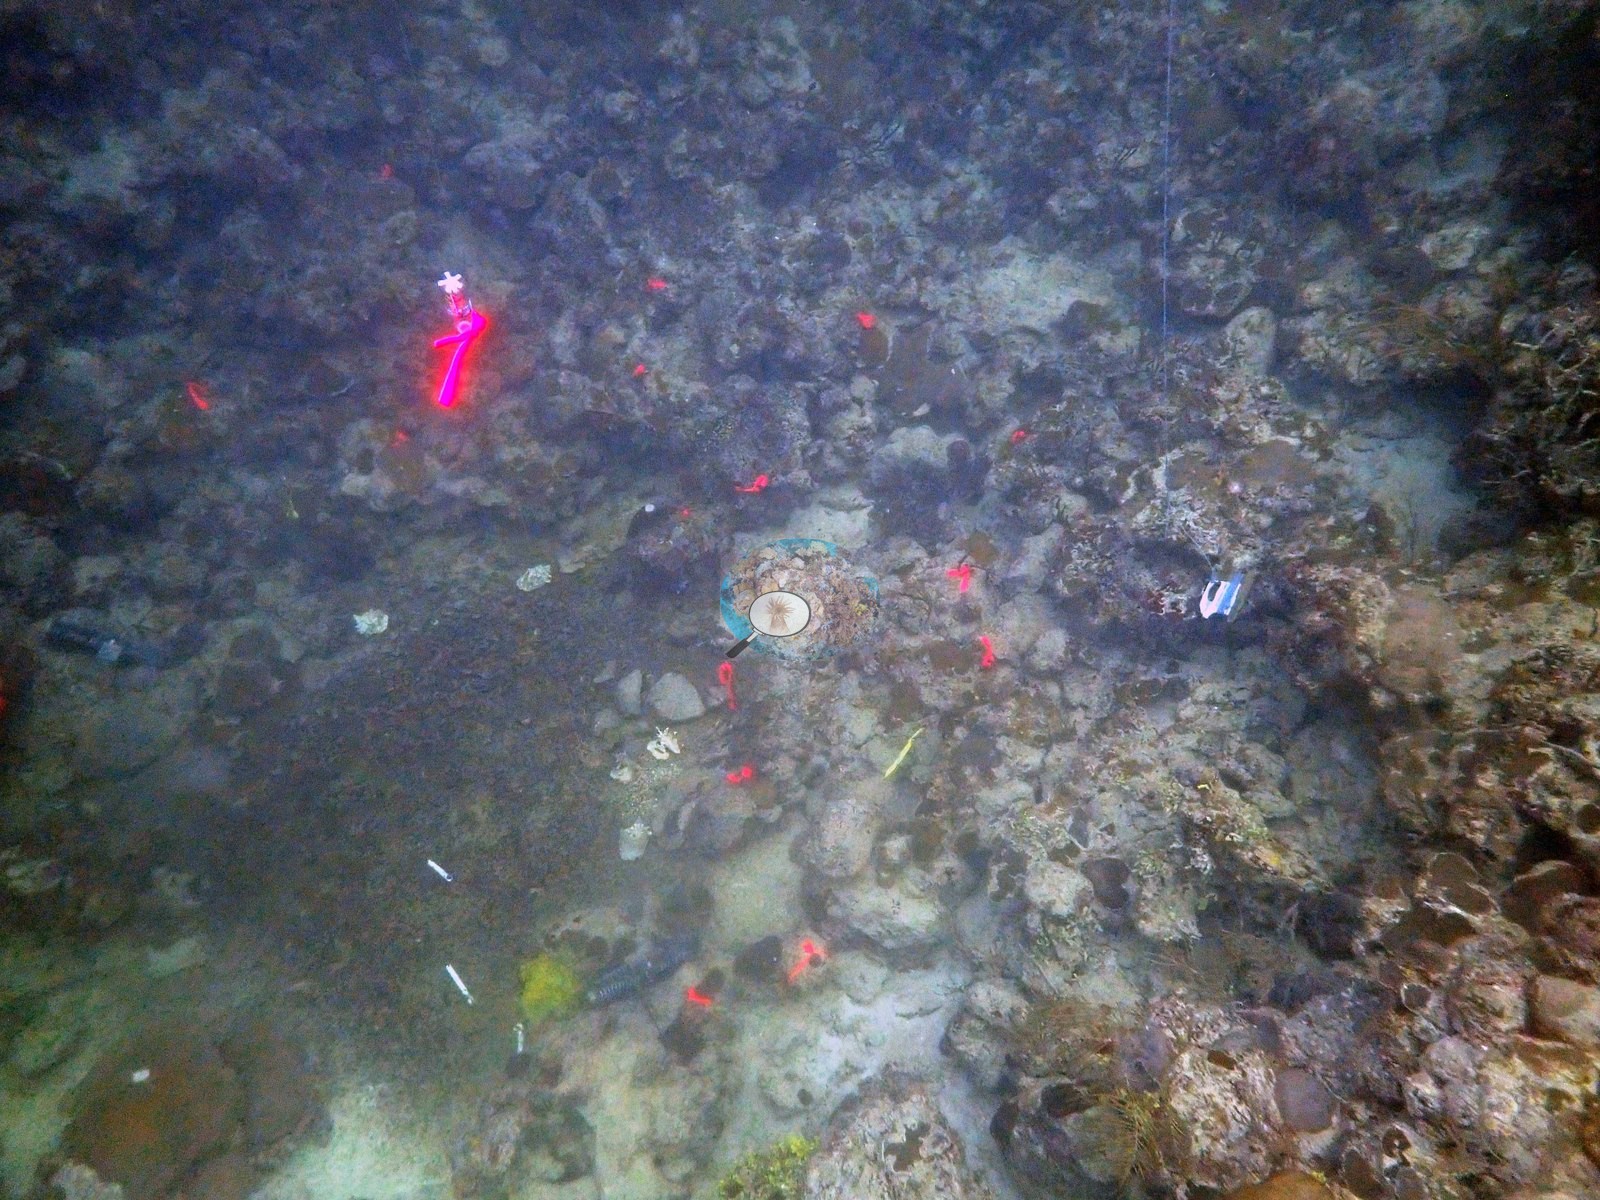
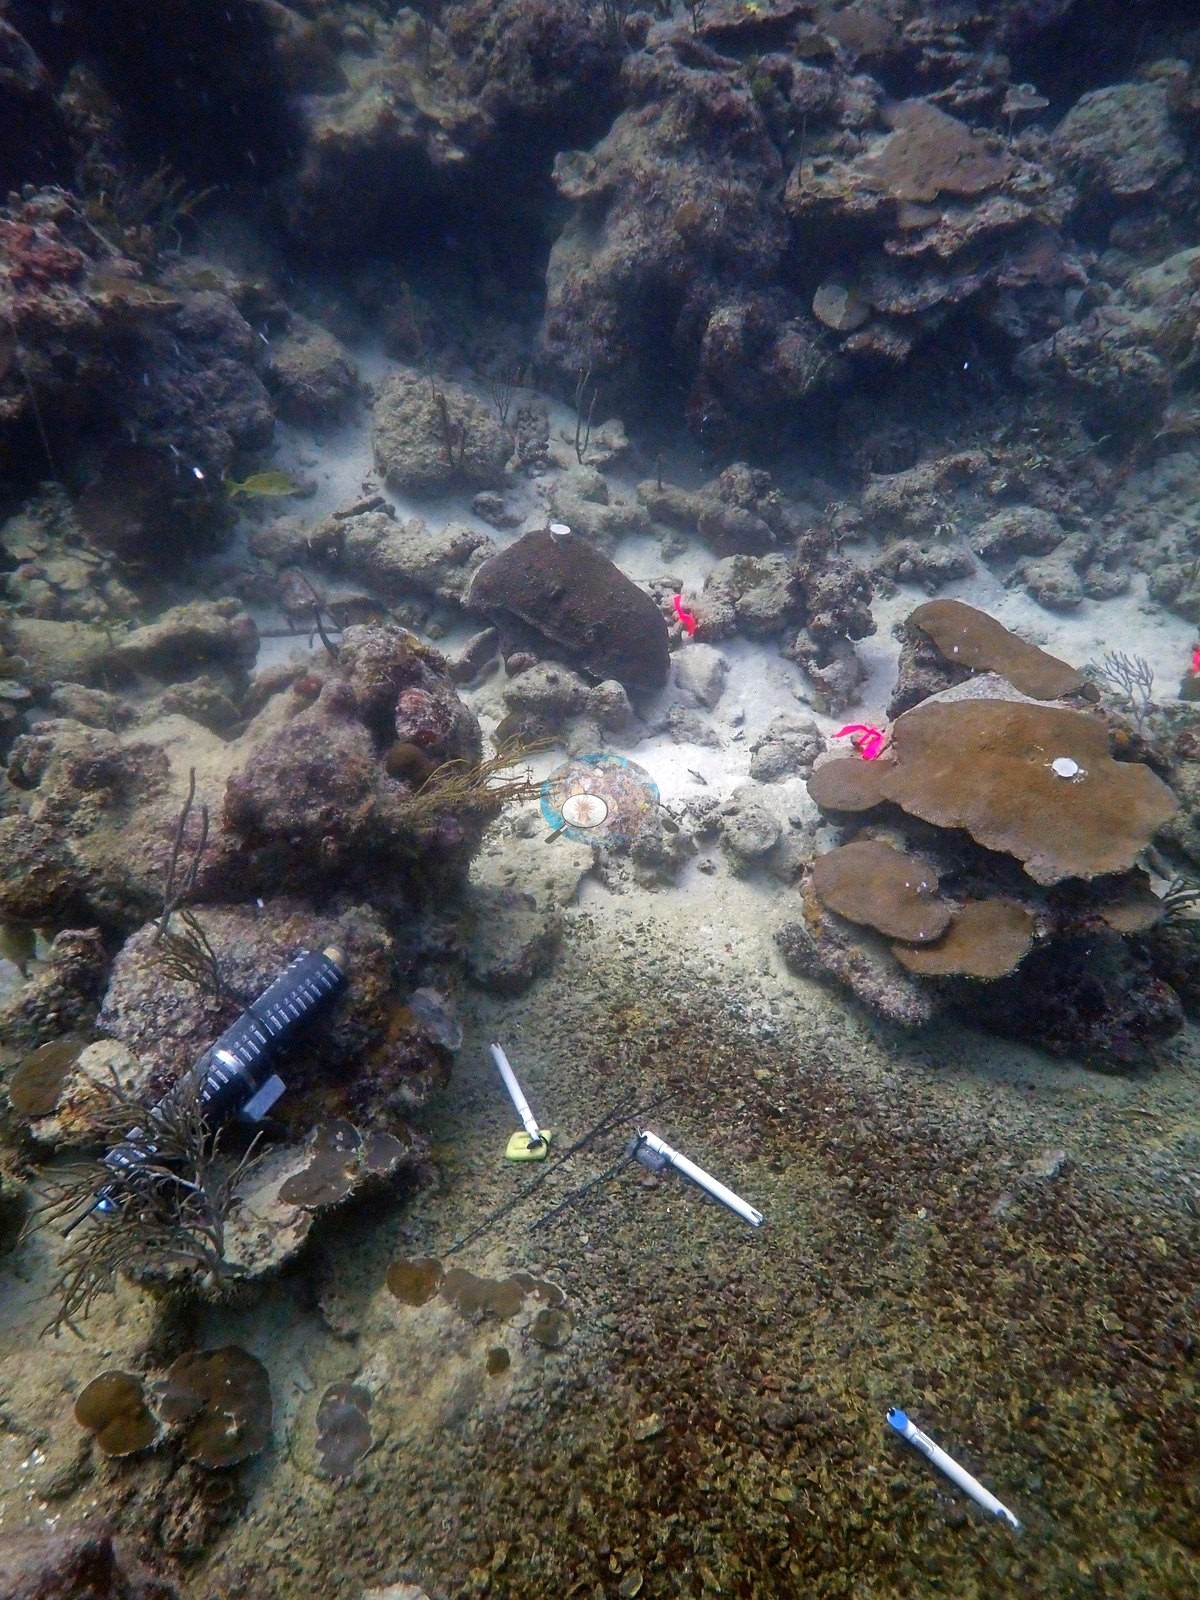
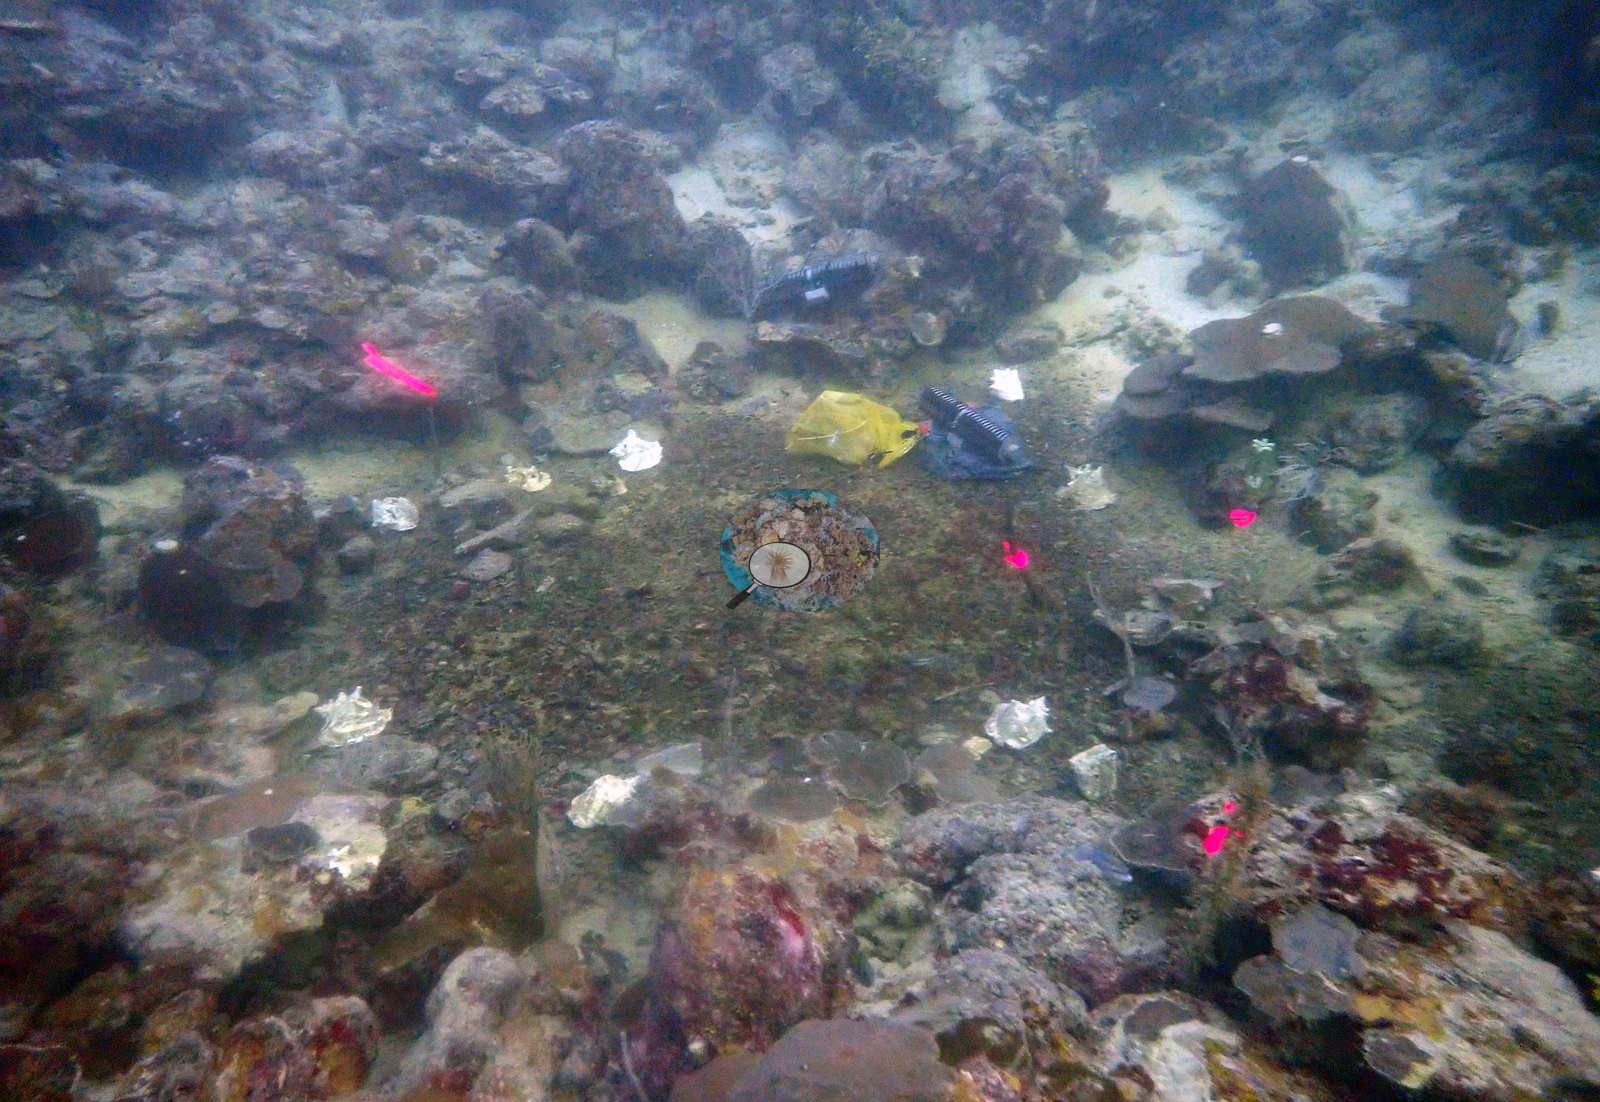
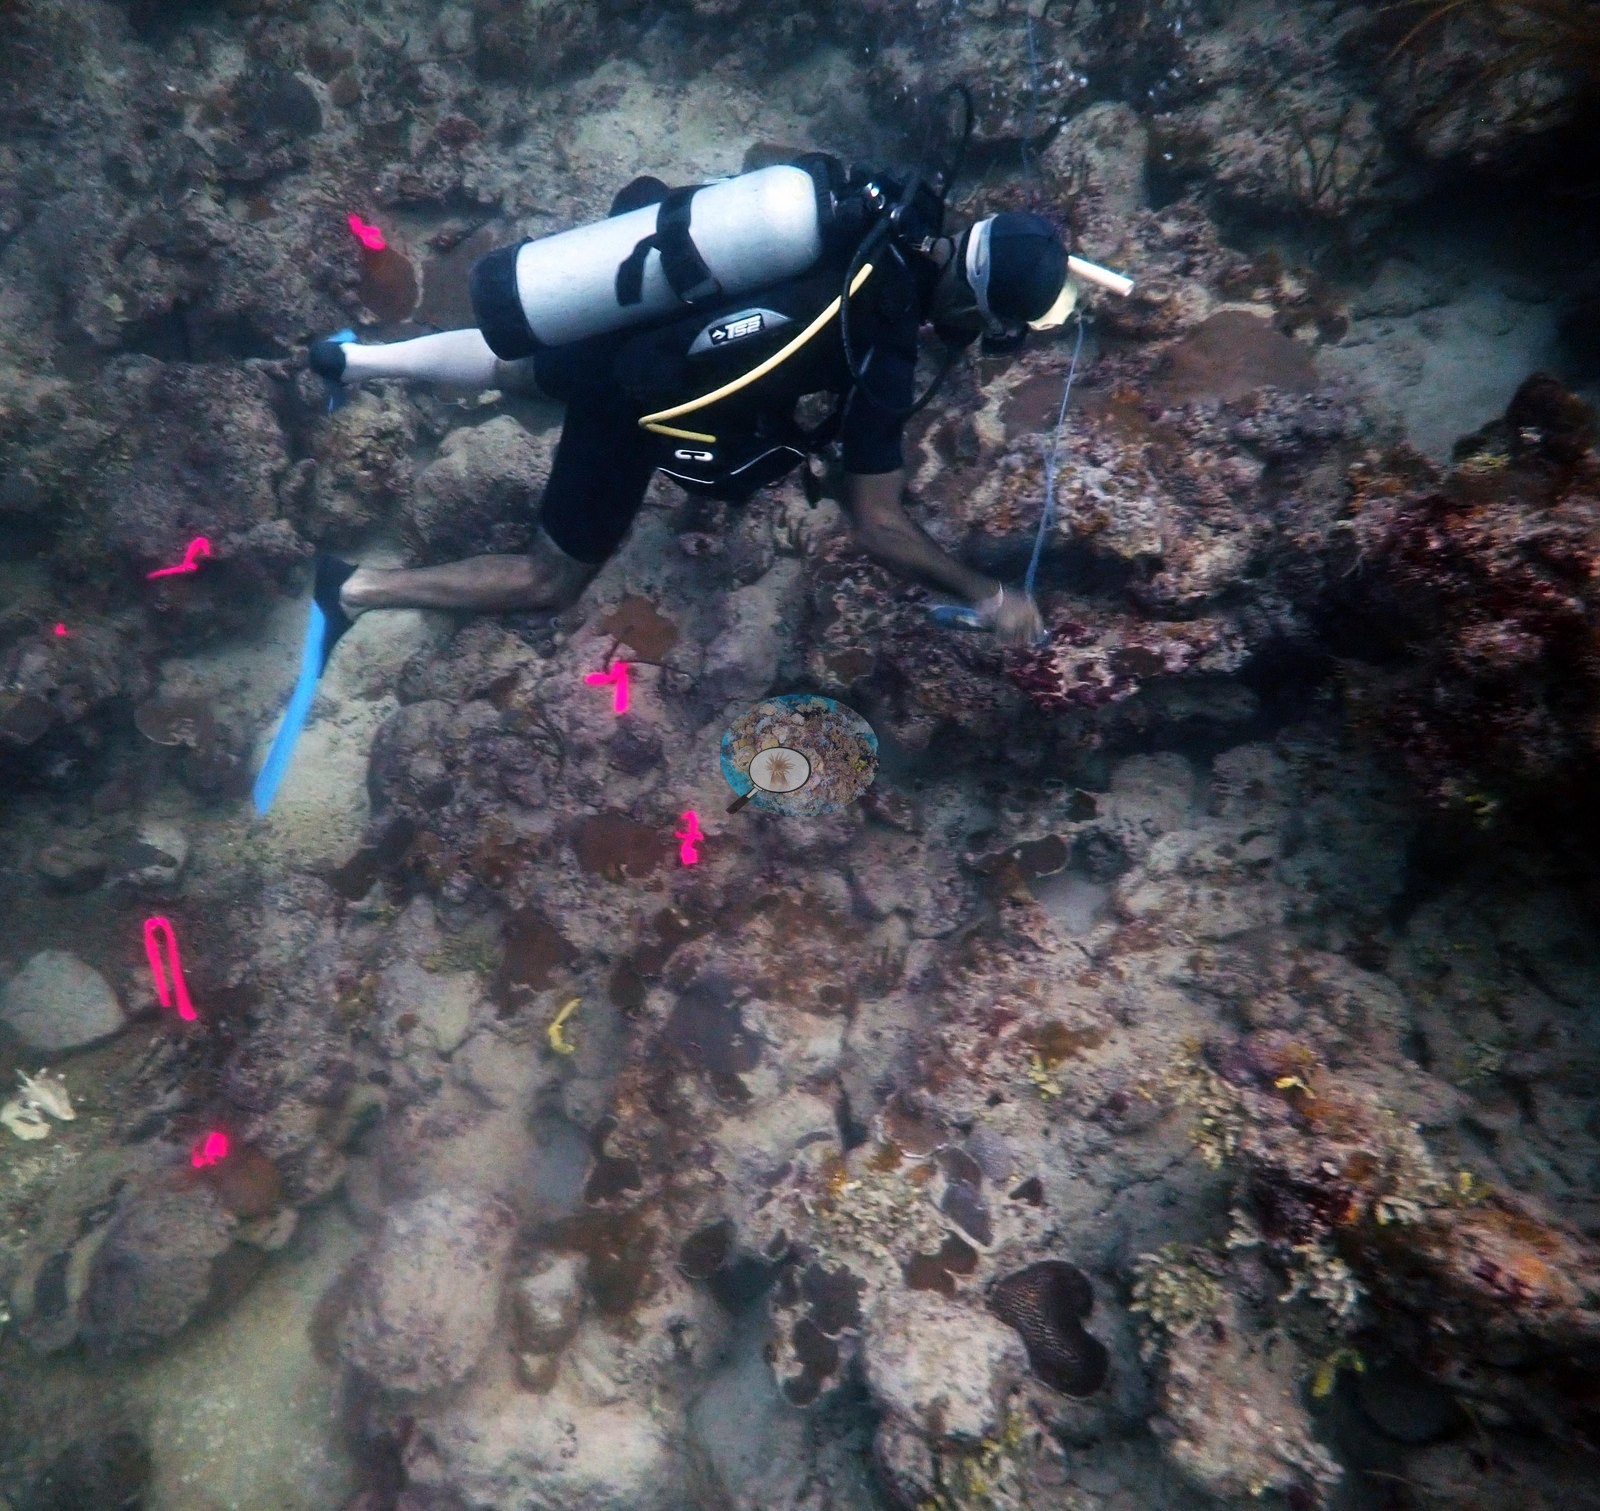
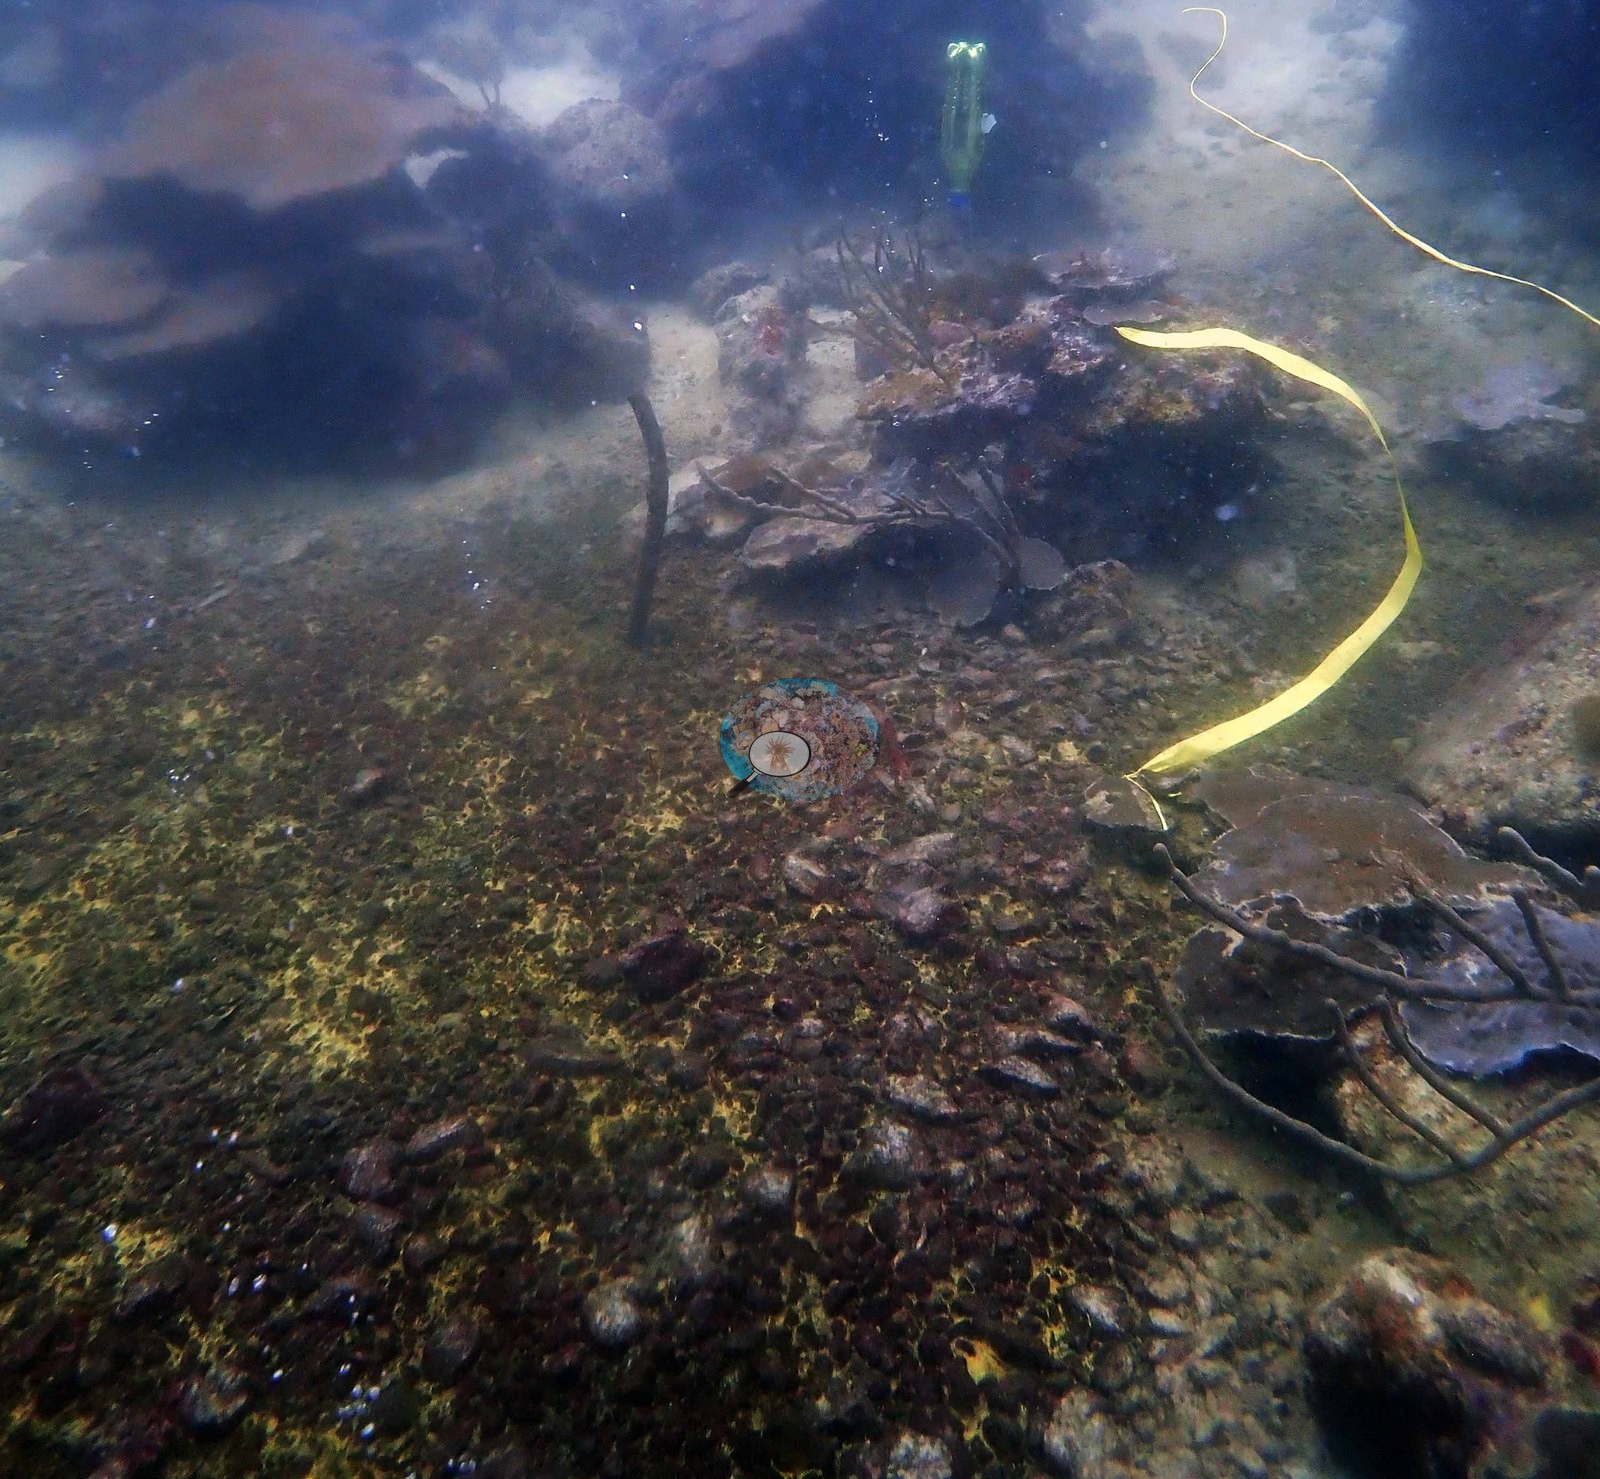
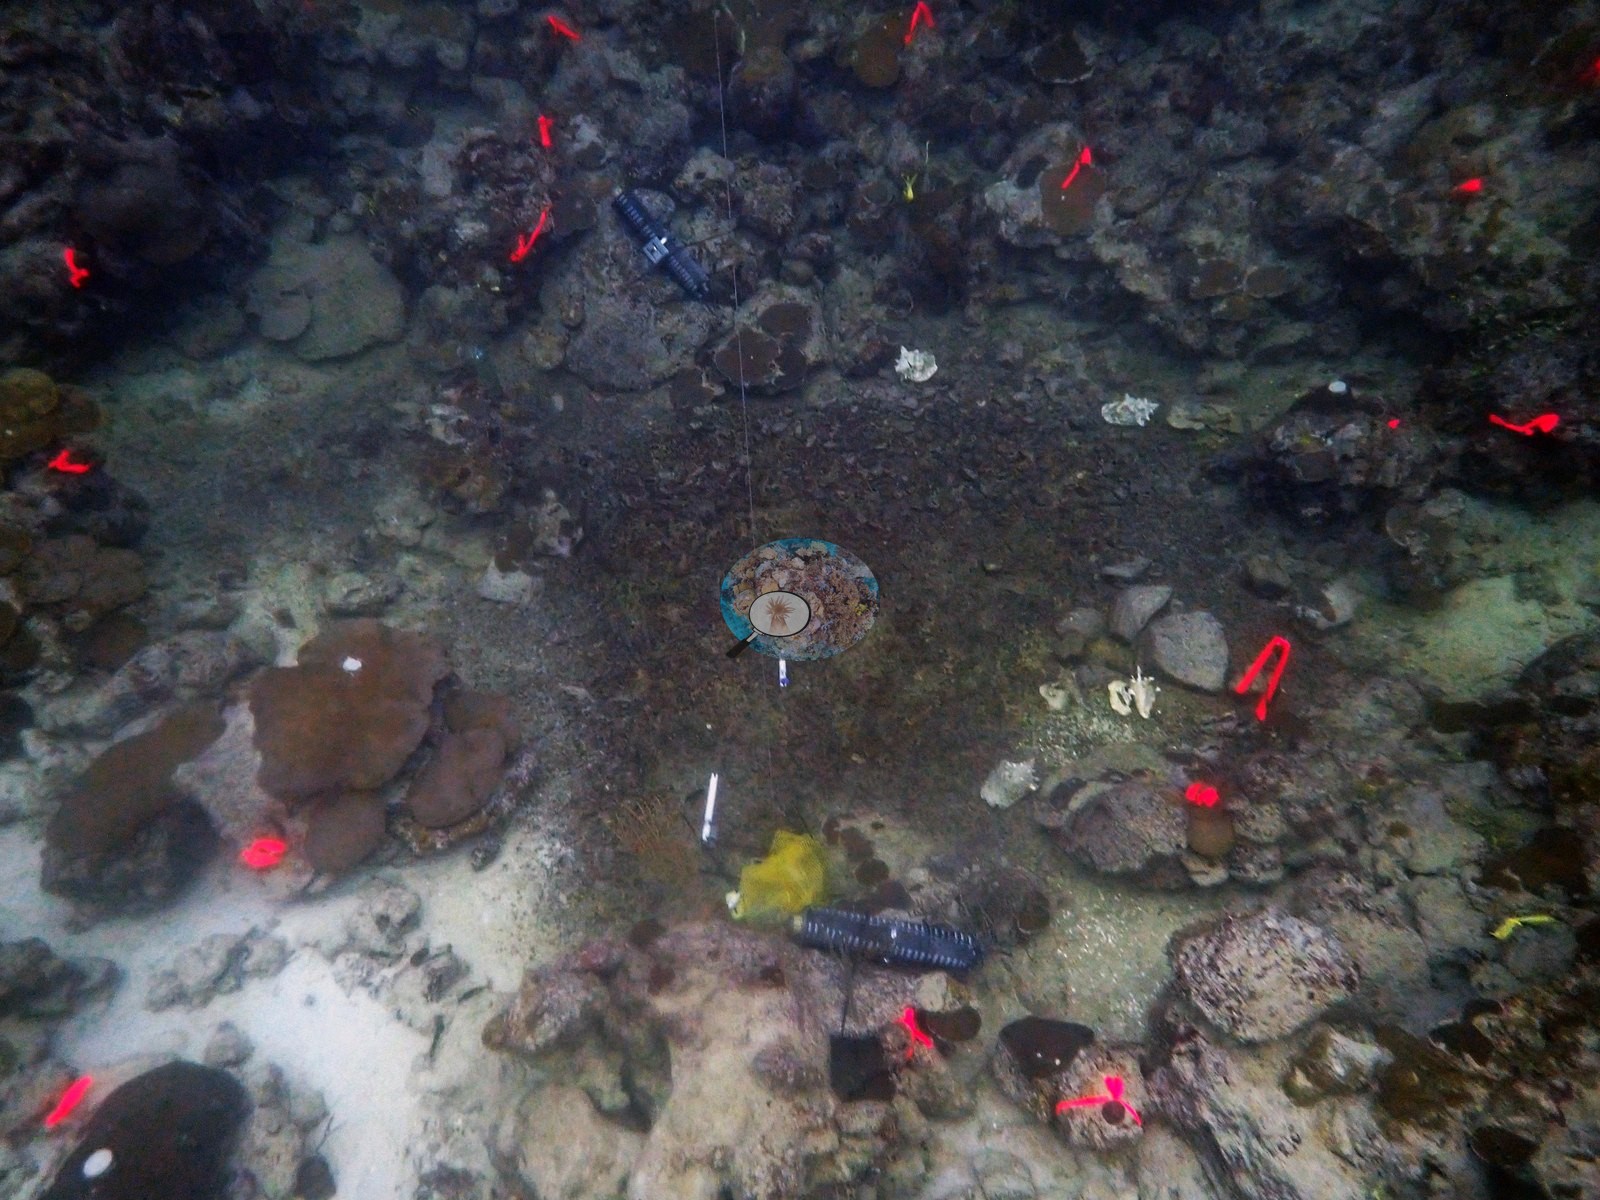
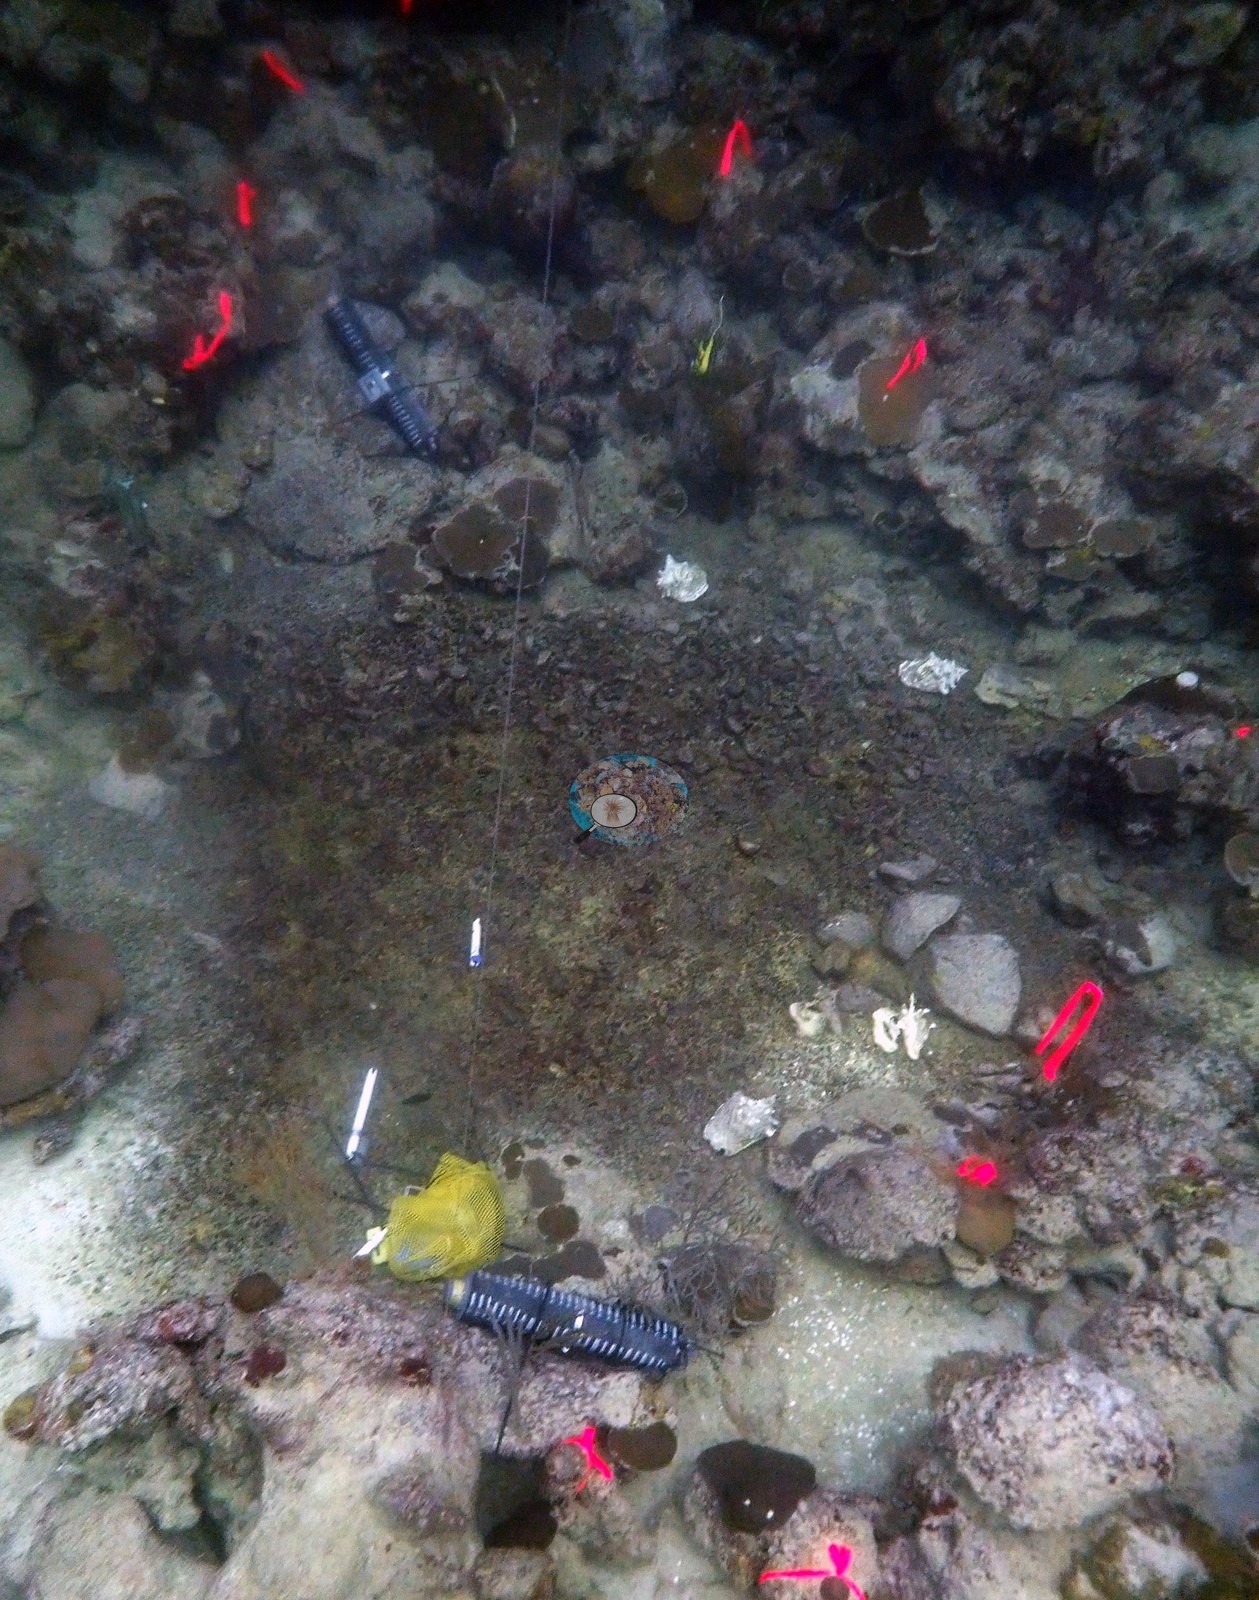
The pavement around it is a striking mosaic of magenta and rose coralline-crusted rubble and plates with yellow-brown turf between - crustose coralline algae and turf, not stony coral, hold this ground. The remaining frames (F3-F10) are the working plot. Low, silt-dusted carbonate pavement and cobble runs out flat, carpeted in dark brown and olive algal turf with clean white sand pockets in the hollows, and it is studded with survey markers: numerous magenta and red flagging tags, blue and yellow tags and white pins staked across the bottom, so densely in F4, F6, F7 and F8 that the plot layout itself is the subject. Small brown mounding and encrusting coral heads sit among the markers - discrete domes 10-30 cm across in F3, F6, F7 and F8, some crusted and partly overgrown - along with small sponges and encrusting growth on the harder blocks. This is a sparse, low-relief, turf-, and rubble-dominated bottom, not a coral framework. F5 shows a diver working head-down over the tagged plot, which gives the scale: the markers cover a patch of a few meters across. F2 is the equipment frame - a coiled yellow hose or line and dark gear resting on a heavily turf-covered pavement in very murky water. F9, his 'pseudo-mosaic', is the same plot shot near-vertically for photomosaic purposes, and F10 is a general 'vent site' overview of tagged pavement and rubble.
Coral cover
- Reference: Claude CV point count (this site's photos)
- Coral cover: 23% — a blind Claude computer-vision point count of 66 of Anderson's edited photographs (20 points per photo; water, fish, and obstructions excluded). The photos come from seven dives, including the old vent; the median is 18%. The mean is above the median because portraits of the sampled colonies sit beside wide reef and gear shots. Enochs et al. (2020, Coral Reefs 39:523-528; https://doi.org/10.1007/s00338-020-01927-5) report high hard and soft coral cover around the vents despite localized CO2 enrichment, but give no cover figure.
Stressors
No corallivores evident.
Comparisons with other data
No other surveys have been conducted at this site to date. Within 5 km, twenty independent stations recorded 1.2–44% hard coral cover between 1999 and 2019; the nearest, XL Catlin Seaview Survey at transect 22017, 0.16 km away, read 8.5% in 2013.
Other notes
Frame-level account of 10 frames documenting the seep and the marked study plot rather than the wider reef. Colonies here are tagged and the plot is marked out with numbered flagging, as expected for a vent-to-control gradient study; no tag or sample codes are reported, as they are not meaningful.
CV model comparison
More info
The mean is above the median because portraits of the sampled Orbicella, Montastraea and Porites colonies sit beside wide reef and gear shots; the photos documented sampled corals and are not a random benthic survey. No computer-vision method yet estimates coral cover accurately on new images, so treat this as indicative rather than a measurement; it is revised as the methods improve.More info
No diver transect exists for this trip, so treat the value as indicative: no computer-vision method yet estimates coral cover accurately on new images.| Method | Hard-coral cover (%) |
|---|---|
| Claude (edited photos) | 23.0 |
See a more detailed, stand-alone version of this table.
Independent surveys nearby
| Agency / program | Year(s) | Stations / distance | Link |
|---|---|---|---|
| AGRRA | 2015–2019 | 8 stations, 2.34–4.79 km | Records ↓ |
| Literature: Deschamps et al. 2003 | 1999 | 2 stations, 3.63 km | Records ↓ |
| Reef Check | 2005–2007 | 4 stations, 2.13–3.44 km | Records ↓ |
| XL Catlin Seaview Survey | 2013 | 6 stations, 0.16–3.92 km | Records ↓ |
 Coral Reef DiagnosticsYear-average (no detectable trend)
Within 5 km, 20 independent survey stations recorded hard coral cover in 26 records between 1999 and 2019. Of the 6 stations surveyed in more than one year, 5 increased and 1 changed by less than 5 percentage points between their first and latest surveys. The longest record, Petit Rameau (AGRRA, 2.34 km away), went from 34% in 2015 to 44% in 2018. The most recent nearby survey is from 2019, so these values predate recent heat stress. This site's own estimate (23%) sits within the range of these surveys (1.2–44%); the methods differ, so the comparison is context, not a like-for-like test.
Collected by other programs using different methods (Reef Check uses point-intercept transects; AGRRA uses benthic point-intercept transects, reported here as live coral cover; the XL Catlin Seaview Survey uses photo-transects with automated image annotation), so these are context for the figures above, not a like-for-like comparison. Where a station was surveyed more than once the range is shown. Station names are not dive-site names.
Show all 20 independent survey records
| Agency | Site / location | Date | Hard coral cover (%) | Distance | Link |
|---|---|---|---|---|---|
| Literature: Deschamps et al. 2003 | Horseshoe Reef fore reef, Tobago Cays Marine Park [3-4 m] | 1999 | 30% | 3.63 km | — |
| Literature: Deschamps et al. 2003 | Horseshoe Reef fore reef, Tobago Cays Marine Park [9-11 m] | 1999 | 40% | 3.63 km | — |
| Reef Check | Petit Bateau | 2005–2007 | 14–19% (2 surveys) | 2.13 km | — |
| Reef Check | Petit Tabac | 2005–2007 | 10–11% (2 surveys) | 3.03 km | — |
| Reef Check | Horseshoe Reef Back Reef | 2005–2007 | 24–31% (2 surveys) | 3.14 km | — |
| Reef Check | Horseshoe (outside) | 2007 | 16% | 3.44 km | — |
| XL Catlin Seaview Survey | transect 22017 | 2013 | 8.5% | 0.16 km | doi:10.14264/uql.2019.930 |
| XL Catlin Seaview Survey | transect 22018 | 2013 | 6.1% | 0.24 km | doi:10.14264/uql.2019.930 |
| XL Catlin Seaview Survey | transect 22019 | 2013 | 11% | 0.25 km | doi:10.14264/uql.2019.930 |
| XL Catlin Seaview Survey | transect 22016 | 2013 | 7.5% | 2.60 km | doi:10.14264/uql.2019.930 |
| XL Catlin Seaview Survey | transect 22014 | 2013 | 5.4% | 2.89 km | doi:10.14264/uql.2019.930 |
| XL Catlin Seaview Survey | transect 22015 | 2013 | 1.2% | 3.92 km | doi:10.14264/uql.2019.930 |
| AGRRA | Petit Rameau | 2015–2018 | 34–44% (2 surveys) | 2.34 km | — |
| AGRRA | Horseshoe REEF-SE | 2015–2018 | 5.6–11% (2 surveys) | 2.92 km | — |
| AGRRA | Horseshoe Reef MPA Site | 2015 | 12% | 3.30 km | — |
| AGRRA | World's End Reef-S | 2015–2018 | 3.0–8.3% (2 surveys) | 4.56 km | — |
| AGRRA | NE Palm Island | 2015 | 1.5% | 4.79 km | — |
| AGRRA | Horseshoe Reef MPA site | 2018 | 12% | 3.30 km | — |
| AGRRA | TaiChi Reef | 2019 | 13% | 3.10 km | — |
| AGRRA | Horse Shoe Reef | 2019 | 11% | 3.32 km | — |
Data & links
- HeatCRD database ↗
- van Woesik and Kratochwill (2024) ↗
- Photo portfolio ↗
- Coral Reef Diagnostics page for this area ↗
All images from Coral Reef Diagnostics. Data are from Coral Reef Diagnostics and the organizations named in the data sources above.
© Coral Reef Diagnostics.
References
- Enochs IC, Formel N, Manzello D, Morris J, Mayfield AB, Boyd A, et al. (2020). Coral persistence despite extreme periodic pH fluctuations at a volcanically acidified Caribbean reef. Coral Reefs 39:523-528. DOI
- Deschamps A, Desrochers A, Klomp KD (2003). St. Vincent. A Rapid Assessment of the Horseshoe Reef, Tobago Cays Marine Park, St. Vincent, West Indies (Stony Corals, Algae and Fishes). Atoll Research Bulletin 496:438-459. DOI
- Gonzalez-Rivero M, et al. (2019). Seaview Survey photo-quadrat and image classification dataset. The University of Queensland (UQ eSpace) data collection. DOI