

SVG - Tobago Cays (Horseshoe Reef)

Part of the regional summary: Saint Vincent and the Grenadines
More info
Windward Caribbean Islands (NOAA CRW virtual station) · Eastern Caribbean ecoregion mean: 13.1 degree heating weeksThe long arc of shallow barrier reef enclosing the Tobago Cays lagoon in the southern Grenadines. The photographs are all topside, showing palm-fringed islets, a beached charter catamaran, and the sharp color break where turquoise lagoon meets deep blue at the reef line, so no underwater account is possible.
21 independent survey stations shown with the program’s logo — click one to see how far it is from this site.
Four other CRD dive sites within 5 km shown in orange — click a marker to open its page.
Site description
Setting
Horseshoe Reef is the long arc of shallow barrier reef that encloses the Tobago Cays lagoon in the southern Grenadines, sheltering the anchorage behind Petit Rameau, Petit Bateau, Baradal, and Jamesby. The photographs attached to this site are all topside, taken from the bow of a small boat crossing between the cays, so they document the setting rather than the reef: low, scrub-covered islets with narrow white beaches and coconut palms (e.g., Image 1, Image 2), a charter catamaran drawn up on the sand with day-trippers ashore (e.g., Image 3), an eroded rocky islet with surf breaking on its windward end (e.g., Image 5), and the striking color break where the pale turquoise of the lagoon shallows meets the deep blue outside the reef line (e.g., Image 4).
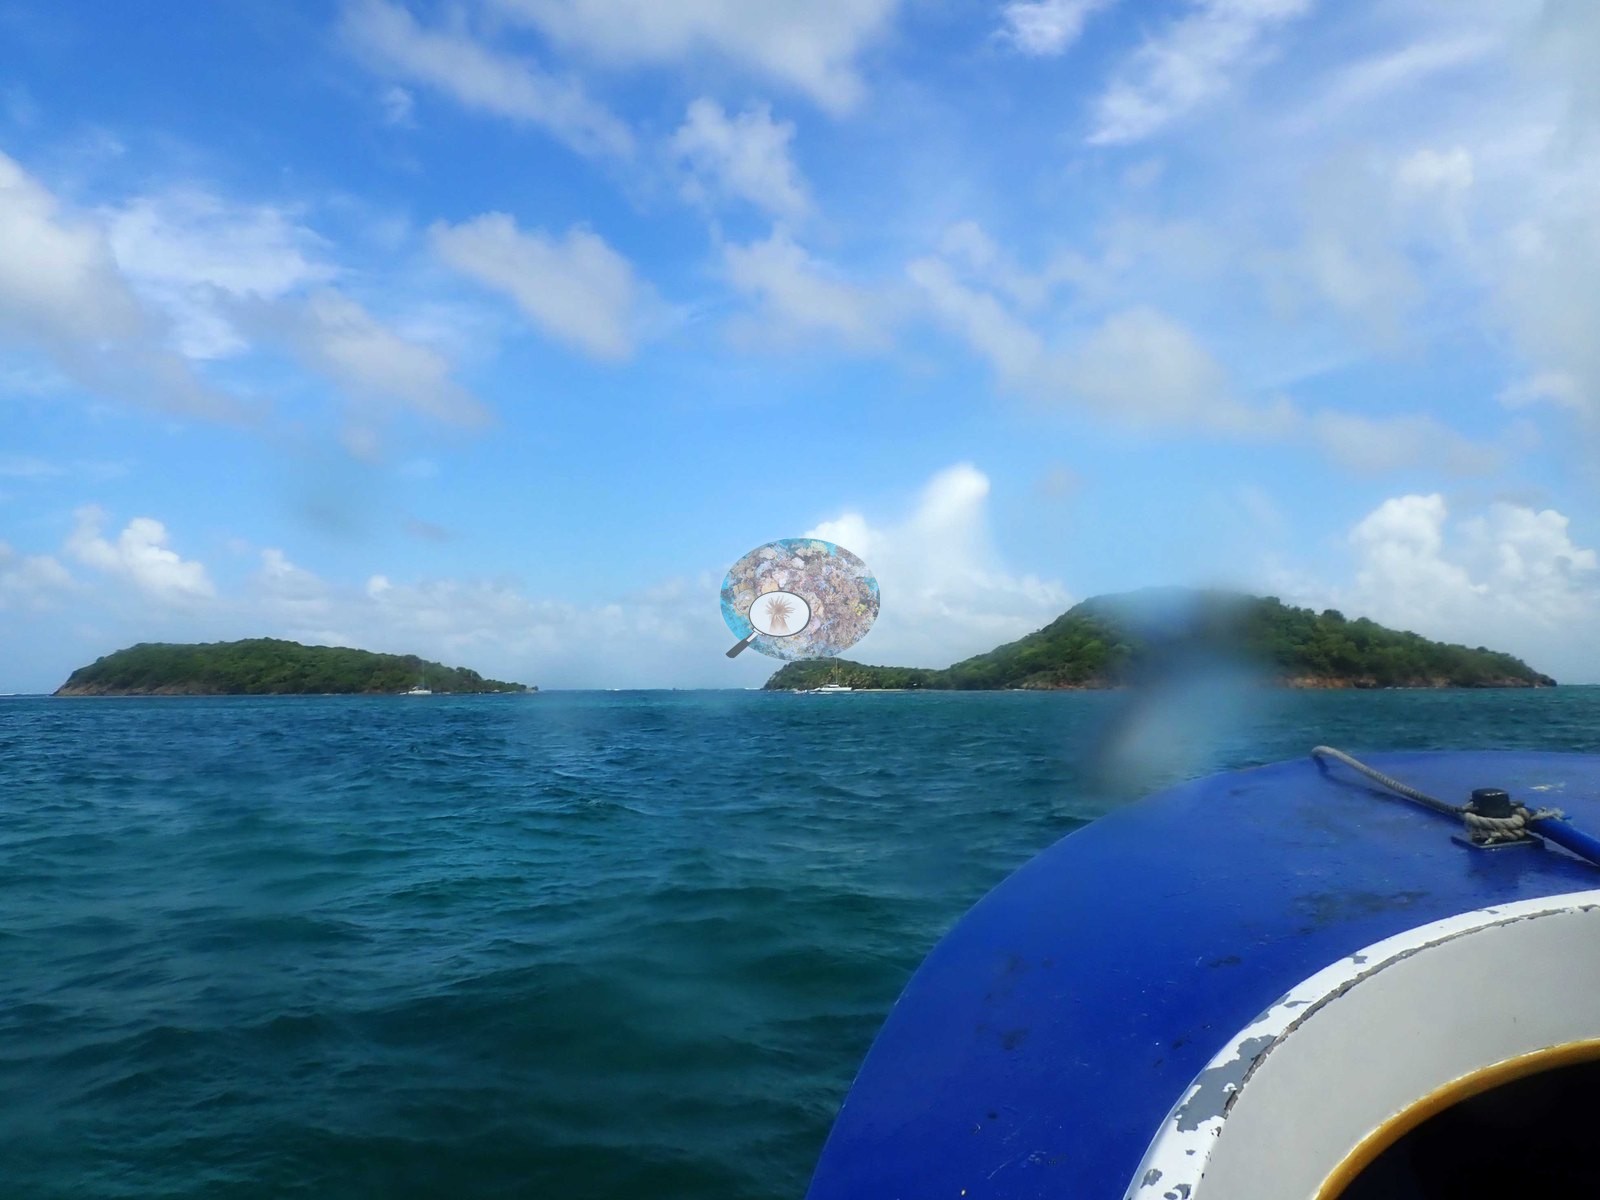
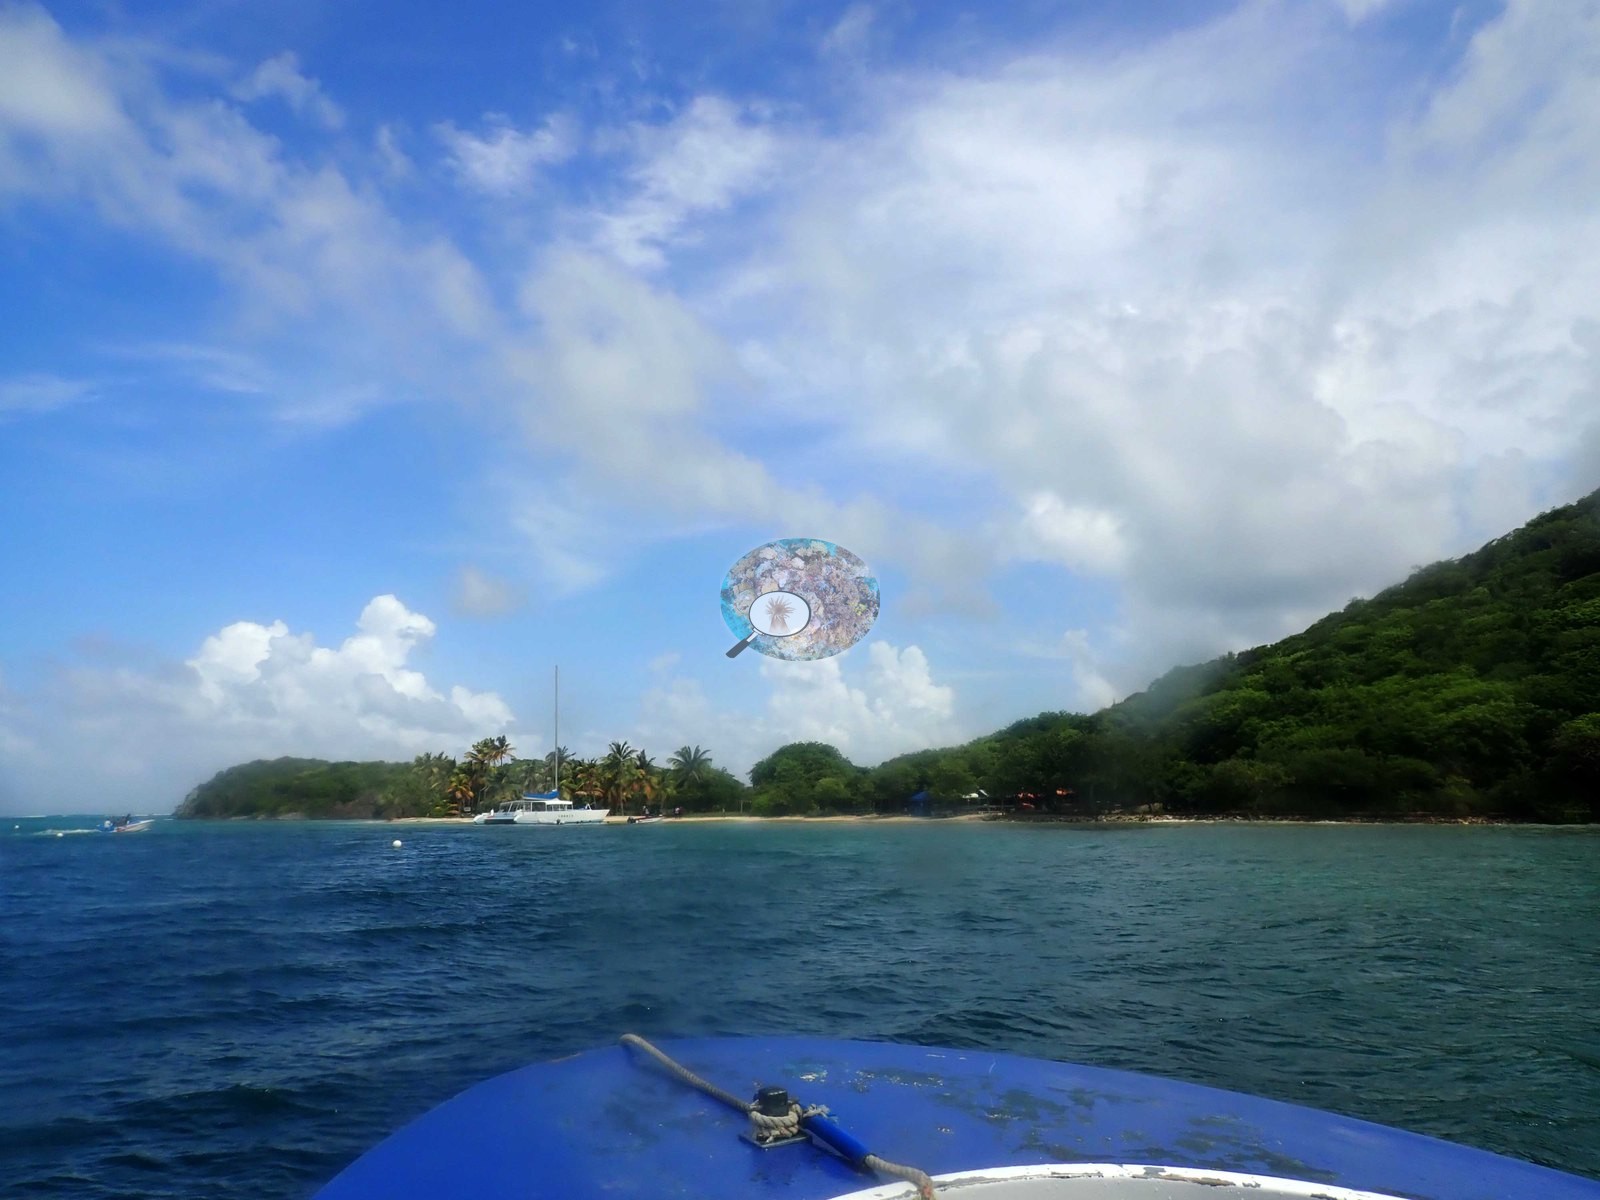
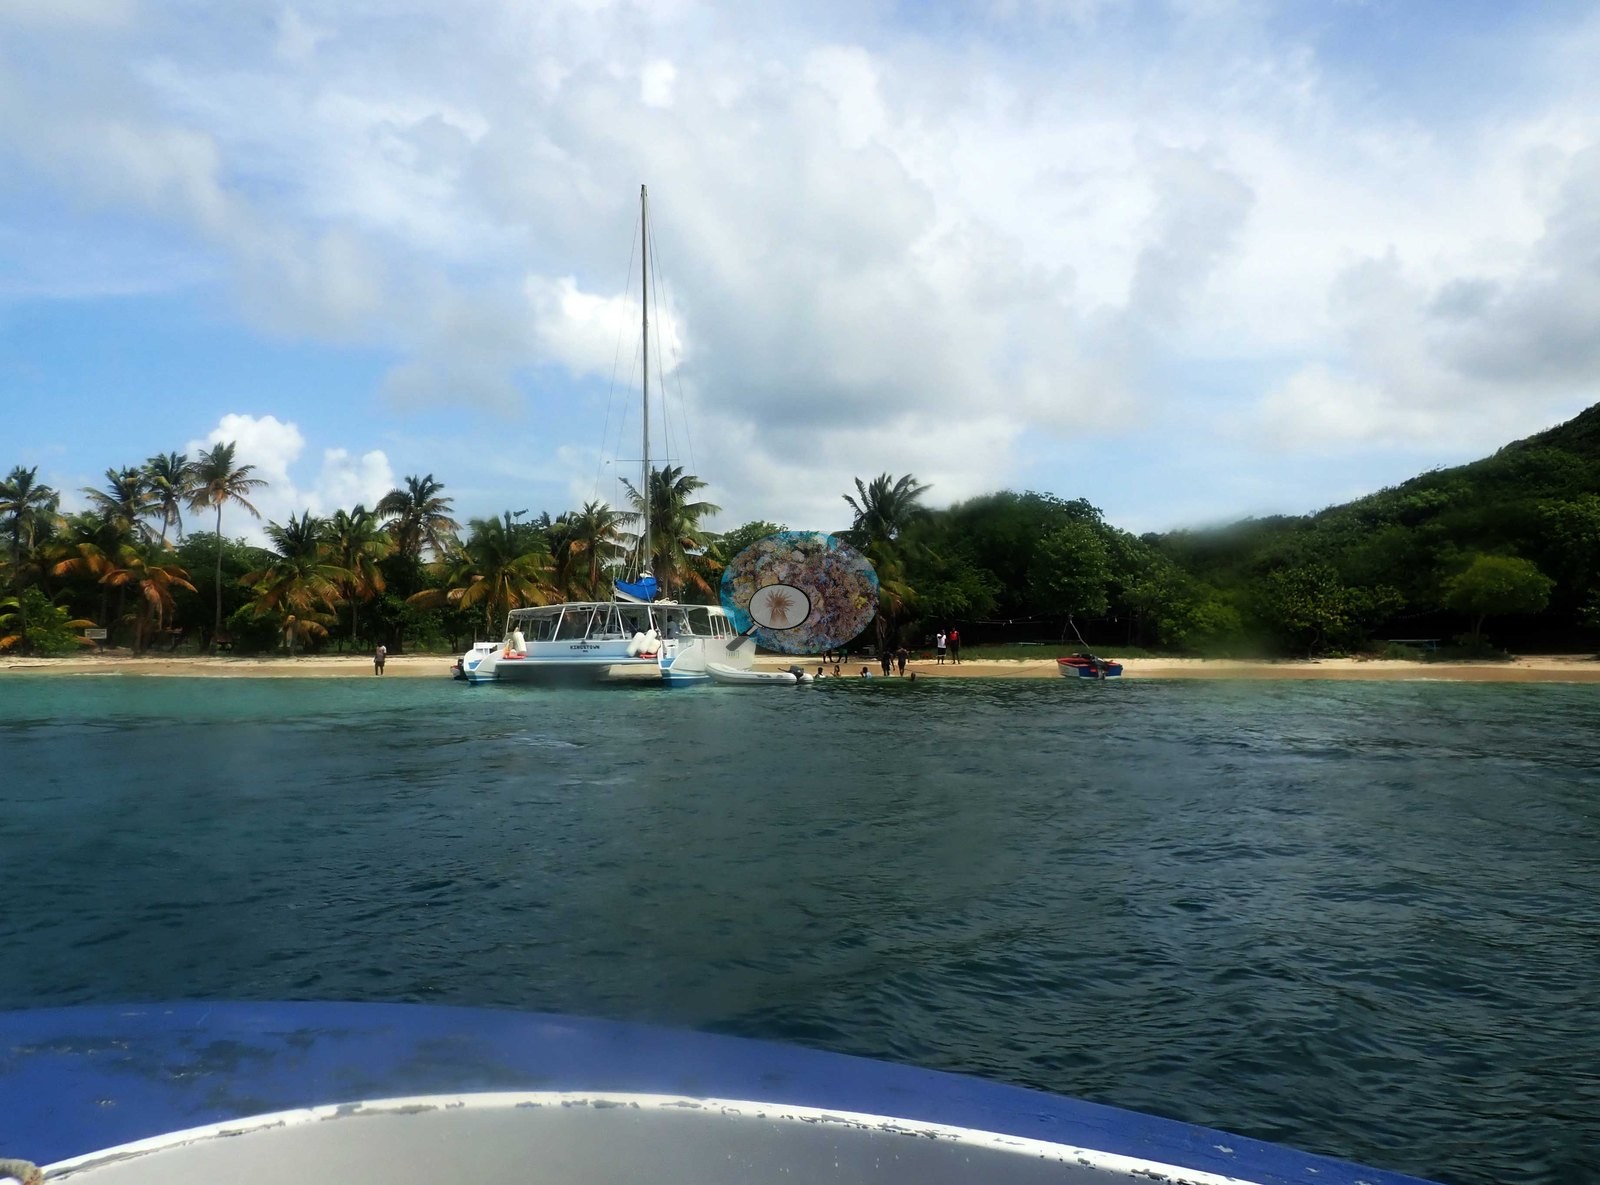
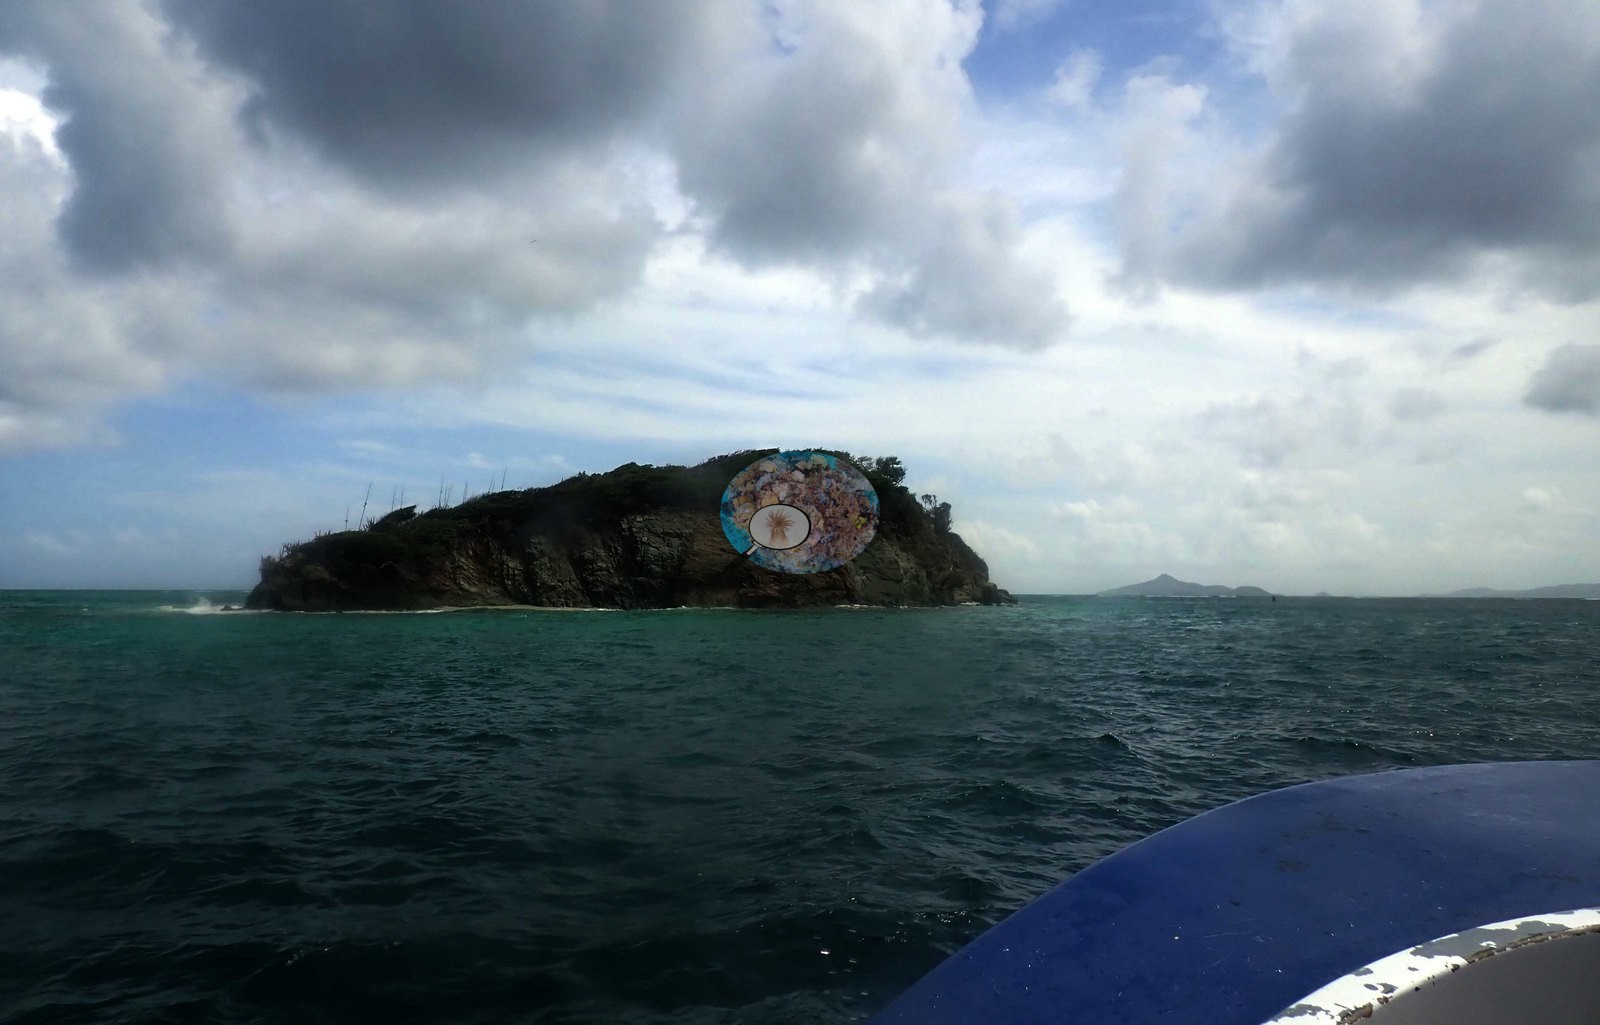
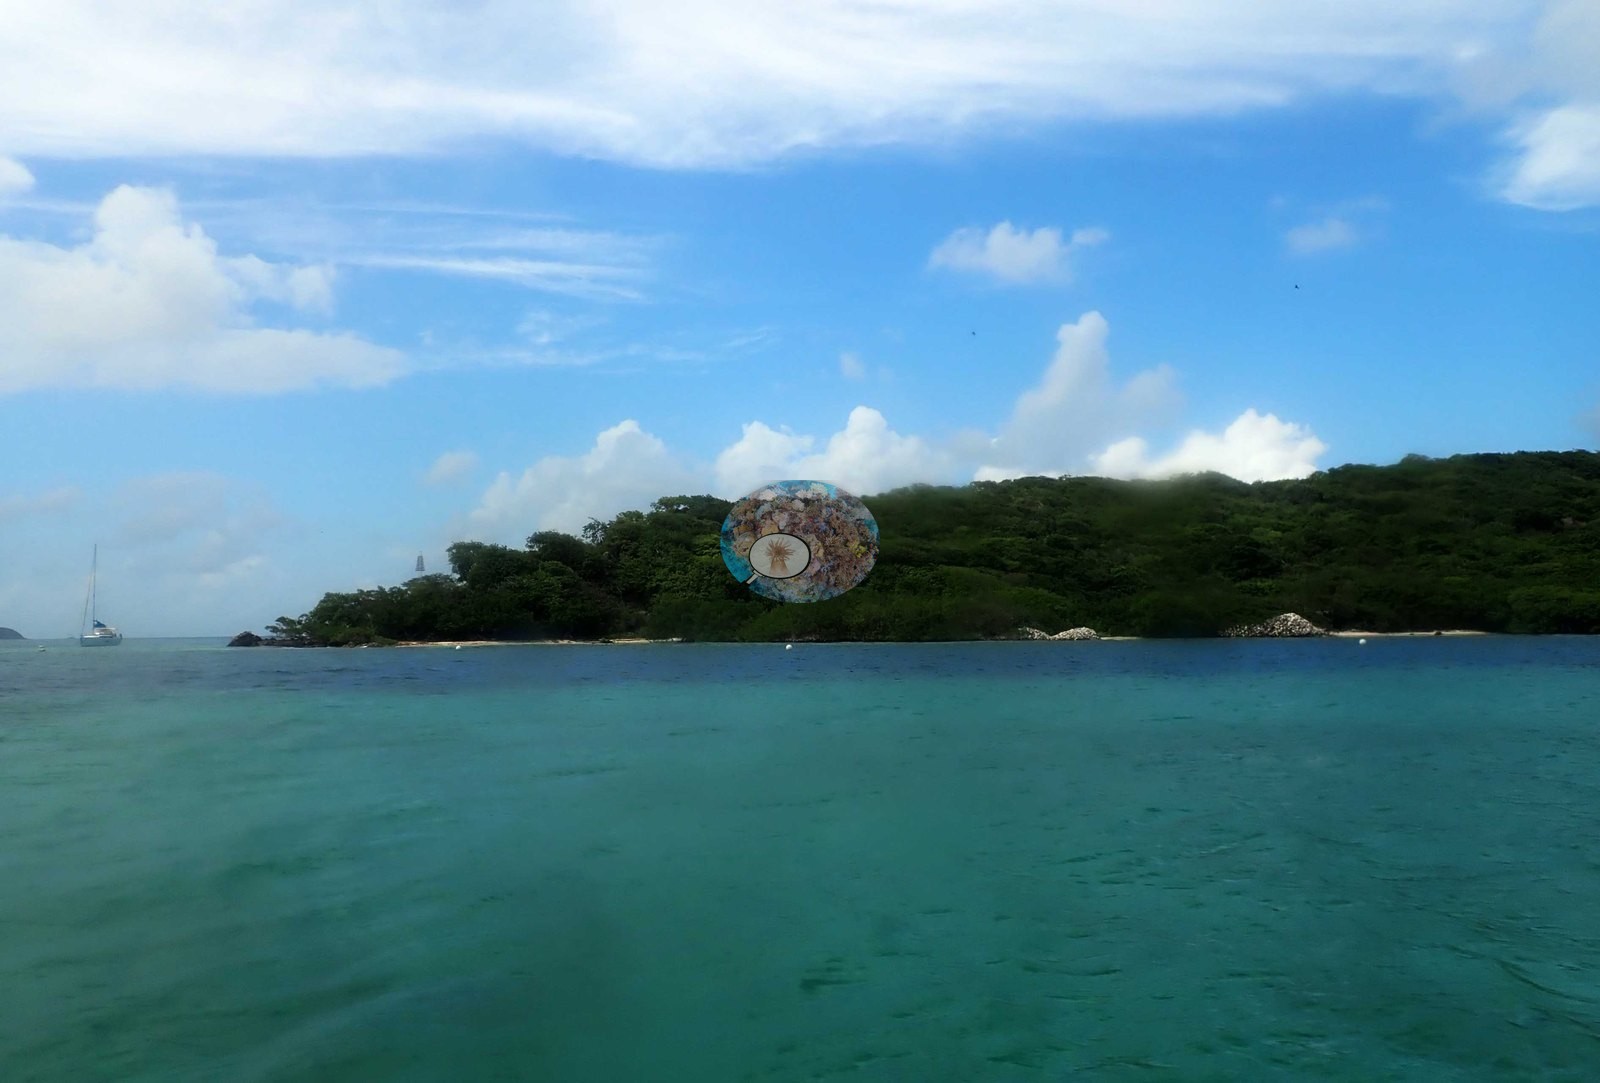
That color boundary is the reef itself seen from above.
General benthic features
Nothing underwater is visible in any frame, so no benthic account can be given here.
Coral cover
- No coral-cover value of its own exists for this site.
Stressors
No corallivores evident.
Comparisons with other data
No other surveys have been conducted at this site to date. Within 5 km, 21 independent stations recorded 1.1–44% hard coral cover between 1999 and 2019; the nearest, Reef Check at Petit Bateau, 0.36 km away, read 14–19% between 2005 and 2007.
Independent surveys nearby
| Agency / program | Year(s) | Stations / distance | Link |
|---|---|---|---|
| AGRRA | 2015–2019 | 8 stations, 0.72–3.72 km | Records ↓ |
| Literature: Deschamps et al. 2003 | 1999 | 2 stations, 1.43 km | Records ↓ |
| Reef Check | 2005–2007 | 4 stations, 0.36–1.40 km | Records ↓ |
| XL Catlin Seaview Survey | 2013 | 7 stations, 1.84–4.12 km | Records ↓ |
Within 5 km, 21 independent survey stations recorded hard coral cover in 28 records between 1999 and 2019. Of the 7 stations surveyed in more than one year, 5 increased and 2 changed by less than 5 percentage points between their first and latest surveys. The longest record, Horseshoe REEF-SE (AGRRA, 0.72 km away), went from 5.6% in 2015 to 11% in 2018. The most recent nearby survey is from 2019, so these values predate recent heat stress.
Collected by other programs using different methods (Reef Check uses point-intercept transects; AGRRA uses benthic point-intercept transects, reported here as live coral cover; the XL Catlin Seaview Survey uses photo-transects with automated image annotation), so these are context for the figures above, not a like-for-like comparison. Where a station was surveyed more than once the range is shown. Station names are not dive-site names.
Show all 21 independent survey records
| Agency | Site / location | Date | Hard coral cover (%) | Distance | Link |
|---|---|---|---|---|---|
| Literature: Deschamps et al. 2003 | Horseshoe Reef fore reef, Tobago Cays Marine Park [3-4 m] | 1999 | 30% | 1.43 km | — |
| Literature: Deschamps et al. 2003 | Horseshoe Reef fore reef, Tobago Cays Marine Park [9-11 m] | 1999 | 40% | 1.43 km | — |
| Reef Check | Petit Bateau | 2005–2007 | 14–19% (2 surveys) | 0.36 km | — |
| Reef Check | Petit Tabac | 2005–2007 | 10–11% (2 surveys) | 1.02 km | — |
| Reef Check | Horseshoe Reef Back Reef | 2005–2007 | 24–31% (2 surveys) | 1.06 km | — |
| Reef Check | Horseshoe (outside) | 2007 | 16% | 1.40 km | — |
| XL Catlin Seaview Survey | transect 22014 | 2013 | 5.4% | 1.84 km | doi:10.14264/uql.2019.930 |
| XL Catlin Seaview Survey | transect 22016 | 2013 | 7.5% | 1.96 km | doi:10.14264/uql.2019.930 |
| XL Catlin Seaview Survey | transect 22015 | 2013 | 1.2% | 2.12 km | doi:10.14264/uql.2019.930 |
| XL Catlin Seaview Survey | transect 22017 | 2013 | 8.5% | 2.26 km | doi:10.14264/uql.2019.930 |
| XL Catlin Seaview Survey | transect 22018 | 2013 | 6.1% | 2.31 km | doi:10.14264/uql.2019.930 |
| XL Catlin Seaview Survey | transect 22019 | 2013 | 11% | 2.33 km | doi:10.14264/uql.2019.930 |
| XL Catlin Seaview Survey | transect 22013 | 2013 | 1.1% | 4.12 km | doi:10.14264/uql.2019.930 |
| AGRRA | Horseshoe REEF-SE | 2015–2018 | 5.6–11% (2 surveys) | 0.72 km | — |
| AGRRA | Petit Rameau | 2015–2018 | 34–44% (2 surveys) | 1.06 km | — |
| AGRRA | Horseshoe Reef MPA Site | 2015 | 12% | 1.18 km | — |
| AGRRA | World's End Reef-S | 2015–2018 | 3.0–8.3% (2 surveys) | 2.90 km | — |
| AGRRA | World's End Reef-SE | 2015–2018 | 3.0–3.9% (2 surveys) | 3.72 km | — |
| AGRRA | Horseshoe Reef MPA site | 2018 | 12% | 1.18 km | — |
| AGRRA | Horse Shoe Reef | 2019 | 11% | 1.20 km | — |
| AGRRA | TaiChi Reef | 2019 | 13% | 1.67 km | — |
Data & links
All images from Coral Reef Diagnostics. Data on this page are from the organizations named in the data sources above, not Coral Reef Diagnostics; Coral Reef Diagnostics has no coral cover estimate of its own at this site.
© Coral Reef Diagnostics.
References
- Deschamps A, Desrochers A, Klomp KD (2003). St. Vincent. A Rapid Assessment of the Horseshoe Reef, Tobago Cays Marine Park, St. Vincent, West Indies (Stony Corals, Algae and Fishes). Atoll Research Bulletin 496:438-459. DOI
- Gonzalez-Rivero M, et al. (2019). Seaview Survey photo-quadrat and image classification dataset. The University of Queensland (UQ eSpace) data collection. DOI