
Regional summary of 4 dive sites. Figures are averages across the sites that report them (n = sites with a value); each site's own page has its individual values.
⬇ Download this region as a report card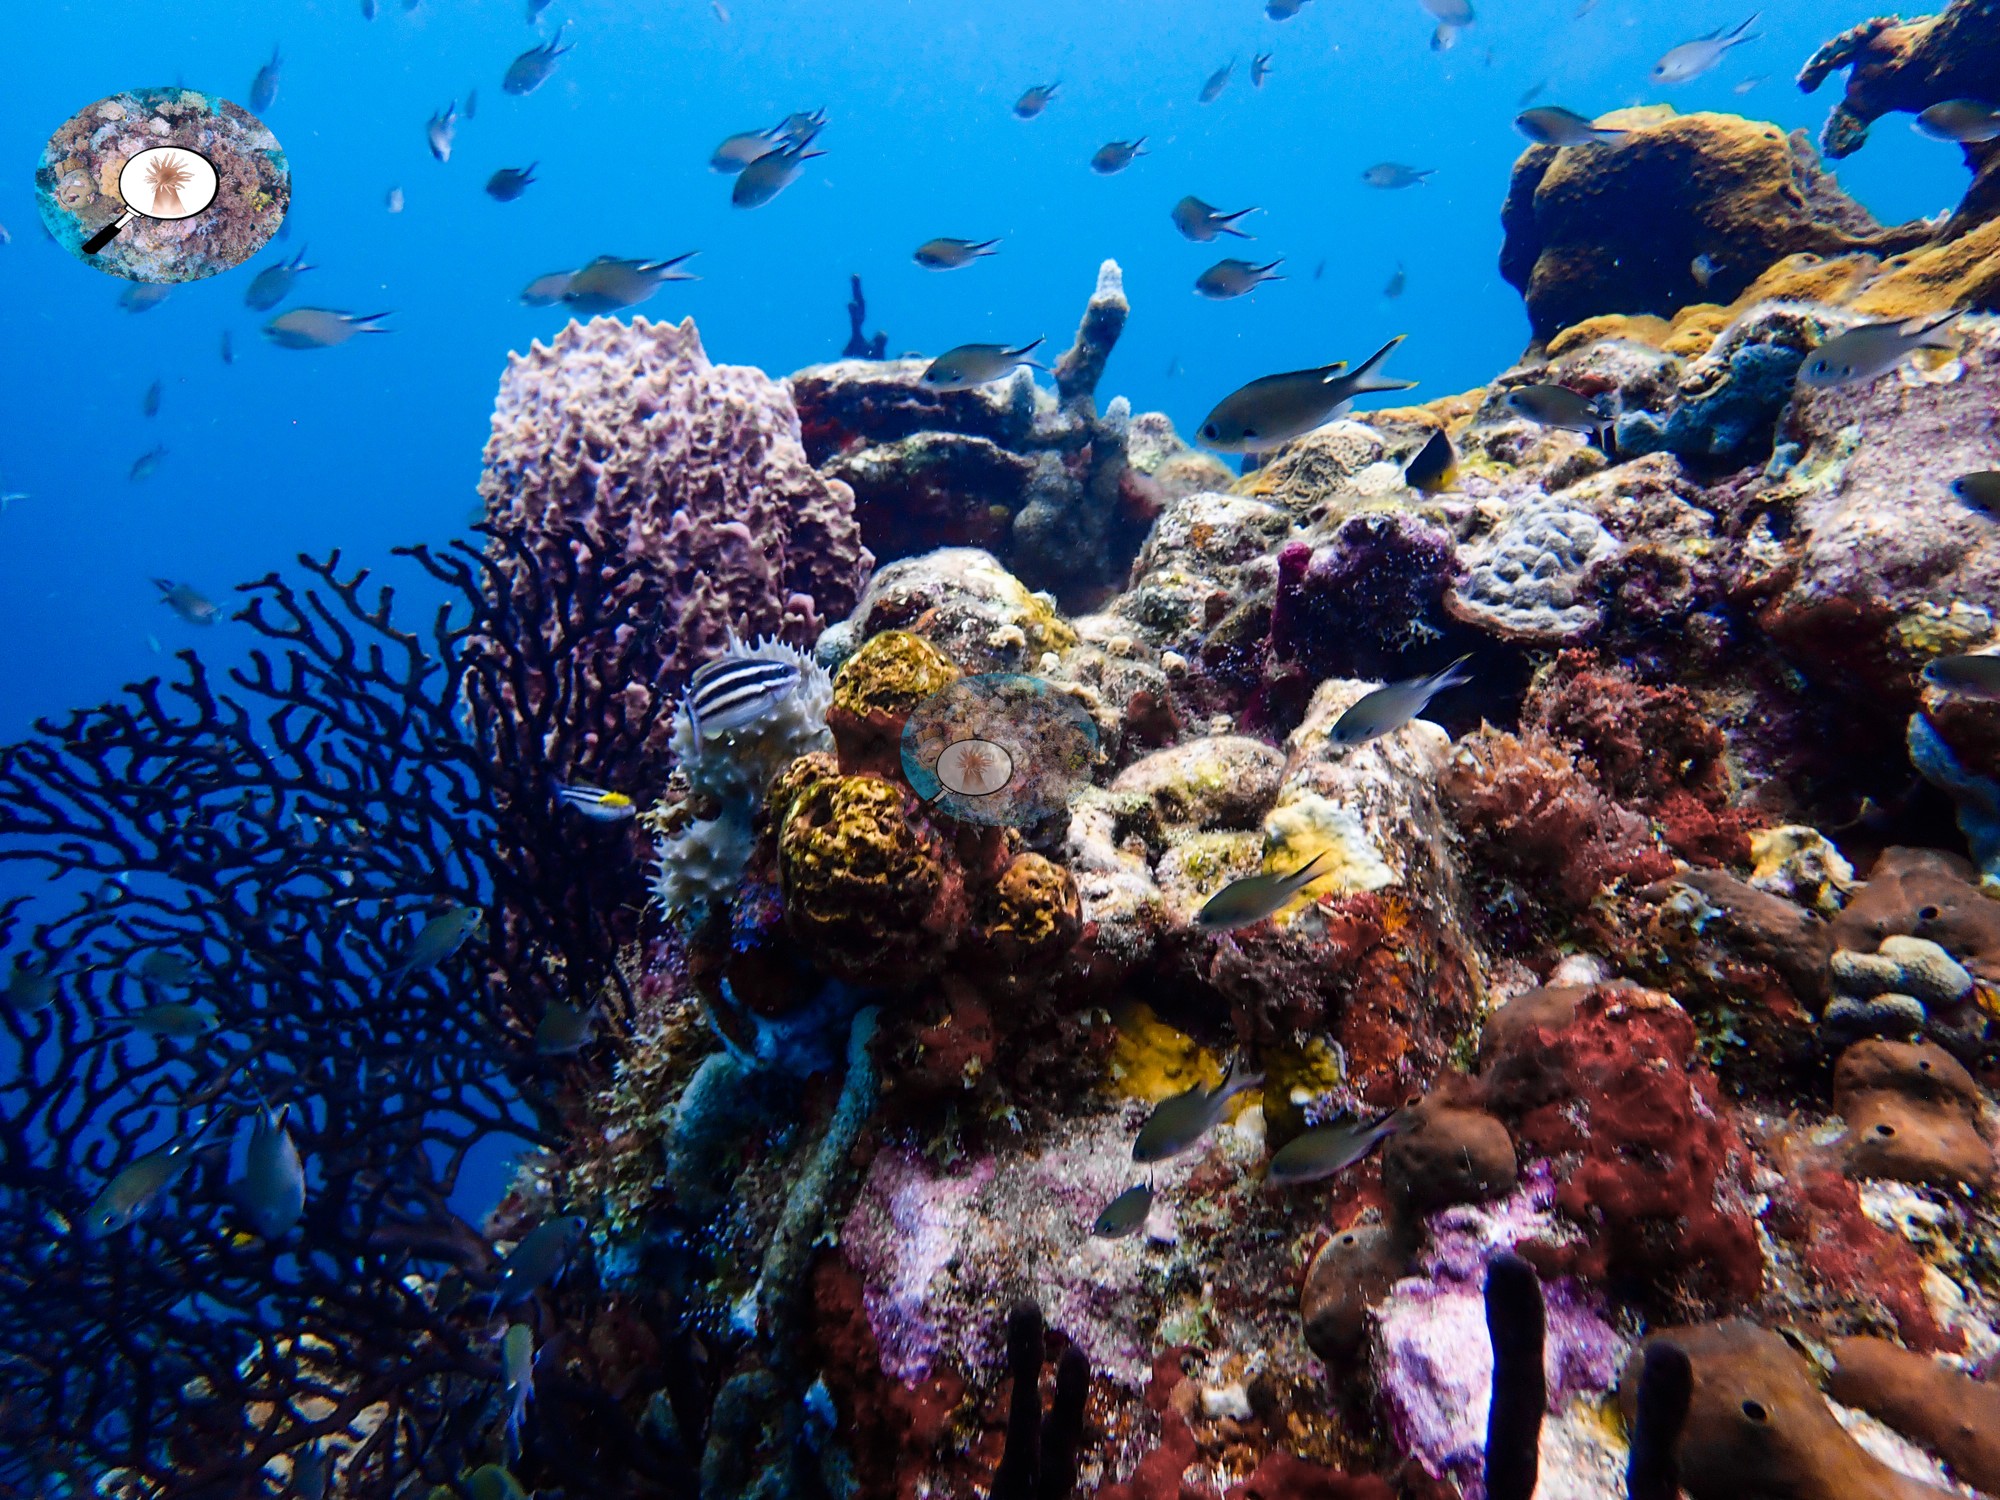

St. Lucia's June 2022 dives and snorkels, at the Pitons, Anse Chastanet, and Pigeon Island, show reefs dominated more by sponges than by stony corals. Soufriere Pinnacles is the most complex, with a coral-packed ridge, though fresh white tissue-loss lesions appeared on several large corals there.
Heat stress
Long-term record: 12 years since 1985 reached 8 or more °C-weeks at NOAA’s Windward Caribbean Islands station. Download the annual DHW data (CSV).
4 sites in this region — click a marker to open that site.
Regional setting
St. Lucia, one of the northern Windward Islands, is a rugged, mainly volcanic island with minor limestone outcrops on its leeward side, and its insular shelf is only about 100 m wide along the middle of the west coast but broadens to roughly 5 km off the island's other coasts (Wells 1988). Reefs occur on every coast, yet Wells (1988) describes them as generally small and young in development, most numerous in the east and south, where sediment-laden streams have less influence. The larger west-coast reefs lie around Anse Cochon, Anse Chastanet, and the Pitons near Soufrière, where strong north-flowing currents support rich coral communities on the steep underwater flanks of Gros Piton. Off Anse Chastanet and the Pitons, a shallow plateau gives way to a reef edge at 8–11 m, well-developed Acropora zones are absent, and the barrel sponge Xestospongia muta is often more conspicuous than the corals; about 40 coral species had been recorded from the southeast and west coasts. Dredging for the 1970s causeway to Pigeon Island caused serious beach erosion and left the reefs there badly degraded, although good stands of A. cervicornis persisted. Hurricane Allen damaged the island's reefs in 1980, and Diadema died off in 1983. Spalding et al. (2001) add that the reefs often form only a thin layer over volcanic rock, that some Soufrière reefs held up to 50% live coral before Hurricane Lenny struck in 1999, and estimate St. Lucia's reef area at about 160 km².
Souter et al. (2021) report recent trends only for the Eastern and Southern Caribbean as a whole, a subregion that groups the Lesser Antilles with Trinidad and Tobago, Aruba, Bonaire, Curaçao, and Venezuela. Across it, mean hard coral cover fell from about 26.2% in 1999 to 14.5% in 2019, the largest decline among the five Caribbean subregions, while algal cover nearly tripled between 1987 and 2019 to reach 48.3%. For the Caribbean as a whole, the same report links these losses to the 2005 mass bleaching, hurricanes, polluted, and nutrient-enriched coastal water, and overfishing of herbivores such as parrotfishes, and it names invasive lionfish, Sargassum influxes since 2011, and stony coral tissue loss disease (SCTLD) as newer threats; SCTLD, first seen in Florida in 2014, had been confirmed in 19 Caribbean countries and territories by October 2021. Earlier, Wilkinson (2006), drawing on the 2004 Caribbean Reefs at Risk assessment, placed the Lesser Antilles among the areas most threatened by coastal development and singled out its high islands for land-based pollution and sediment.
Overview
The St. Lucia unit covers four sites visited between 26 and 30 June 2022. Two are dives at the Pitons, inside the Soufriere Marine Management Area, both on 26 June: Superman's Flight (19.5 m) and Soufriere Pinnacles (20.4 m). The other two are snorkels, at Anse Chastanet near Soufriere on 27 June and at Pigeon Island in the north on 30 June. Sponges dominate these reefs more than stony corals do, and the four sites differ sharply in structure.
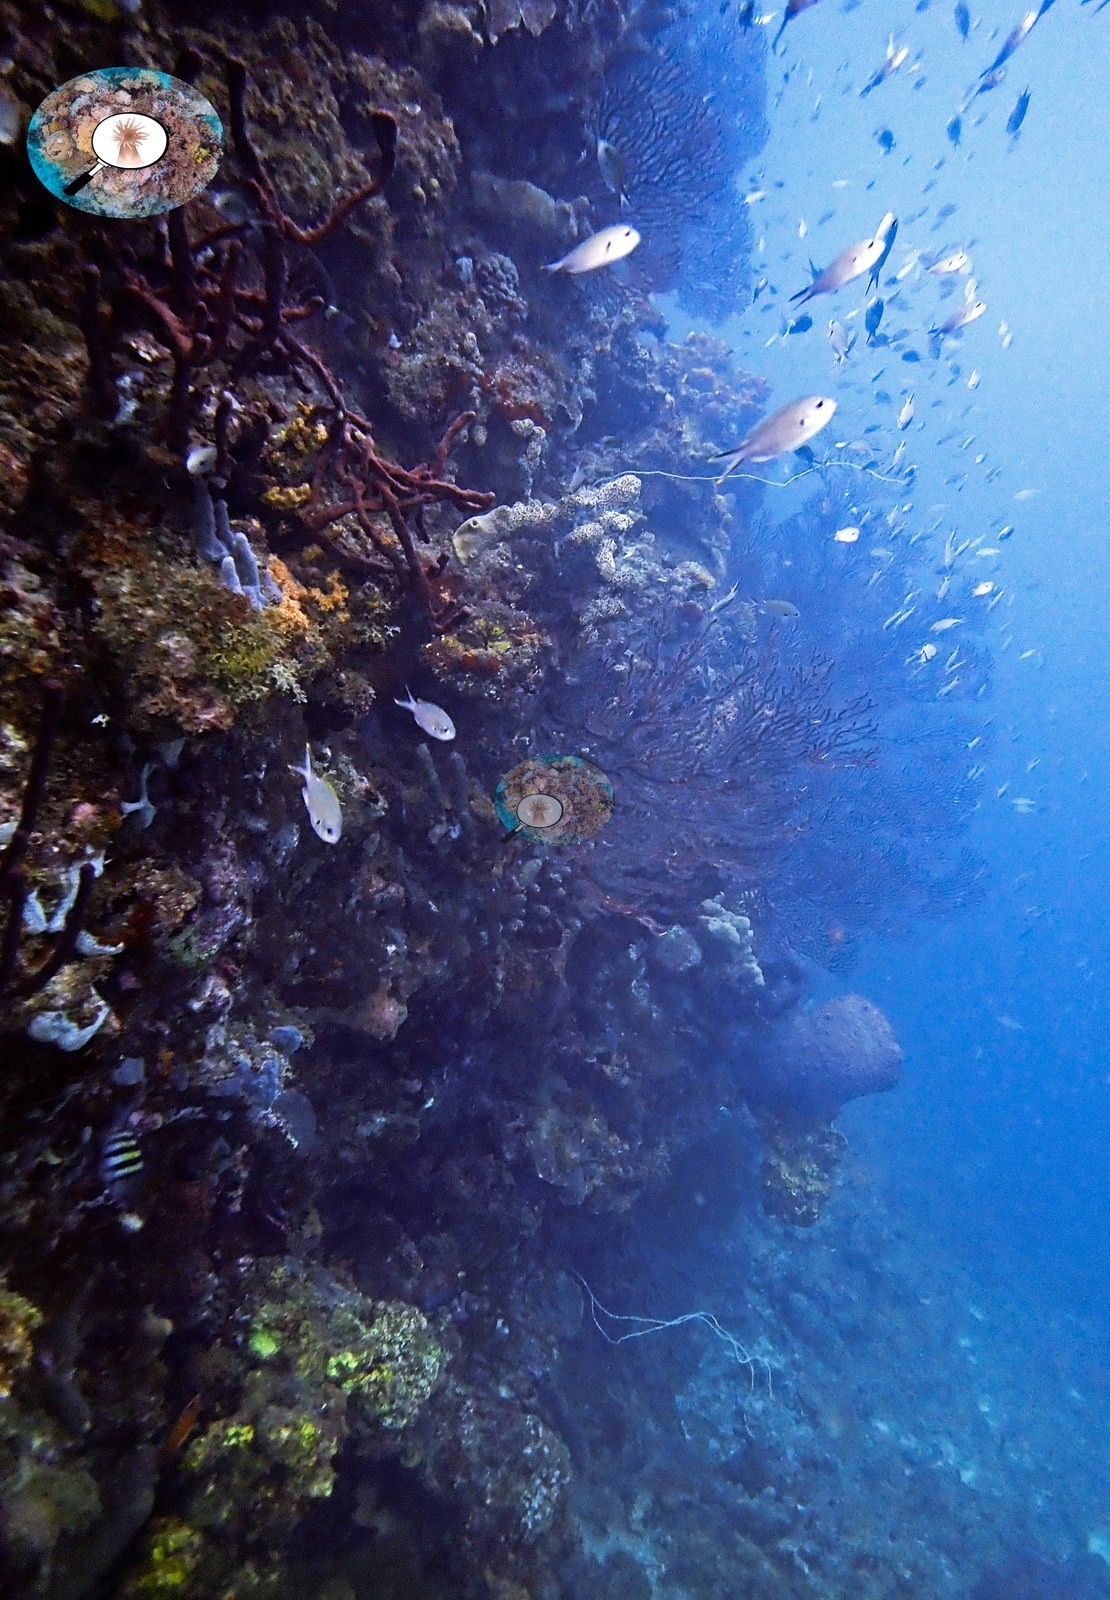
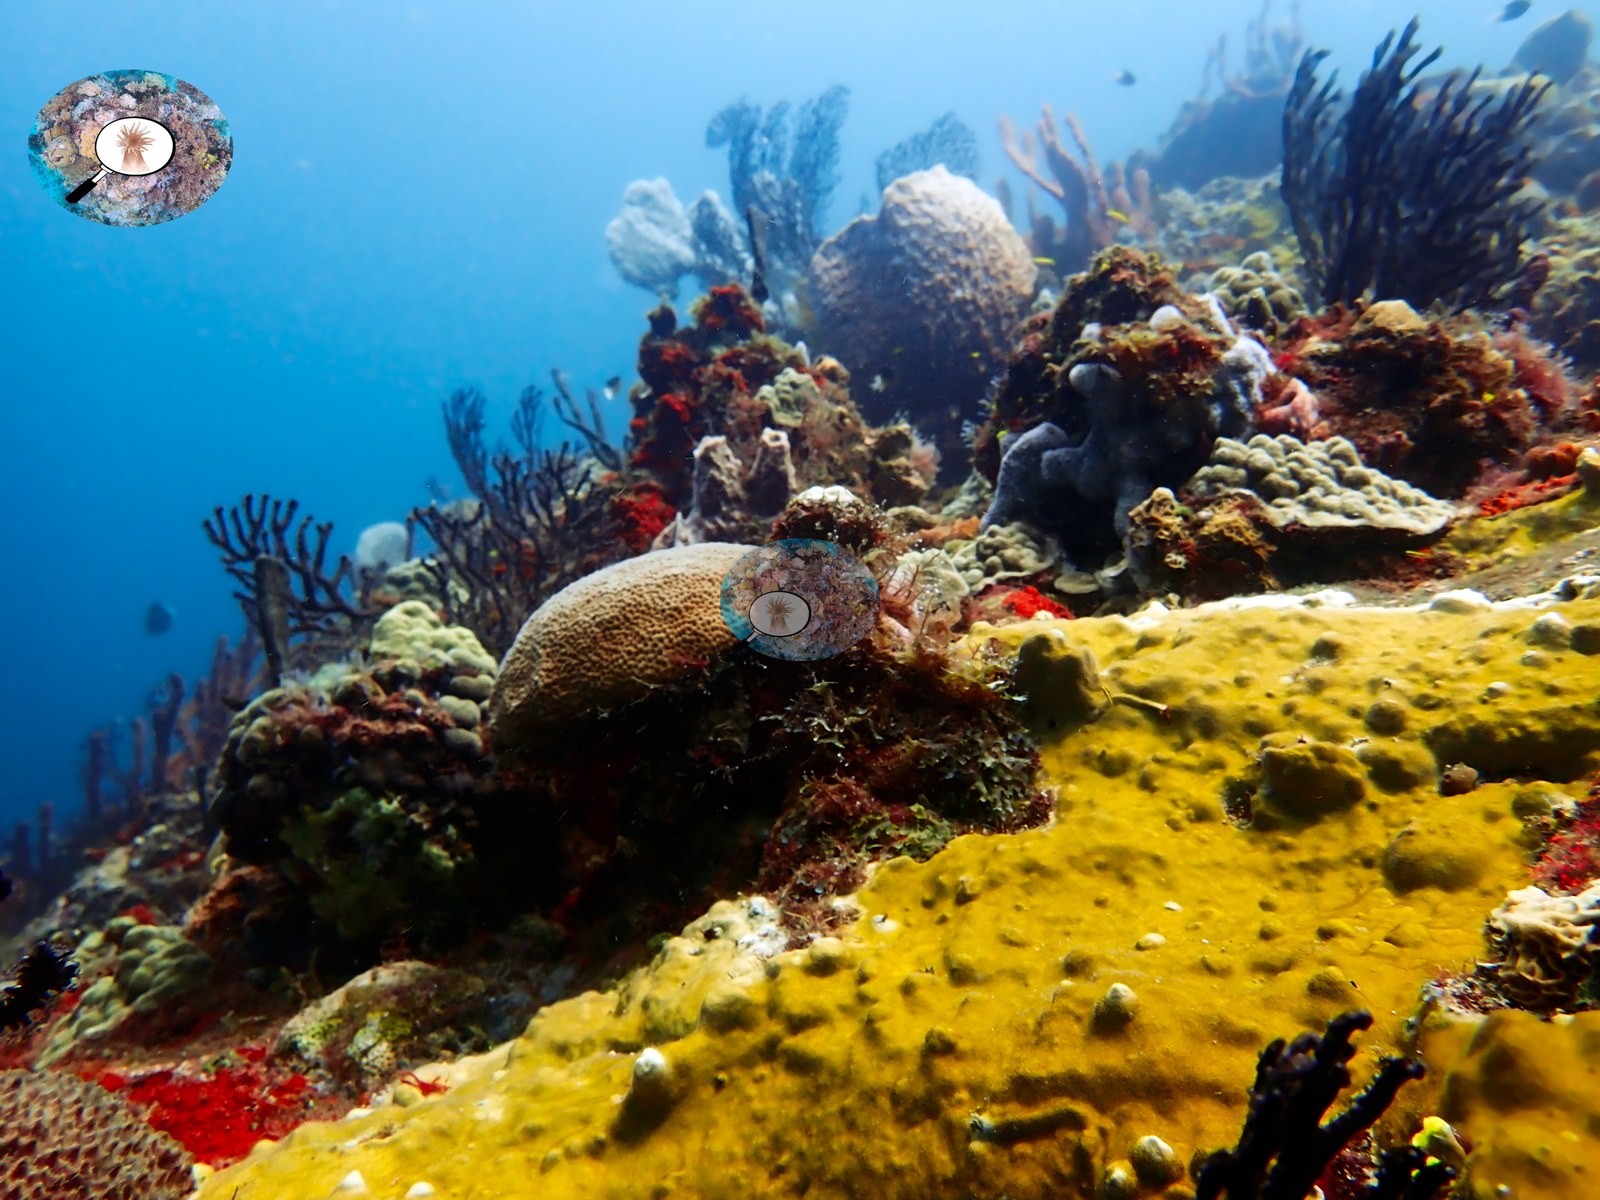
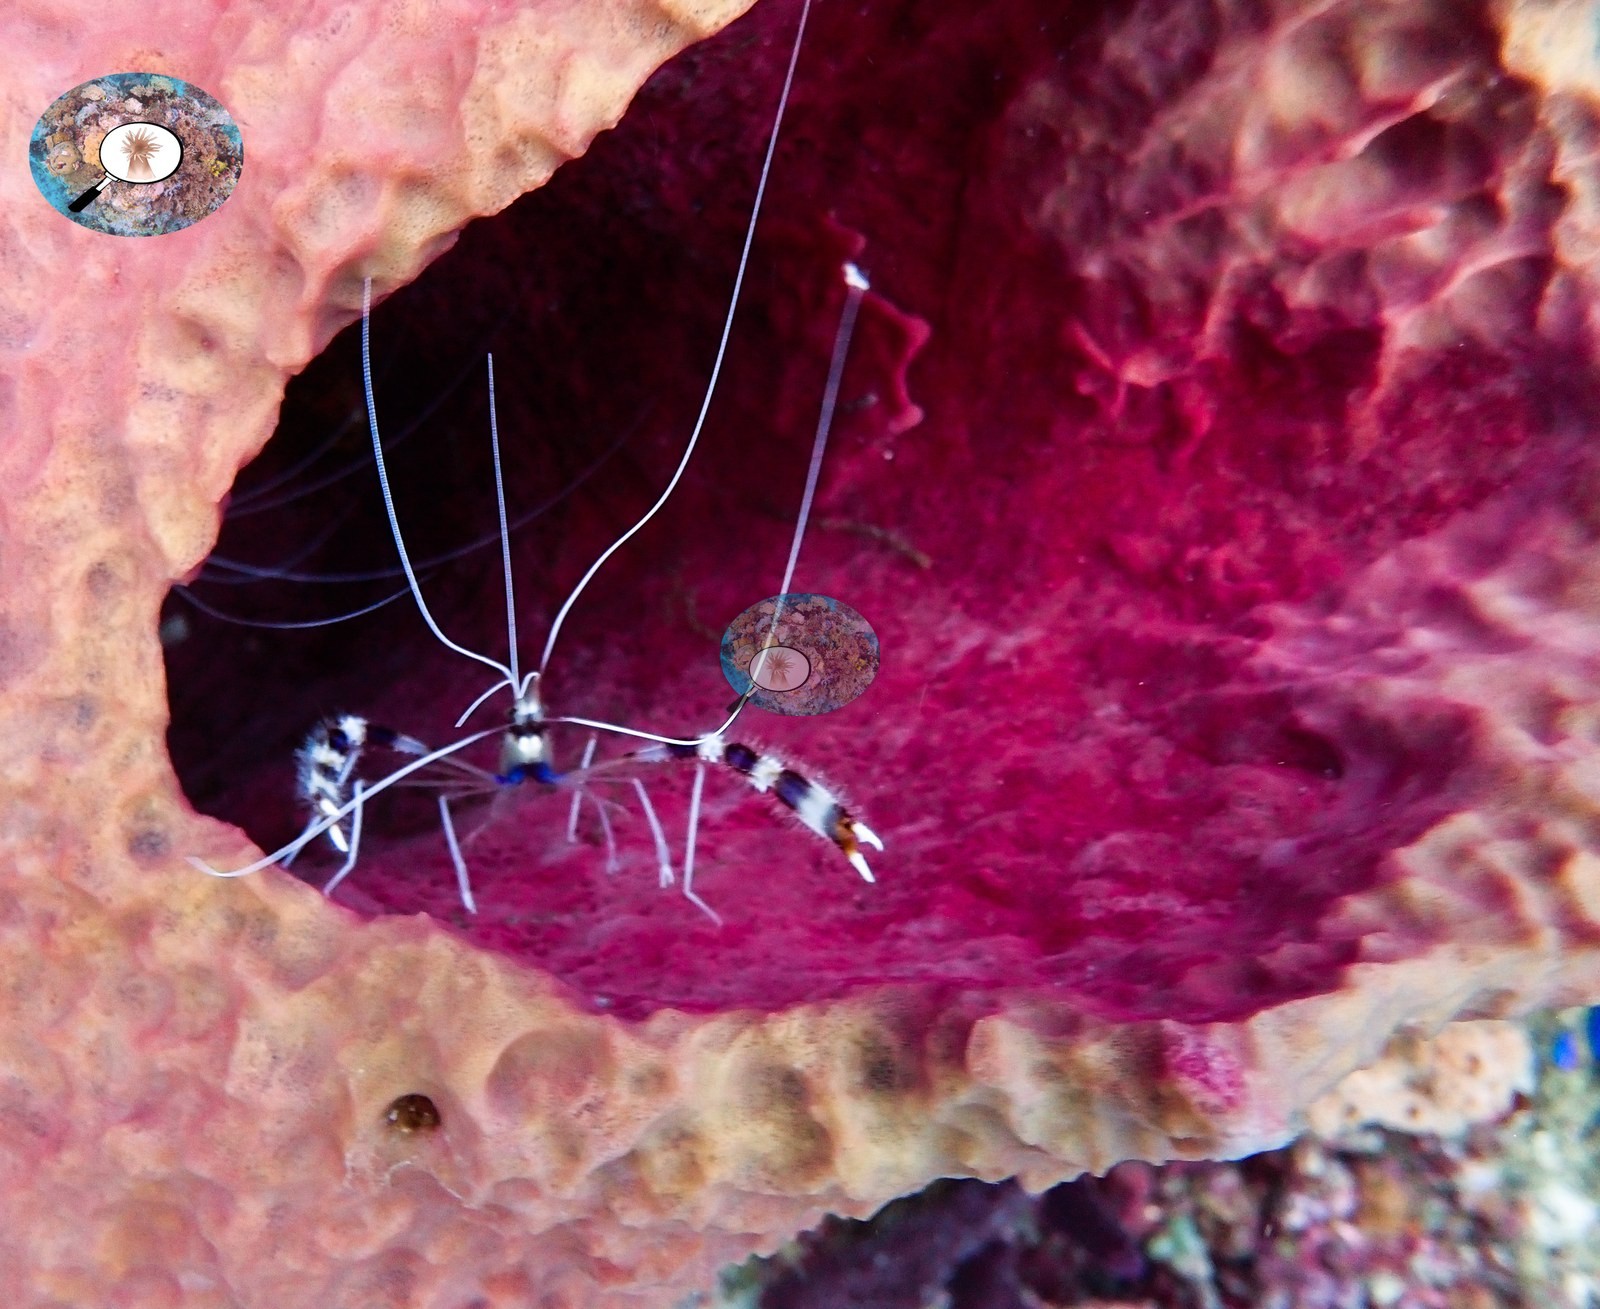
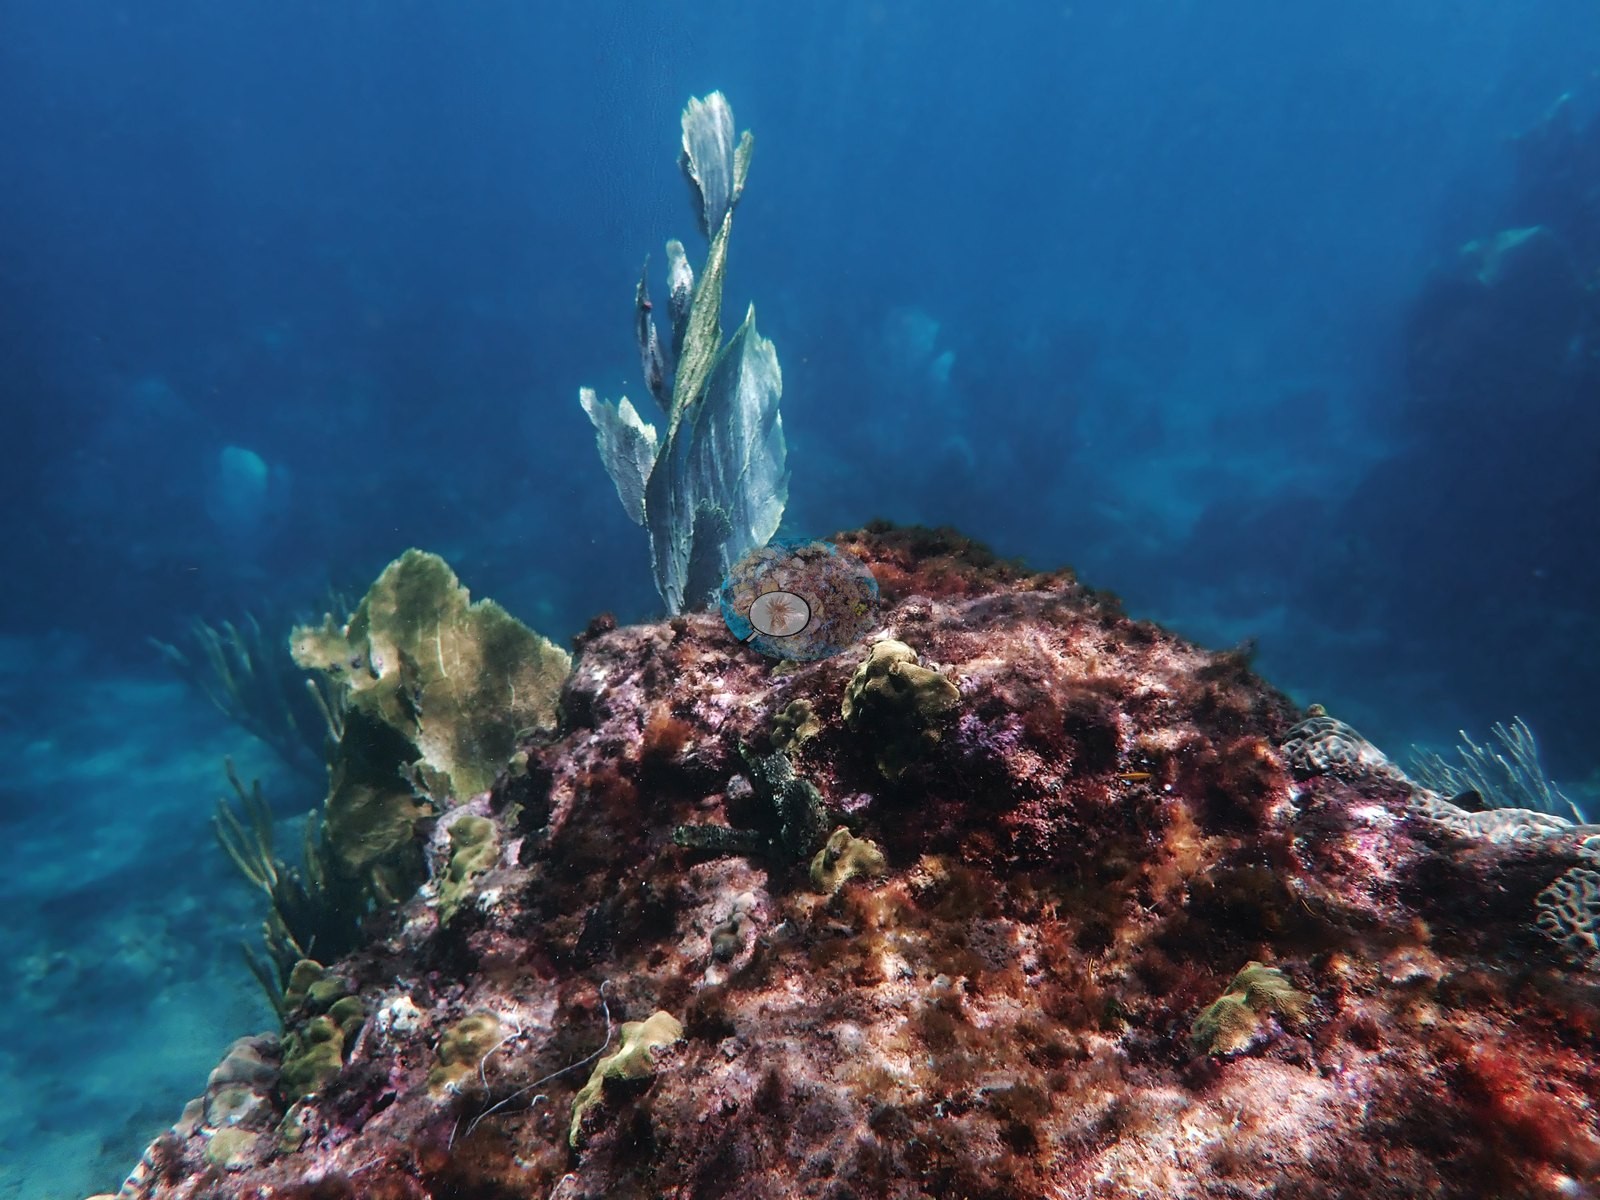
Superman's Flight is a drift dive along the steep submerged base of Petit Piton, logged at 19.5 m. The slope is covered in sponges: meter-wide barrel sponges, tube-sponge clusters, and yellow and orange encrusting sheets, with black-coral whips and gorgonians leaning into the current. Stony corals are only a minor component. Soufriere Pinnacles, at the foot of Gros Piton (20.4 m), is the most structurally complex site. Boulders, near-vertical faces, and narrow sand-floored passages lead up to a densely colonized ridge of massive and plating corals that is swarming with small planktivorous fish. Its steeper faces carry giant barrel sponges and large sea fans.
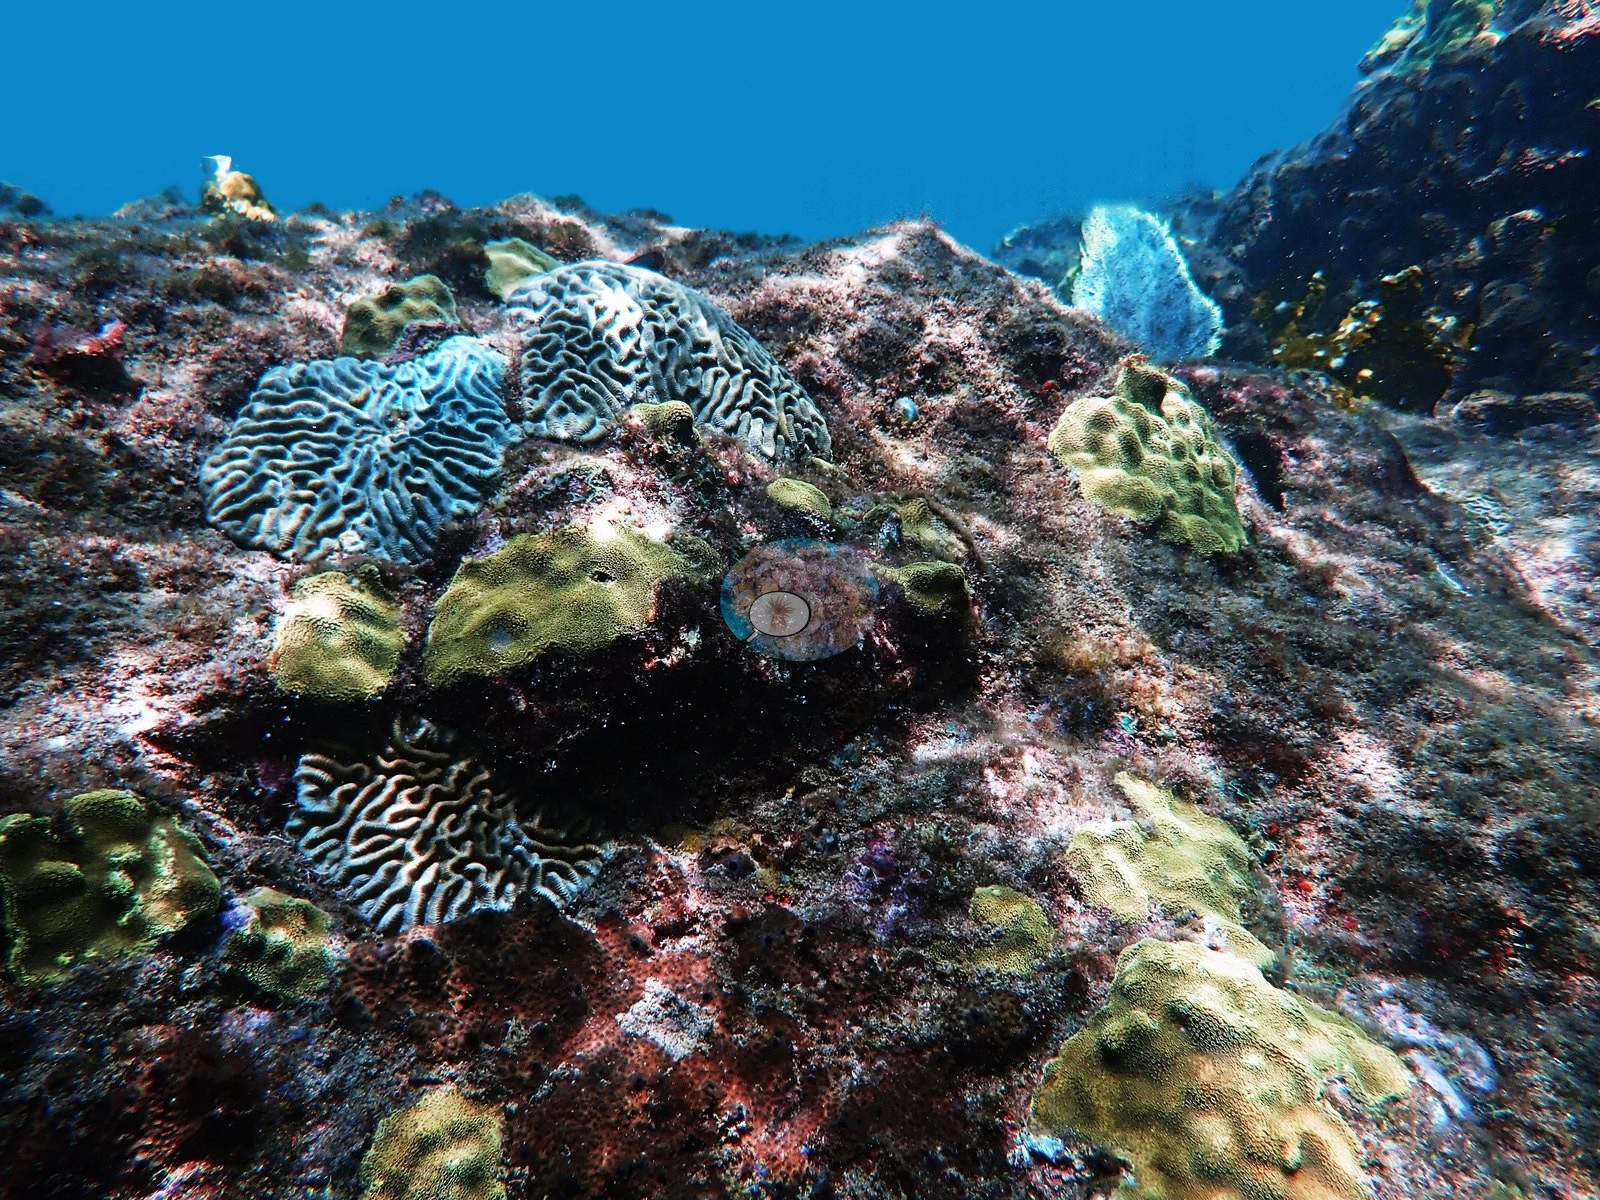
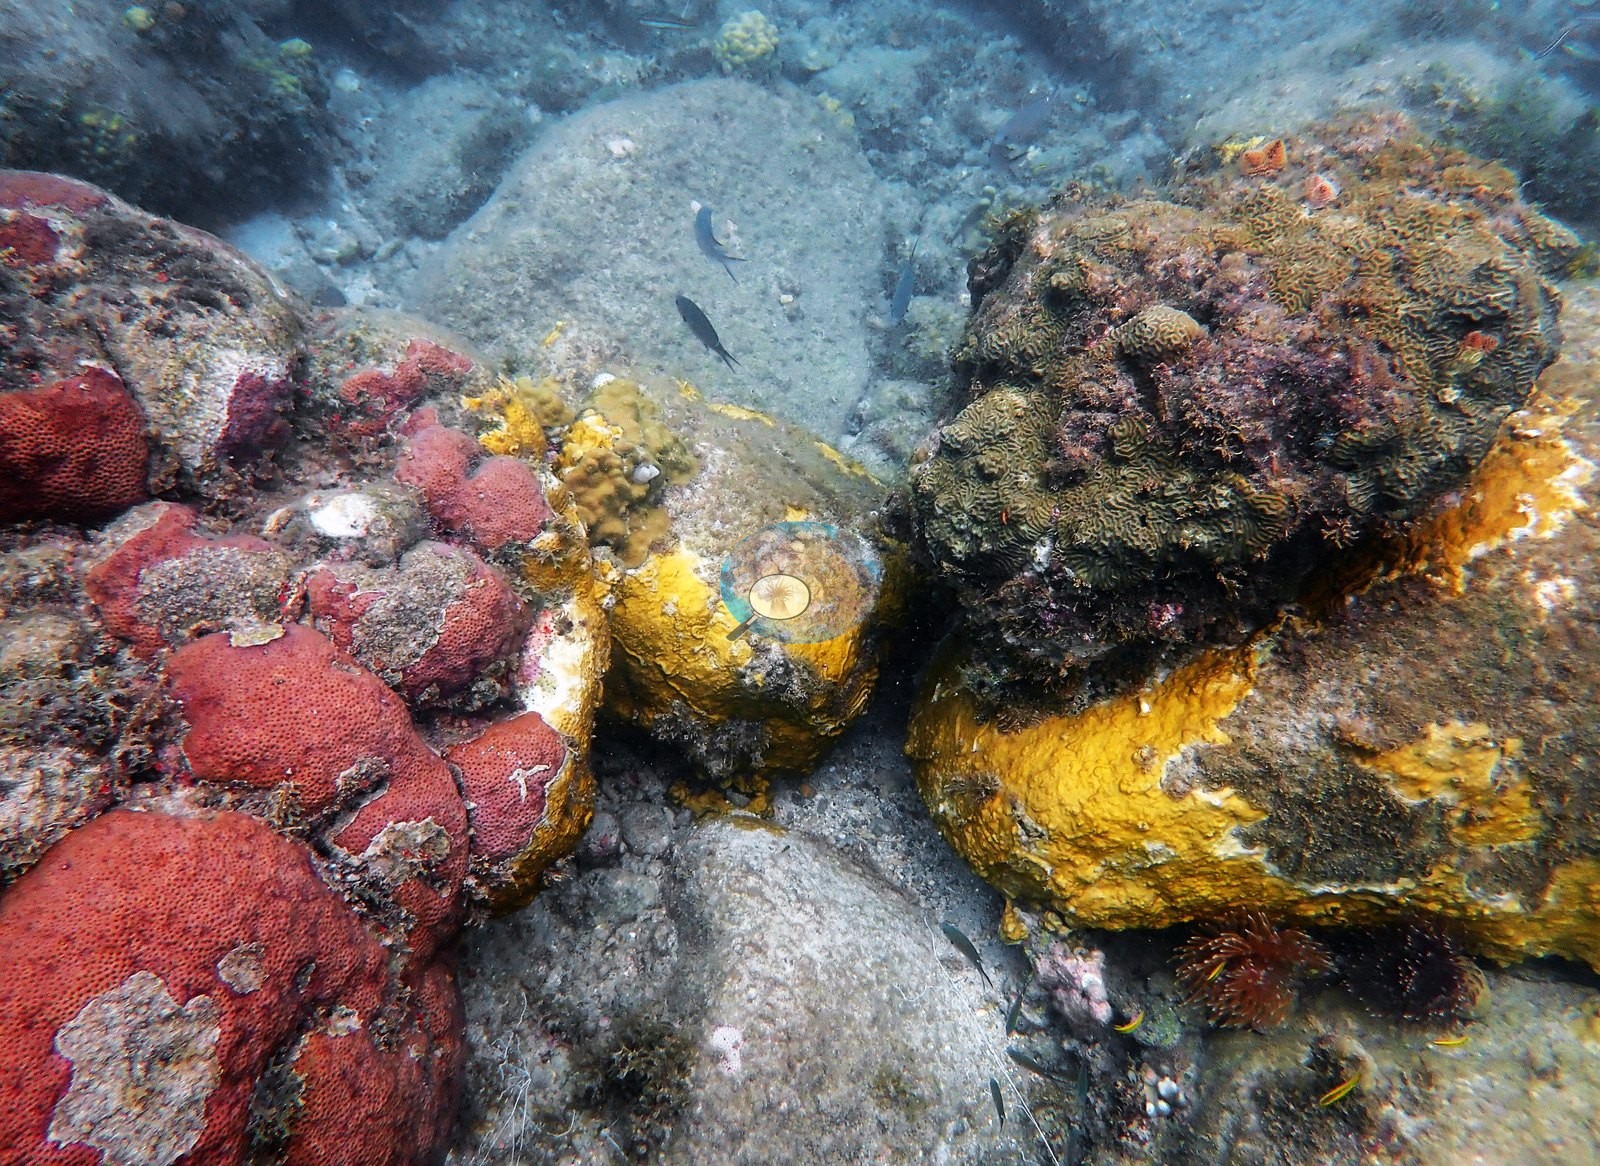
The two snorkel sites are shallower and more mixed. At Anse Chastanet, the resort jetty pilings are the most coral-covered surface, with dinner-plate brain corals and star corals growing directly on the wood, while the nearby natural rocky reef is low-relief and dominated by turf. At Pigeon Island, a nearshore rocky reef in turbid water, coral is scattered among turf, sediment, and sponge. The healthiest patches there are continuous mounds of finger coral and an intact brain coral about half a meter across, and long-spined Diadema urchins were photographed. Blind Claude computer-vision point counts of Anderson's edited photographs put coral cover at 13% at Pigeon Island, 11% at Soufriere Pinnacles, 9.0% at Superman's Flight, and 7.8% at Anse Chastanet, where all 36 photos count, including the jetty pilings and open sand; the medians are lower (10%, 5.0%, 5.0%, and 0%) because a few colony-focused photos raise the means. Condition notes across the unit include fresh white tissue-loss lesions on several large corals at Soufriere Pinnacles, discrete white patches on massive colonies at Anse Chastanet, and recent partial mortality at Pigeon Island.
Highlights
- Soufriere Pinnacles: high-relief boulders, walls, and canyons with a coral-packed ridge at the foot of Gros Piton
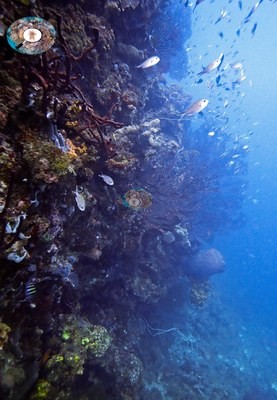 photo: St. Lucia - Soufriere Pinnacles
 - Superman's Flight: sponge-dominated drift along Petit Piton's base, with black-coral whips
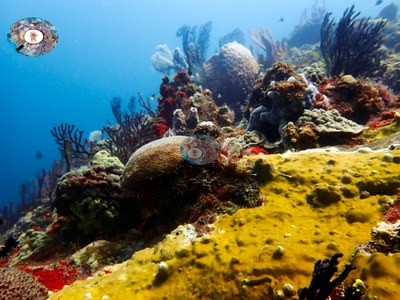 photo: St. Lucia - Superman's Flight
 - Anse Chastanet: the resort jetty pilings carry more coral than the natural Anse Chastanet Reef beside them
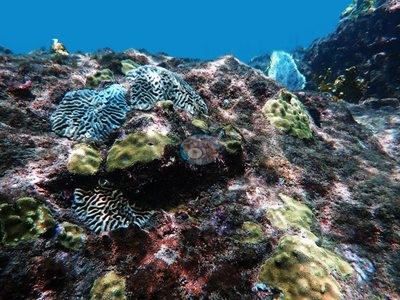 photo: St. Lucia - Anse Chastanet
 - Pigeon Island: finger-coral mounds and Diadema urchins on a turbid nearshore reef
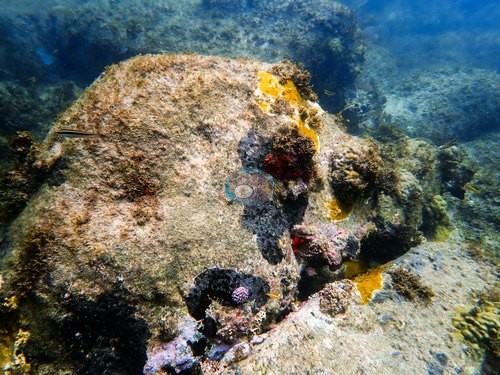 photo: St. Lucia - Pigeon Island
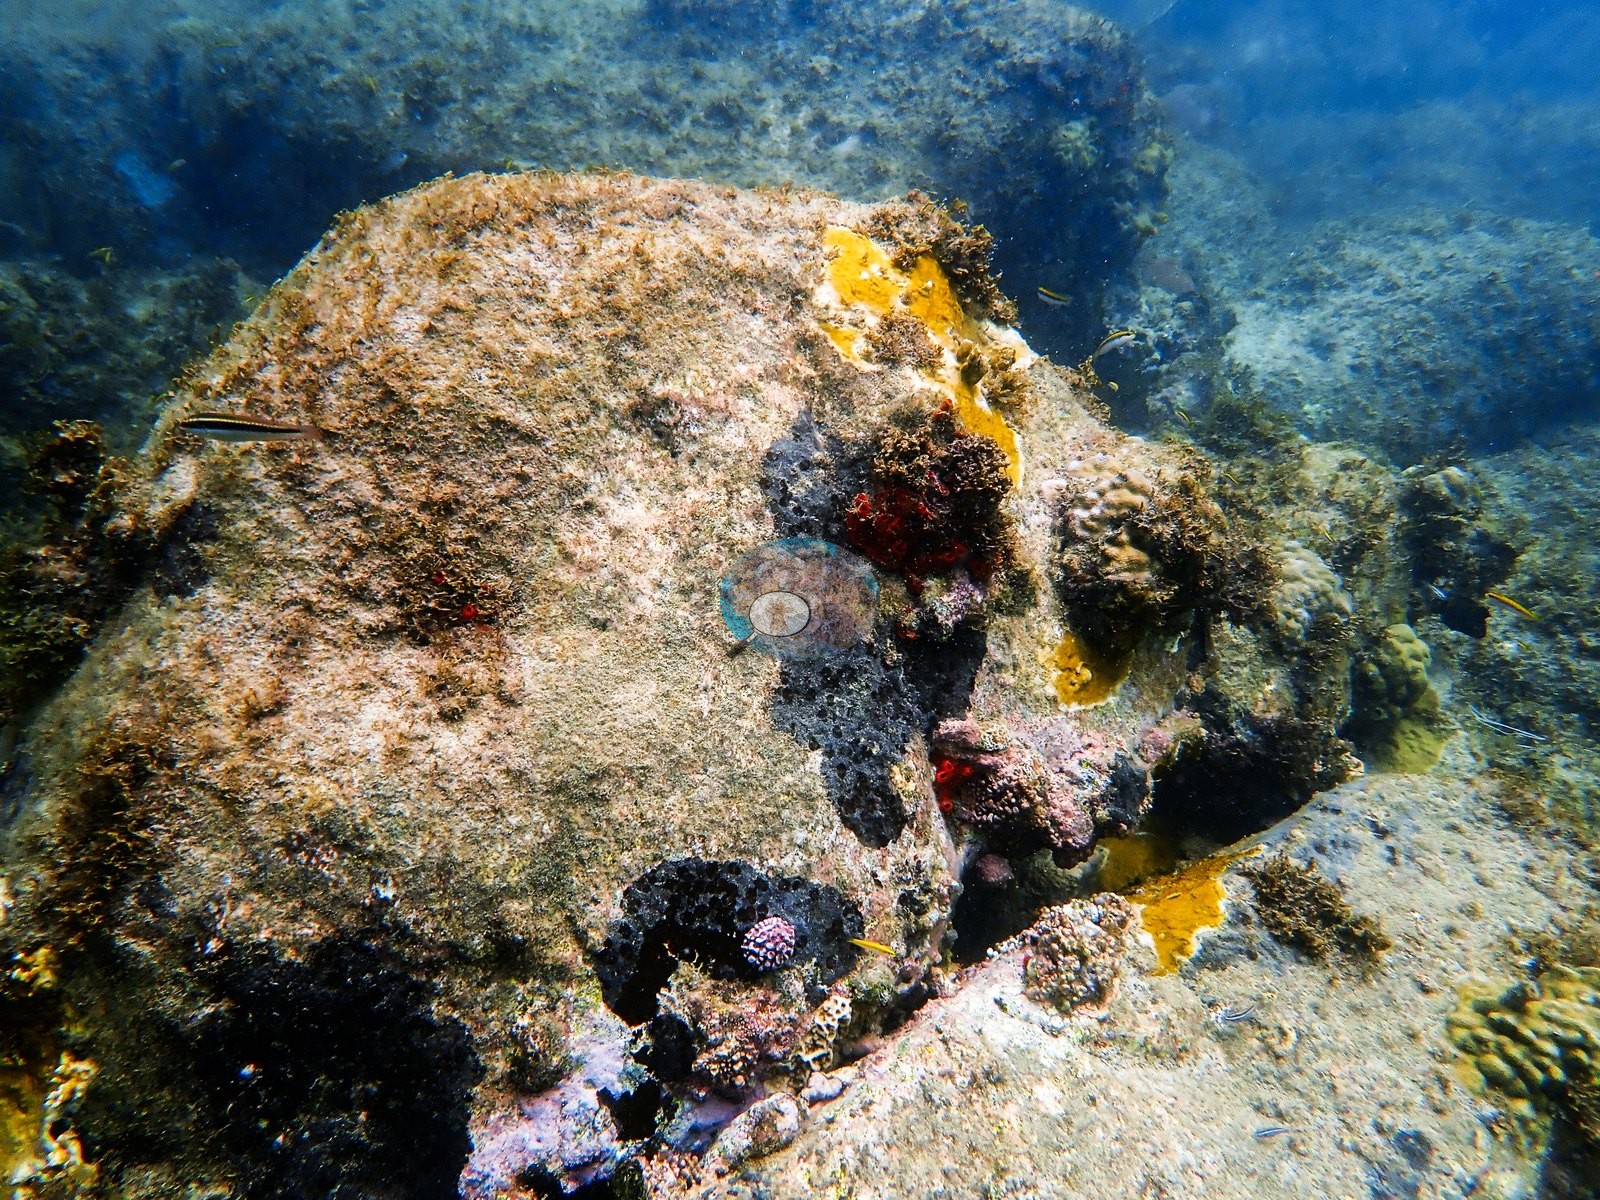
Notable observations
- St. Lucia - Soufriere Pinnacles: several large corals carry fresh white tissue-loss lesions; old broken staghorn rubble conspicuous in places
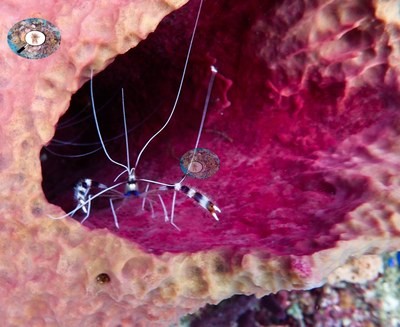
- St. Lucia - Anse Chastanet: two frames show sharply defined white patches on otherwise pigmented massive colonies, read as localized tissue loss; cause not determinable from photographs
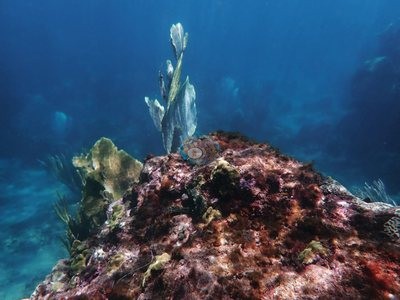
- St. Lucia - Pigeon Island: pale patches of recent partial mortality on several massive colonies; turf overgrowing a brain coral; an algal-colonized basal scar
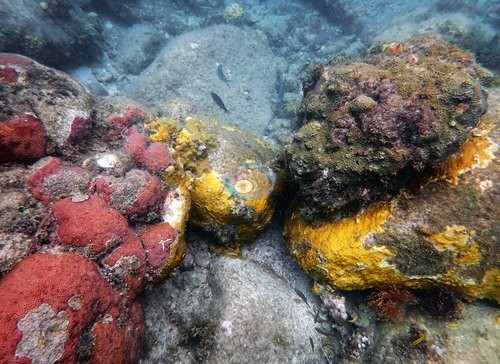
Coral cover over time (pooled)
Sites in this region
- St. Lucia - Anse Chastanet — 7.8% coral cover
- St. Lucia - Pigeon Island — 13% coral cover
- St. Lucia - Soufriere Pinnacles — 11% coral cover
- St. Lucia - Superman's Flight — 9.0% coral cover
Nearby external survey stations
57 independent survey records within 5 km of a site in this region (each record counted once).
Show all 57 records
- Reef Check — Anse Chastanet Reef (1999): 34% hard coral cover, 0.00 km from St. Lucia - Anse Chastanet
- Reef Check — Anse Chastanet Reef (2003): 14% hard coral cover, 0.00 km from St. Lucia - Anse Chastanet
- Reef Check — Anse Chastanet Reef (2004): 18% hard coral cover, 0.00 km from St. Lucia - Anse Chastanet
- Reef Check — Anse Chastanet Reef (2004): 17% hard coral cover, 0.00 km from St. Lucia - Anse Chastanet
- Reef Check — Anse Chastanet Reef (2006): 24% hard coral cover, 0.00 km from St. Lucia - Anse Chastanet
- Reef Check — Anse Chastanet Reef (2006): 36% hard coral cover, 0.92 km from St. Lucia - Anse Chastanet
- Reef Check — Coral Garden (2014): 3.8% hard coral cover, 1.98 km from St. Lucia - Superman's Flight
- Reef Check — Coral Gardens (1999): 38% hard coral cover, 1.86 km from St. Lucia - Superman's Flight
- Reef Check — Coral Gardens (1999): 22% hard coral cover, 1.86 km from St. Lucia - Superman's Flight
- Reef Check — Coral Gardens (2000): 12% hard coral cover, 1.86 km from St. Lucia - Superman's Flight
- Reef Check — Coral Gardens (2001): 8.4% hard coral cover, 1.86 km from St. Lucia - Superman's Flight
- Reef Check — Coral Gardens (2003): 9.4% hard coral cover, 2.59 km from St. Lucia - Superman's Flight
- Reef Check — Coral Gardens (2004): 5.3% hard coral cover, 2.59 km from St. Lucia - Superman's Flight
- Reef Check — Coral Gardens (2006): 30% hard coral cover, 1.86 km from St. Lucia - Superman's Flight
- Reef Check — Grande Caille (2008): 4.6% hard coral cover, 0.60 km from St. Lucia - Anse Chastanet
- Reef Check — Grande Caille (2008): 12% hard coral cover, 0.60 km from St. Lucia - Anse Chastanet
- Reef Check — Grande Caille (2009): 14% hard coral cover, 0.60 km from St. Lucia - Anse Chastanet
- Reef Check — Grande Caille (2010): 18% hard coral cover, 0.60 km from St. Lucia - Anse Chastanet
- Reef Check — Grande Caille (2014): 6.9% hard coral cover, 0.60 km from St. Lucia - Anse Chastanet
- Reef Check — Le Sport Reef (2003): 15% hard coral cover, 1.39 km from St. Lucia - Pigeon Island
- Reef Check — Le Sport Reef (2003): 11% hard coral cover, 1.39 km from St. Lucia - Pigeon Island
- Reef Check — Le Sport Reef (2004): 8.8% hard coral cover, 1.39 km from St. Lucia - Pigeon Island
- Reef Check — Le Sport Reef (2006): 9.4% hard coral cover, 1.39 km from St. Lucia - Pigeon Island
- Reef Check — Malgretoute (1999): 43% hard coral cover, 0.89 km from St. Lucia - Superman's Flight
- Reef Check — Malgretoute (1999): 21% hard coral cover, 0.89 km from St. Lucia - Superman's Flight
- Reef Check — Malgretoute (2001): 13% hard coral cover, 0.89 km from St. Lucia - Superman's Flight
- Reef Check — Malgretoute (2003): 18% hard coral cover, 1.15 km from St. Lucia - Soufriere Pinnacles
- Reef Check — Malgretoute (2004): 13% hard coral cover, 1.15 km from St. Lucia - Soufriere Pinnacles
- Reef Check — Malgretoute (2004): 16% hard coral cover, 1.15 km from St. Lucia - Soufriere Pinnacles
- Reef Check — Malgretoute (2005): 21% hard coral cover, 0.89 km from St. Lucia - Superman's Flight
- Reef Check — Malgretoute (2006): 16% hard coral cover, 0.89 km from St. Lucia - Superman's Flight
- Reef Check — Malgretoute (2007): 11% hard coral cover, 0.89 km from St. Lucia - Superman's Flight
- Reef Check — Malgretoute (2010): 22% hard coral cover, 0.89 km from St. Lucia - Superman's Flight
- Reef Check — Rachette Point (2005): 25% hard coral cover, 0.96 km from St. Lucia - Soufriere Pinnacles
- Reef Check — Rachette Point (2006): 22% hard coral cover, 0.96 km from St. Lucia - Soufriere Pinnacles
- Reef Check — Rachette Point (2007): 10% hard coral cover, 0.96 km from St. Lucia - Soufriere Pinnacles
- Reef Check — Rachette Point (2008): 8.8% hard coral cover, 0.96 km from St. Lucia - Soufriere Pinnacles
- Reef Check — Rachette Point (2009): 14% hard coral cover, 0.96 km from St. Lucia - Soufriere Pinnacles
- Reef Check — Rachette Point (2009): 18% hard coral cover, 0.96 km from St. Lucia - Soufriere Pinnacles
- Reef Check — Rachette Point (2010): 24% hard coral cover, 0.96 km from St. Lucia - Soufriere Pinnacles
- Reef Check — Rachette Pointe (2006): 33% hard coral cover, 0.82 km from St. Lucia - Soufriere Pinnacles
- Reef Check — Superman's Flight (2005): 18% hard coral cover, 0.59 km from St. Lucia - Superman's Flight
- Reef Check — Superman's Flight (2006): 12% hard coral cover, 0.42 km from St. Lucia - Superman's Flight
- Reef Check — Superman's Flight (2006): 7.0% hard coral cover, 0.42 km from St. Lucia - Superman's Flight
- Reef Check — Superman's Flight (2006): 16% hard coral cover, 0.59 km from St. Lucia - Superman's Flight
- Reef Check — Superman's Flight (2007): 5.3% hard coral cover, 0.42 km from St. Lucia - Superman's Flight
- Reef Check — Superman's Flight (2008): 5.0% hard coral cover, 0.82 km from St. Lucia - Superman's Flight
- Reef Check — Superman's Flight (2008): 18% hard coral cover, 0.81 km from St. Lucia - Superman's Flight
- Reef Check — Superman's Flight (2009): 17% hard coral cover, 0.82 km from St. Lucia - Superman's Flight
- Reef Check — Superman's Flight (2010): 24% hard coral cover, 0.82 km from St. Lucia - Superman's Flight
- Reef Check — Turtle Reef (1999): 39% hard coral cover, 0.21 km from St. Lucia - Anse Chastanet
- Reef Check — Turtle Reef (2000): 28% hard coral cover, 0.80 km from St. Lucia - Anse Chastanet
- Reef Check — Turtle Reef (2003): 34% hard coral cover, 0.44 km from St. Lucia - Anse Chastanet
- Reef Check — Turtle Reef (2003): 26% hard coral cover, 0.45 km from St. Lucia - Anse Chastanet
- Reef Check — Turtle Reef (2004): 18% hard coral cover, 0.44 km from St. Lucia - Anse Chastanet
- Reef Check — Turtle Reef (2006): 57% hard coral cover, 0.21 km from St. Lucia - Anse Chastanet
- Reef Check — Turtle Reef (2006): 48% hard coral cover, 0.21 km from St. Lucia - Anse Chastanet
All images from Coral Reef Diagnostics. Data are from Coral Reef Diagnostics and Reef Check Foundation.
 © Coral Reef Diagnostics.
References
- Souter D, et al. (eds) (2021) Status of Coral Reefs of the World: 2020. International Coral Reef Initiative / Global Coral Reef Monitoring Network. [PDF]
- Spalding MD, et al. (2001) World Atlas of Coral Reefs. University of California Press, Berkeley. [PDF]
- Wells SM (ed.) (1988) Coral Reefs of the World. Volume 1: Atlantic and Eastern Pacific. UNEP/IUCN, Cambridge. [PDF]
- Wilkinson C (2006) Status of coral reefs of the world: summary of threats and remedial action. In: Côté IM, Reynolds JD (eds) Coral Reef Conservation. Cambridge University Press, Cambridge. [PDF]