Coral Reef Diagnostics

St. Eustatius

NOAA Coral Reef Watch

Regional summary of 4 dive sites. Figures are averages across the sites that report them (n = sites with a value); each site's own page has its individual values.

⬇ Download this region as a report card
05
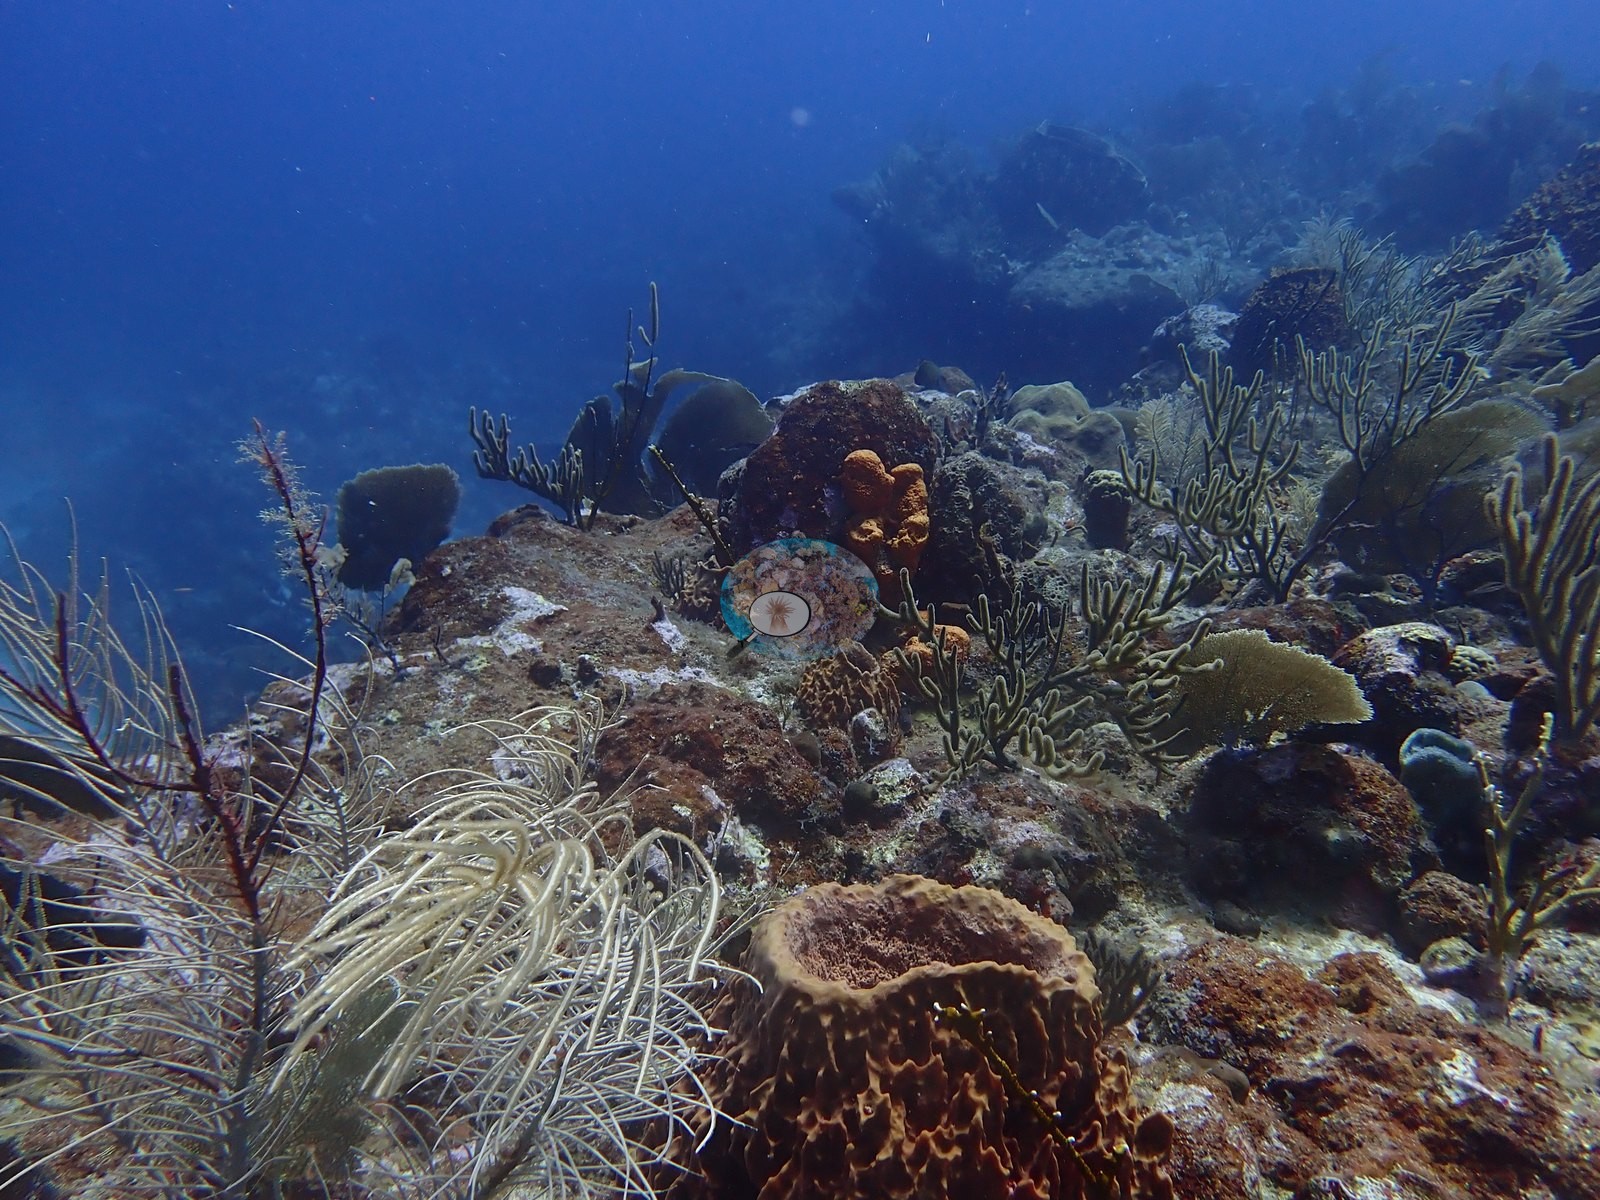
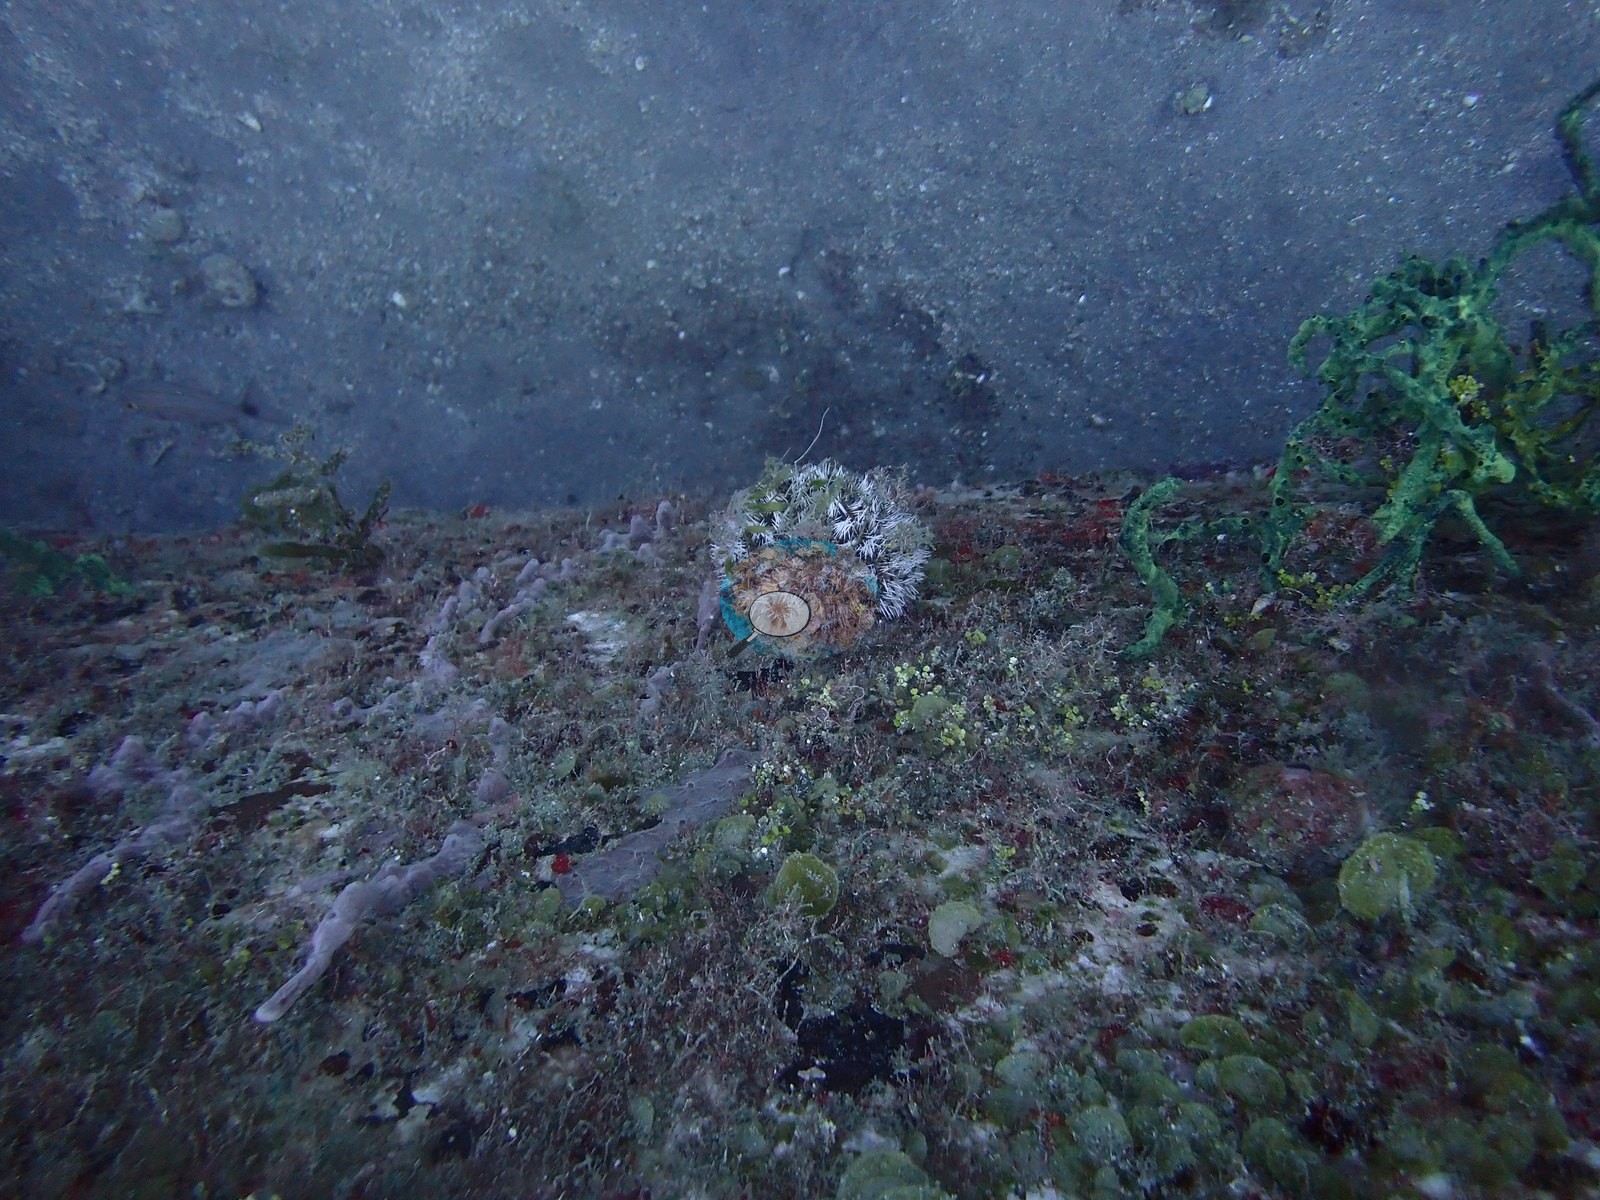
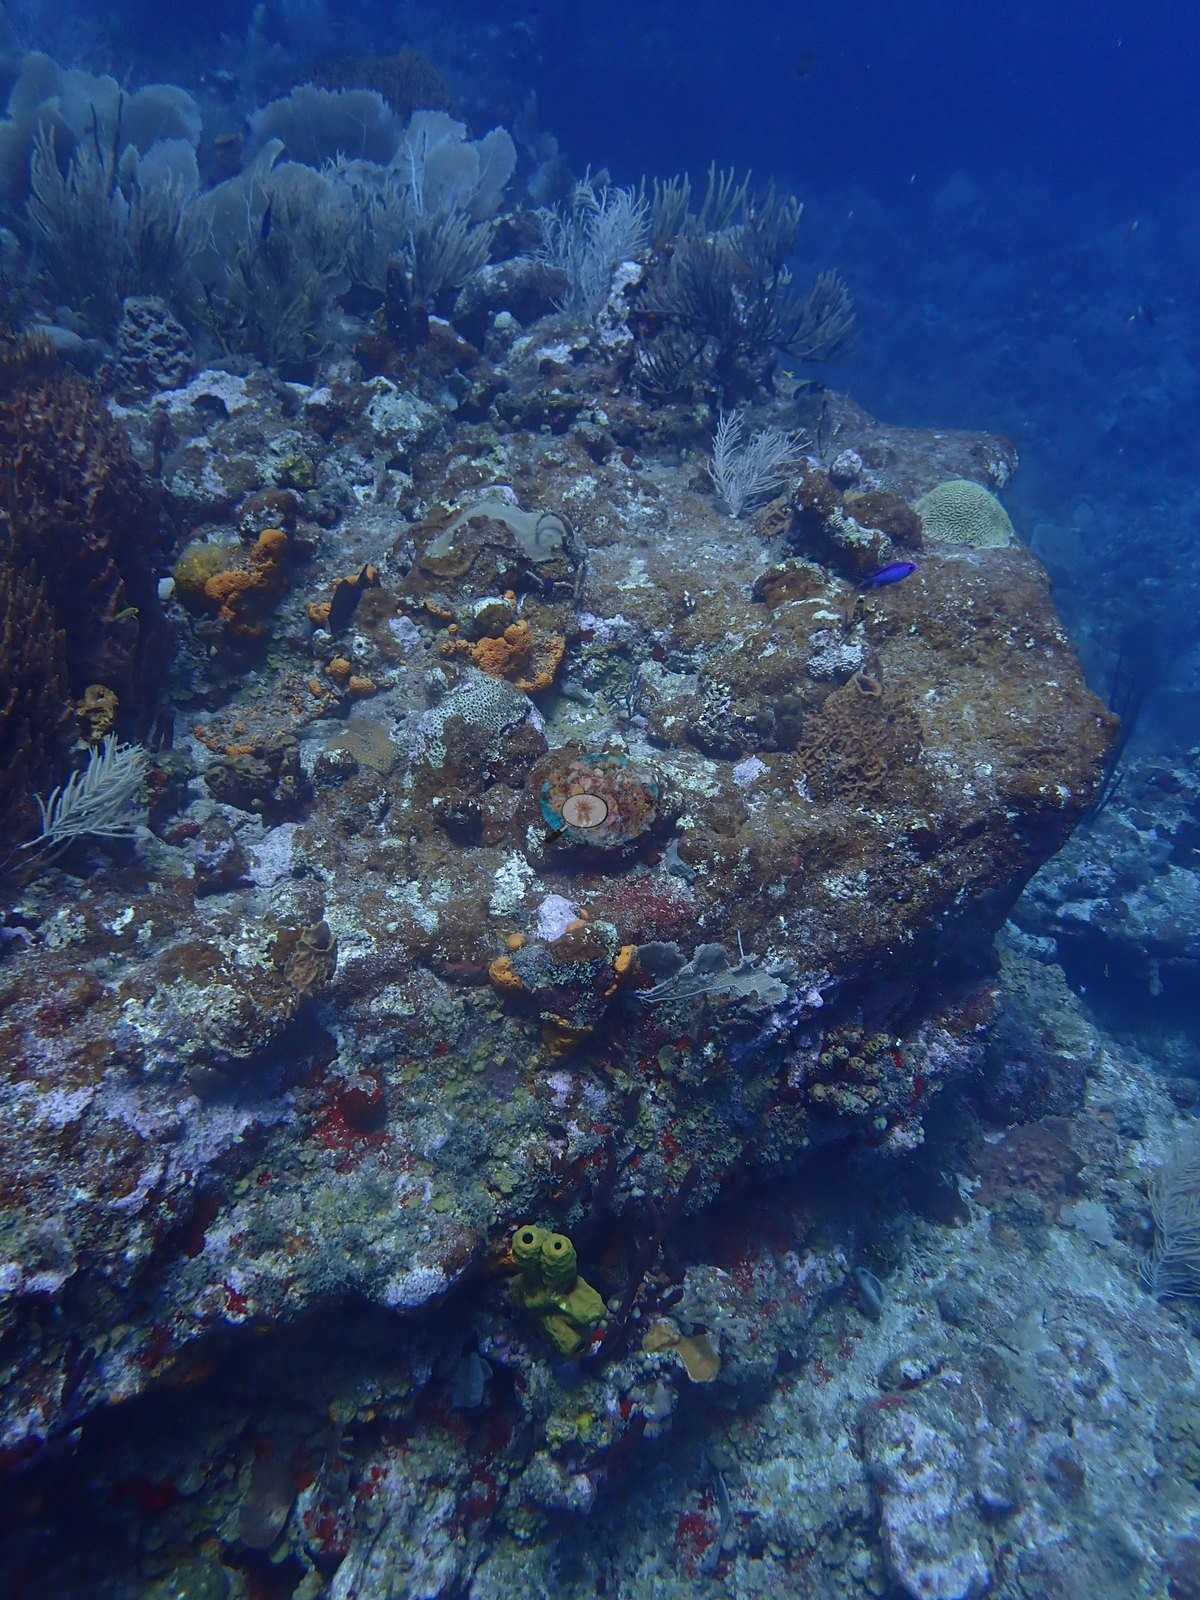
Photo: Anderson Mayfield/Coral Reef Diagnostics — St. Eustatius - The Ledge to Hangover
Country
St. Eustatius
Sites
4
each linked below
Hard coral cover (regional mean)
4.2% ± 1.0% (std. dev.)
n=4. range 2.9–5.6%
Water temp. during surveys (regional mean)
—
n = 0 of 4 sites
Coral Health Index (regional mean)
not yet scored
n = 0 of 4 sites
Most recent water temperature record
Most recent heat stress record
16 Sep 2026 · Alert Level 1
Mean annual max degree heating weeks (DHW), last 5 years
2021–2025 · Leeward Caribbean Islands
Highest annual heat stress
in 2024 · Leeward Caribbean Islands
Severe heat-stress years
1985–2025 · 4 in the last 10 years
Heat-stress figures: NOAA Coral Reef Watch — Leeward Caribbean Islands 5-km virtual station. Each pill links its source record and carries the values behind it.
Regional summary

St. Eustatius's four dives cross an artificial reef, an intact upright cargo wreck, a seagrass meadow with ballast mounds, and a gorgonian-carpeted ledge, where sponges and octocorals dominate and stony corals are small or scattered. No bleaching was seen, and barracuda, turtles, and nurse sharks were highlights.

Heat stress

04812162024Week of 2023-07-23: DHW 0.6°C-weeks (below the bleaching alert threshold); SST 29.22°CWeek of 2023-07-30: DHW 1.6°C-weeks (below the bleaching alert threshold); SST 29.59°CWeek of 2023-08-06: DHW 3.0°C-weeks (below the bleaching alert threshold); SST 29.68°CWeek of 2023-08-13: DHW 4.3°C-weeks (Alert Level 1: significant bleaching likely); SST 29.61°CWeek of 2023-08-20: DHW 5.7°C-weeks (Alert Level 1: significant bleaching likely); SST 29.74°CWeek of 2023-08-27: DHW 7.5°C-weeks (Alert Level 1: significant bleaching likely); SST 30.10°CWeek of 2023-09-03: DHW 9.4°C-weeks (Alert Level 2+: severe bleaching and significant mortality likely); SST 30.17°CWeek of 2023-09-10: DHW 11.4°C-weeks (Alert Level 2+: severe bleaching and significant mortality likely); SST 30.30°CWeek of 2023-09-17: DHW 13.5°C-weeks (Alert Level 2+: severe bleaching and significant mortality likely); SST 30.43°CWeek of 2023-09-24: DHW 15.6°C-weeks (Alert Level 2+: severe bleaching and significant mortality likely); SST 30.41°CWeek of 2023-10-01: DHW 17.5°C-weeks (Alert Level 2+: severe bleaching and significant mortality likely); SST 30.21°CWeek of 2023-10-08: DHW 19.2°C-weeks (Alert Level 2+: severe bleaching and significant mortality likely); SST 30.05°CWeek of 2023-10-15: DHW 20.5°C-weeks (Alert Level 2+: severe bleaching and significant mortality likely); SST 30.17°CWeek of 2023-10-22: DHW 21.2°C-weeks (Alert Level 2+: severe bleaching and significant mortality likely); SST 30.06°CWeek of 2023-10-29: DHW 21.2°C-weeks (Alert Level 2+: severe bleaching and significant mortality likely); SST 29.77°CWeek of 2023-11-05: DHW 21.1°C-weeks (Alert Level 2+: severe bleaching and significant mortality likely); SST 29.60°CWeek of 2023-11-12: DHW 20.8°C-weeks (Alert Level 2+: severe bleaching and significant mortality likely); SST 29.31°CWeek of 2023-11-19: DHW 19.2°C-weeks (Alert Level 2+: severe bleaching and significant mortality likely); SST 28.89°CWeek of 2023-11-26: DHW 17.5°C-weeks (Alert Level 2+: severe bleaching and significant mortality likely); SST 28.73°CWeek of 2023-12-03: DHW 15.6°C-weeks (Alert Level 2+: severe bleaching and significant mortality likely); SST 28.61°CWeek of 2023-12-10: DHW 13.6°C-weeks (Alert Level 2+: severe bleaching and significant mortality likely); SST 28.31°CWeek of 2023-12-17: DHW 11.4°C-weeks (Alert Level 2+: severe bleaching and significant mortality likely); SST 28.13°CWeek of 2023-12-24: DHW 9.3°C-weeks (Alert Level 2+: severe bleaching and significant mortality likely); SST 28.06°CWeek of 2023-12-31: DHW 7.5°C-weeks (Alert Level 1: significant bleaching likely); SST 27.98°CWeek of 2024-01-07: DHW 5.7°C-weeks (Alert Level 1: significant bleaching likely); SST 27.82°CWeek of 2024-01-14: DHW 3.9°C-weeks (below the bleaching alert threshold); SST 27.64°CWeek of 2024-01-21: DHW 2.3°C-weeks (below the bleaching alert threshold); SST 27.48°CWeek of 2024-01-28: DHW 1.0°C-weeks (below the bleaching alert threshold); SST 27.52°CWeek of 2024-05-12: DHW 0.5°C-weeks (below the bleaching alert threshold); SST 29.27°CWeek of 2024-05-19: DHW 1.4°C-weeks (below the bleaching alert threshold); SST 29.48°CWeek of 2024-05-26: DHW 1.4°C-weeks (below the bleaching alert threshold); SST 29.28°CWeek of 2024-06-02: DHW 2.5°C-weeks (below the bleaching alert threshold); SST 29.39°CWeek of 2024-06-09: DHW 3.8°C-weeks (below the bleaching alert threshold); SST 29.58°CWeek of 2024-06-16: DHW 5.2°C-weeks (Alert Level 1: significant bleaching likely); SST 29.75°CWeek of 2024-06-23: DHW 6.5°C-weeks (Alert Level 1: significant bleaching likely); SST 29.62°CWeek of 2024-06-30: DHW 7.5°C-weeks (Alert Level 1: significant bleaching likely); SST 29.52°CWeek of 2024-07-07: DHW 8.7°C-weeks (Alert Level 2+: severe bleaching and significant mortality likely); SST 29.56°CWeek of 2024-07-14: DHW 9.7°C-weeks (Alert Level 2+: severe bleaching and significant mortality likely); SST 29.57°CWeek of 2024-07-21: DHW 10.9°C-weeks (Alert Level 2+: severe bleaching and significant mortality likely); SST 29.43°CWeek of 2024-07-28: DHW 12.3°C-weeks (Alert Level 2+: severe bleaching and significant mortality likely); SST 29.68°CWeek of 2024-08-04: DHW 13.2°C-weeks (Alert Level 2+: severe bleaching and significant mortality likely); SST 29.66°CWeek of 2024-08-11: DHW 13.8°C-weeks (Alert Level 2+: severe bleaching and significant mortality likely); SST 29.79°CWeek of 2024-08-18: DHW 15.4°C-weeks (Alert Level 2+: severe bleaching and significant mortality likely); SST 29.89°CWeek of 2024-08-25: DHW 16.0°C-weeks (Alert Level 2+: severe bleaching and significant mortality likely); SST 29.96°CWeek of 2024-09-01: DHW 16.4°C-weeks (Alert Level 2+: severe bleaching and significant mortality likely); SST 29.95°CWeek of 2024-09-08: DHW 16.6°C-weeks (Alert Level 2+: severe bleaching and significant mortality likely); SST 30.15°CWeek of 2024-09-15: DHW 17.4°C-weeks (Alert Level 2+: severe bleaching and significant mortality likely); SST 30.34°CWeek of 2024-09-22: DHW 18.7°C-weeks (Alert Level 2+: severe bleaching and significant mortality likely); SST 30.75°CWeek of 2024-09-29: DHW 19.7°C-weeks (Alert Level 2+: severe bleaching and significant mortality likely); SST 30.52°CWeek of 2024-10-06: DHW 21.0°C-weeks (Alert Level 2+: severe bleaching and significant mortality likely); SST 30.70°CWeek of 2024-10-13: DHW 22.1°C-weeks (Alert Level 2+: severe bleaching and significant mortality likely); SST 30.54°CWeek of 2024-10-20: DHW 22.6°C-weeks (Alert Level 2+: severe bleaching and significant mortality likely); SST 30.23°CWeek of 2024-10-27: DHW 23.0°C-weeks (Alert Level 2+: severe bleaching and significant mortality likely); SST 30.00°CWeek of 2024-11-03: DHW 23.2°C-weeks (Alert Level 2+: severe bleaching and significant mortality likely); SST 30.01°CWeek of 2024-11-10: DHW 23.2°C-weeks (Alert Level 2+: severe bleaching and significant mortality likely); SST 29.74°CWeek of 2024-11-17: DHW 23.0°C-weeks (Alert Level 2+: severe bleaching and significant mortality likely); SST 29.74°CWeek of 2024-11-24: DHW 22.7°C-weeks (Alert Level 2+: severe bleaching and significant mortality likely); SST 29.71°CWeek of 2024-12-01: DHW 22.3°C-weeks (Alert Level 2+: severe bleaching and significant mortality likely); SST 29.40°CWeek of 2024-12-08: DHW 21.0°C-weeks (Alert Level 2+: severe bleaching and significant mortality likely); SST 28.93°CWeek of 2024-12-15: DHW 18.9°C-weeks (Alert Level 2+: severe bleaching and significant mortality likely); SST 28.85°CWeek of 2024-12-22: DHW 16.5°C-weeks (Alert Level 2+: severe bleaching and significant mortality likely); SST 28.40°CWeek of 2024-12-29: DHW 14.4°C-weeks (Alert Level 2+: severe bleaching and significant mortality likely); SST 28.15°CWeek of 2025-01-05: DHW 12.1°C-weeks (Alert Level 2+: severe bleaching and significant mortality likely); SST 28.02°CWeek of 2025-01-12: DHW 9.8°C-weeks (Alert Level 2+: severe bleaching and significant mortality likely); SST 27.91°CWeek of 2025-01-19: DHW 7.9°C-weeks (Alert Level 1: significant bleaching likely); SST 27.68°CWeek of 2025-01-26: DHW 6.2°C-weeks (Alert Level 1: significant bleaching likely); SST 27.58°CWeek of 2025-02-02: DHW 4.6°C-weeks (Alert Level 1: significant bleaching likely); SST 27.46°CWeek of 2025-02-09: DHW 3.2°C-weeks (below the bleaching alert threshold); SST 27.27°CWeek of 2025-02-16: DHW 1.7°C-weeks (below the bleaching alert threshold); SST 27.14°CWeek of 2025-02-23: DHW 0.4°C-weeks (below the bleaching alert threshold); SST 27.11°CWeek of 2025-08-03: DHW 0.2°C-weeks (below the bleaching alert threshold); SST 29.17°CWeek of 2025-08-10: DHW 0.9°C-weeks (below the bleaching alert threshold); SST 29.34°CWeek of 2025-08-17: DHW 1.8°C-weeks (below the bleaching alert threshold); SST 29.49°CWeek of 2025-08-24: DHW 3.1°C-weeks (below the bleaching alert threshold); SST 29.63°CWeek of 2025-08-31: DHW 4.7°C-weeks (Alert Level 1: significant bleaching likely); SST 29.81°CWeek of 2025-09-07: DHW 6.2°C-weeks (Alert Level 1: significant bleaching likely); SST 29.87°CWeek of 2025-09-14: DHW 7.8°C-weeks (Alert Level 1: significant bleaching likely); SST 29.92°CWeek of 2025-09-21: DHW 9.4°C-weeks (Alert Level 2+: severe bleaching and significant mortality likely); SST 29.96°CWeek of 2025-09-28: DHW 11.2°C-weeks (Alert Level 2+: severe bleaching and significant mortality likely); SST 30.04°CWeek of 2025-10-05: DHW 12.9°C-weeks (Alert Level 2+: severe bleaching and significant mortality likely); SST 30.07°CWeek of 2025-10-12: DHW 14.3°C-weeks (Alert Level 2+: severe bleaching and significant mortality likely); SST 29.75°CWeek of 2025-10-19: DHW 15.2°C-weeks (Alert Level 2+: severe bleaching and significant mortality likely); SST 29.46°CWeek of 2025-10-26: DHW 16.2°C-weeks (Alert Level 2+: severe bleaching and significant mortality likely); SST 29.49°CWeek of 2025-11-02: DHW 16.0°C-weeks (Alert Level 2+: severe bleaching and significant mortality likely); SST 29.17°CWeek of 2025-11-09: DHW 15.4°C-weeks (Alert Level 2+: severe bleaching and significant mortality likely); SST 28.84°CWeek of 2025-11-16: DHW 14.4°C-weeks (Alert Level 2+: severe bleaching and significant mortality likely); SST 28.88°CWeek of 2025-11-23: DHW 13.0°C-weeks (Alert Level 2+: severe bleaching and significant mortality likely); SST 28.52°CWeek of 2025-11-30: DHW 11.4°C-weeks (Alert Level 2+: severe bleaching and significant mortality likely); SST 28.27°CWeek of 2025-12-07: DHW 9.9°C-weeks (Alert Level 2+: severe bleaching and significant mortality likely); SST 28.06°CWeek of 2025-12-14: DHW 8.3°C-weeks (Alert Level 2+: severe bleaching and significant mortality likely); SST 27.81°CWeek of 2025-12-21: DHW 6.6°C-weeks (Alert Level 1: significant bleaching likely); SST 27.69°CWeek of 2025-12-28: DHW 4.9°C-weeks (Alert Level 1: significant bleaching likely); SST 27.64°CWeek of 2026-01-04: DHW 3.2°C-weeks (below the bleaching alert threshold); SST 27.51°CWeek of 2026-01-11: DHW 1.9°C-weeks (below the bleaching alert threshold); SST 27.45°CWeek of 2026-01-18: DHW 0.9°C-weeks (below the bleaching alert threshold); SST 27.37°CWeek of 2026-08-16: DHW 0.5°C-weeks (below the bleaching alert threshold); SST 29.20°CWeek of 2026-08-23: DHW 1.6°C-weeks (below the bleaching alert threshold); SST 29.33°CWeek of 2026-08-30: DHW 2.7°C-weeks (below the bleaching alert threshold); SST 29.38°CWeek of 2026-09-06: DHW 4.0°C-weeks (below the bleaching alert threshold); SST 29.59°CWeek of 2026-09-13: DHW 4.7°C-weeks (Alert Level 1: significant bleaching likely); SST 29.53°C26283032Bleaching threshold 29.3°C2023202420252026SST (°C)DHW (°C-weeks)
sea surface temperature (SST) (left axis)DHW under 2DHW 2–3DHW 3–5DHW 5–8DHW 8–10DHW over 10 (🔥 above 12)
Daily SST (line) and weekly maximum Degree Heating Weeks (bars), Jan 2023–Sep 2026, NOAA Coral Reef Watch 5-km Leeward Caribbean Islands virtual station. Dashed line: bleaching threshold (maximum monthly mean 28.3°C + 1°C). DHW ≥ 4: bleaching likely; ≥ 8: severe bleaching and mortality likely. A bar is drawn only where DHW exceeds zero, so a stretch with no bar is accumulated heat stress of zero, not missing data — the SST line runs the full period.

Long-term record: 6 years since 1985 reached 8 or more °C-weeks at NOAA’s Leeward Caribbean Islands station. Download the annual DHW data (CSV).

4 sites in this region — click a marker to open that site.

Regional setting

St. Eustatius (Statia), about 30 km² in area, sits on a relatively shallow bank that it shares with St. Kitts and Nevis, and the volcano at its southern end last erupted in the late Pleistocene or early Holocene (Wells 1988). Wells (1988) describes the flat, sandy plateau around the island as unfavorable for corals, which grow mainly on sheltered cliffs, cobble bottoms, and the lee sides of boulders. A narrow but distinct shelf at 22–30 m surrounds much of the island, and there are no extensive Acropora palmata reefs. The notable exception is the Corre Corre ridge off the southeastern point, an unbroken and exceptionally well-built algal ridge that extends roughly a kilometer up the east coast, rises over a meter above low tide, and has a near-vertical face falling to about 6 m; Wells (1988) suggests that earlier maps showing living reef all around the island may in fact refer to this ridge. The same account notes that the Windward Group islands hold fewer hermatypic coral species than the Leewards (33 against 50). Spalding et al. (2001) likewise treat Saba and St. Eustatius as steep-sided volcanoes with little reef framework but important coral communities, and note that a marine park created in 1998 protects four coastal zones on St. Eustatius that take in both reefs and shipwrecks. They estimate about 420 km² of reef for the former Netherlands Antilles, a combined figure that also covers Bonaire, Curaçao, Saba, and St. Maarten.

Souter et al. (2021) report recent trends only for the Eastern and Southern Caribbean as a whole, a subregion that groups the Lesser Antilles with Trinidad and Tobago, Aruba, Bonaire, Curaçao, and Venezuela. Across it, mean hard coral cover fell from about 26.2% in 1999 to 14.5% in 2019, the largest decline among the five Caribbean subregions, while algal cover nearly tripled between 1987 and 2019 to reach 48.3%. For the Caribbean as a whole, the same report links these losses to the 2005 mass bleaching, hurricanes, polluted, and nutrient-enriched coastal water, and overfishing of herbivores such as parrotfishes, and it names invasive lionfish, Sargassum influxes since 2011, and stony coral tissue loss disease (SCTLD) as newer threats; SCTLD, first seen in Florida in 2014, had been confirmed in 19 Caribbean countries and territories by October 2021. Earlier, Wilkinson (2006), drawing on the 2004 Caribbean Reefs at Risk assessment, placed the Lesser Antilles among the areas most threatened by coastal development and singled out its high islands for land-based pollution and sediment.

Overview

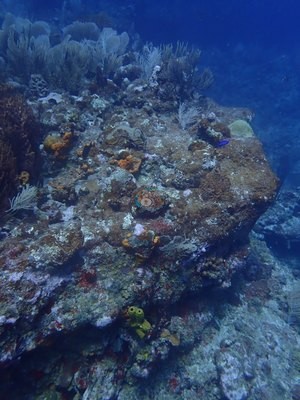
The St. Eustatius unit covers four dives made on 24 and 25 February 2026 in and around the St. Eustatius National Marine Park, and they are as much about man-made and mixed habitat as about natural reef. STENAPA Reef is a purpose-built artificial reef inside the park: concrete rings, arches, slabs, and steel hoops laid across a volcanic sand plain. The Chien Tong wreck is an intact steel cargo ship sitting upright on sand, with railings, masts, winch, and cargo hatches still in place. Double Wreck is a turtle-grass meadow broken by low ballast-and-rubble mounds, plus an upright anchor crusted in coral and sponge. The Ledge to Hangover is low, gorgonian-carpeted pavement stepping down to a 1.5-2 m undercut ledge.

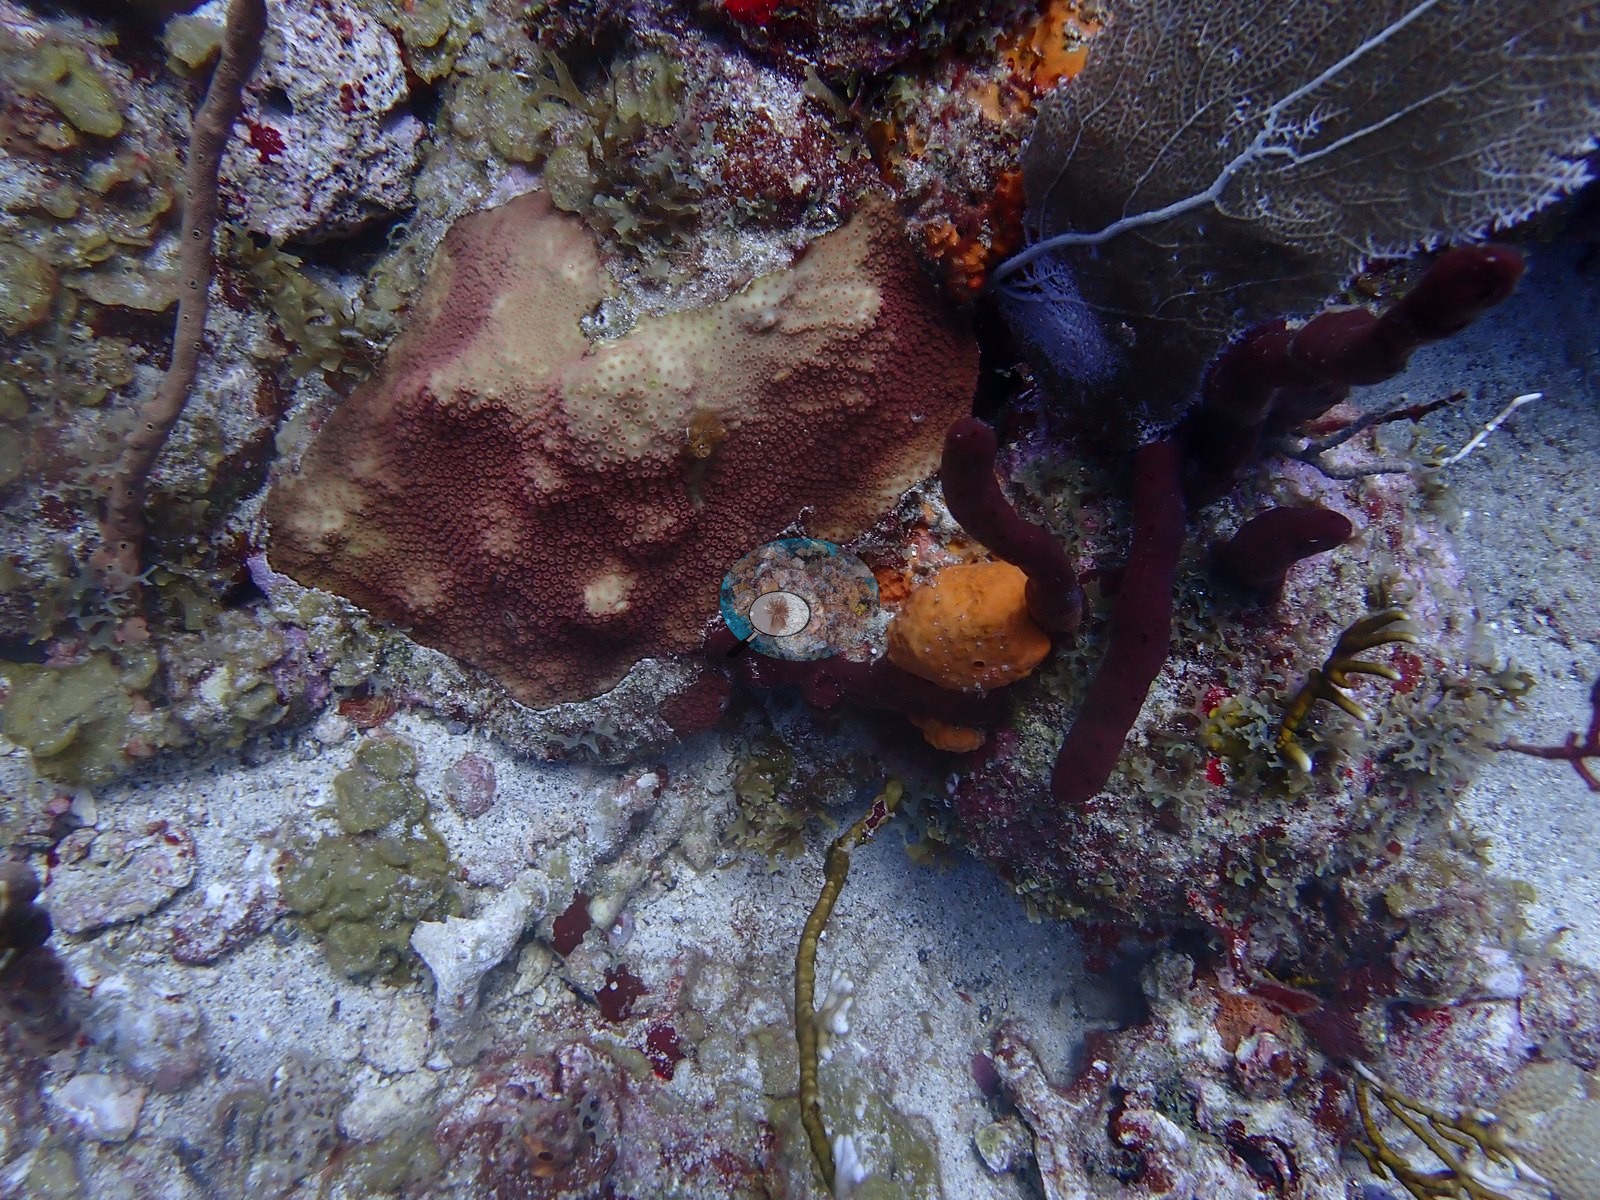
Sponges and octocorals dominate the standing growth at every site, and stony corals are mostly small or scattered. On STENAPA Reef, sponges cover most of the structure while small young colonies settle on it, including plating corals consistent with Agaricia and lobes consistent with Porites astreoides. On the Chien Tong, sponges and hydroids crust the railings and masts, the flat decks stay bare under sediment, and young brain, maze, and star corals are just beginning to settle, richest in the shaded overhangs. Double Wreck's mounds hold large brain corals consistent with Pseudodiploria strigosa and giant barrel sponges, and fleshy macroalgae and turf occupy much of the hard substrate between colonies. At The Ledge, sea fans, sea plumes, and giant barrel sponges stand over long-dead framework under turf and encrusting sponge. Hard coral cover (Claude CV) ran from 2.9% at The Ledge to Hangover to 5.6% at Double Wreck, with STENAPA Reef at 4.6% and the Chien Tong wreck at 3.8%; three of the four are logged as artificial structures, so their values measure growth on built substrate rather than reef. Reef Check stations 0.7-2 km away recorded hard coral from 9.4% to 37.5% across surveys in 2005-2010.

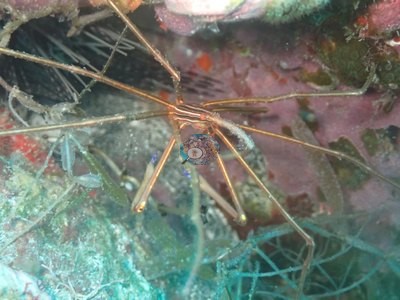
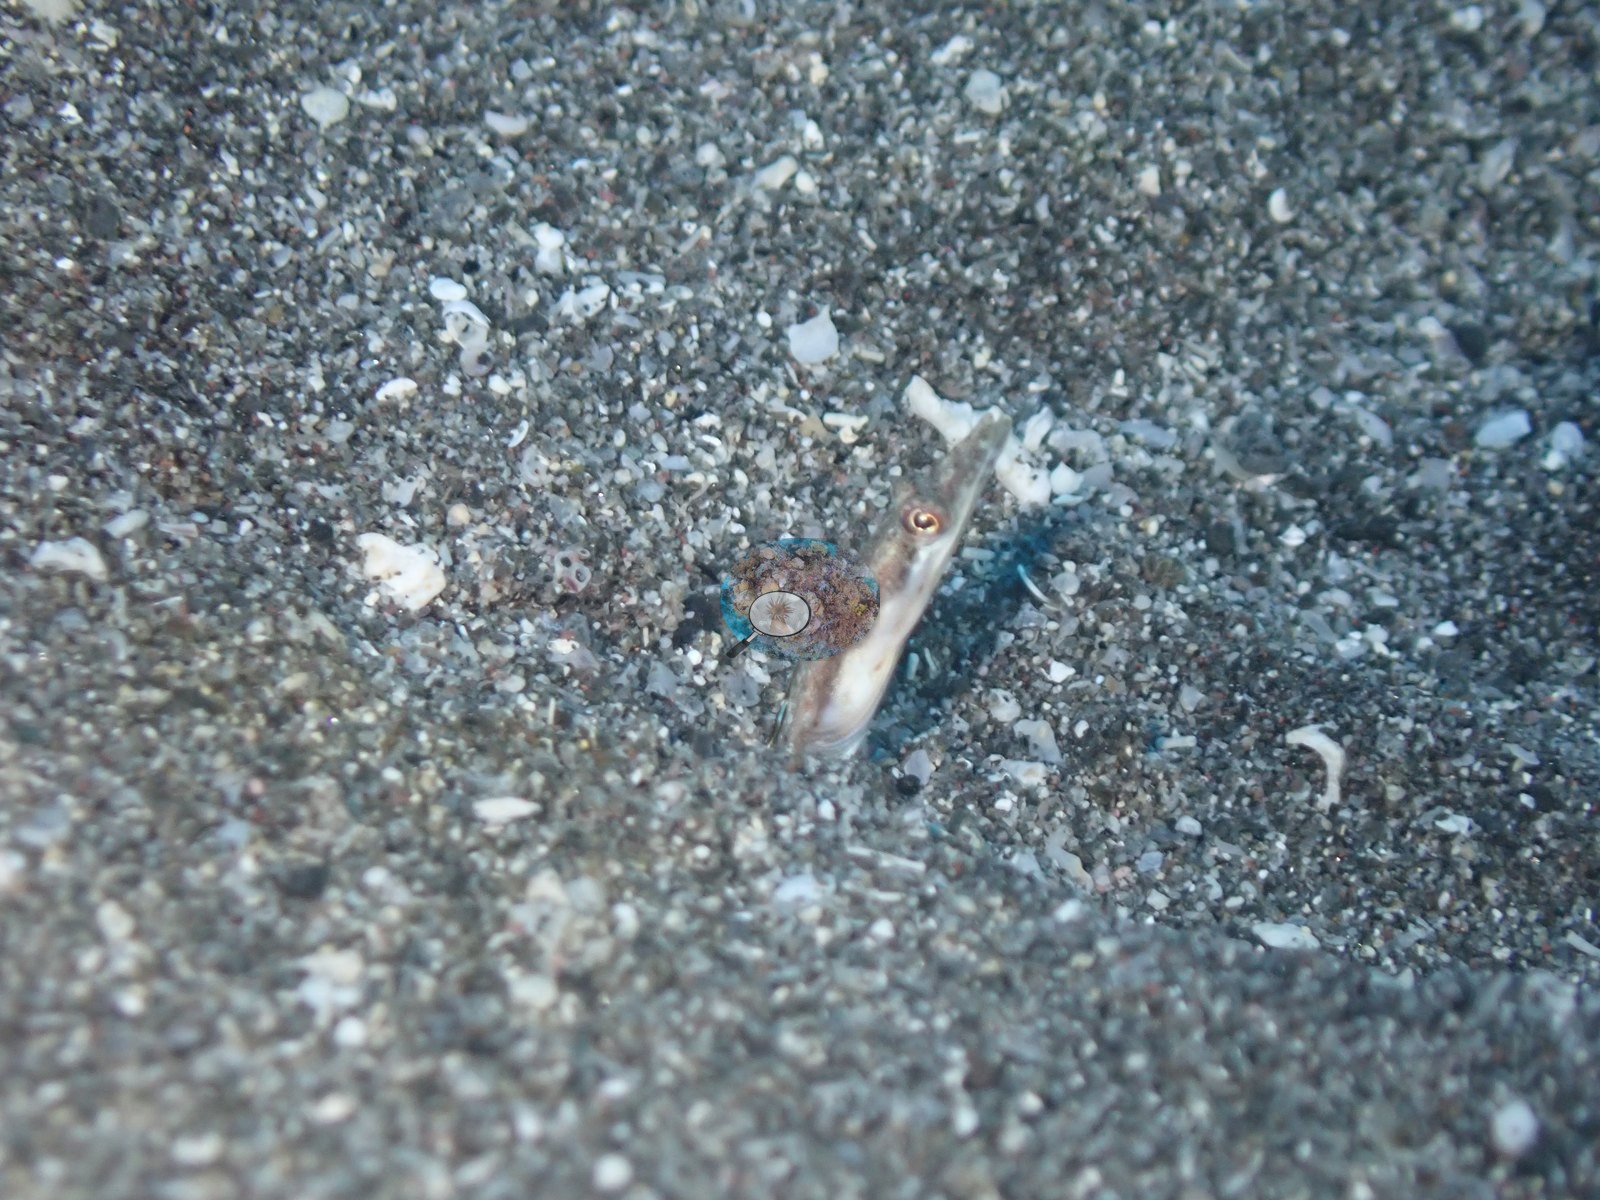
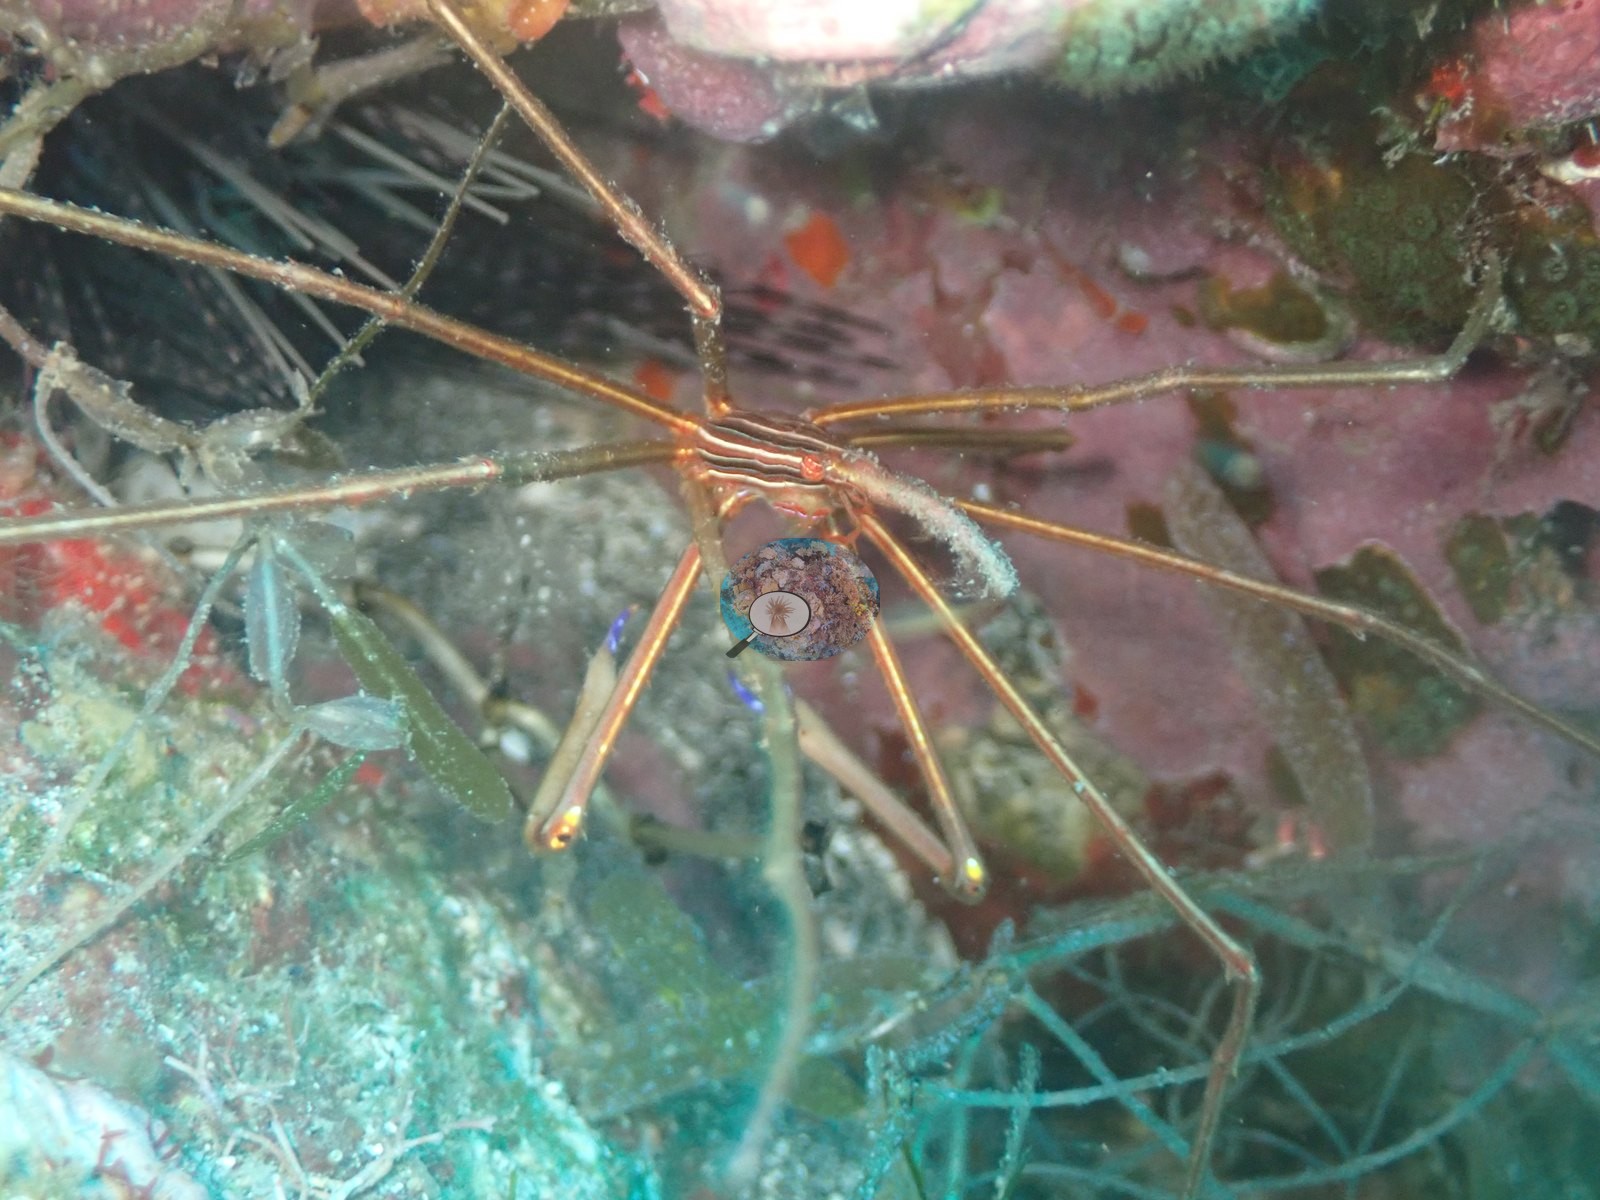
No bleaching was evident at any of the four sites. One mounding colony consistent with Orbicella at The Ledge carried an advancing band of freshly exposed skeleton, the pattern of an active tissue-loss lesion. Invasive lionfish and invasive orange cup coral were photographed on STENAPA Reef. Wildlife is a strength: a great barracuda under the Hangover and around the Chien Tong superstructure, a green sea turtle and a resting nurse shark at Double Wreck, where giant anemones host arrow crabs and cleaner shrimp, and spiny lobsters, fireworms, and a flamingo tongue across the sites.

Highlights

Notable observations

Coral cover over time (pooled)

One point per year: the mean of every hard coral cover value available for this region that year — Anderson’s own dives and every independent survey station within 5 km of them. The vertical bar is the full range behind that mean. Different programs use different methods at different stations, so this is a regional summary, not a single comparable series. Years resting on fewer than three values are drawn as smaller points (2008, 2010). Non-CRD points are from Reef Check Foundation and XL Catlin Seaview Survey (University of Queensland). Marker shape: his own dives, other organizations’ surveys.
0%10%20%30%40%2005201520262005: mean 27% of 4 values (range 24–29%)2007: mean 26% of 4 values (range 11–38%)2008: mean 14% of 2 values (range 11–16%)2009: mean 16% of 3 values (range 9.4–22%)2010: mean 26% of 1 value2013: mean 2.4% of 3 values (range 0.7–4.4%)2026: mean 4.2% of 4 values (range 2.9–5.6%)

Sites in this region

Nearby external survey stations

21 independent survey records within 5 km of a site in this region (deduplicated across sites).

Show all 21 records

All images from Coral Reef Diagnostics. Data are from Coral Reef Diagnostics and Reef Check Foundation and XL Catlin Seaview Survey (University of Queensland).

© Coral Reef Diagnostics.

References