
St. Eustatius - STENAPA Reef

Part of the regional summary: St. Eustatius
More about this place: Sint Eustatius on Wikipedia
More info
Leeward Caribbean Islands (NOAA CRW virtual station) · Eastern Caribbean ecoregion mean=13.1°C-heating weeksA purpose-built artificial reef in St. Eustatius National Marine Park: concrete rings, arches, slabs, and steel hoops laid across a volcanic sand plain, now covered mainly by sponges, with small young coral colonies settling on the structures. Grunts, squirrelfish, spiny lobsters, and invasive lionfish crowd the compartments, and invasive orange cup coral is also present. Wreck and artificial-structure site: this cover value counts coral growing on man-made structure (steel, concrete, wreck debris) and the bottom around it, so it isn't comparable with natural-reef cover or with regional averages.
Eight independent survey stations shown with the program’s logo — click one to see how far it is from this site.
Three other CRD dive sites within 5 km shown in orange — click a marker to open its page.
19 of these 50 photographs are shown beside the text that discusses them under "Site description" below.
Site description
Setting
STENAPA Reef, St. Eustatius National Marine Park, dived 24 February 2026 — the first dive of the day. This is a purpose-built artificial reef, not a natural one, and the photographs make that unmistakable: the whole dive works a scatter of engineered objects set down on an open sand plain. Conditions were hazy with visible suspended particulate; several wide frames are blue-cast and low-contrast, which limits color-based condition scoring (e.g., Image 9).
General benthic features
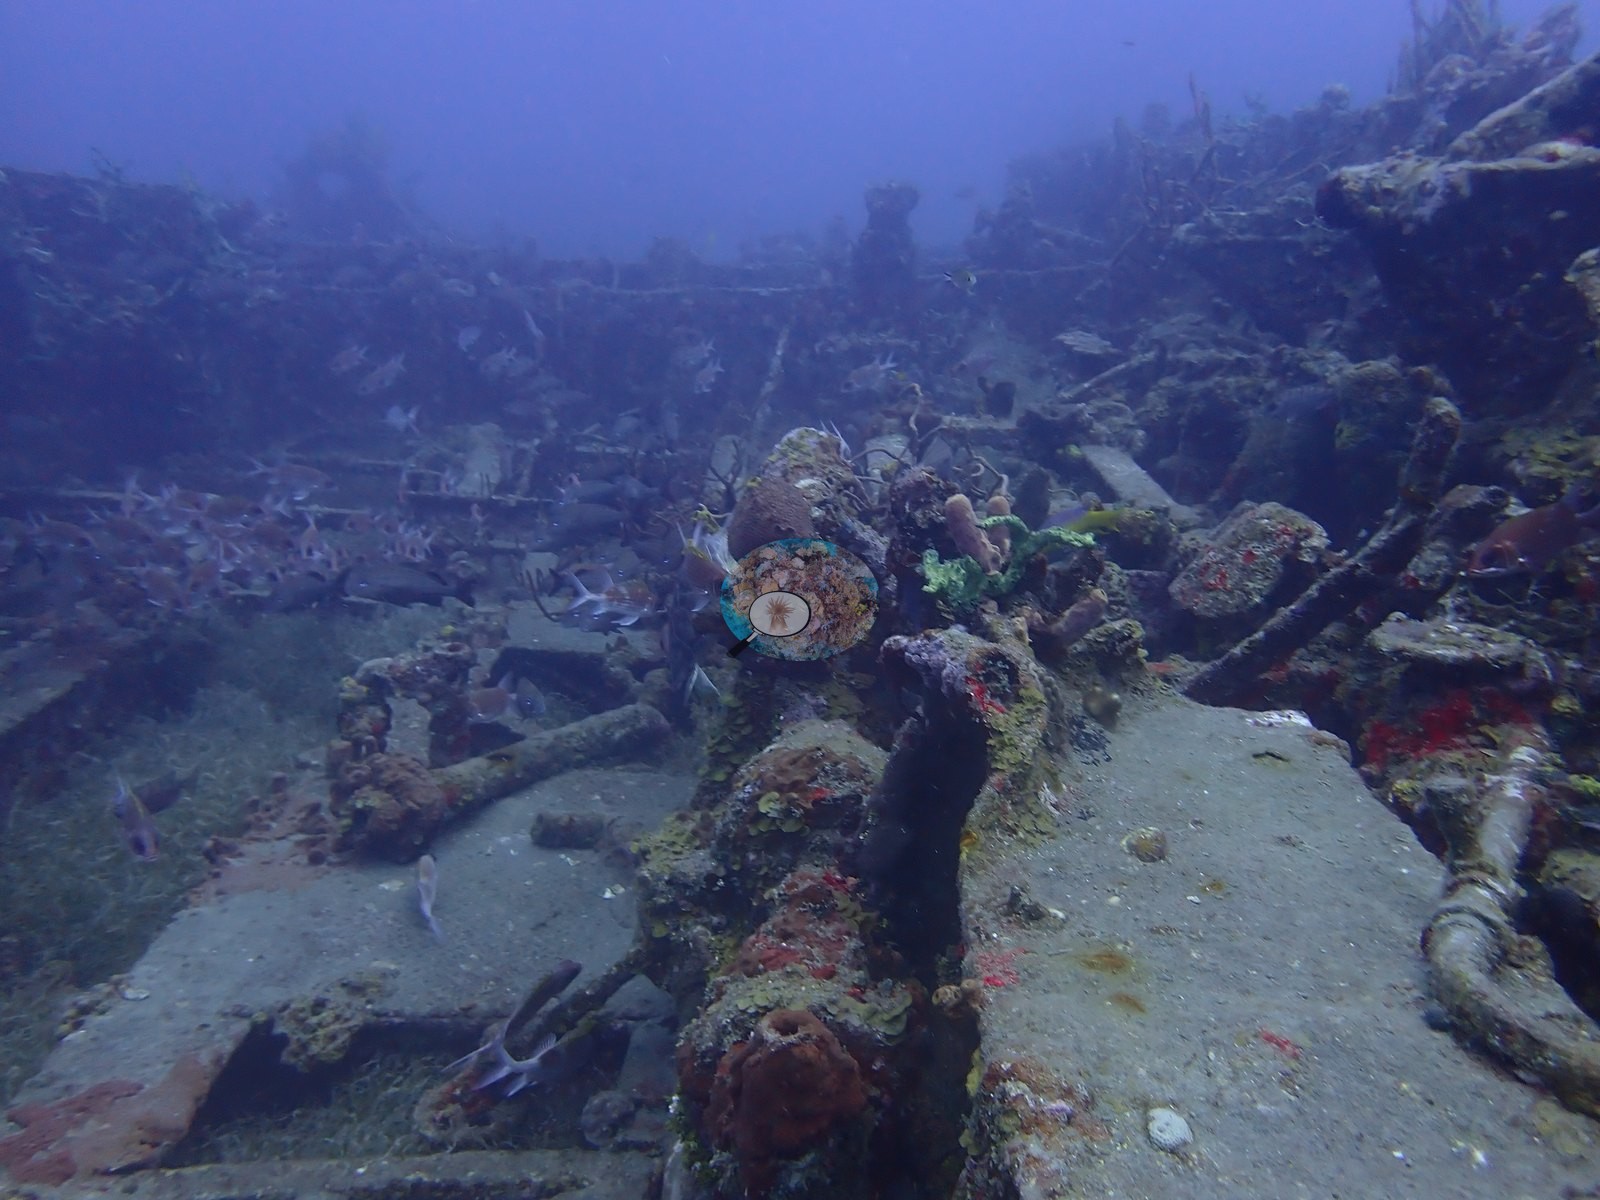
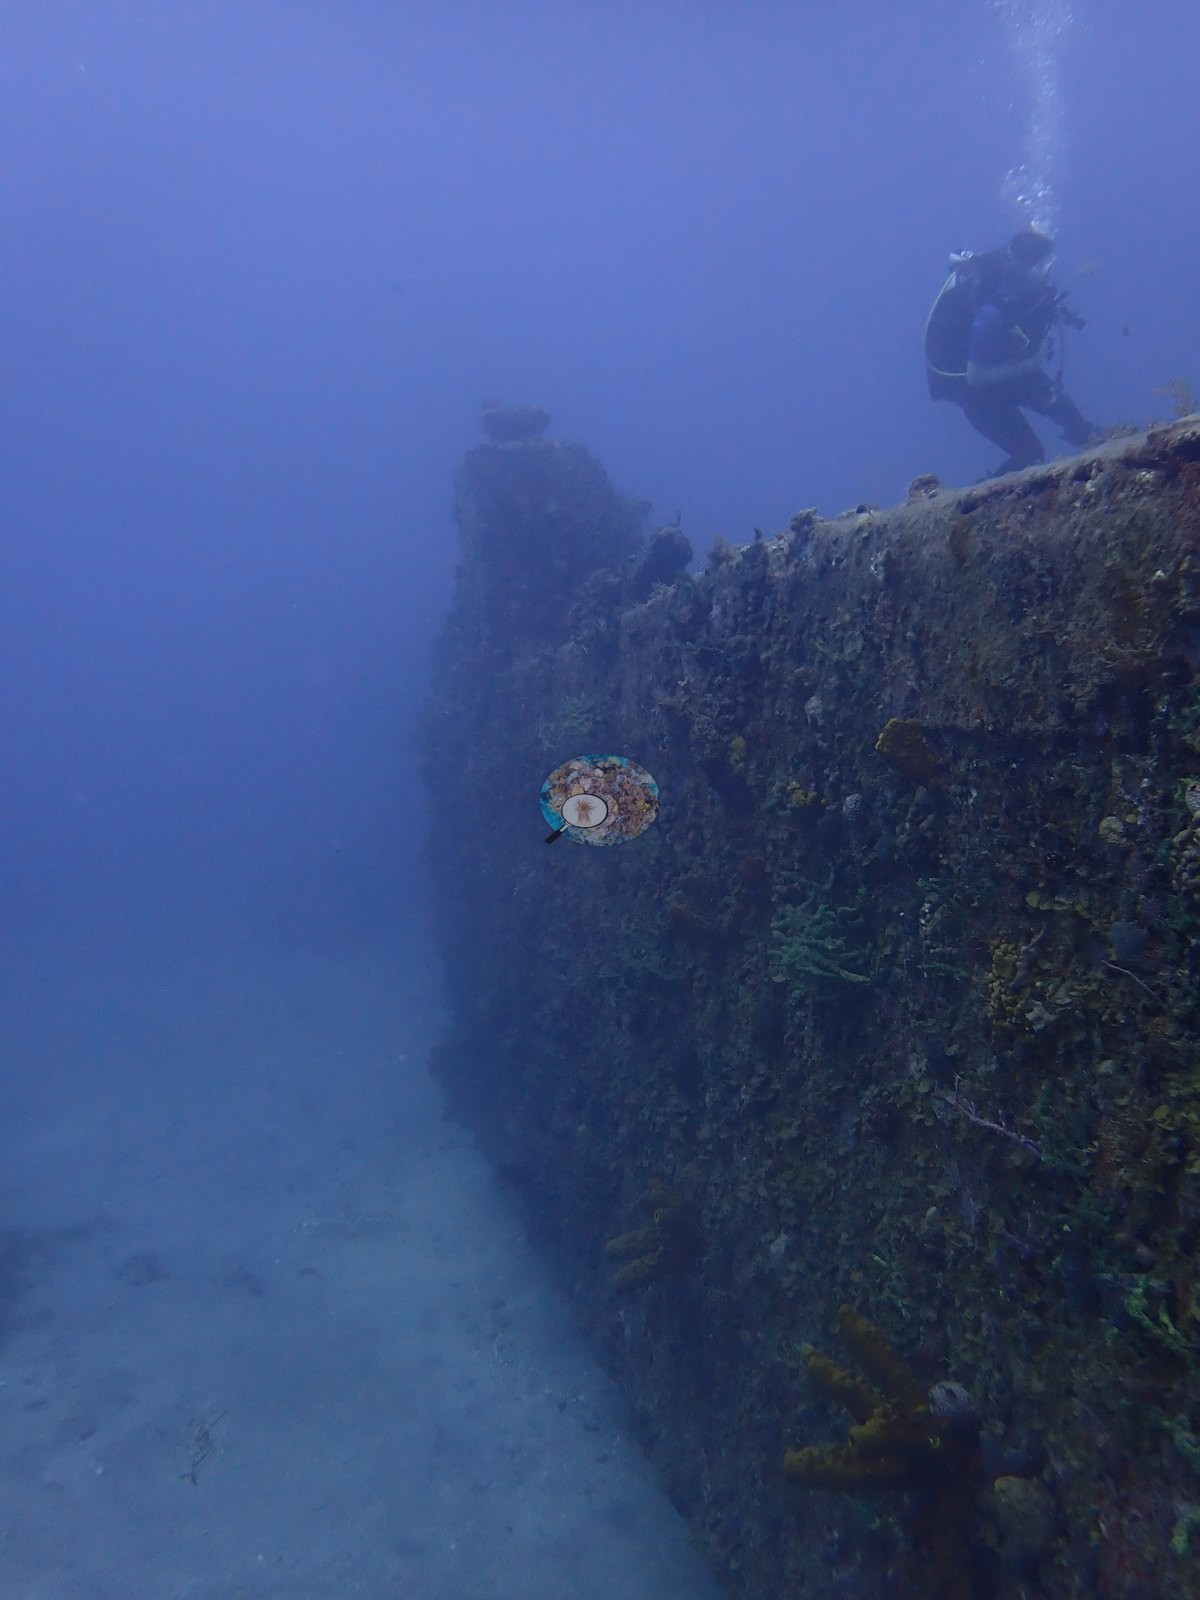
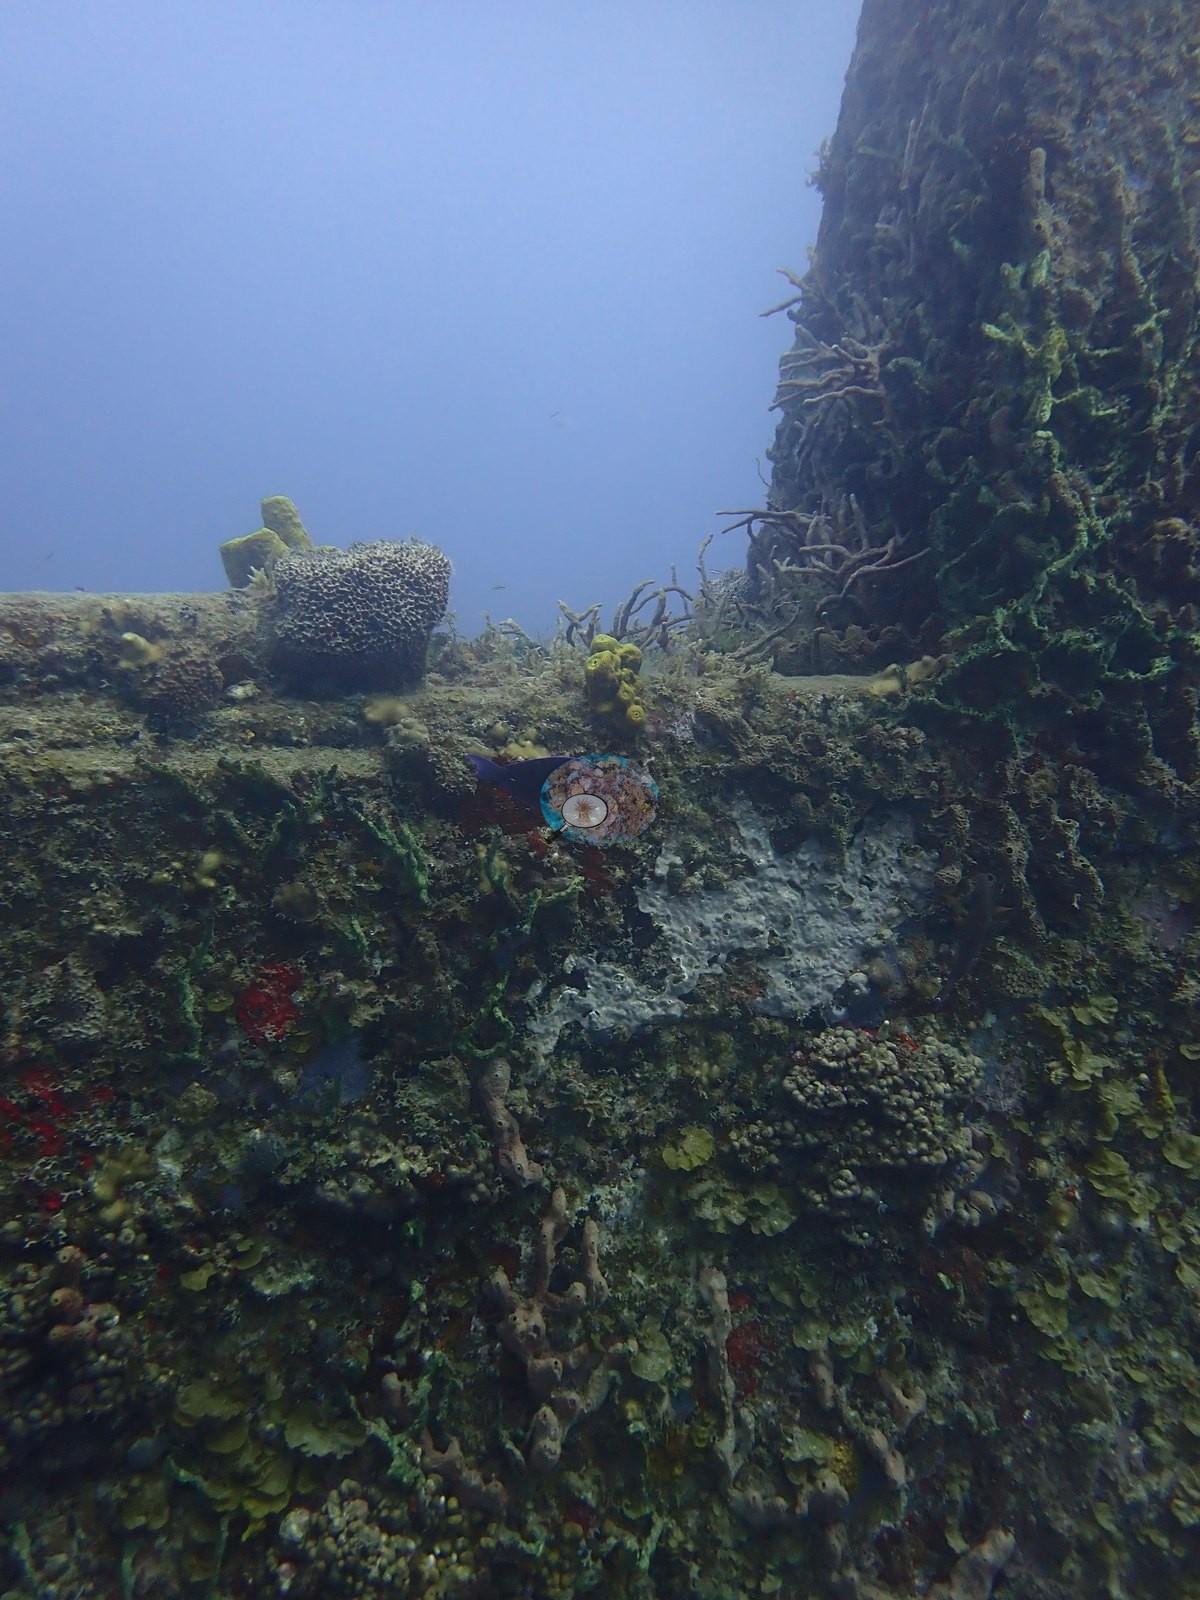
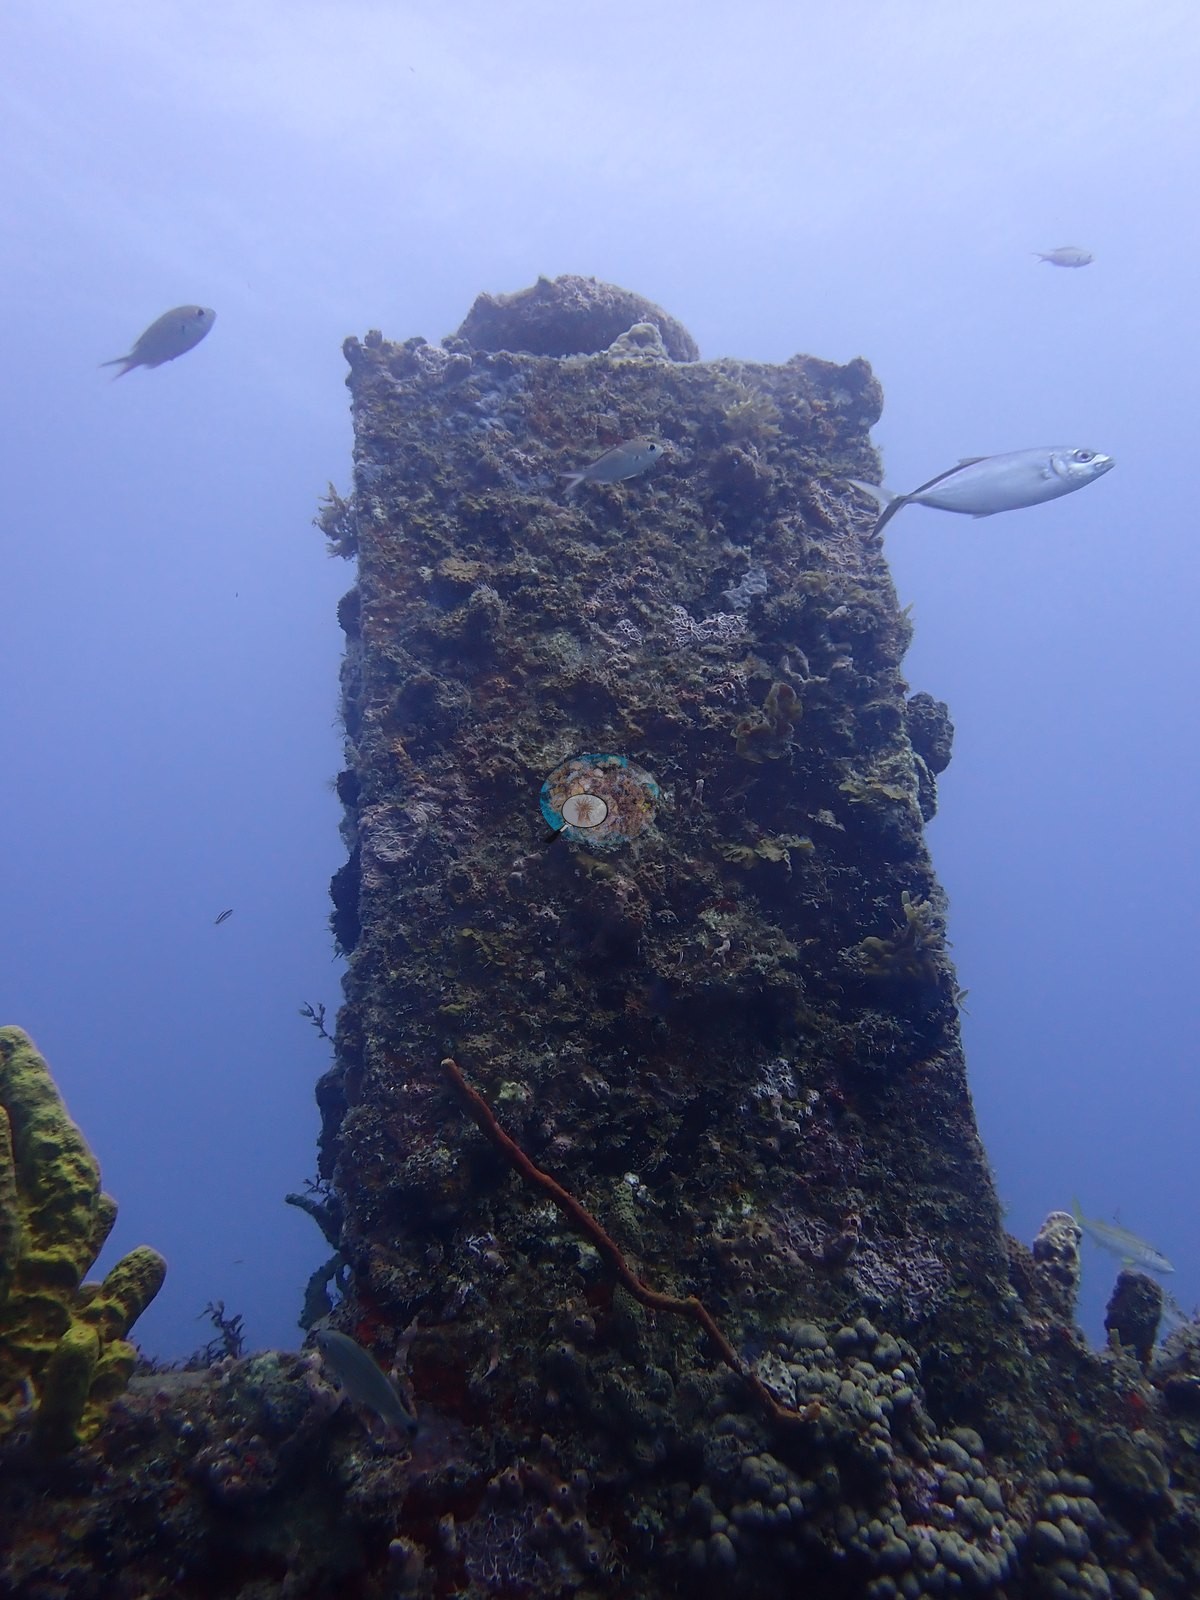
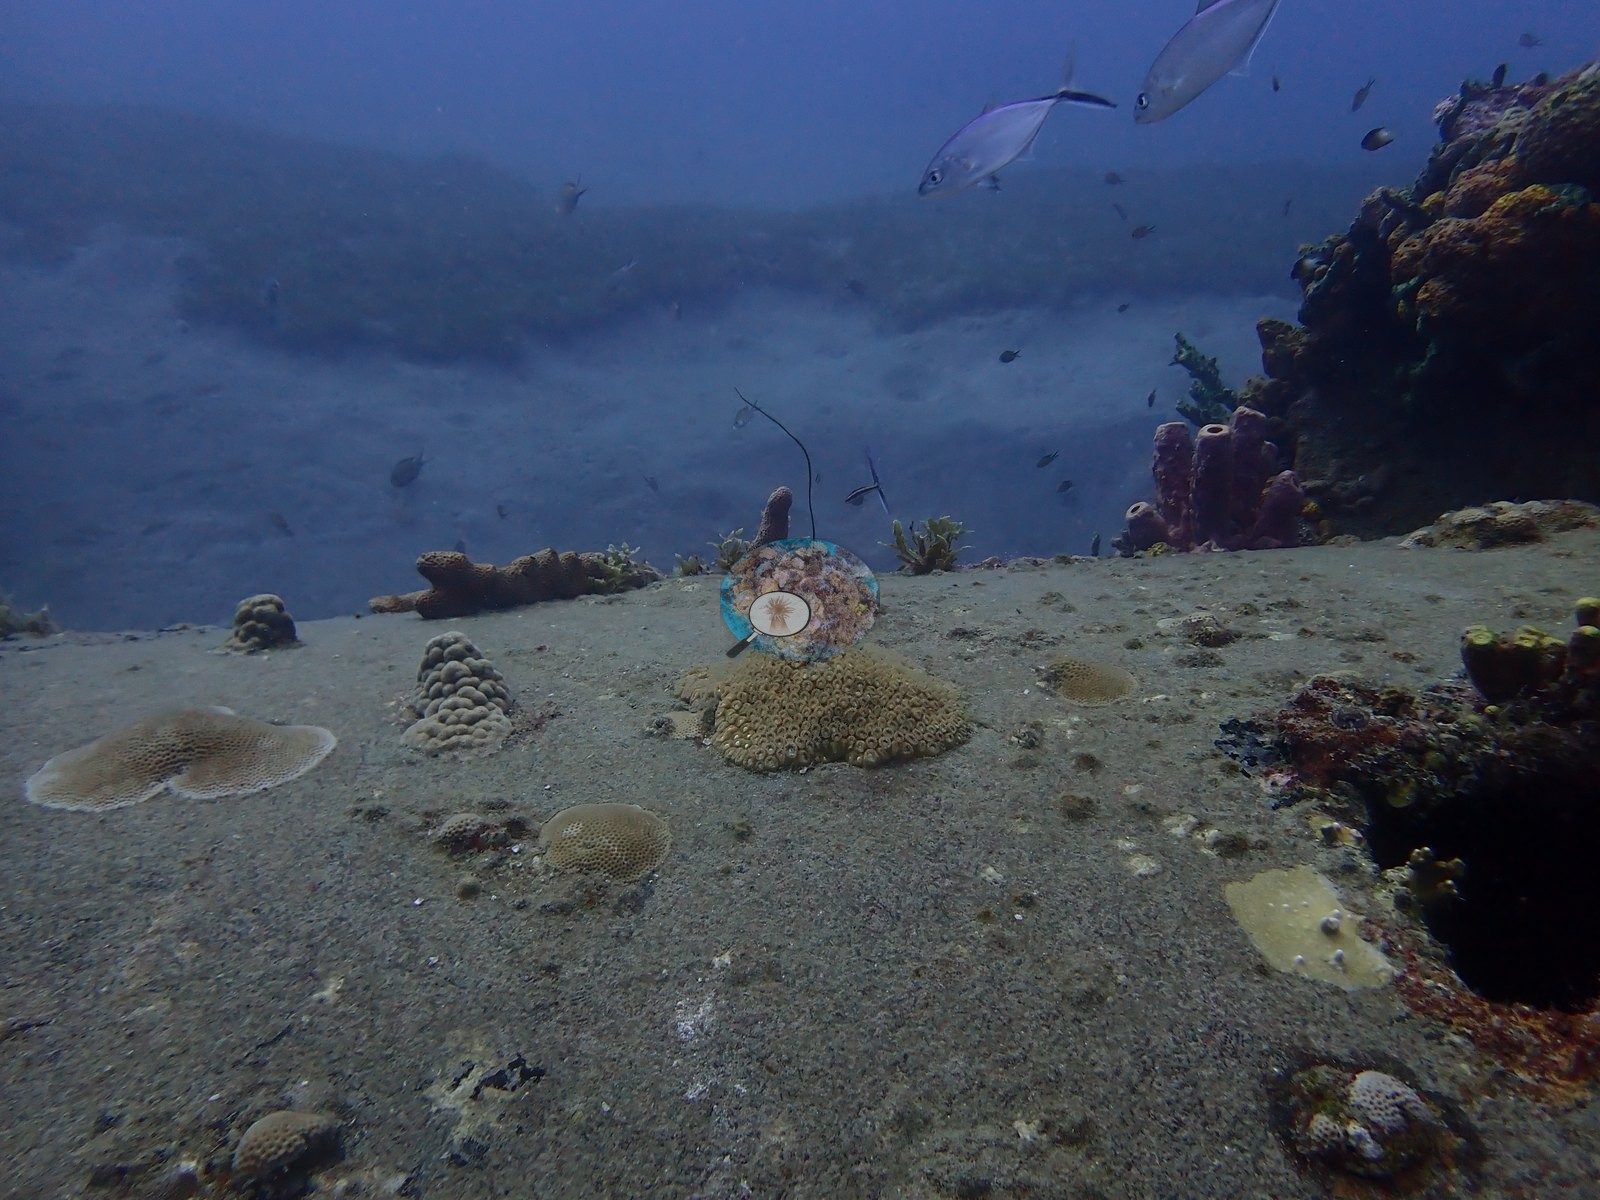
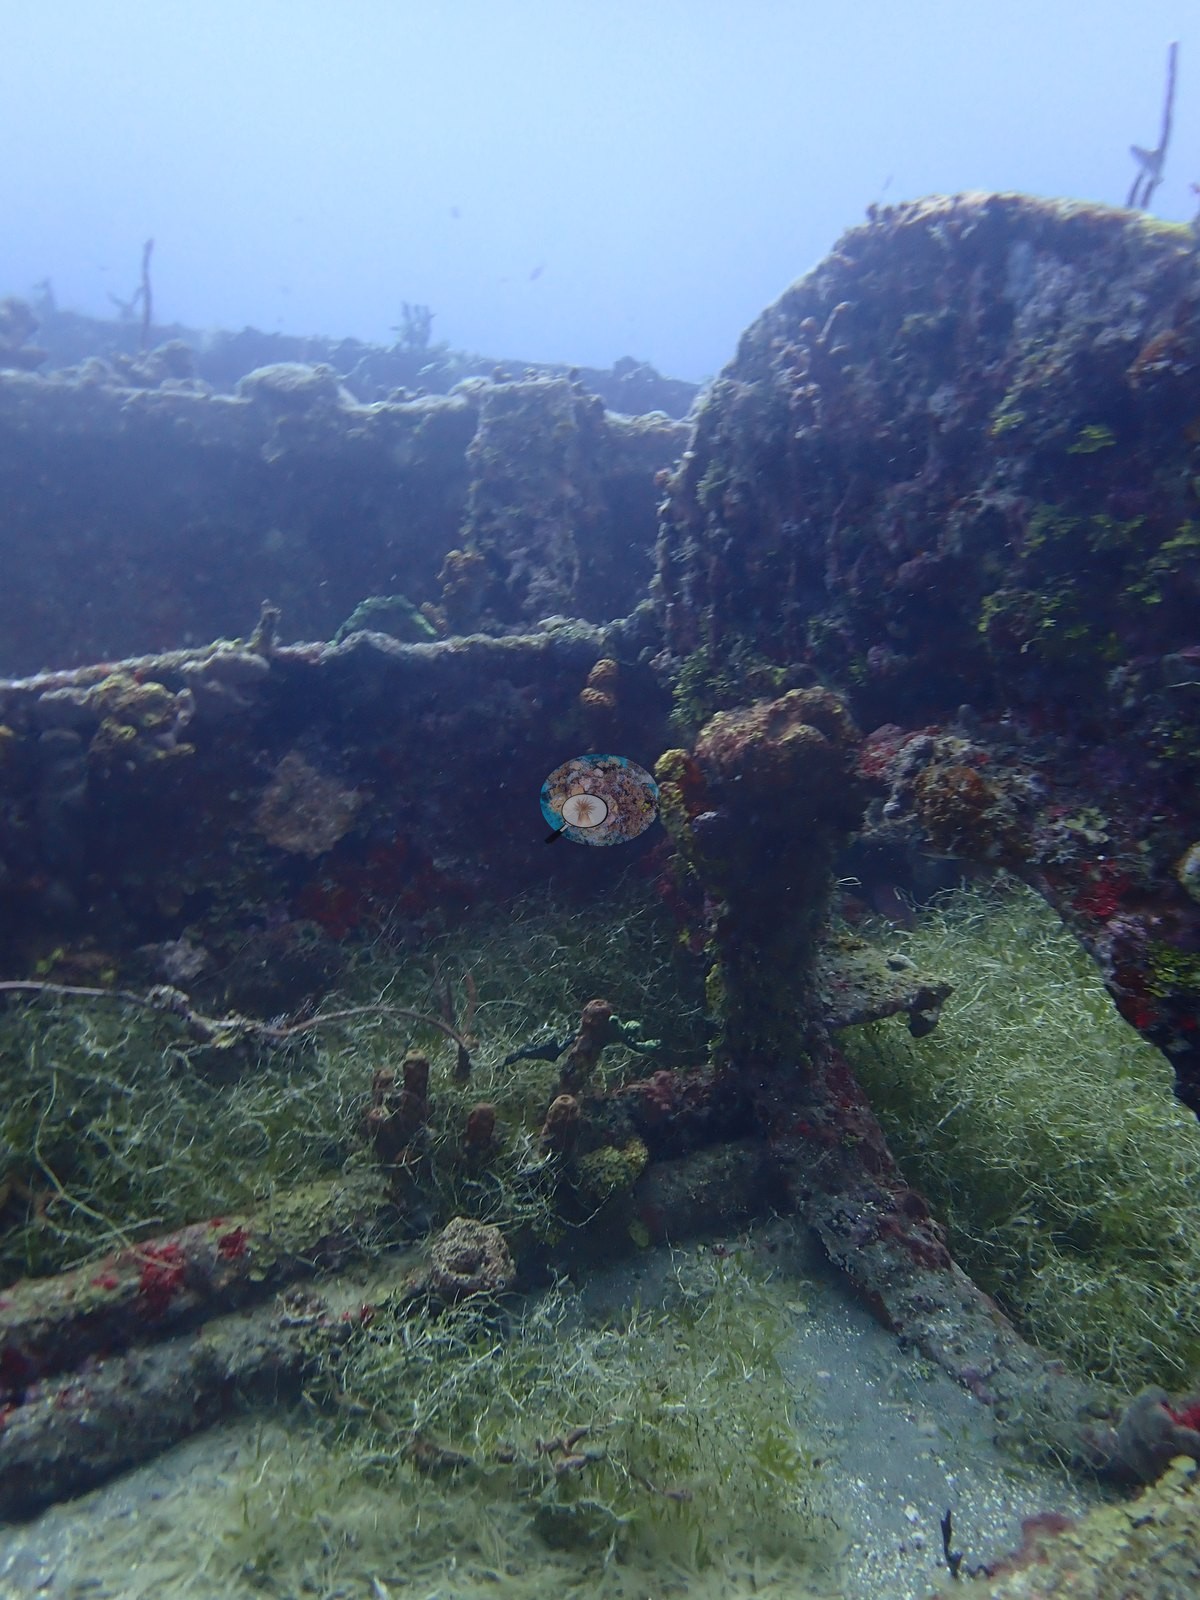
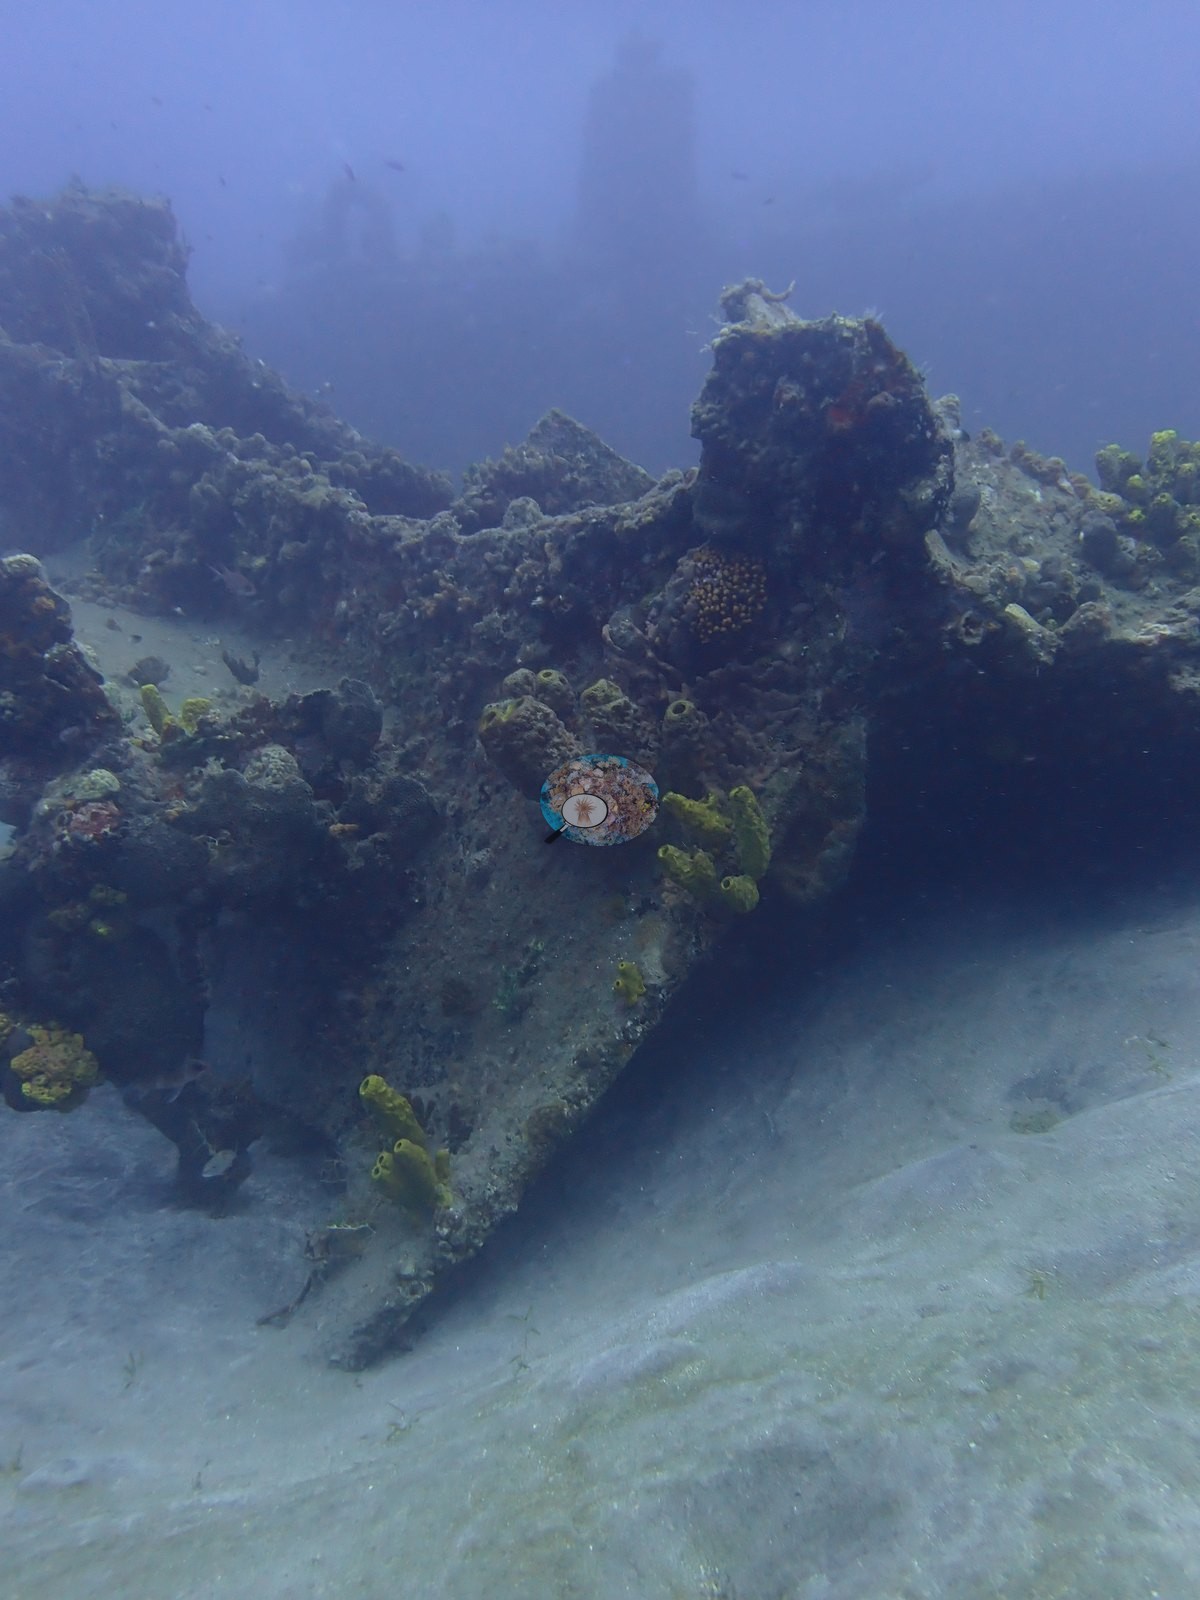
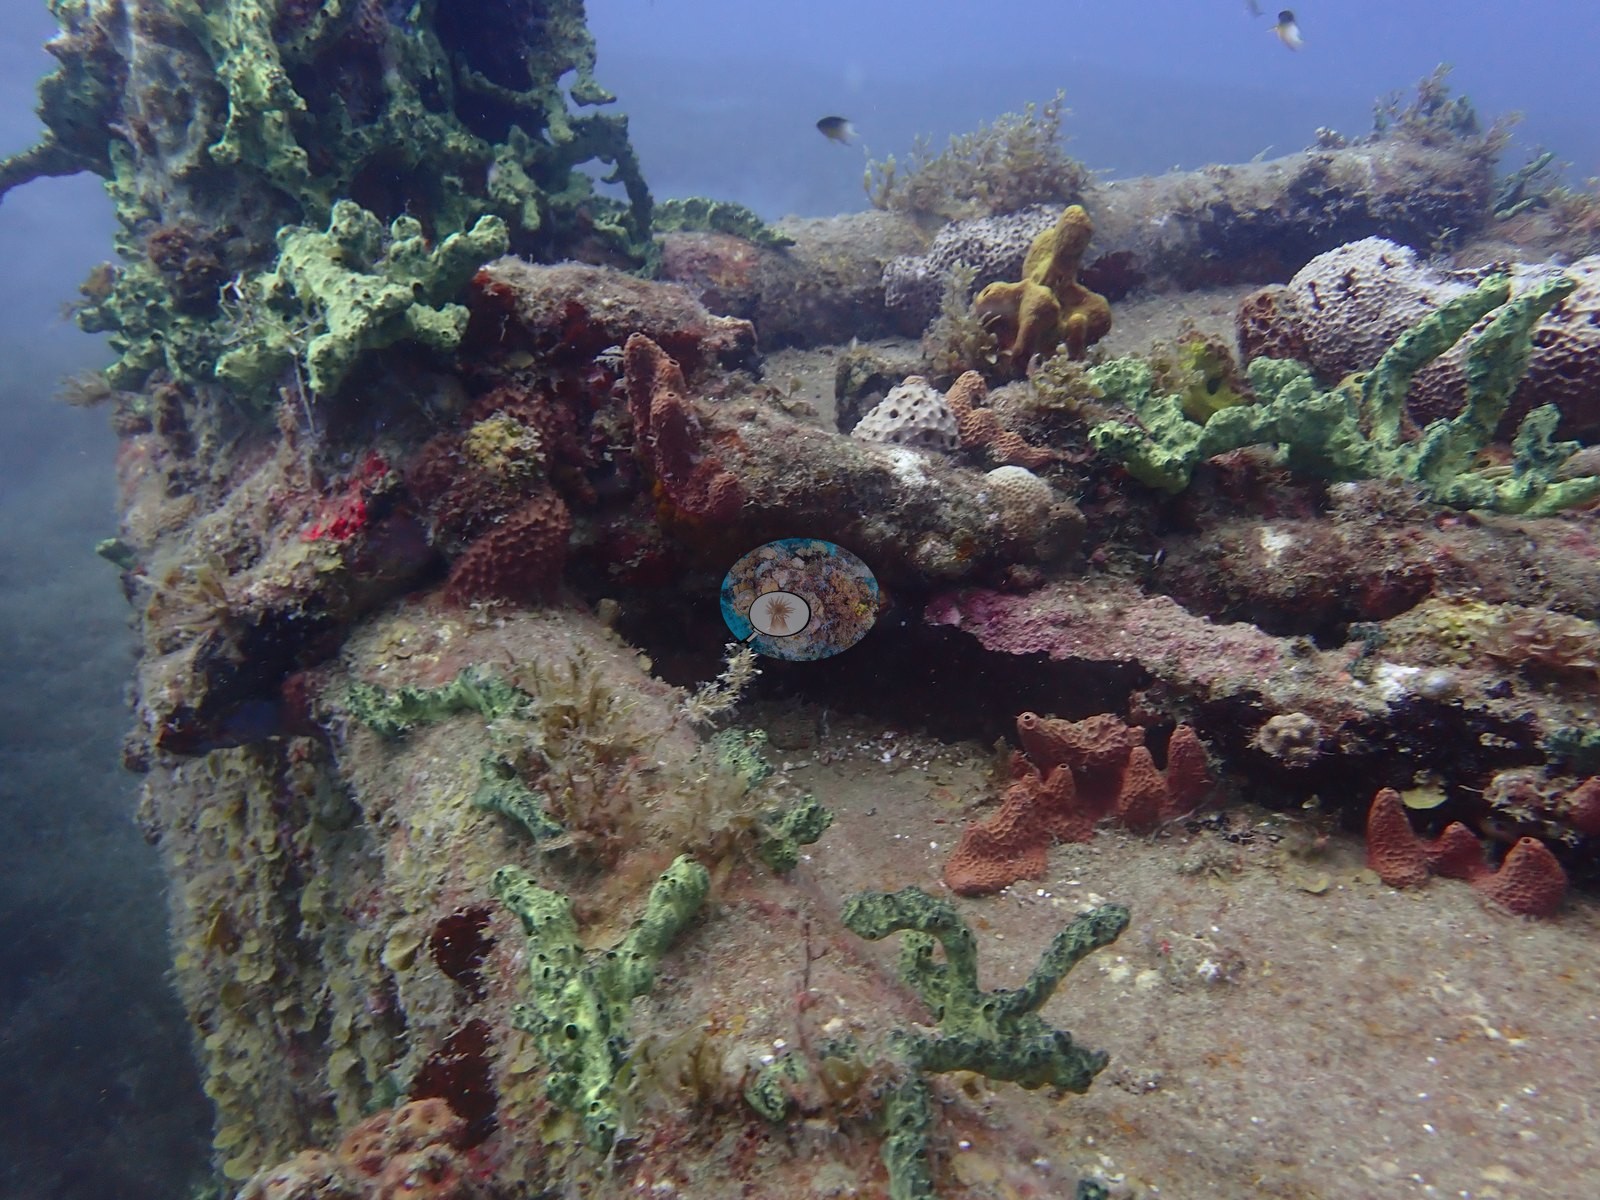
Frames show large steel hoops and rebar rings lying flat on the sand, cast concrete blocks with arched window-like openings standing in a line, right-angled concrete beam-and-slab frameworks, and flat plates with drilled circular ports (e.g., Image 7, Image 21, Image 36).
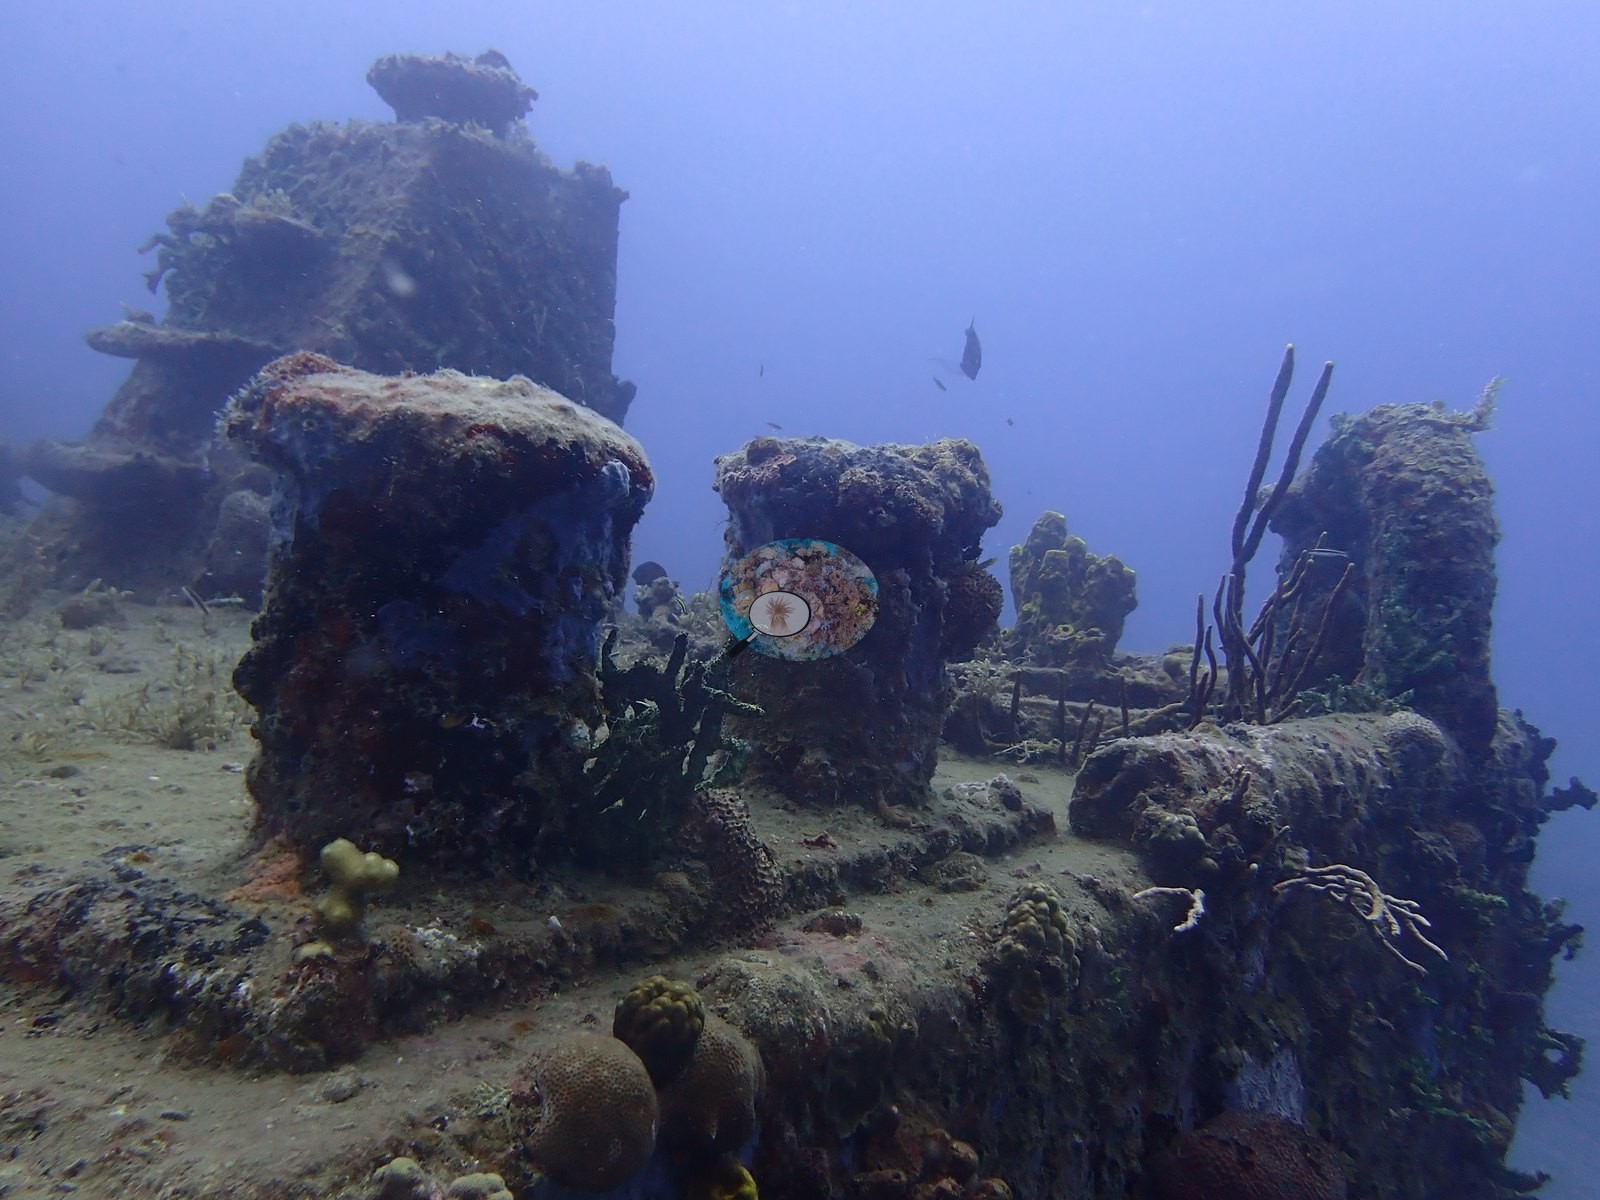
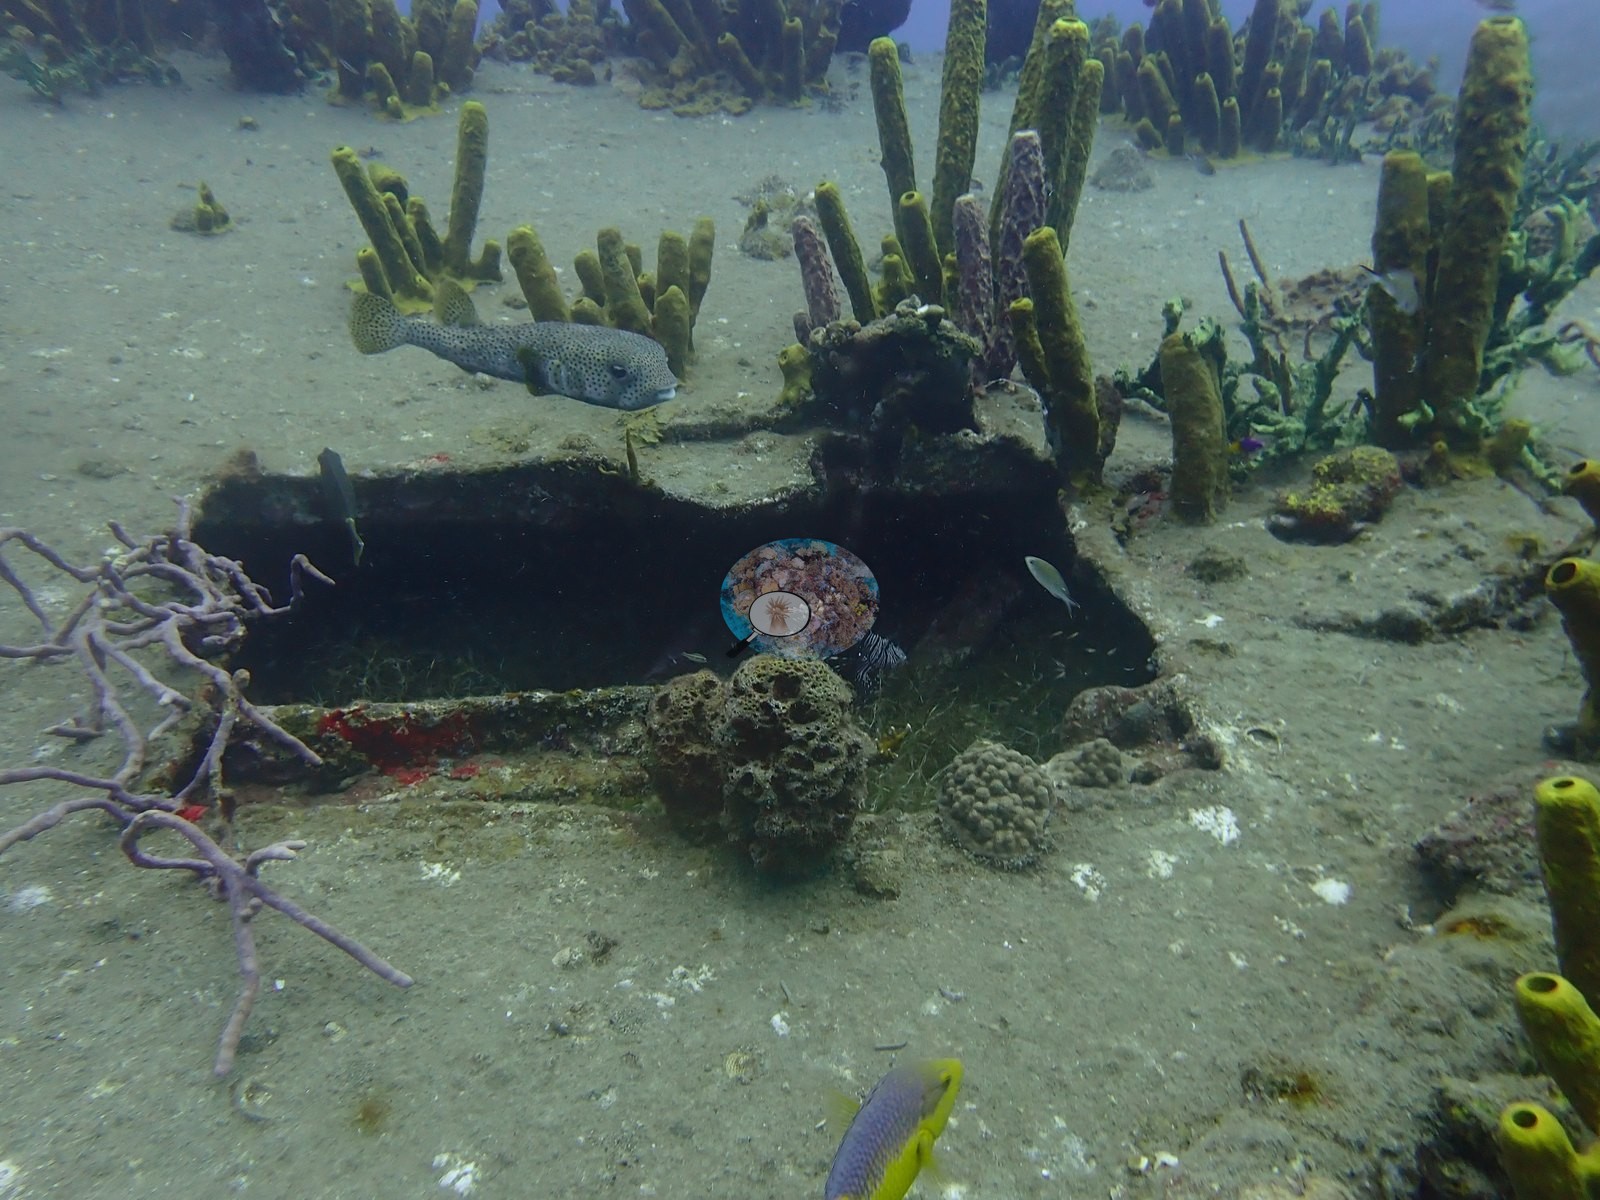
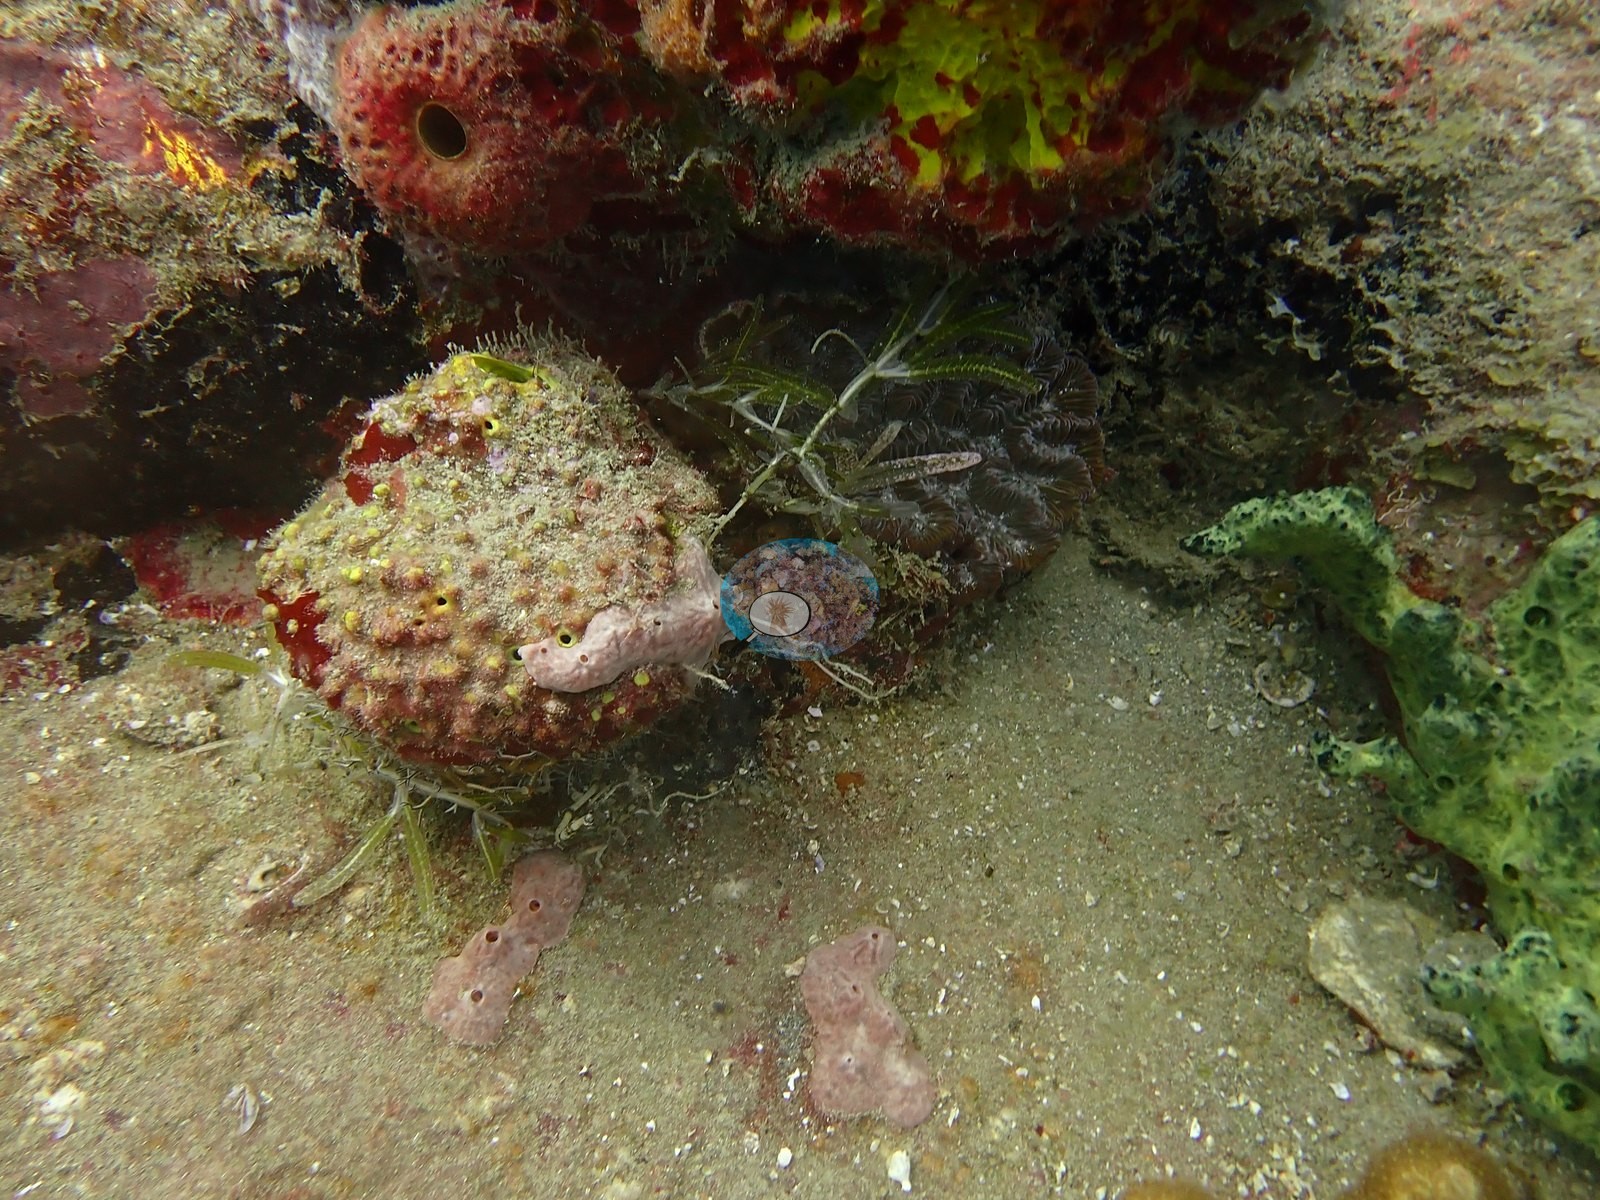
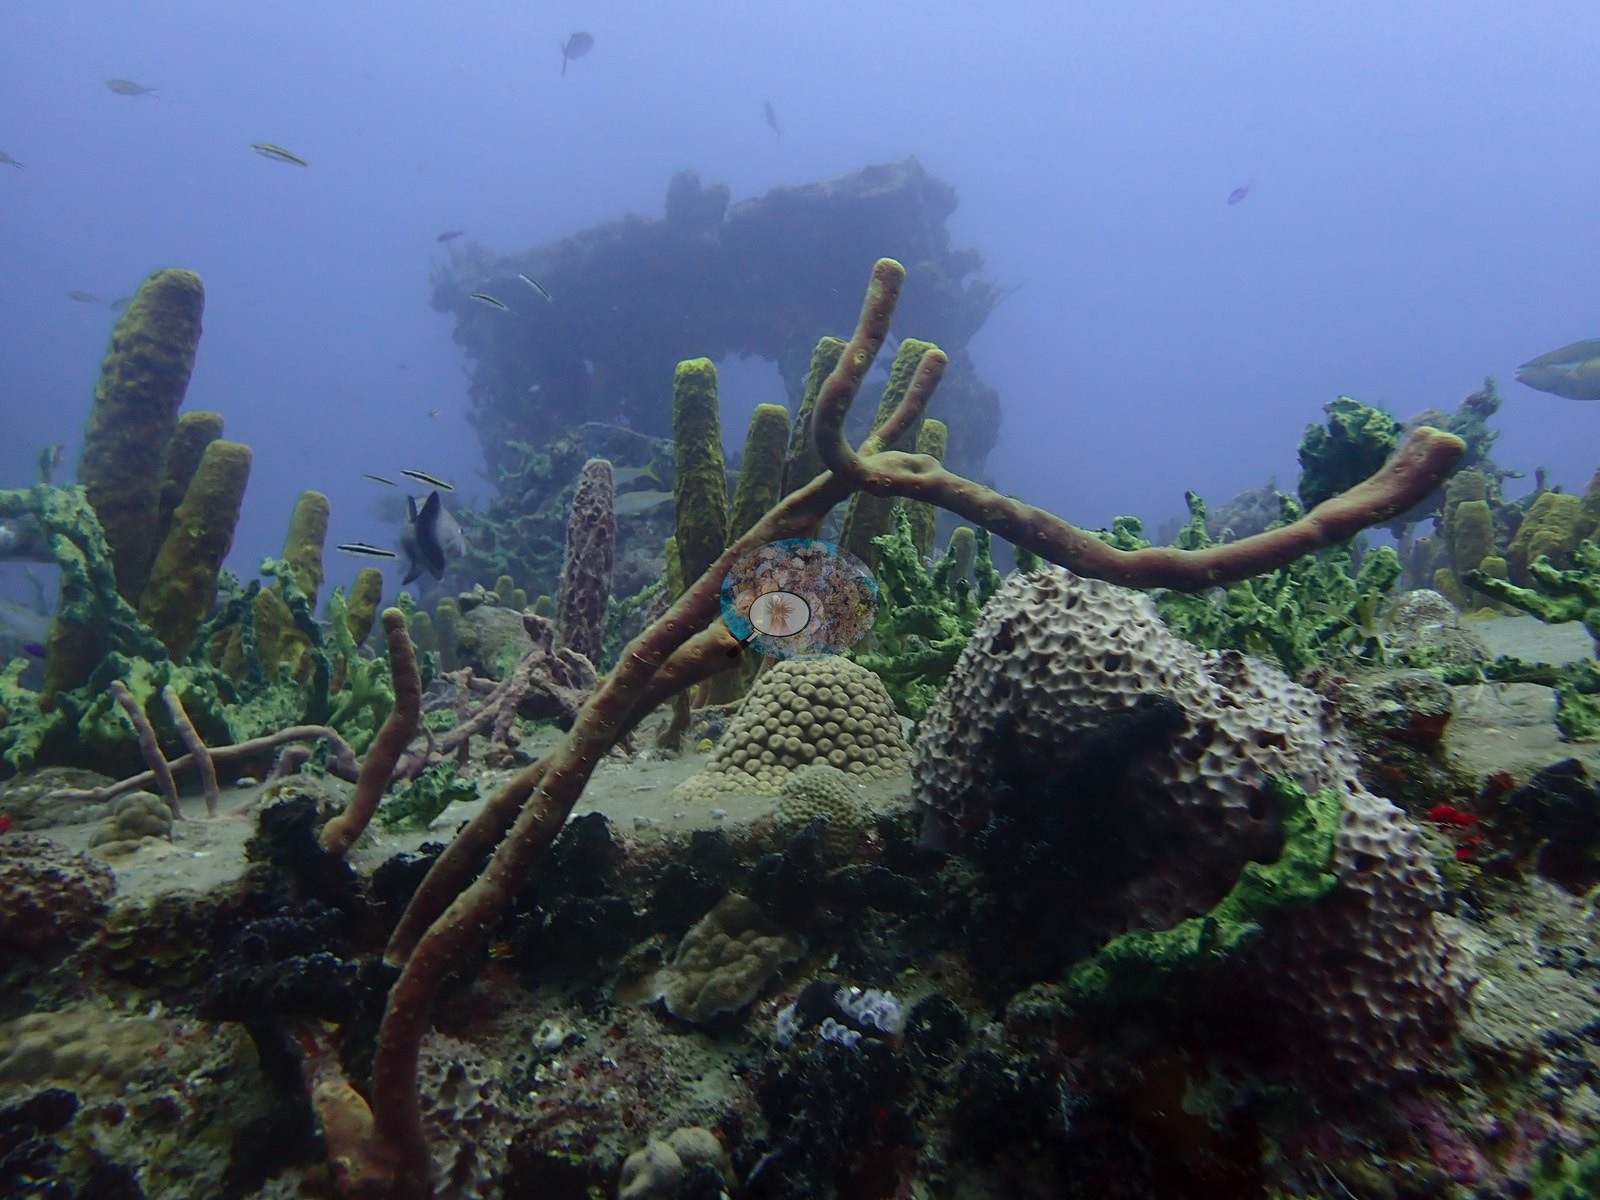
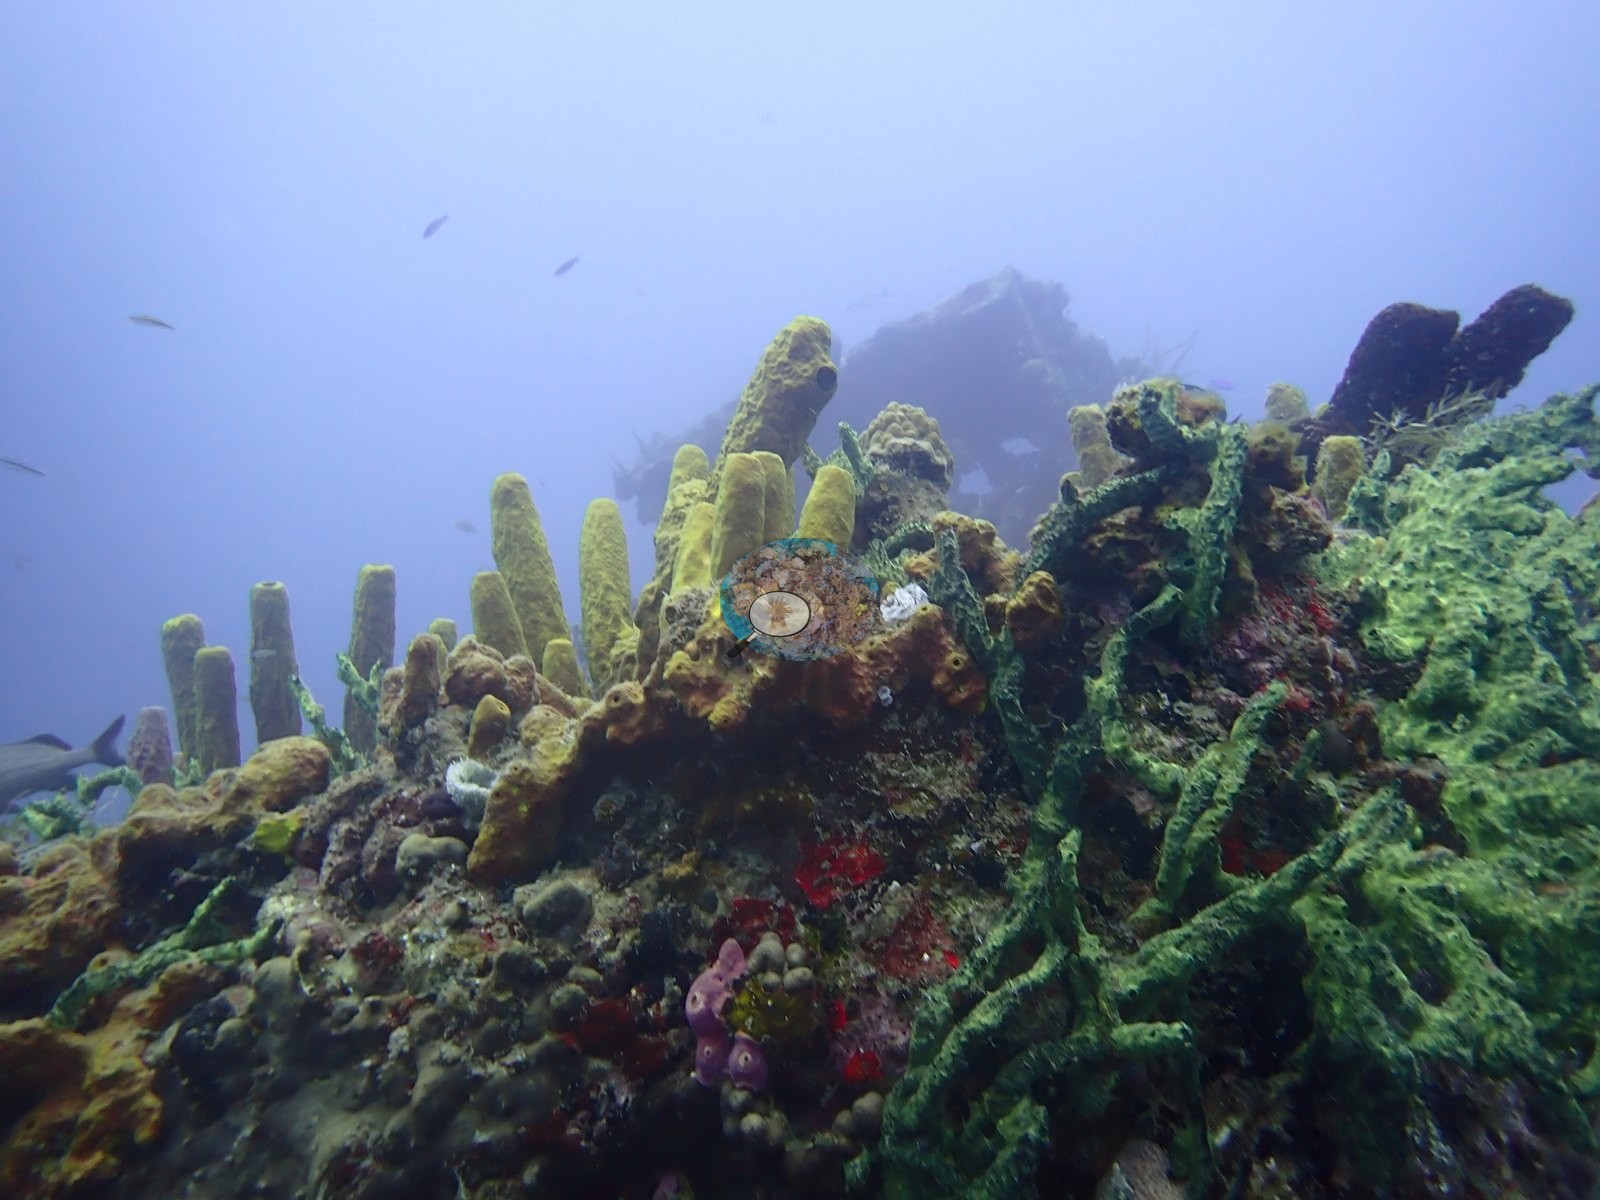
Sponges, not corals, are the dominant cover on the structures (e.g., Image 16).
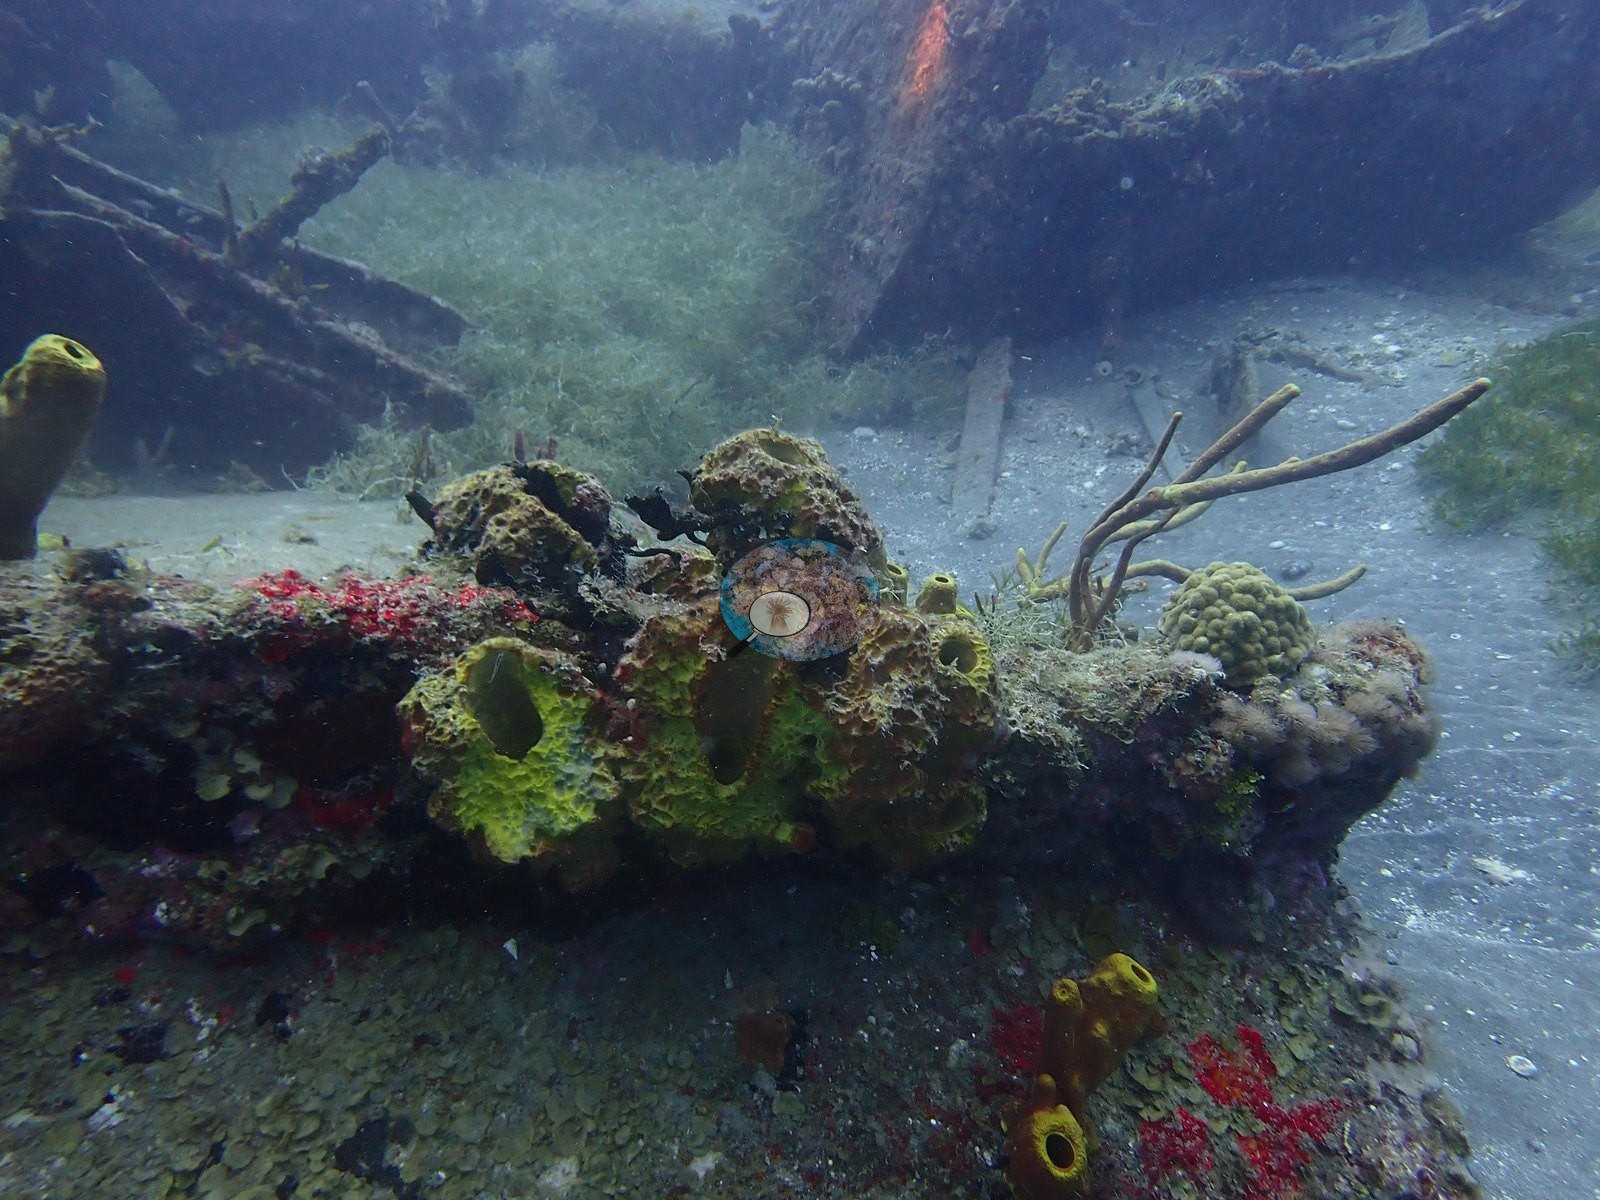
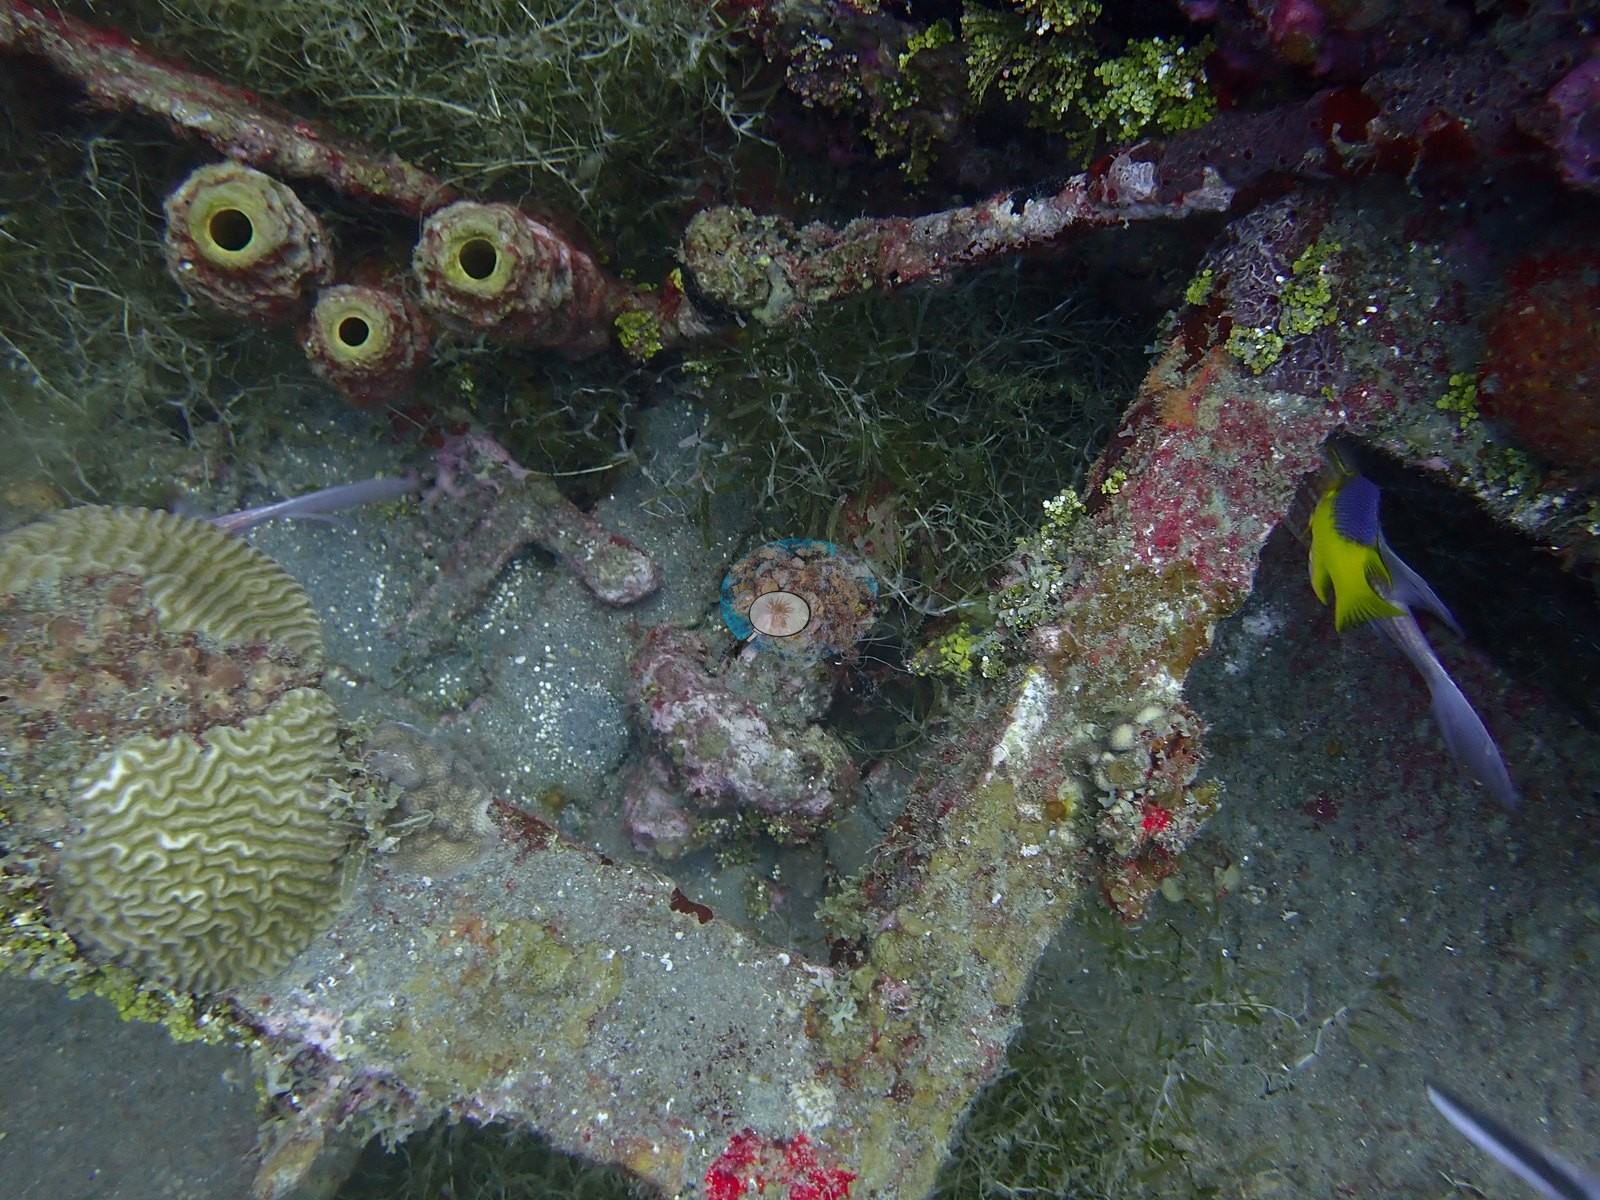
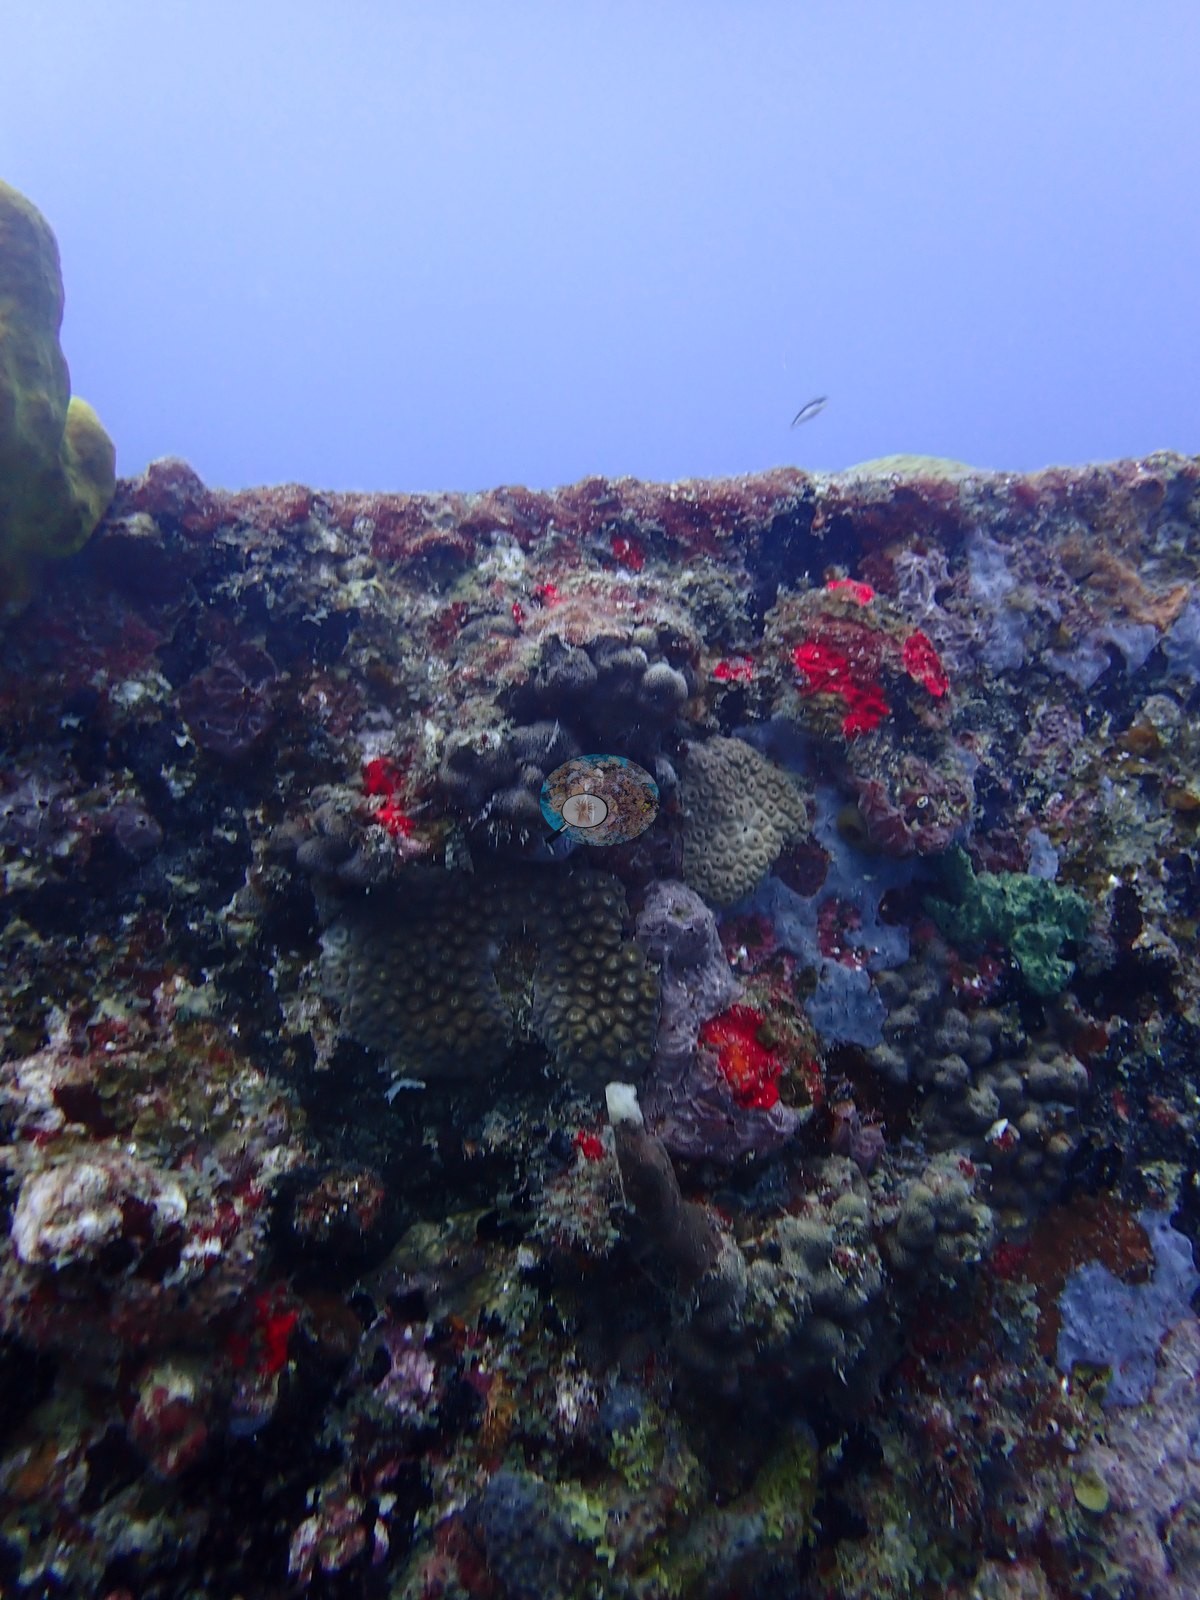
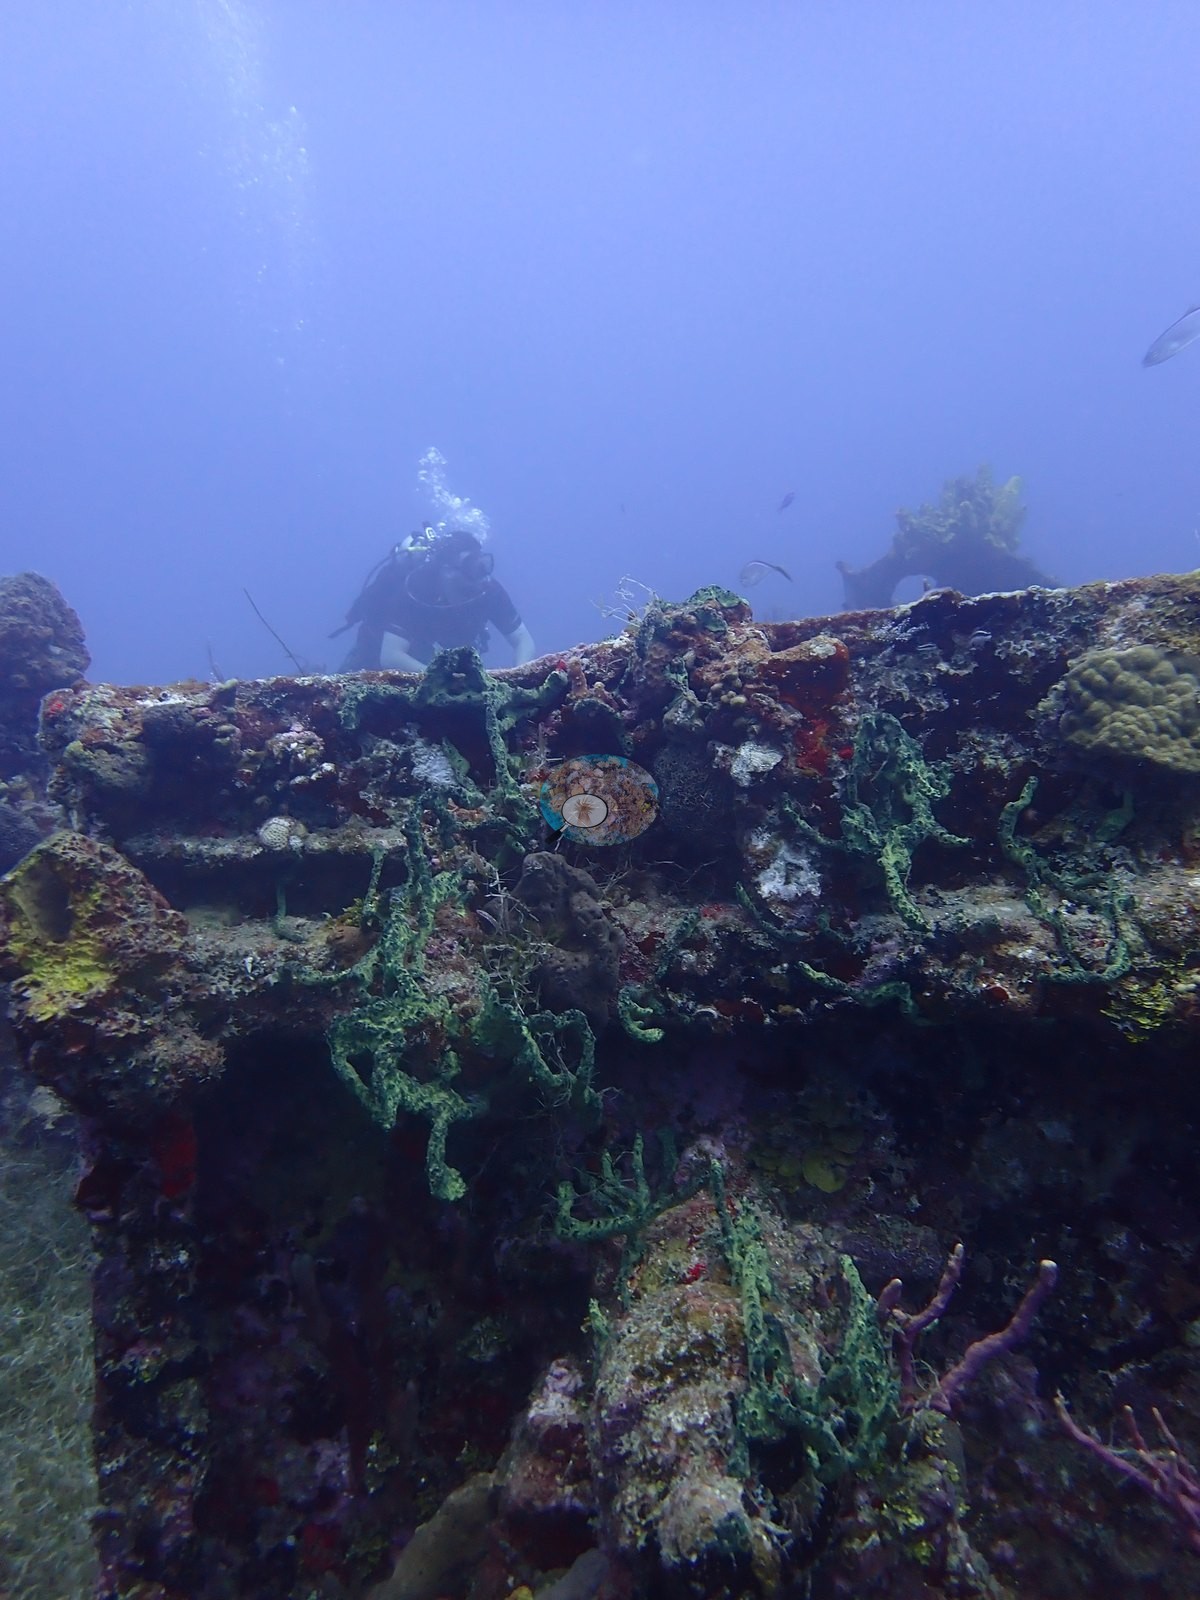
Yellow and orange tube sponges (Aplysina-type), branching lime-green rope sponges, maroon and scarlet encrusting sheets, pale green encrusting patches, and a pink-brown vase sponge cover most of the hard surface, with pink crustose coralline algae, filamentous turf, and small purple gorgonian sprigs filling the gaps (e.g., Image 29, Image 30, Image 34).
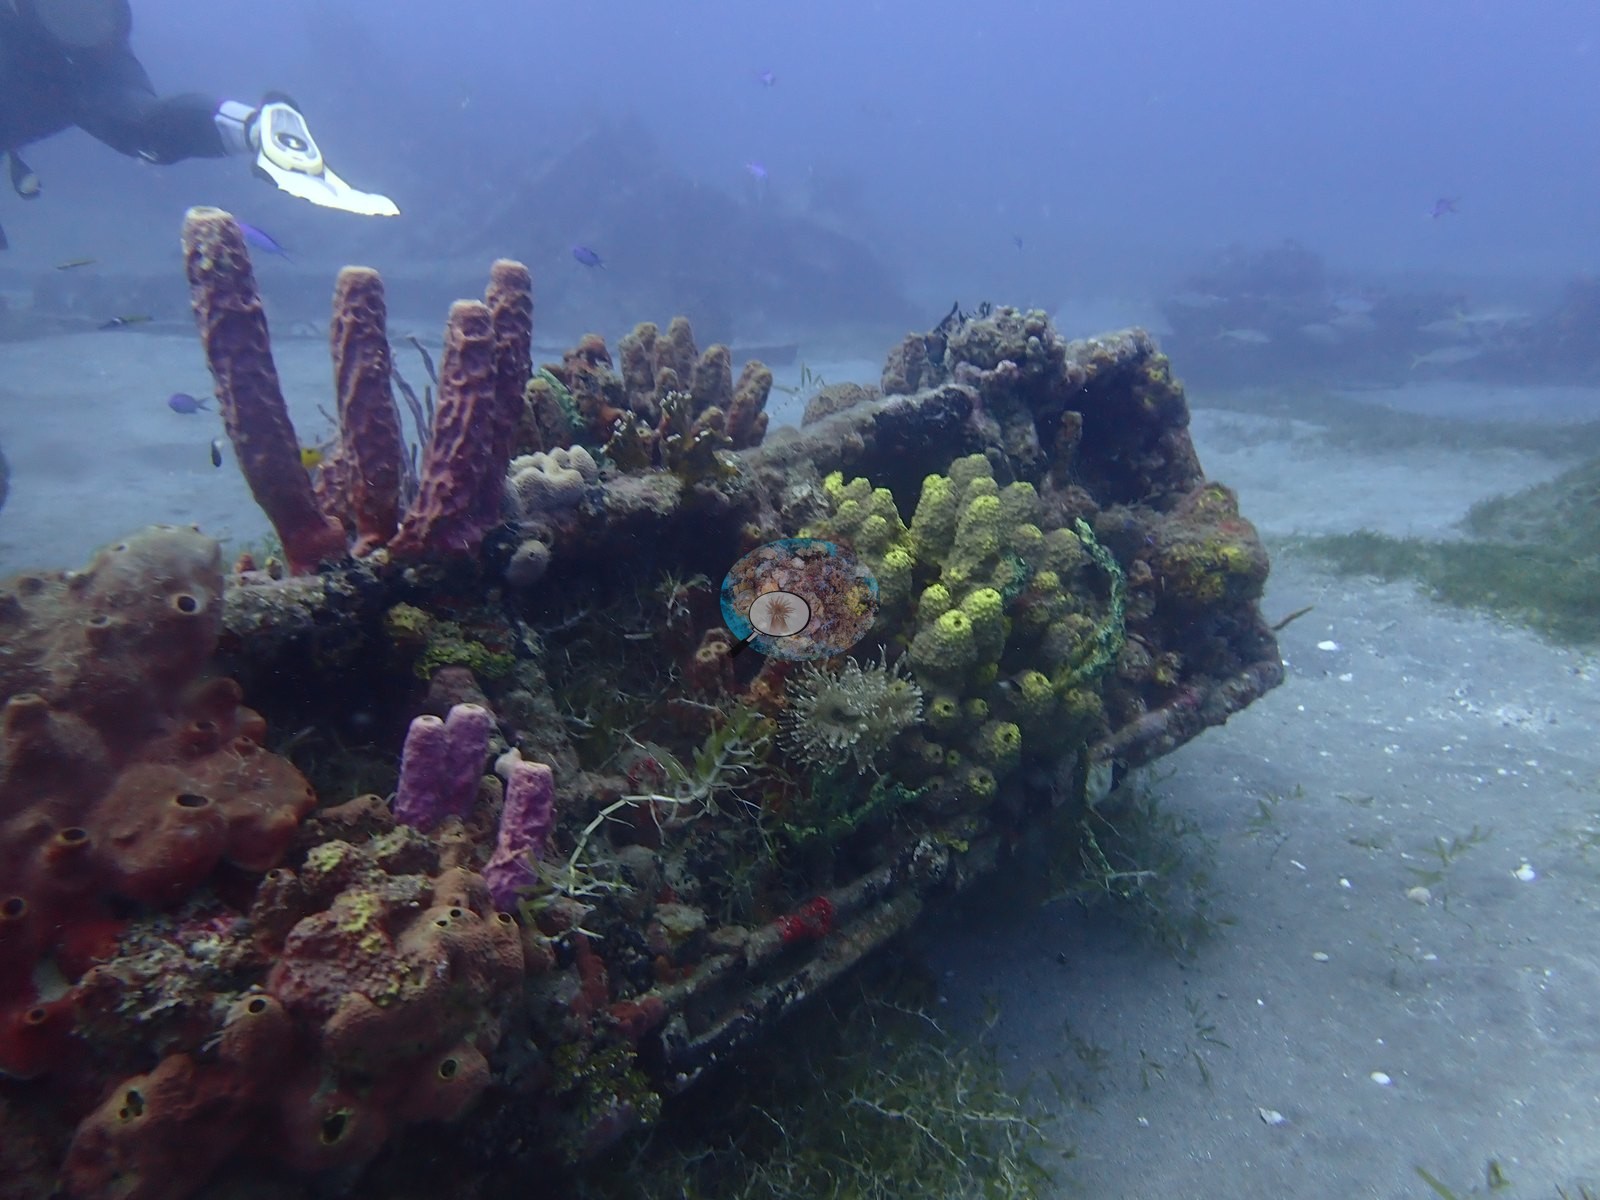
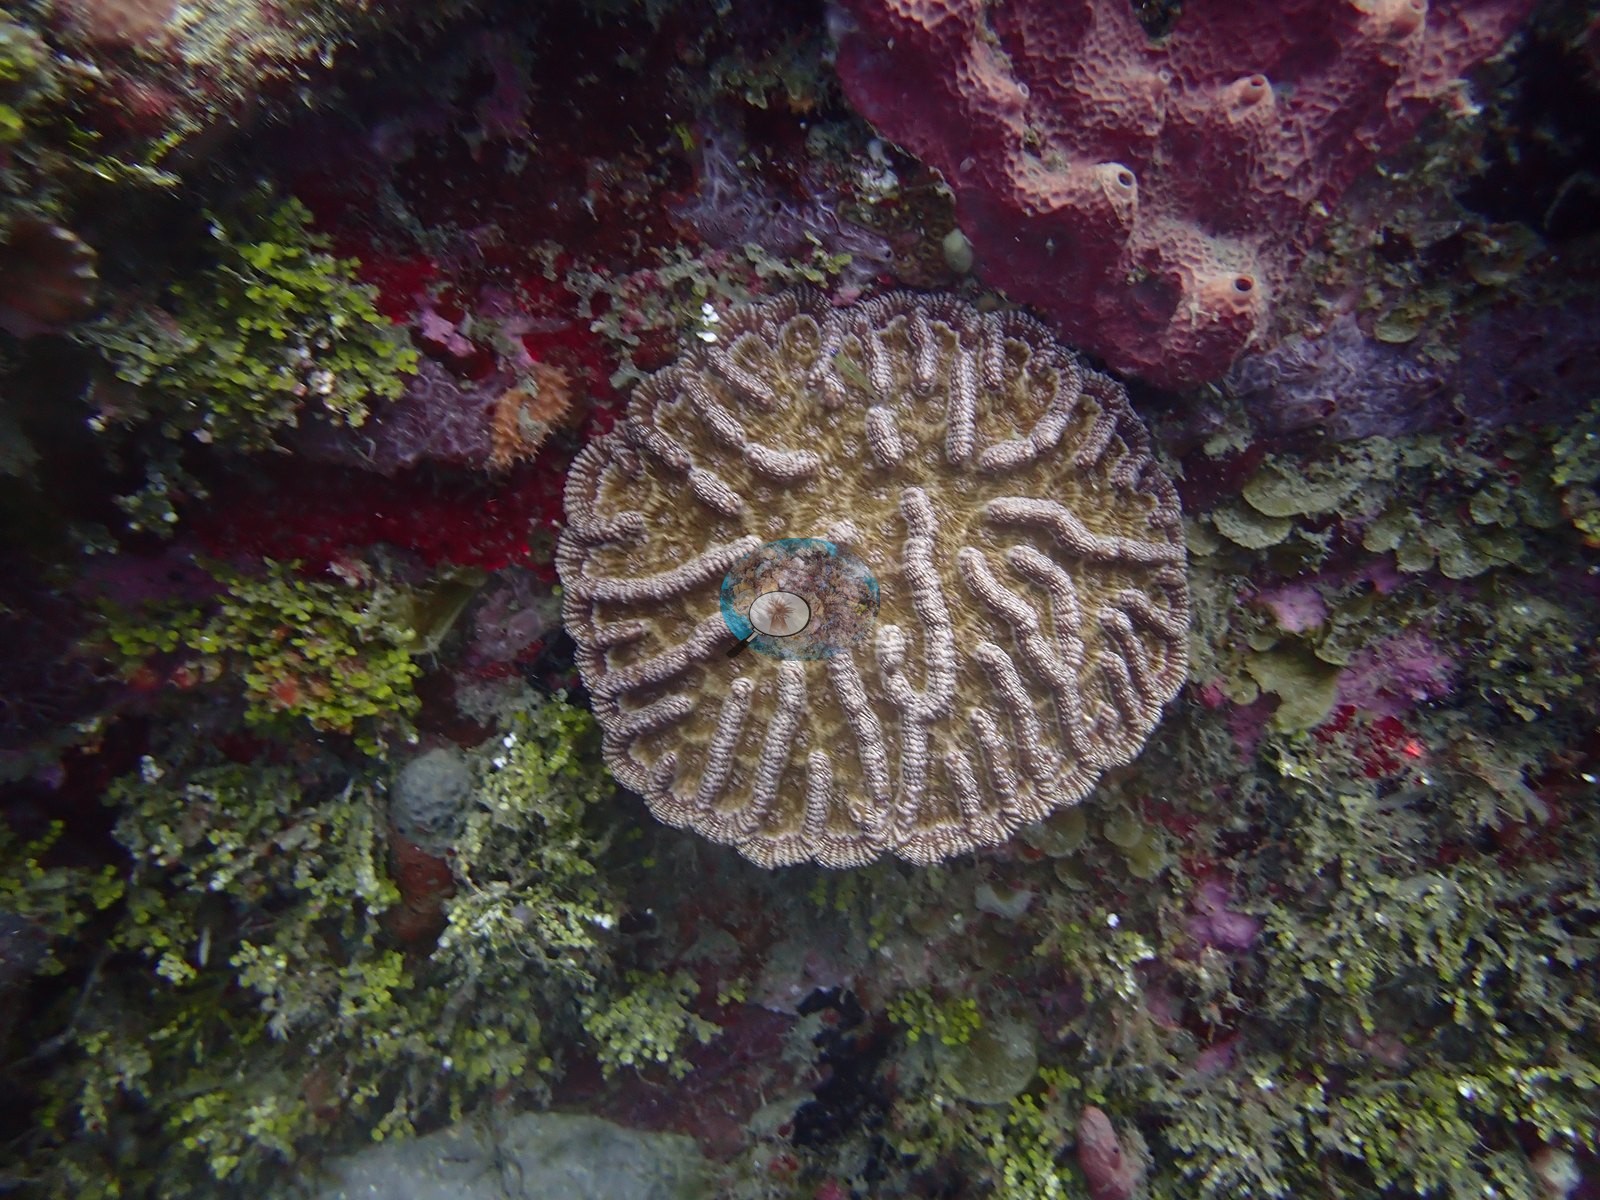
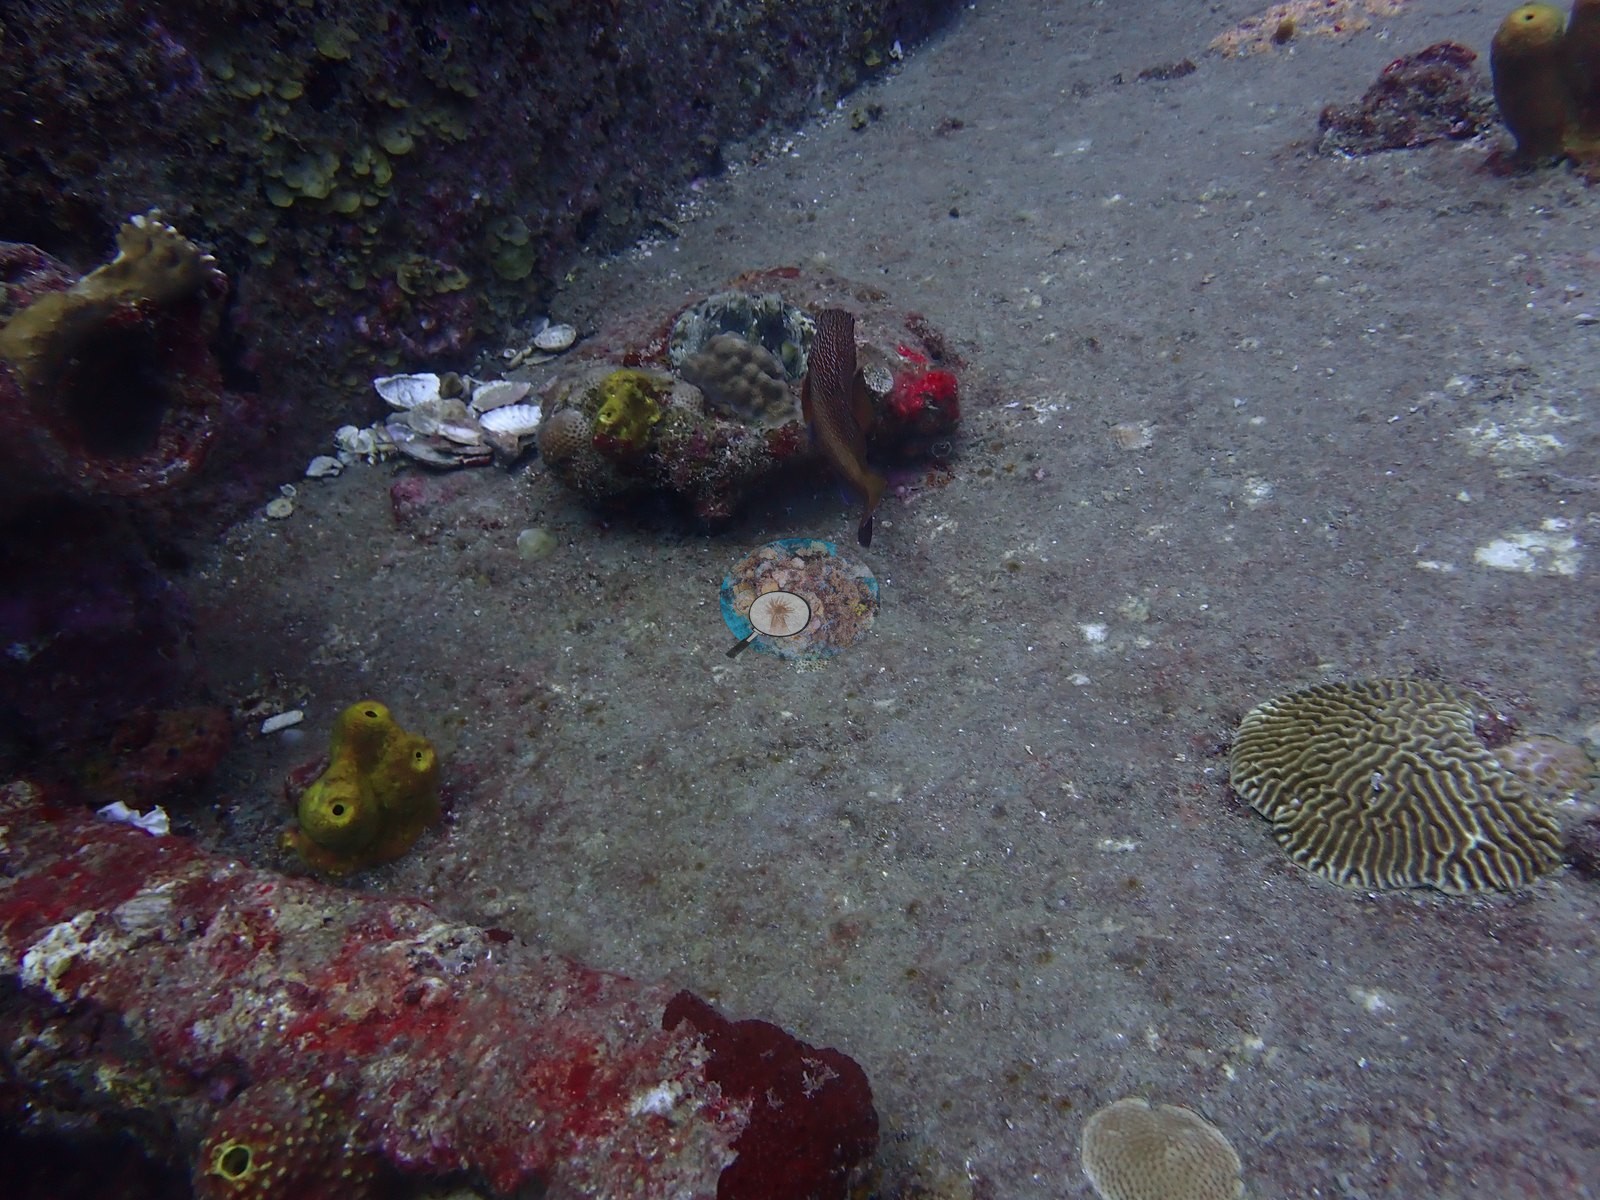
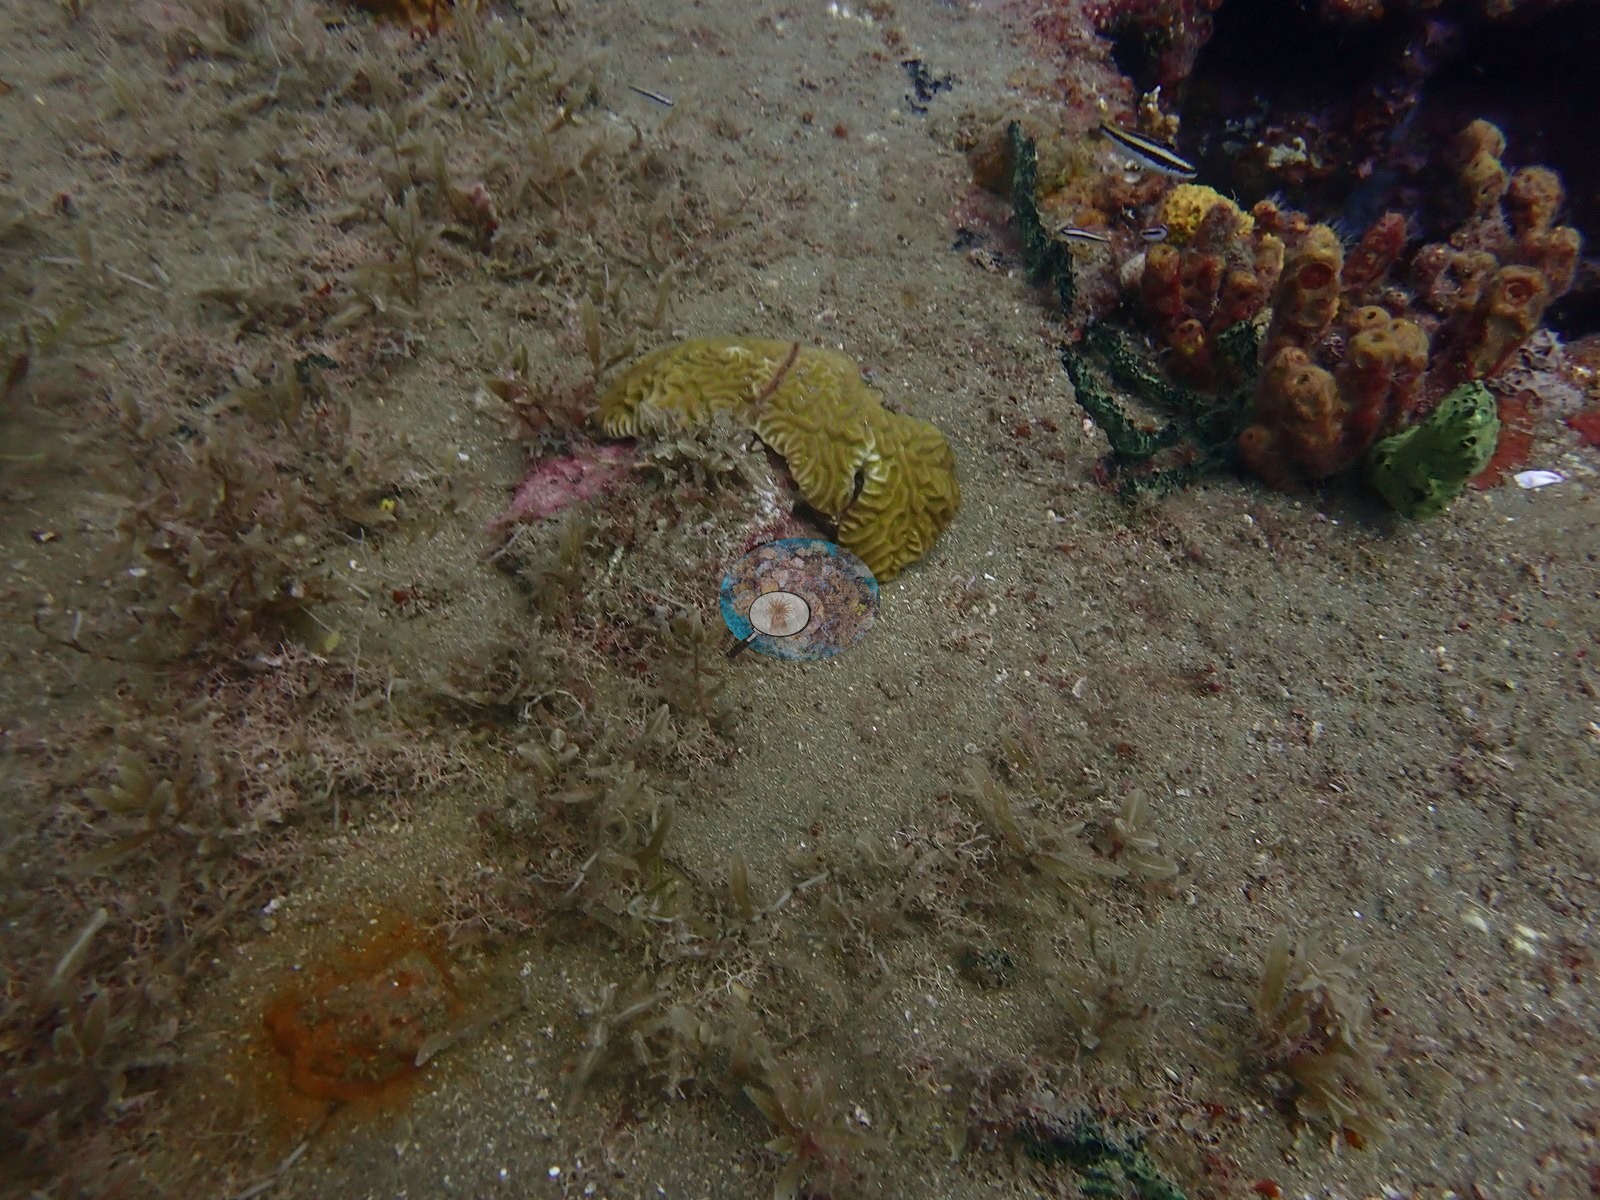
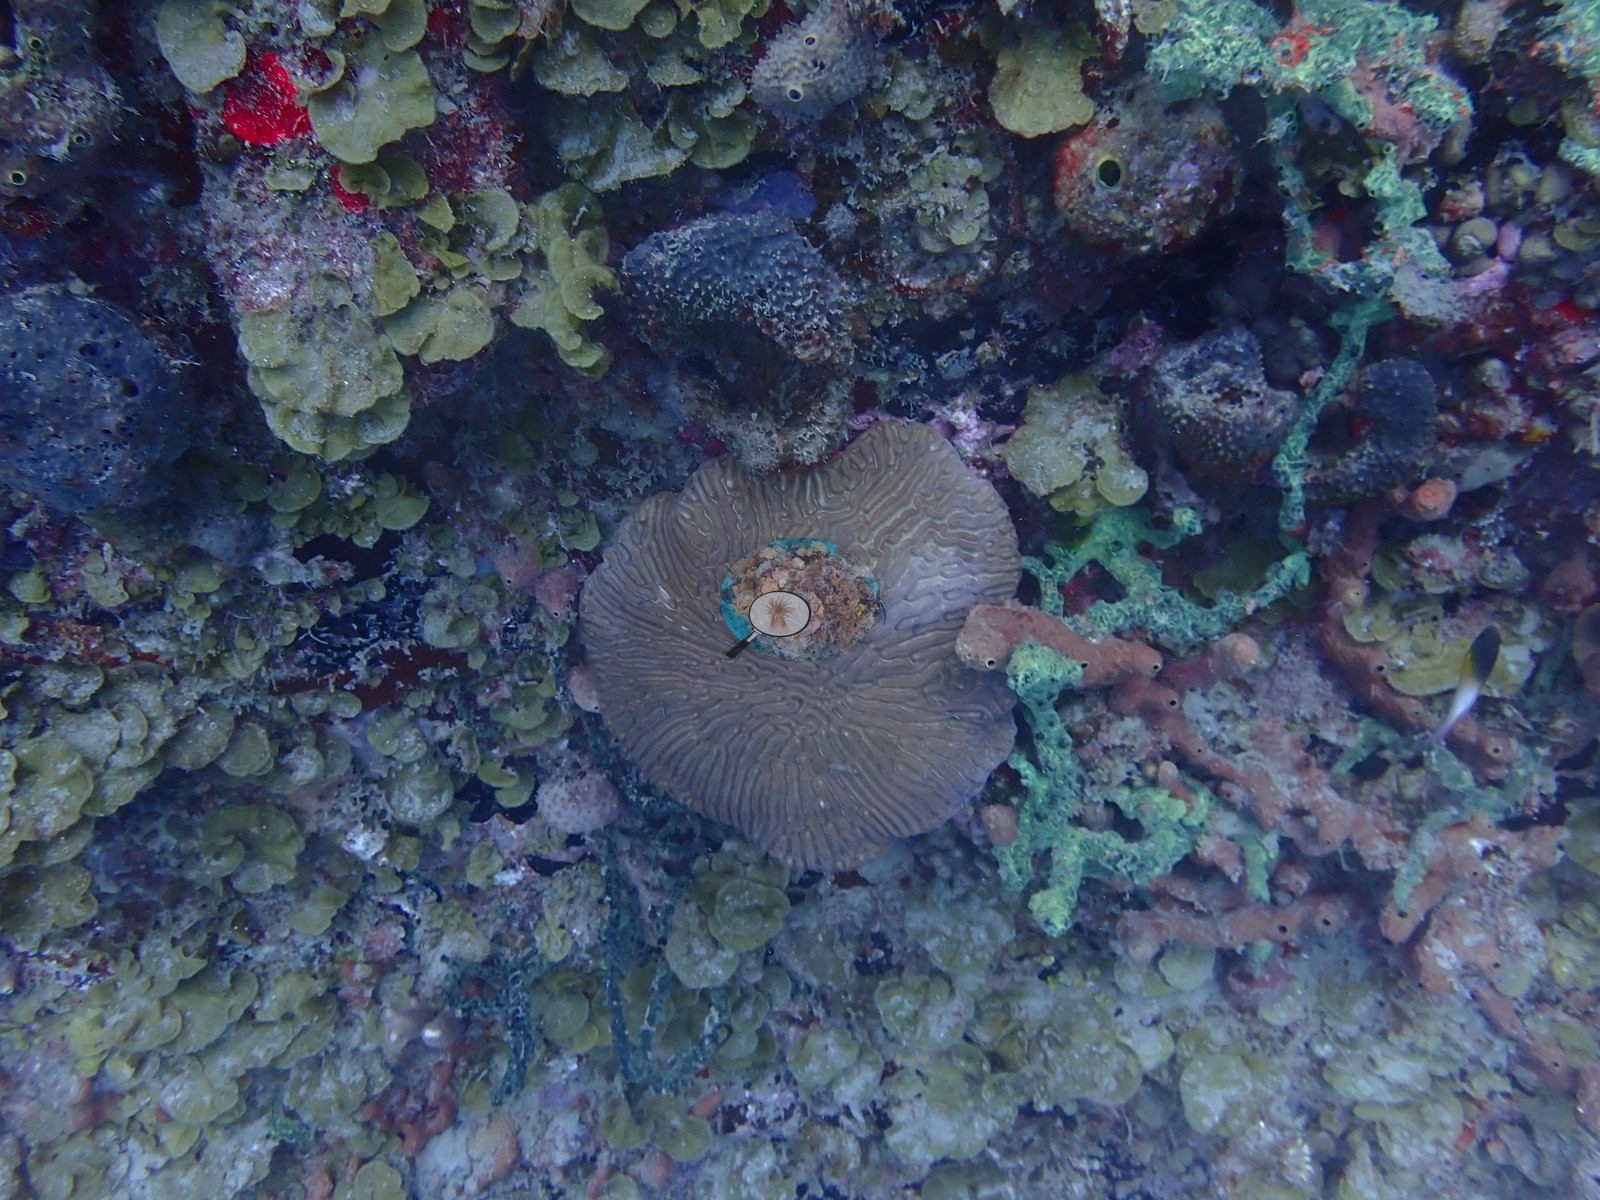
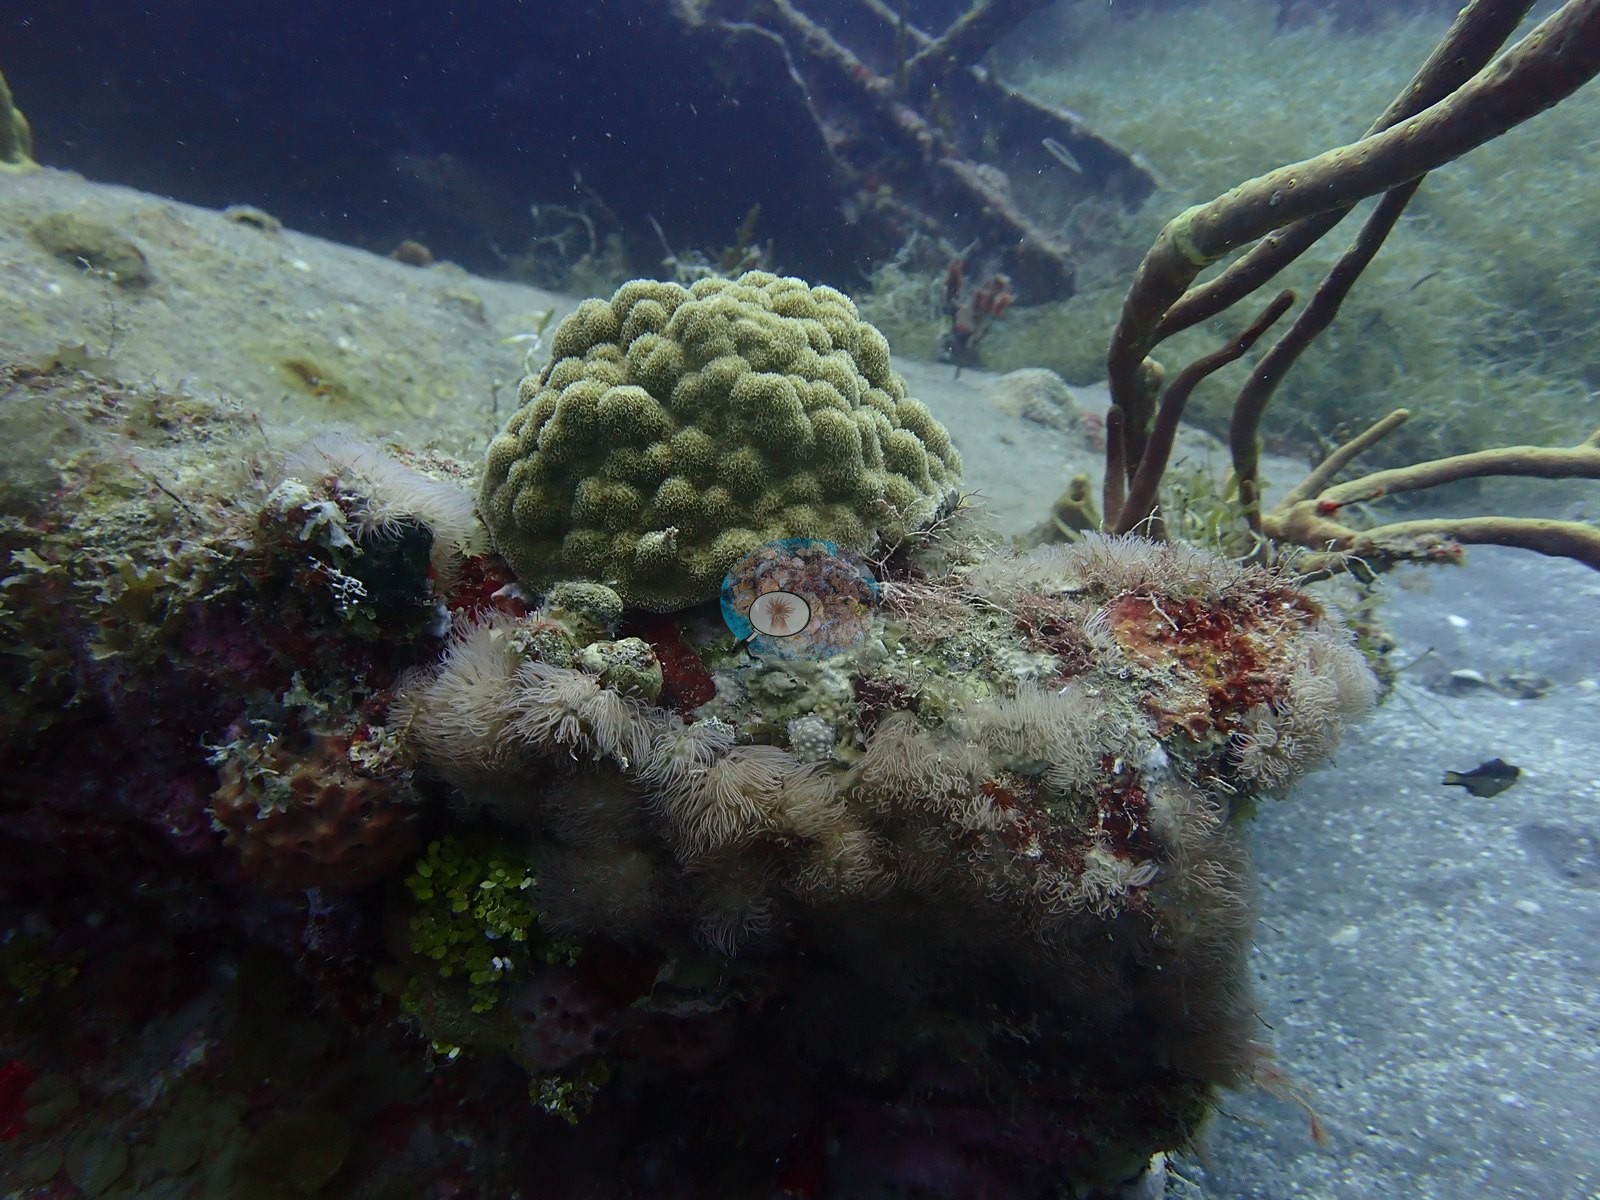
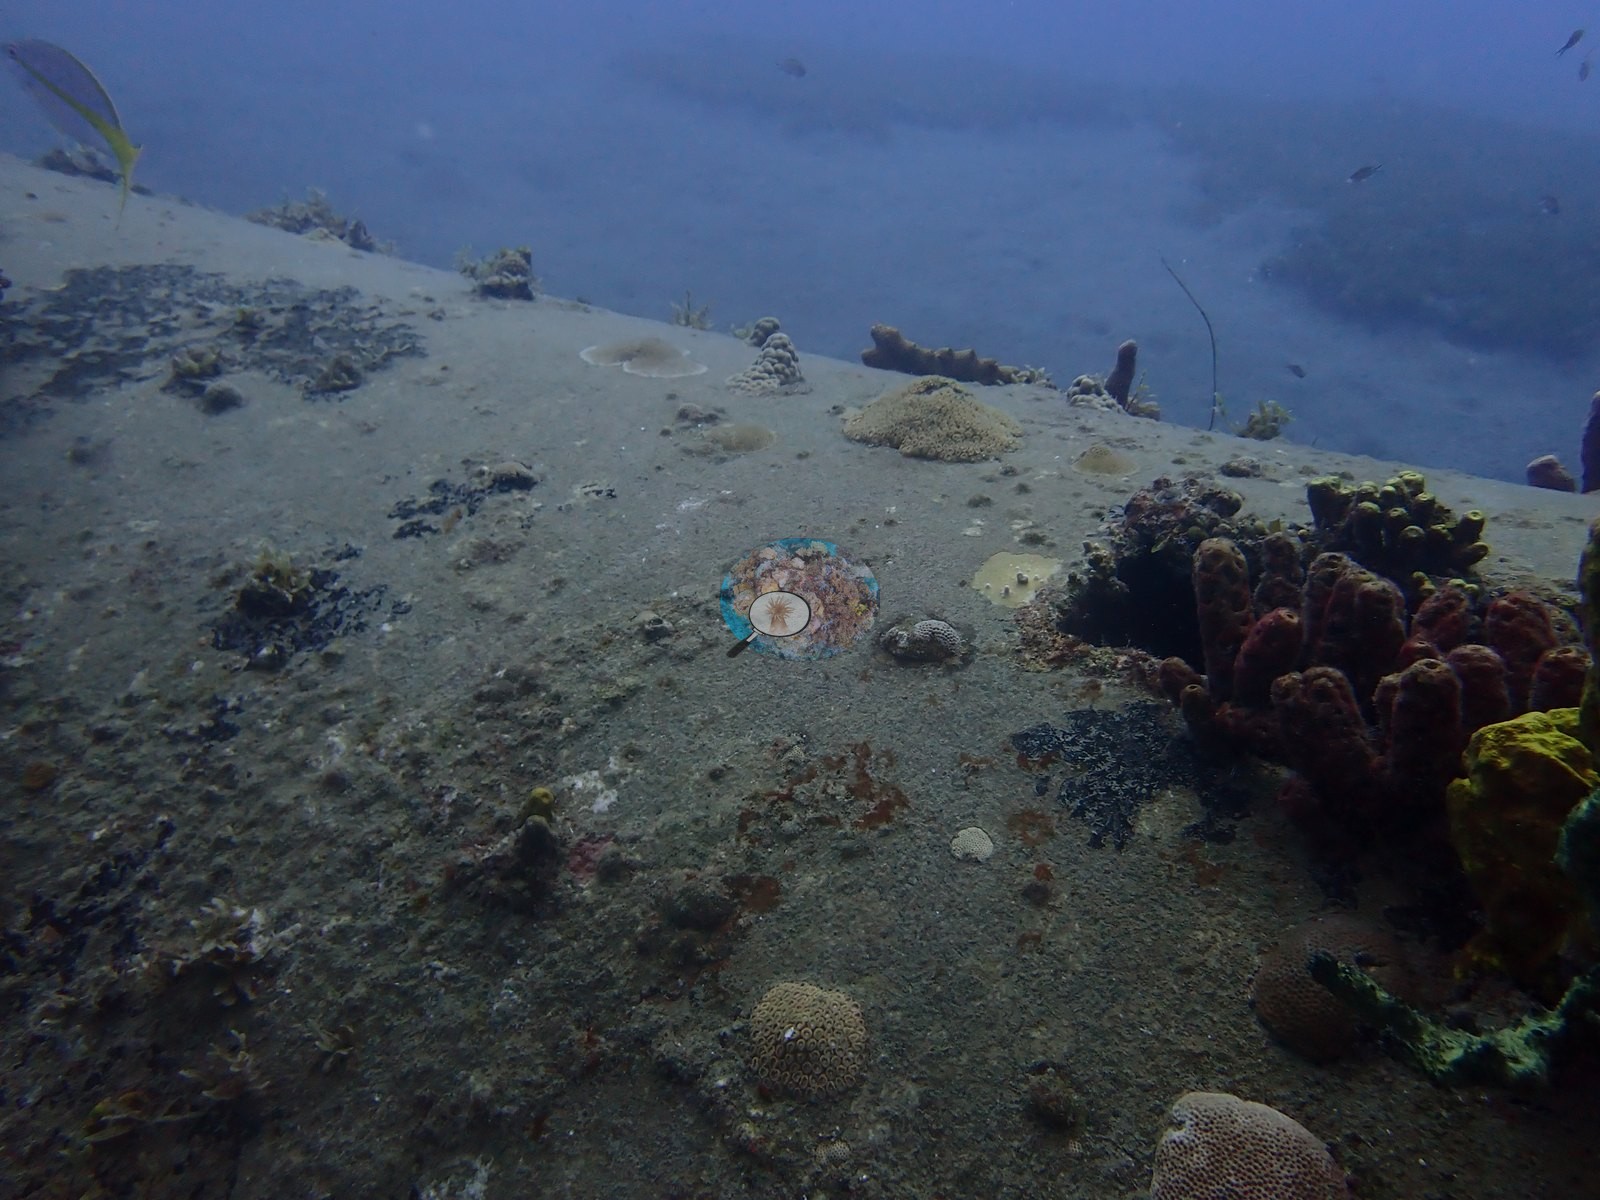
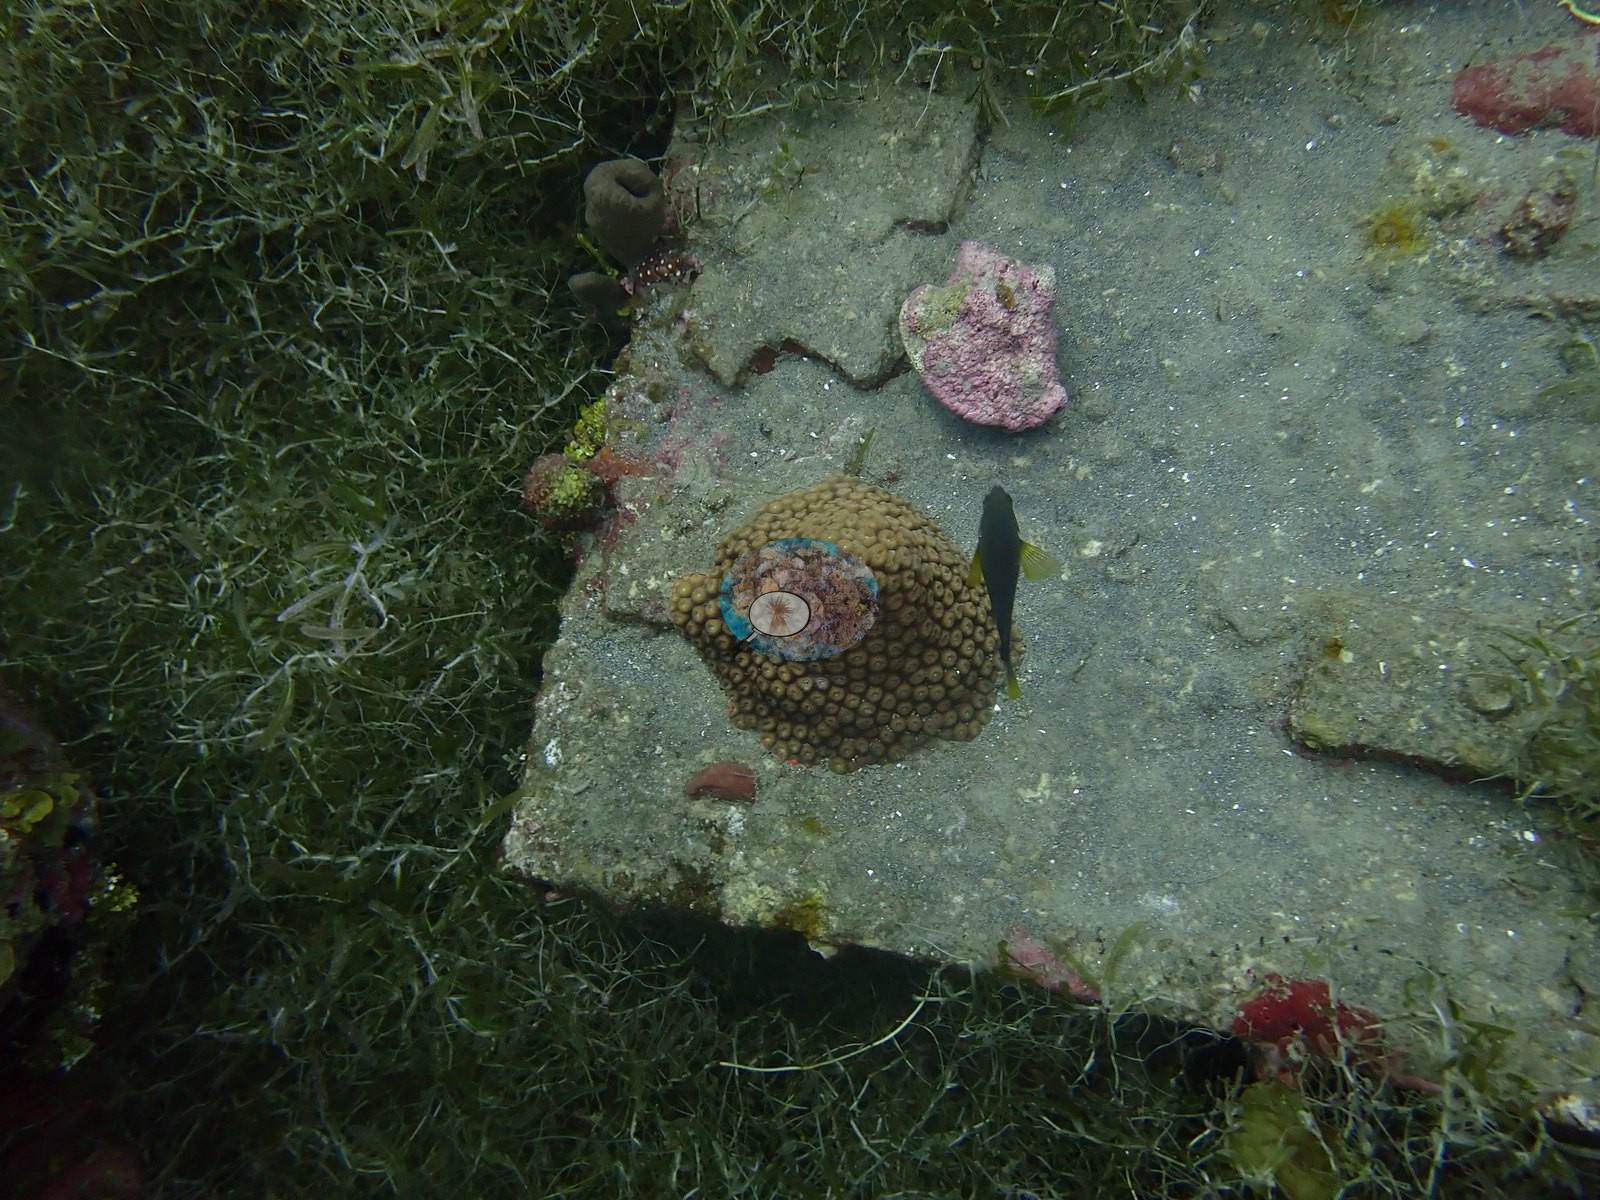
Stony coral is present but sparse and small-colonied: a cluster of knobby mustard-brown Porites-type colonies with pale pink margins, a single clean circular meandroid brain coral (Pseudodiploria/Diploria-type) about a hand-span across, a small yellow-green ridged coral resting on open sand beside a rope sponge, scattered mustard Porites astreoides-type domes on the flat plates, and a few small recruits dotting the concrete (e.g., Image 26, Image 40, Image 42, Image 46, Image 47).
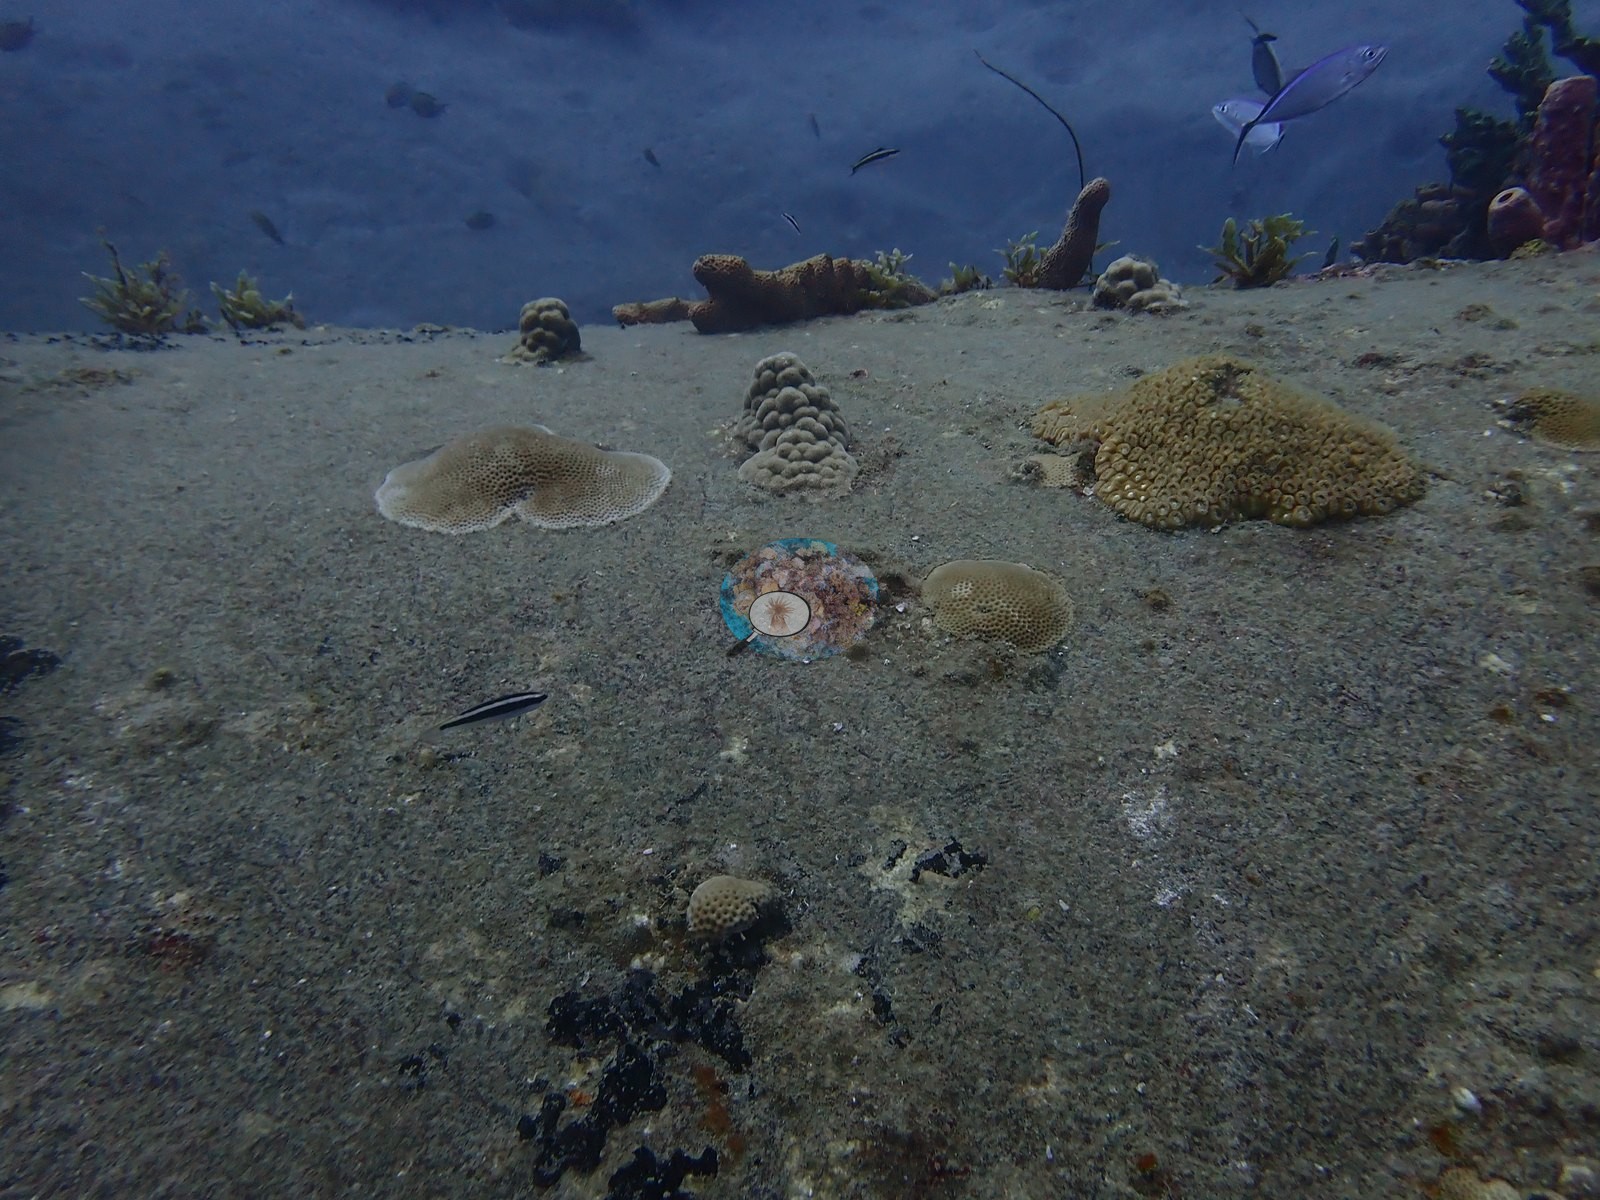
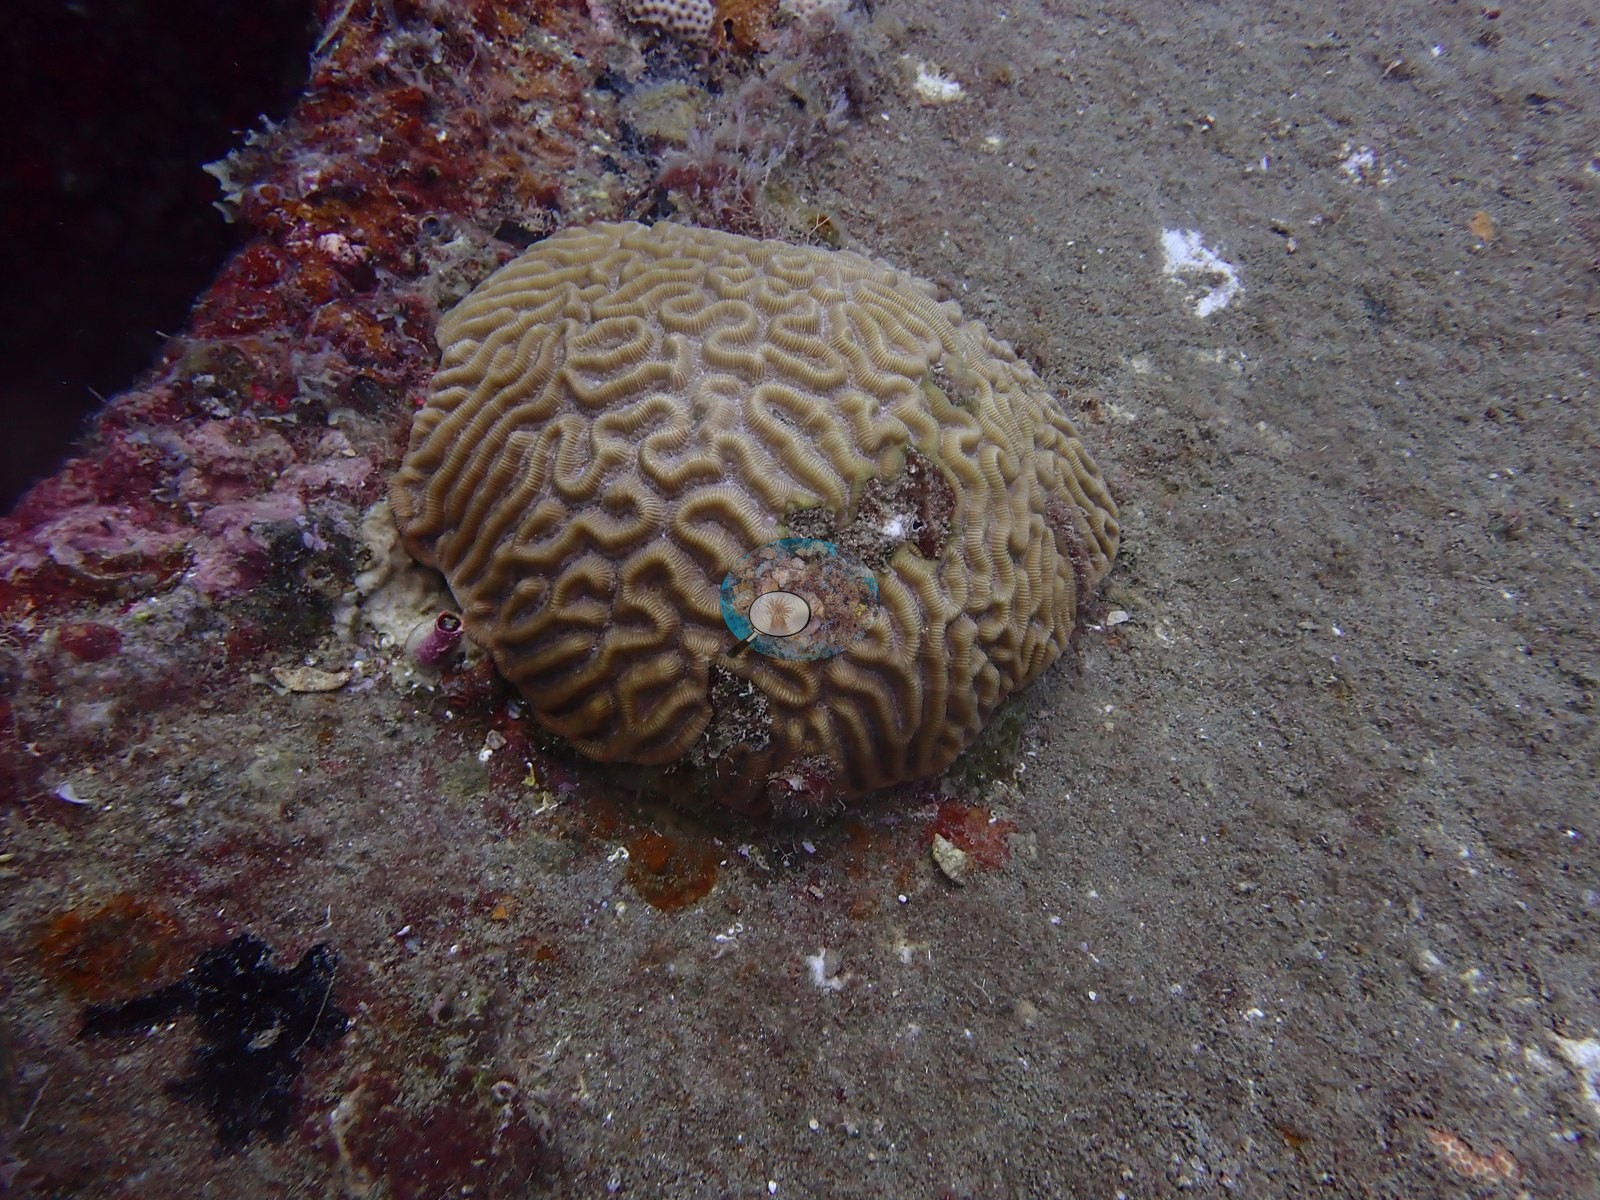
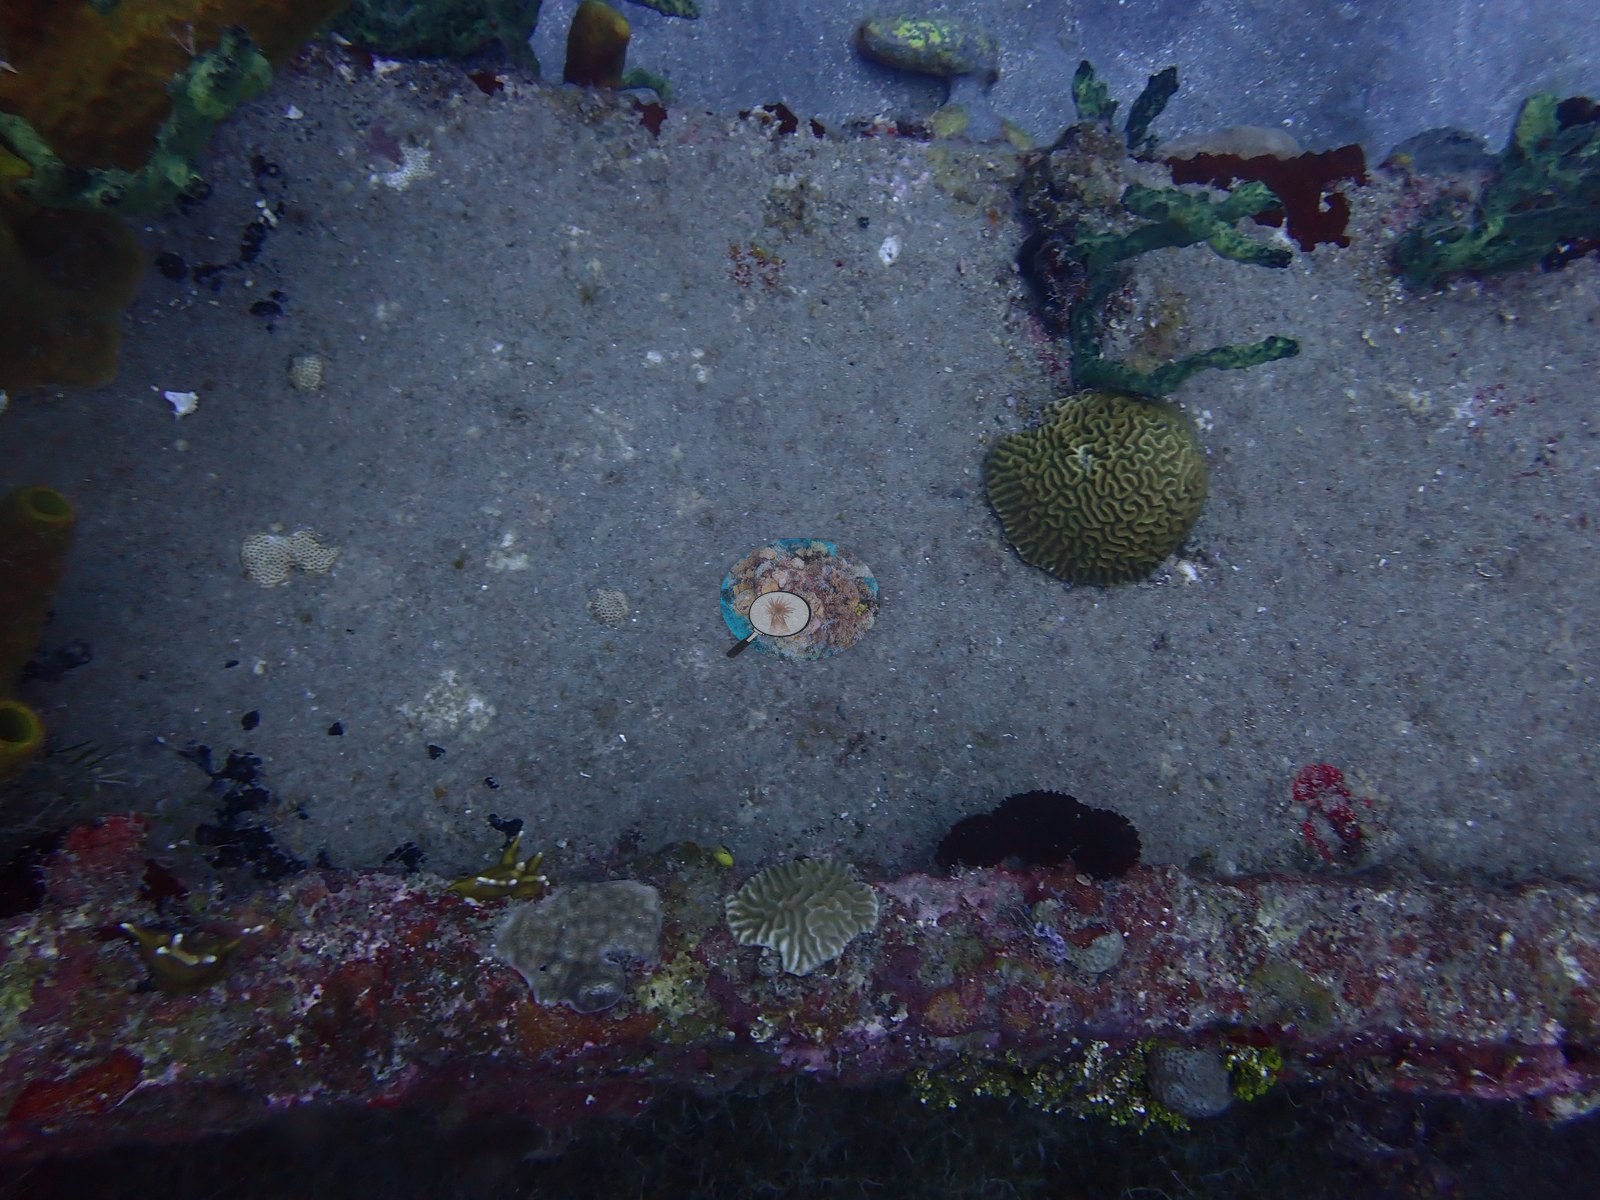
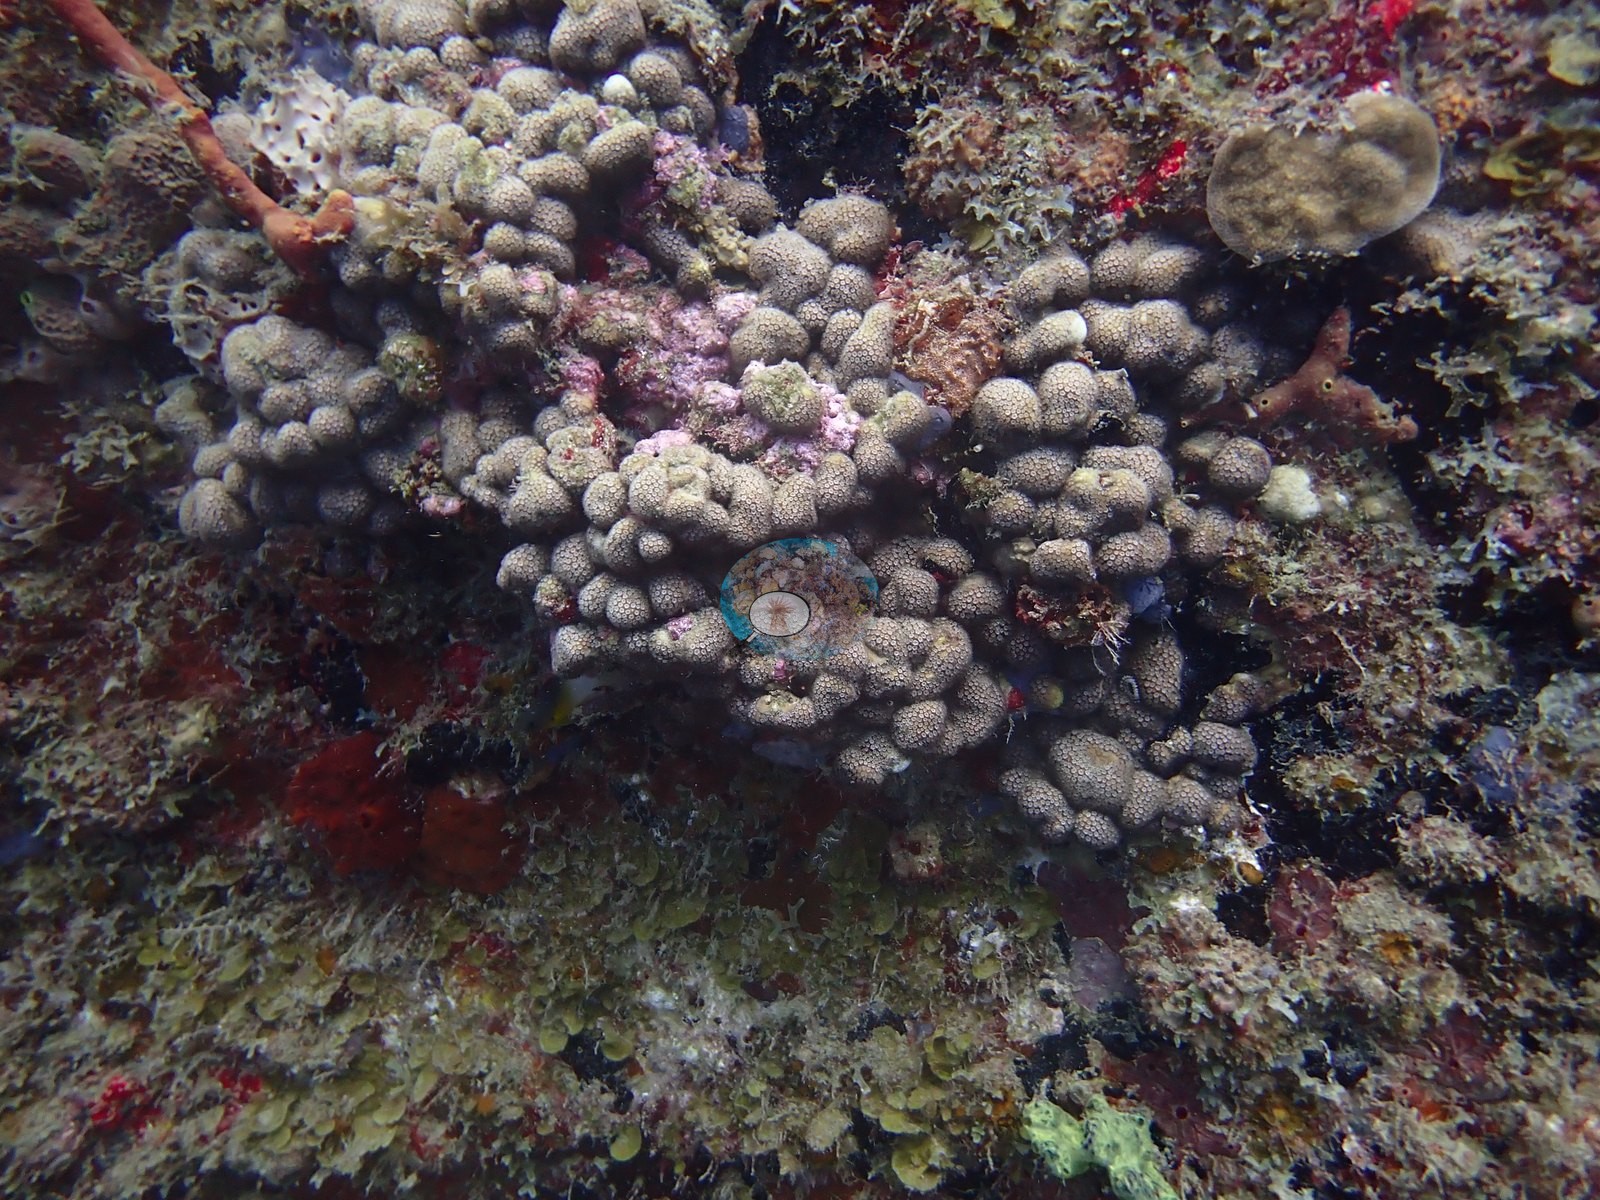
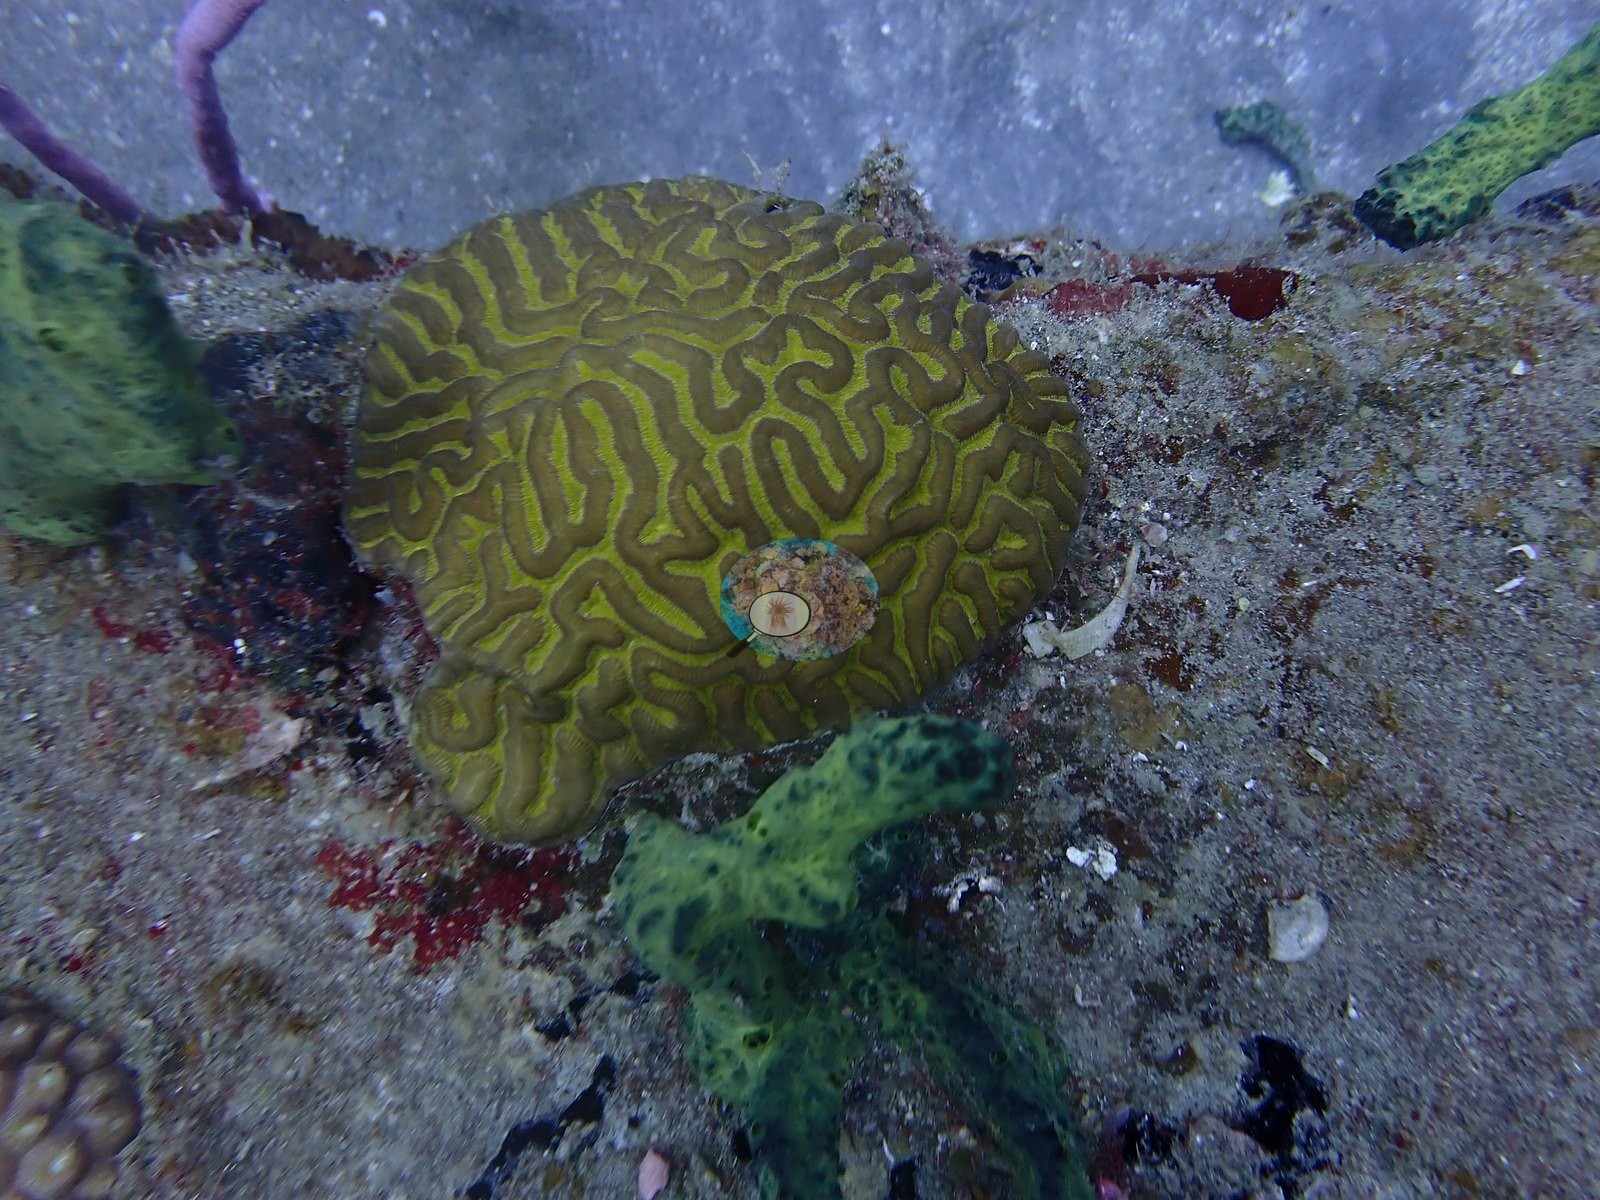
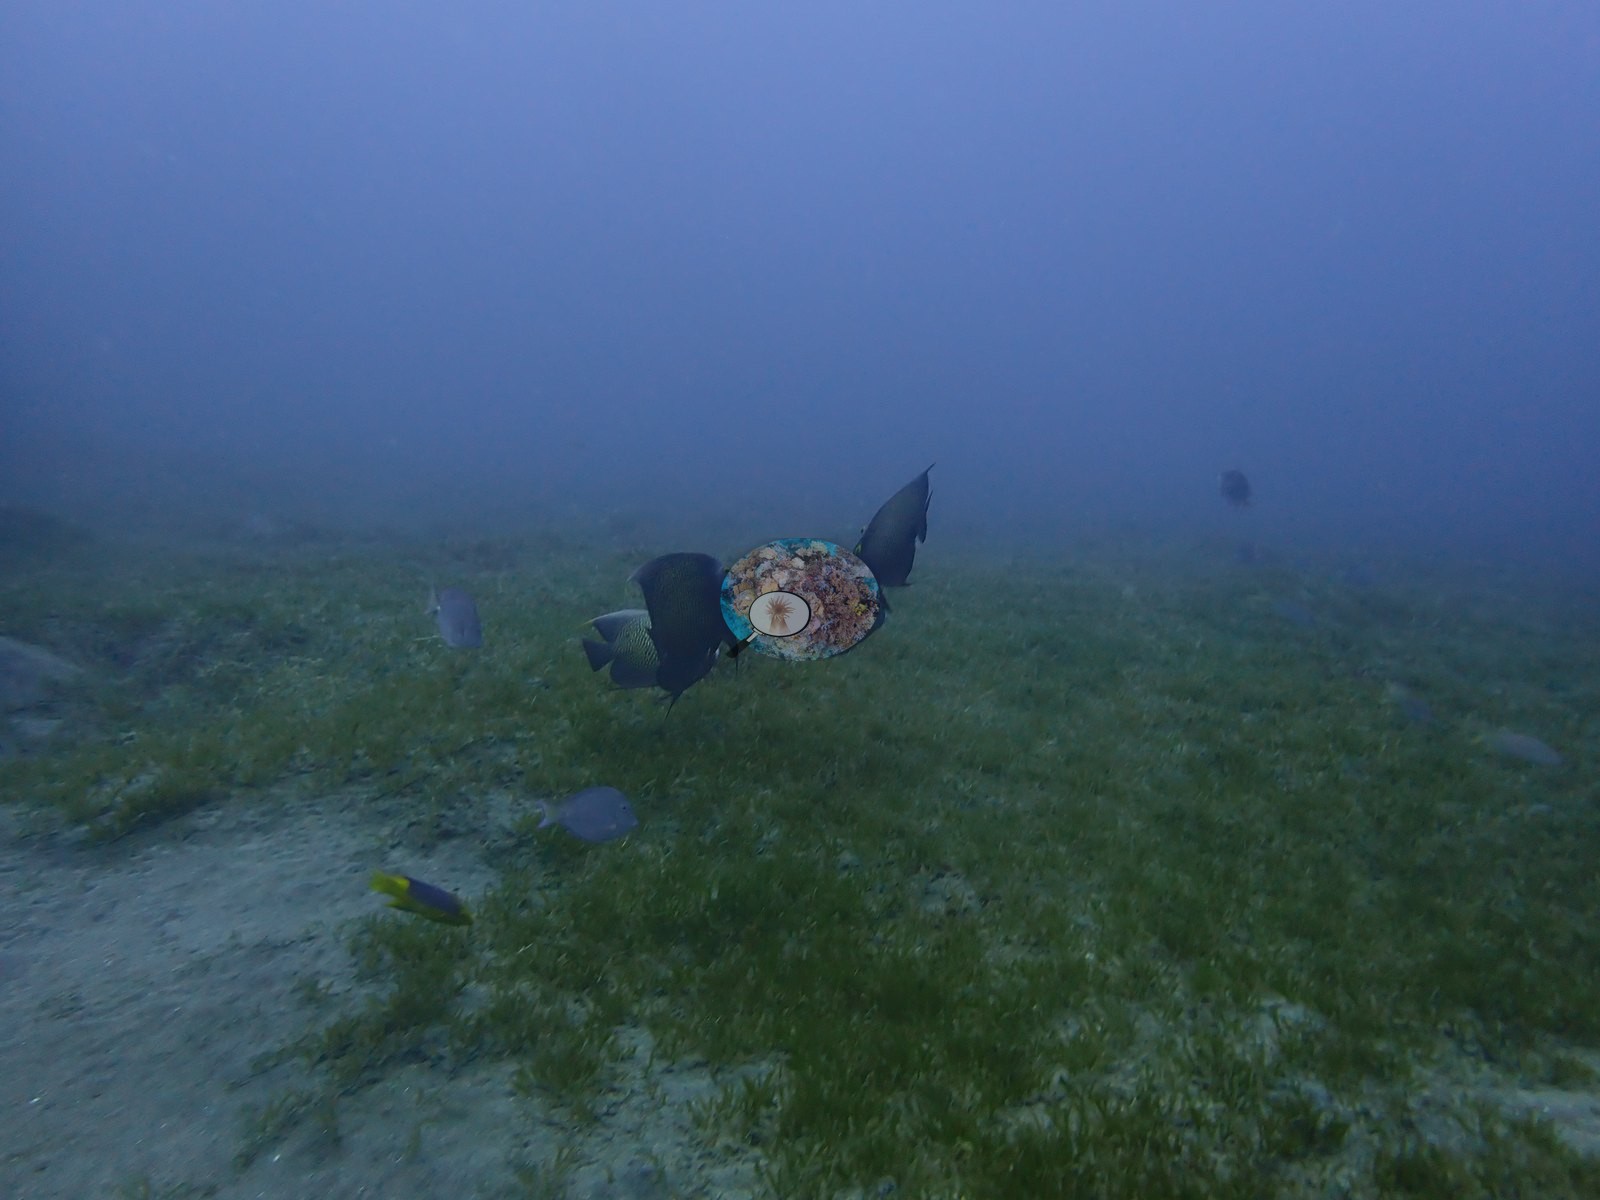
Between the built objects the bottom is fine gray-green volcanic sand, and one stretch of the dive crosses a dense seagrass meadow where dark-bodied fish with trailing dorsal filaments, consistent with French angelfish, drift over the blades — too dim to confirm the identification (e.g., Image 33).
Coral cover
Coral cover: 4.6% — a blind Claude computer-vision point count of 103 of Anderson's unedited photographs (20 points per photo; water, fish, and obstructions excluded). Other computer-vision methods are listed in the method table. Wreck and artificial-structure site: this cover value counts coral growing on man-made structure (steel, concrete, wreck debris) and the bottom around it, so it isn't comparable with natural-reef cover or with regional averages.
Stressors
Notably, no bleached, pale, or freshly dead coral tissue was resolved in any of the 16 frames reviewed — the few colonies present carry normal pigment.
Fish and other fauna
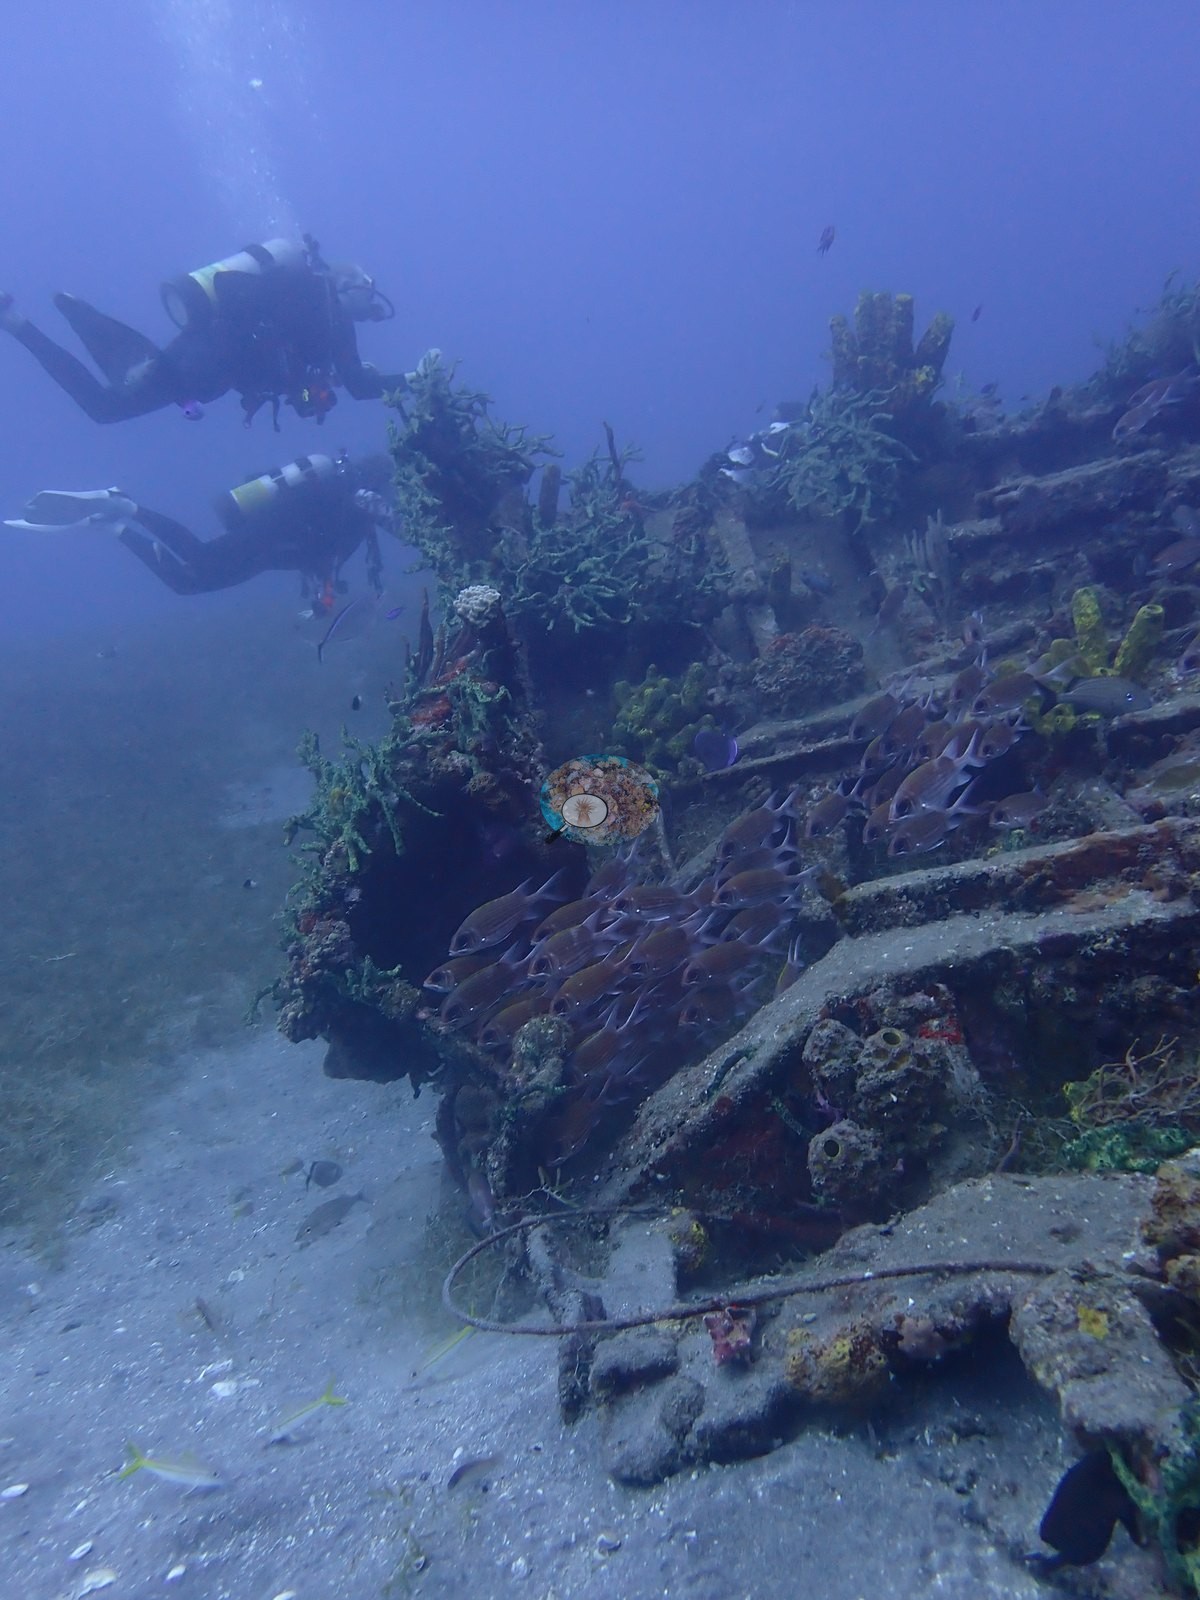
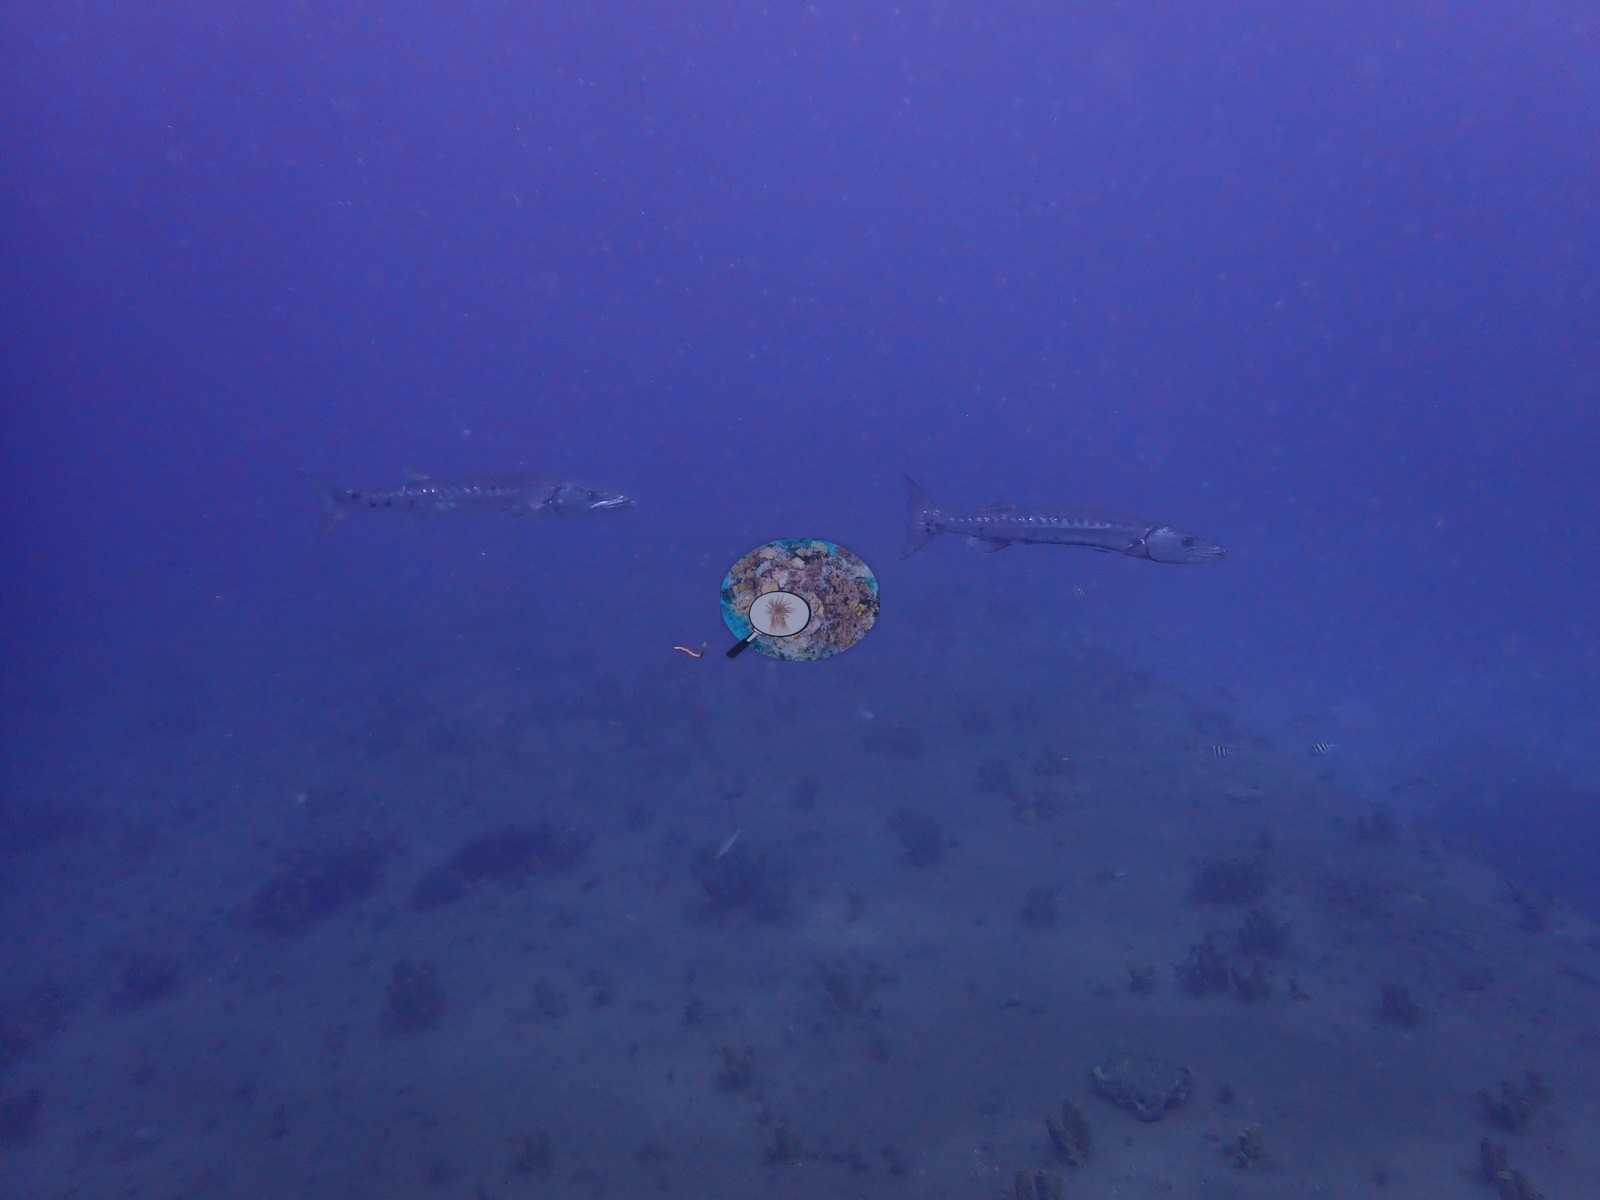
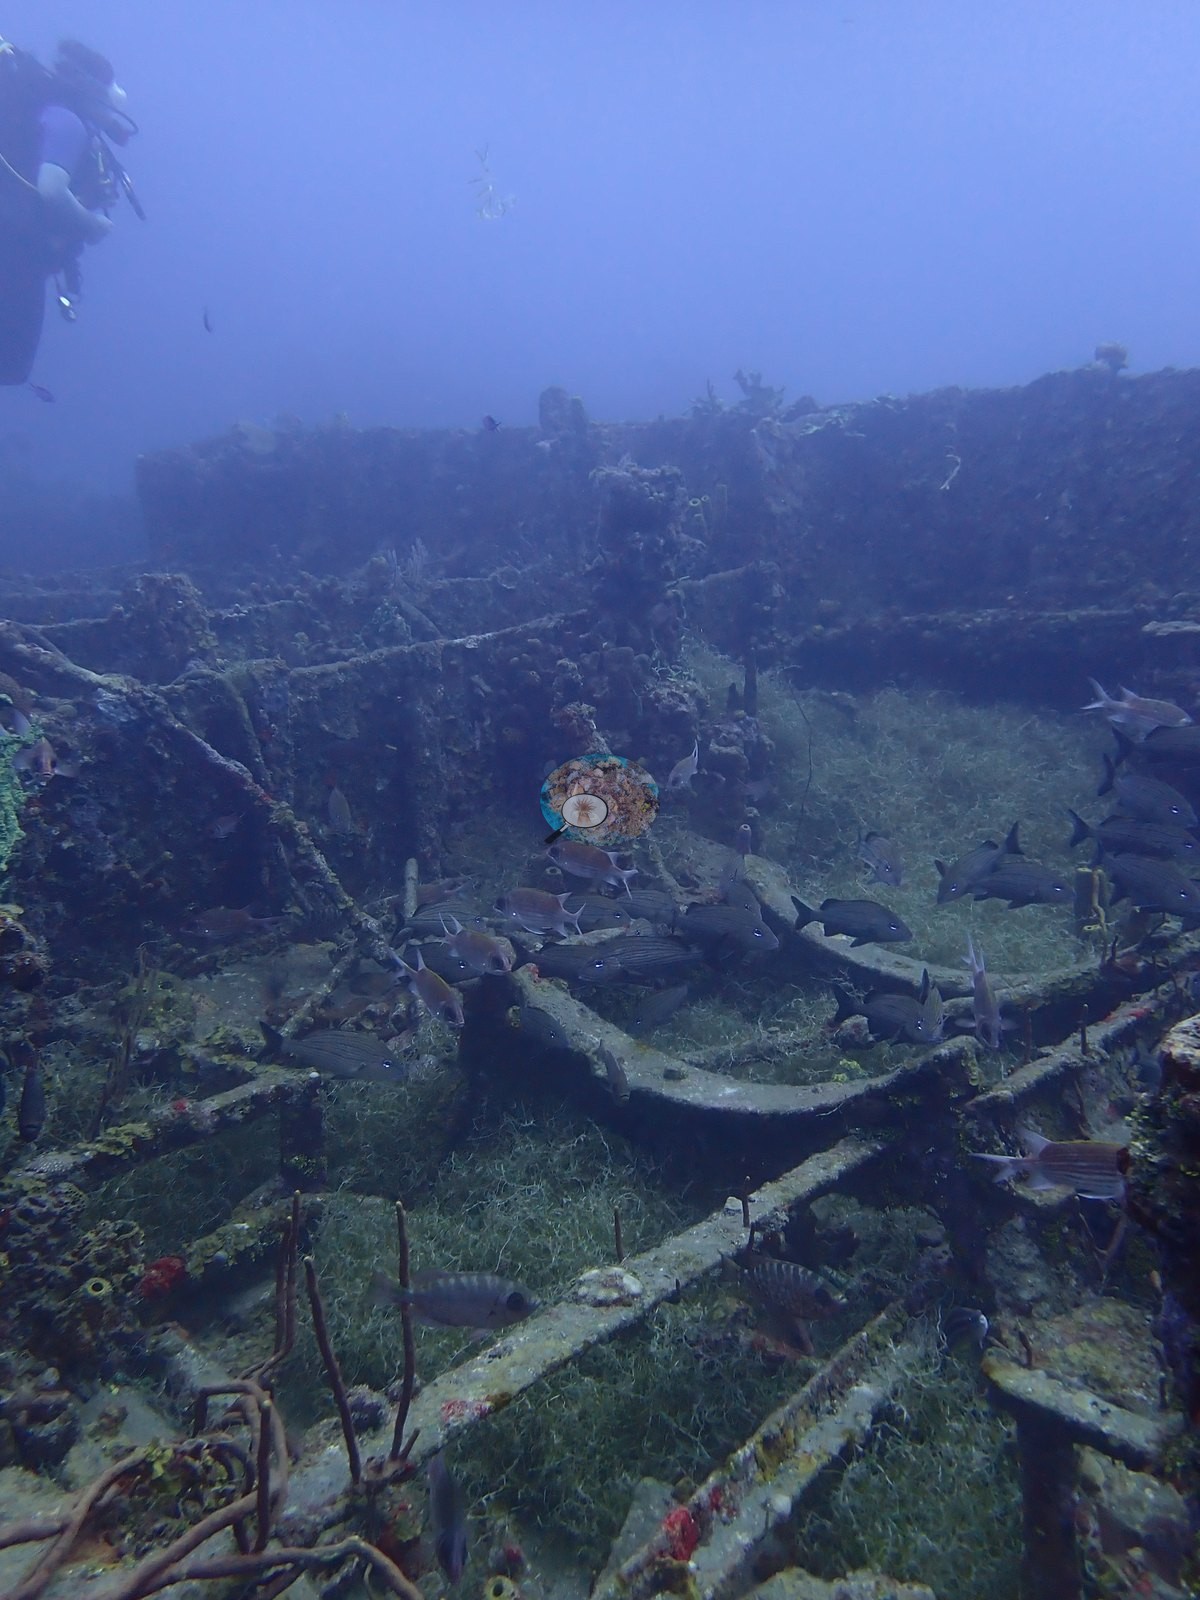
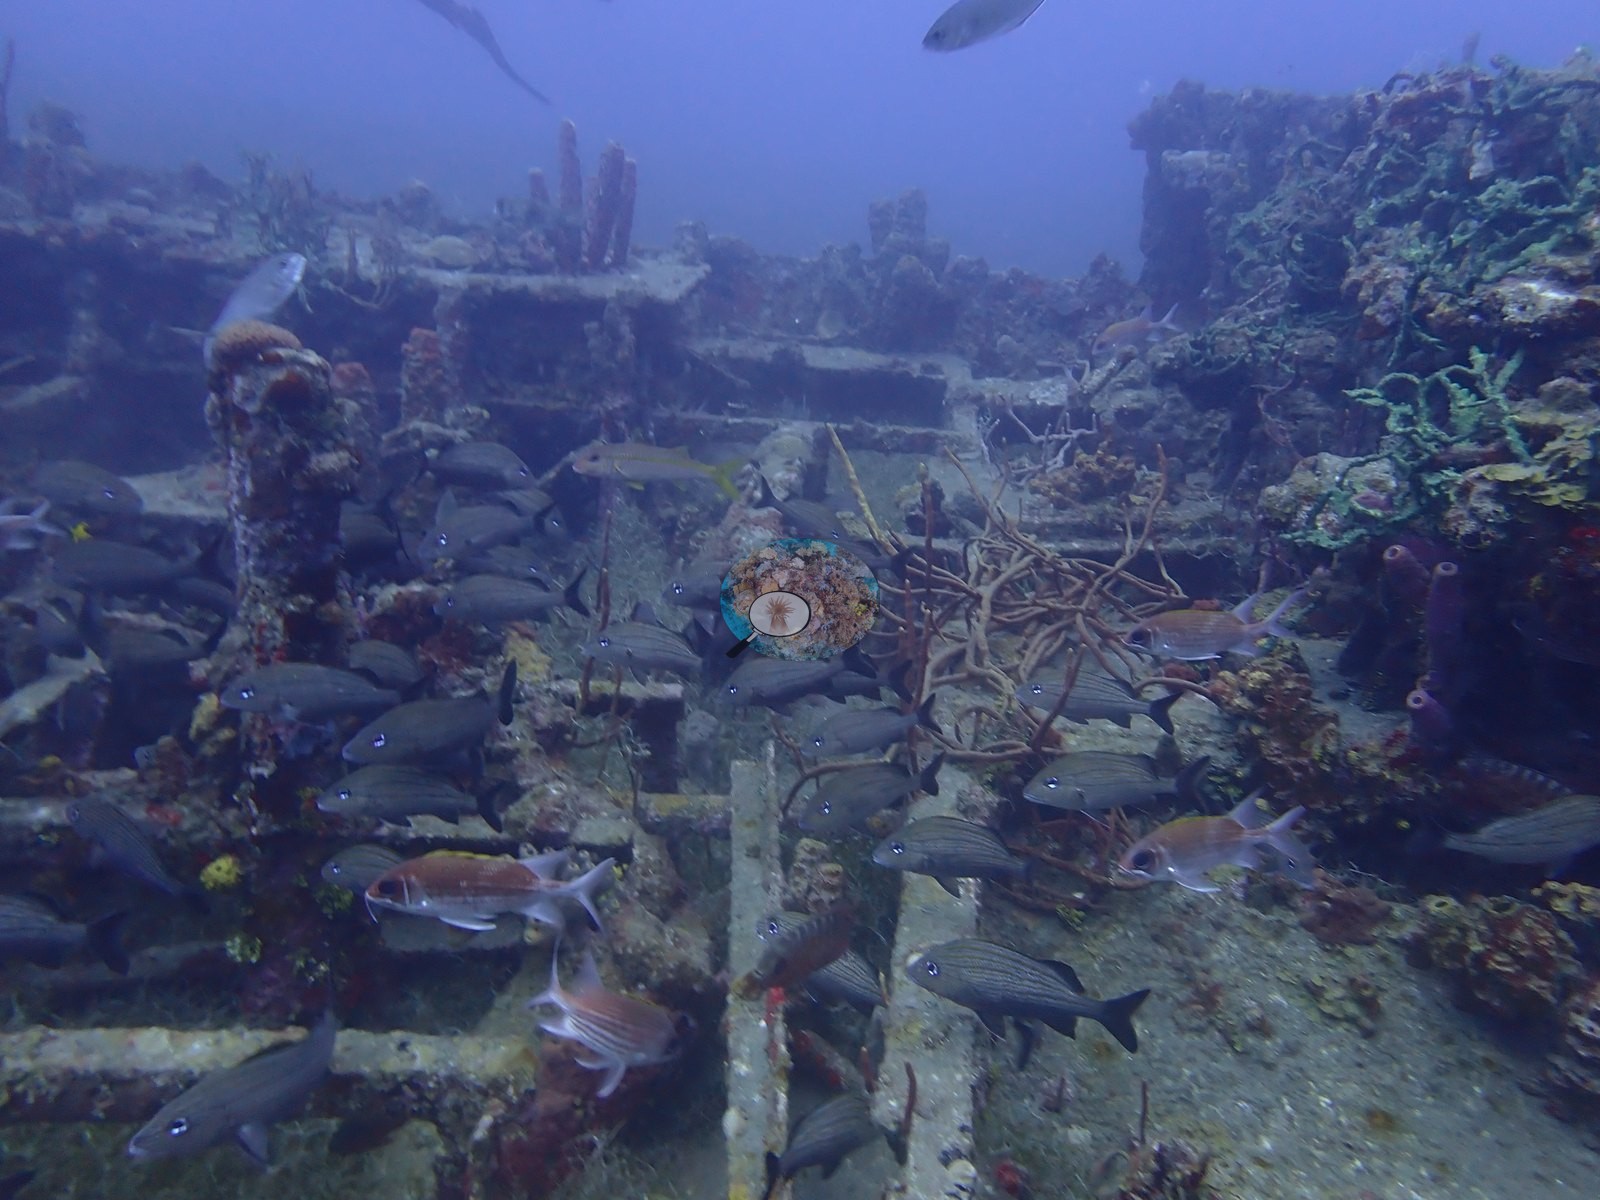
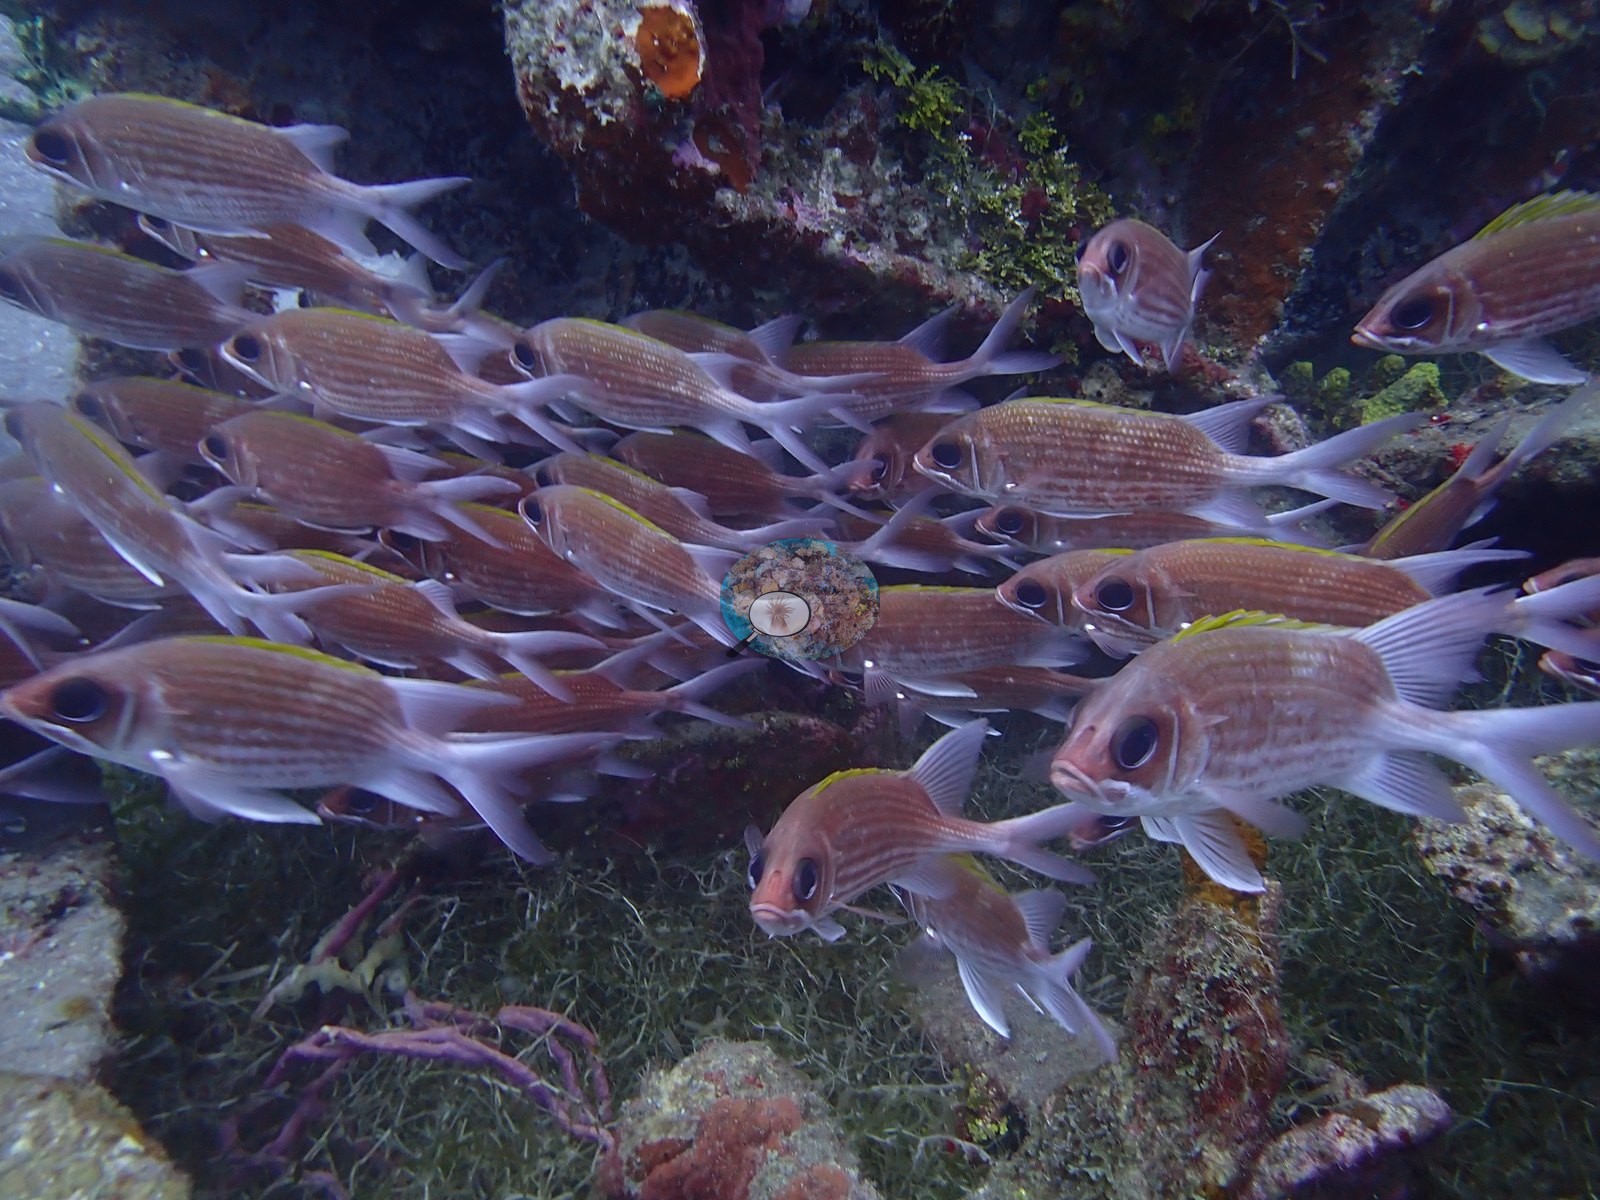
Fish use the structure heavily (e.g., Image 3).
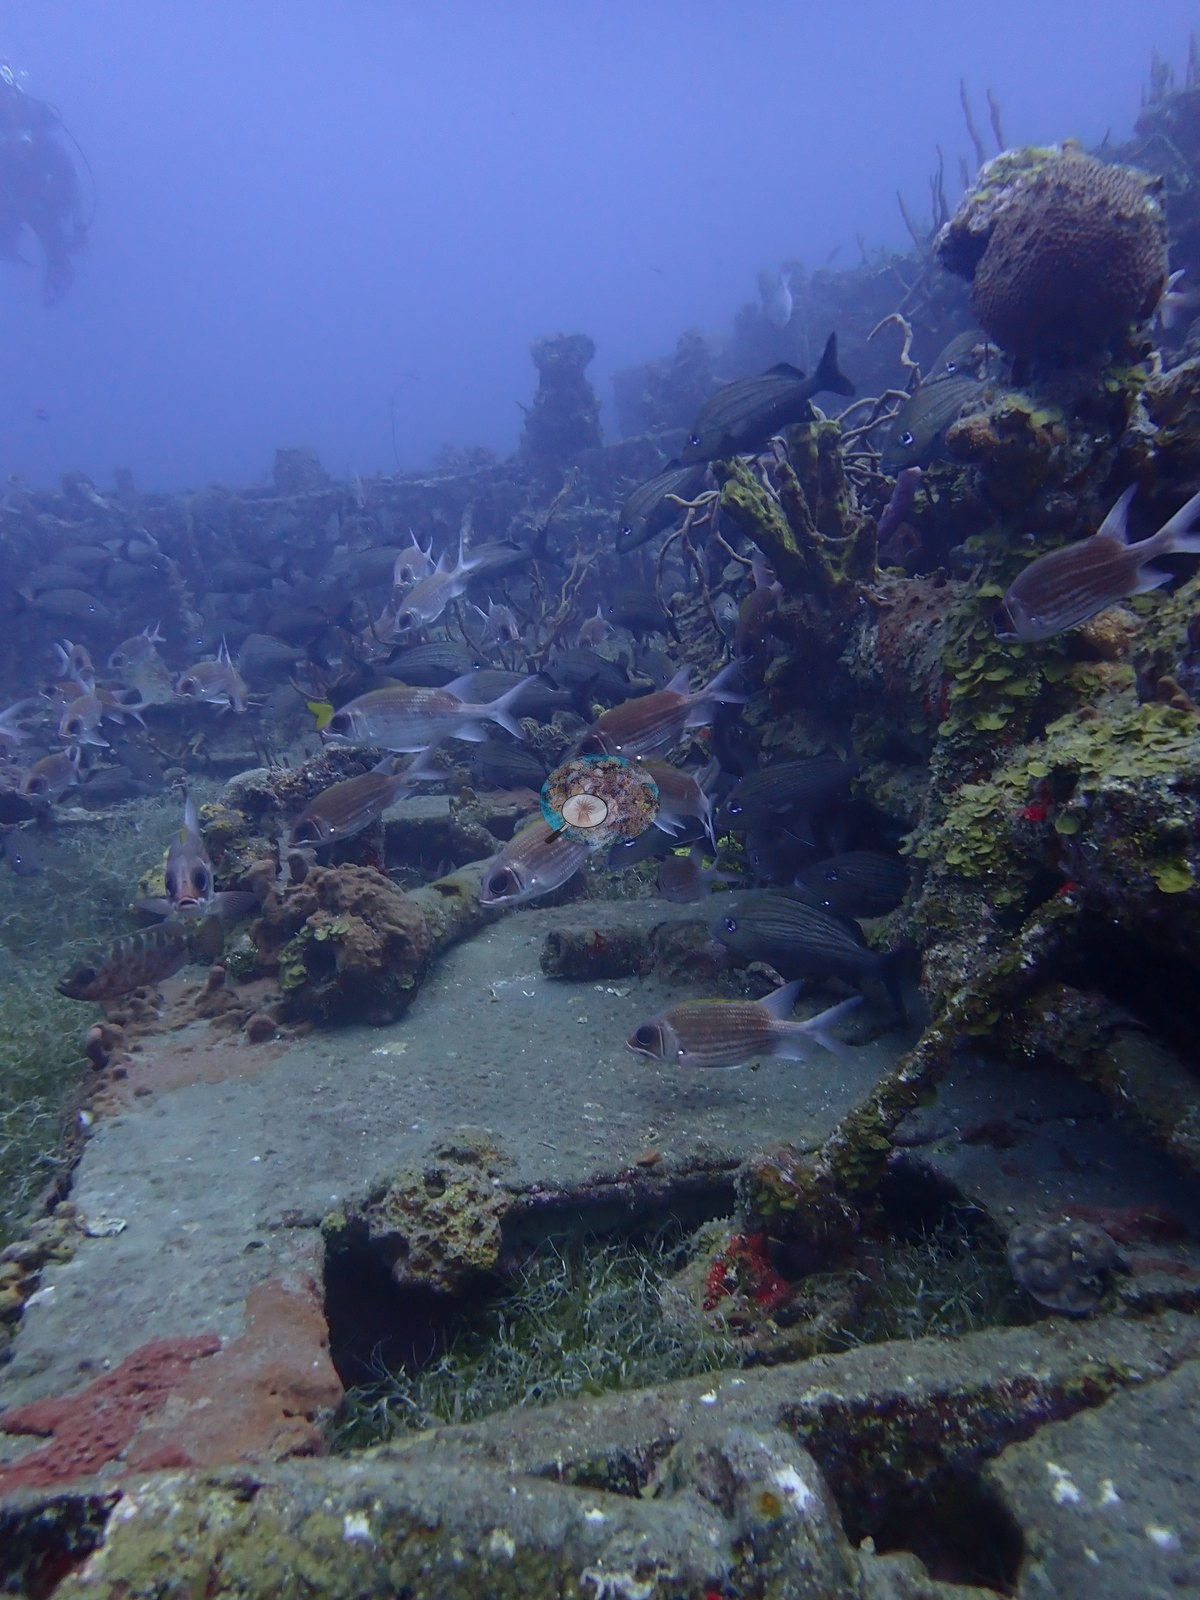
One frame holds a dense mixed aggregation of grunts and squirrelfish packed into the concrete framework; another shows yellow-lined goatfish and snapper working the sand alongside the structure line (e.g., Image 18, Image 44).
A long-spined sea urchin (Diadema antillarum) is tucked into a crevice in one frame, spines intact.
Comparisons with other data
Also on record for this site: Visibility was poor to moderate; wide shots (16, 61, 104) go milky within 10-15 m while close work stays sharp. Stony corals are small, isolated heads rather than builders (e.g., Image 11).
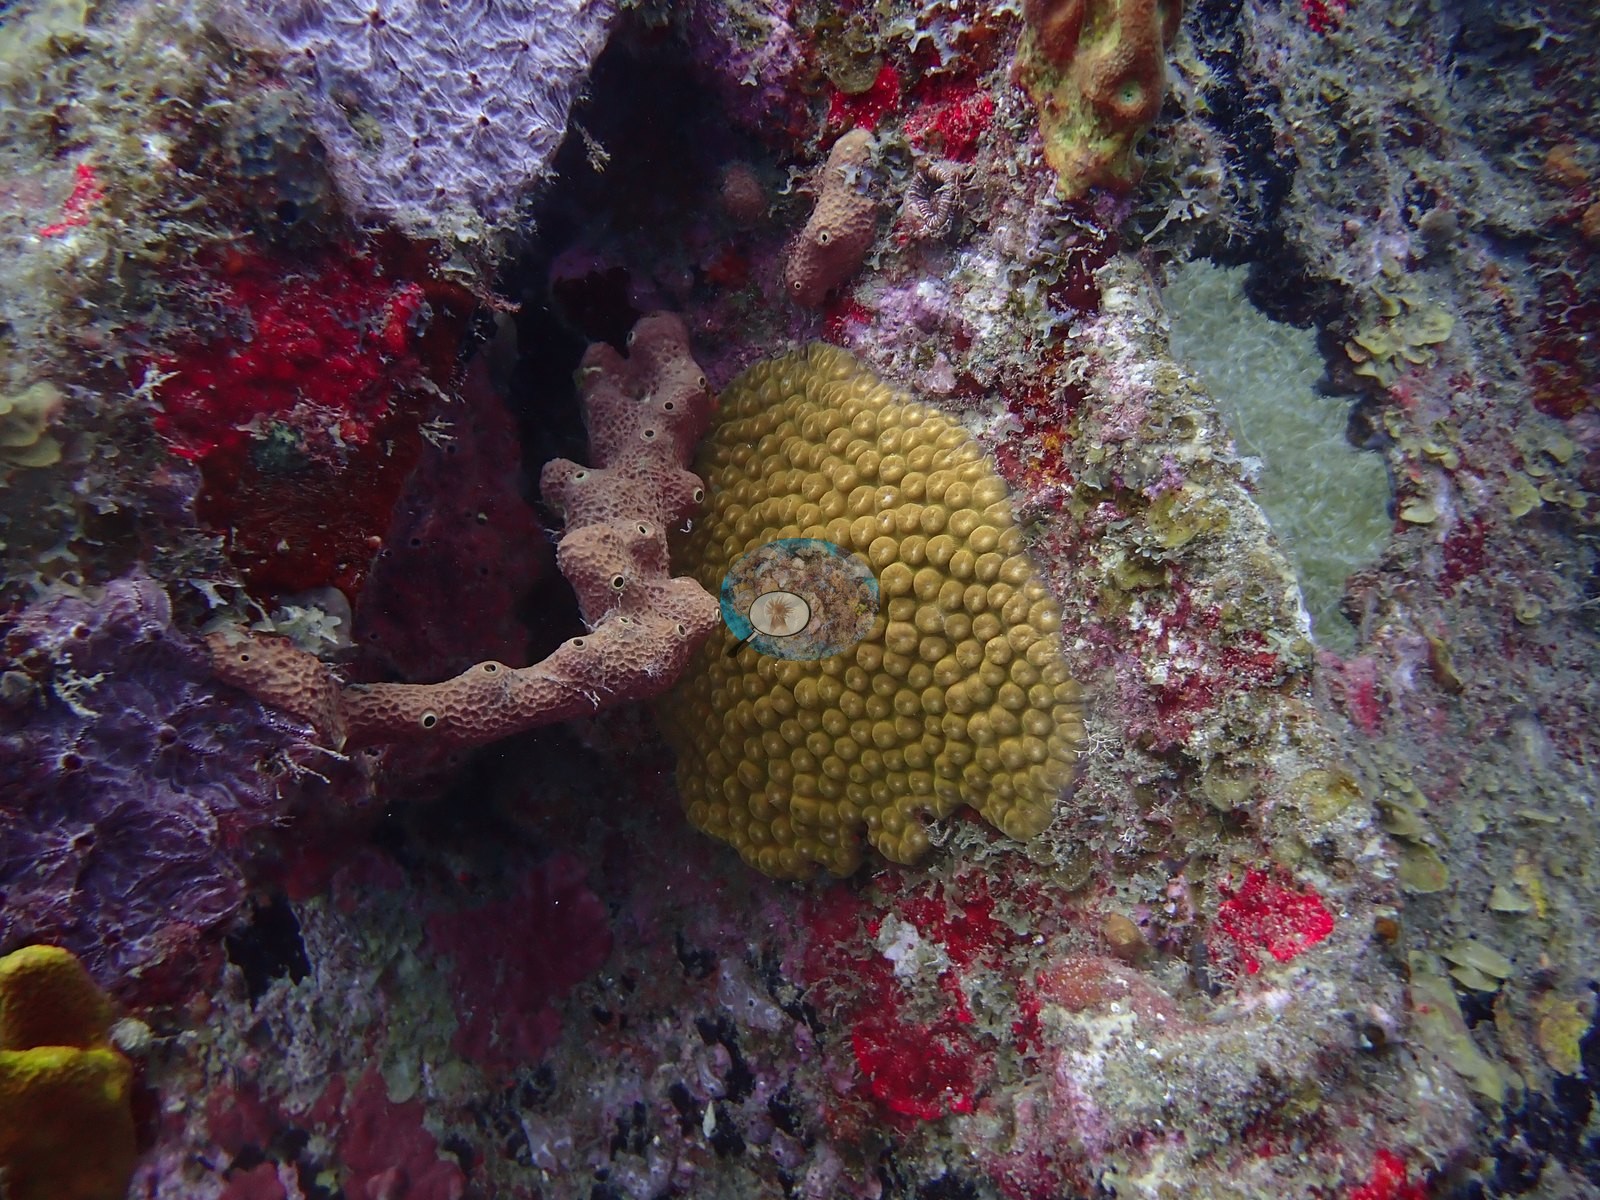
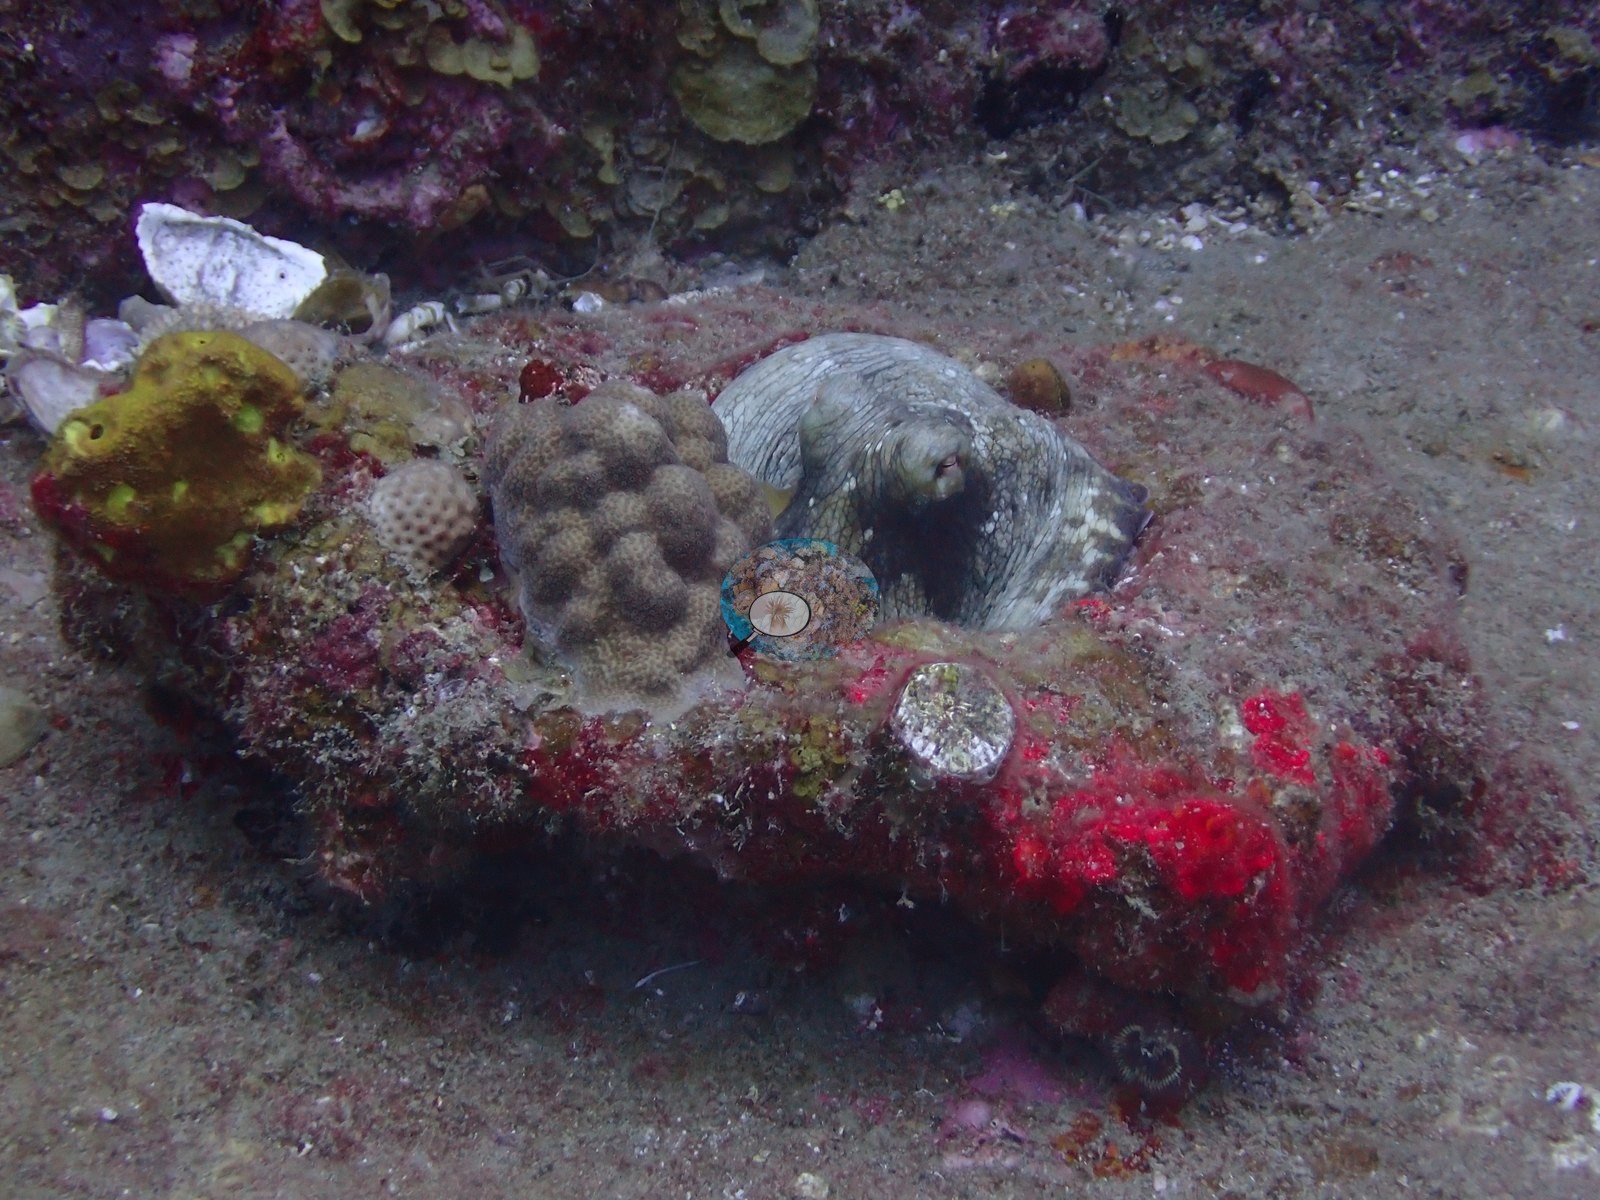
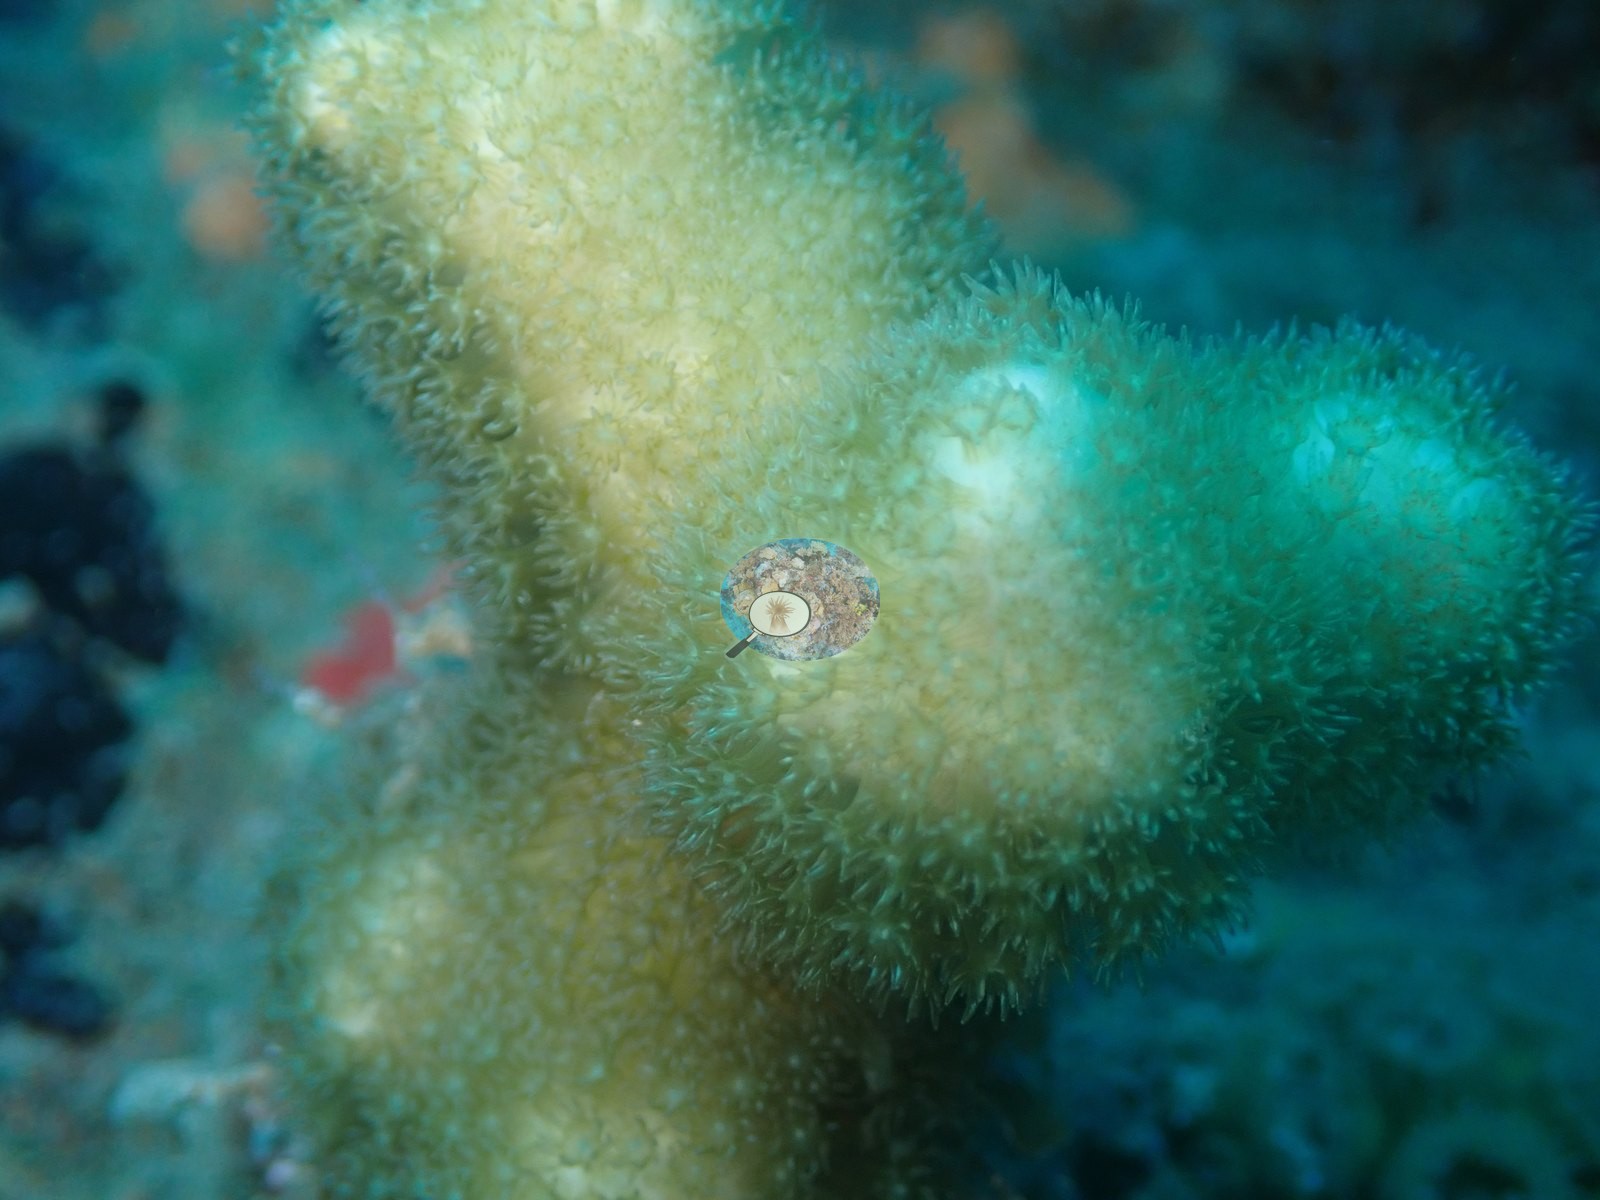
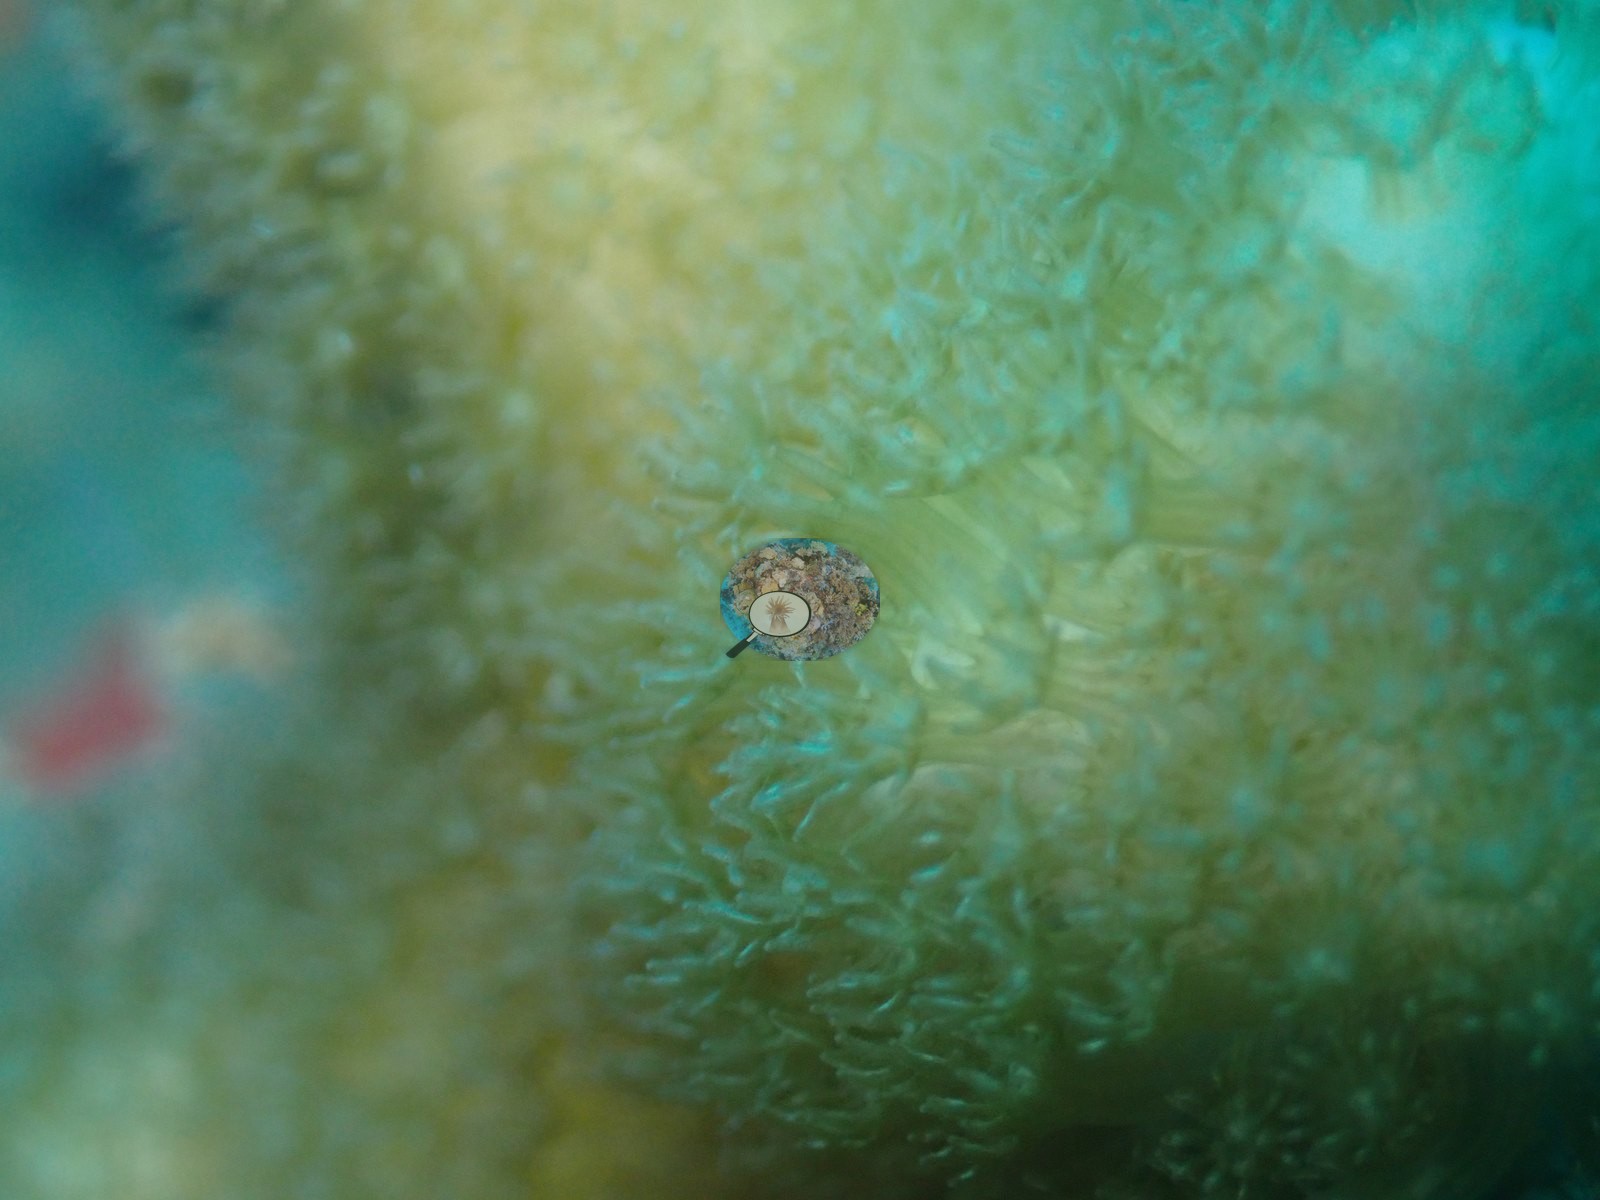
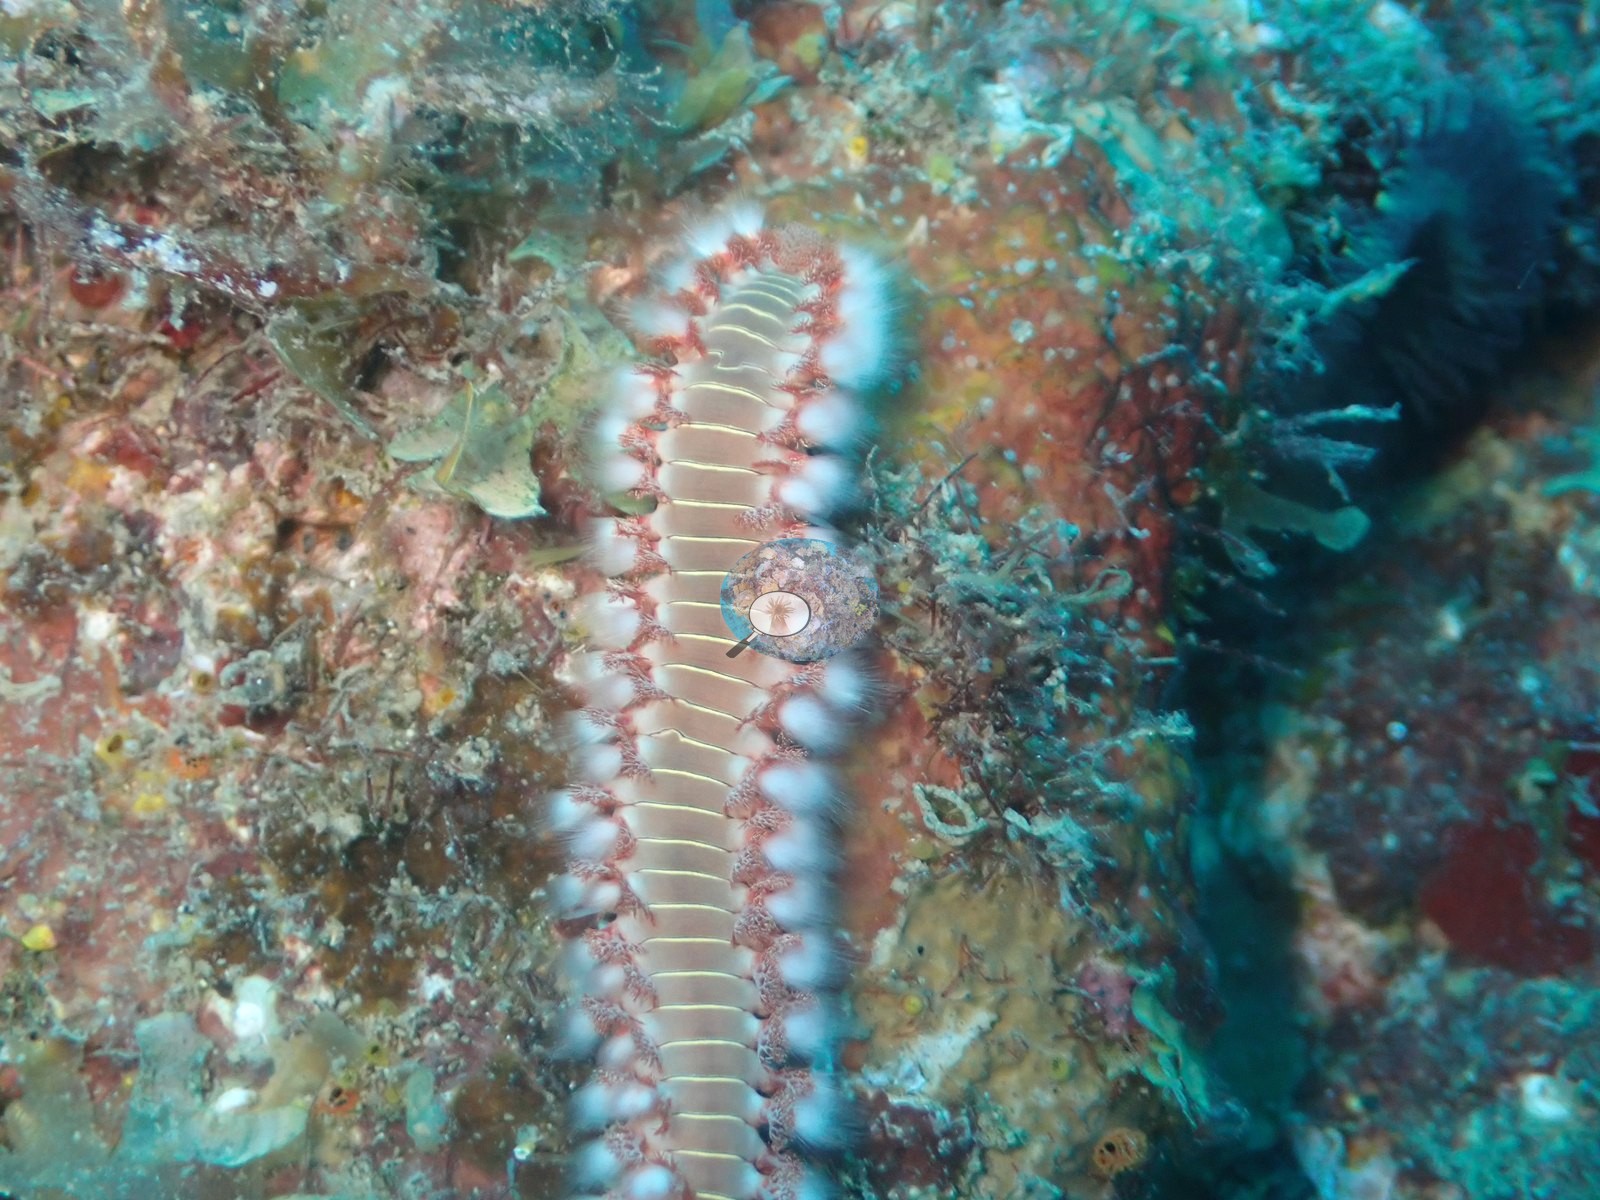
Four blurred macros (94-97) show a cream-pale colony with fully extended polyps - too out of focus to call bleaching either way. Two introduced species are on record here: lionfish (54, 66, 67) and orange cup coral Tubastraea coccinea (21, 75, 80) (e.g., Image 8).
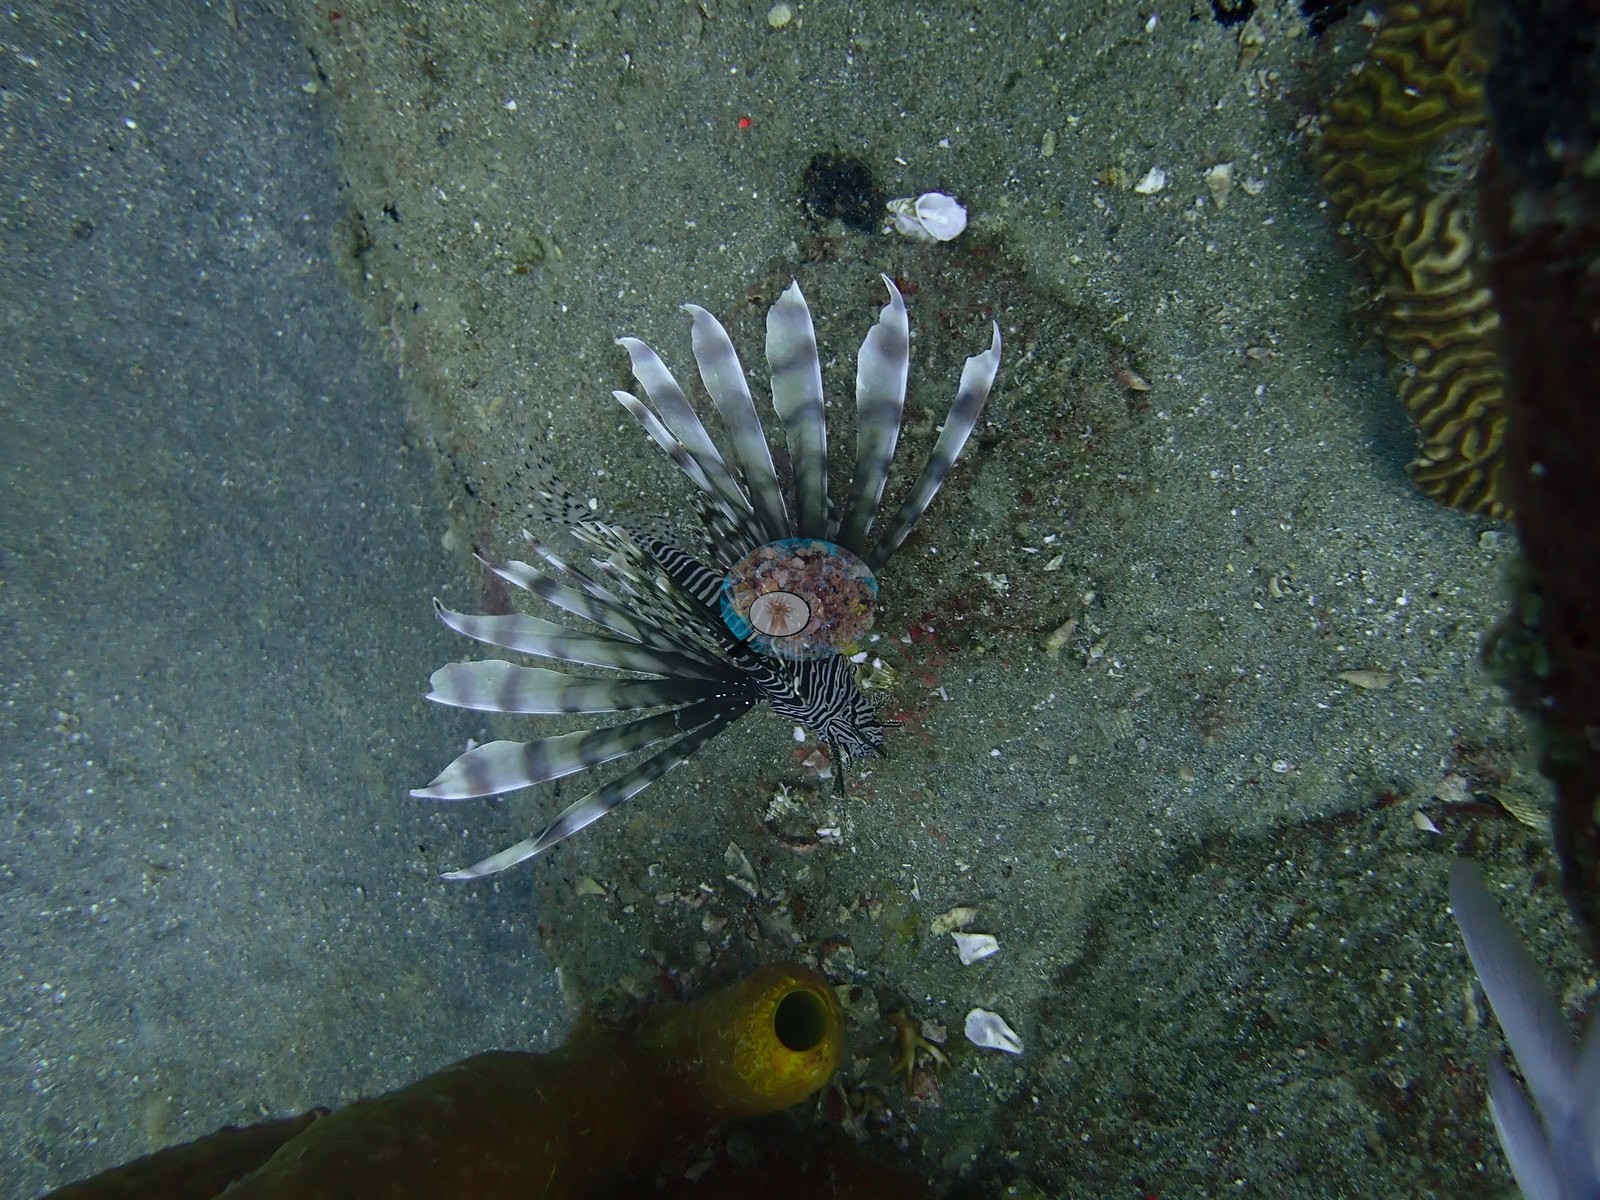
A historic glass bottle lies on the sand (29). This site publishes 4.6%.
CV model comparison
More info
DINOv3 and CoralSCOP were run on the same photos and are listed for comparison. Coralscapes v2 and v1 were also run but are not shown: Anderson does not consider Coralscapes reliable for these photos. No diver transect exists for this trip, so agreement between the rows is not accuracy, and as of September 2026 no computer-vision method estimates coral cover accurately on new images; treat every row as indicative.| Method | Hard-coral cover (%) |
|---|---|
| In-house DINOv3 | 18.0 |
| CoralSCOP unedited | 21.2 |
| Claude | 4.6 |
Independent surveys nearby
| Agency / program | Year(s) | Stations / distance | Link |
|---|---|---|---|
| Reef Check | 2005–2010 | 5 stations, 2.04–3.75 km | Records ↓ |
| XL Catlin Seaview Survey | 2013 | 3 stations, 1.63–4.67 km | Records ↓ |
 Dr. Coral (CRD)
Within 5 km, 8 independent survey stations recorded hard coral cover in 18 records between 2005 and 2013. Of the 4 stations surveyed in more than one year, 1 declined, 1 increased, and 2 changed by less than 5 percentage points between their first and latest surveys. The longest record, Barracuda Reef Line 1 (Reef Check, 2.04 km away), went from 28% in 2005 to 26% in 2010. The most recent nearby survey is from 2013, so these values predate recent heat stress. This site's own estimate (4.6%) sits within the range of these surveys (0.7–38%); the methods differ, so the comparison is context, not a like-for-like test.
Collected by other programs using different methods (Reef Check uses point-intercept transects; the XL Catlin Seaview Survey uses photo-transects with automated image annotation), so these are context for the figures above, not a like-for-like comparison. Where a station was surveyed more than once the range is shown. Station names are not dive-site names.
| Agency | Site / location | Date | Hard coral cover (%) | Distance | Link |
|---|---|---|---|---|---|
| Reef Check | Barracuda Reef Line 1 | 2005–2010 | 11–28% (6 surveys) | 2.04 km | — |
| Reef Check | Barracuda Reef Line 2 | 2005–2007 | 24–25% (2 surveys) | 2.04 km | — |
| Reef Check | Mushroom Garden Line 1 | 2005–2009 | 9.4–33% (4 surveys) | 3.17 km | — |
| Reef Check | Mushroom Garden Line 2 | 2005–2007 | 24–38% (2 surveys) | 3.17 km | — |
| Reef Check | Twin Sisters | 2009 | 16% | 3.75 km | — |
| XL Catlin Seaview Survey | transect 25015 | 2013 | 2.0% | 1.63 km | — |
| XL Catlin Seaview Survey | transect 25016 | 2013 | 0.7% | 1.66 km | — |
| XL Catlin Seaview Survey | transect 25017 | 2013 | 4.4% | 4.67 km | — |
Data & links
All images from Coral Reef Diagnostics. Data are from Coral Reef Diagnostics and the organizations named in the data-sources table above.
© Coral Reef Diagnostics.