Regional summary of 4 dive sites. Figures are averages across the sites that report them (n = sites with a value); each site's own page has its individual values.
Saba's four marine-park dives, in February 2026, cross volcanic boulders, basalt pinnacles, and sand rather than true reef framework, where sponges and gorgonians dominate and stony corals are small and sparse. Large animals are a strength, including Caribbean reef sharks, nurse sharks, and green turtles.
Heat stress
sea surface temperature (SST) (left axis)DHW under 2DHW 2–3DHW 3–5DHW 5–8DHW 8–10DHW over 10 (🔥 above 12)
Daily SST (line) and weekly maximum Degree Heating Weeks (bars), Jan 2023–Sep 2026, NOAA Coral Reef Watch 5-km Leeward Caribbean Islands virtual station. Dashed line: bleaching threshold (maximum monthly mean 28.3°C + 1°C). DHW ≥ 4: bleaching likely; ≥ 8: severe bleaching and mortality likely. A bar is drawn only where DHW exceeds zero, so a stretch with no bar is accumulated heat stress of zero, not missing data — the SST line runs the full period.
4 sites in this region — click a marker to open that site.
Regional setting
Saba, about 13 km² in area, is an inactive volcano that climbs steeply out of deep water, and its eroding, surf-swept rocky coast, with few sheltered bays and no permanent beaches, is poorly suited to reef building (Wells 1988). Spalding et al. (2001) likewise characterize Saba and St. Eustatius as steep-sided volcanic islands that lack much reef framework yet support important coral communities. Wells (1988) reports that a brief survey in 1984, made for the planned marine park, found a well-developed reef at about 24 m off the south coast, running parallel to shore for at least a kilometer, with more than 90% coral cover of large flattened Montastraea annularis, Colpophyllia natans, and Porites astreoides, and seamounts at 30–33 m with cover approaching 100%. Eroded boulders all along the coast have been colonized by corals, and at Core Gut Bay some resemble giant coral mushrooms where sediment has scoured their bases. The same account notes that the Windward Group islands hold fewer hermatypic corals than the Leewards (33 species against 50), and that Diadema antillarum mass mortality had reached Saba by the mid-1980s. Nearby lies the Saba Bank, a large shallow platform that may be a submerged atoll (Spalding et al. 2001). As of 2001 the Saba Marine Park protected all benthic communities to 60 m. Spalding et al. (2001) estimate about 420 km² of reef for the former Netherlands Antilles, a combined figure that includes Bonaire, Curaçao, St. Eustatius, and St. Maarten.
Souter et al. (2021) report recent trends only for the Eastern and Southern Caribbean as a whole, a subregion that groups the Lesser Antilles with Trinidad and Tobago, Aruba, Bonaire, Curaçao, and Venezuela. Across it, mean hard coral cover fell from about 26.2% in 1999 to 14.5% in 2019, the largest decline among the five Caribbean subregions, while algal cover nearly tripled between 1987 and 2019 to reach 48.3%. For the Caribbean as a whole, the same report links these losses to the 2005 mass bleaching, hurricanes, polluted, and nutrient-enriched coastal water, and overfishing of herbivores such as parrotfishes, and it names invasive lionfish, Sargassum influxes since 2011, and stony coral tissue loss disease (SCTLD) as newer threats; SCTLD, first seen in Florida in 2014, had been confirmed in 19 Caribbean countries and territories by October 2021. Earlier, Wilkinson (2006), drawing on the 2004 Caribbean Reefs at Risk assessment, placed the Lesser Antilles among the areas most threatened by coastal development and singled out its high islands for land-based pollution and sediment.
Overview
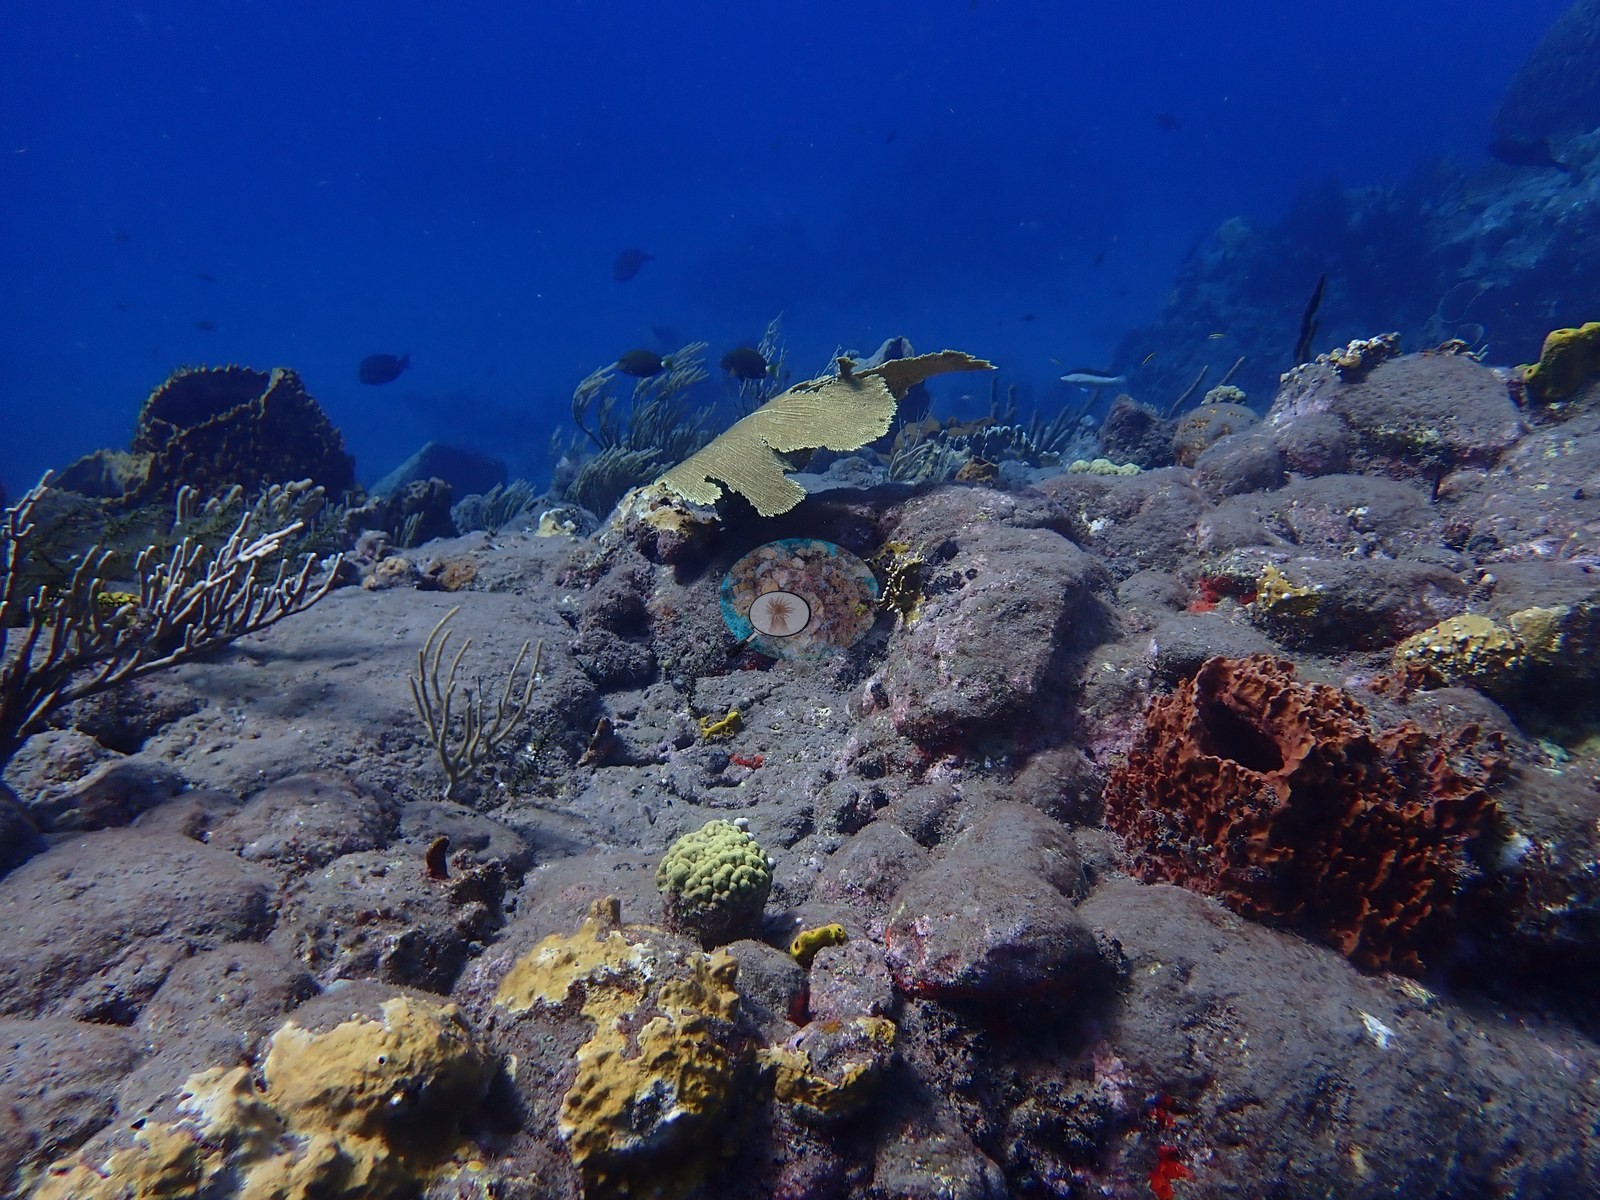
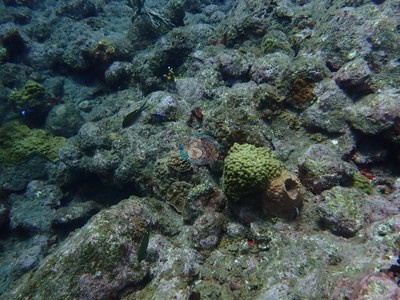
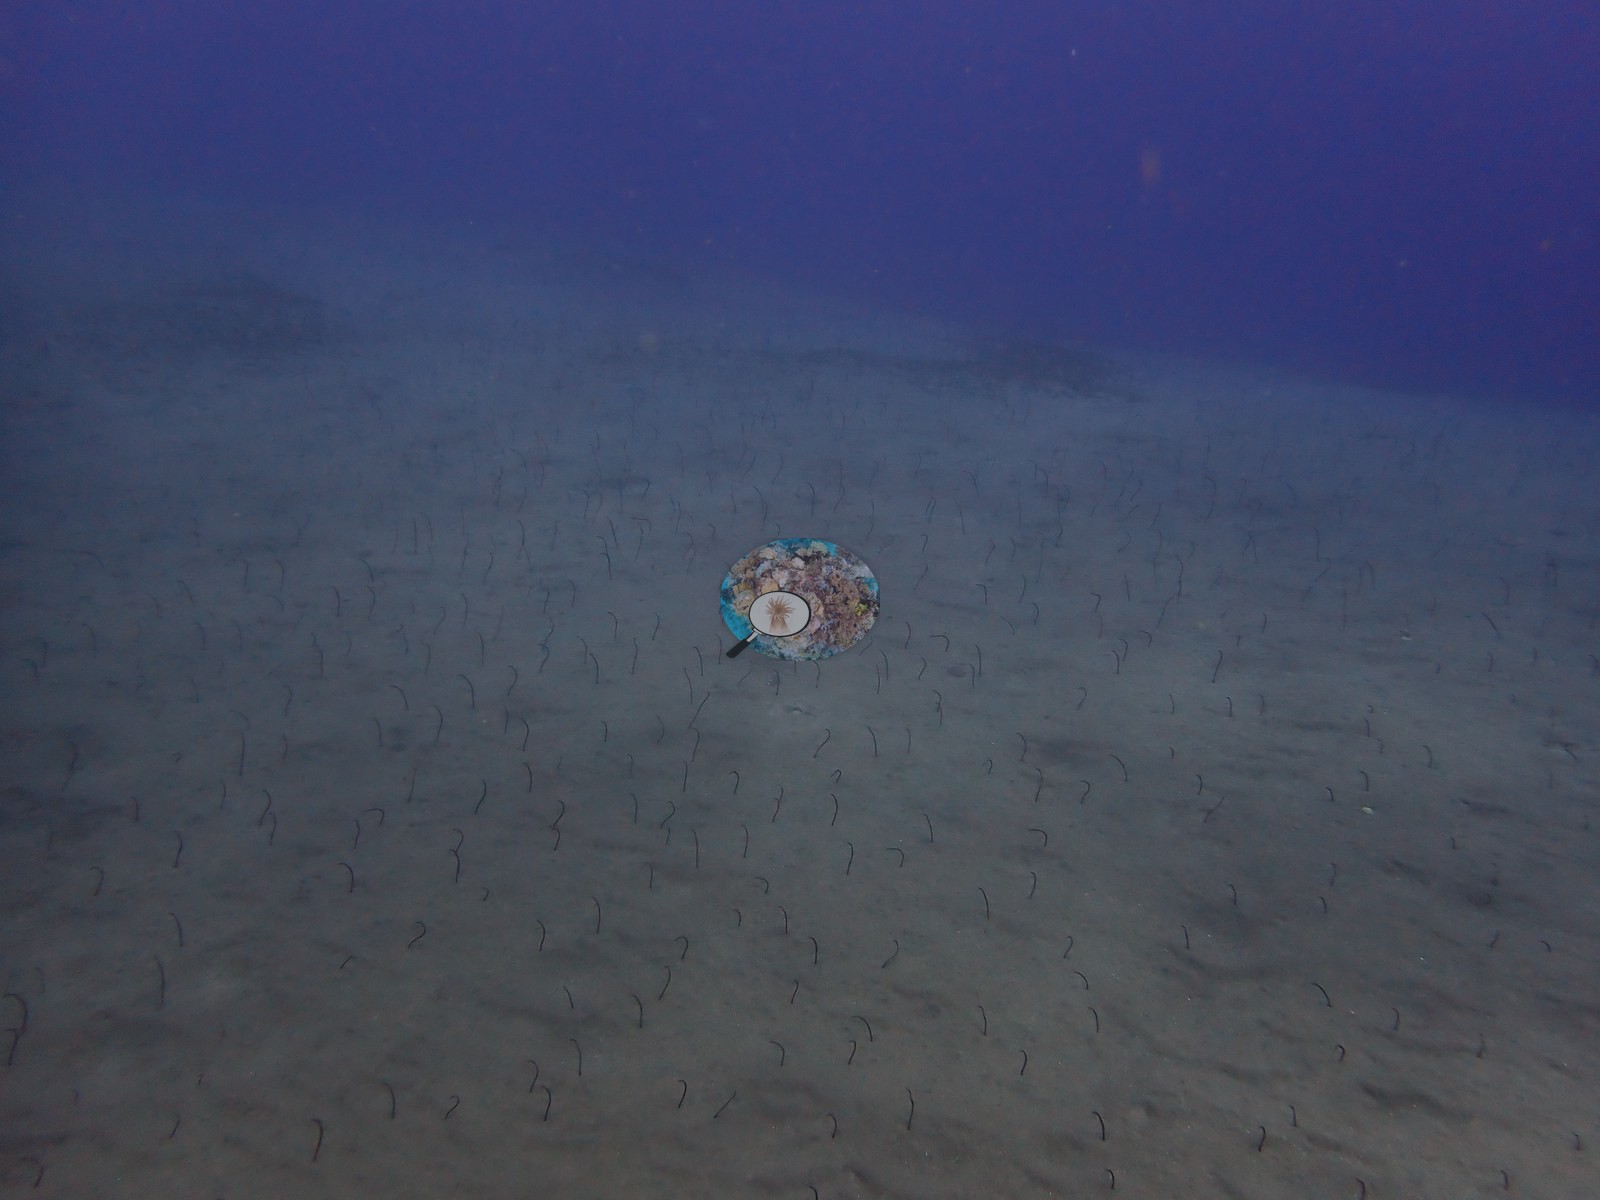
The Saba unit covers four dives made on 21 and 22 February 2026 in the Saba National Marine Park. Tent Drift and Tent Shallow are on the Tent Reef cluster, and the other two are Ladder Labyrinth and Man-of-War Shoals. All four are volcanic hardground rather than carbonate framework. Tent Drift is a low ridge of rounded lava boulders grading into gray sand, with a stretch of vertical wall. Man-of-War Shoals is the high-relief site, with basalt spires and pinnacles separated by clefts and walls dropping to sand. Ladder Labyrinth is a maze of boulder ridges 1 to 3 m high divided by narrow sand corridors, and Tent Shallow is mostly a garden-eel sand plain with isolated knolls.
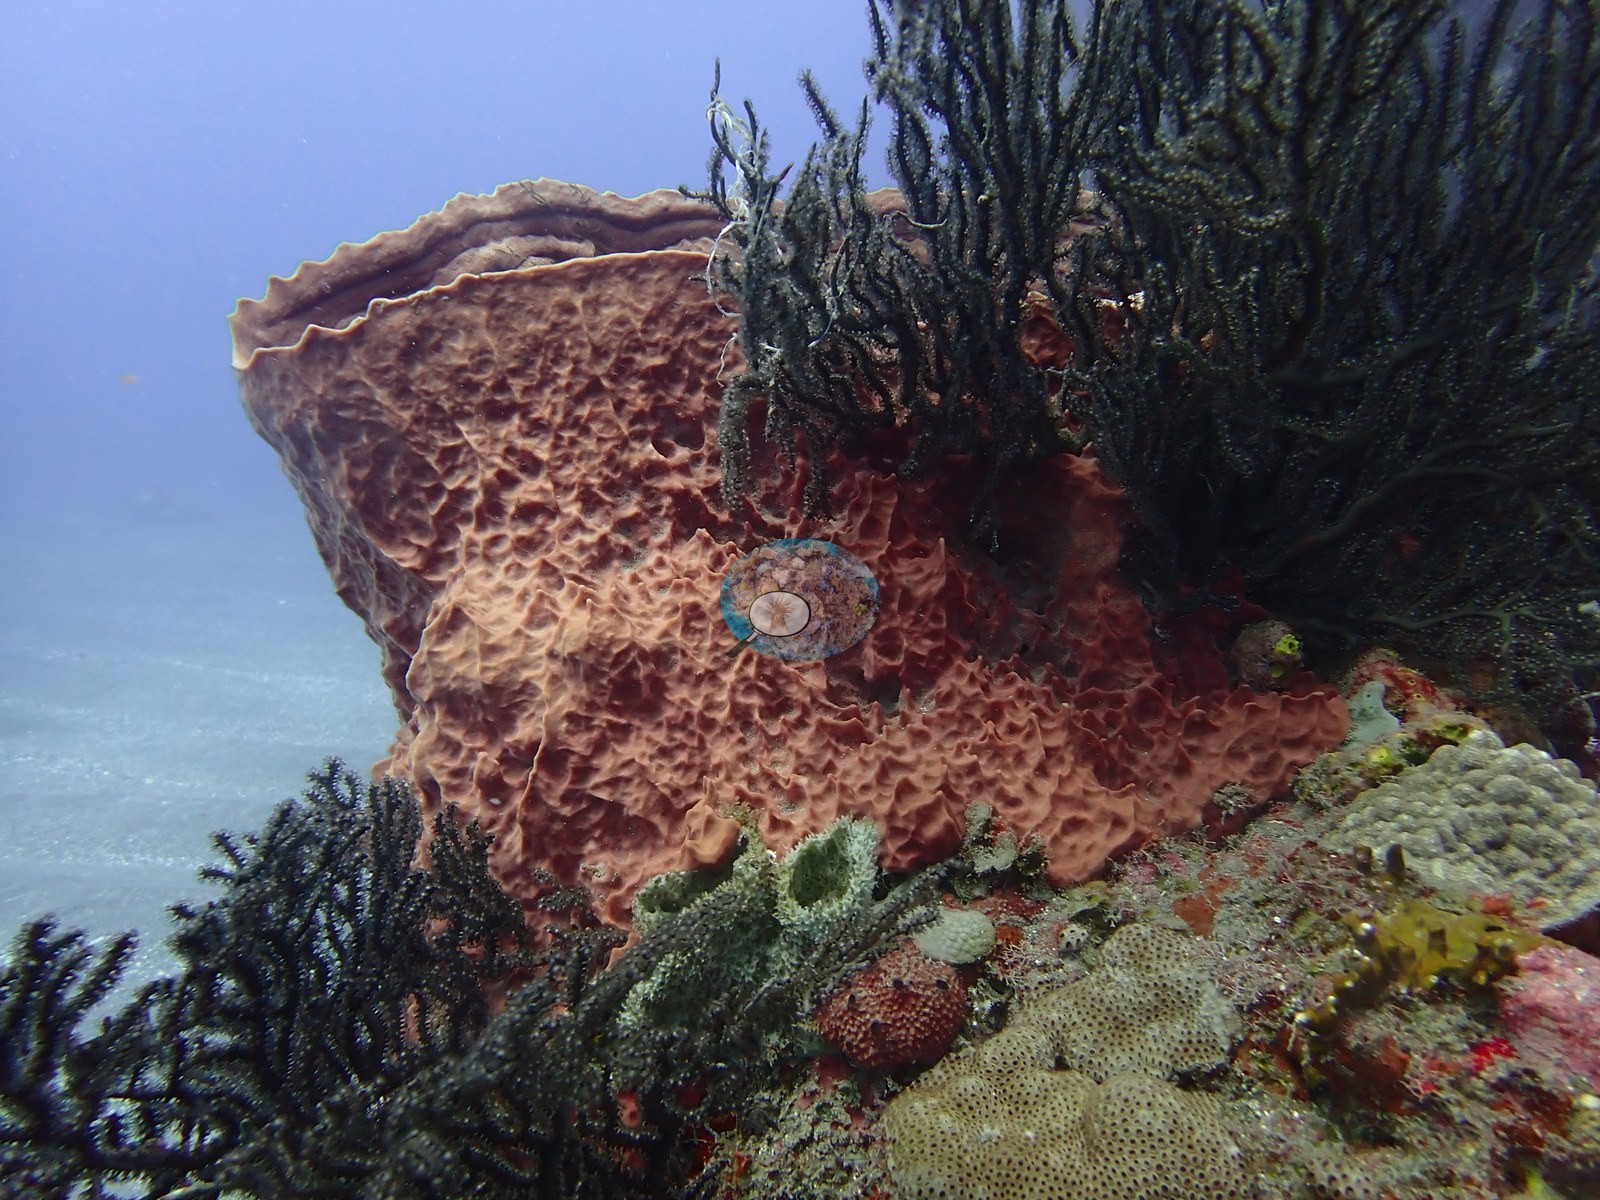
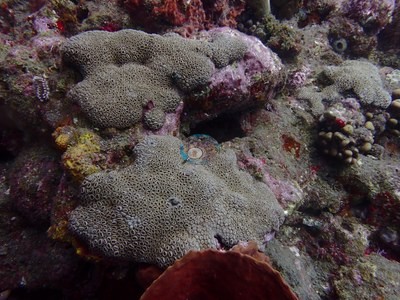
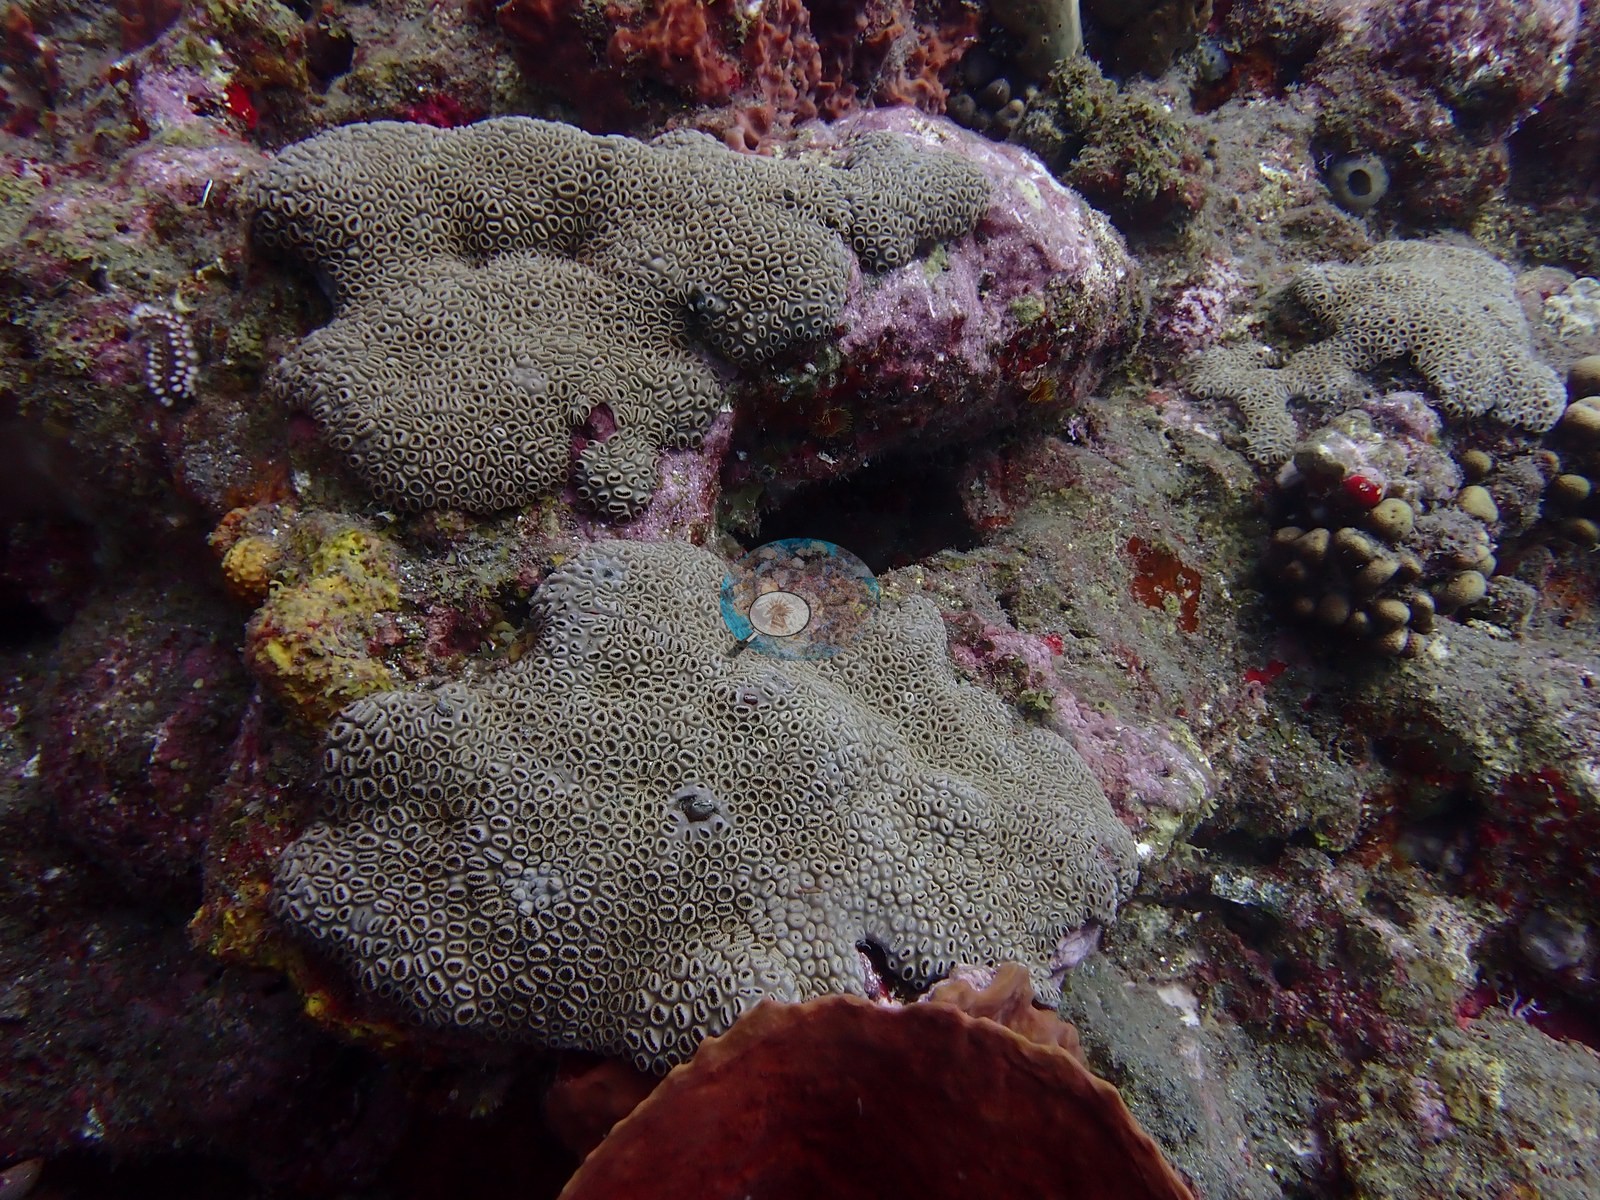
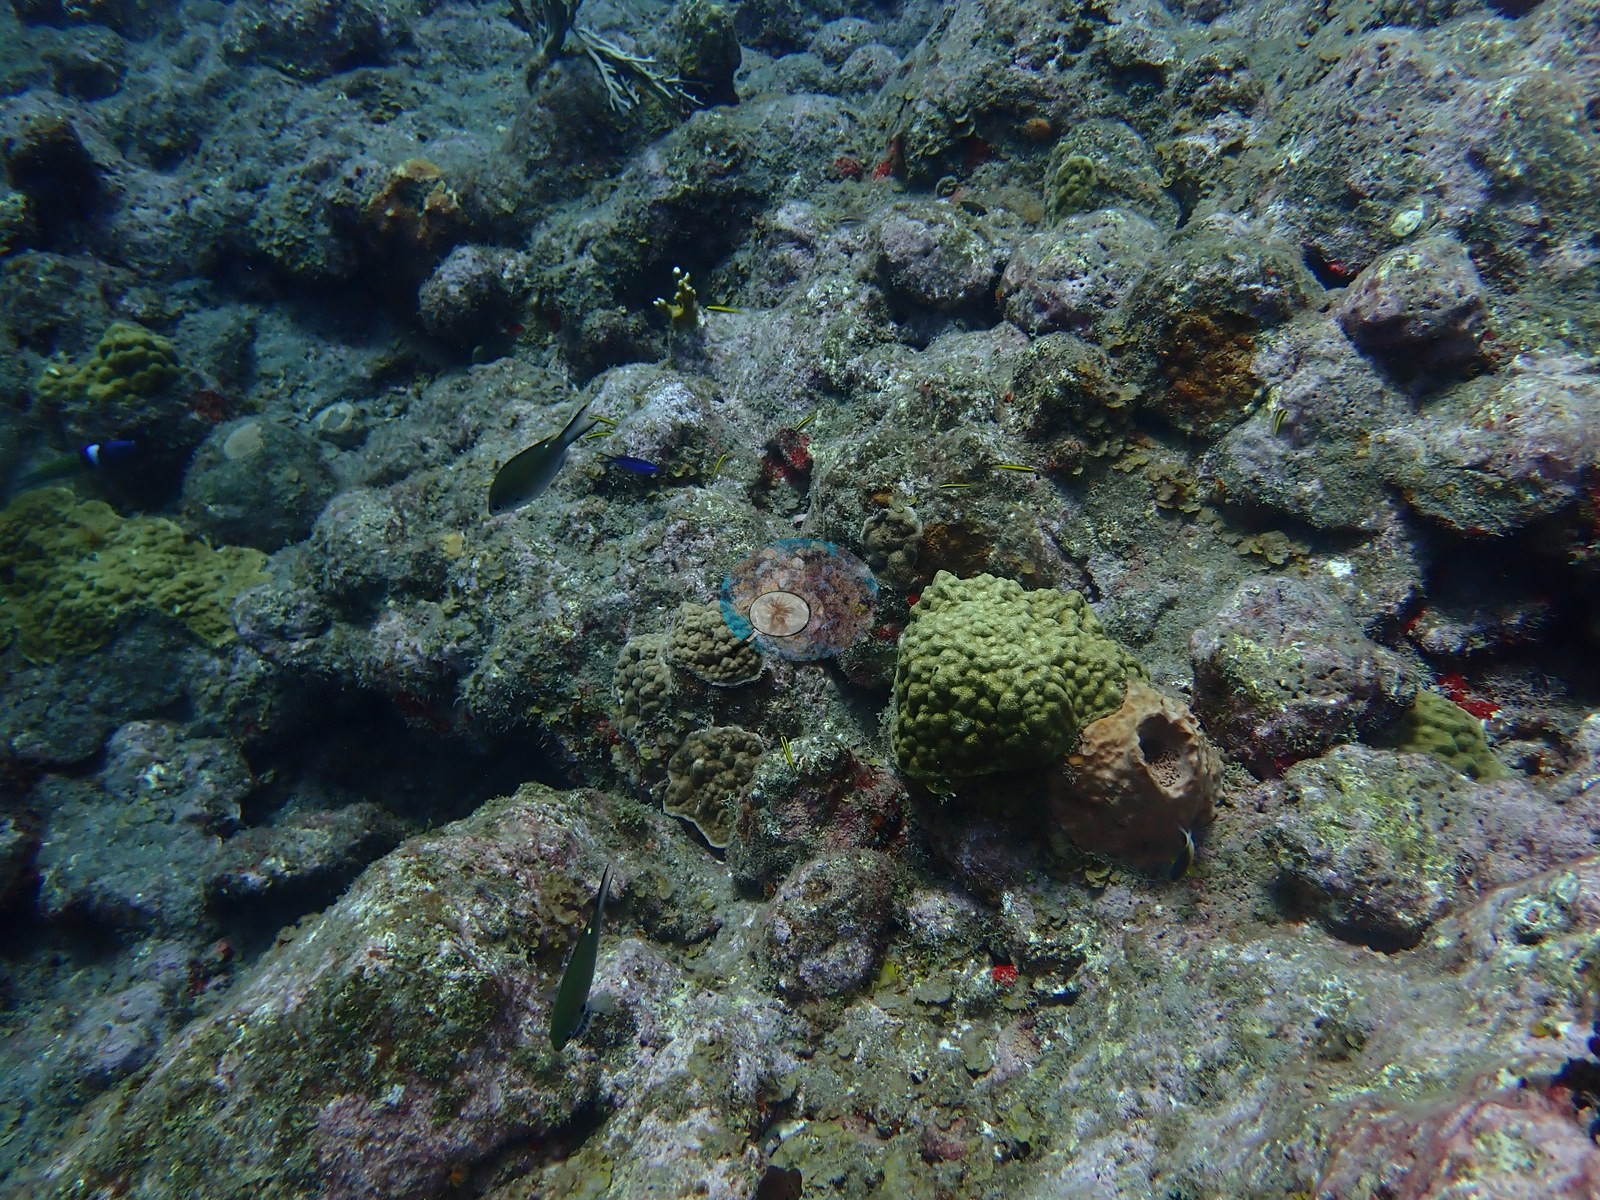
Sponges and gorgonians dominate the visible community. The main ones are giant barrel sponges (Xestospongia muta), tube sponges including Aplysina fistularis, elephant-ear sponges consistent with Agelas clathrodes, sea fans, sea rods, and sea plumes. Stony coral is sparse and small-colony: Eusmilia fastigiata, Diploria labyrinthiformis, Porites astreoides, and Agaricia. The best colonies at Man-of-War Shoals are domes of Montastraea cavernosa. Ladder Labyrinth has the most numerous live colonies, many fist- to dinner-plate-sized heads packed onto the boulder crests, though together they cover little area. Hard coral cover (Claude CV) ranged from 3.0% at Tent Shallow to 8.9% at Ladder Labyrinth; a nearby 2024 survey recorded 1.7% hard coral.
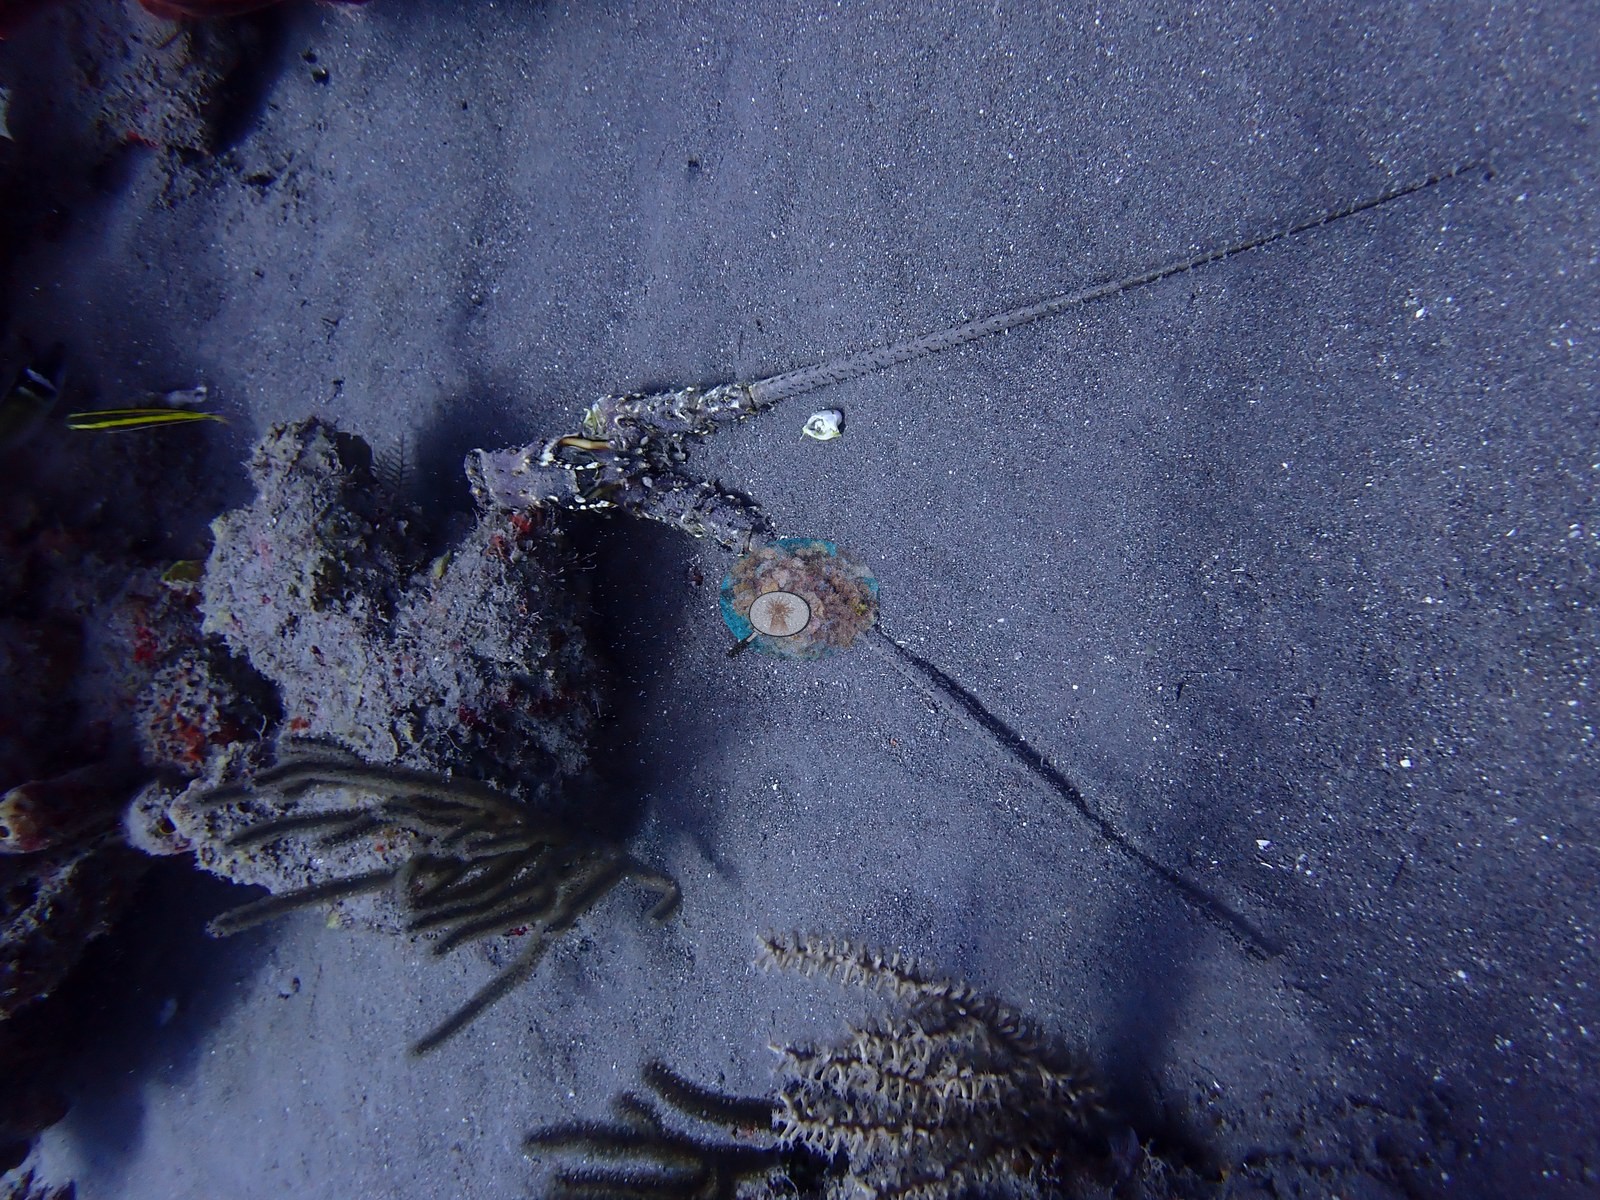
Coral condition is mixed rather than clearly impaired. Several Eusmilia colonies at Tent Drift held pigment only at the base, and colonies with sharply bounded pale patches or small white lesions appear at Tent Drift and Man-of-War Shoals, none confirmed as bleaching. Invasive lionfish were seen at three of the four sites, along with a cup coral consistent with the invasive Tubastraea coccinea at Tent Drift, and an old fish trap lies in the sand at Ladder Labyrinth. Large fauna is a strength: Caribbean reef sharks at Man-of-War Shoals, nurse sharks at three sites, green turtles, a southern stingray at Tent Drift, and dense garden-eel colonies at the Tent Reef sites.
Highlights
Man-of-War Shoals is the high-relief dive, with basalt pinnacles, some of the biggest barrel sponges of the Saba dives, and Caribbean reef sharks on the wall.photo: Saba - Man-of-War Shoals
Ladder Labyrinth's boulder crests carry the most numerous live coral colonies of the four dives.
Tent Shallow's sand plain holds a garden-eel colony of hundreds of individuals.
Great star coral (Montastraea cavernosa) forms the healthiest large colonies, at Man-of-War Shoals.photo: Saba - Man-of-War Shoals
Tent Drift on Tent Reef: a resting nurse shark, a green turtle, a buried southern stingray, and a dense garden-eel colony.photo: Saba - Tent Drift
Notable observations
Saba - Tent Drift: Possible bleaching: multiple Eusmilia fastigiata colonies cream to near-white with pigment retained only basally, possible paling/bleaching; one large plating star coral with a sharply bounded pale-orange central patch, partial bleaching or a healed lesion. Invasive species: one lionfish (Pterois volitans) and a scarlet solitary cup coral consistent with Tubastraea coccinea. No diagnosable disease.
Saba - Man-of-War Shoals: Possible bleaching/mortality: several colonies cream to white or with sharply bounded pale patches (partial bleaching, recent mortality, or spongeovergrowth; not called as bleaching); grooved brain corals with small white lesions. Invasive lionfish in one frame.
Saba - Ladder Labyrinth: Possible bleaching: one large meandroid/star coral colony reads unusually pale/whitish, possibly a blue-water lighting artifact rather than bleaching. Gear: an old fish trap wedged in the sand.
Saba - Tent Shallow: Invasive species: a lionfish (Pterois volitans/miles) tucked into a rock crevice.
Coral cover over time (pooled)
One point per year: the mean of every hard coral cover value available for this region that year — Anderson’s own dives and every independent survey station within 5 km of them. The vertical bar is the full range behind that mean. Different programs use different methods at different stations, so this is a regional summary, not a single comparable series. Years resting on fewer than three values are drawn as smaller points (2024, 2025). Marker shape: his own dives, other organizations’ surveys.
5 independent survey records within 5 km of a site in this region (deduplicated across sites).
MERMAID project “Saba_Marina_Relocation”* — Black_Rock_Donor (2024): 1.7% hard coral cover, 1.45 km from Saba - Tent Shallow
MERMAID project “Saba_Marina_Relocation”* — Black_Rock_Donor (2025): 10% hard coral cover, 1.45 km from Saba - Tent Shallow
MERMAID project “Saba_Marina_Relocation”* — Black_Rock_Donor (mean of 2 surveys, 2024–2025) (2025): 5.8% hard coral cover, 1.45 km from Saba - Tent Shallow
MERMAID project “Saba_Marina_Relocation”* — Hole_in_the_Corner_(HITC)_Recipient (2024): 6.5% hard coral cover, 3.15 km from Saba - Tent Shallow
MERMAID project “Saba_Marina_Relocation”* (MERMAID test project) — Black_Rock_Donor (2025): 5.8% hard coral cover, 1.45 km from Saba - Tent Shallow
Spalding MD, et al. (2001) World Atlas of Coral Reefs. University of California Press, Berkeley. [PDF]
Wells SM (ed.) (1988) Coral Reefs of the World. Volume 1: Atlantic and Eastern Pacific. UNEP/IUCN, Cambridge. [PDF]
Wilkinson C (2006) Status of coral reefs of the world: summary of threats and remedial action. In: Côté IM, Reynolds JD (eds) Coral Reef Conservation. Cambridge University Press, Cambridge. [PDF]

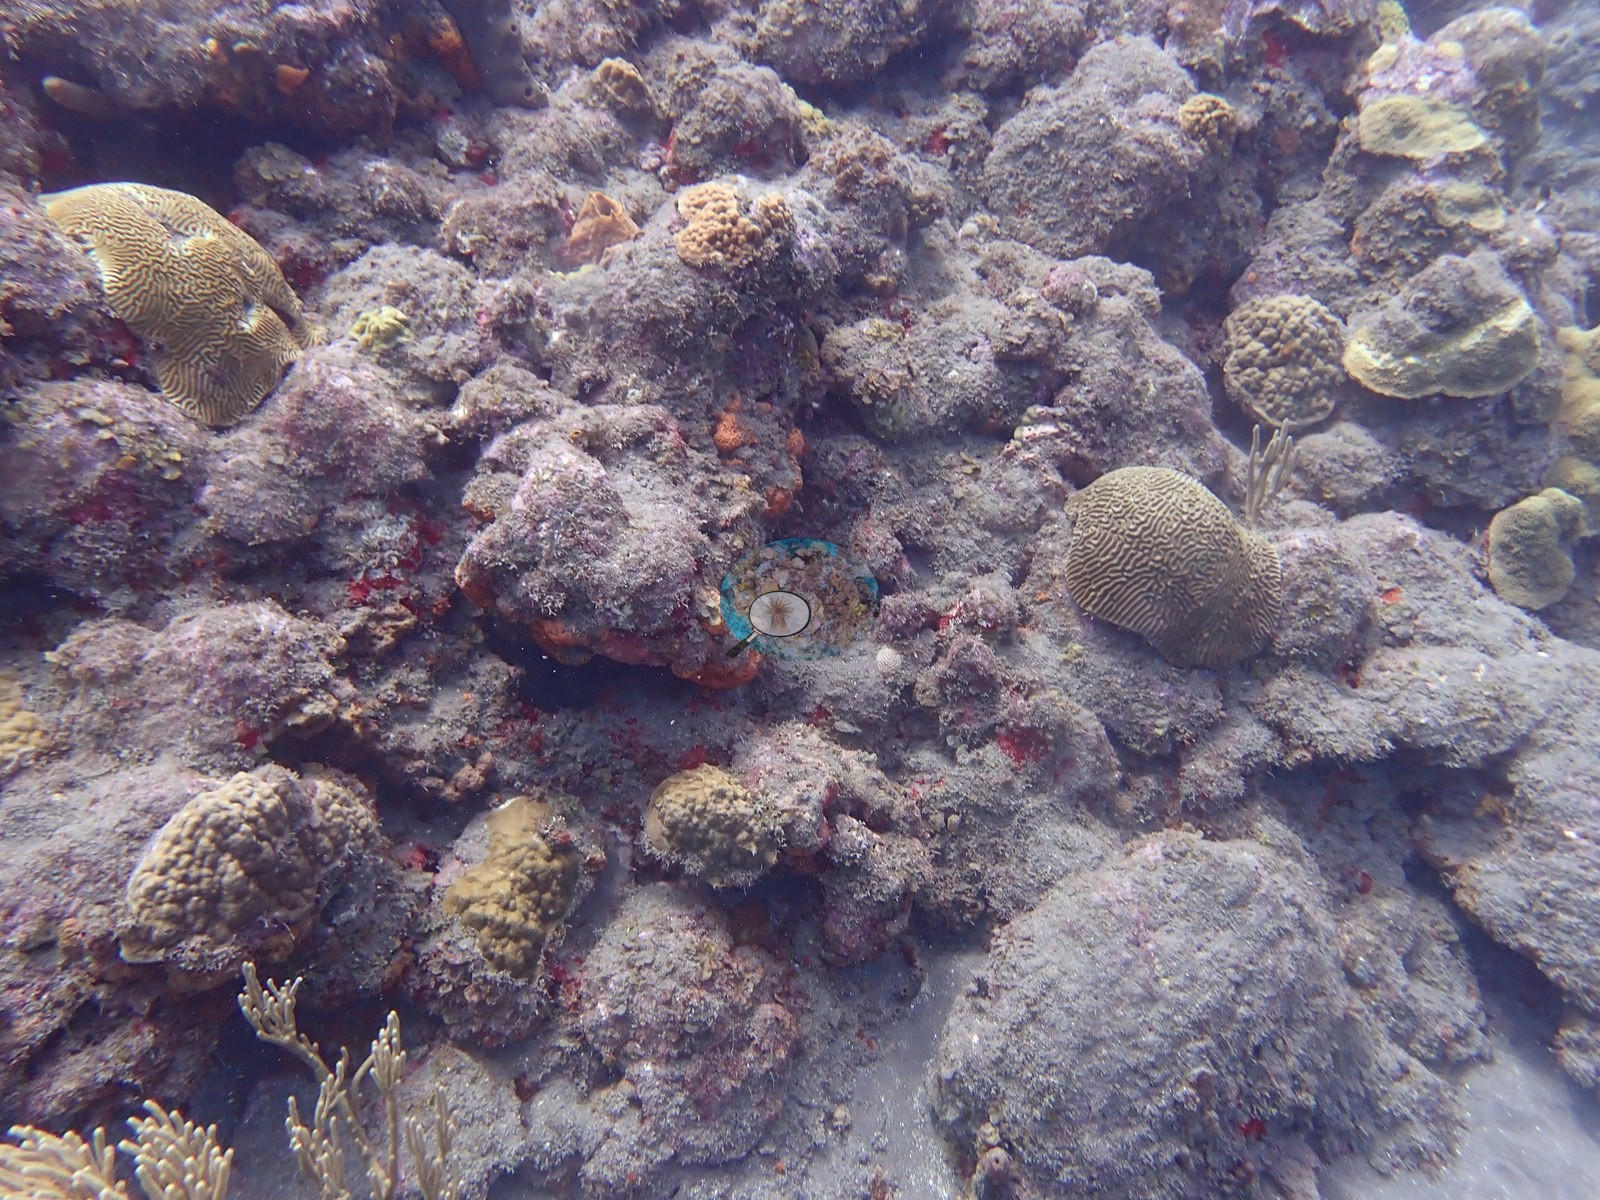

 photo: Saba - Man-of-War Shoals
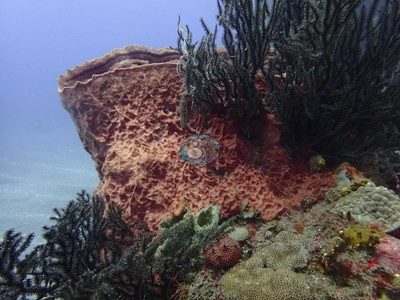 photo: Saba - Man-of-War Shoals
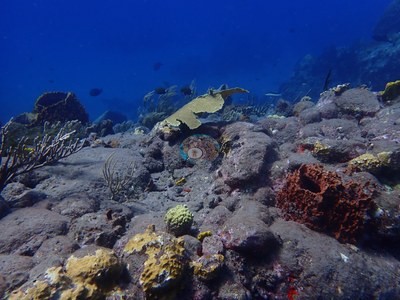 photo: Saba - Tent Drift
 © Coral Reef Diagnostics.