
Saba - Tent Shallow
Part of the regional summary: Saba
More about this place: Saba on Wikipedia
More info
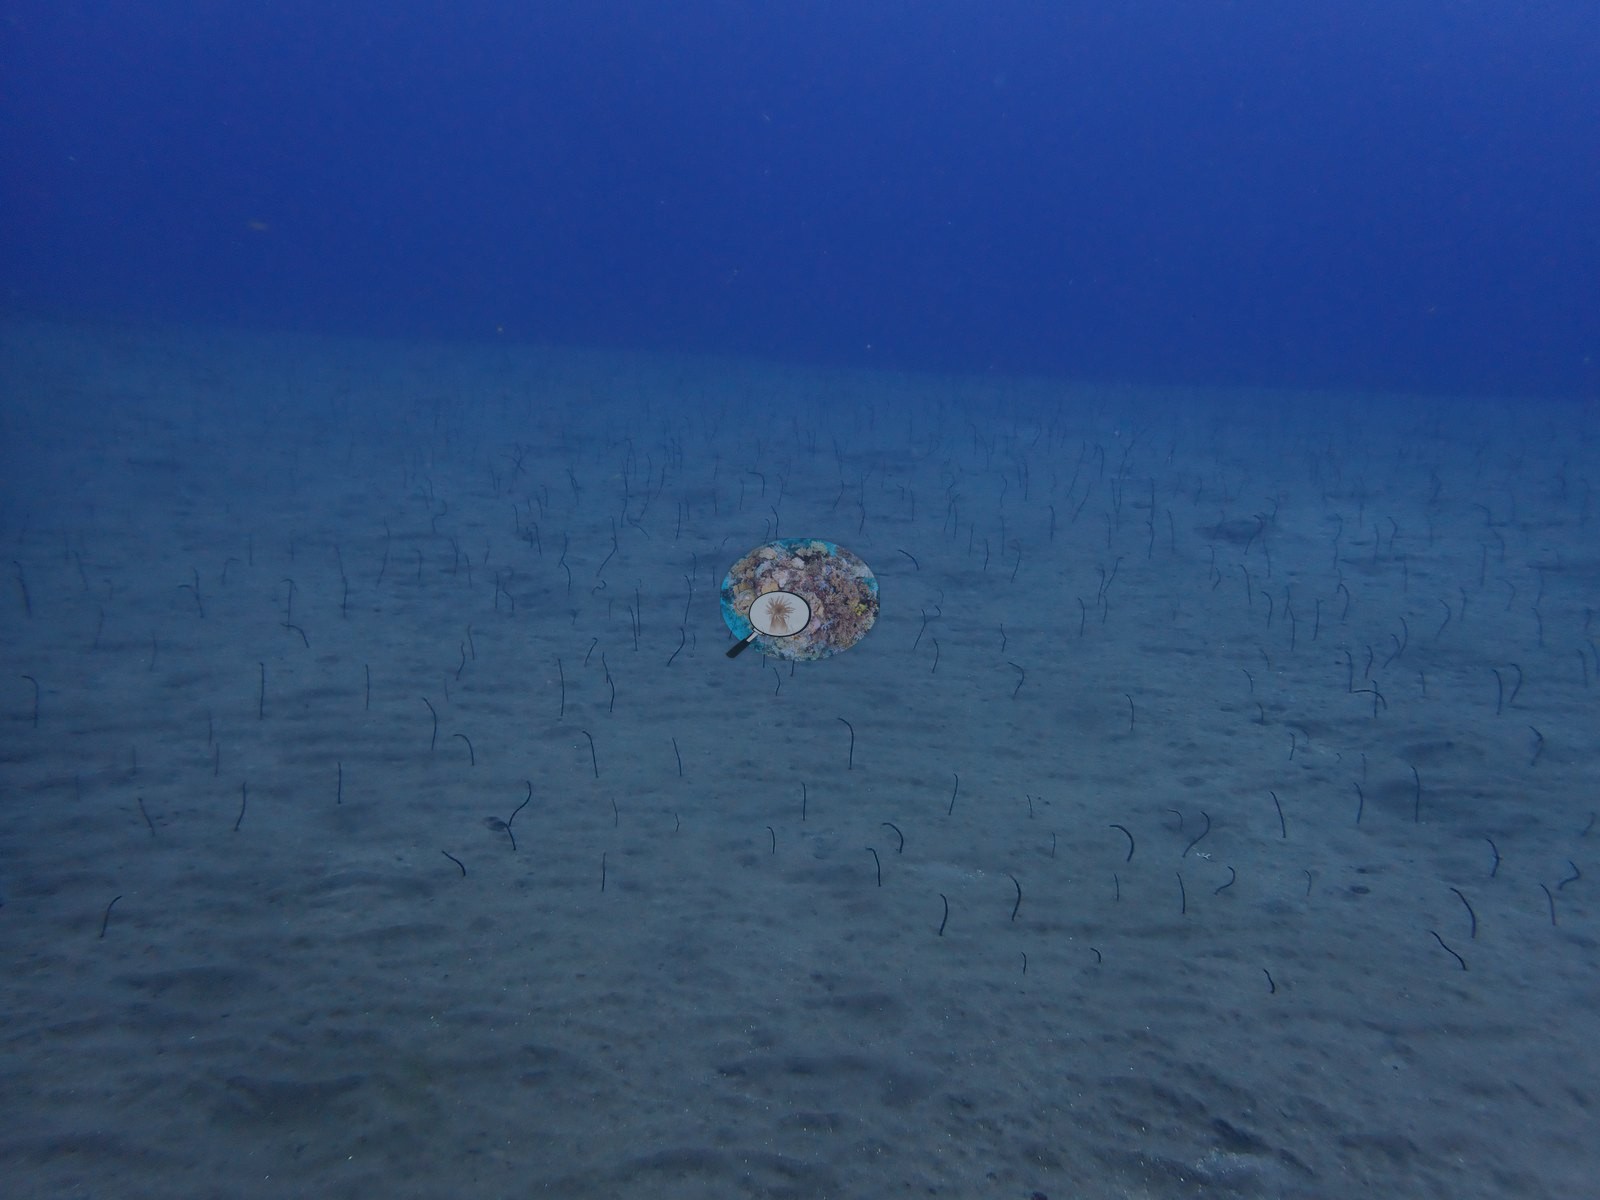
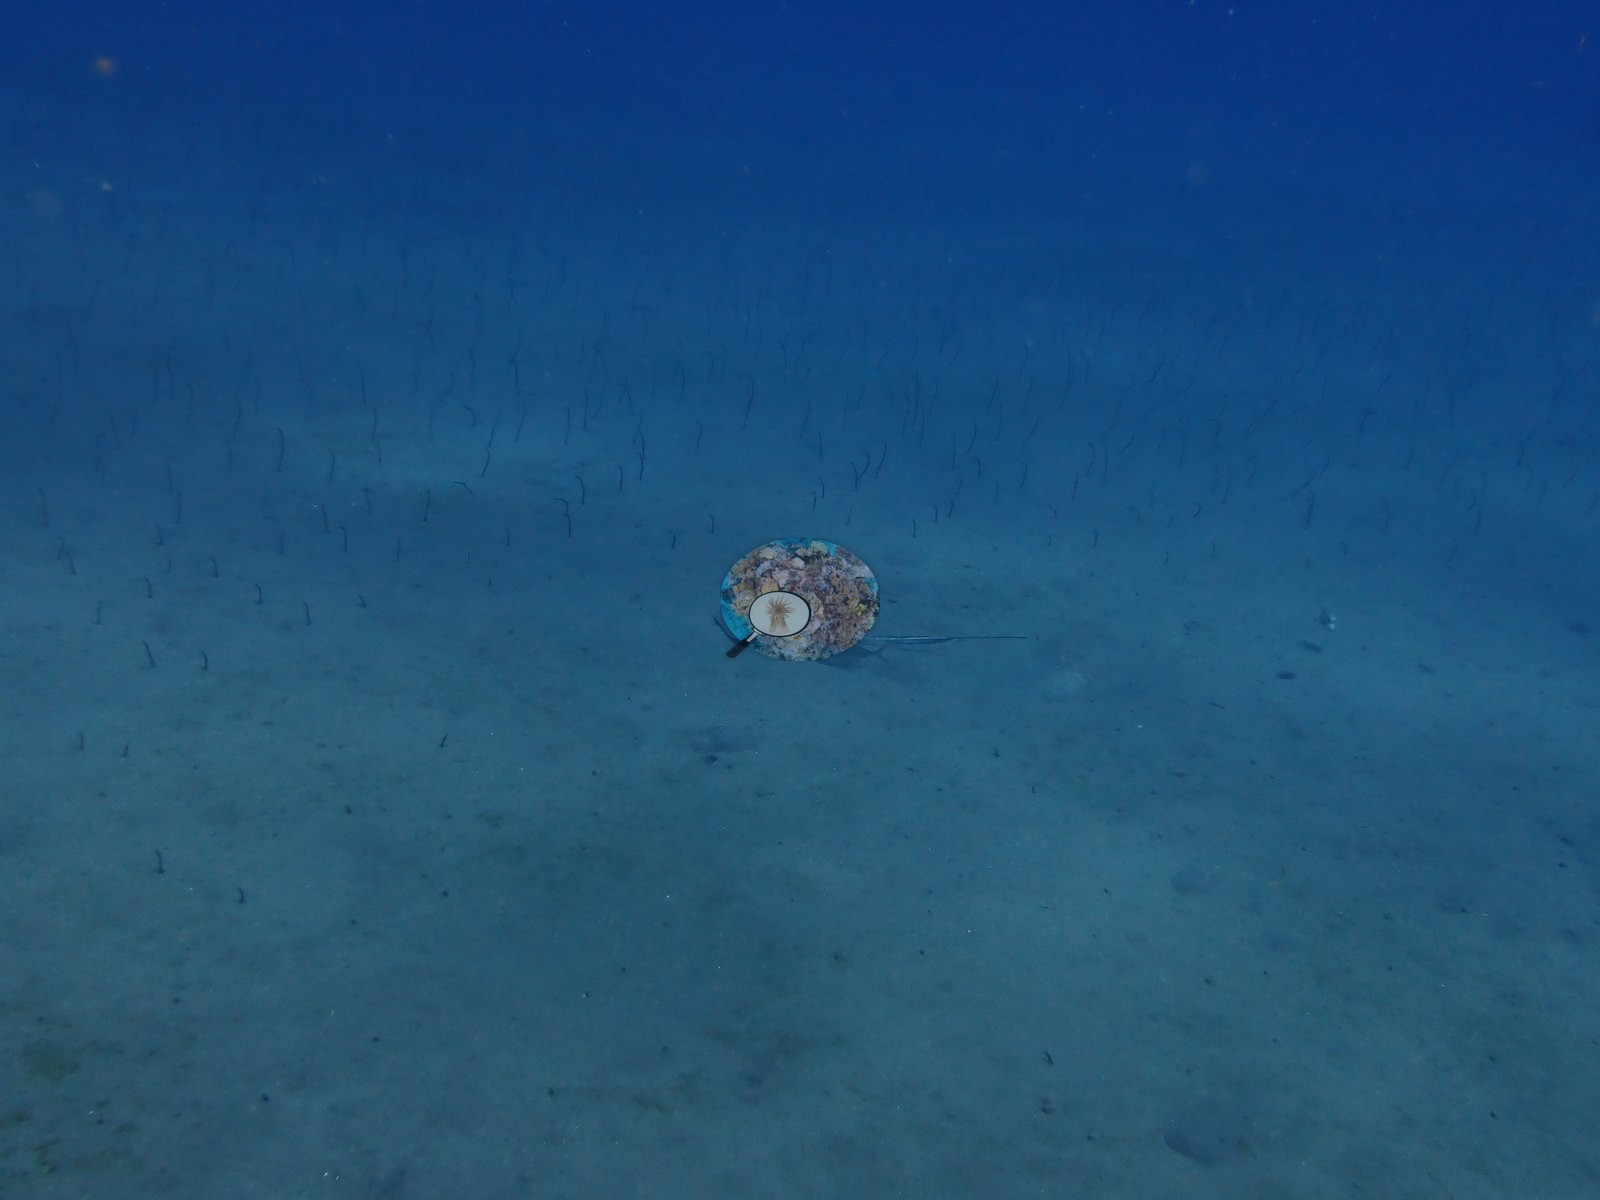
Leeward Caribbean Islands (NOAA CRW virtual station) · Eastern Caribbean ecoregion mean=13.1°C-heating weeksA shallow volcanic sand plain (about 6 m) with a garden-eel colony of hundreds, broken by isolated rocky knolls covered mainly in tube and barrel sponges, sea rods, and sea fans. Hard coral is only a minor part of this sand-and-soft-coral habitat, and an invasive lionfish was spotted on one outcrop.
Three independent survey stations shown with the program’s logo — click one to see how far it is from this site.
Three other CRD dive sites within 5 km shown in orange — click a marker to open its page.
12 of these 51 photographs are shown beside the text that discusses them under "Site description" below.
Site description
Setting
A shallow (dive-computer readout confirms 5.6 m at the safety stop), volcanic sand-and-rock habitat rather than a continuous reef, consistent with the name "Tent Shallow."
General benthic features
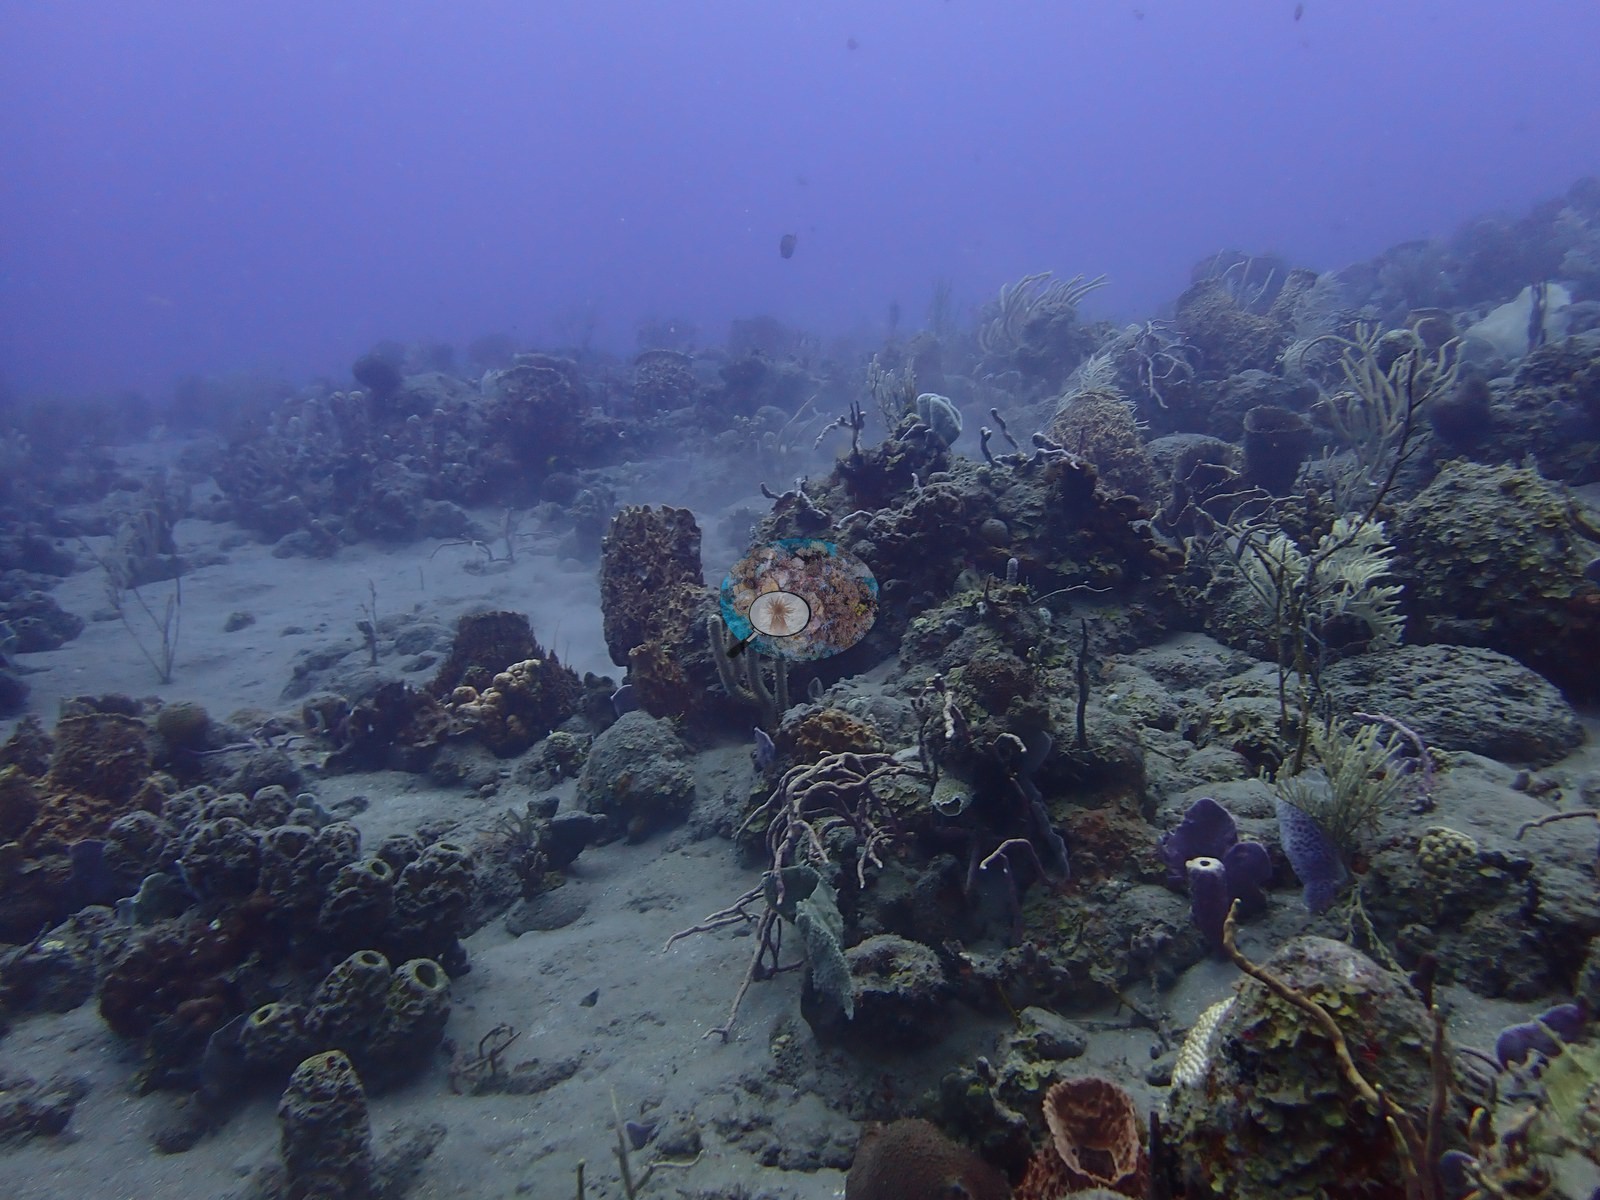
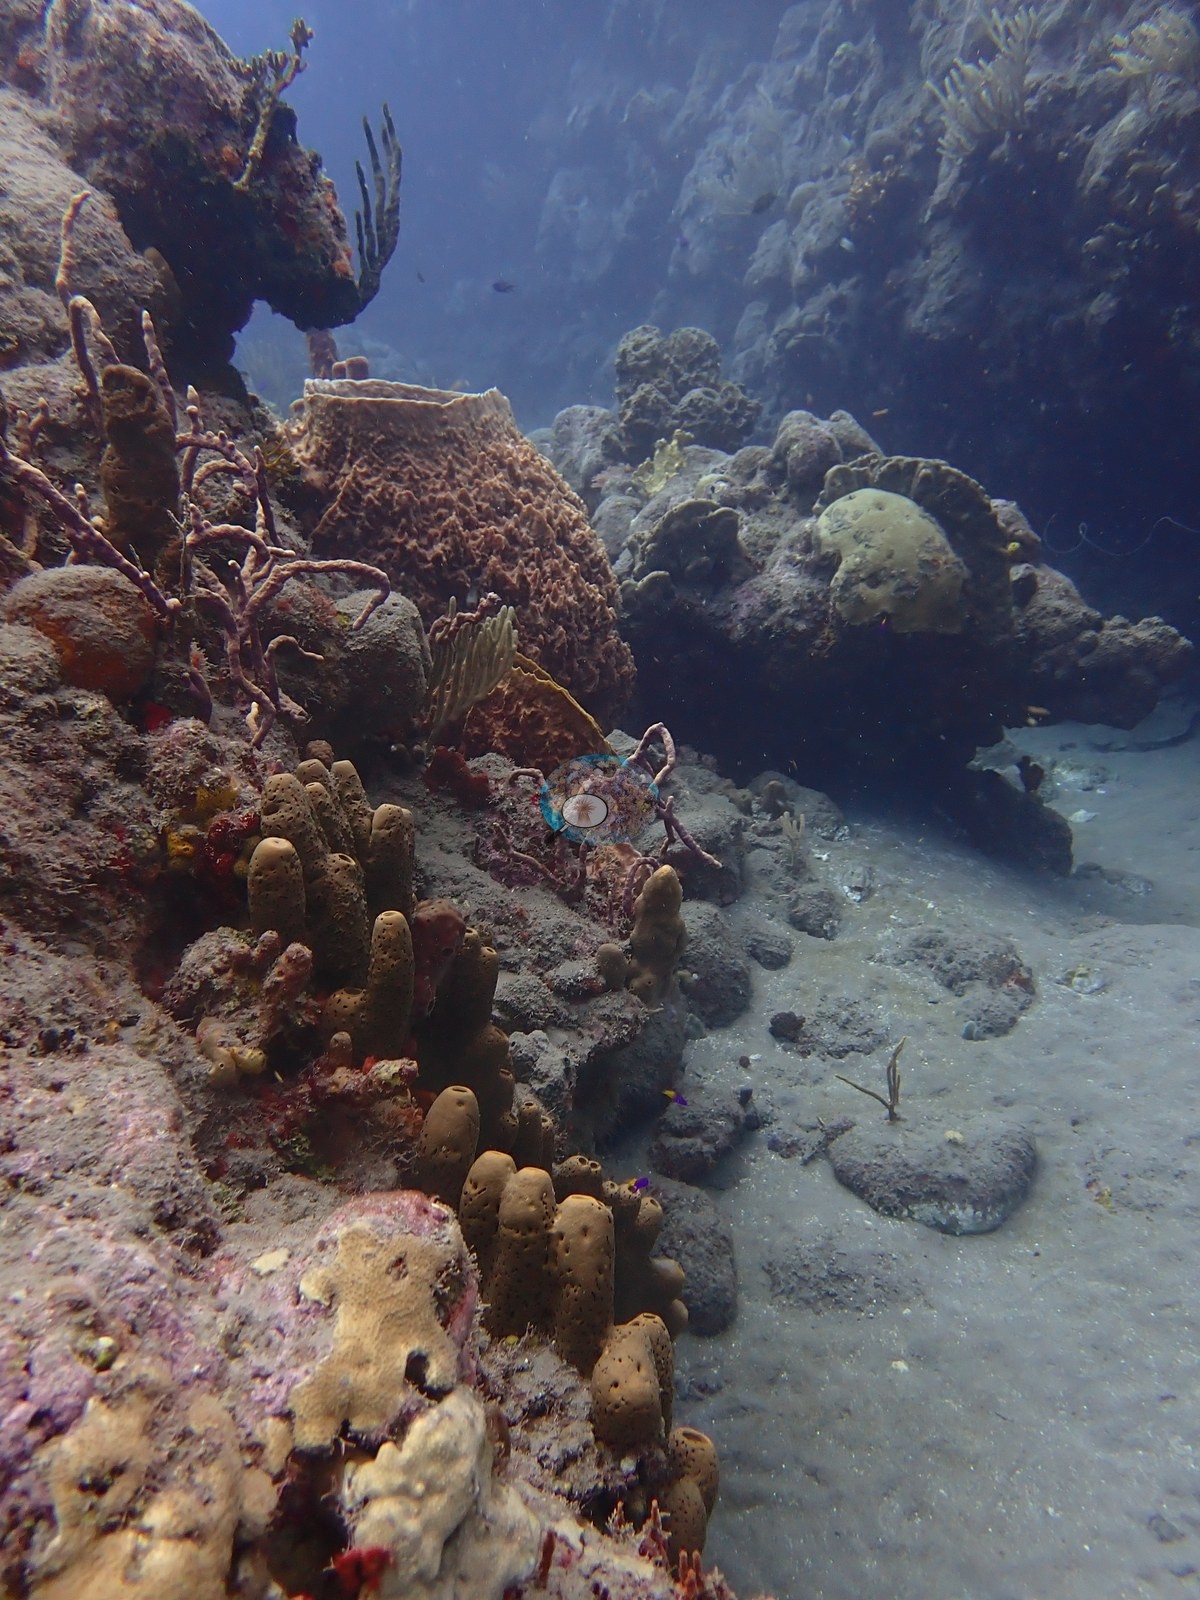
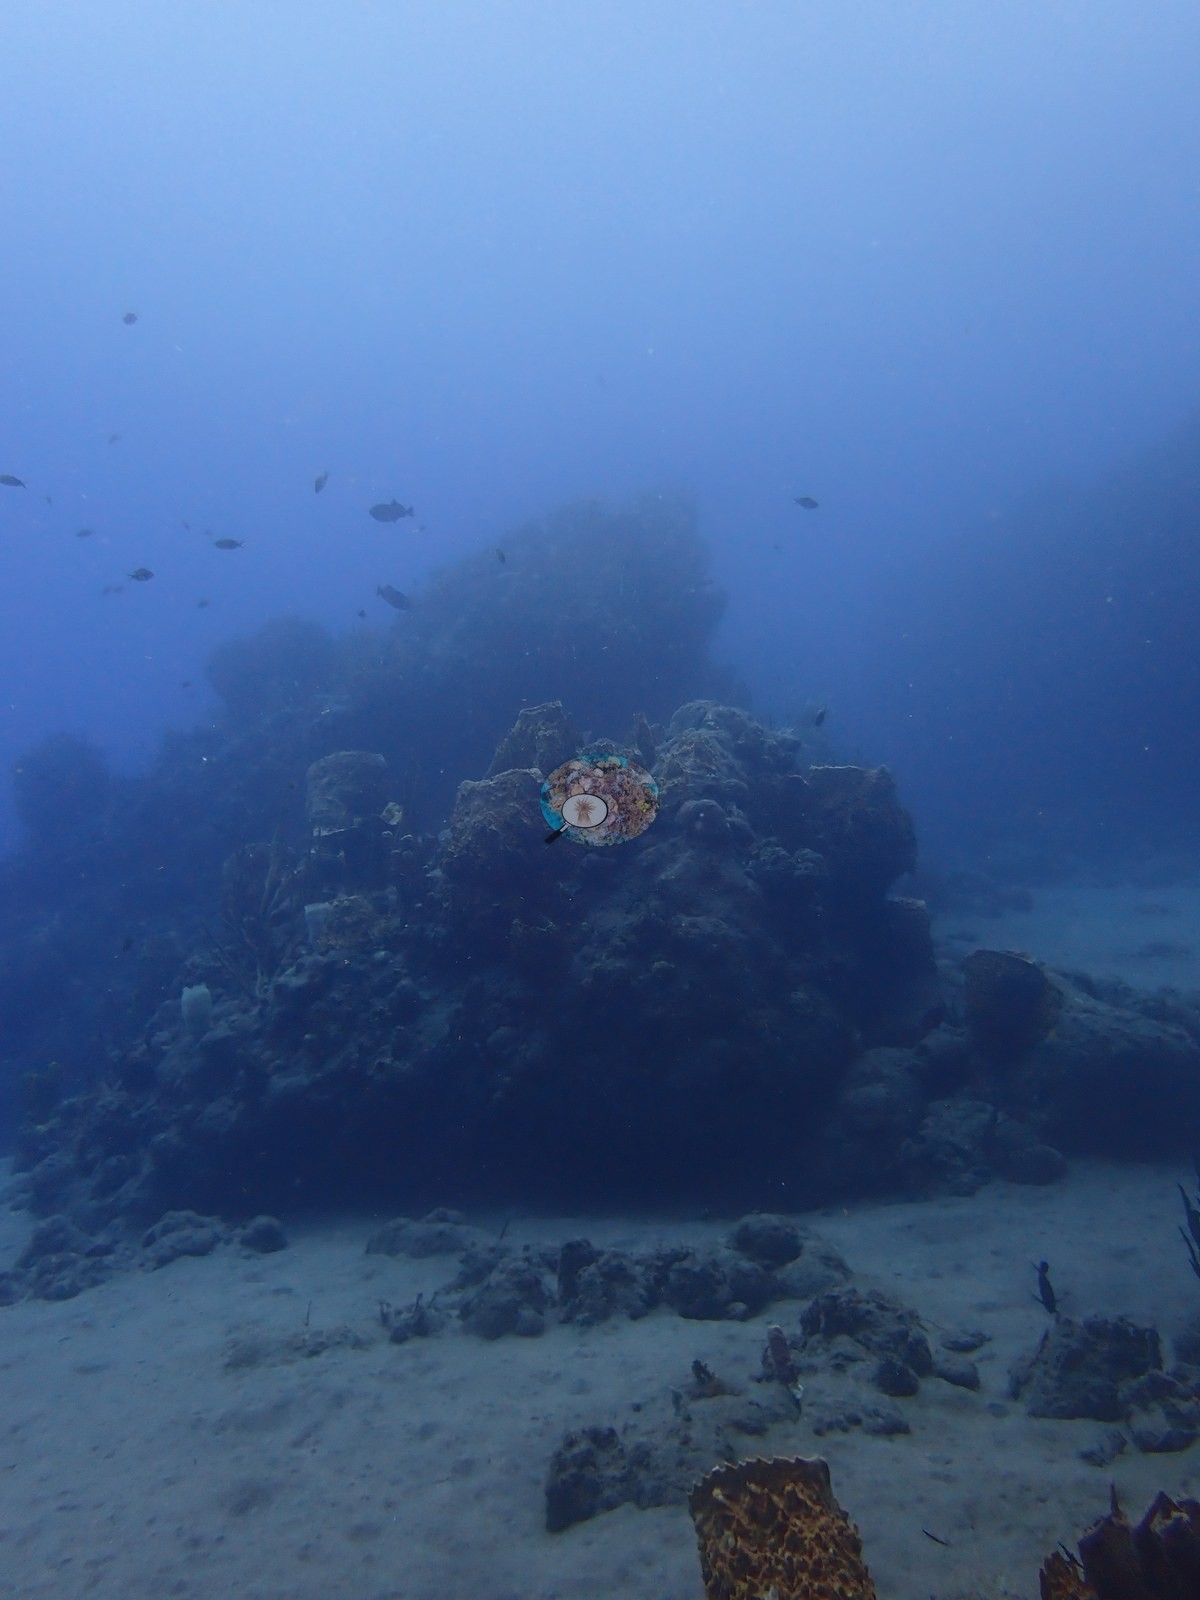
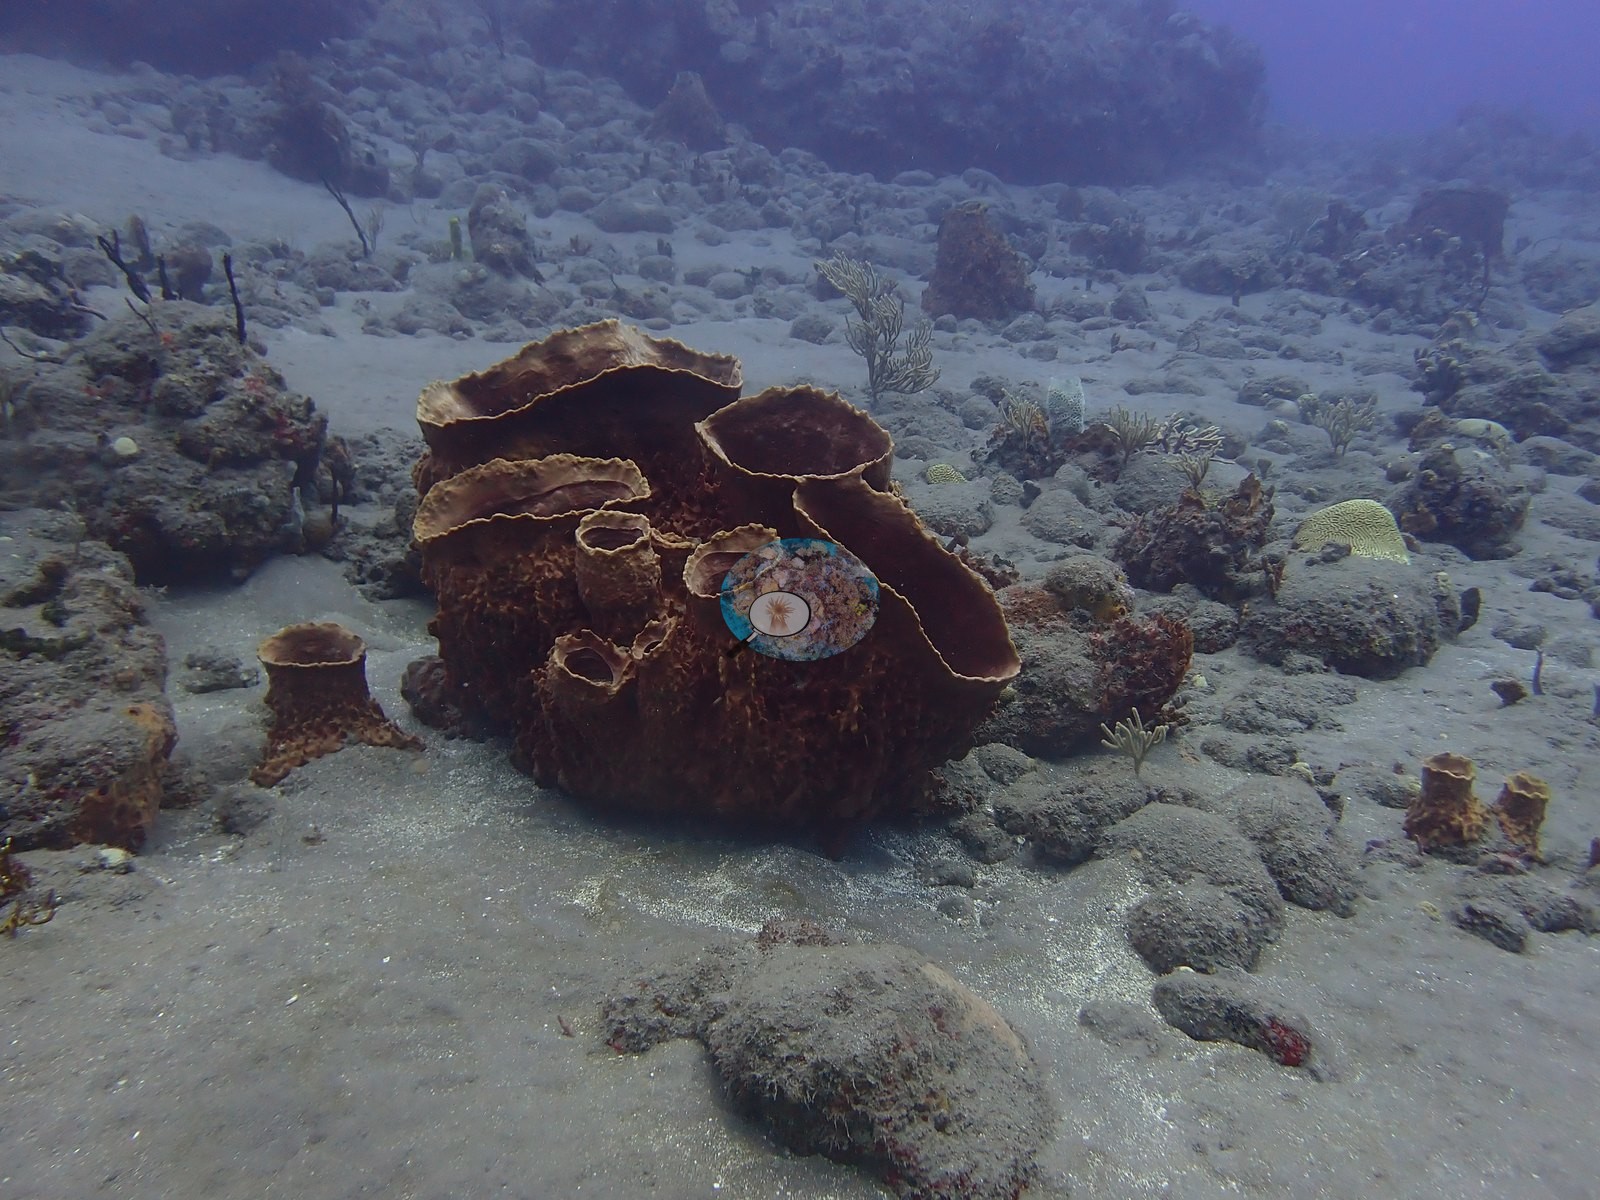
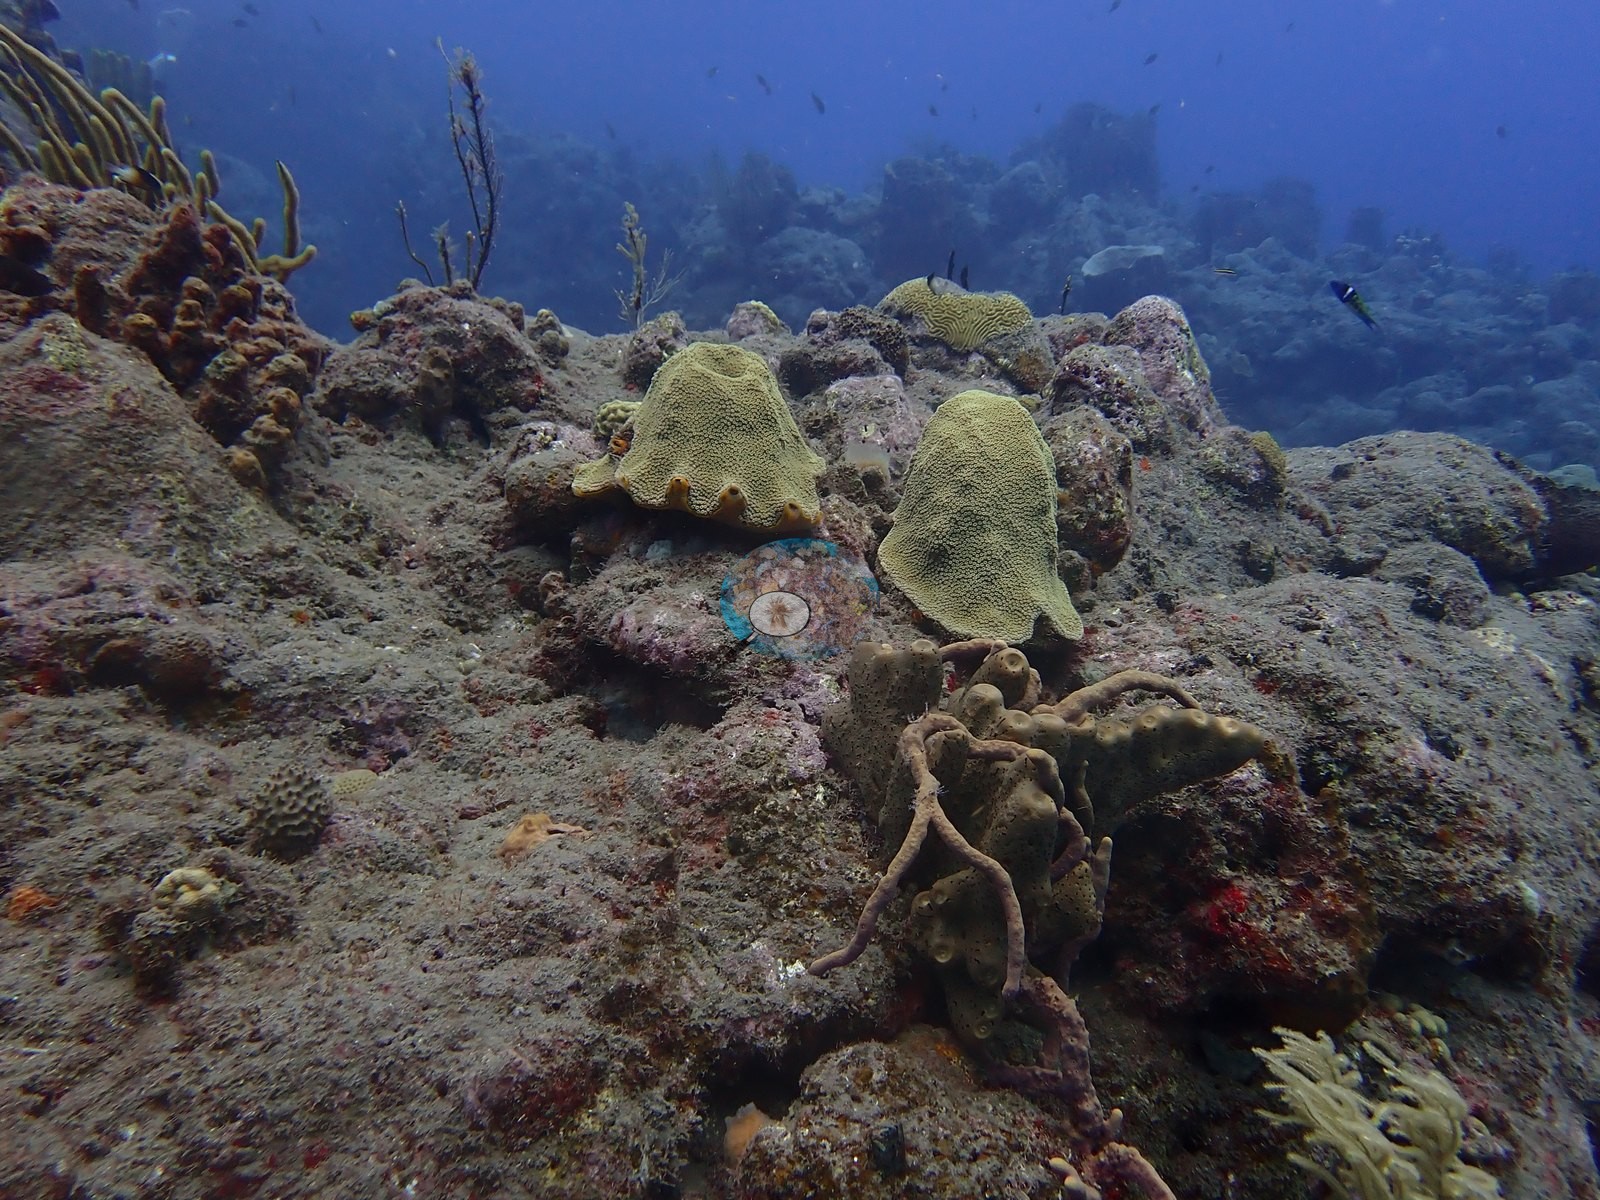
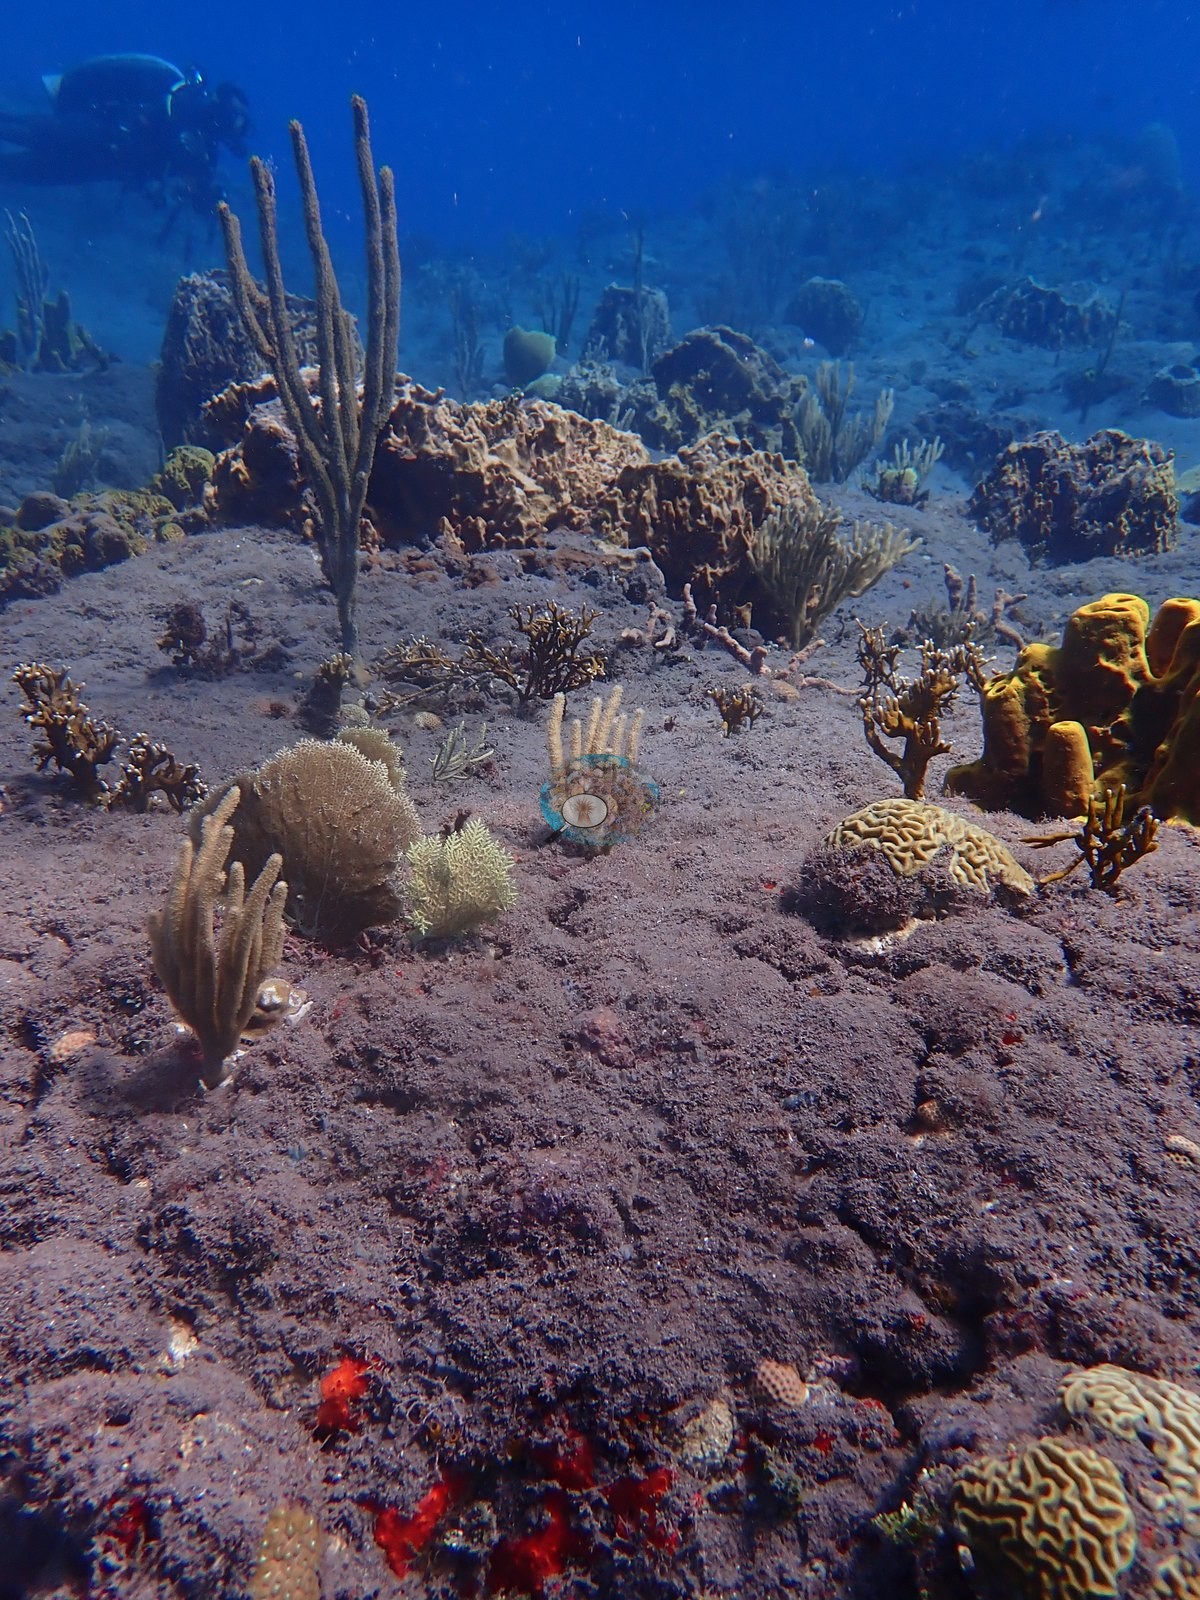
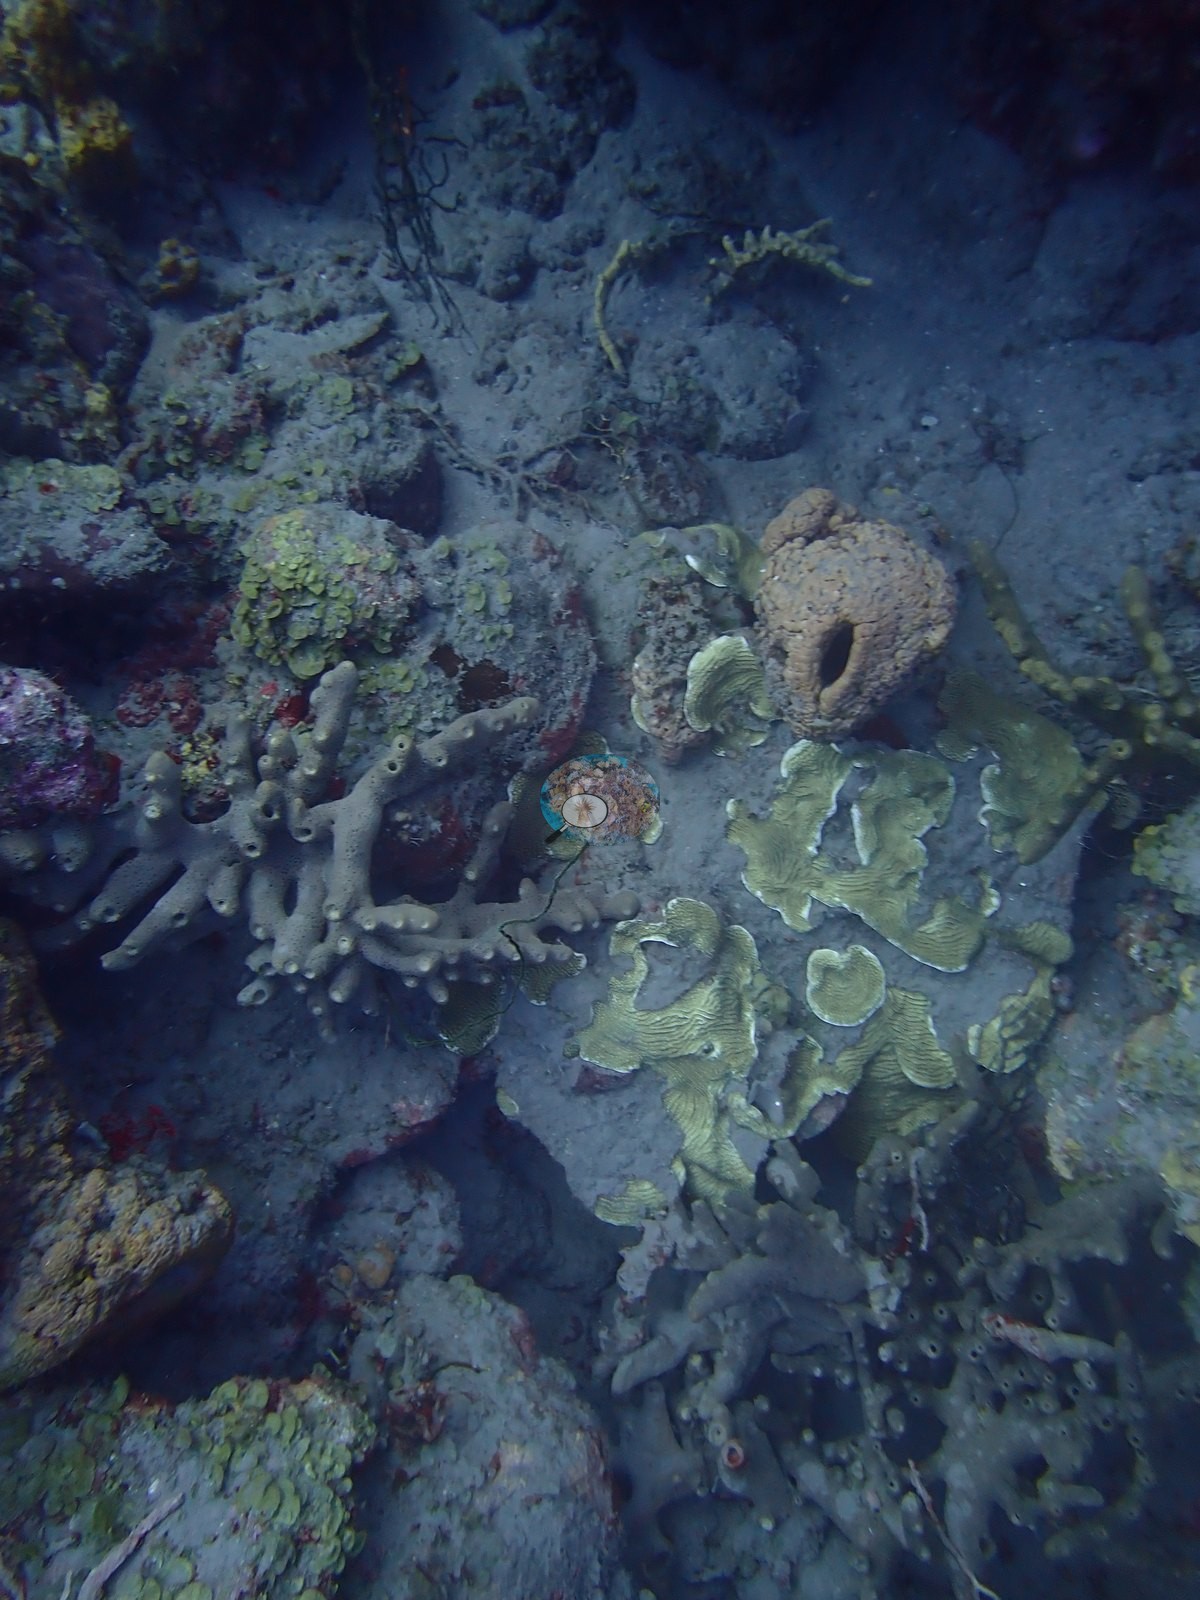
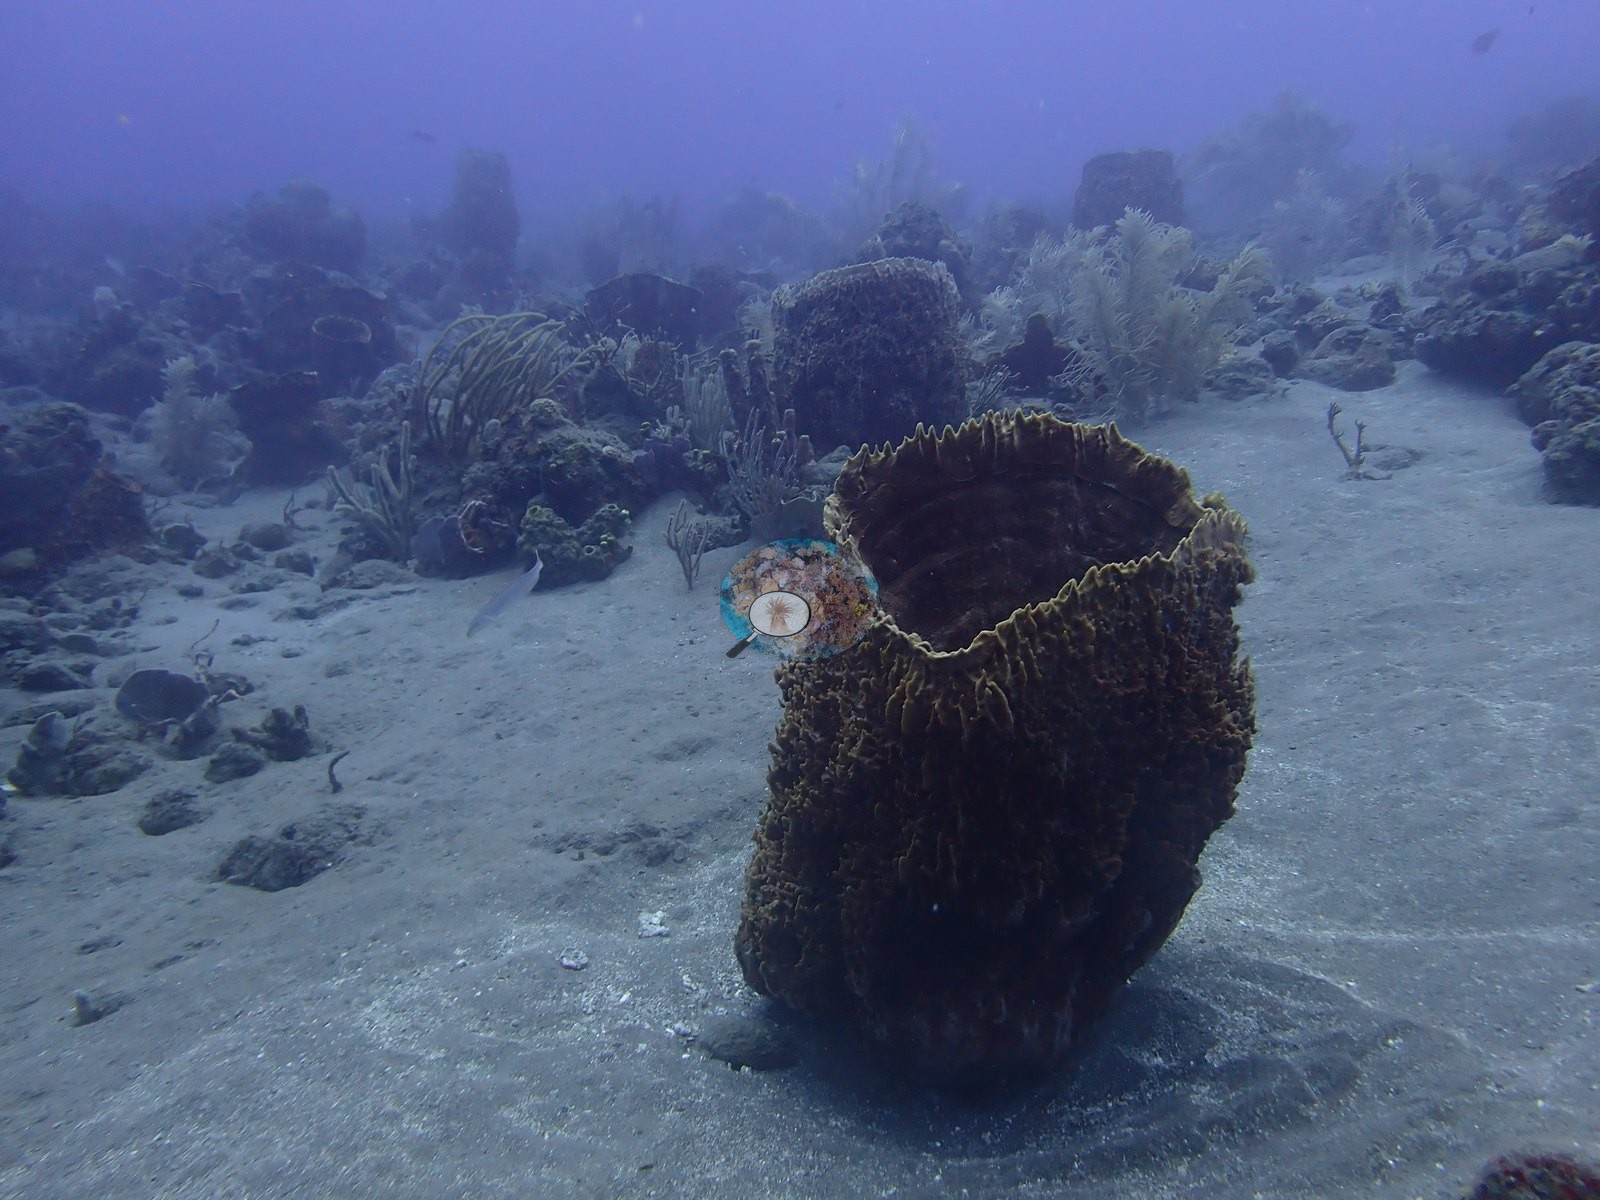
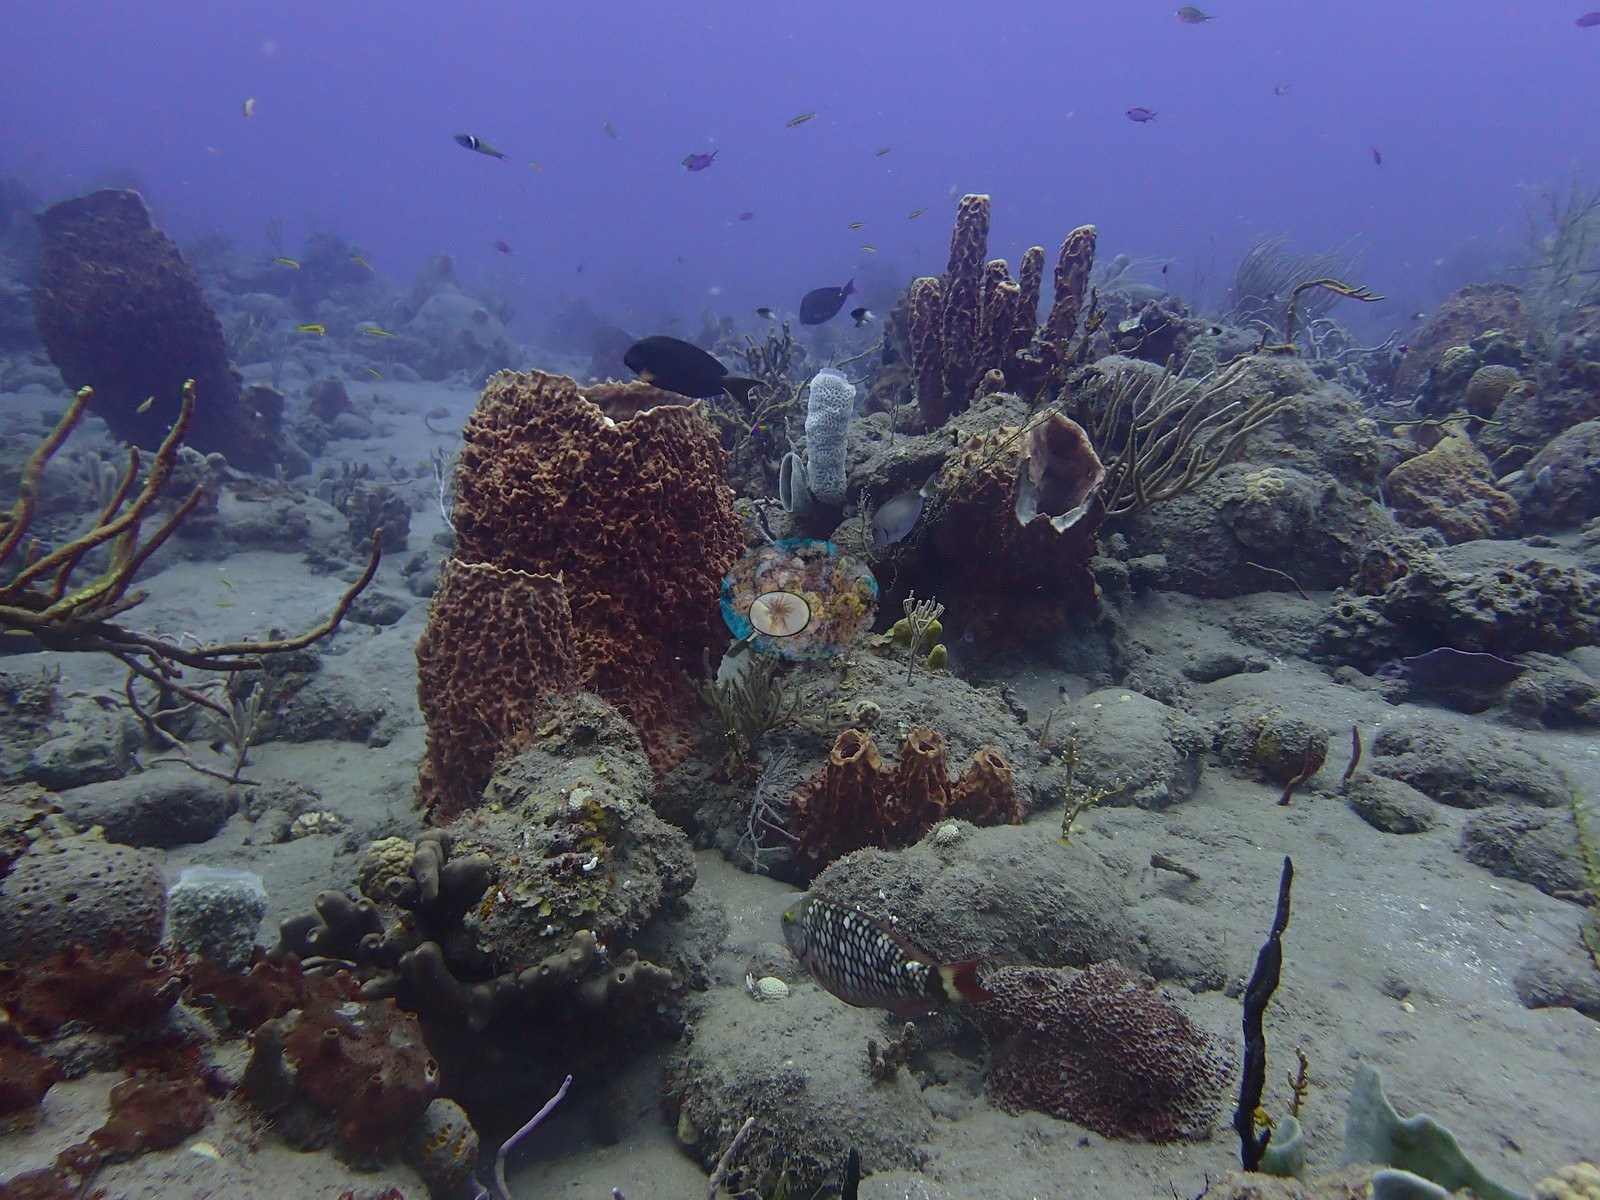
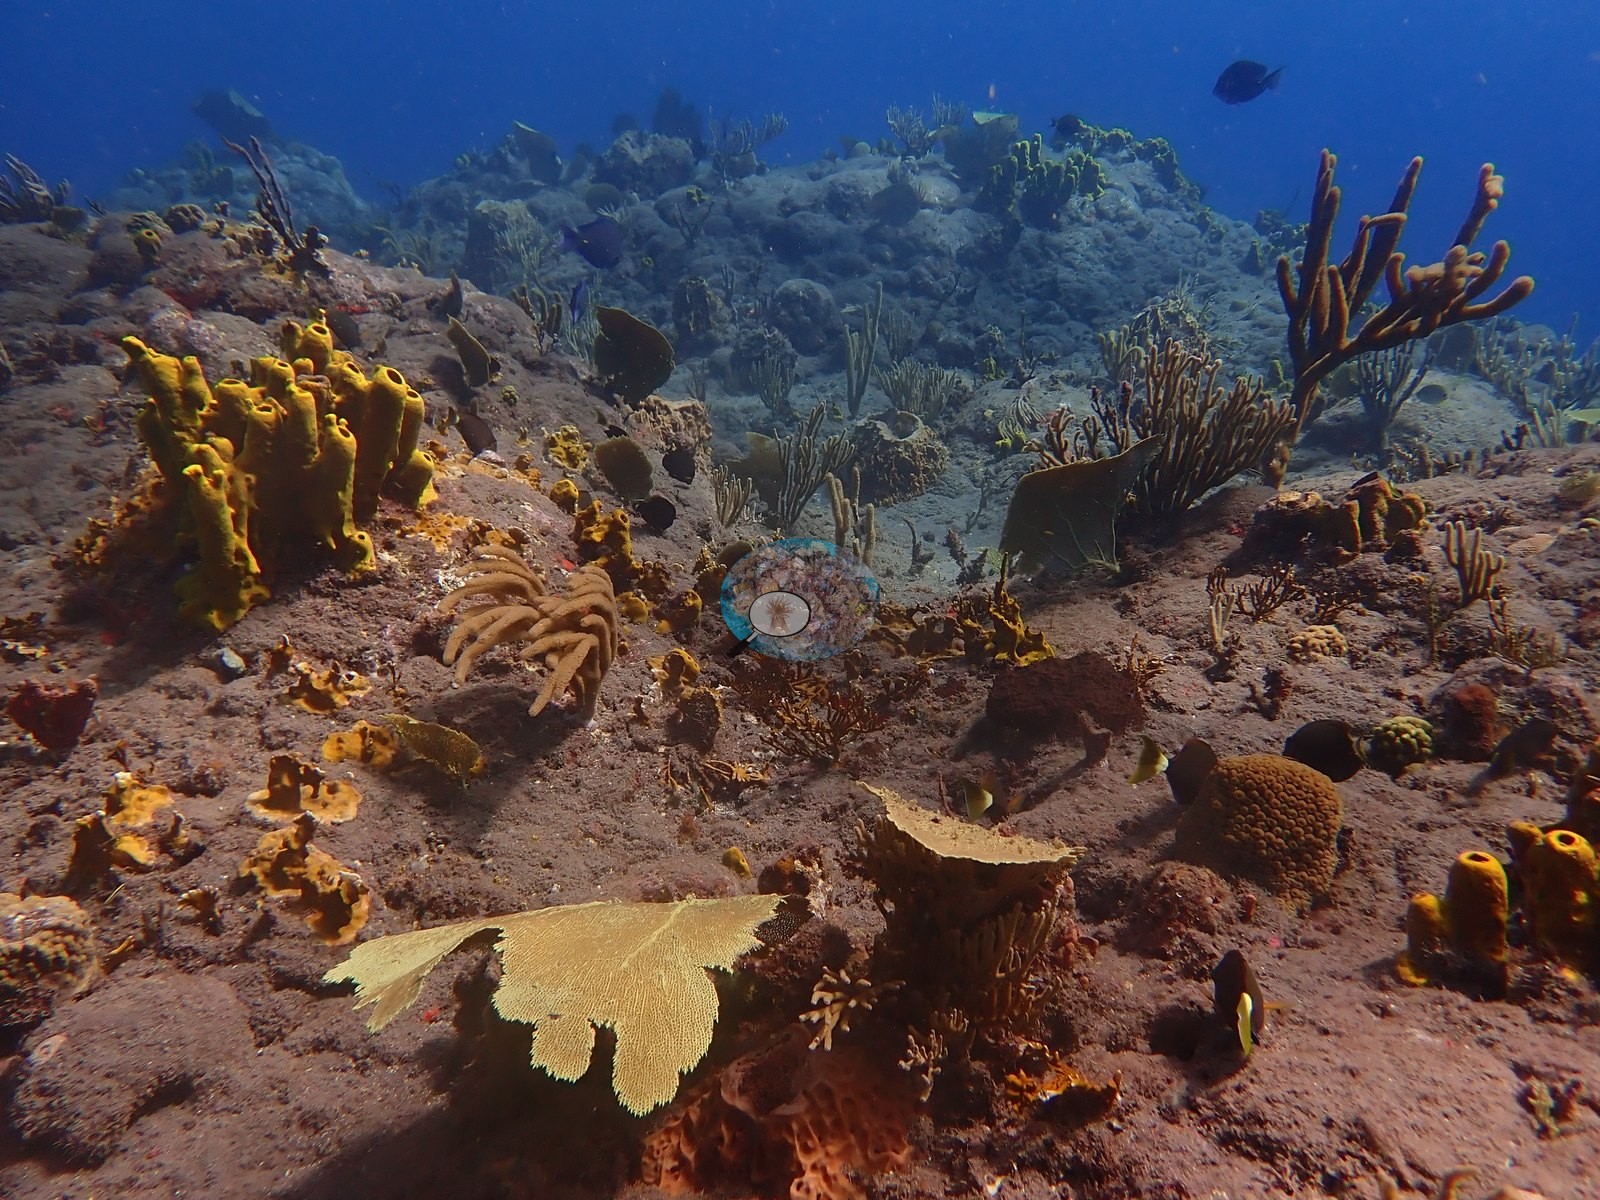
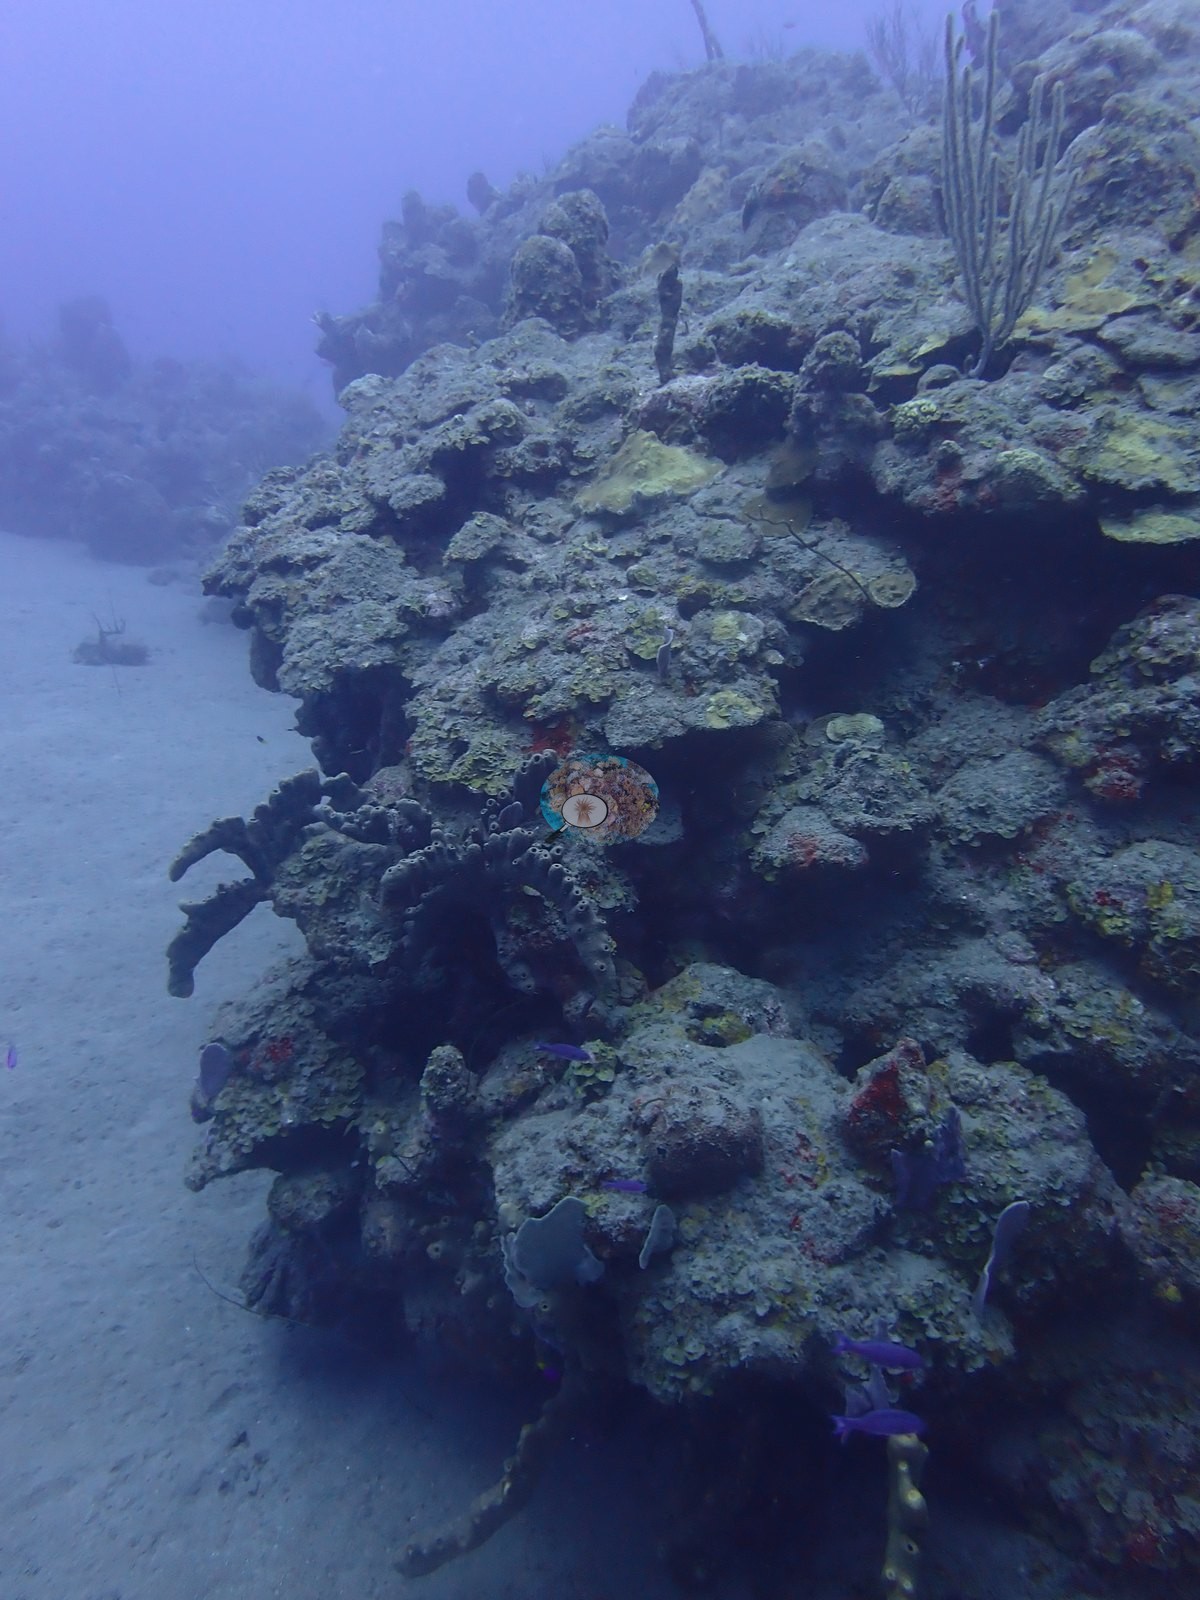
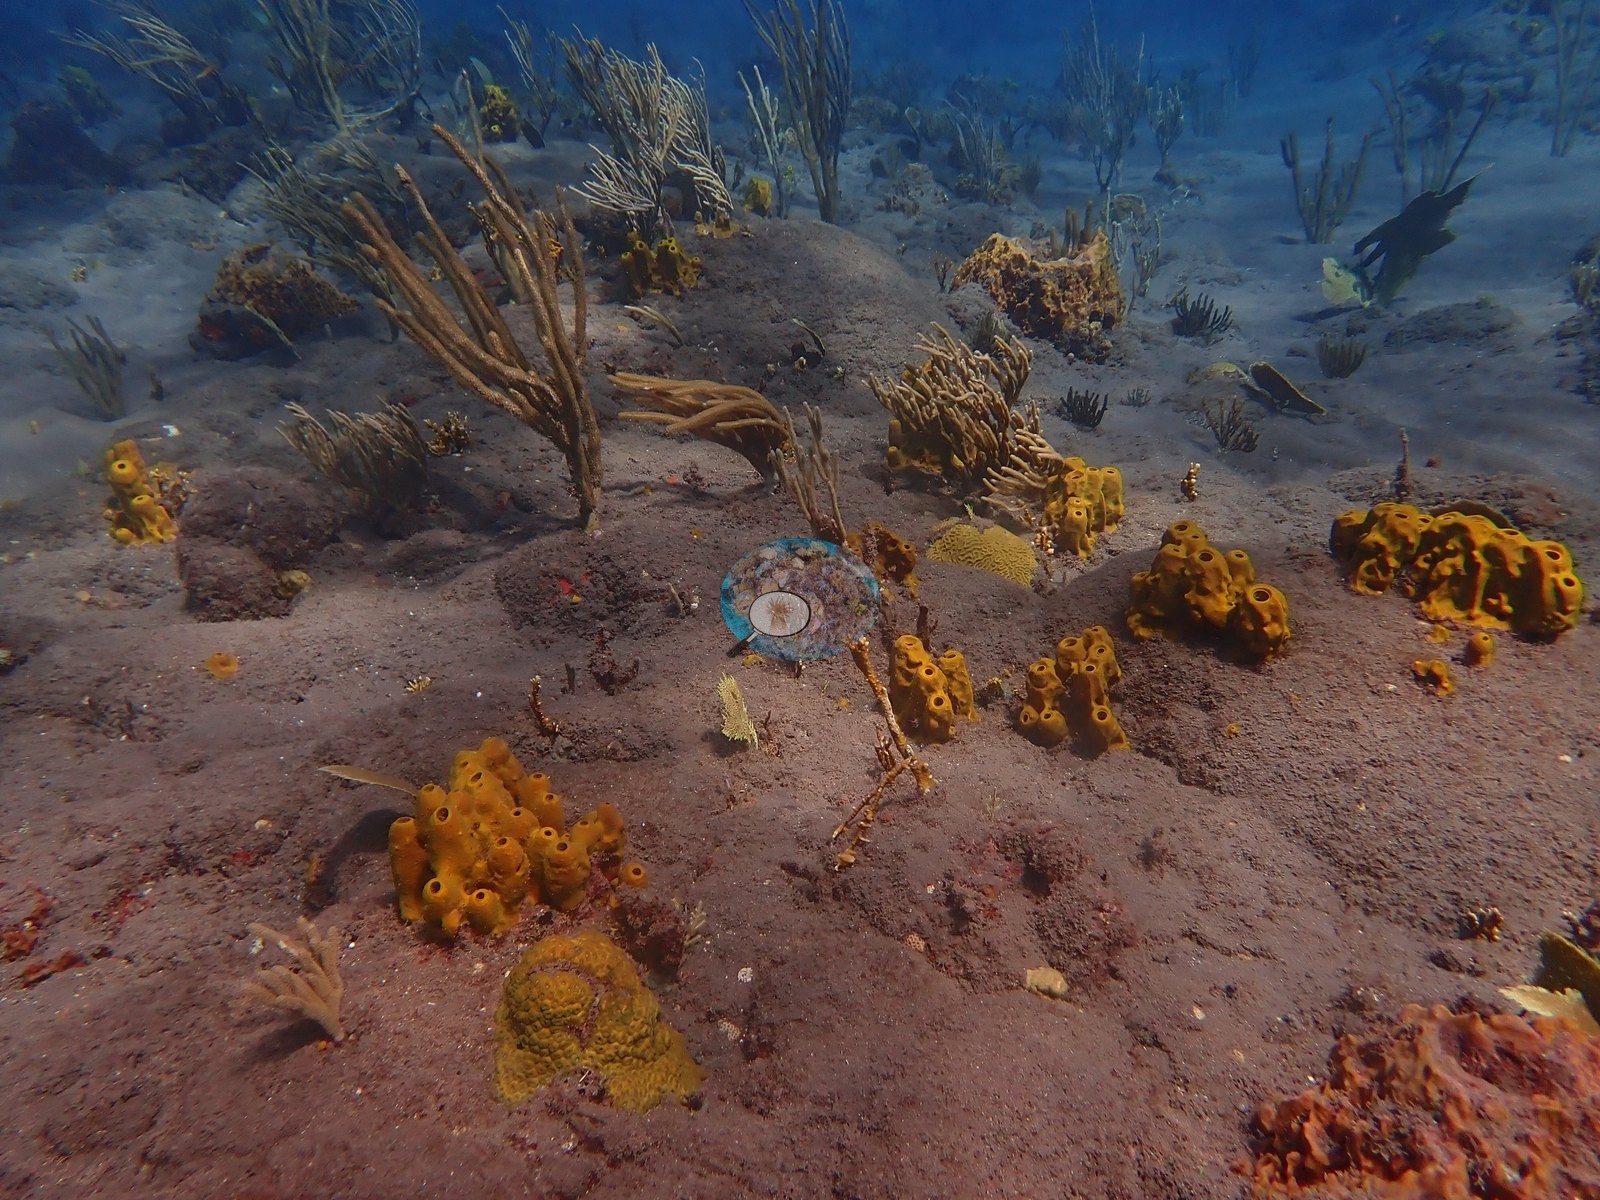
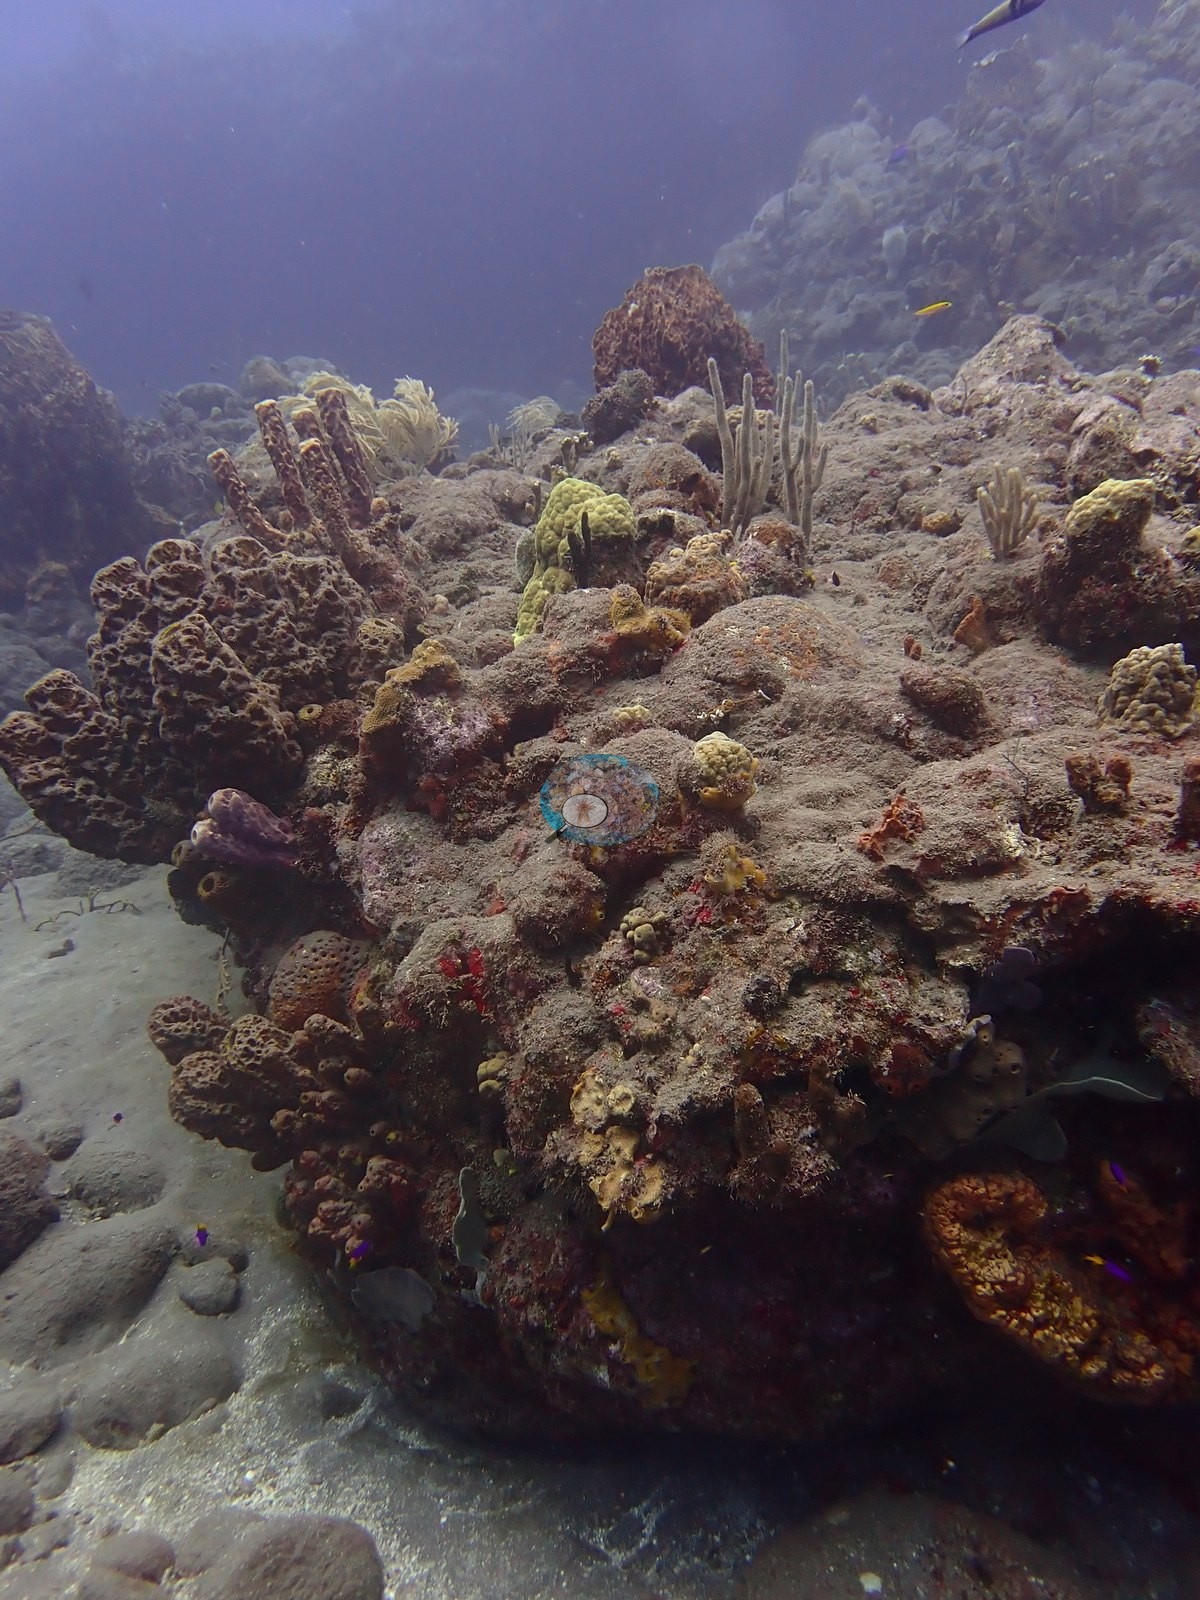
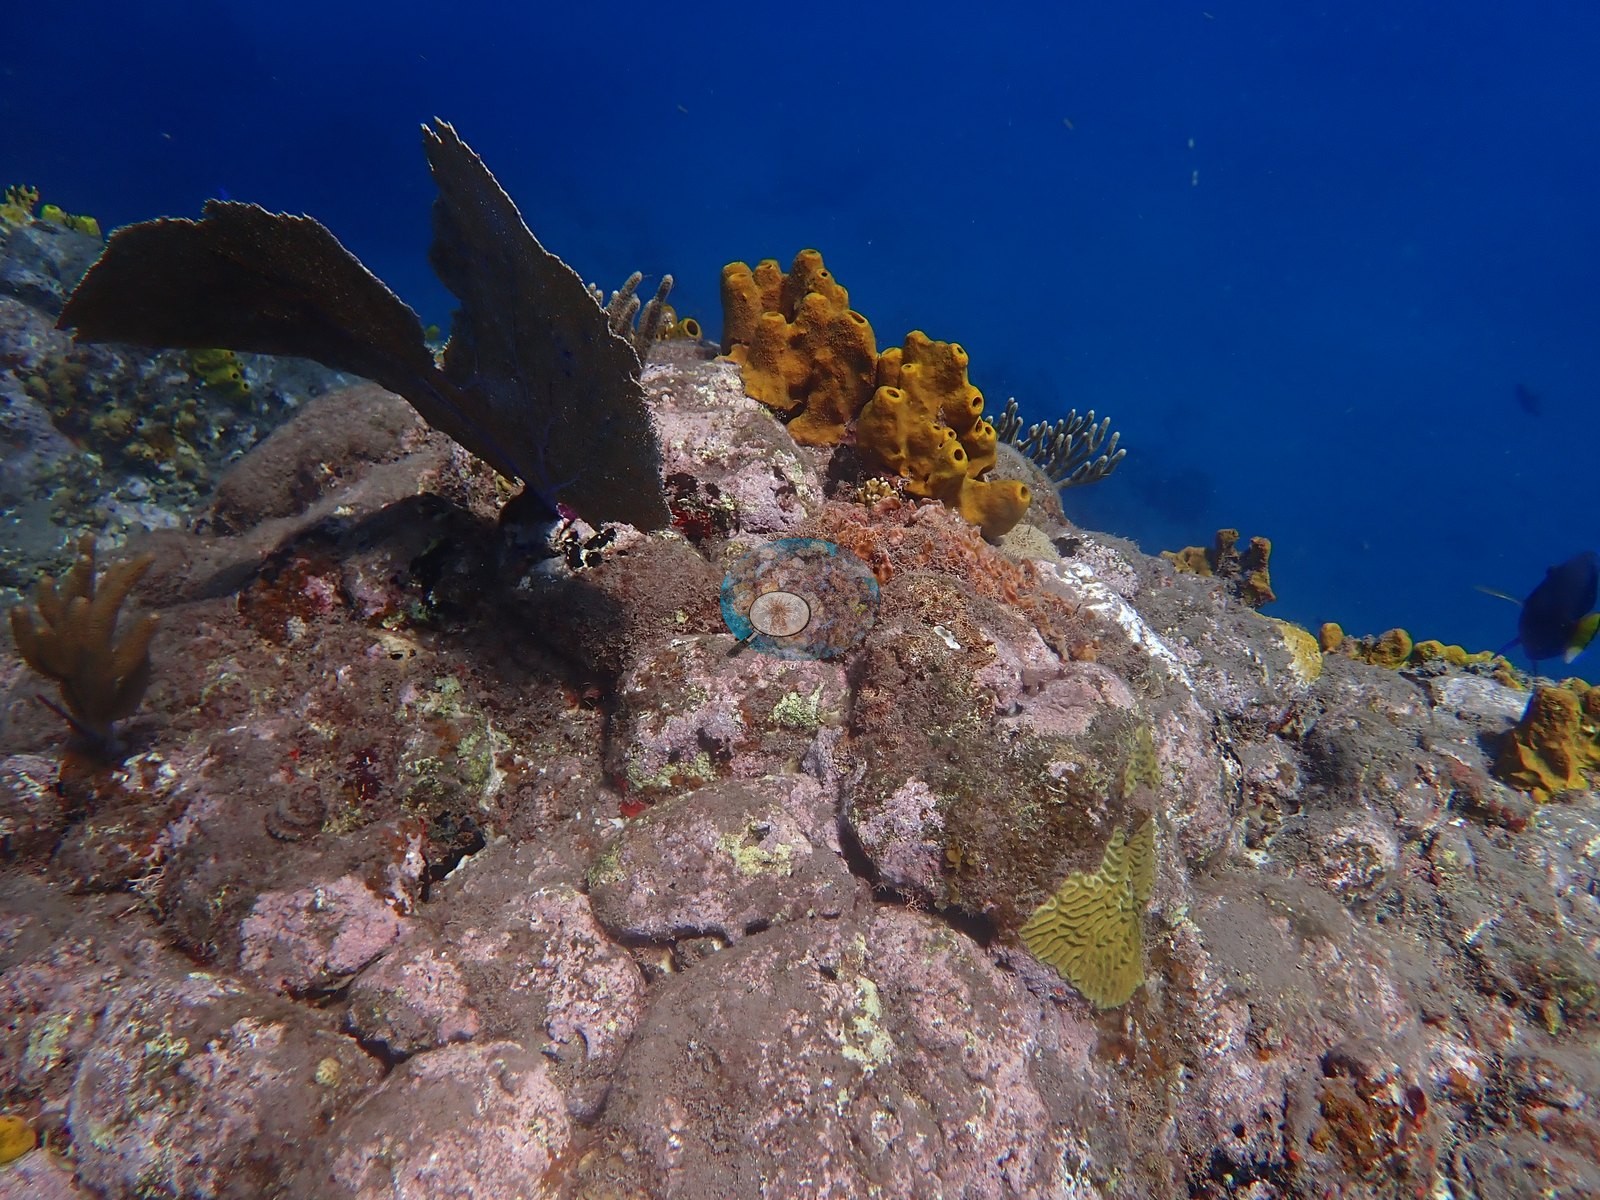
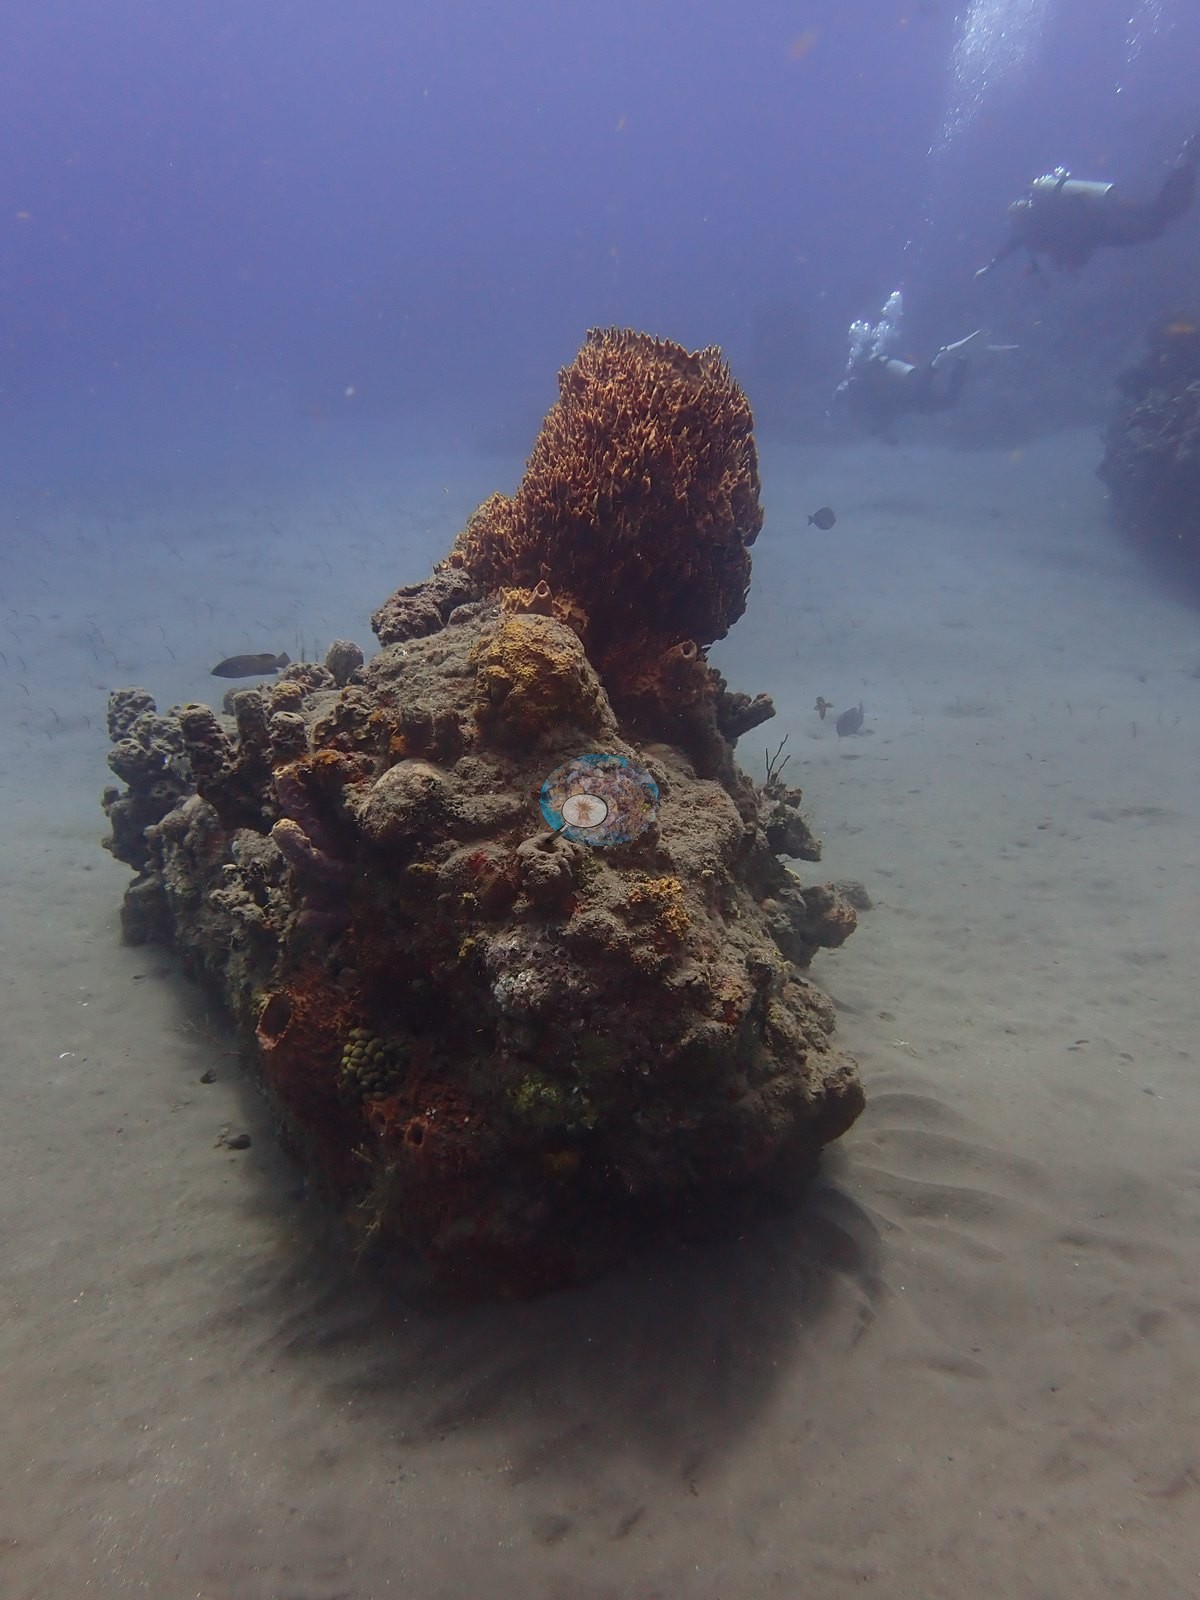
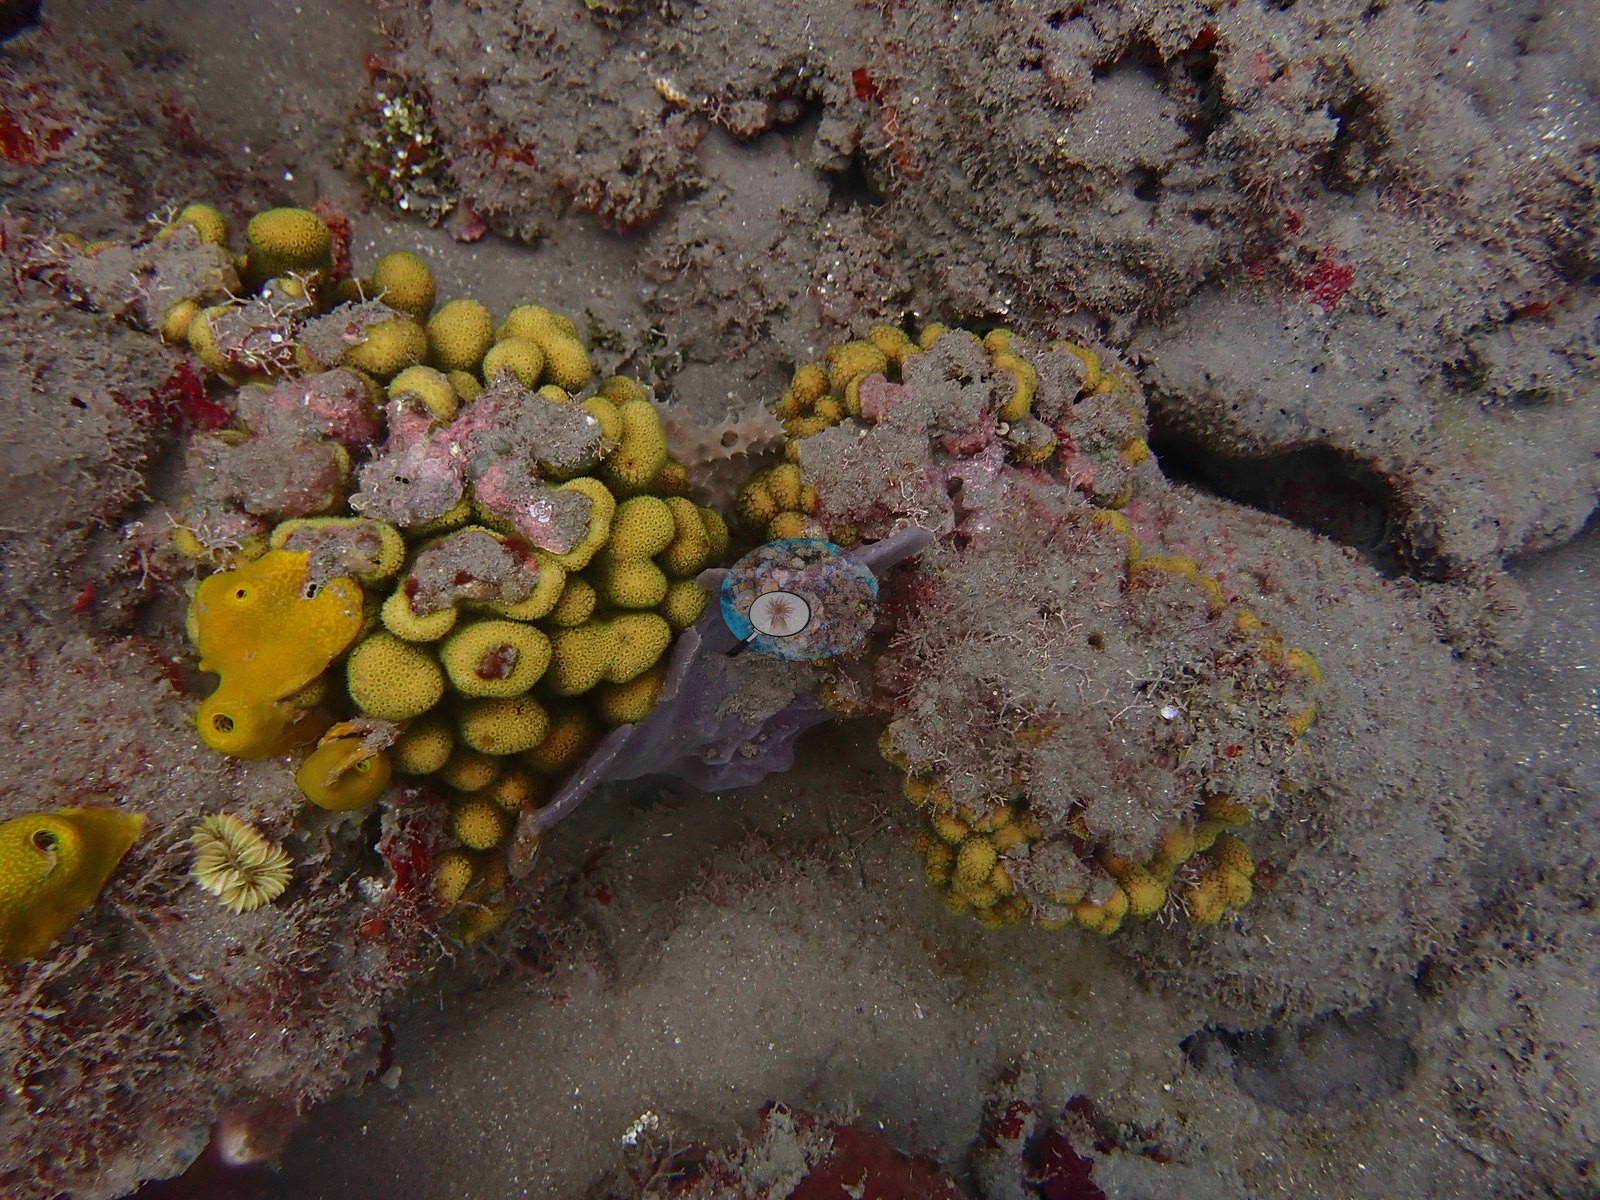
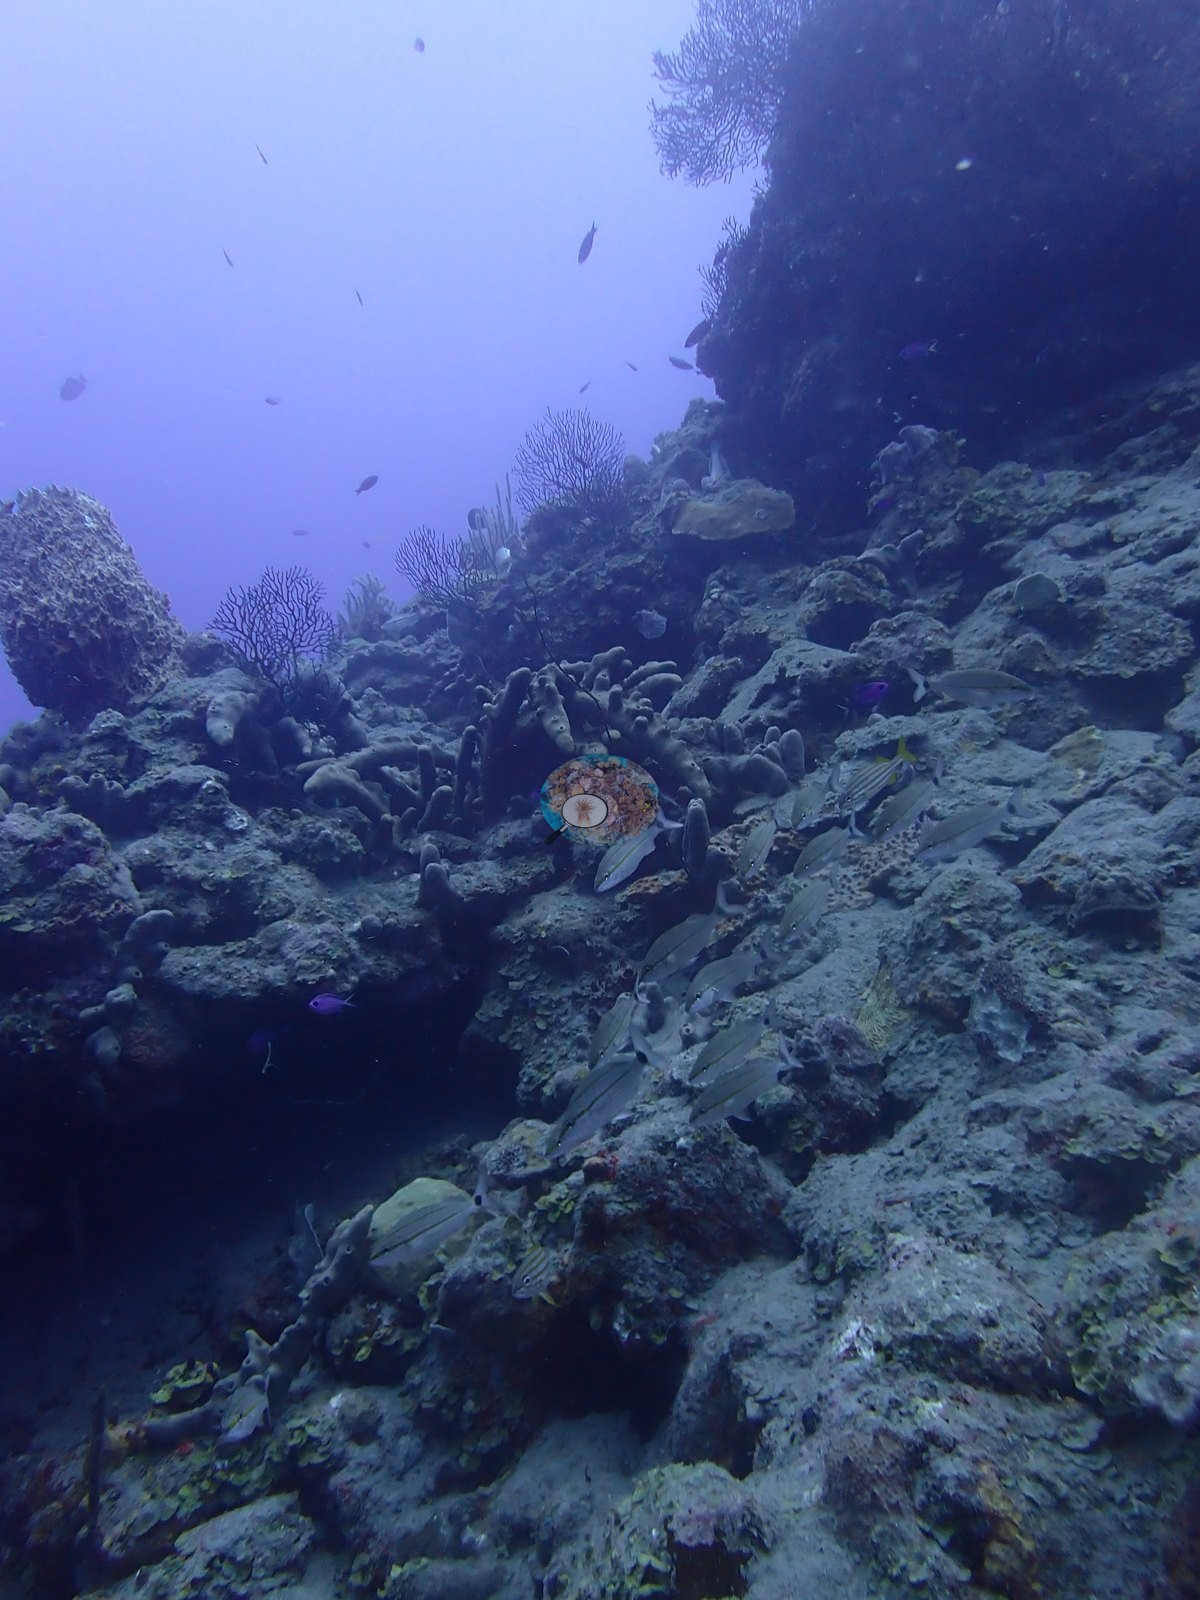
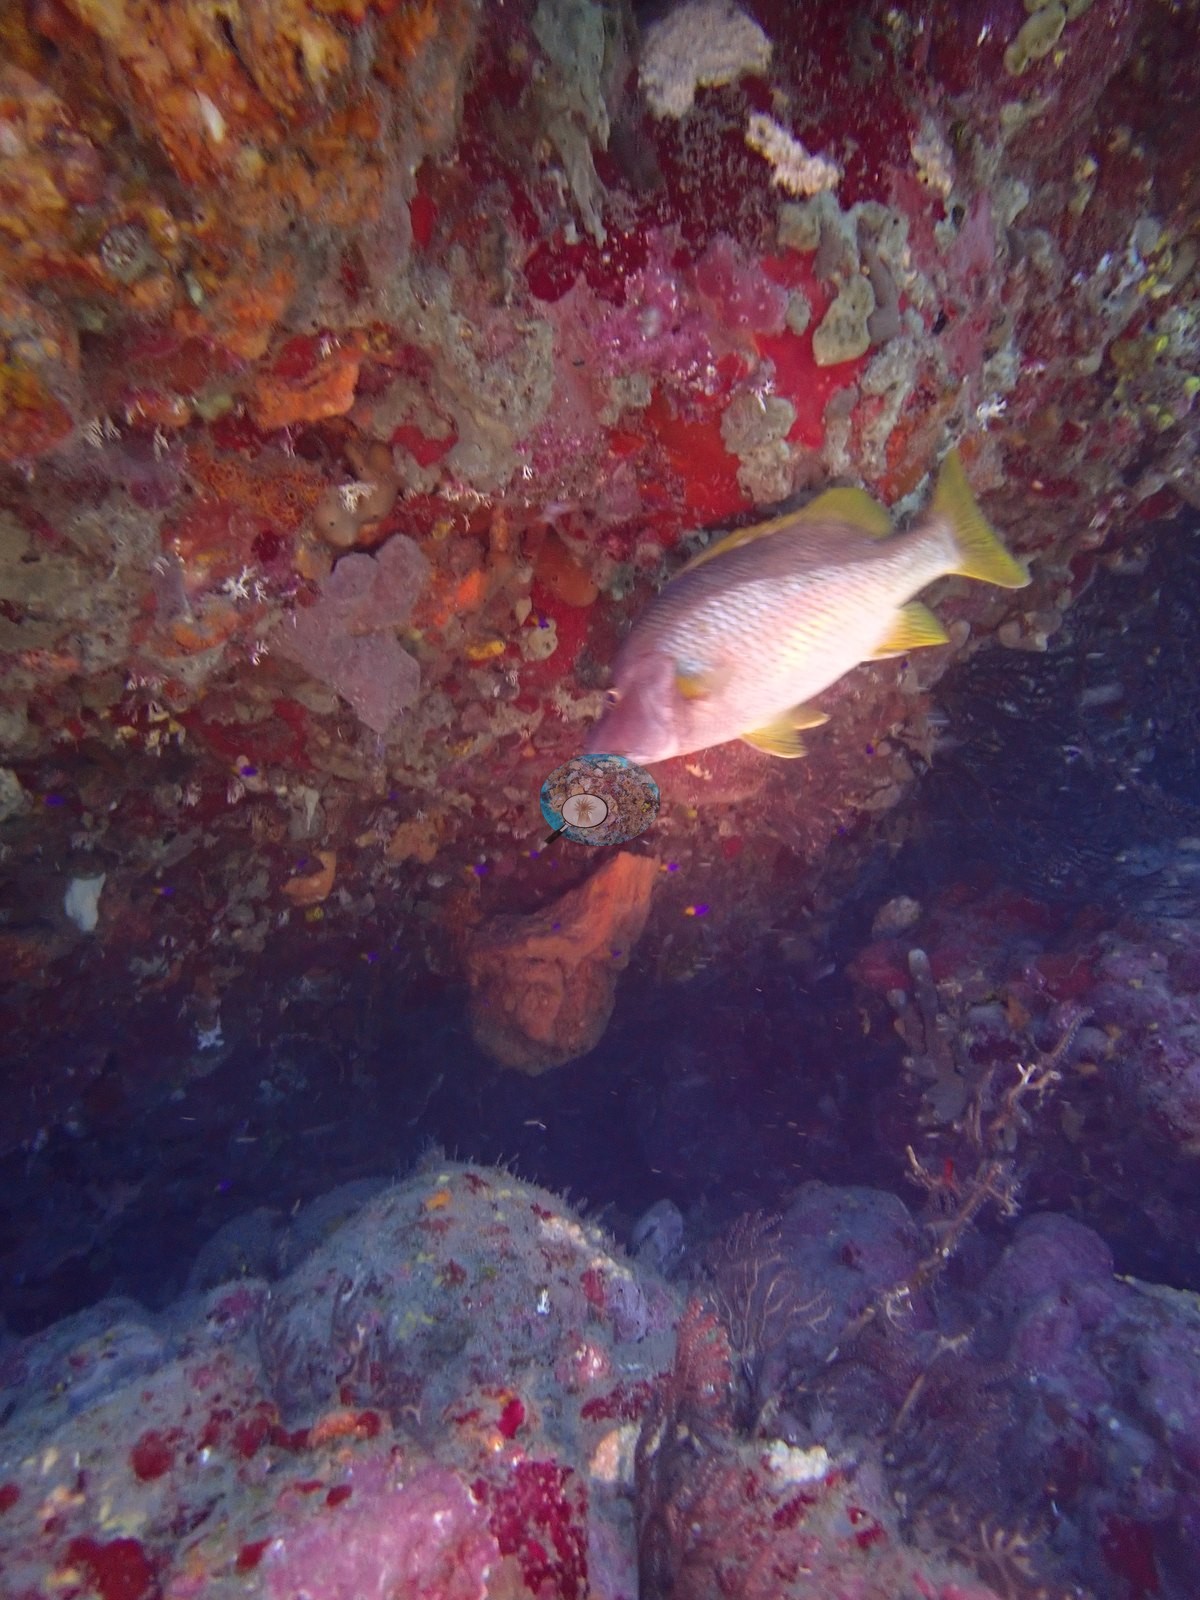
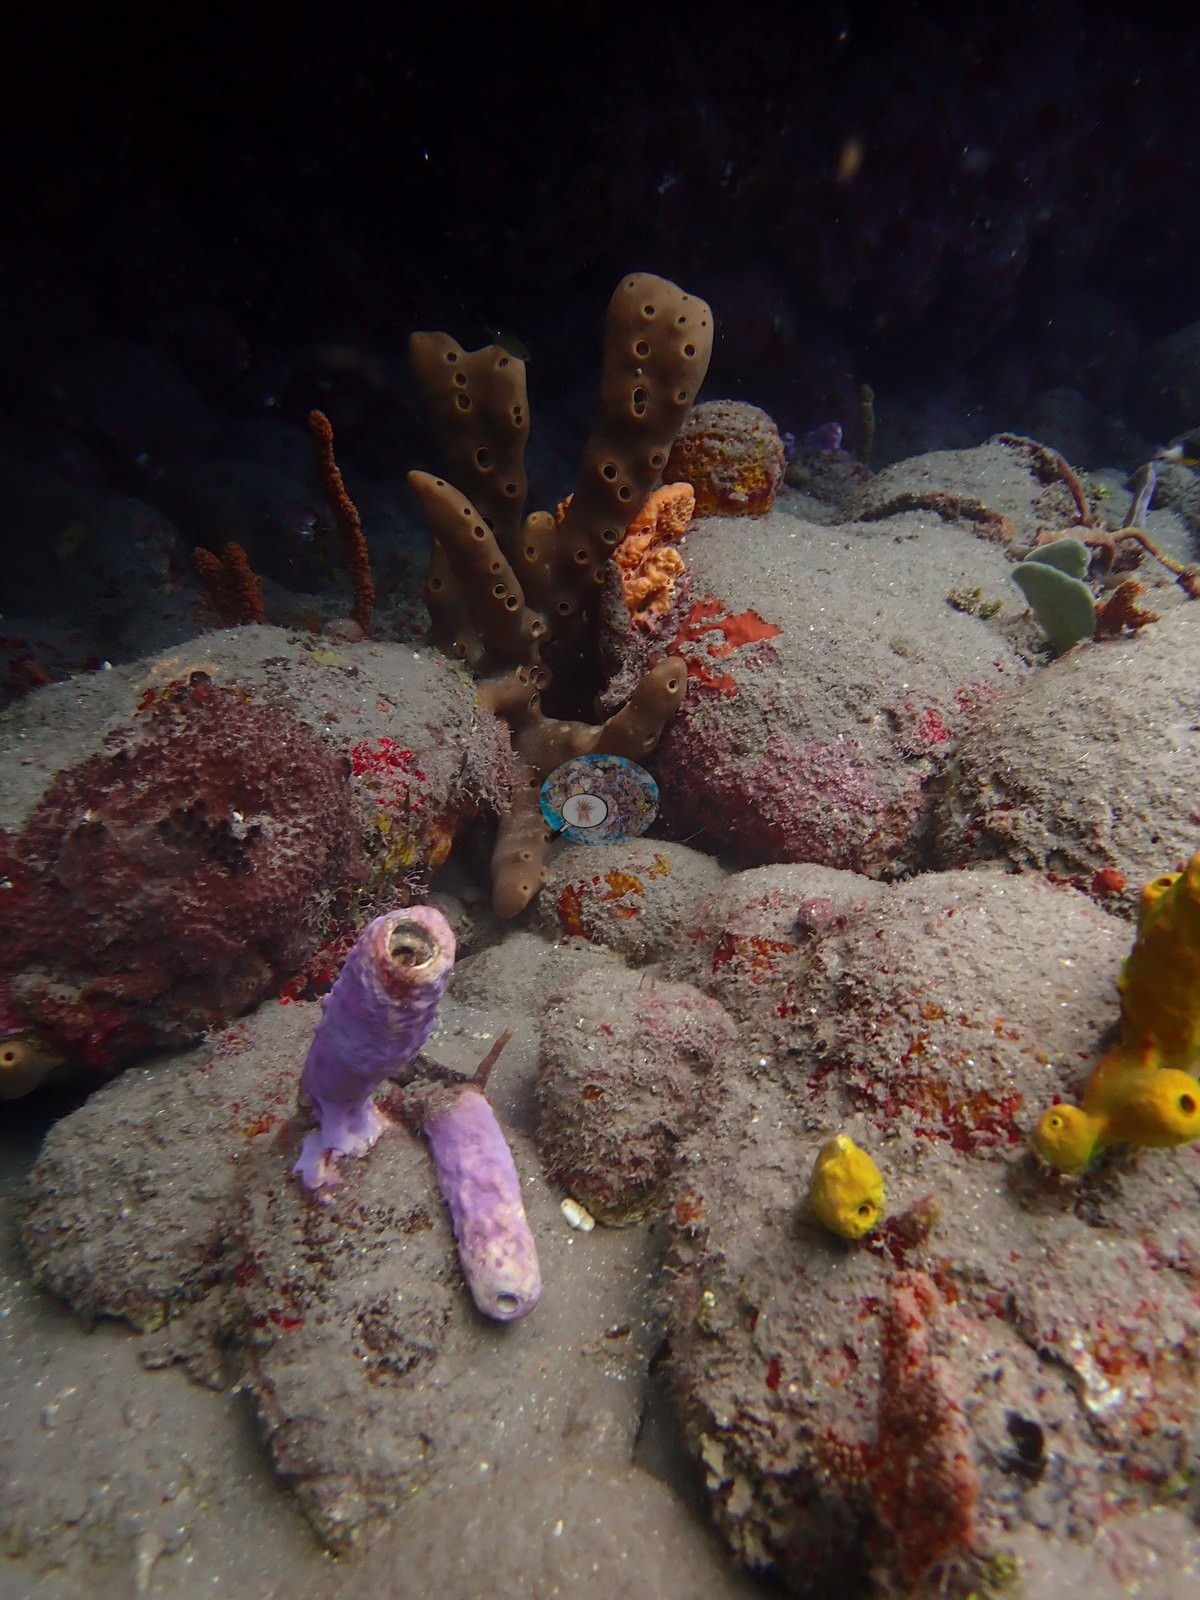
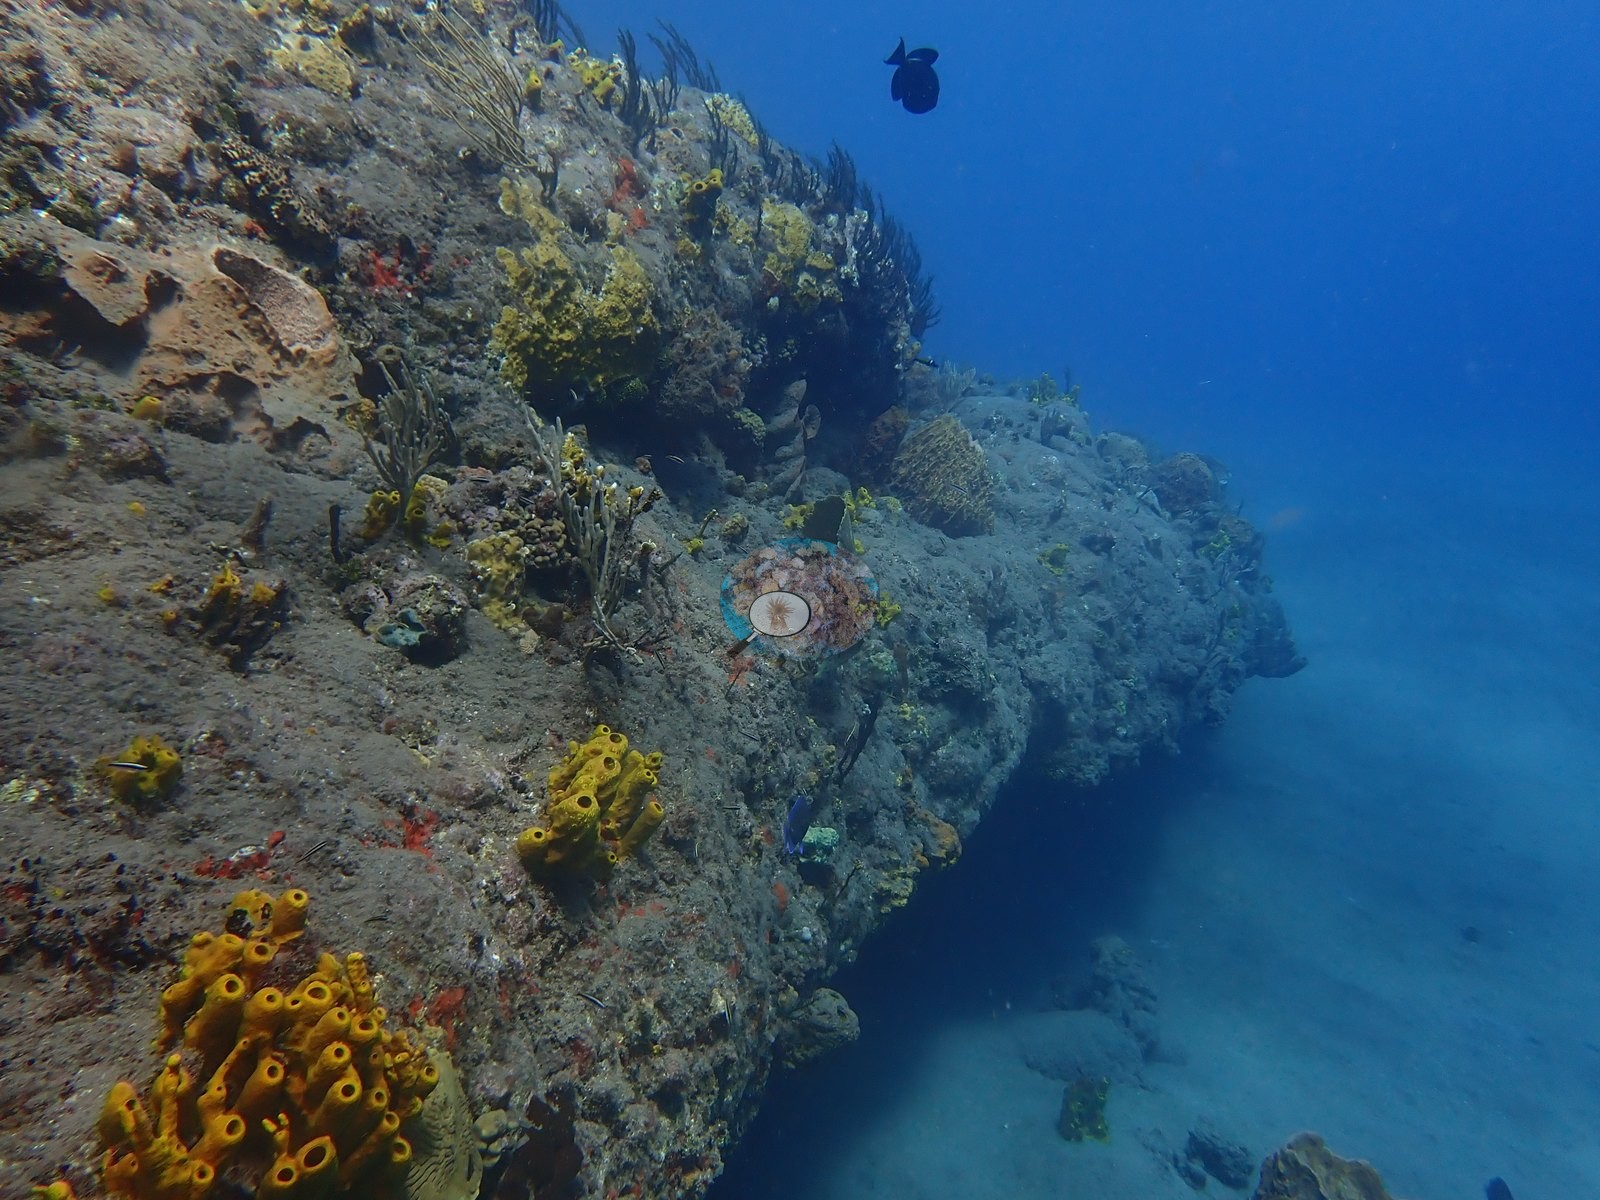
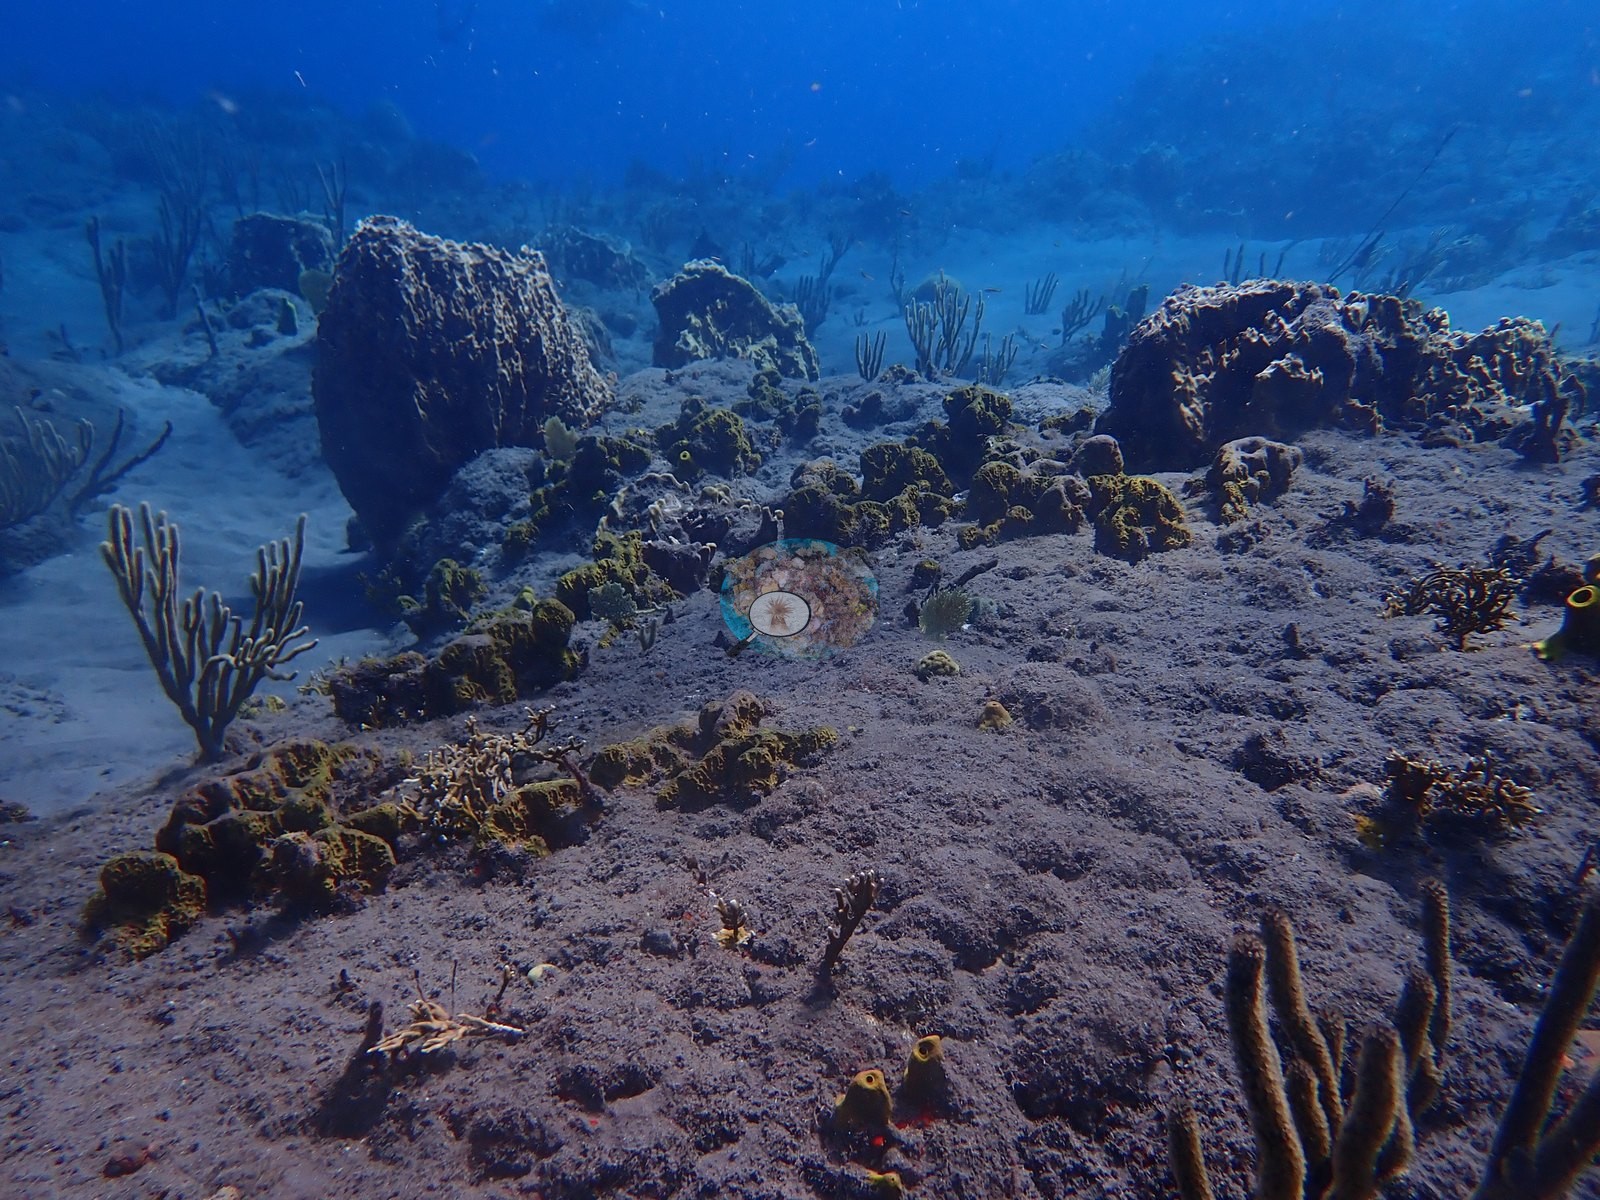
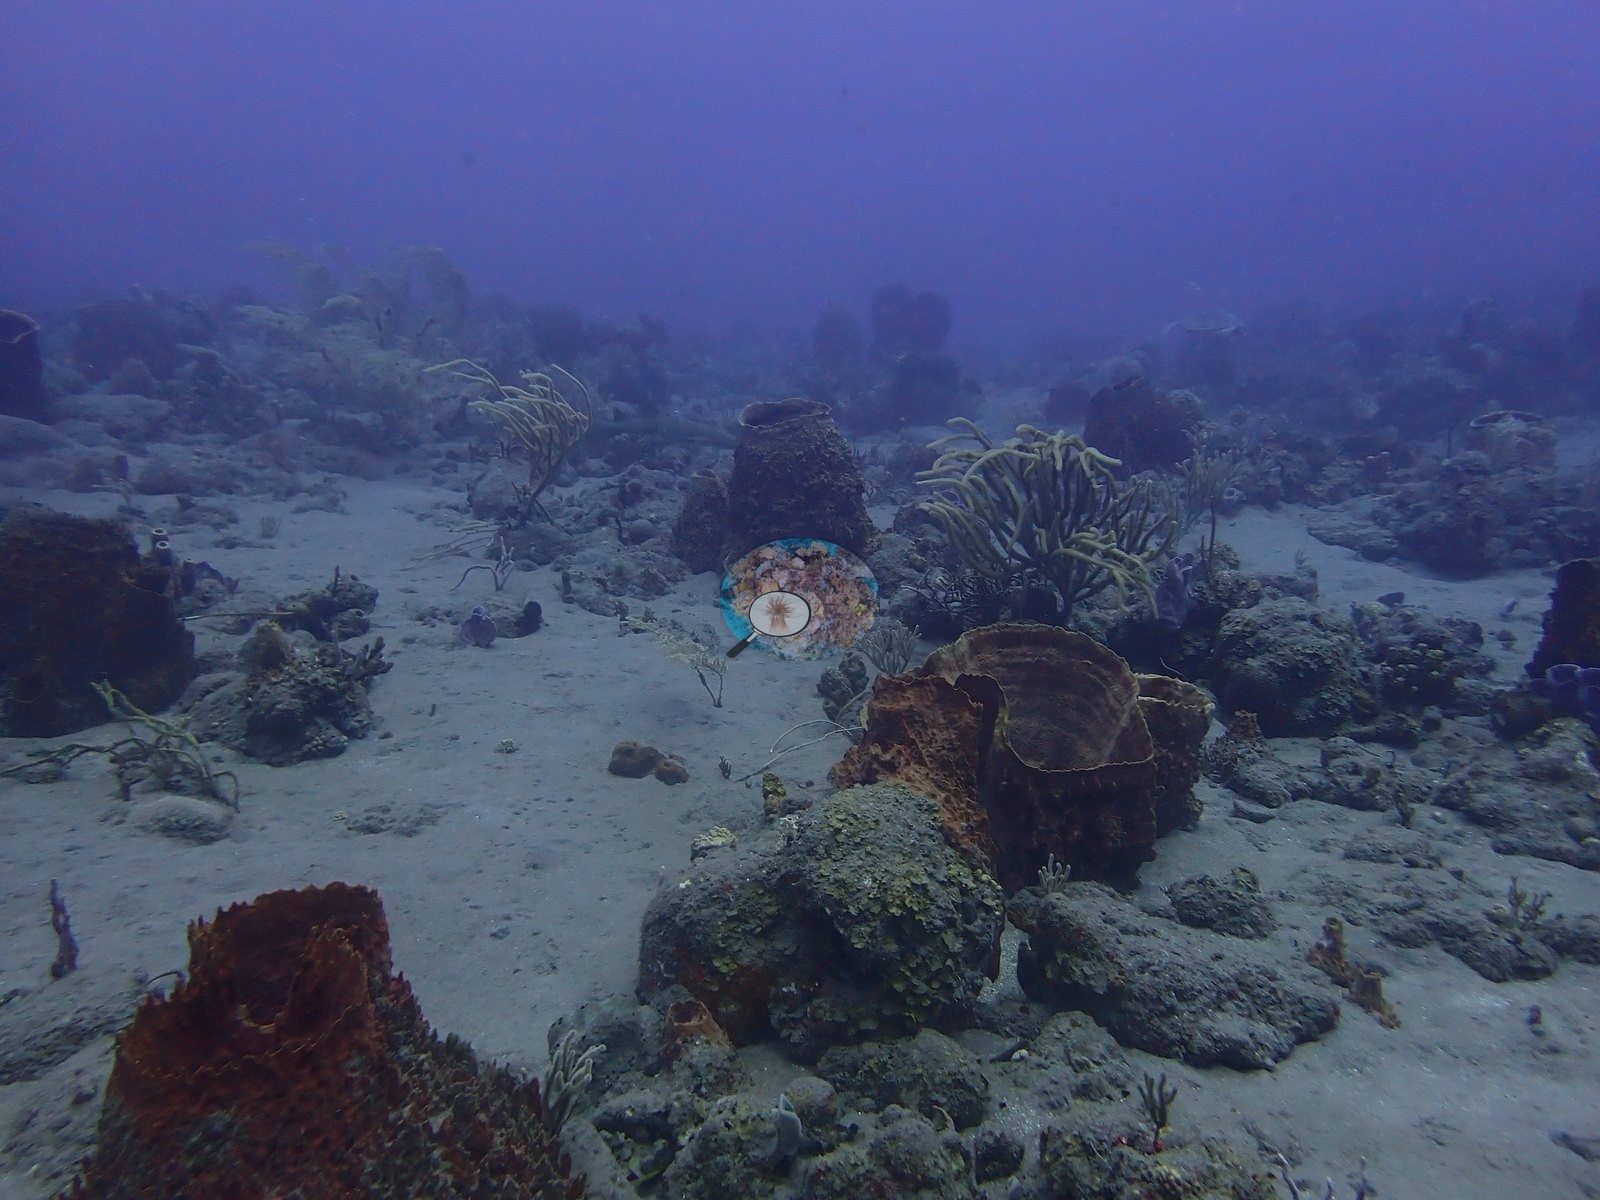
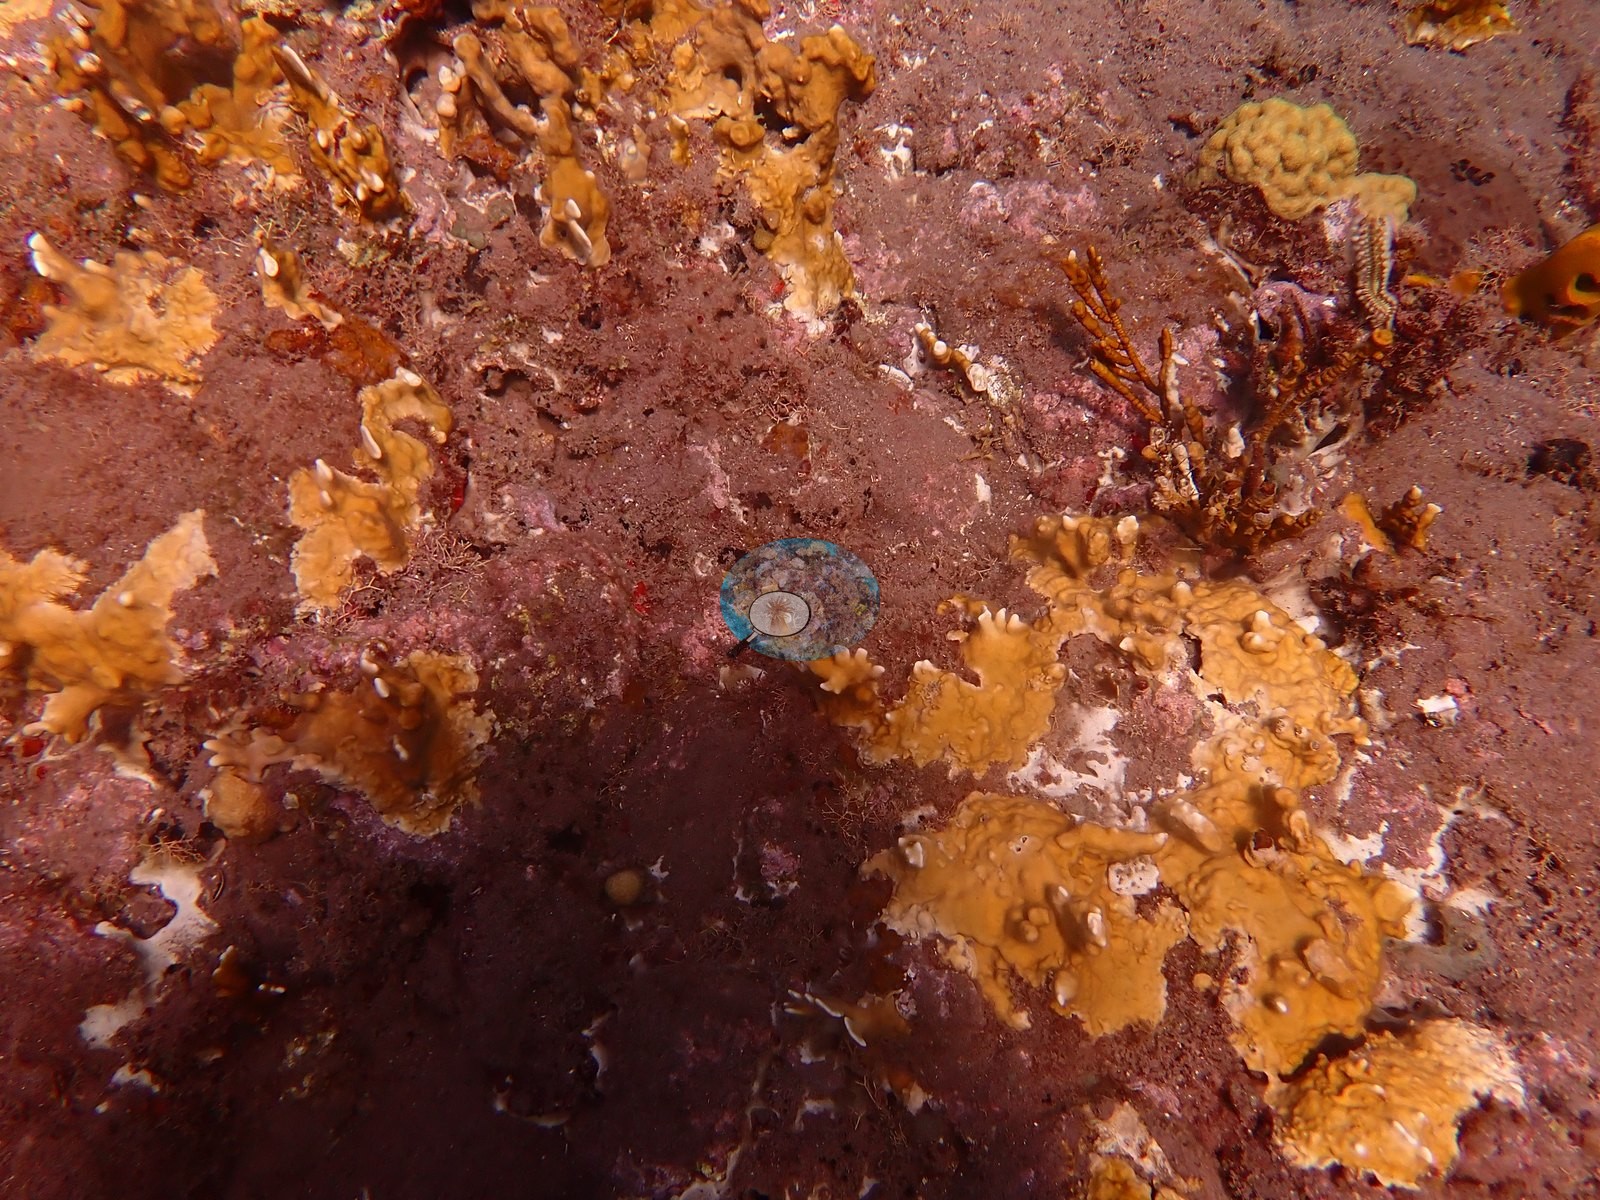
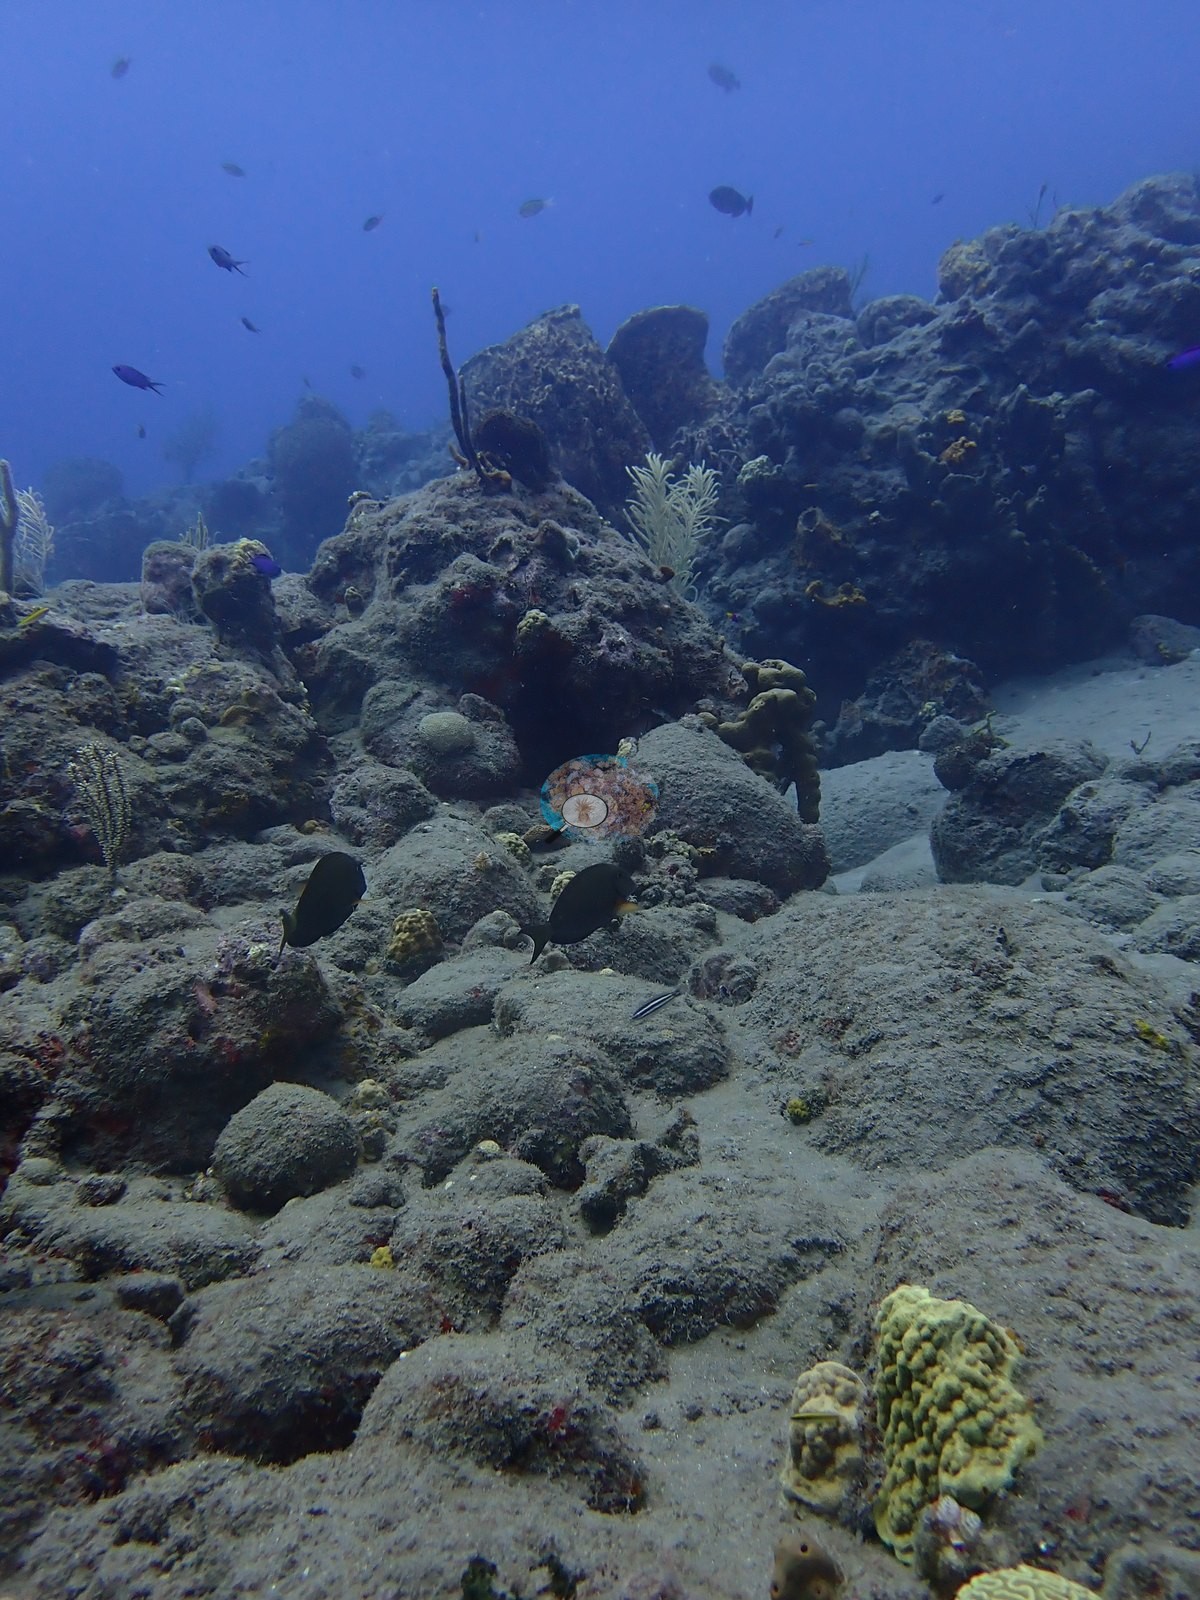
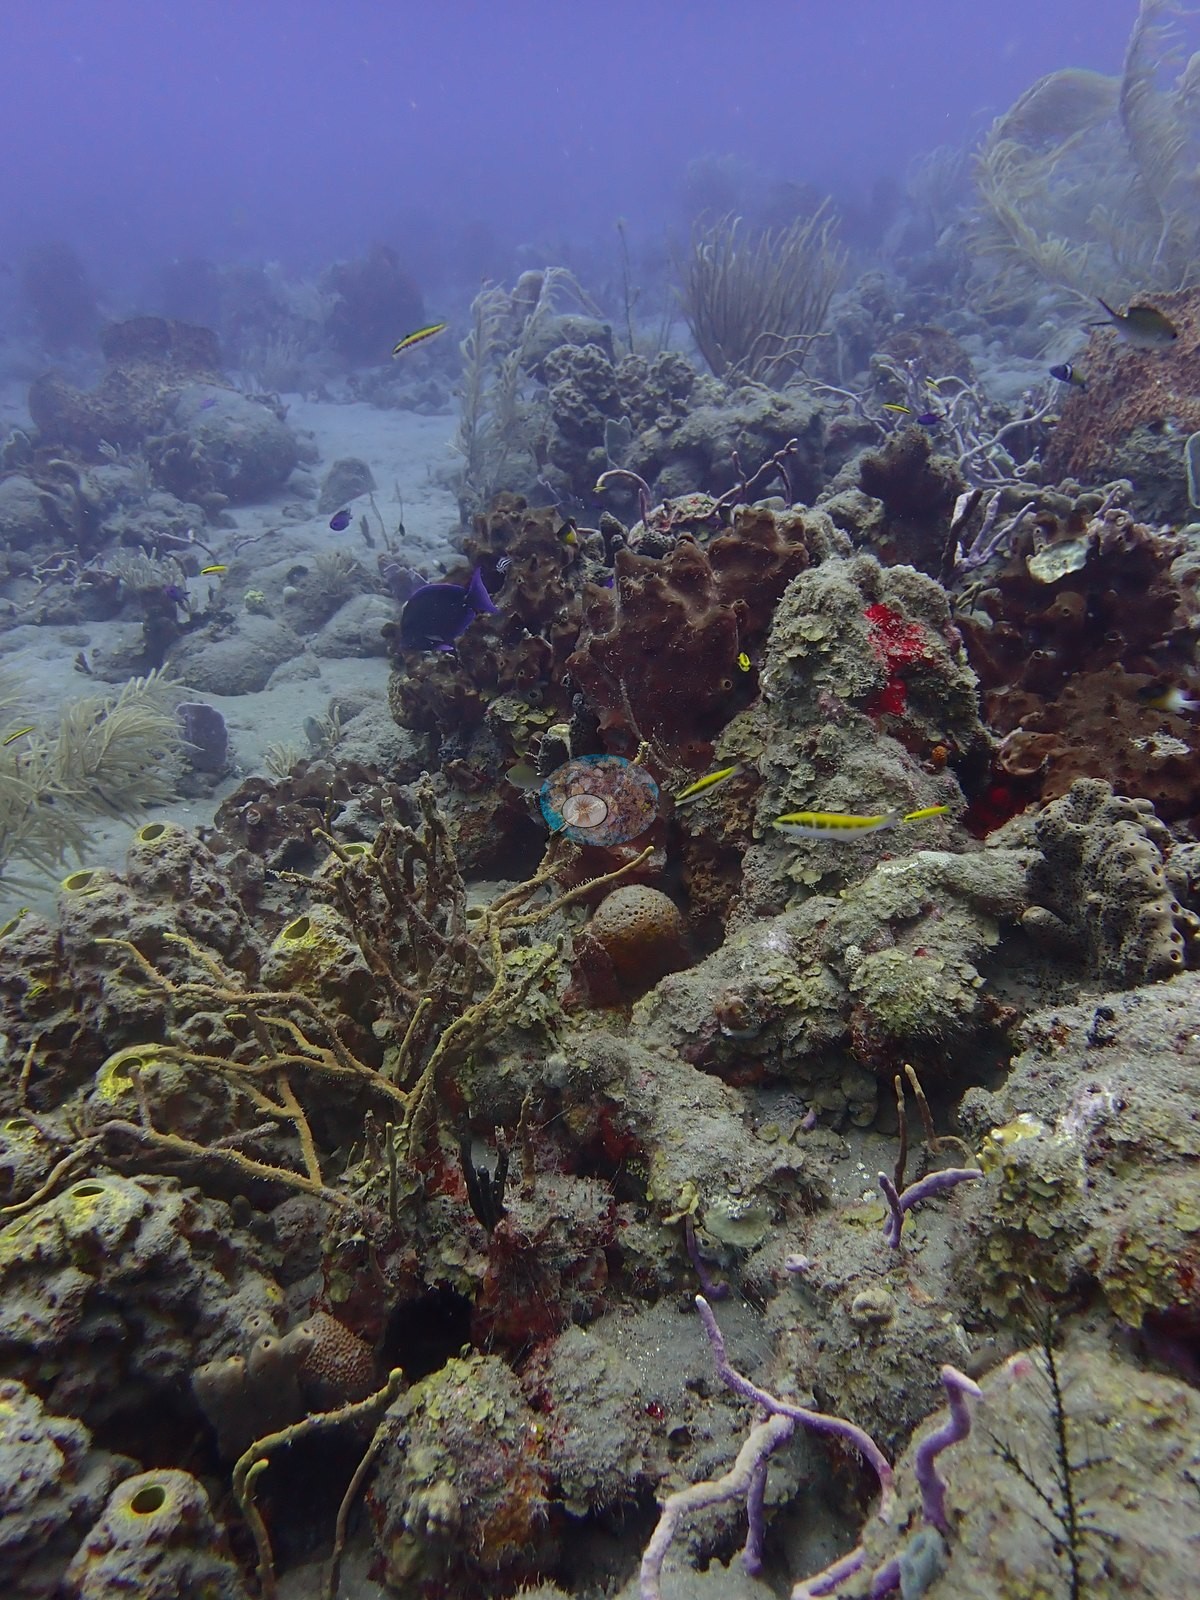
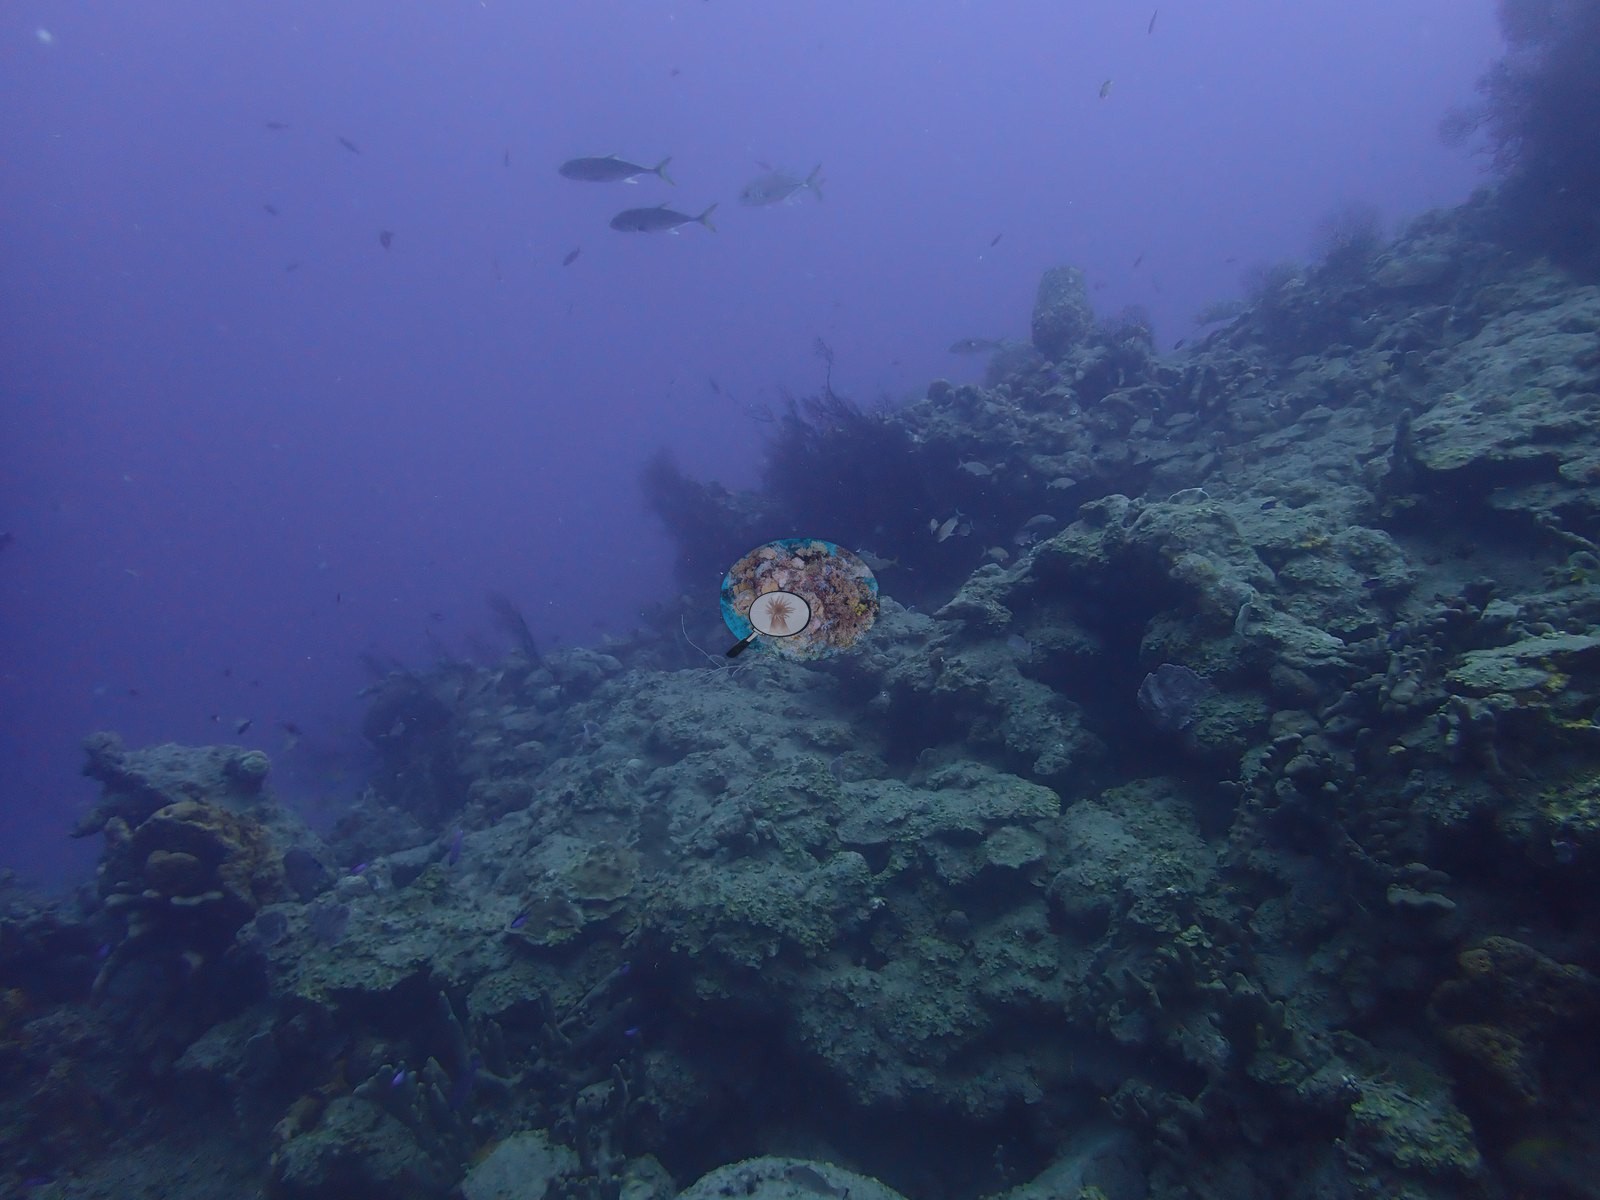
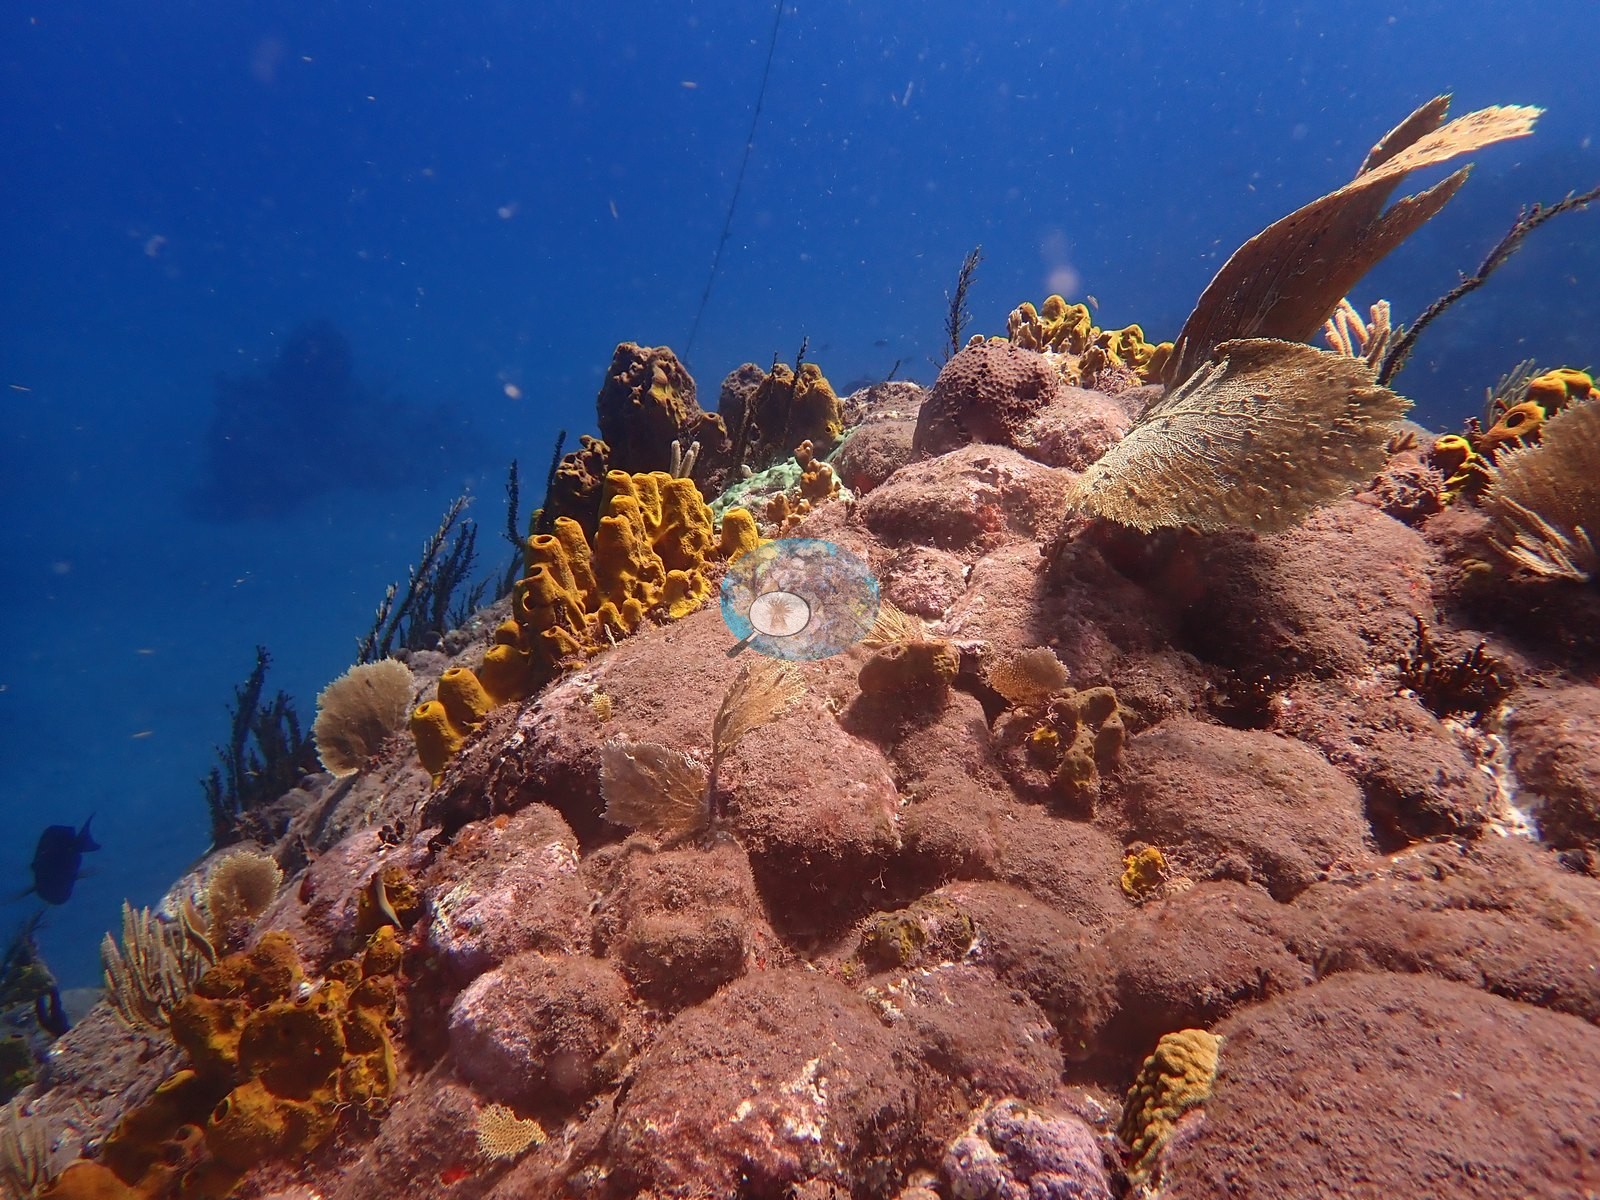
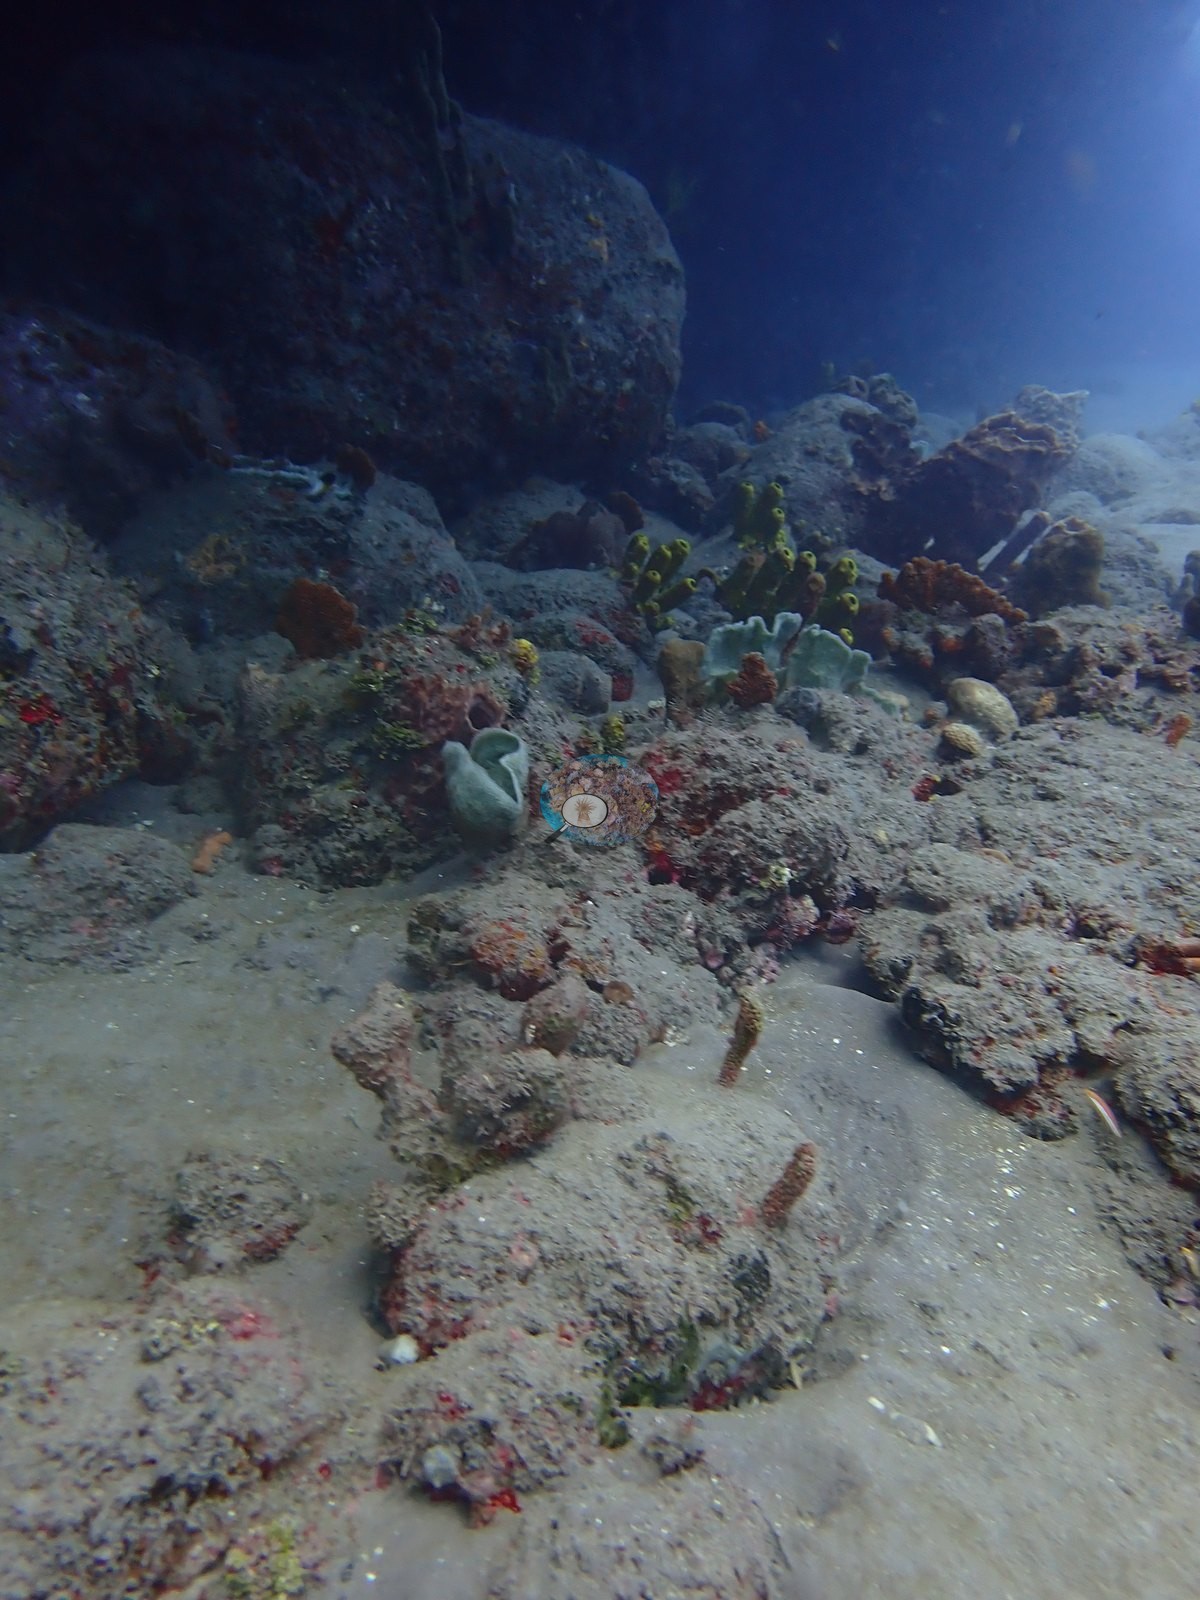
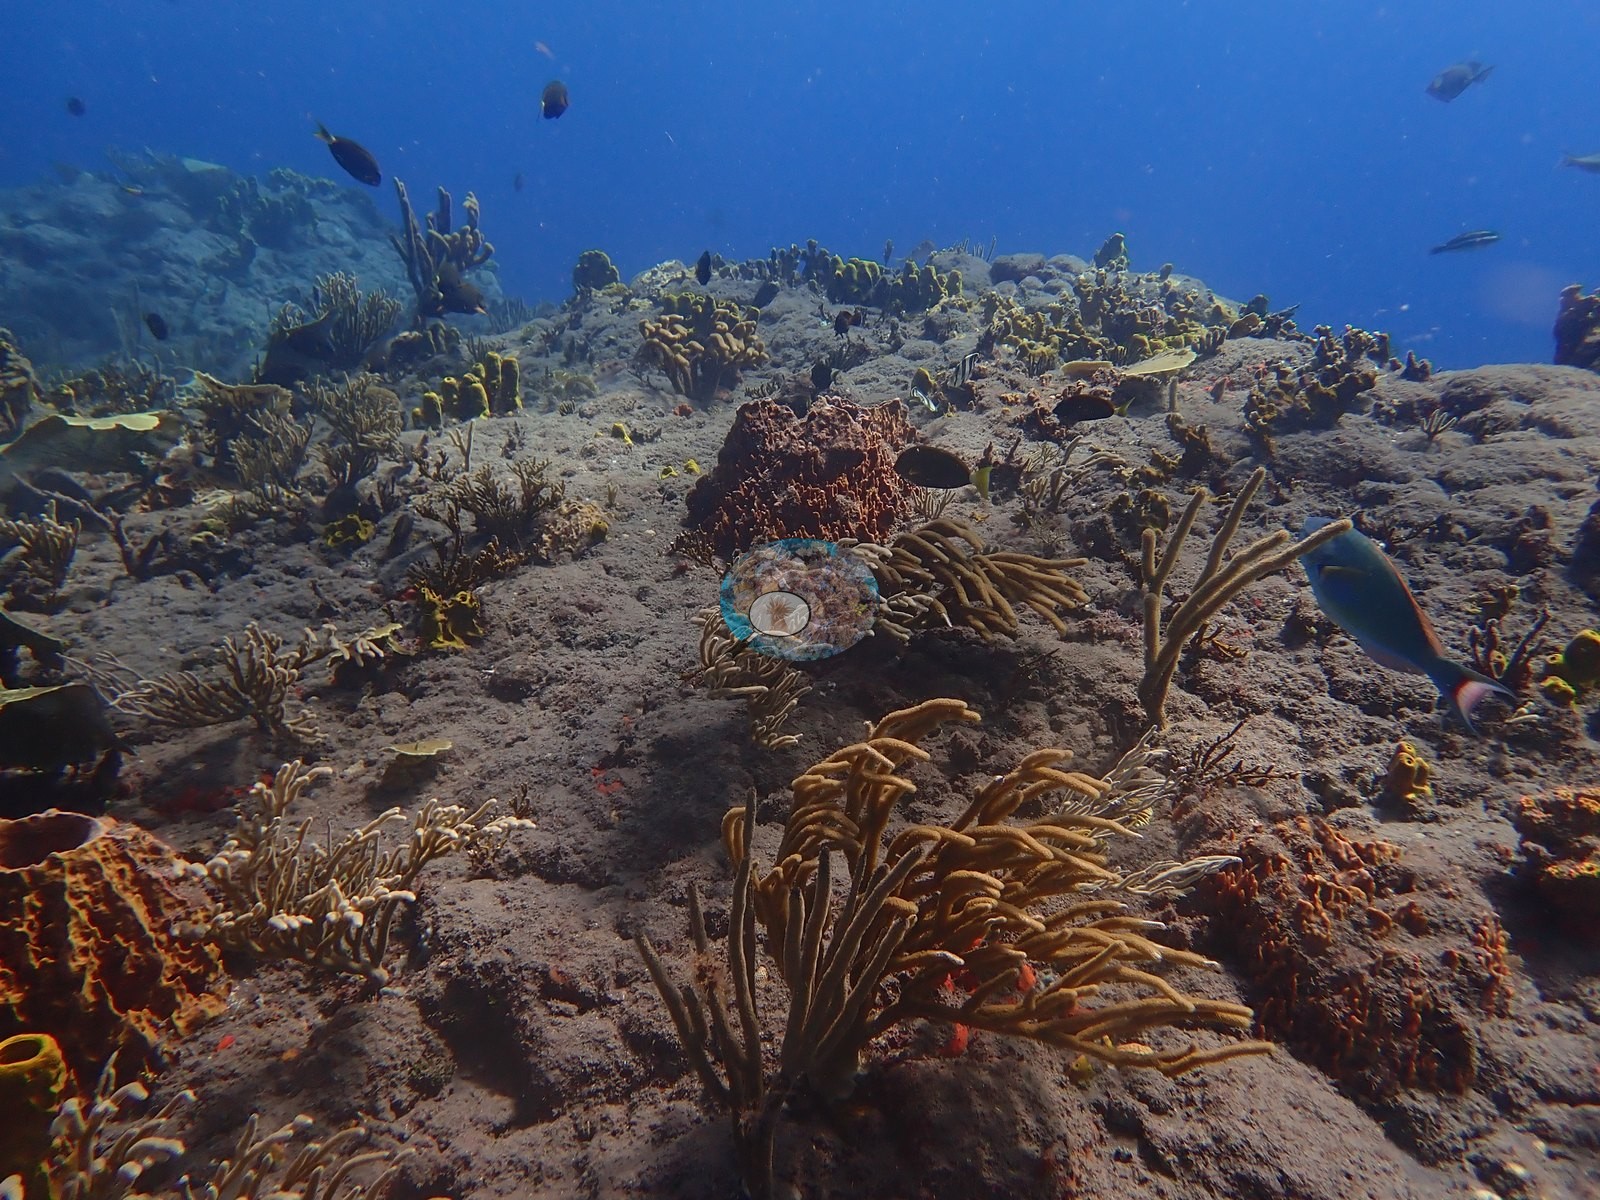
Rocky outcrops rising from the sand are thickly colonized by sponges and turf rather than by hard coral: dense clusters of mustard-yellow tube sponges, orange and salmon encrusting/barrel sponges (one large pair flanking a school of reef fish and a striped fish sheltering in a barrel-sponge mouth), pale blue-gray vase sponges, and a black bushy growth consistent with black coral (e.g., Image 5, Image 8, Image 9, Image 18, Image 27).
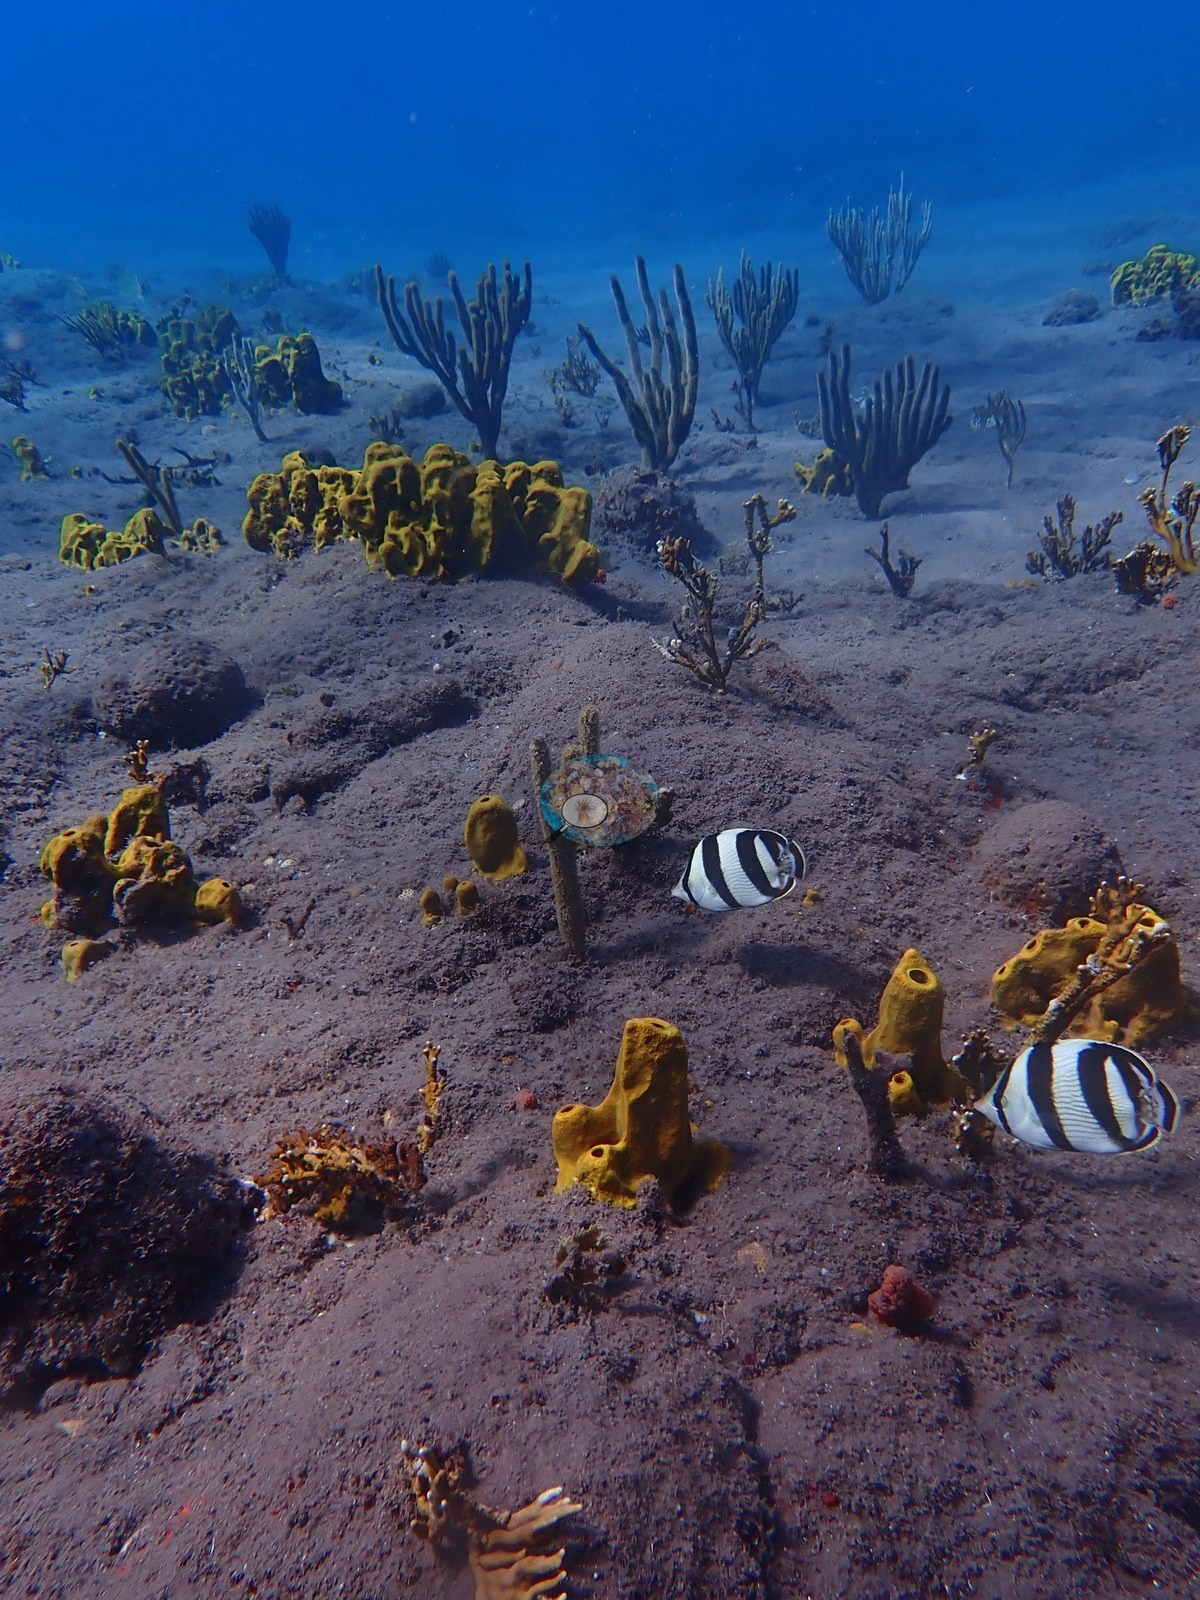
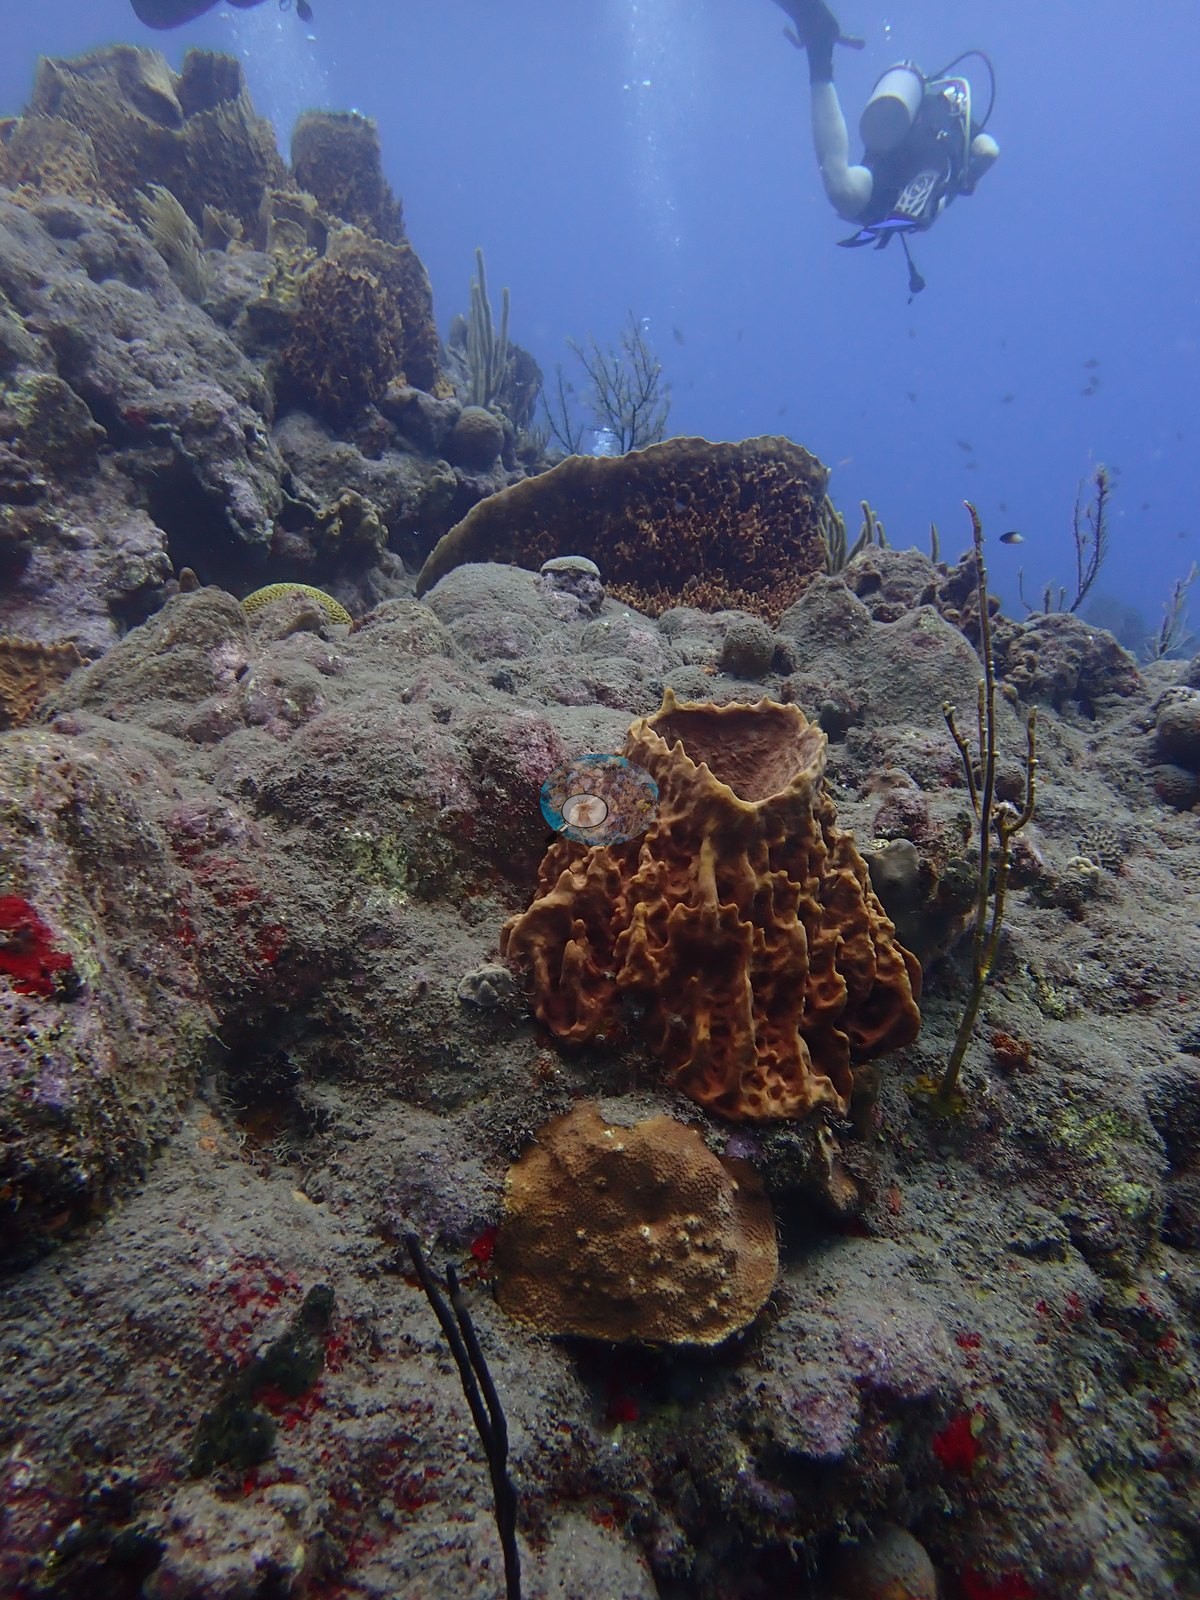
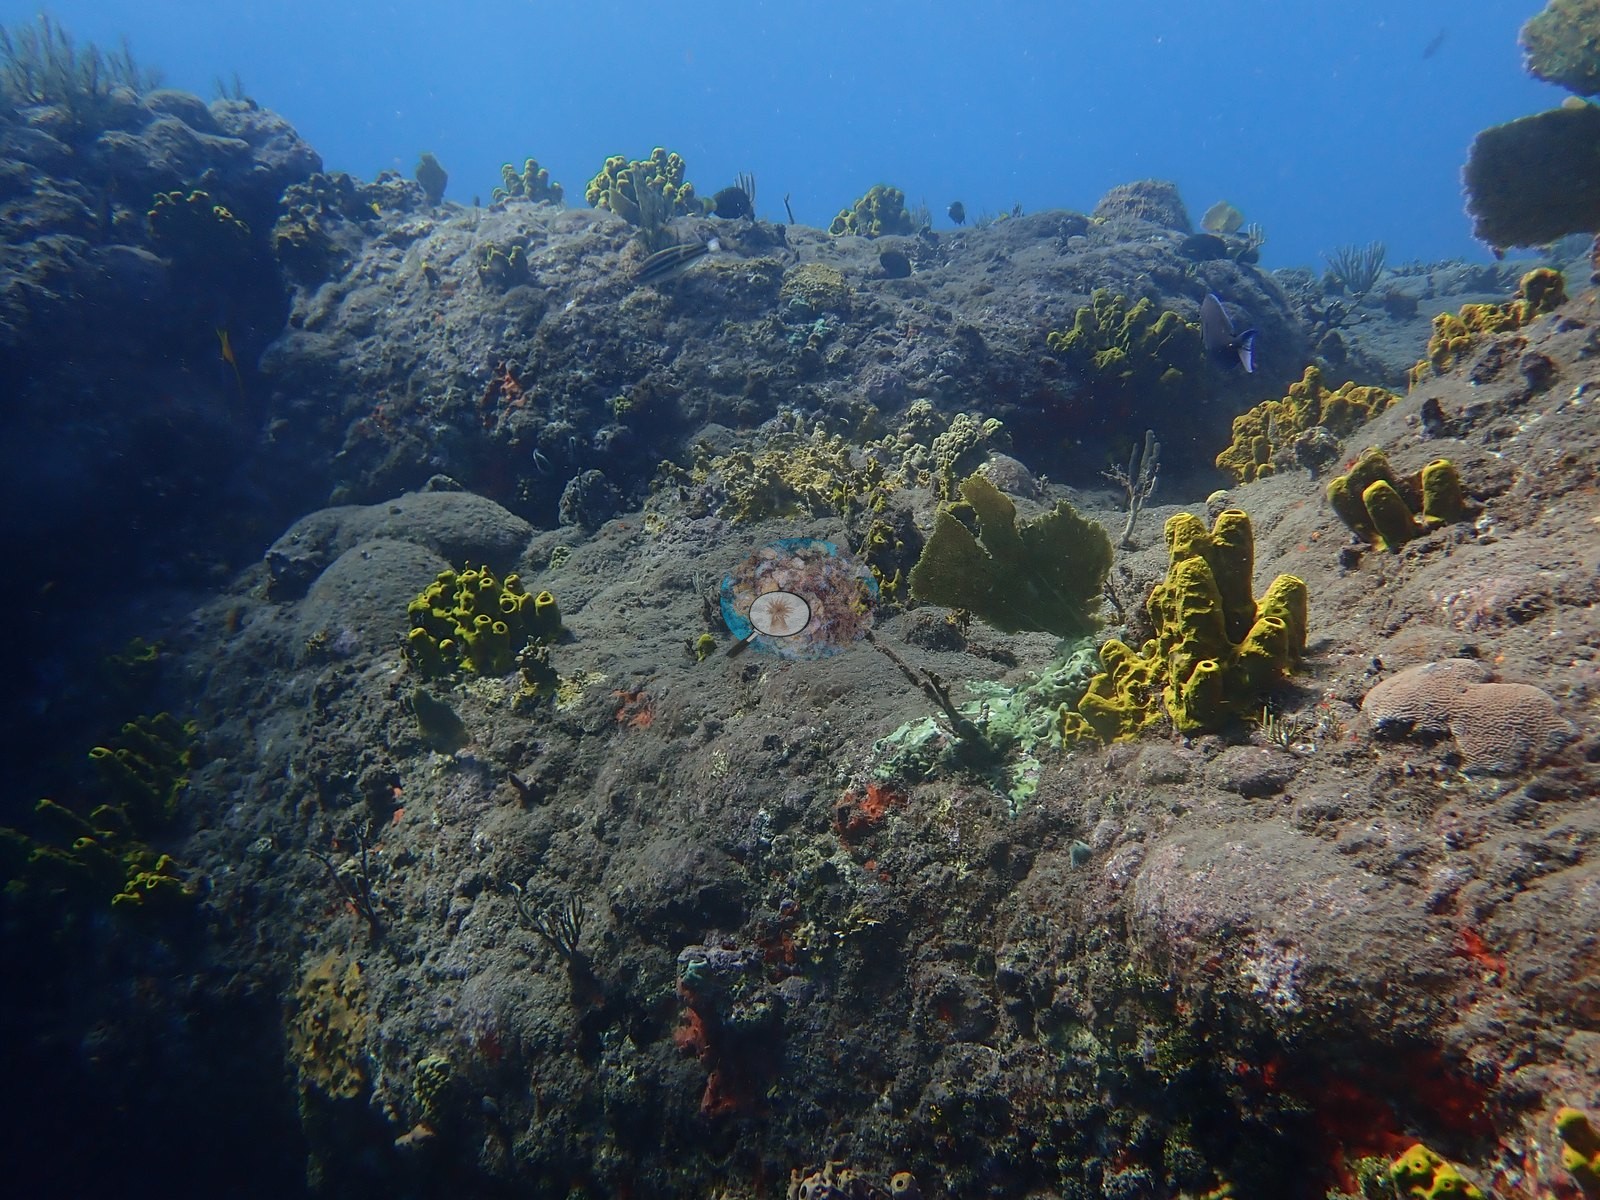
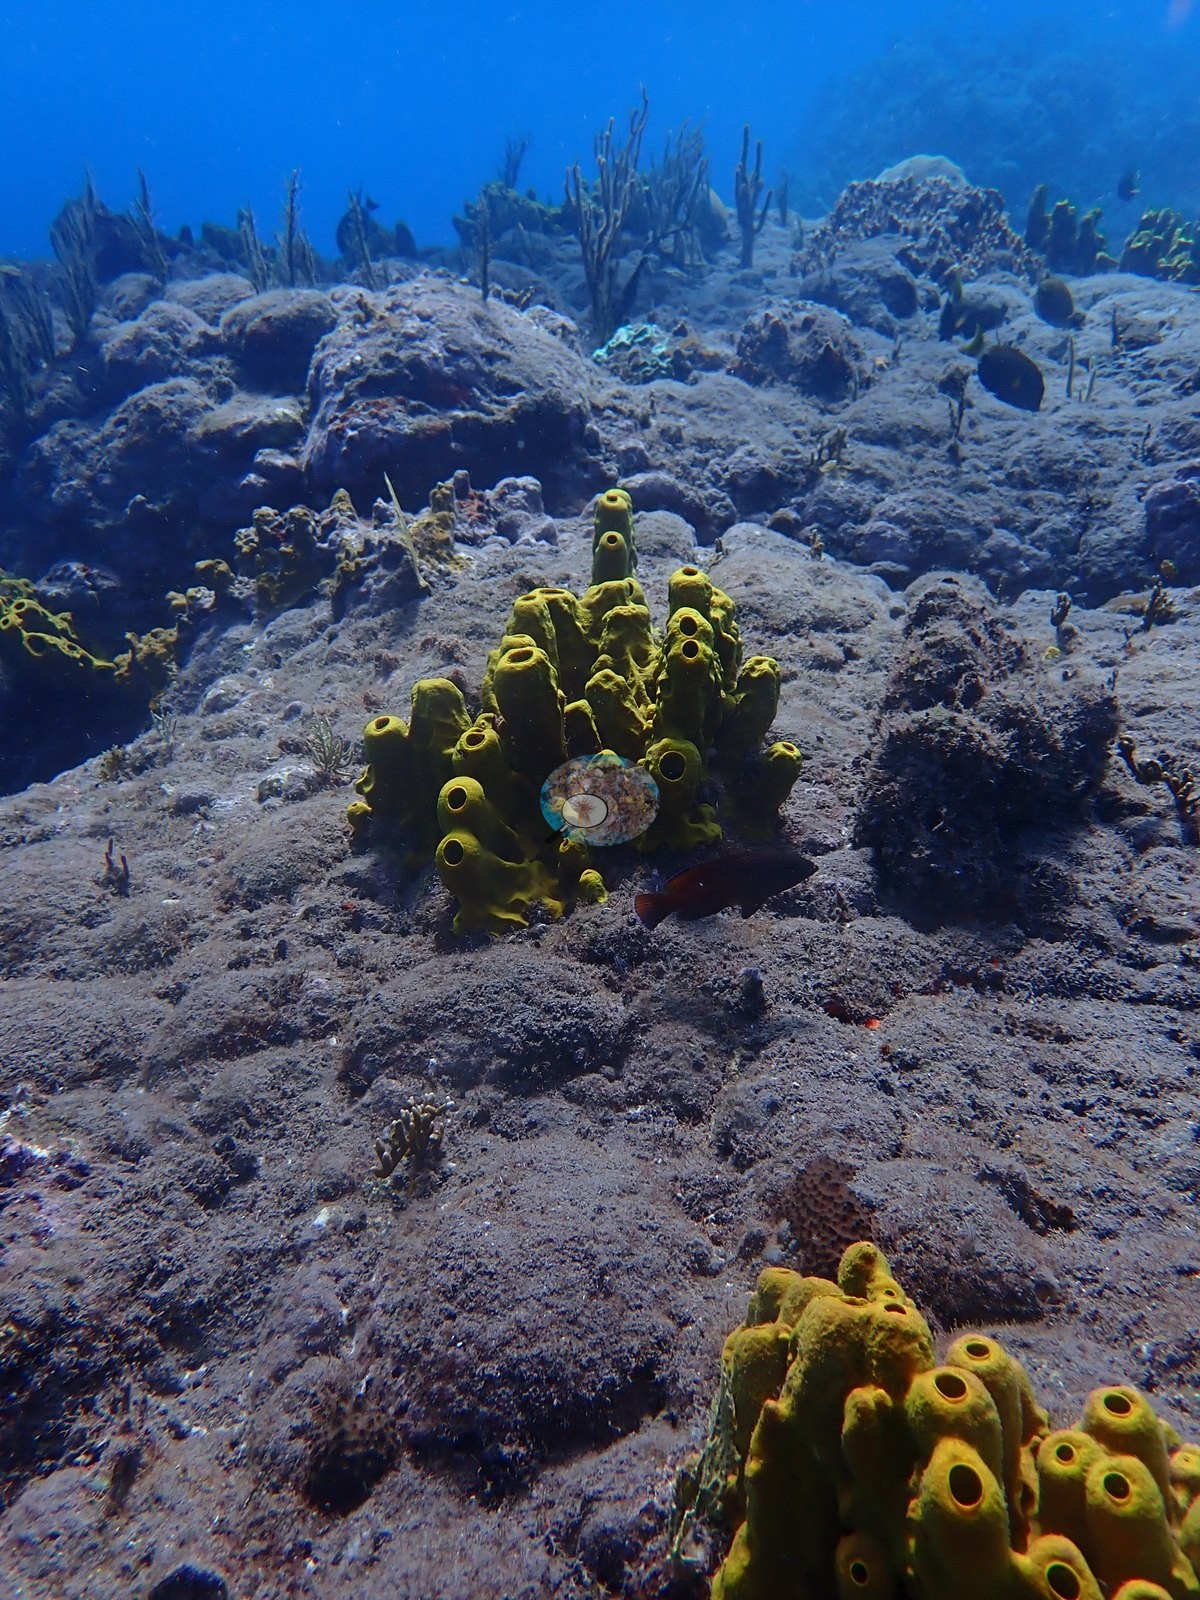
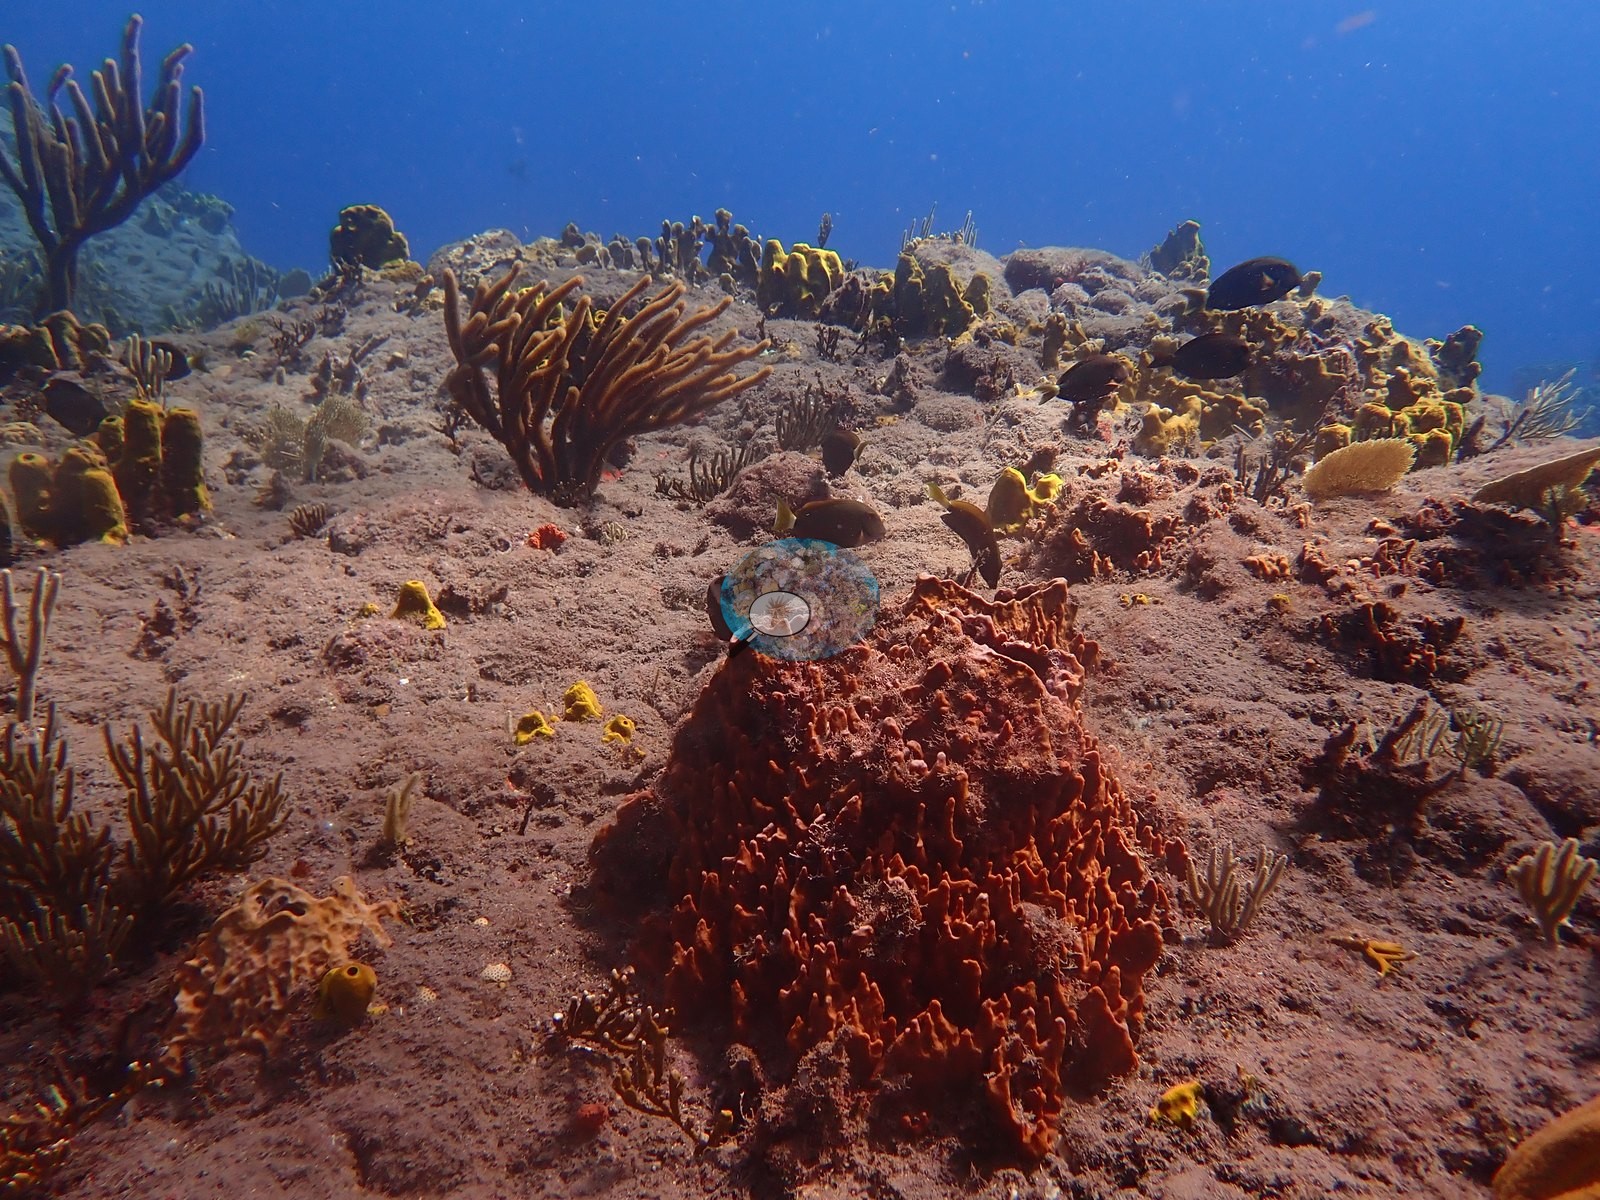
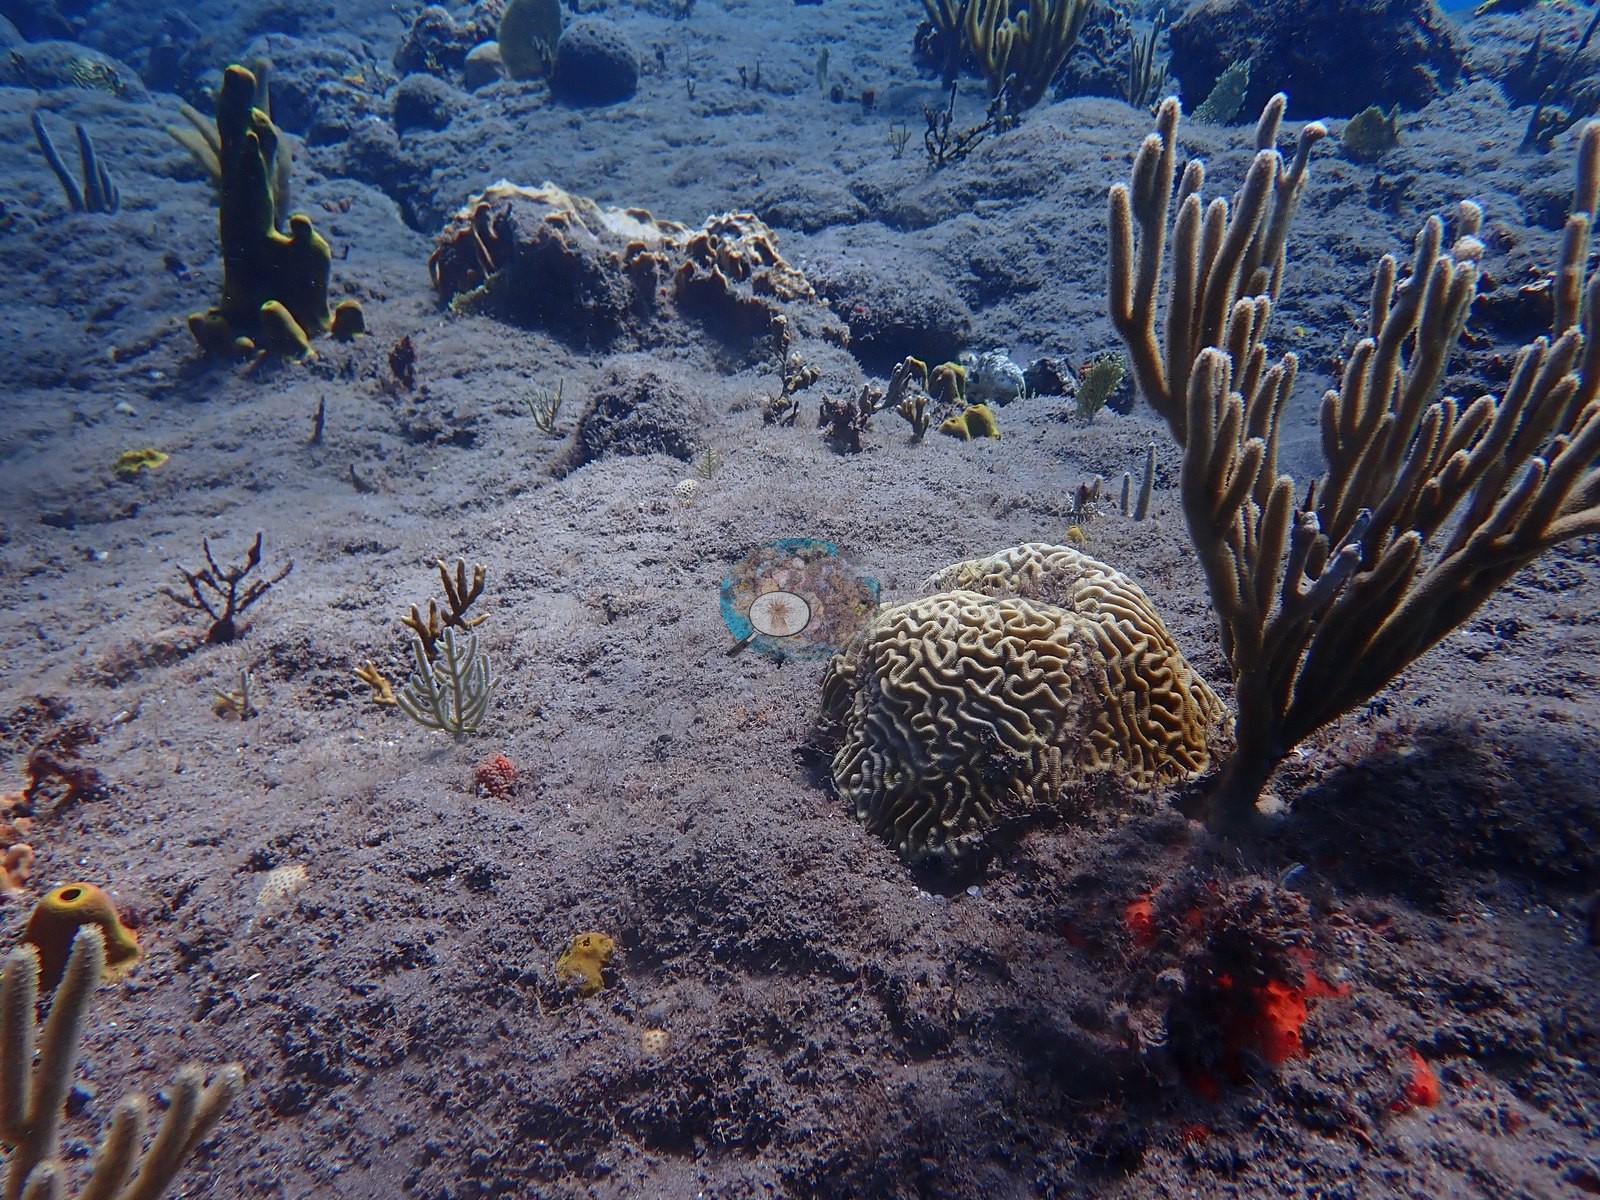
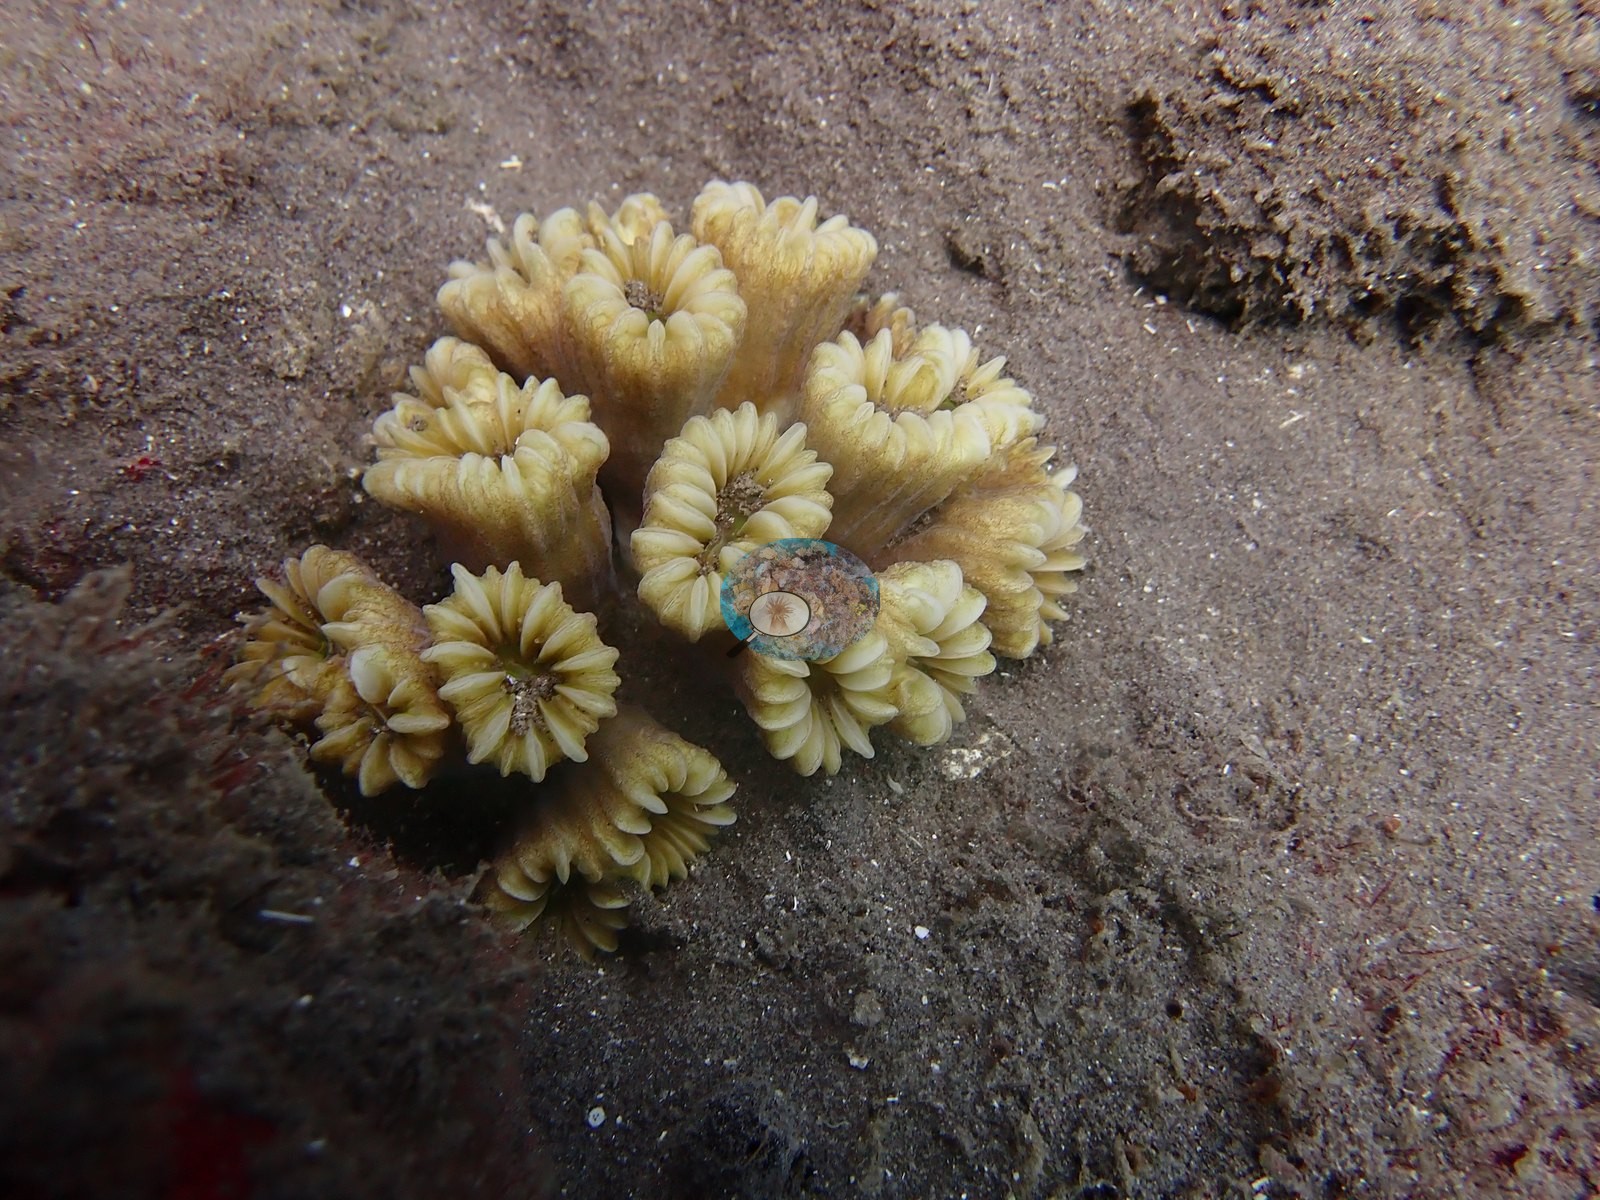
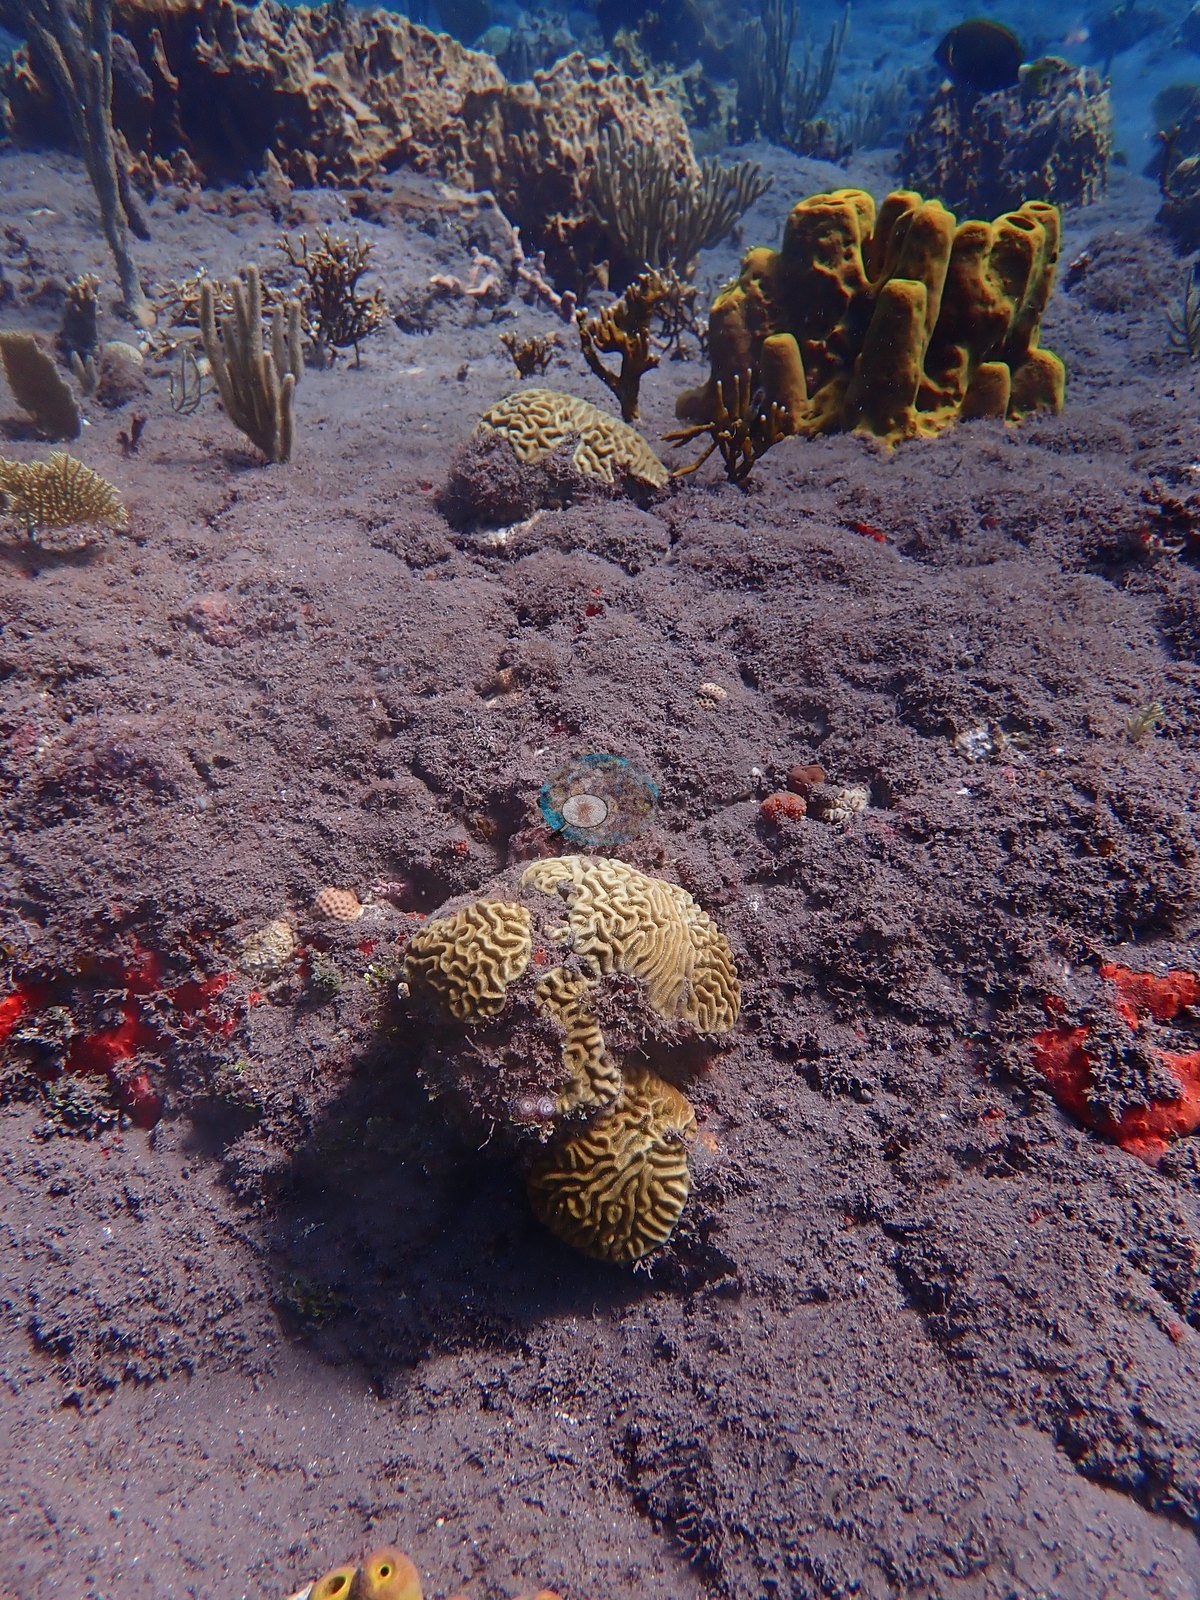
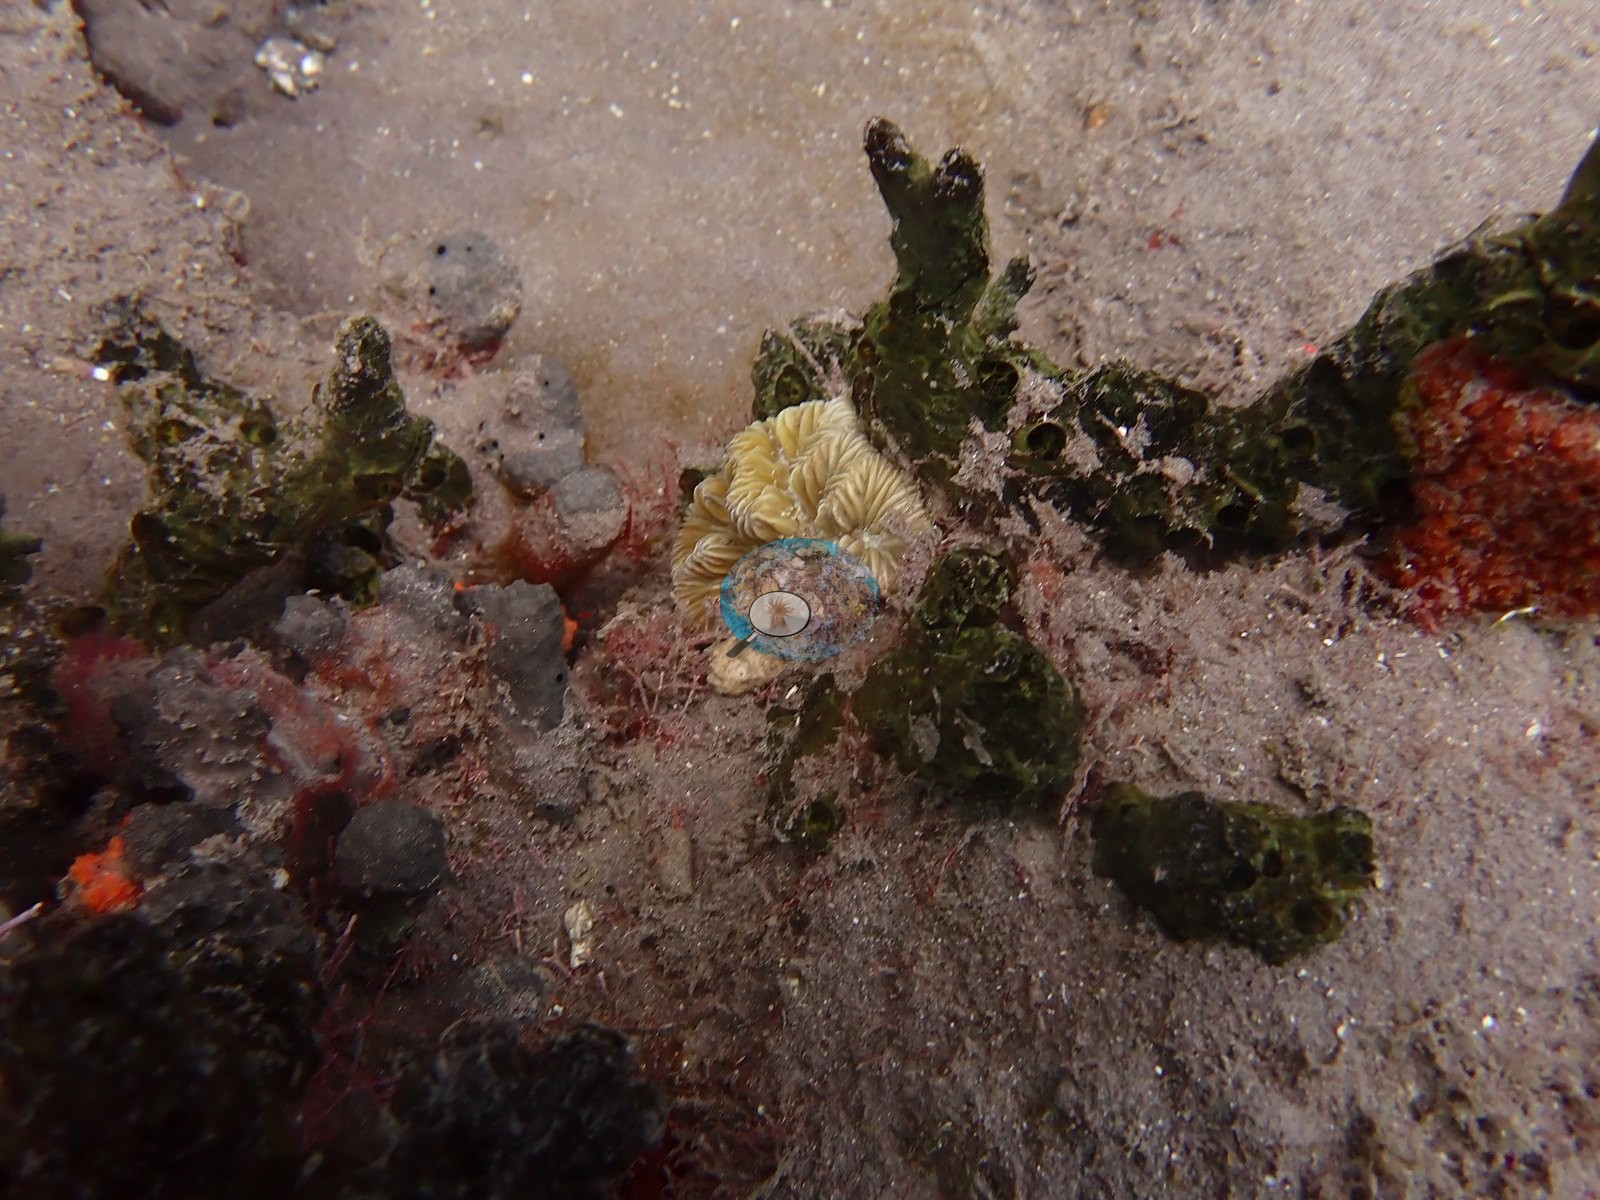
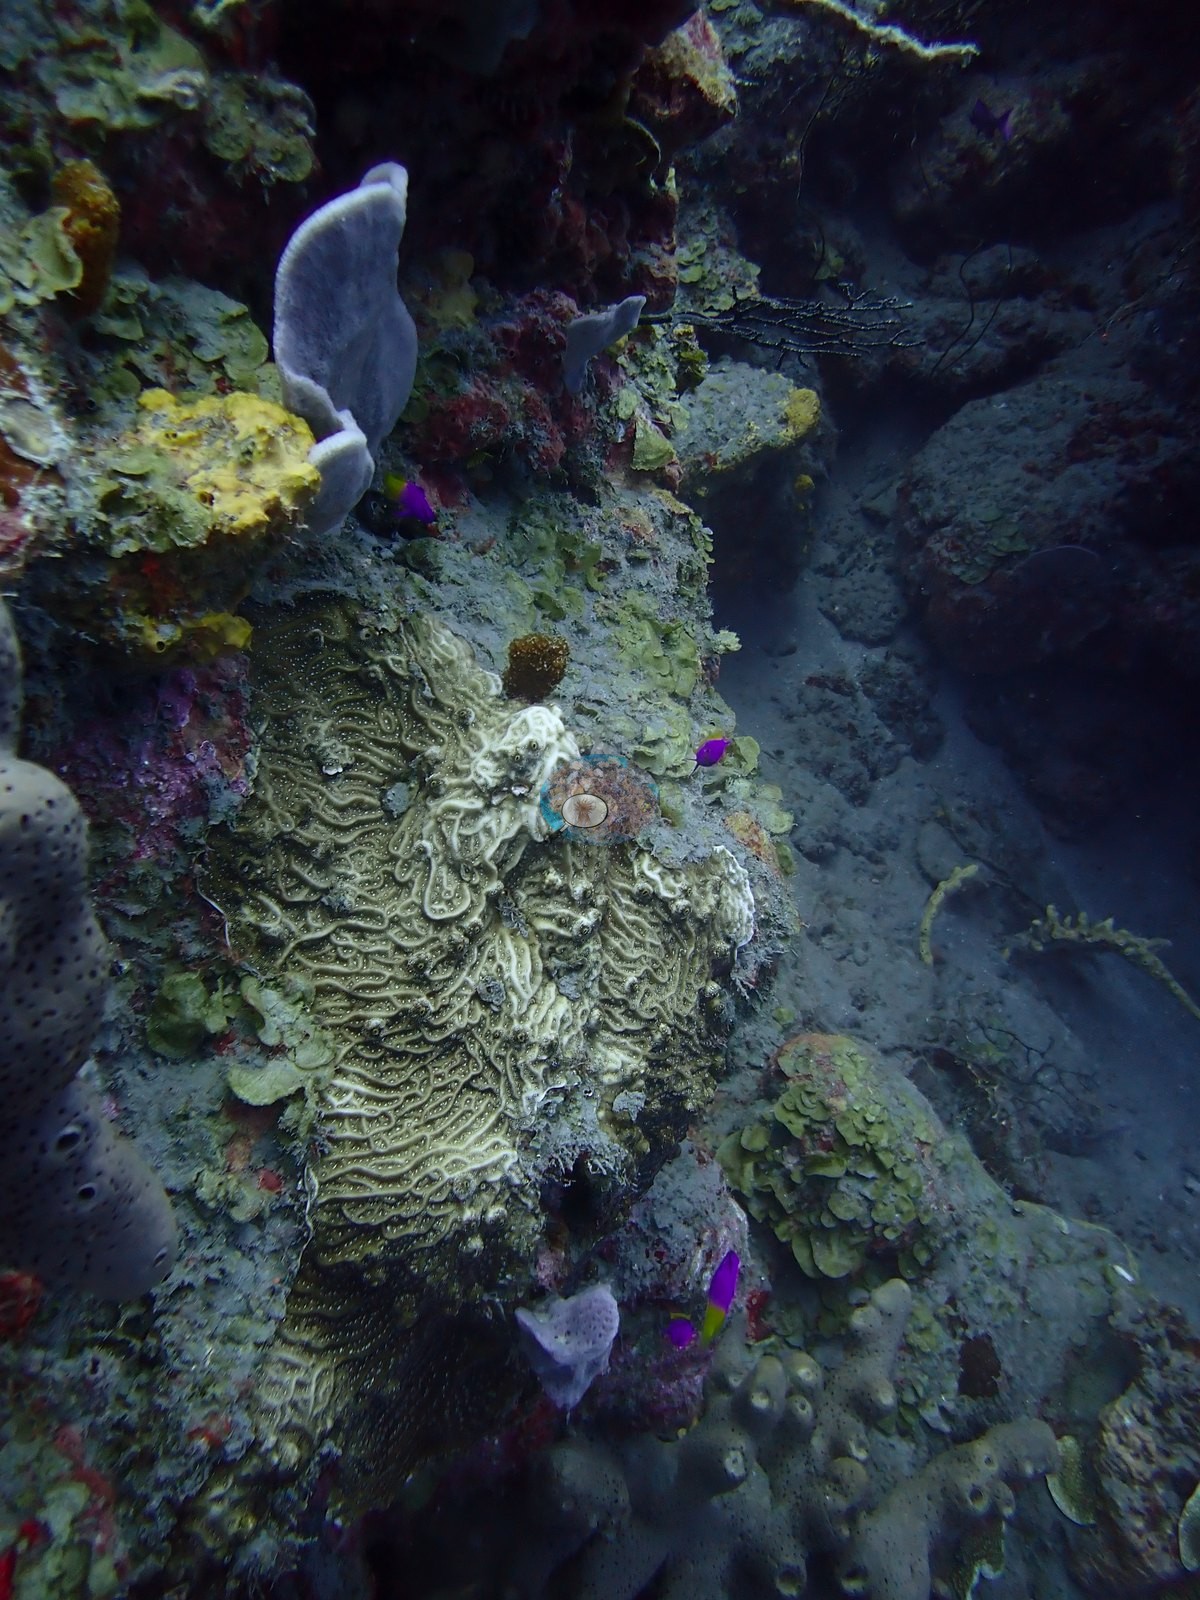
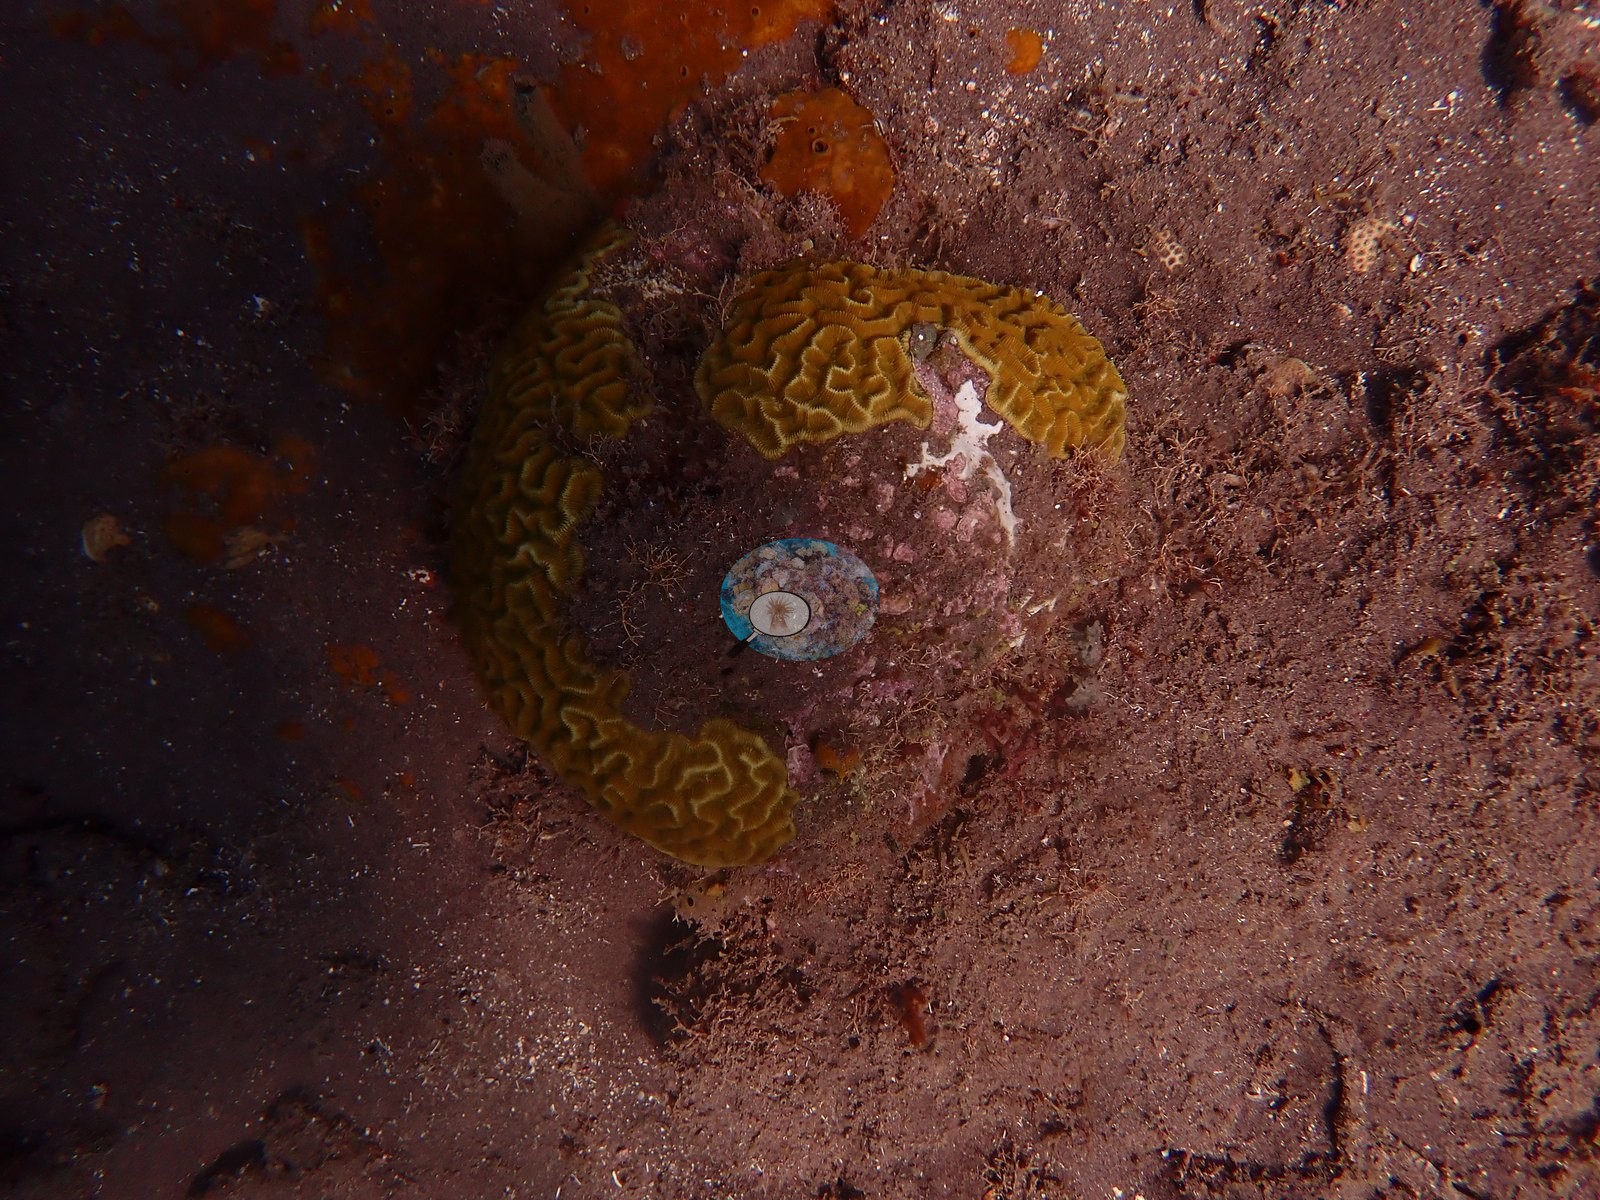
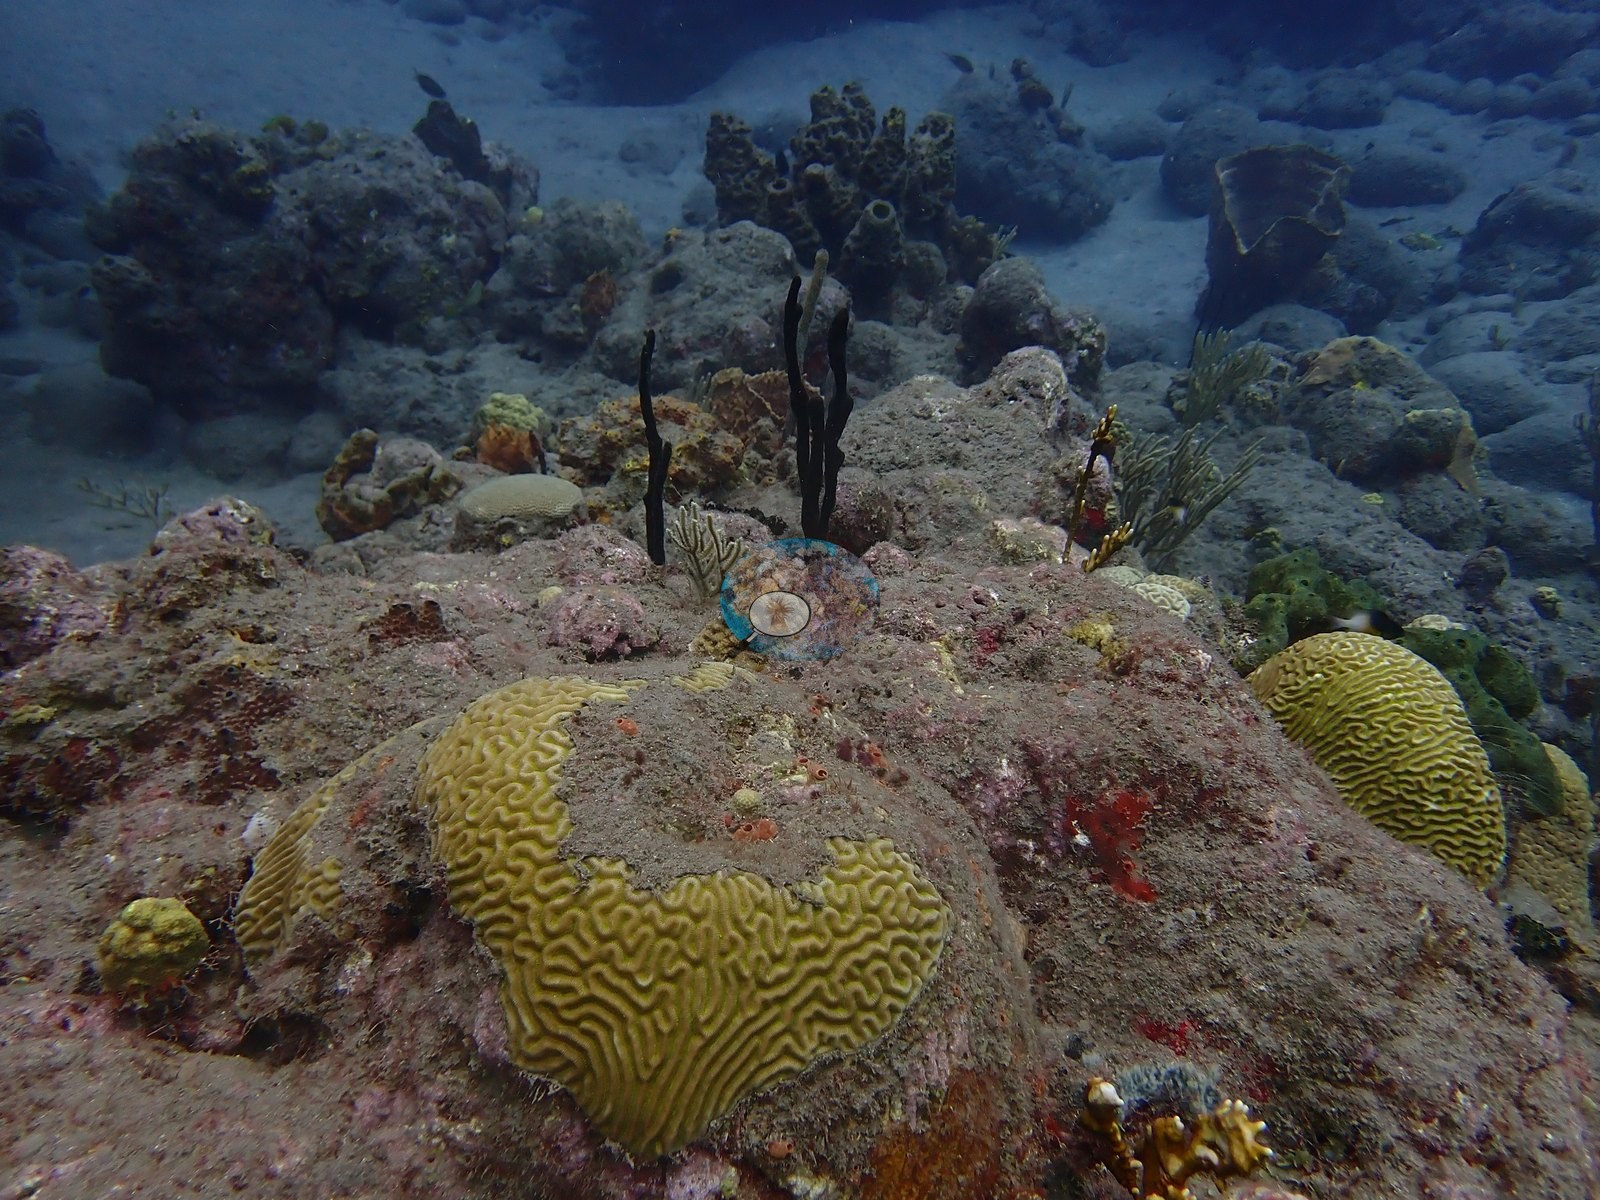
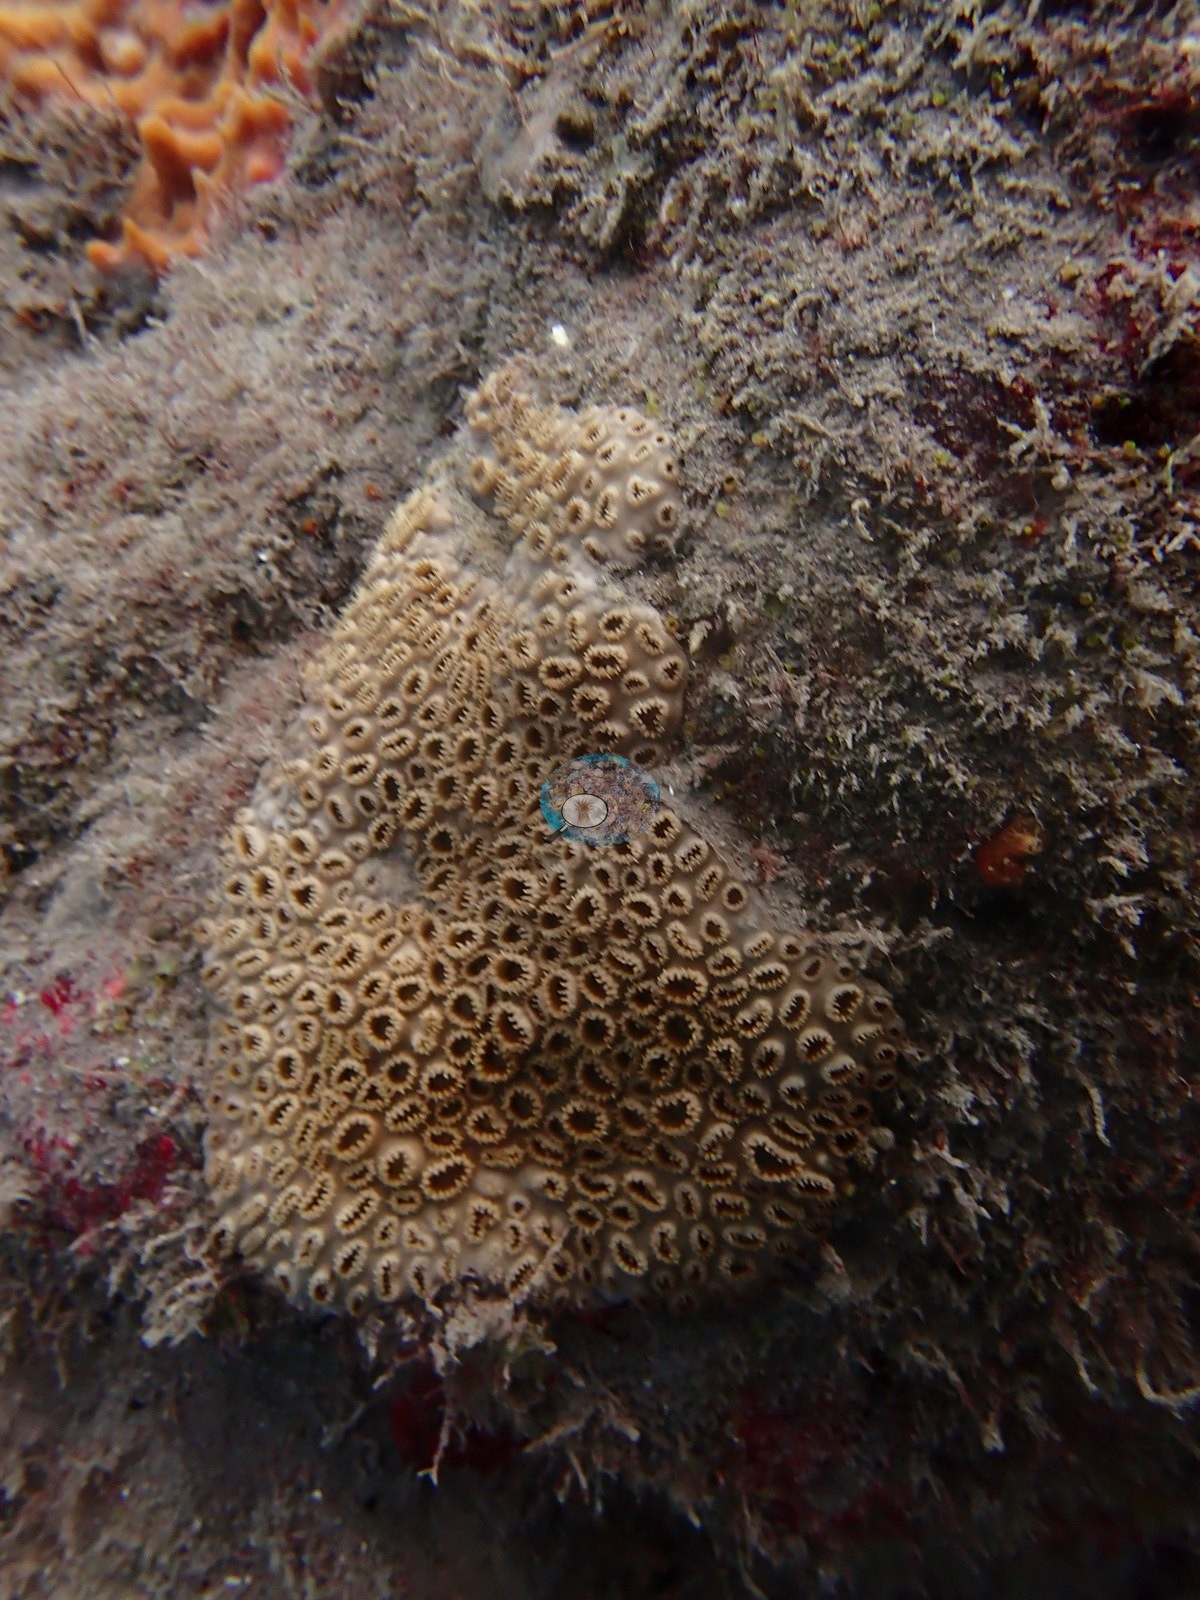
Hard coral is present but a minor component: one small honeycomb/star-coral head (tan, evenly pored, healthy) sits beside an orange sponge cluster; a separate frame shows two adjacent grooved brain/star corals (dark, ridged) flanked by orange tube sponges and a mustard hill-type coral fragment; and a low mounding brain coral appears at the base of a rock covered in black sea rods and a purple sea fan (e.g., Image 6, Image 12, Image 22, Image 24).
Coral cover
Coral cover: 3.0% — a blind Claude computer-vision point count of 85 of Anderson's unedited photographs (20 points per photo; water, fish, and obstructions excluded). Other computer-vision methods are listed in the method table. Frames were screened before scoring: open sand, mid-water, blown-out, and burst-duplicate frames, dive computers, topside, and diver shots, blue-light fluorescence, and macros were all removed.
Stressors
No bleaching, disease, or physical damage is visible on any of the small number of coral colonies photographed; the habitat's low hard coral component is a feature of the site type (sand/rubble with sponge-colonized outcrops), not a health signal. No corallivores evident.
Fish and other fauna
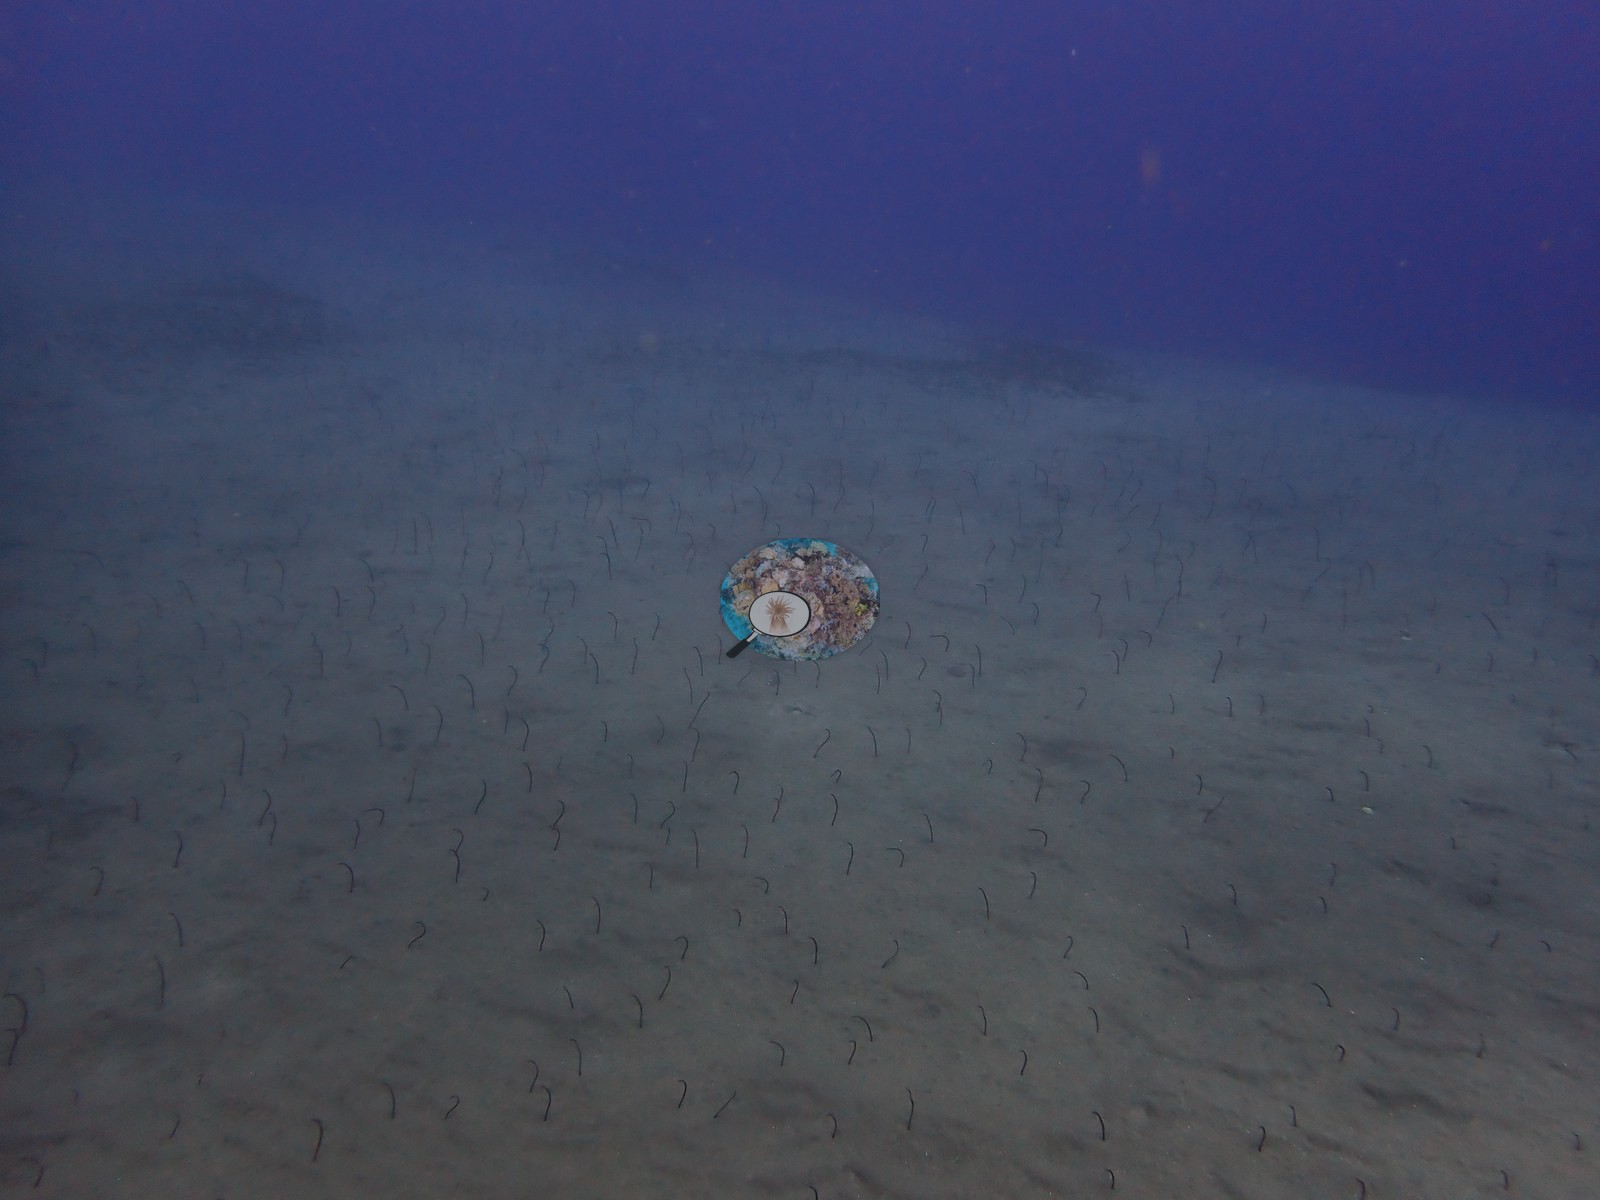
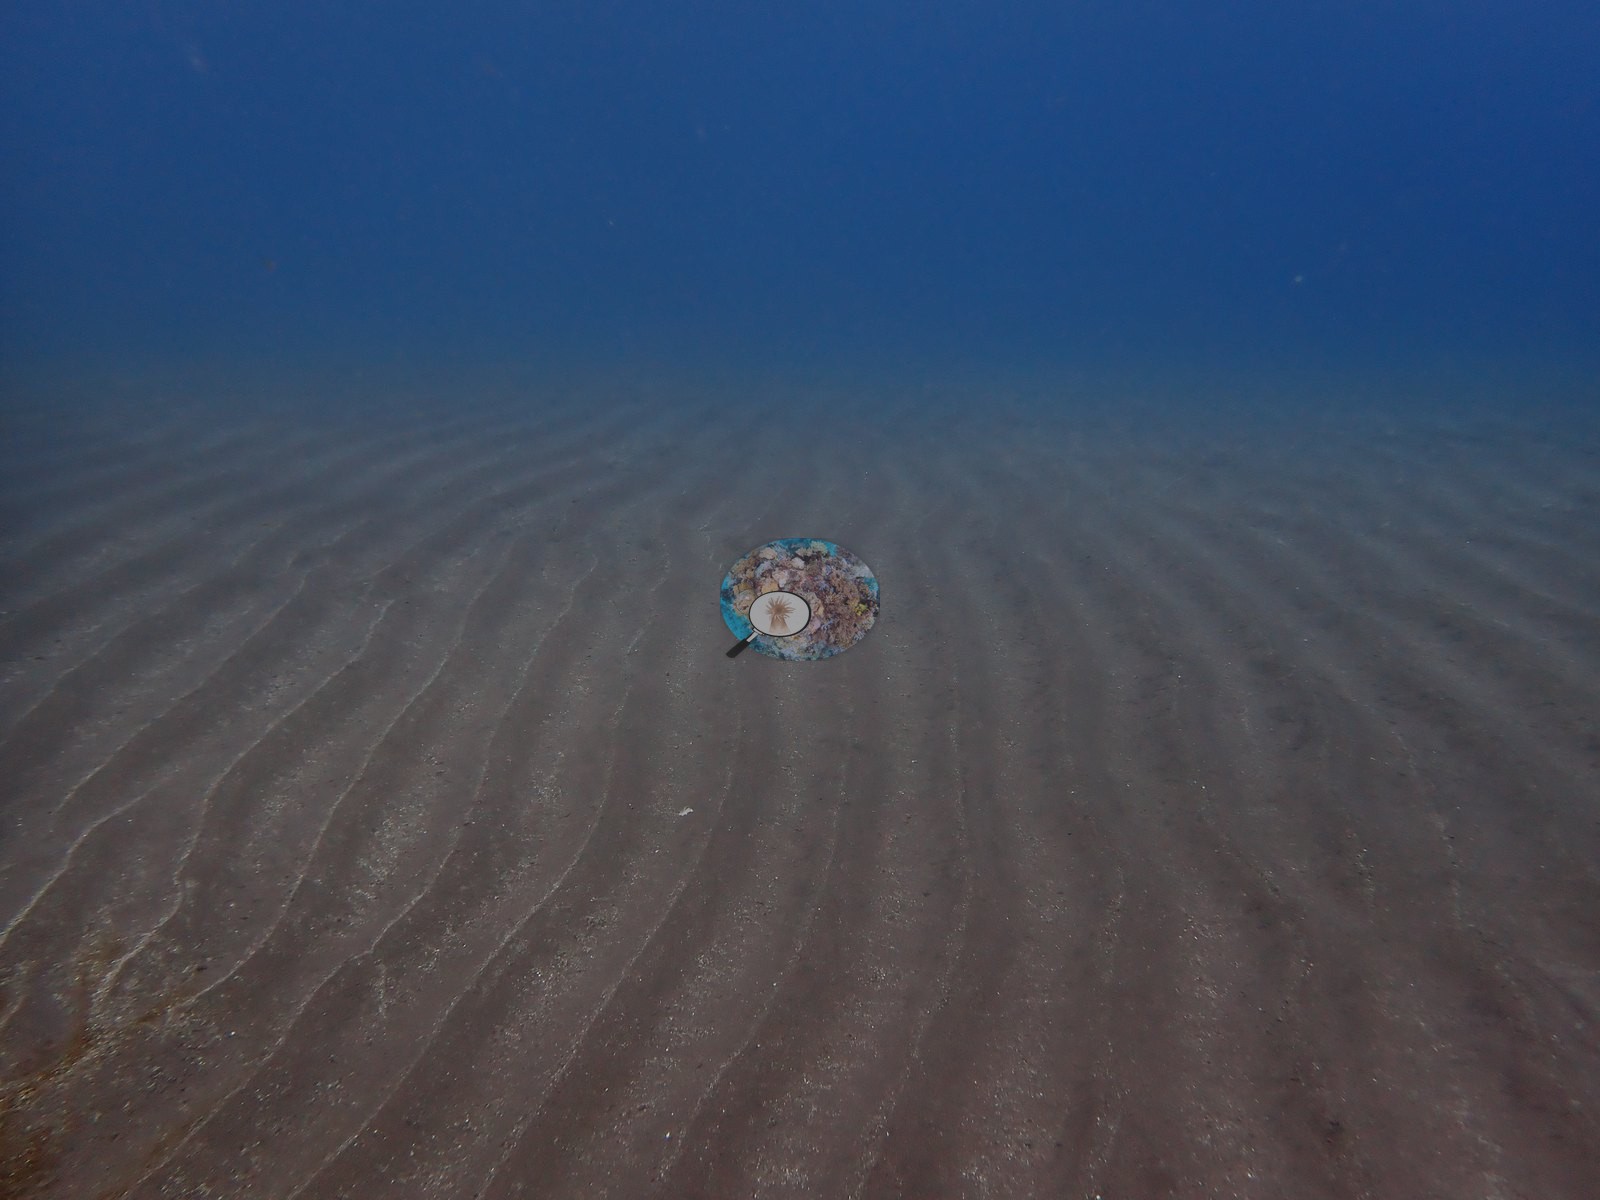
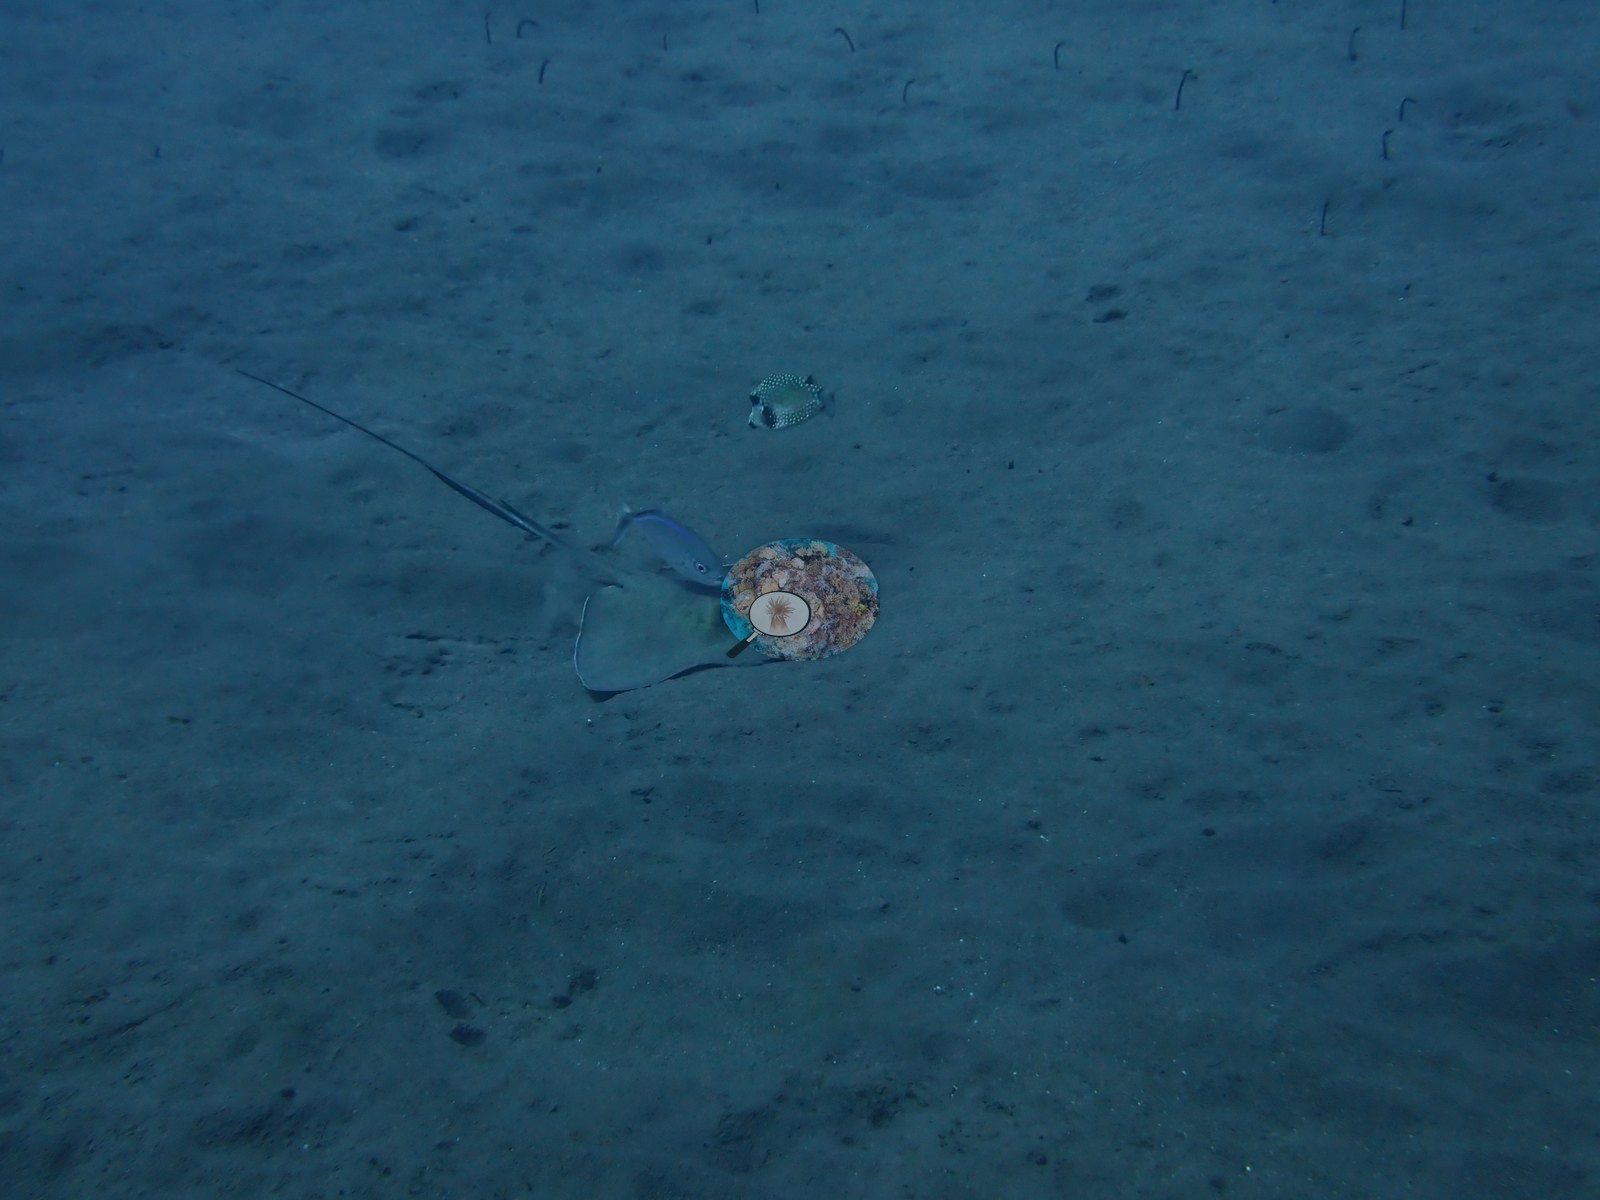
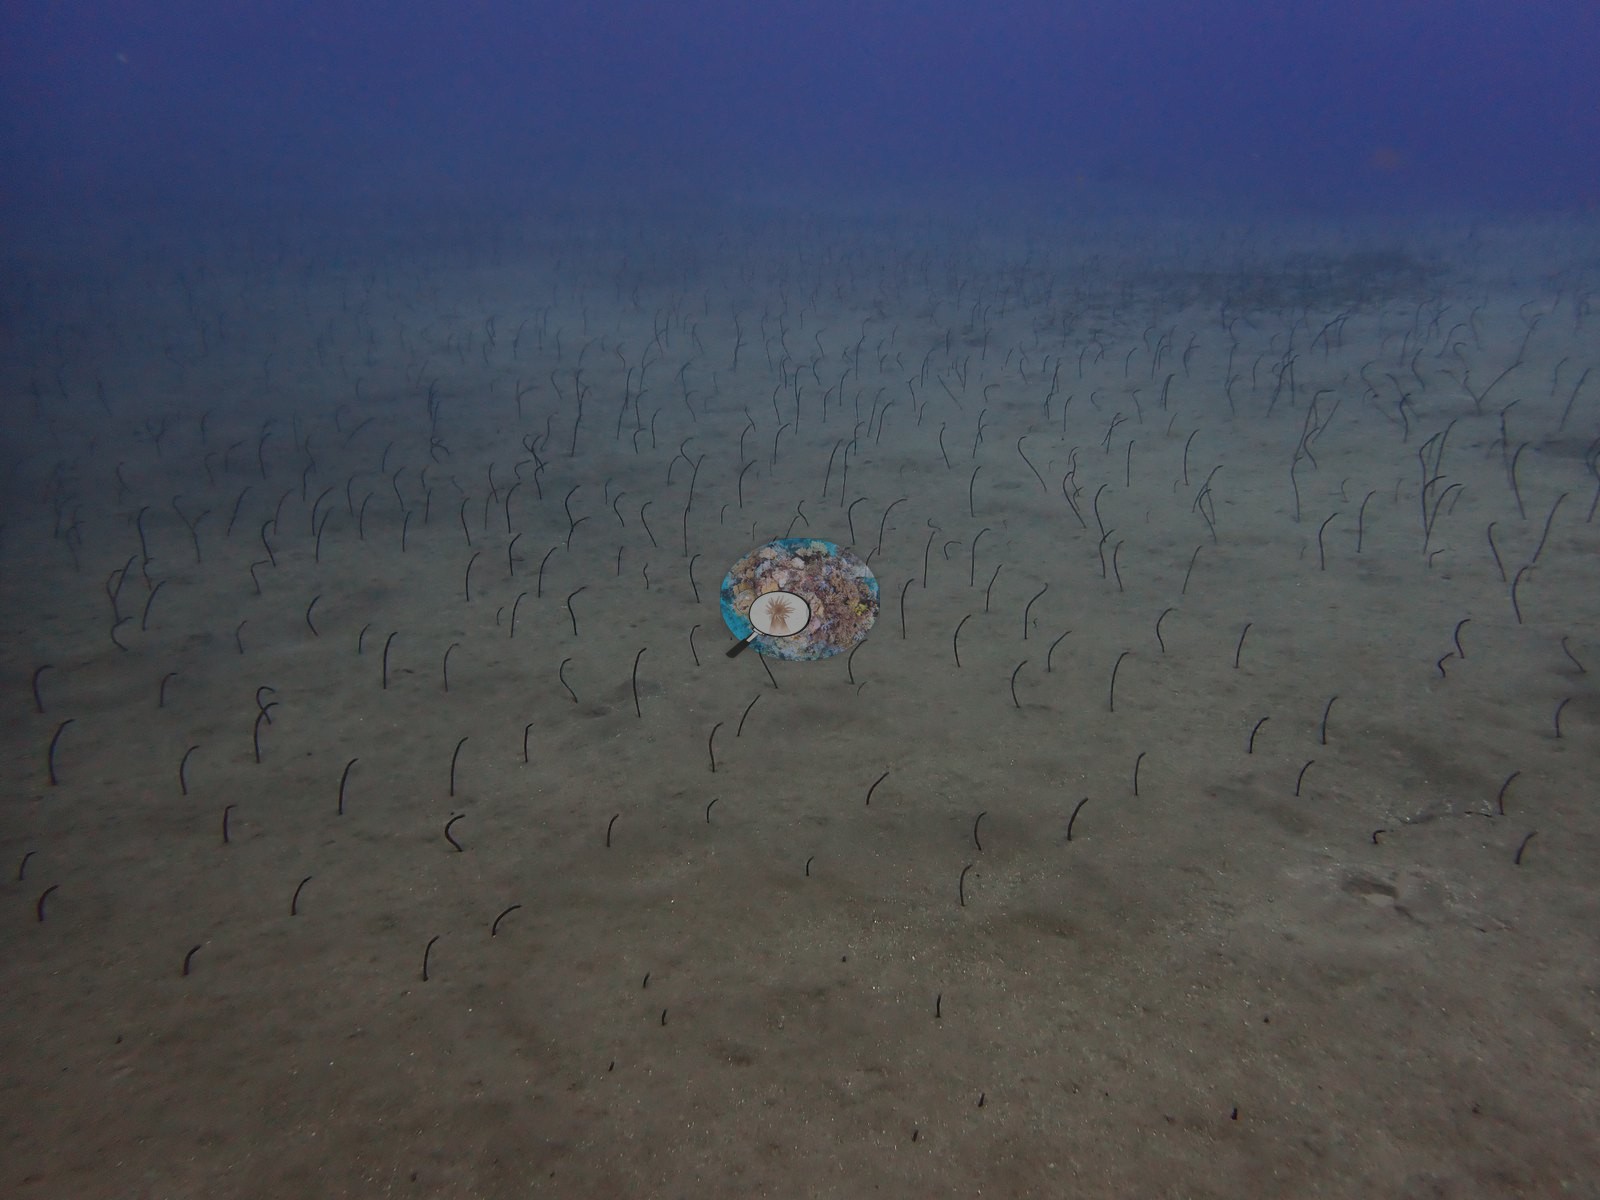
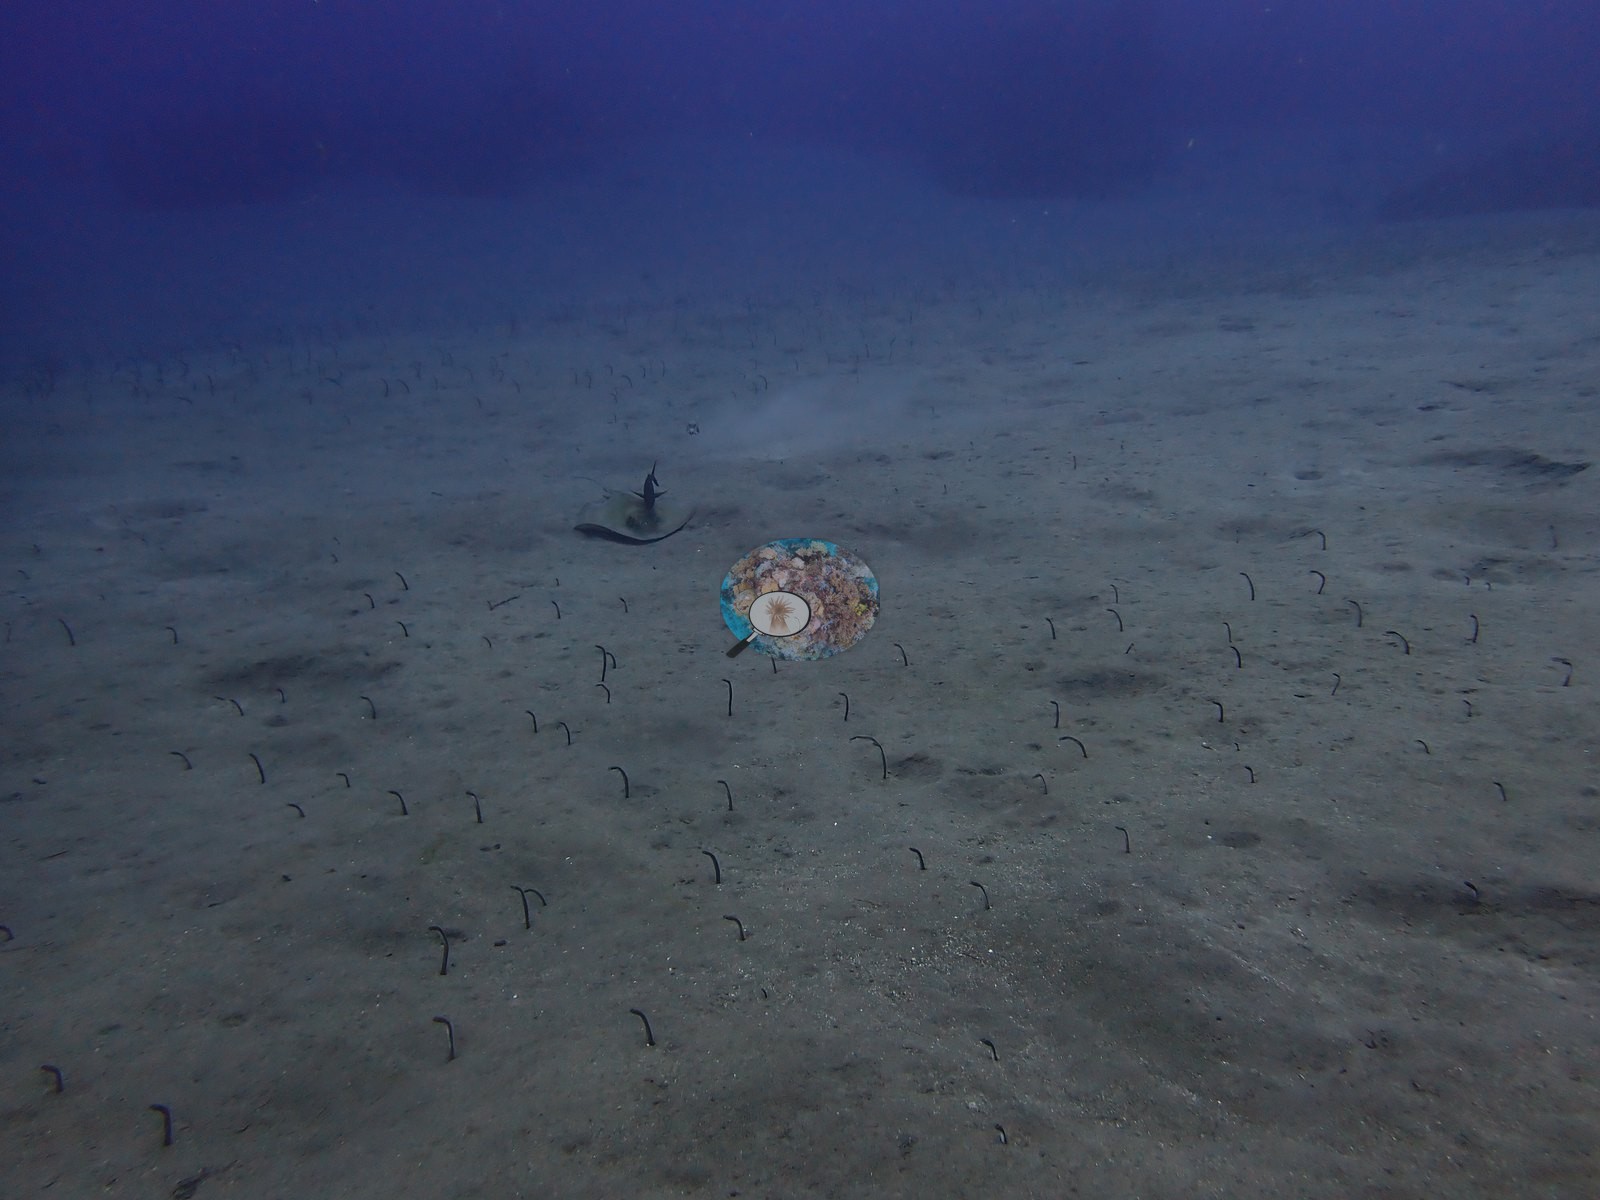
The opening and closing frames show a large garden-eel colony: dozens of pale eels with heads raised from burrows across an open gray sand plain, visible in two separate wide shots (e.g., Image 7, Image 33).
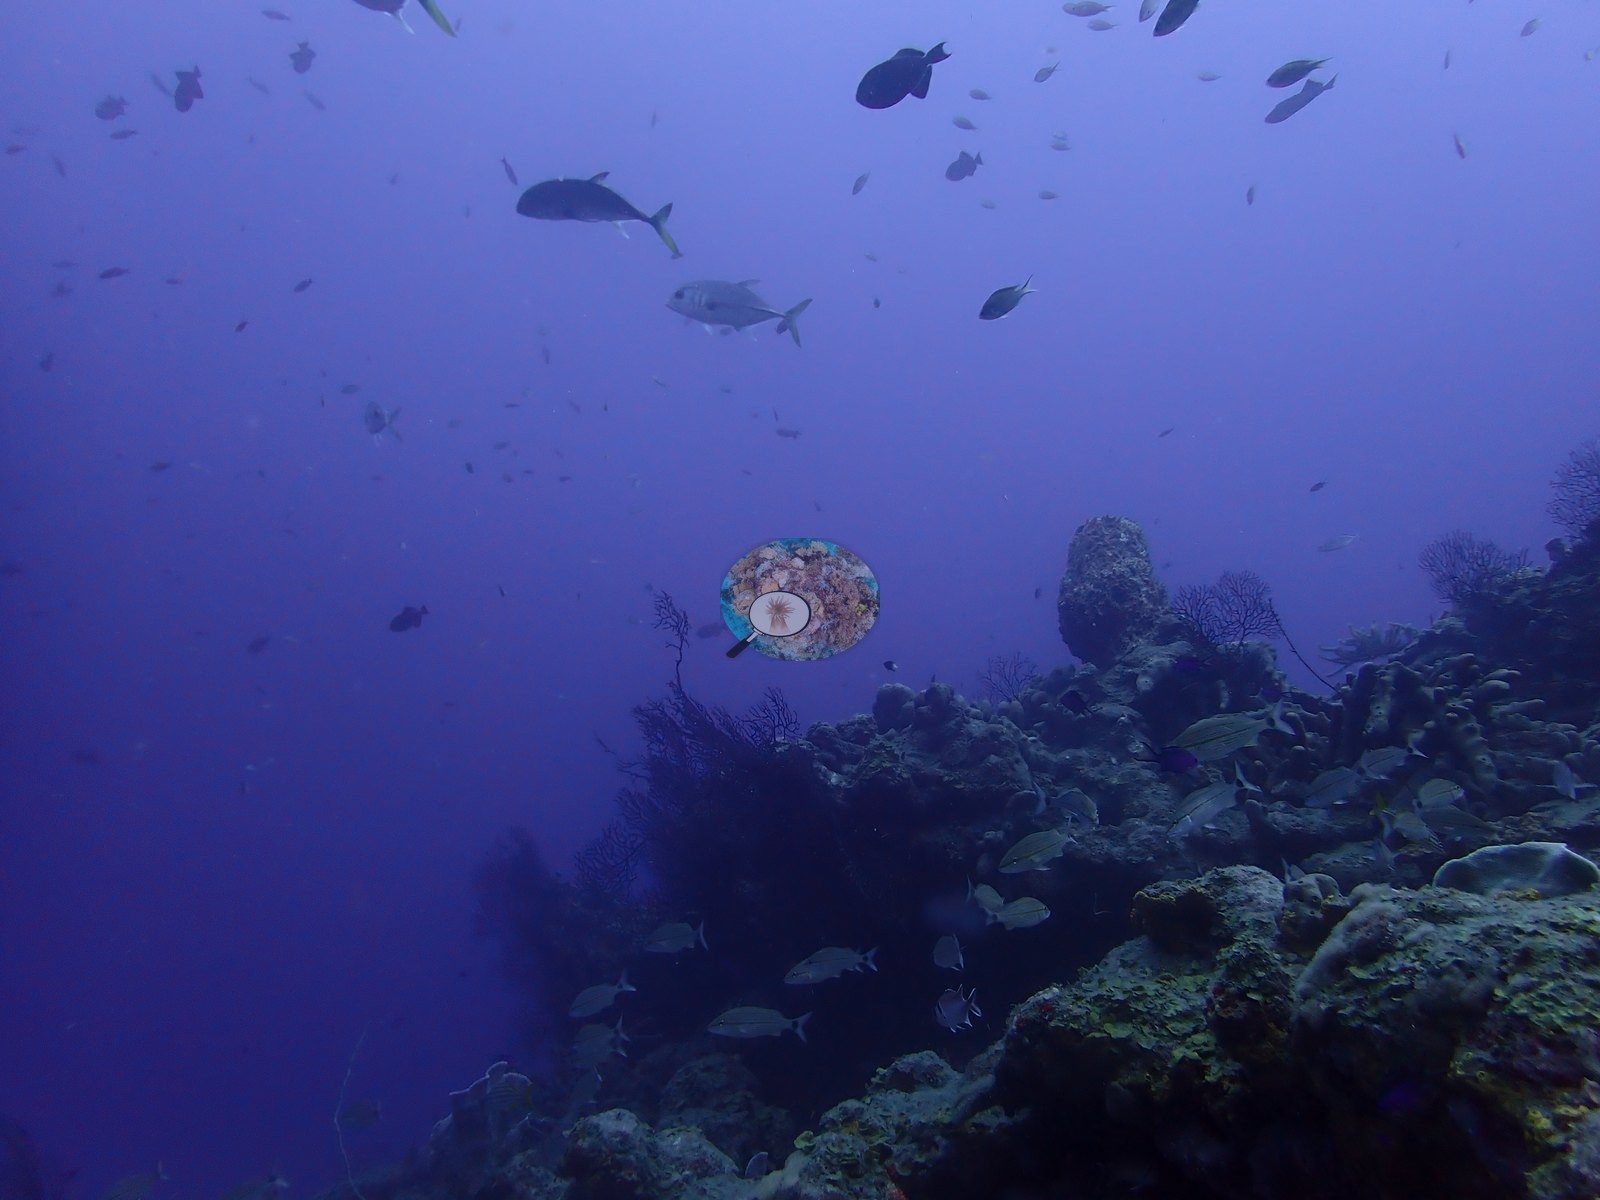
A lionfish (invasive, Pterois volitans/miles) is visible tucked into a crevice on one outcrop, camouflaged against the gray rock. Reef fish (blue and brown chromis, a parrotfish, sergeant majors) move over the structure, and one frame shows a diver examining a barrel-sponge-and-coral outcrop in clear blue water (e.g., Image 49).
Comparisons with other data
No independent survey was made at this exact site; the nearest ones are listed in the table below.
CV model comparison
More info
DINOv3 and CoralSCOP were run on the same photos and are listed for comparison. Coralscapes v2 and v1 were also run but are not shown: Anderson does not consider Coralscapes reliable for these photos. No diver transect exists for this trip, so agreement between the rows is not accuracy, and as of September 2026 no computer-vision method estimates coral cover accurately on new images; treat every row as indicative.| Method | Hard-coral cover (%) |
|---|---|
| In-house DINOv3 | 15.0 |
| CoralSCOP unedited | 21.3 |
| Claude | 3.0 |
Independent surveys nearby
 Dr. Coral (CRD)
Within 5 km, 3 independent survey stations recorded hard coral cover in 7 surveys between 2024 and 2025. Of the 1 station surveyed in more than one year, 1 increased between their first and latest surveys. The longest record, Black_Rock_Donor (MERMAID project “Saba_Marina_Relocation”*, 1.45 km away), went from 1.7% in 2024 to 10% in 2025. Surveys since 2021 average 6.0% (range 1.7–10%, n=4). This site's own estimate (3.0%) sits within the recent range (1.7–10%); the methods differ, so the comparison is context, not a like-for-like test.
Collected by other programs using different methods (MERMAID is a data platform: each MERMAID row names the organization that did the survey, and its method is in the row's hover text. *Conducted by citizen scientists), so these are context for the figures above, not a like-for-like comparison. Where a station was surveyed more than once the range is shown. Station names are not dive-site names.
| Agency | Site / location | Date | Hard coral cover (%) | Distance | Link |
|---|---|---|---|---|---|
| MERMAID project “Saba_Marina_Relocation”* | Black_Rock_Donor | 2024–2025 | 1.7–10% (2 surveys) | 1.45 km | Bean T, Gould K, Re E. 2025. Saba_Marina_Relocation. MERMAID |
| MERMAID project “Saba_Marina_Relocation”* | Hole_in_the_Corner_(HITC)_Recipient | 2024 | 6.5% | 3.15 km | Bean T, Gould K, Re E. 2025. Saba_Marina_Relocation. MERMAID |
| MERMAID project “Saba_Marina_Relocation”* | Black_Rock_Donor (mean of 2 surveys, 2024–2025) | 2025 | 5.8% (4 surveys) | 1.45 km | Bean T, Gould K, Re E. 2025. Saba_Marina_Relocation. MERMAID |
Data & links
All images from Coral Reef Diagnostics. Data are from Coral Reef Diagnostics and the organizations named in the data-sources table above.
© Coral Reef Diagnostics.