
Saba - Tent Drift
Part of the regional summary: Saba
More about this place: Saba on Wikipedia
More info
Leeward Caribbean Islands (NOAA CRW virtual station) · Eastern Caribbean ecoregion mean=13.1°C-heating weeksA drift along low volcanic boulders and a wall in Saba National Marine Park, dominated by barrel sponges and gorgonians, with only sparse small corals such as flower and brain corals, some looking pale. The wildlife steals the show: a resting nurse shark, a green turtle, a buried southern stingray, and a dense garden-eel colony, plus one invasive lionfish.
Three independent survey stations shown with the program’s logo — click one to see how far it is from this site.
Three other CRD dive sites within 5 km shown in orange — click a marker to open its page.
30 of these 51 photographs are shown beside the text that discusses them under "Site description" below.
Site description
Setting
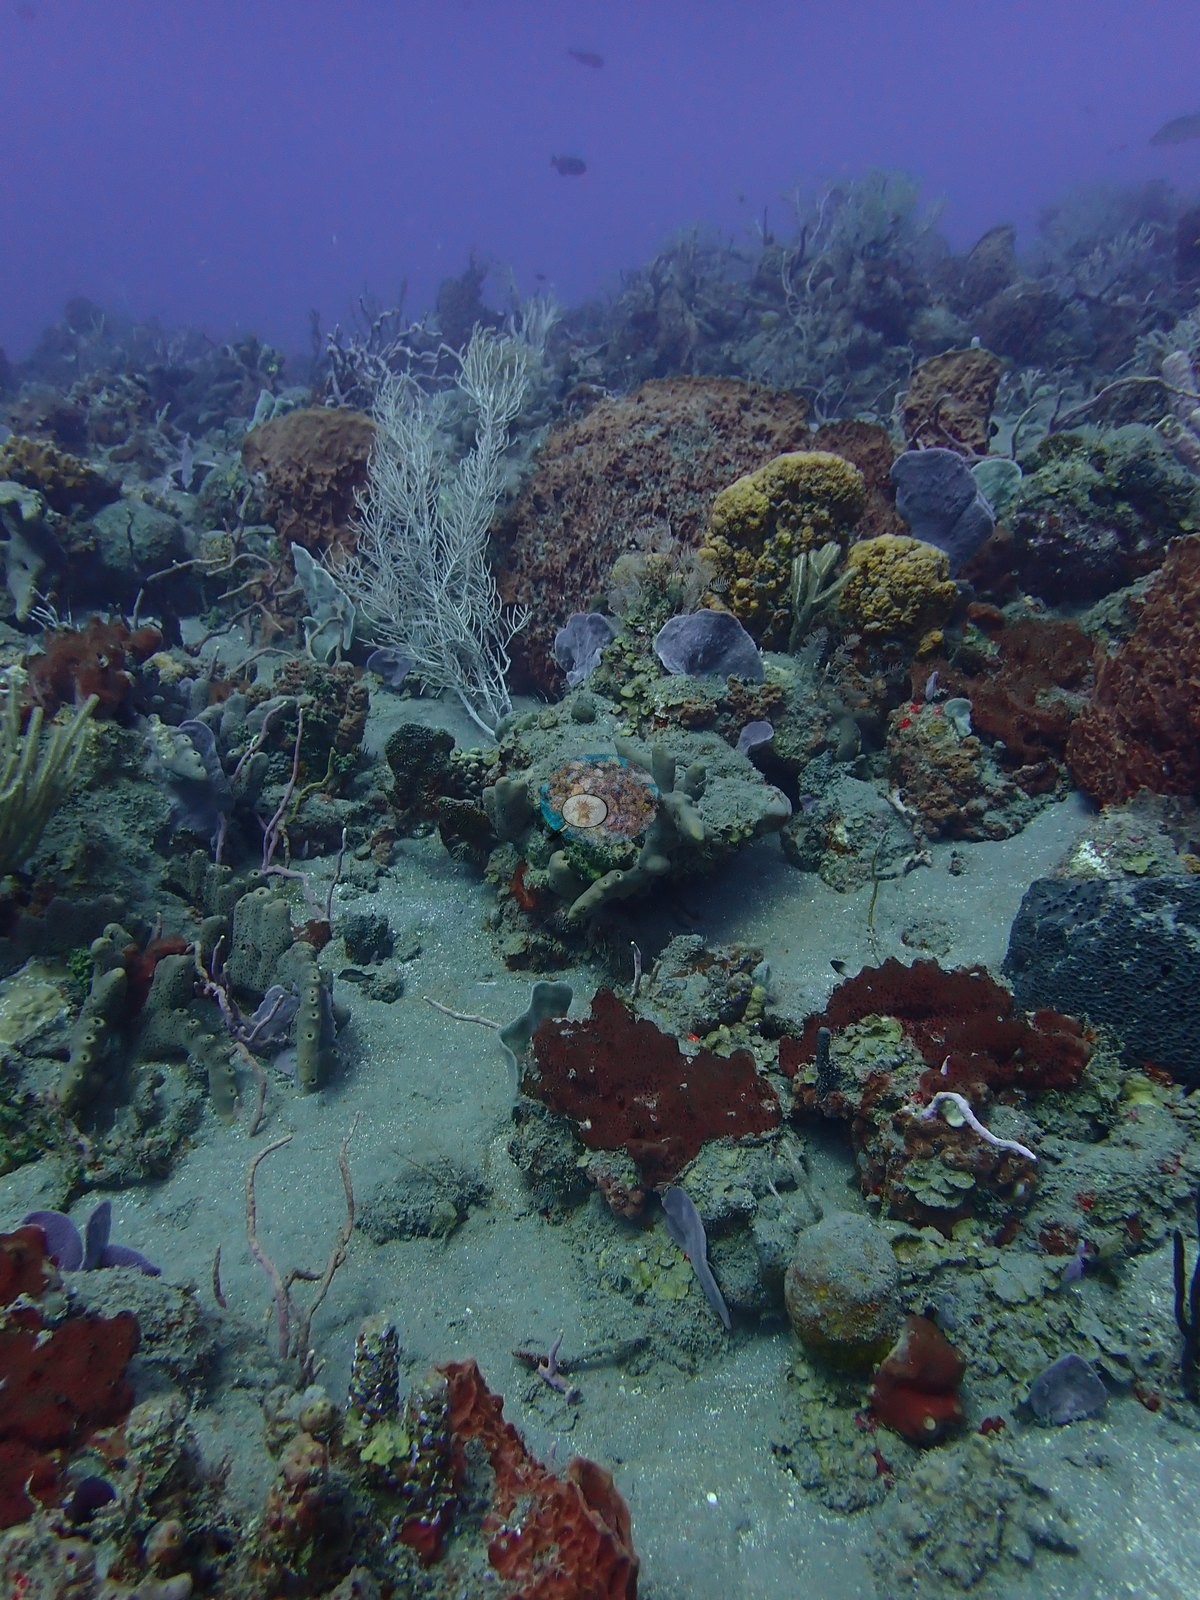
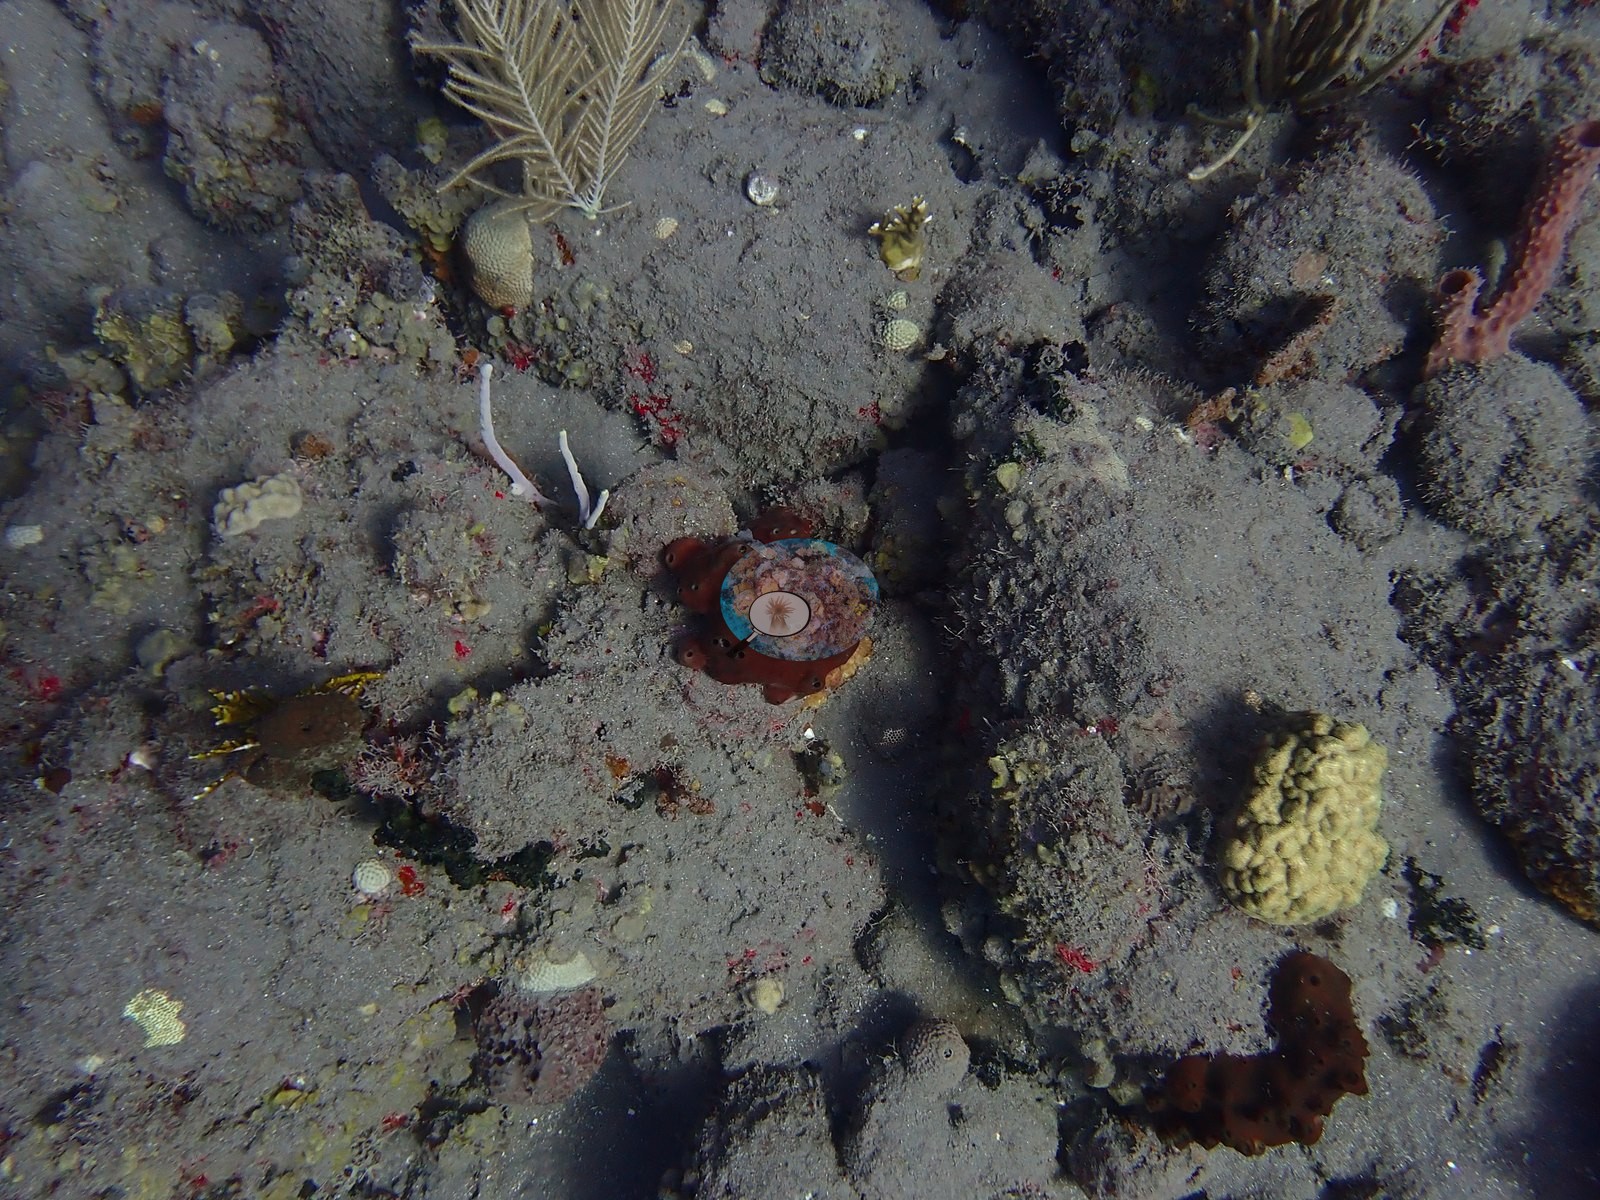
Visibility is moderate, hazy in the deeper shots; fine sediment coats much of the pavement (e.g., Image 10).
General benthic features
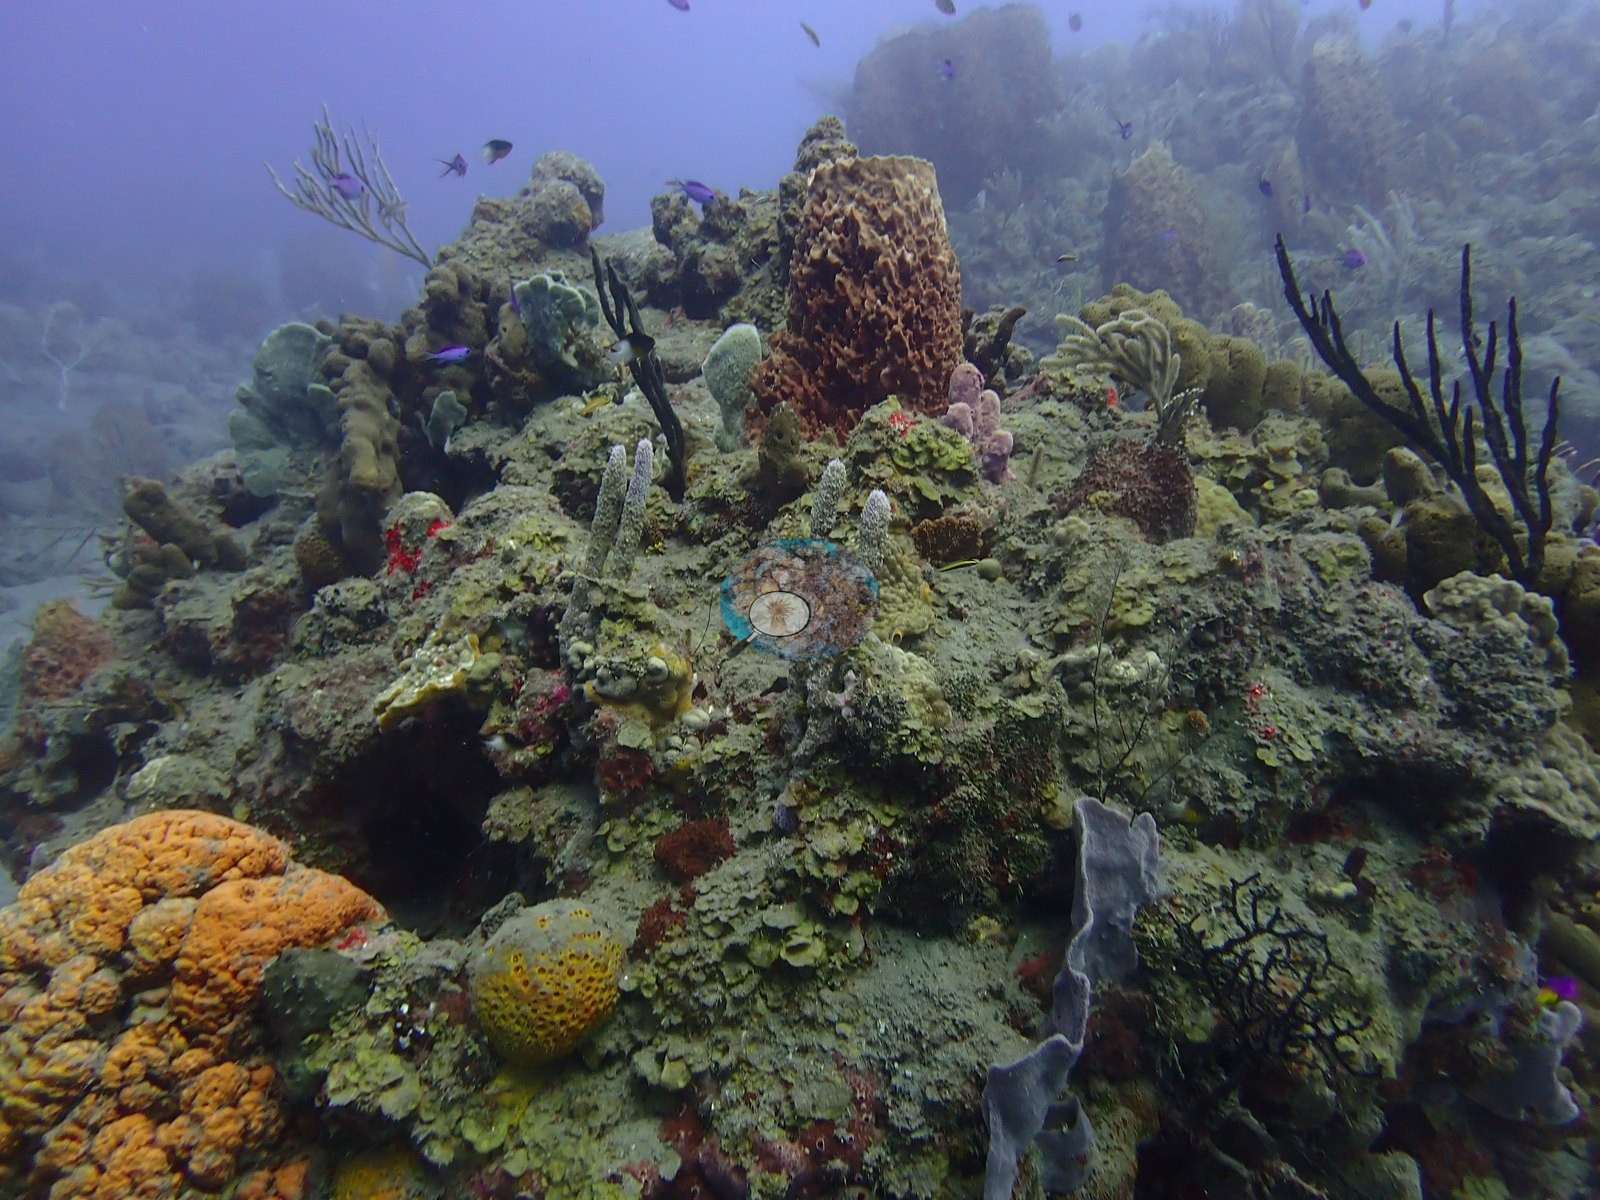
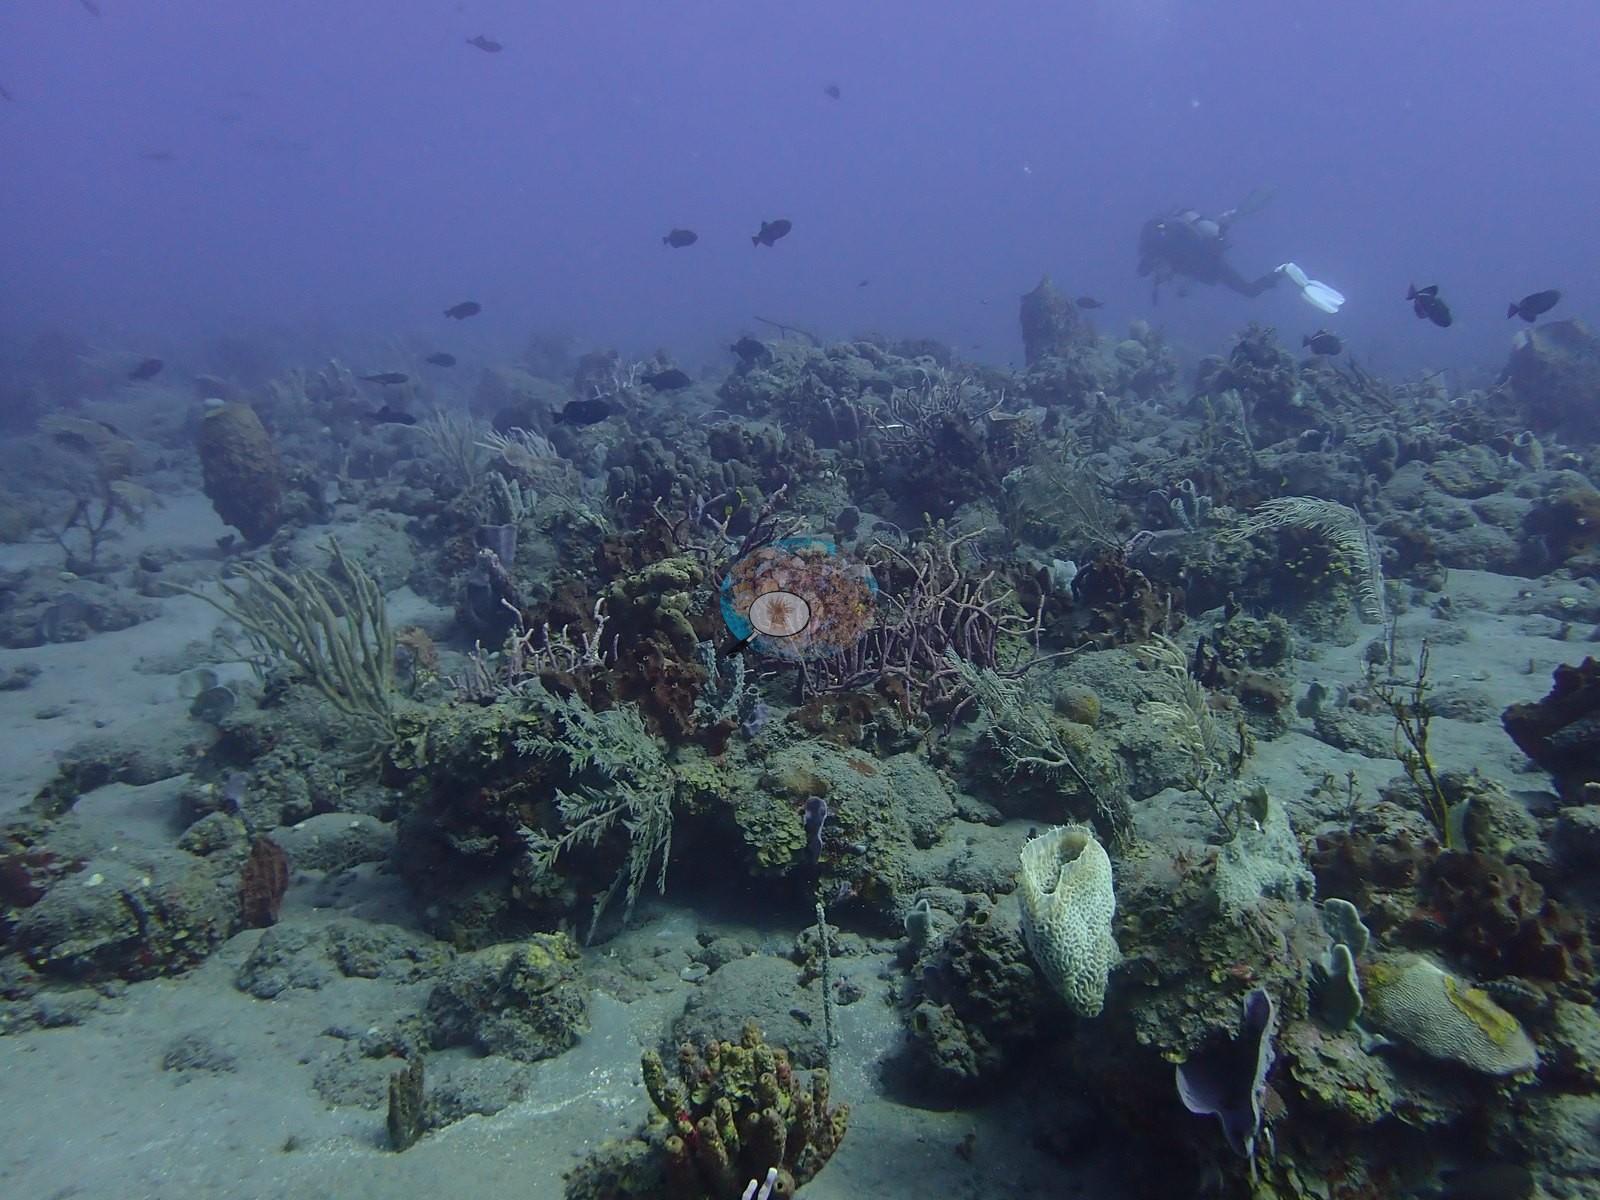
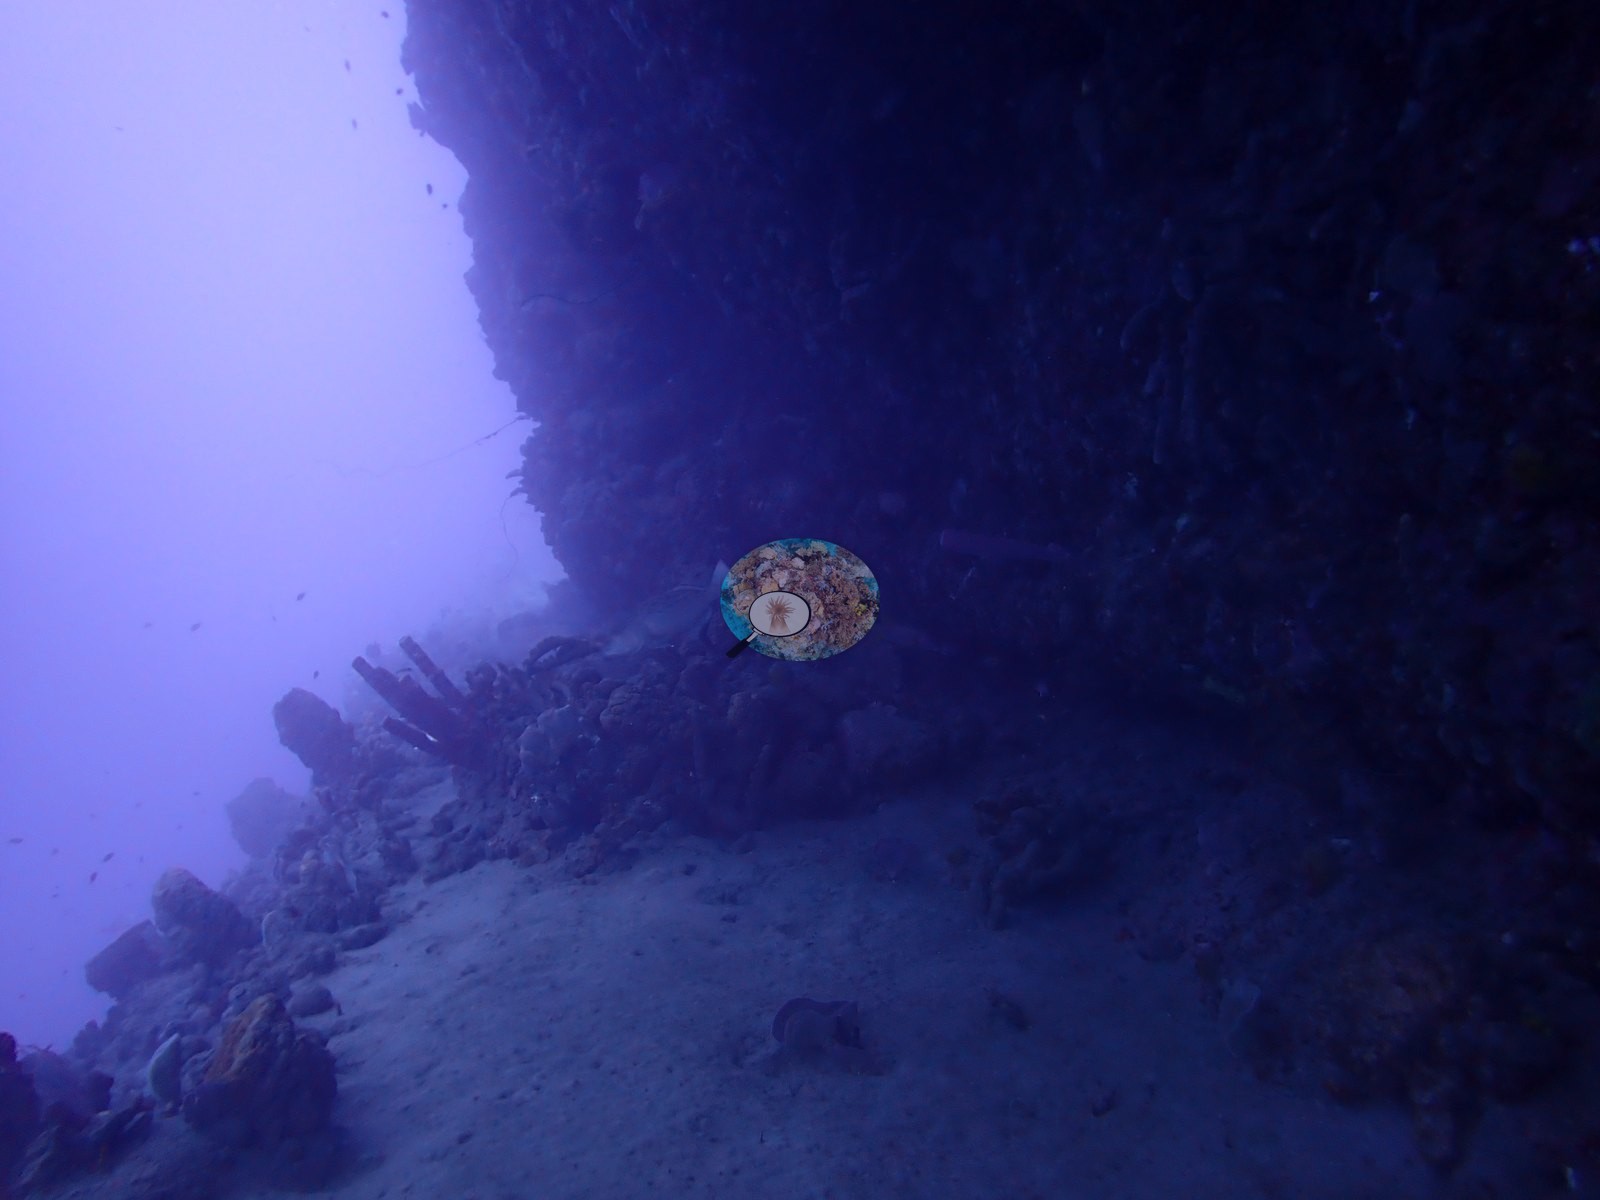
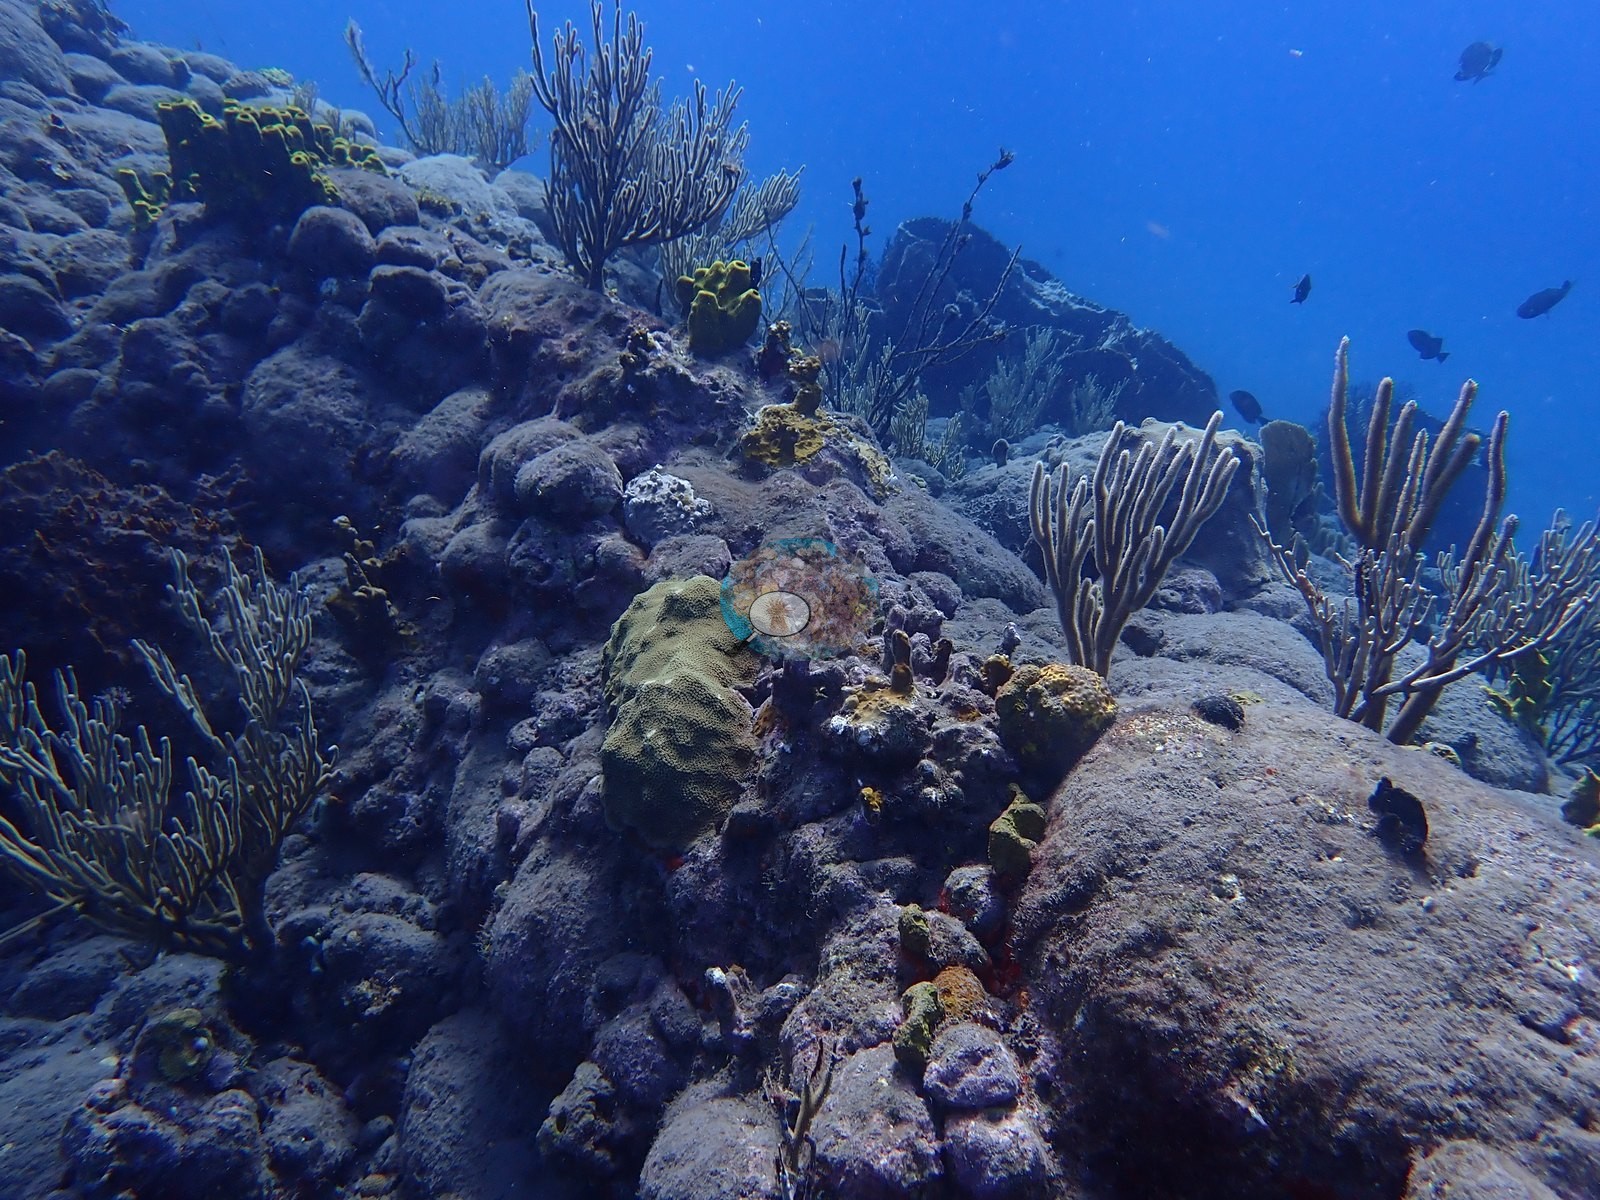
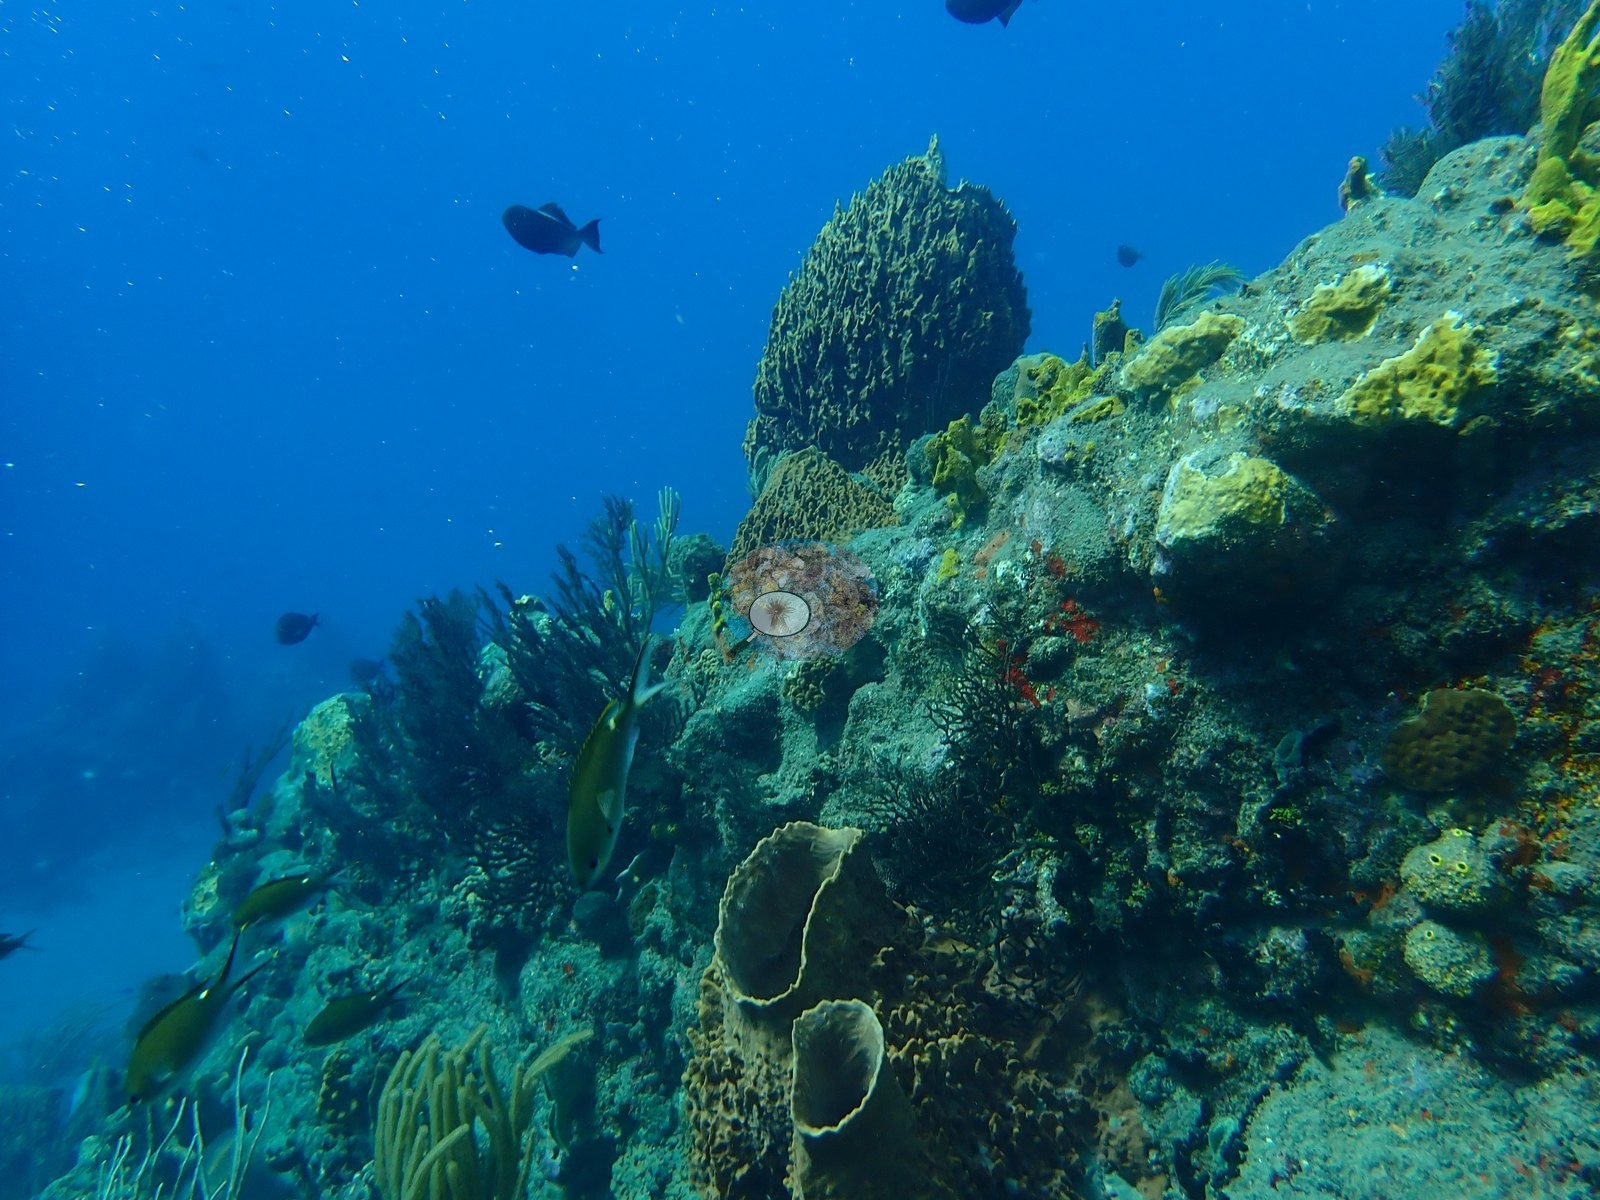
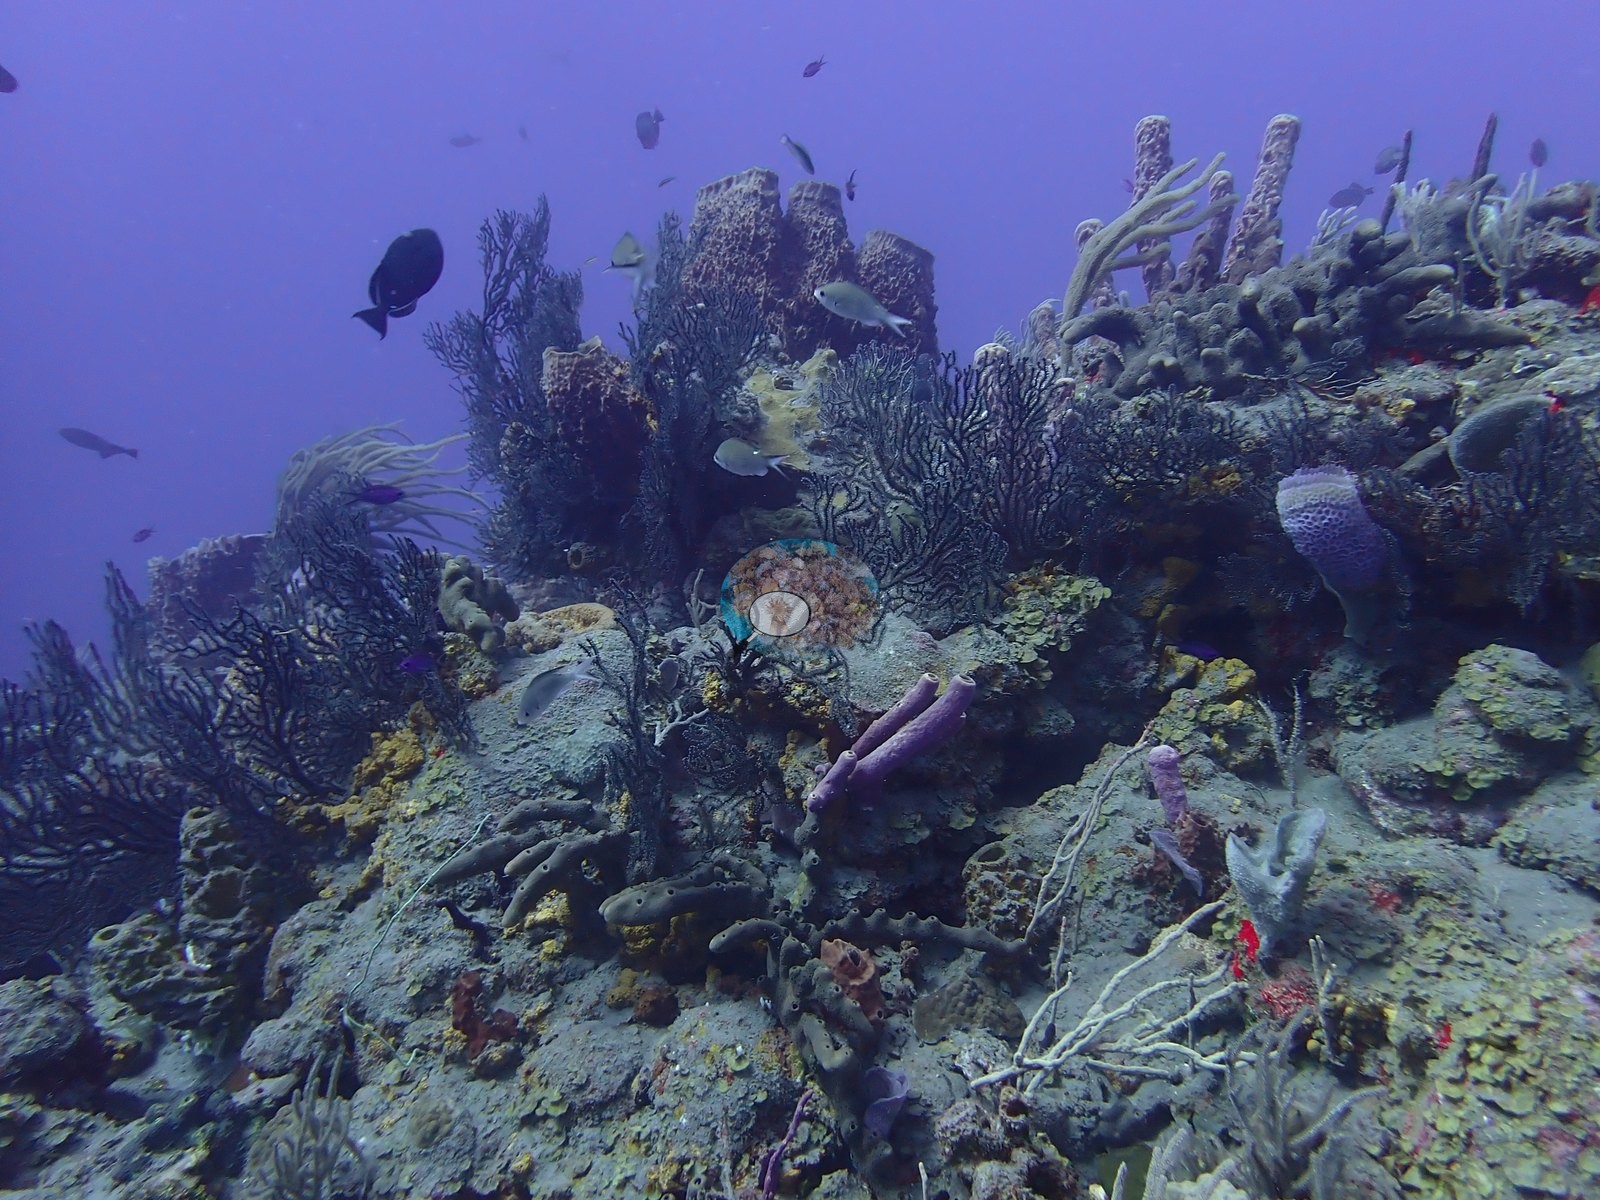
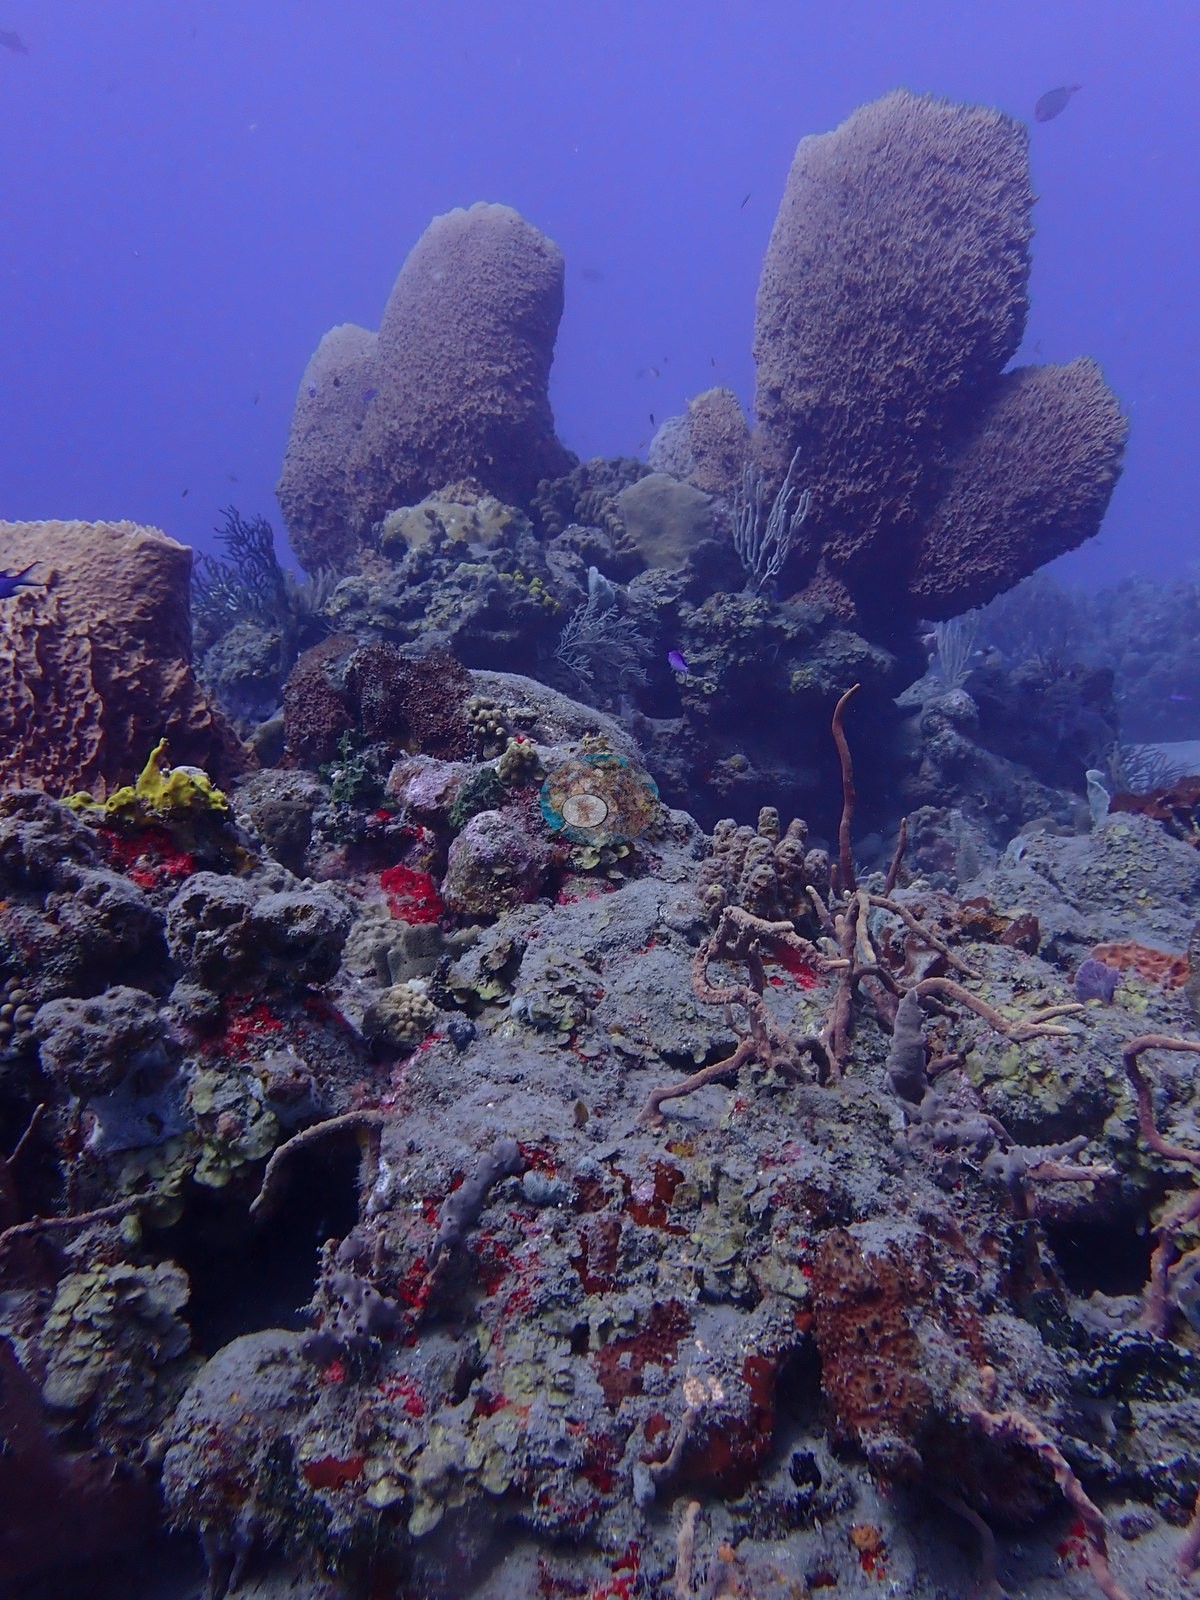
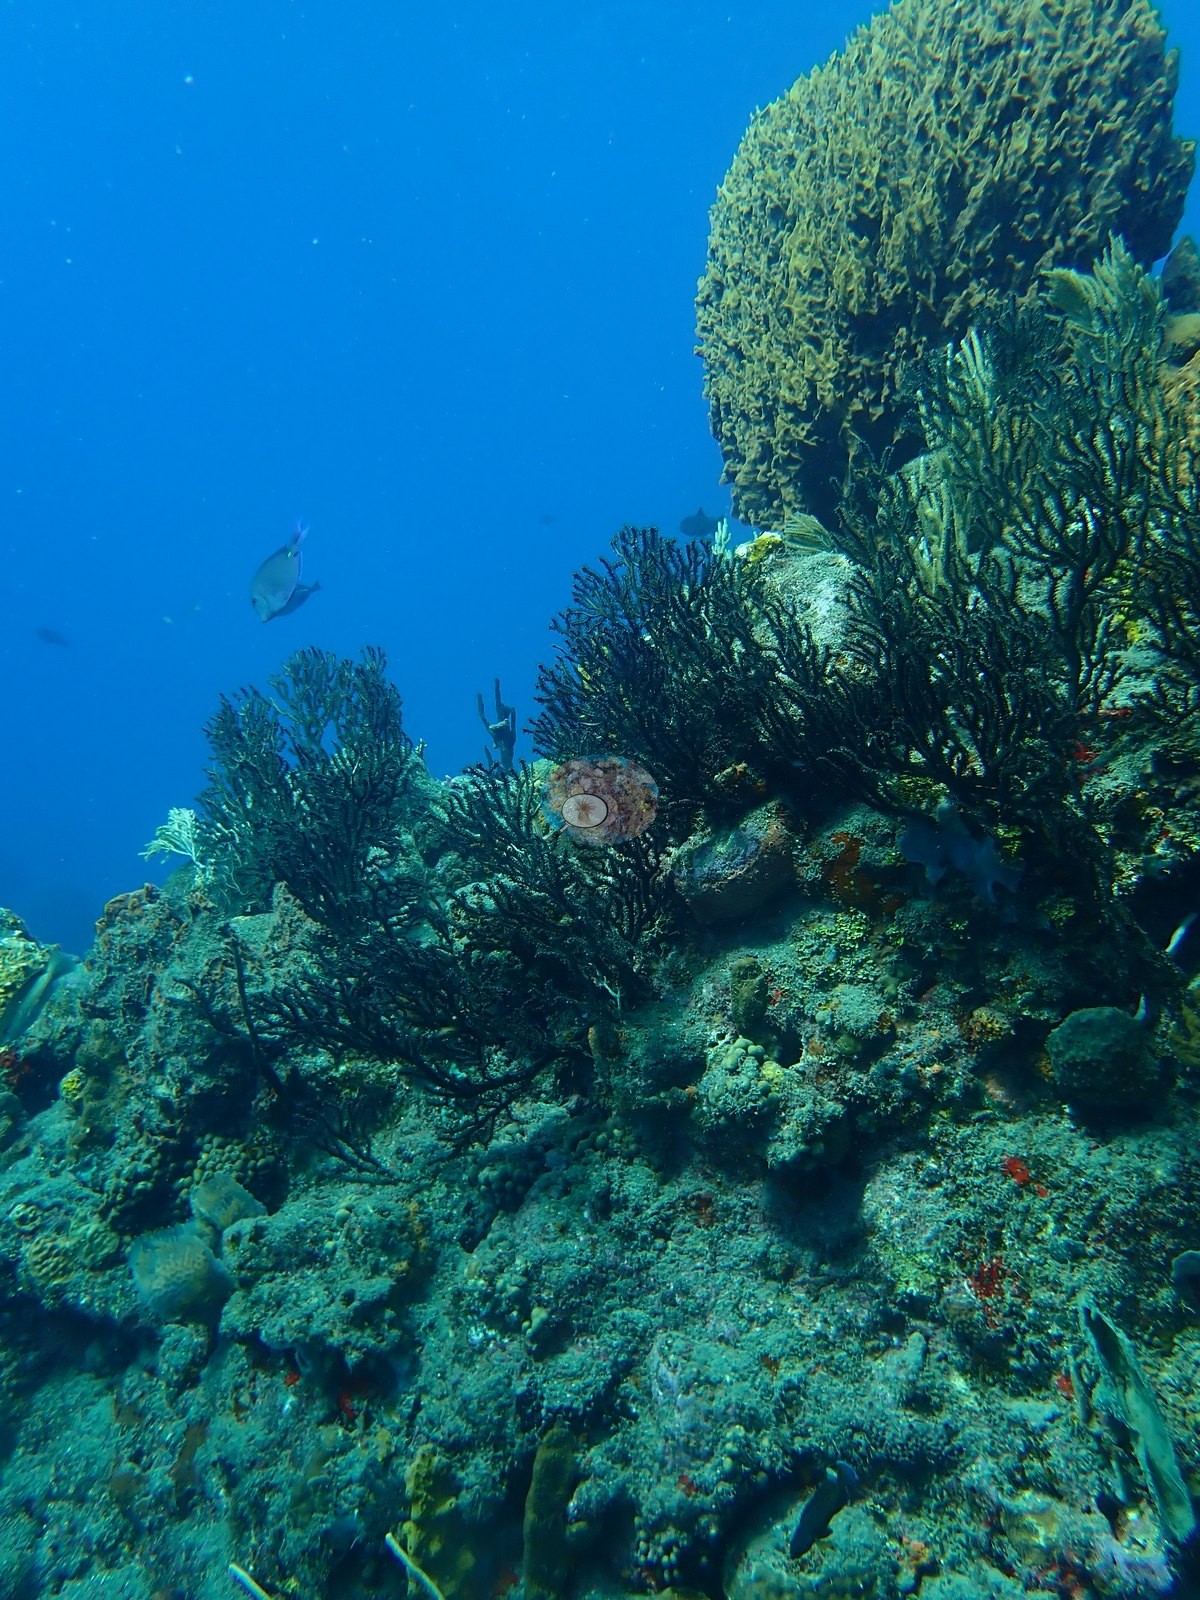
Low-relief volcanic hardground, not carbonate framework: rounded boulders and pavement sheeted in turf and pink crustose coralline algae, grading into gray volcanic sand flats, with several frames along a vertical wall dropping into blue (e.g., Image 1, Image 6, Image 20, Image 54).
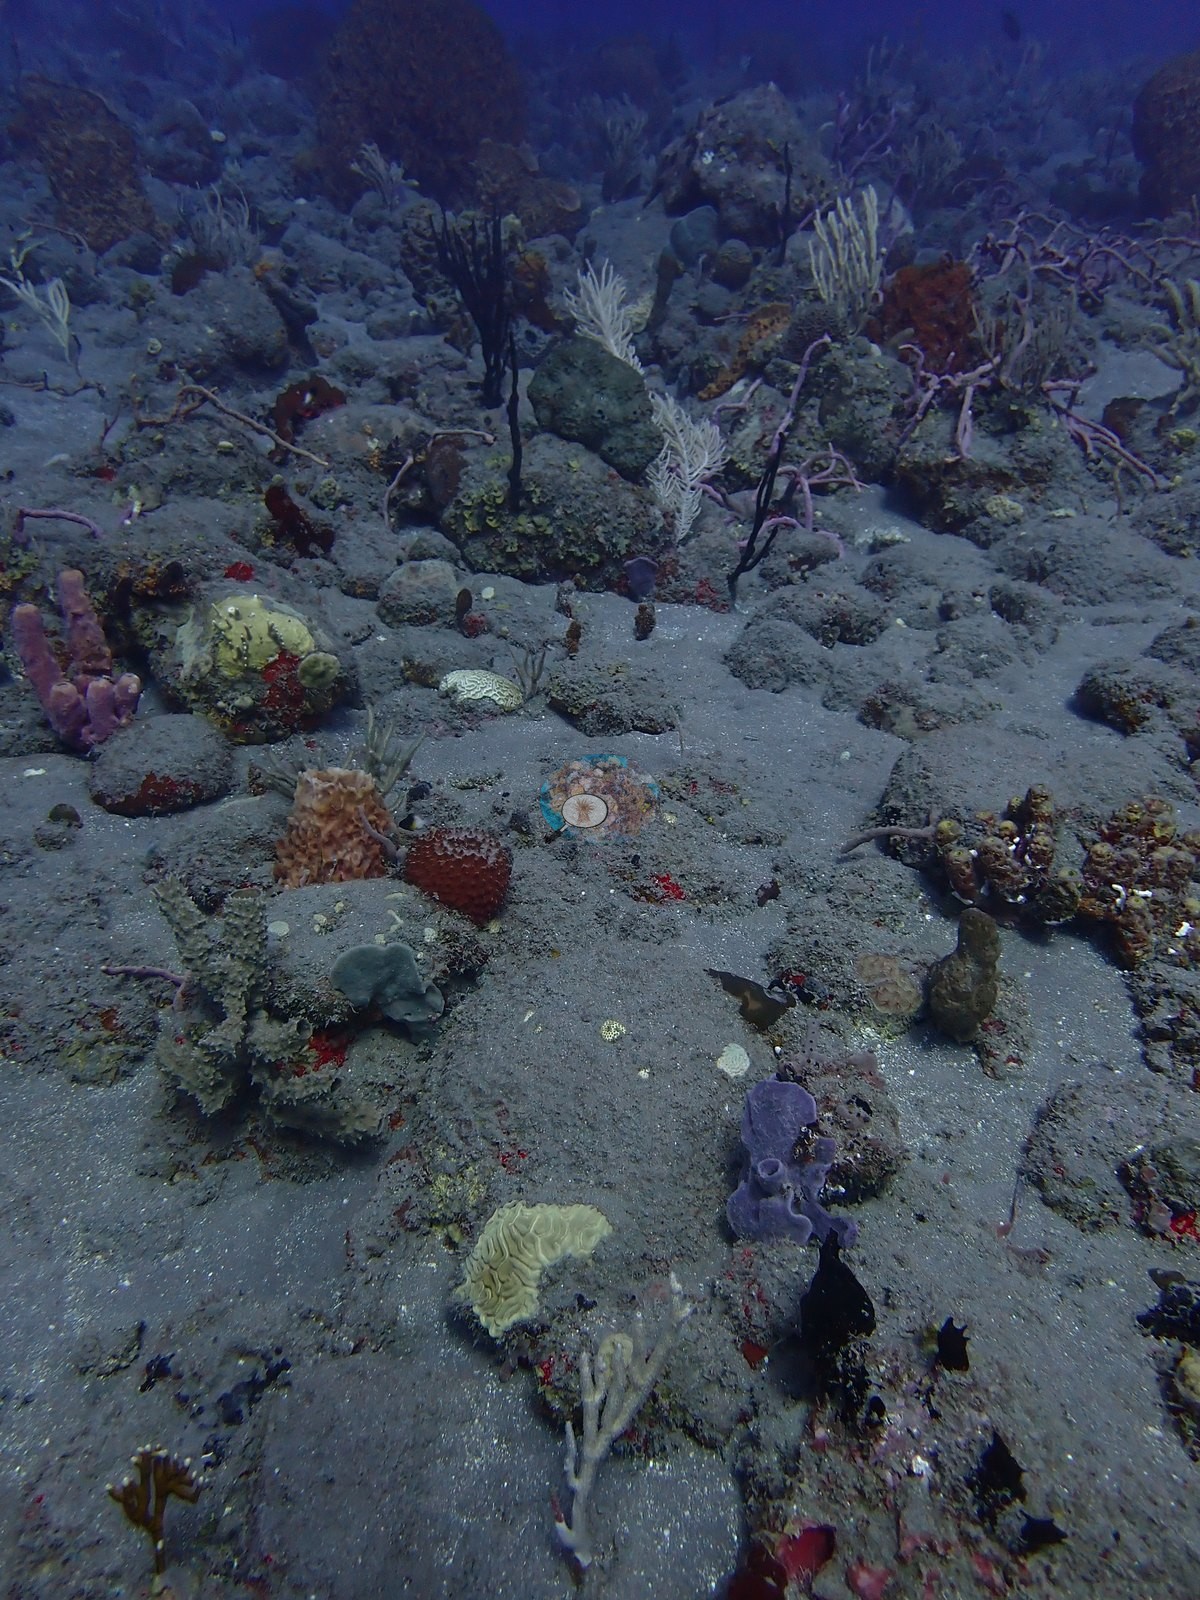
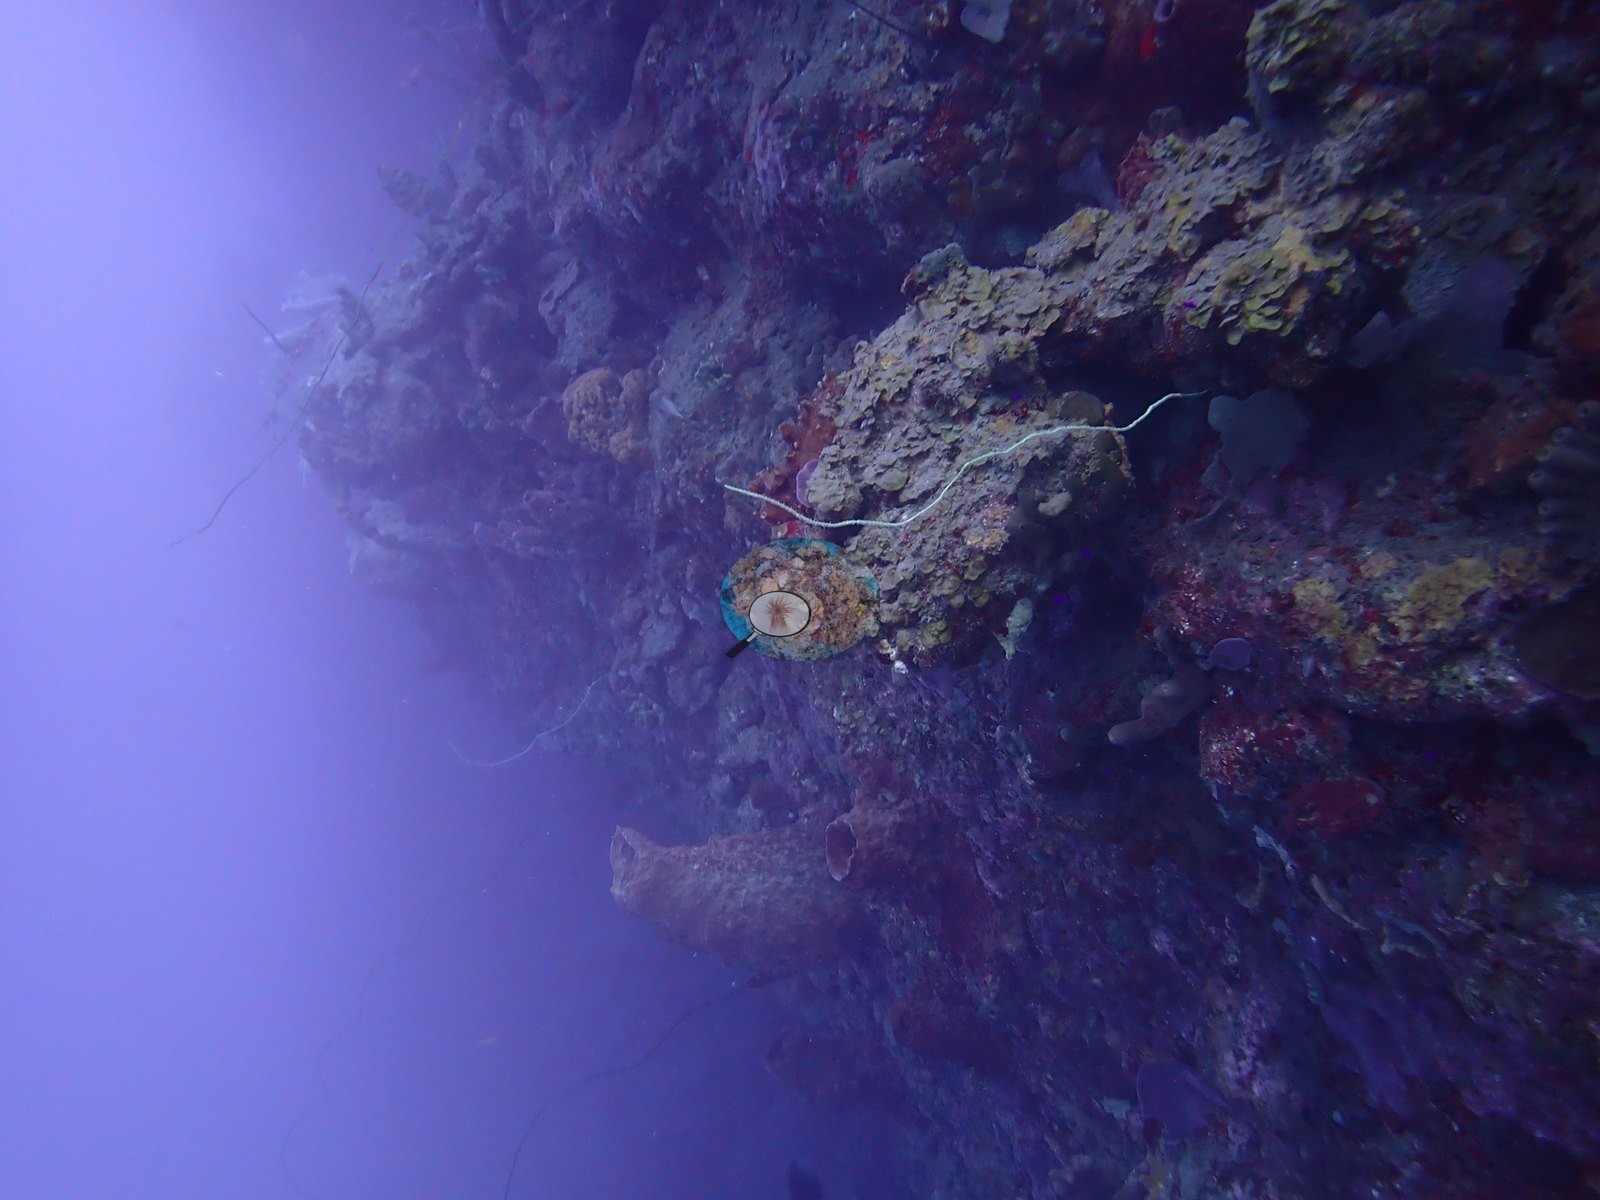
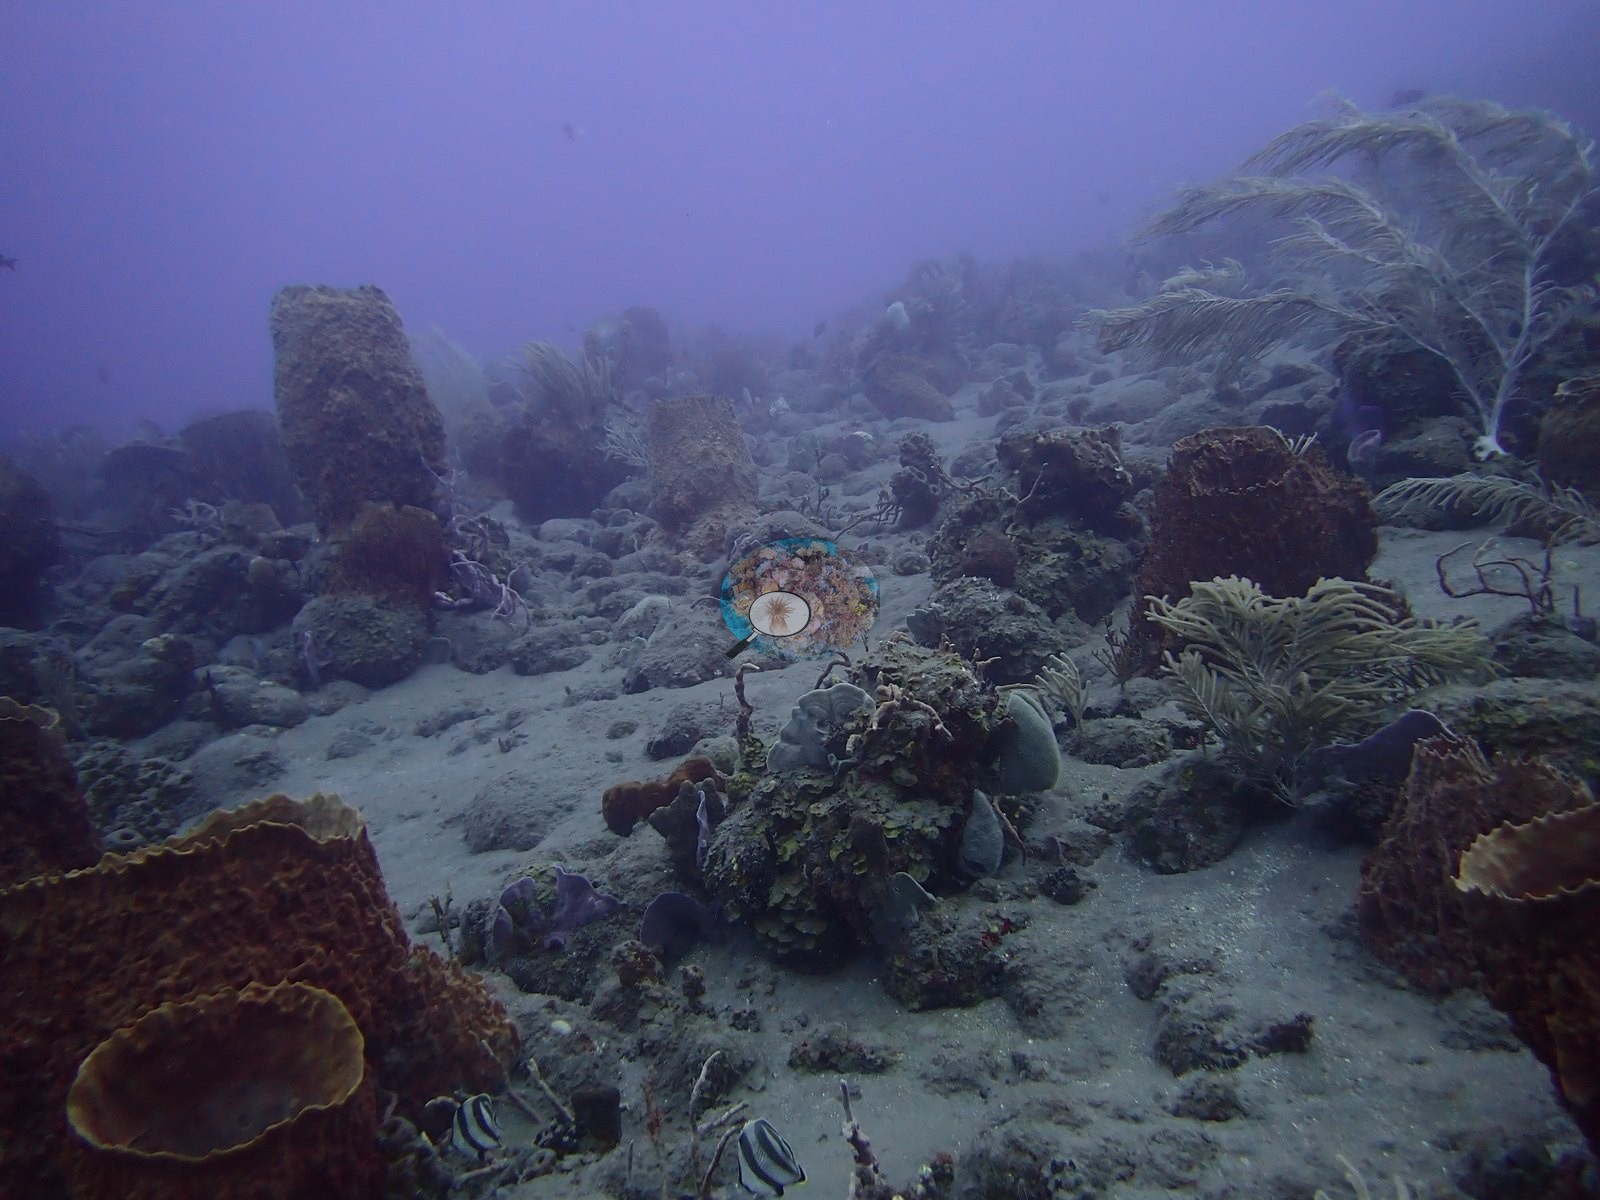
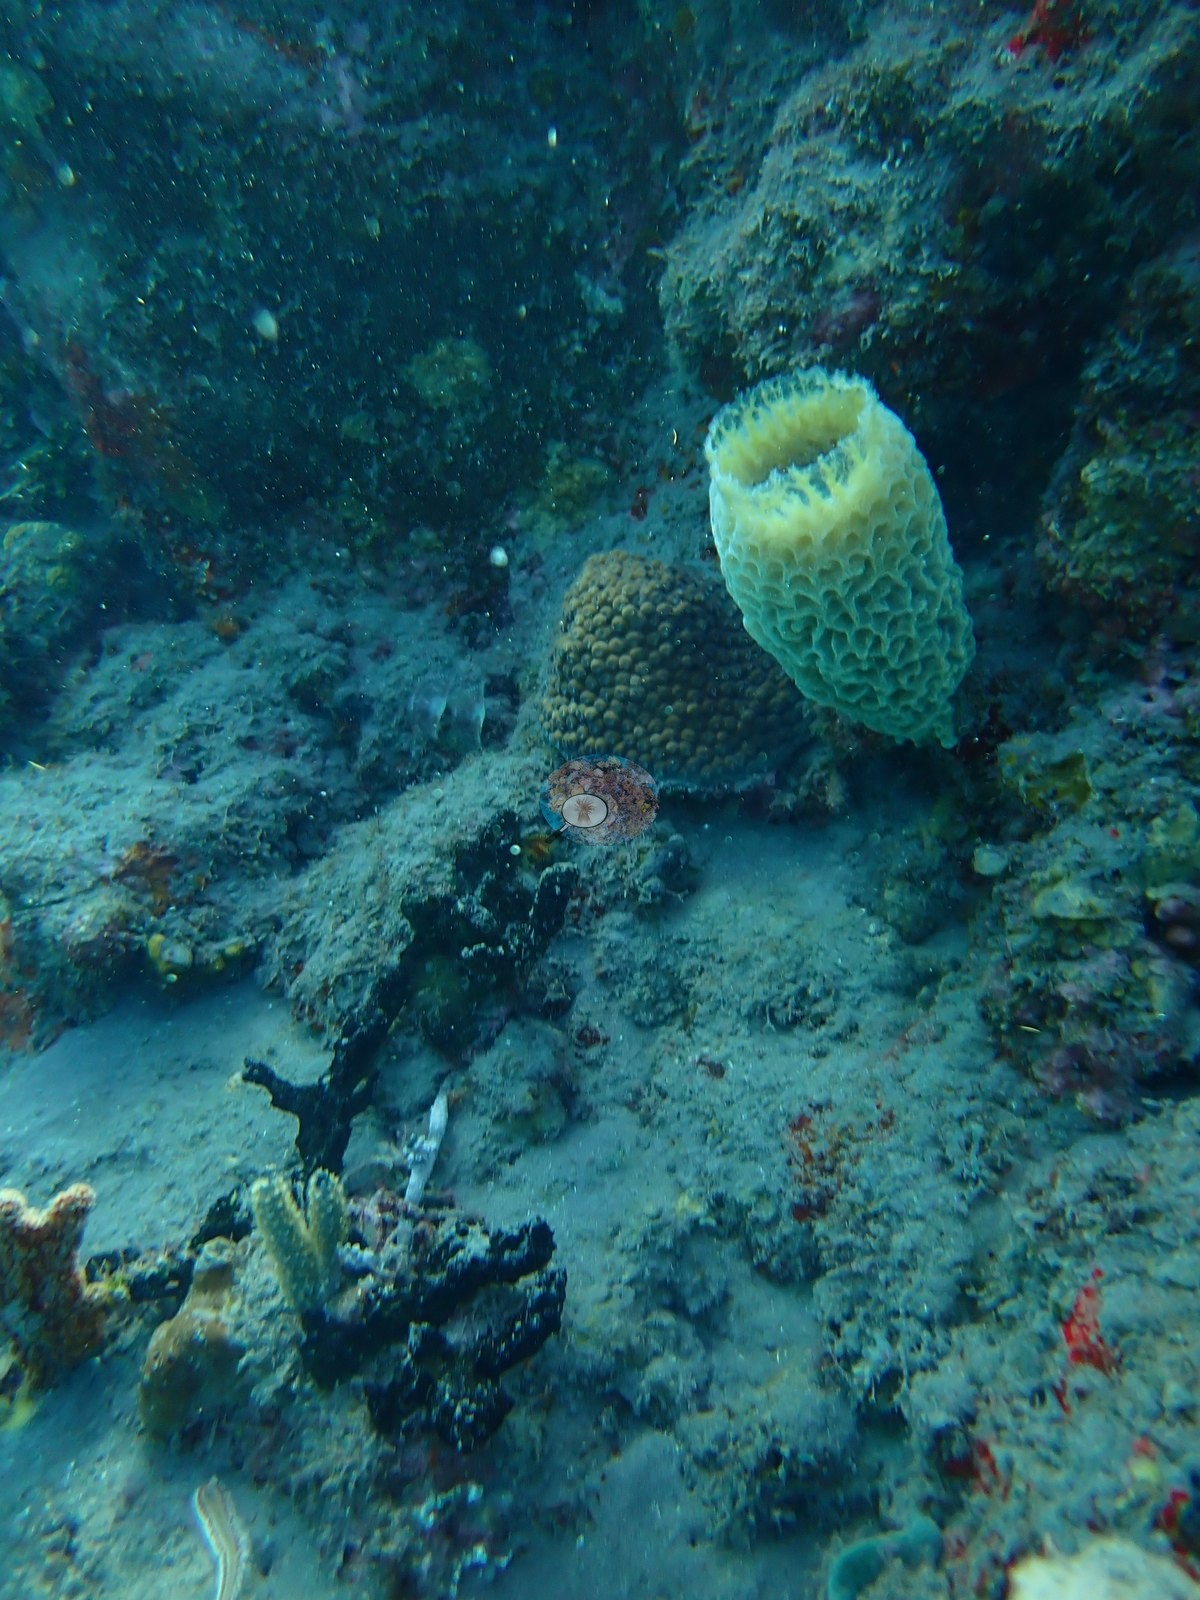
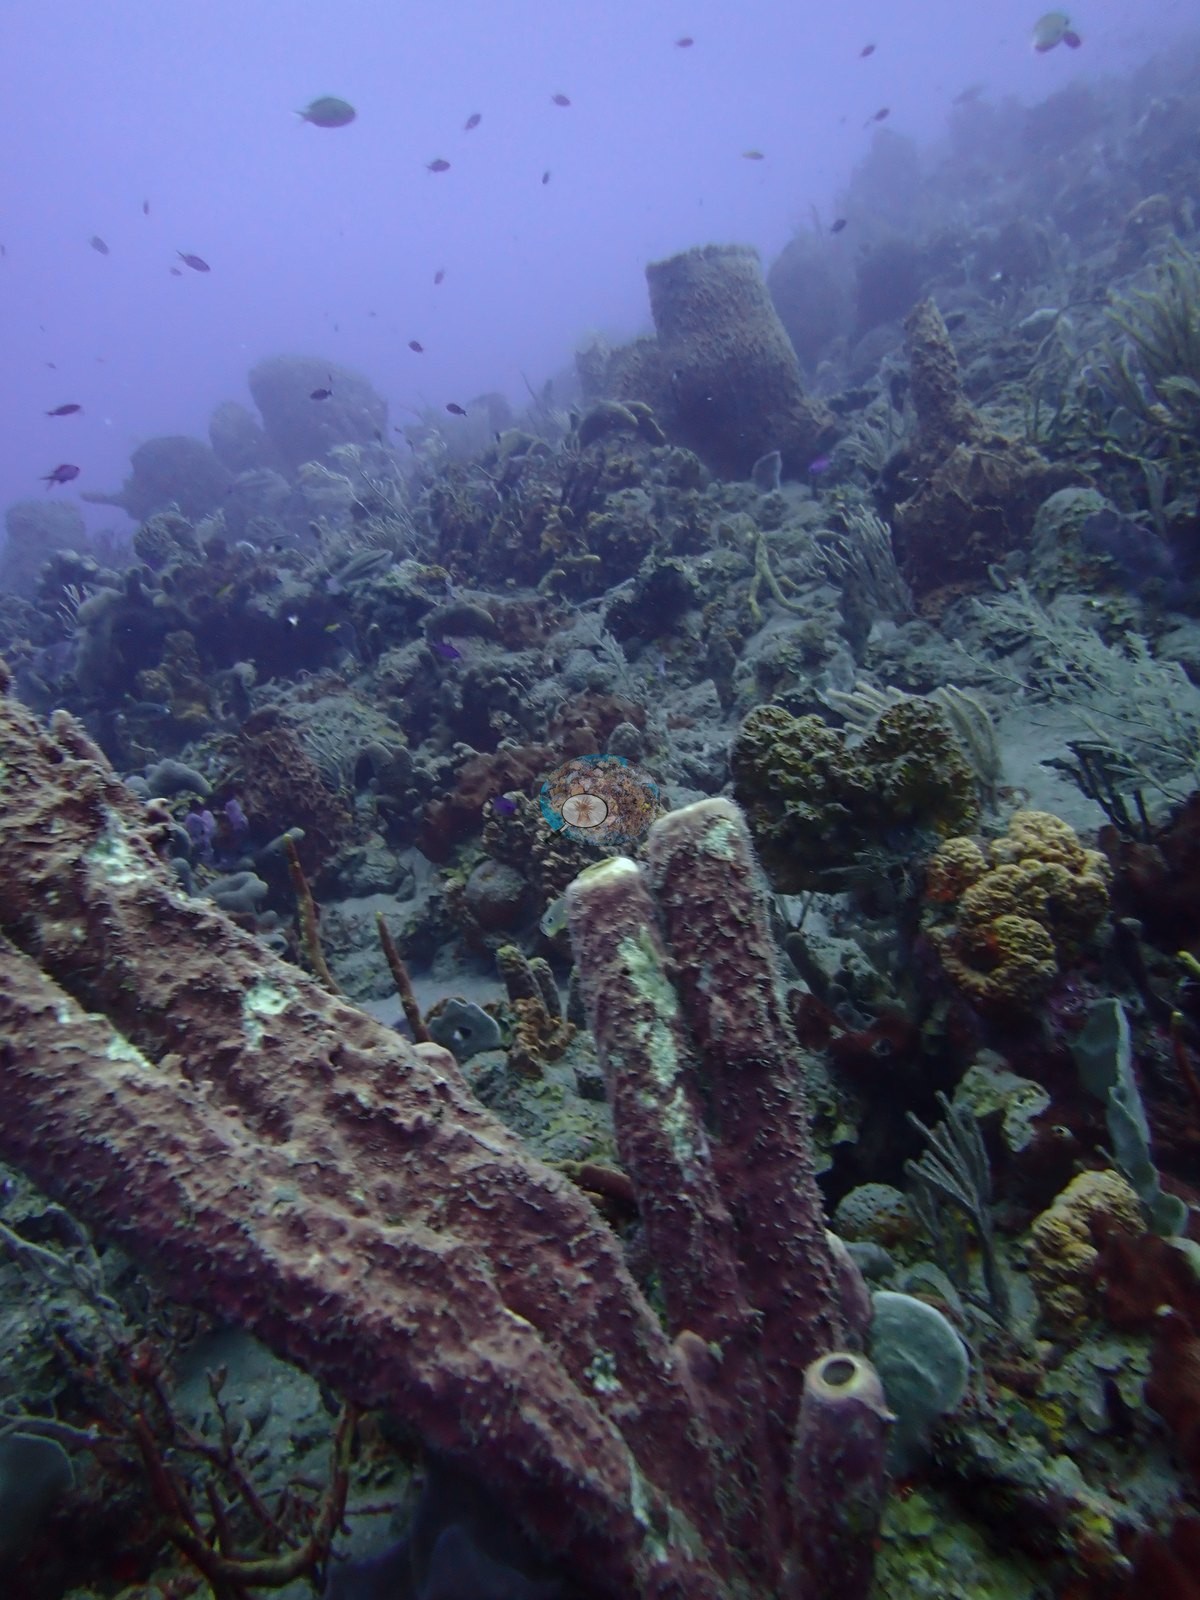
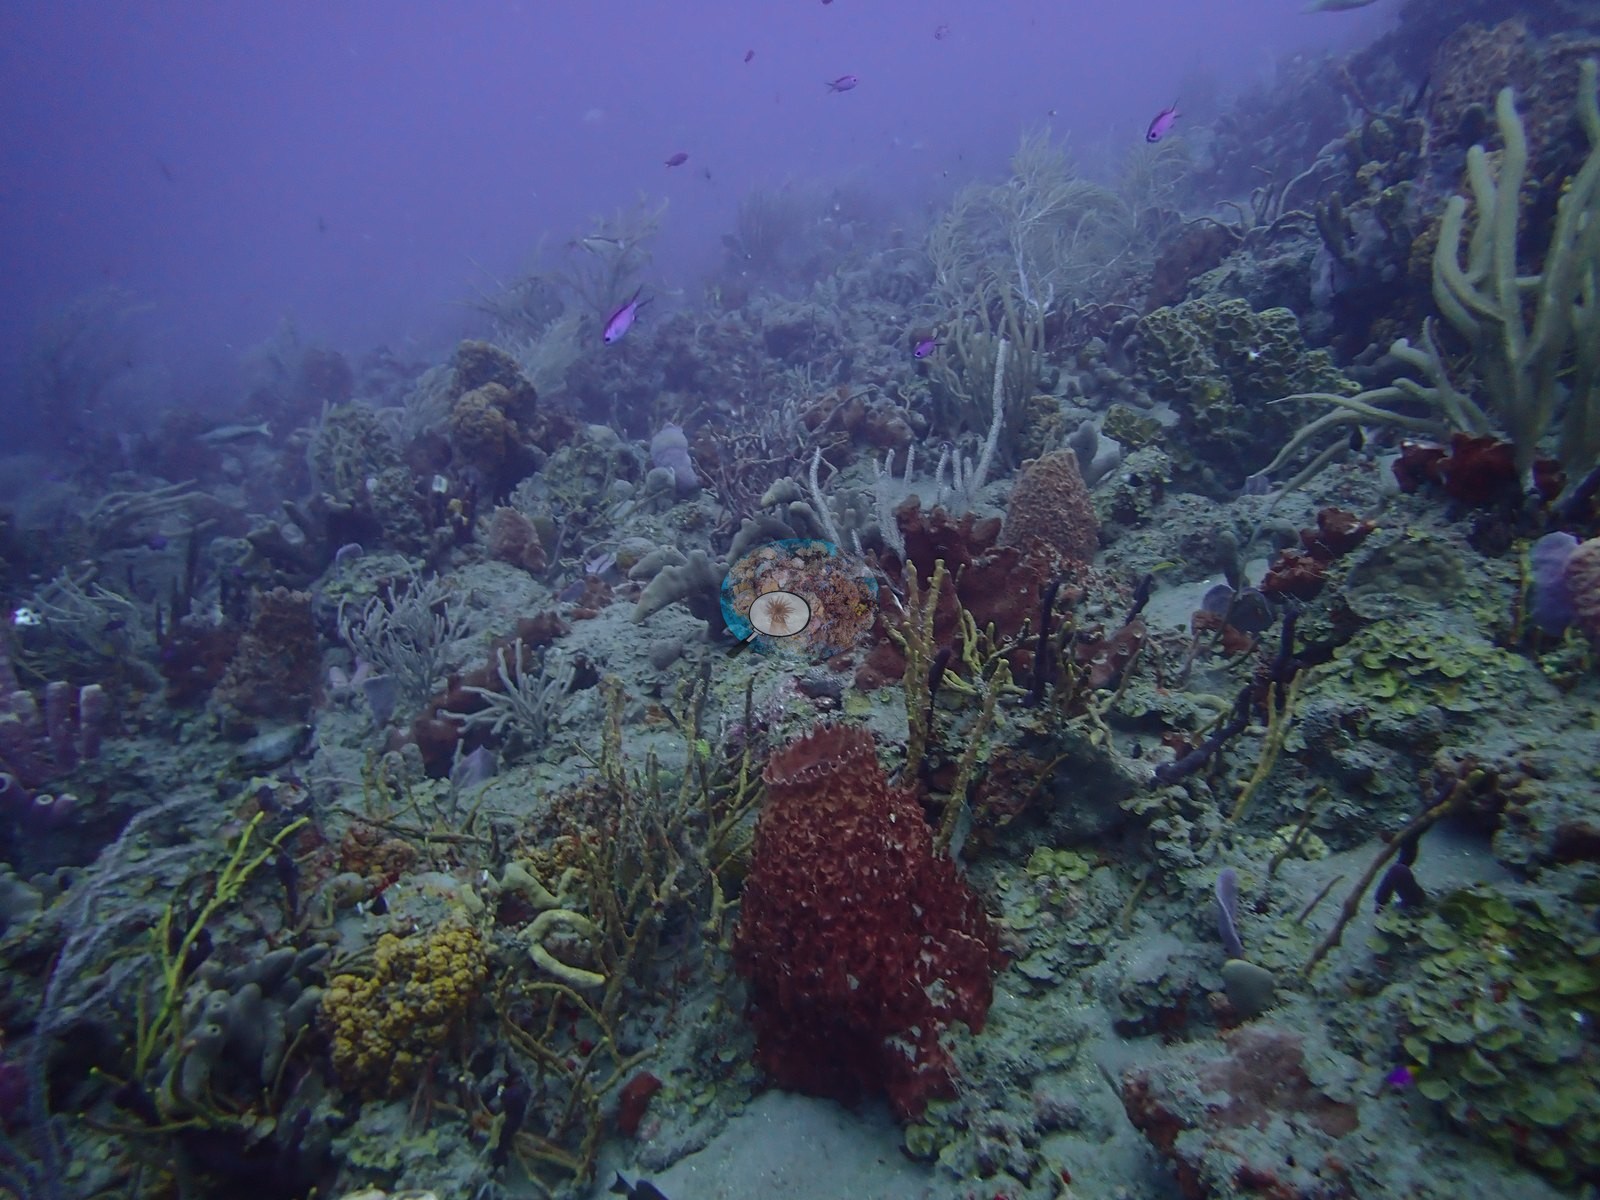
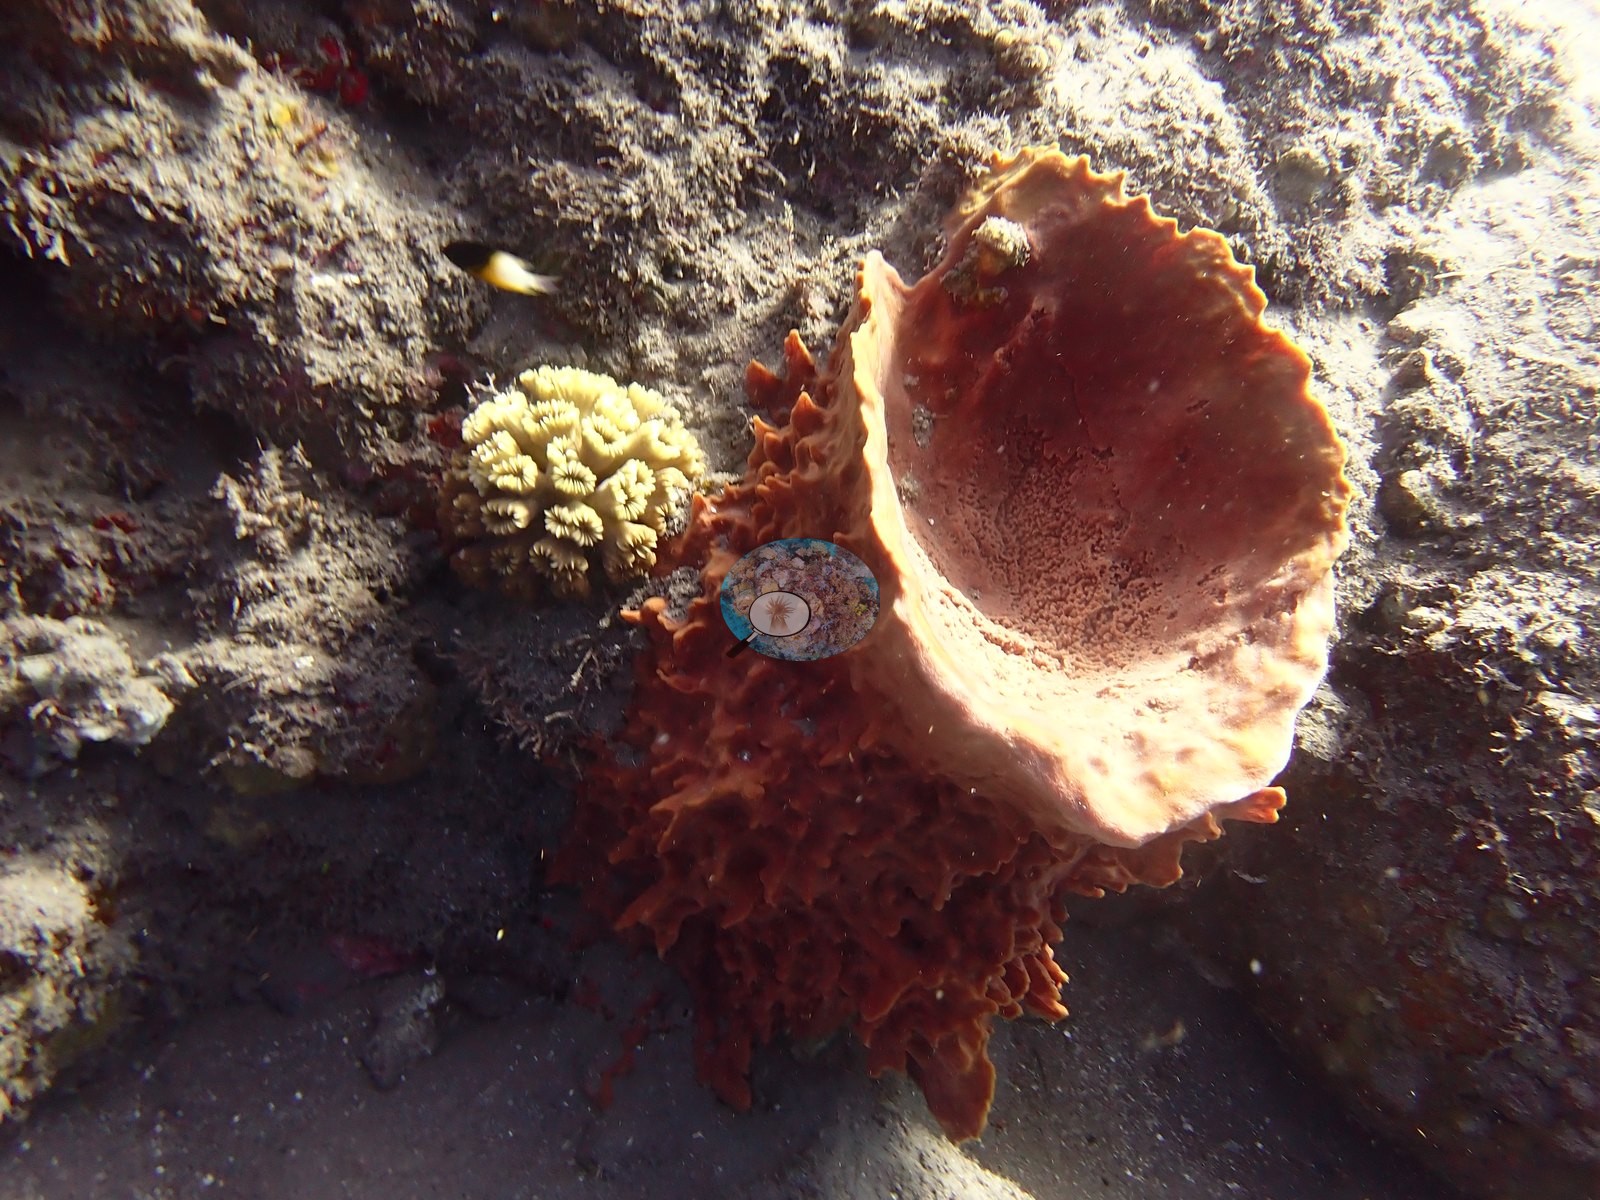
Sponges and gorgonians dominate. Barrel sponges (Xestospongia muta) appear in nearly every wide frame, salmon-pink to brick-red, some on the wall lip, with lavender and pink tube sponges, gray vase sponges, yellow encrusting sponges, black branching sponges, and red-brown excavating sponges (e.g., Image 13, Image 39, Image 42, Image 51).
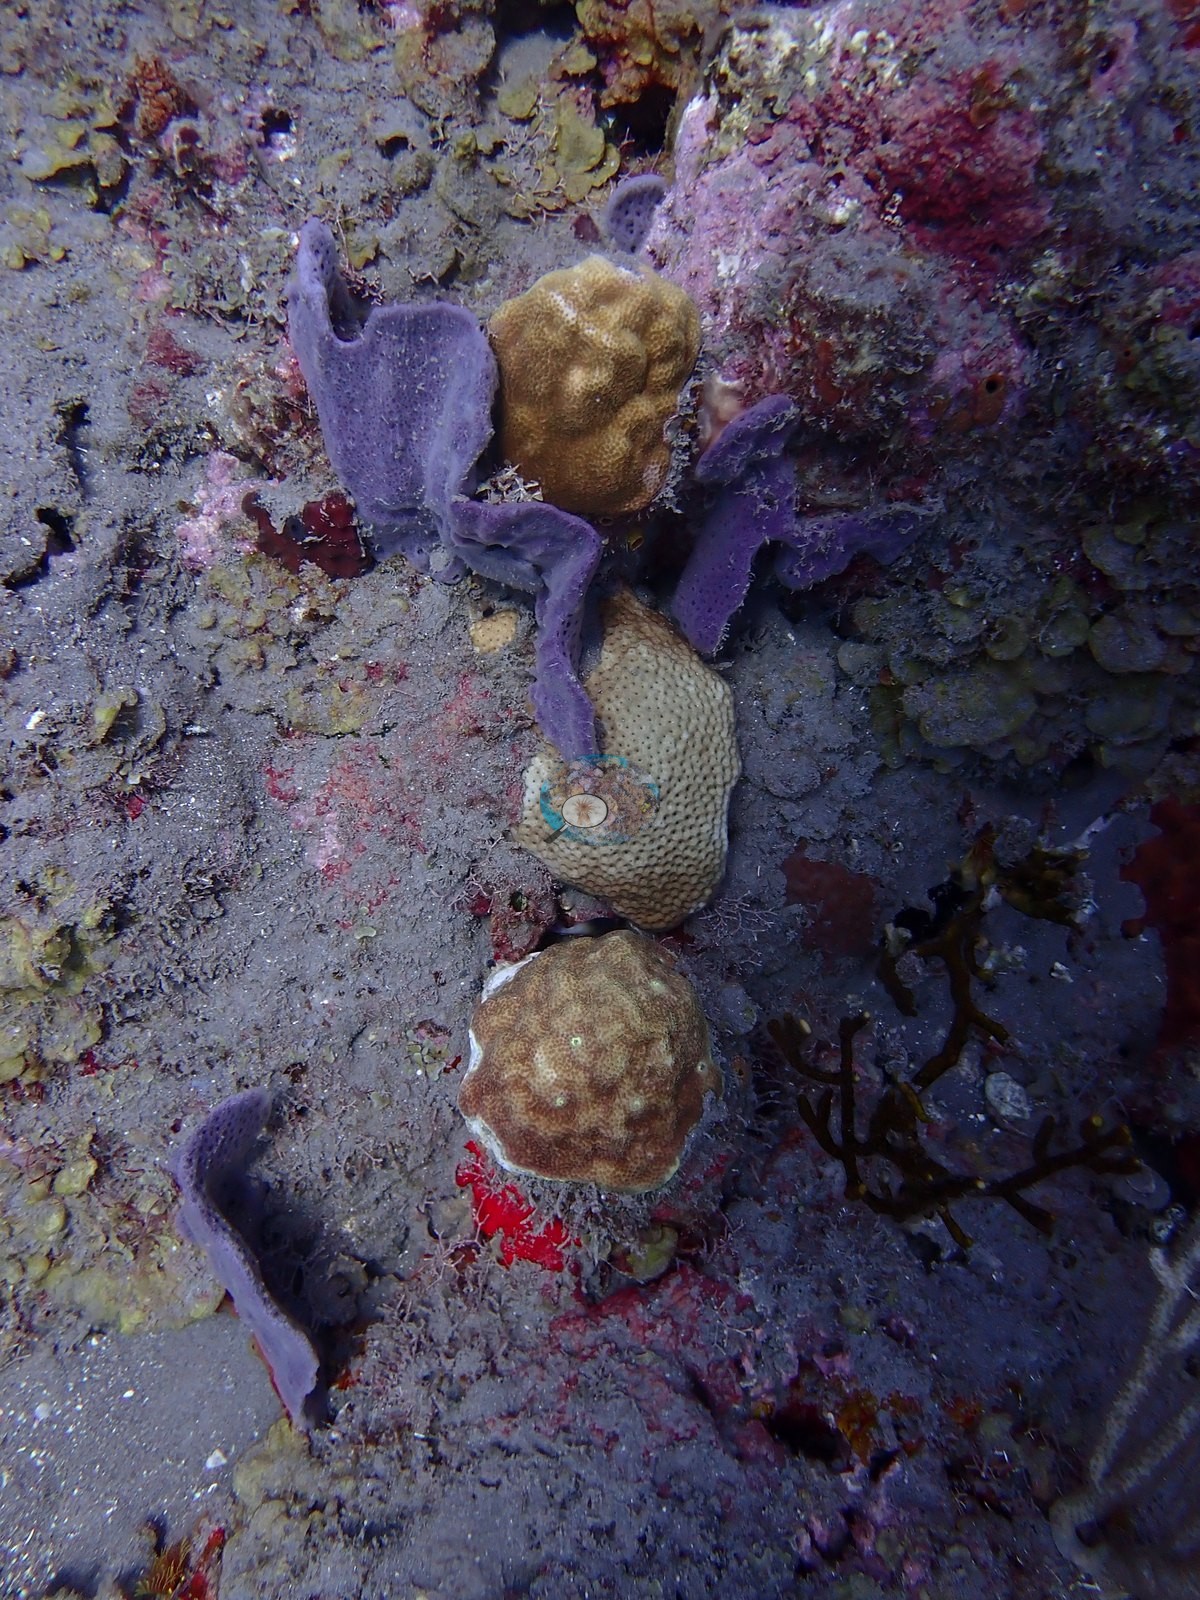
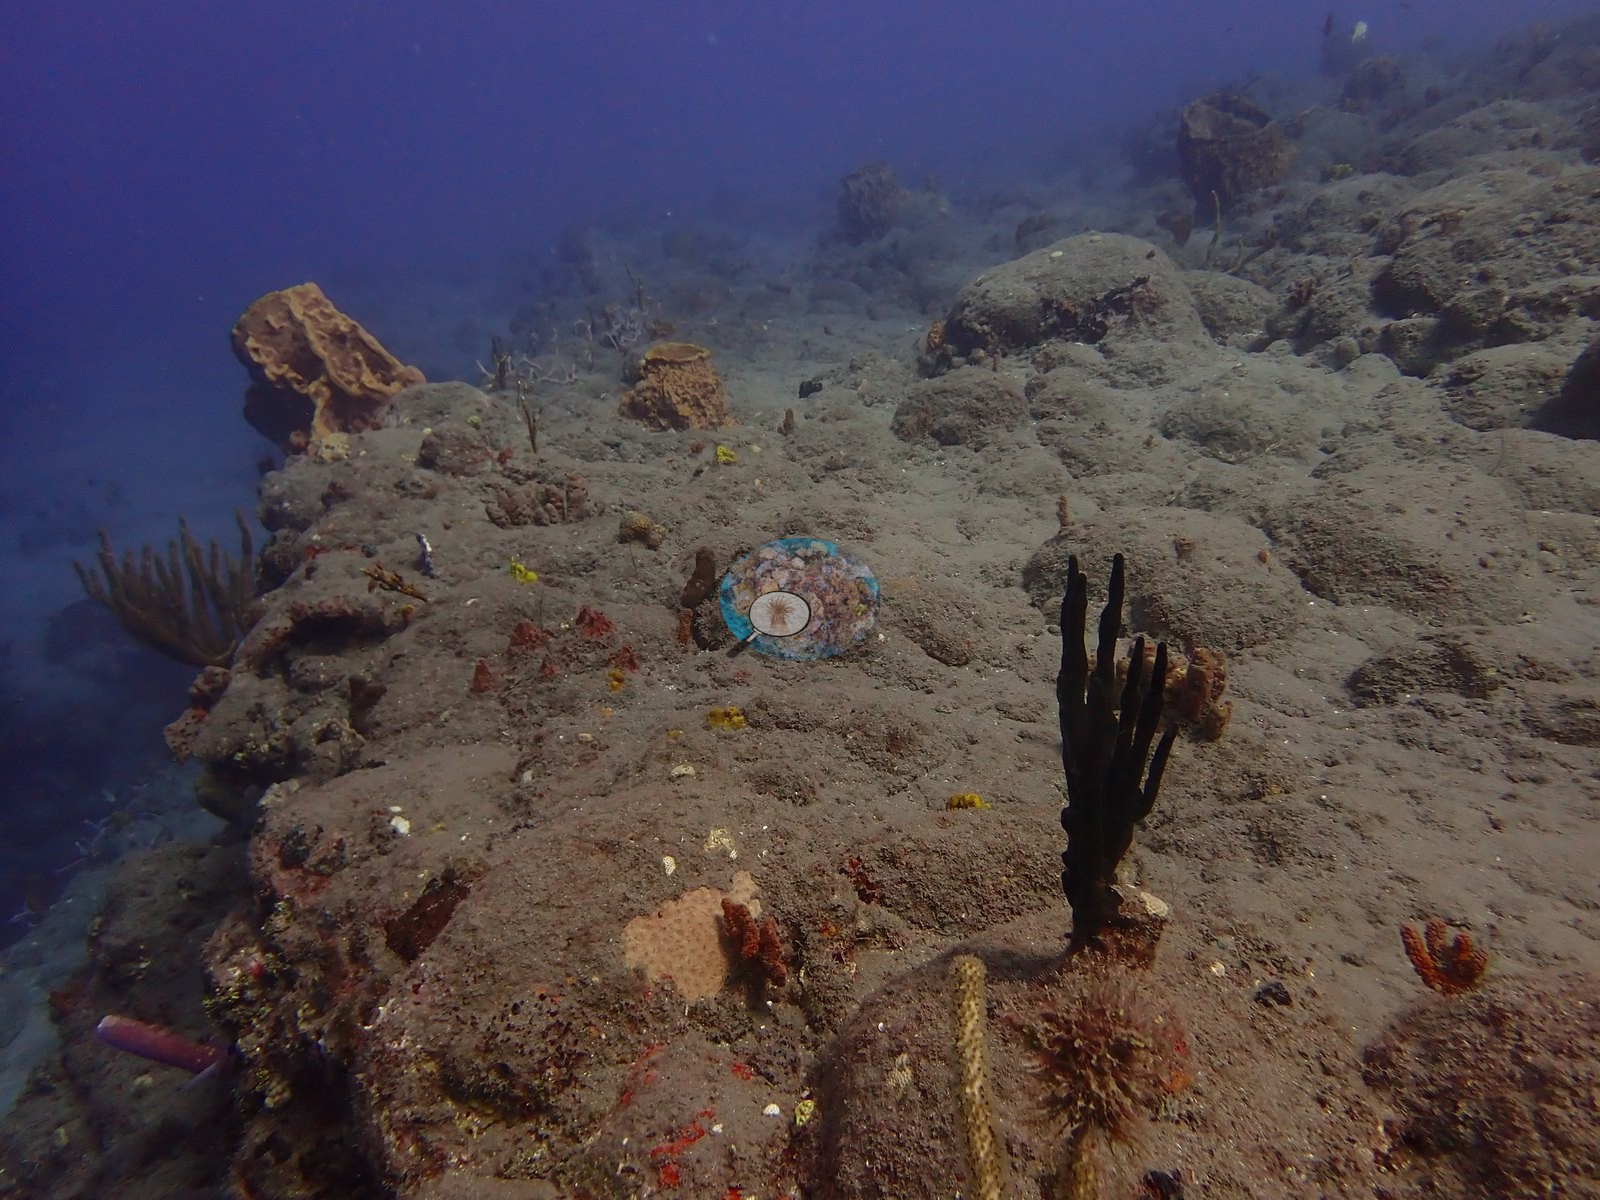
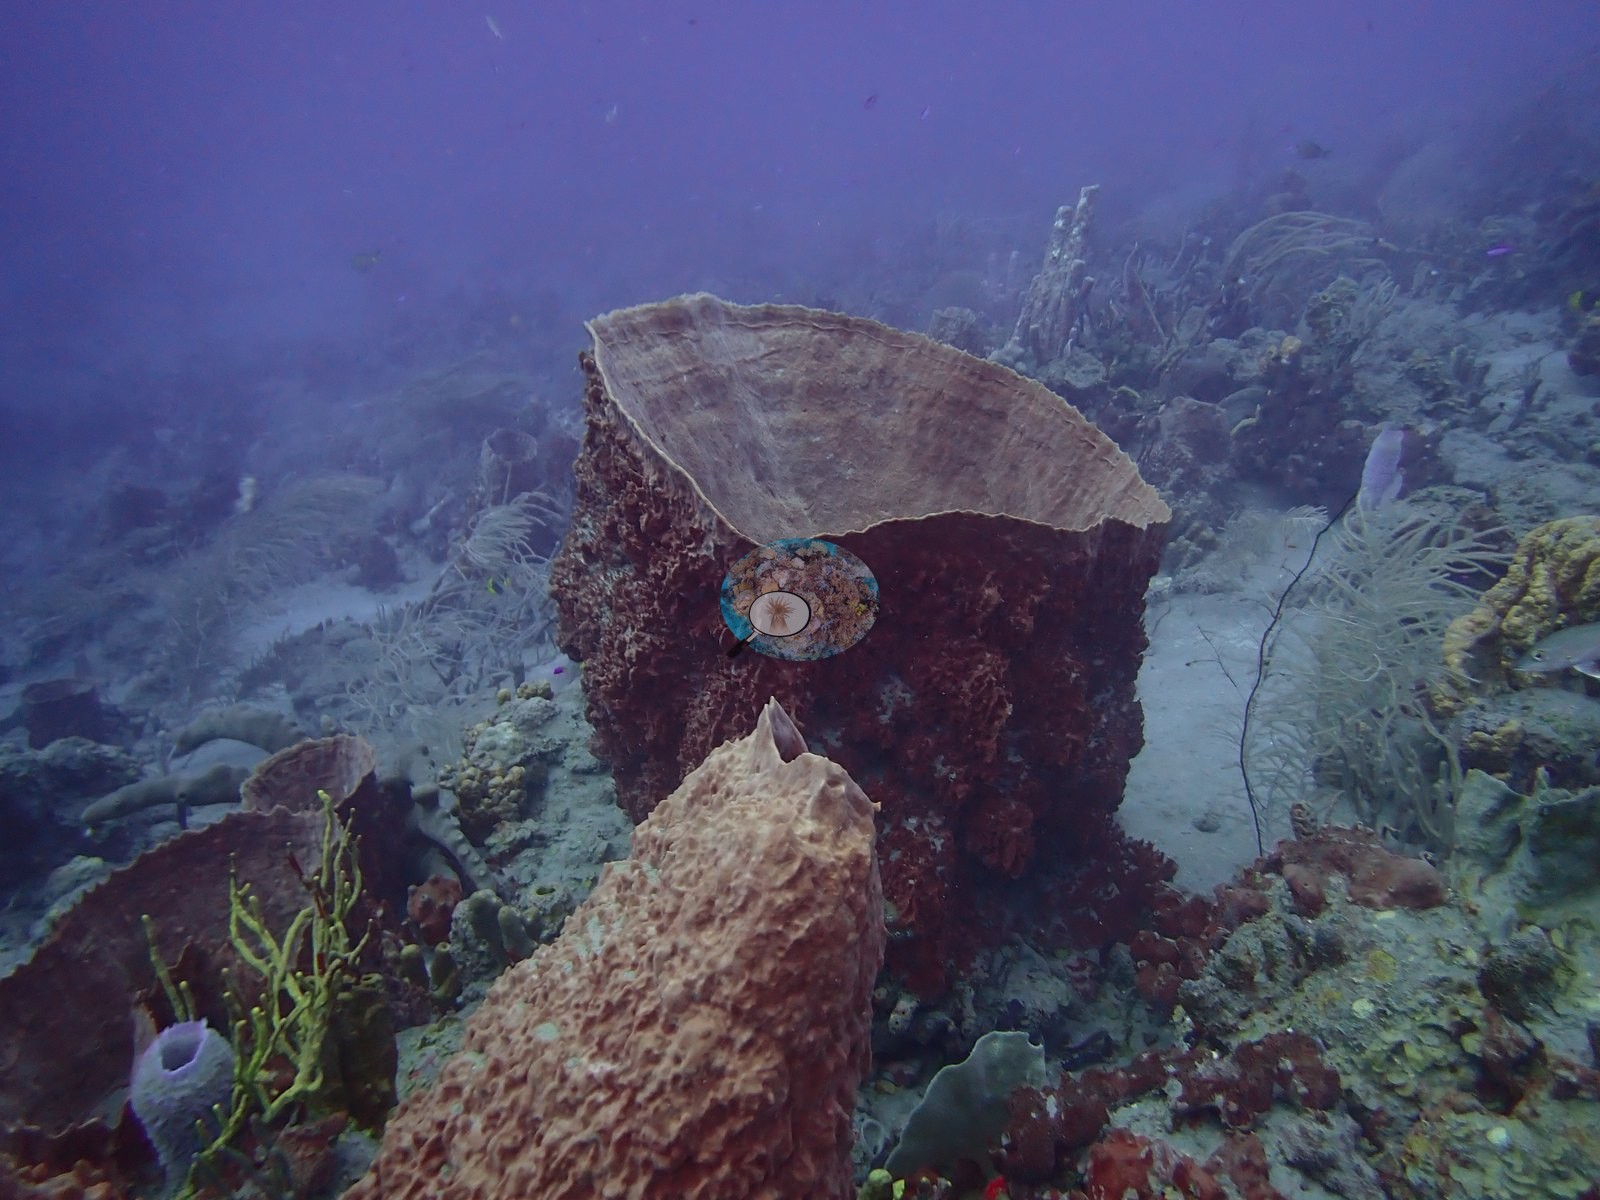
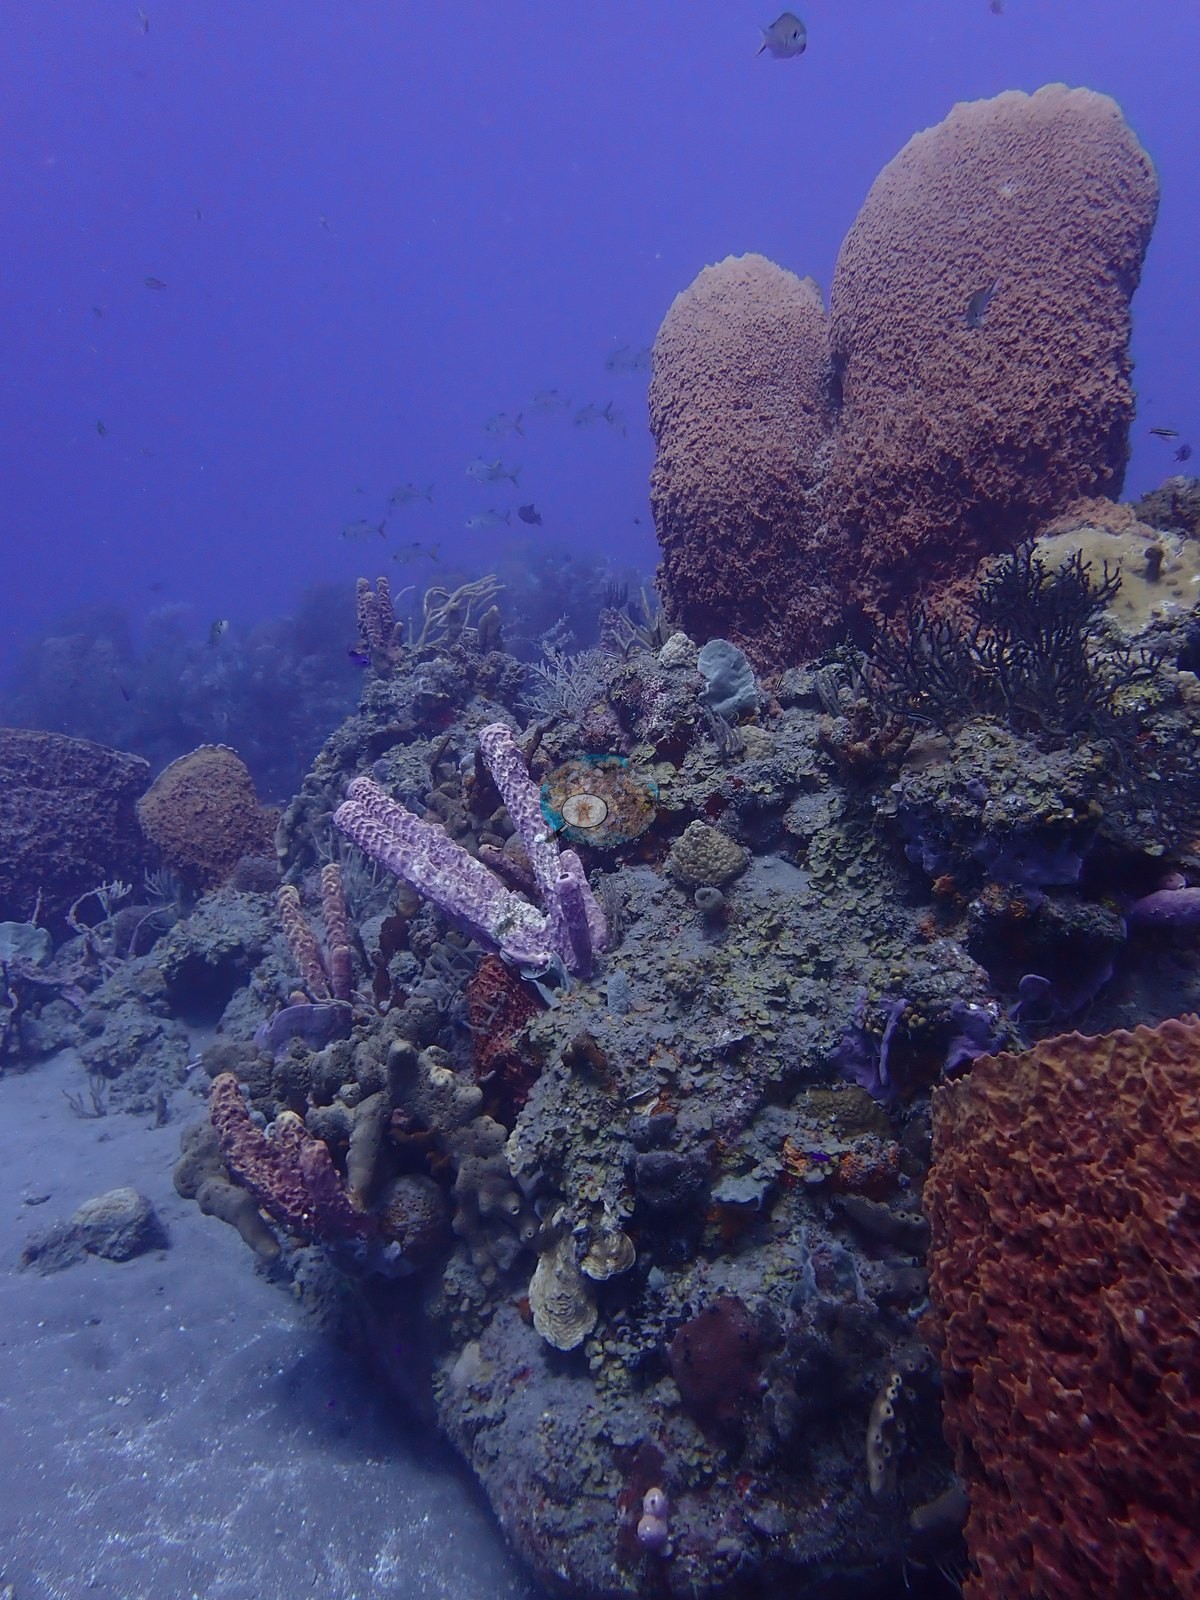
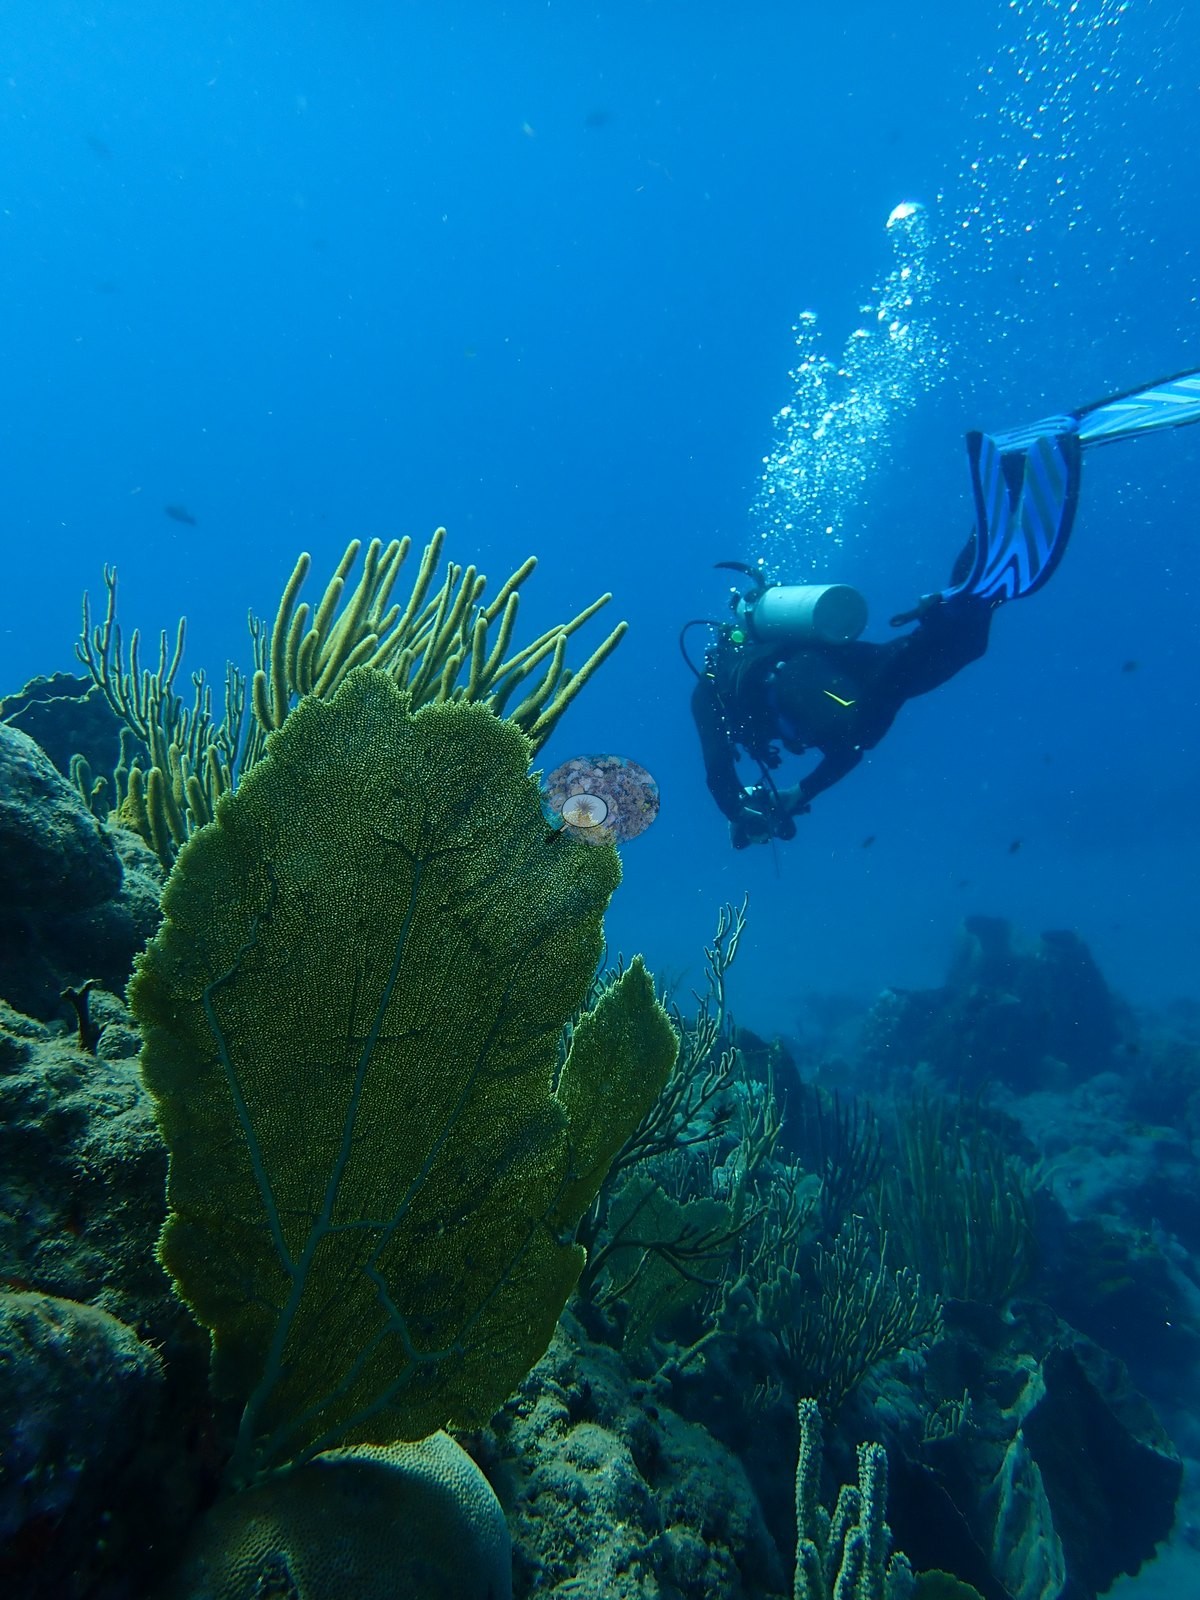
Gorgonians include sea fans (Gorgonia), sea plumes bent over in current, sea rods, knobby golden colonies, and a free-hanging wire coral on the wall (e.g., Image 12, Image 15, Image 16).
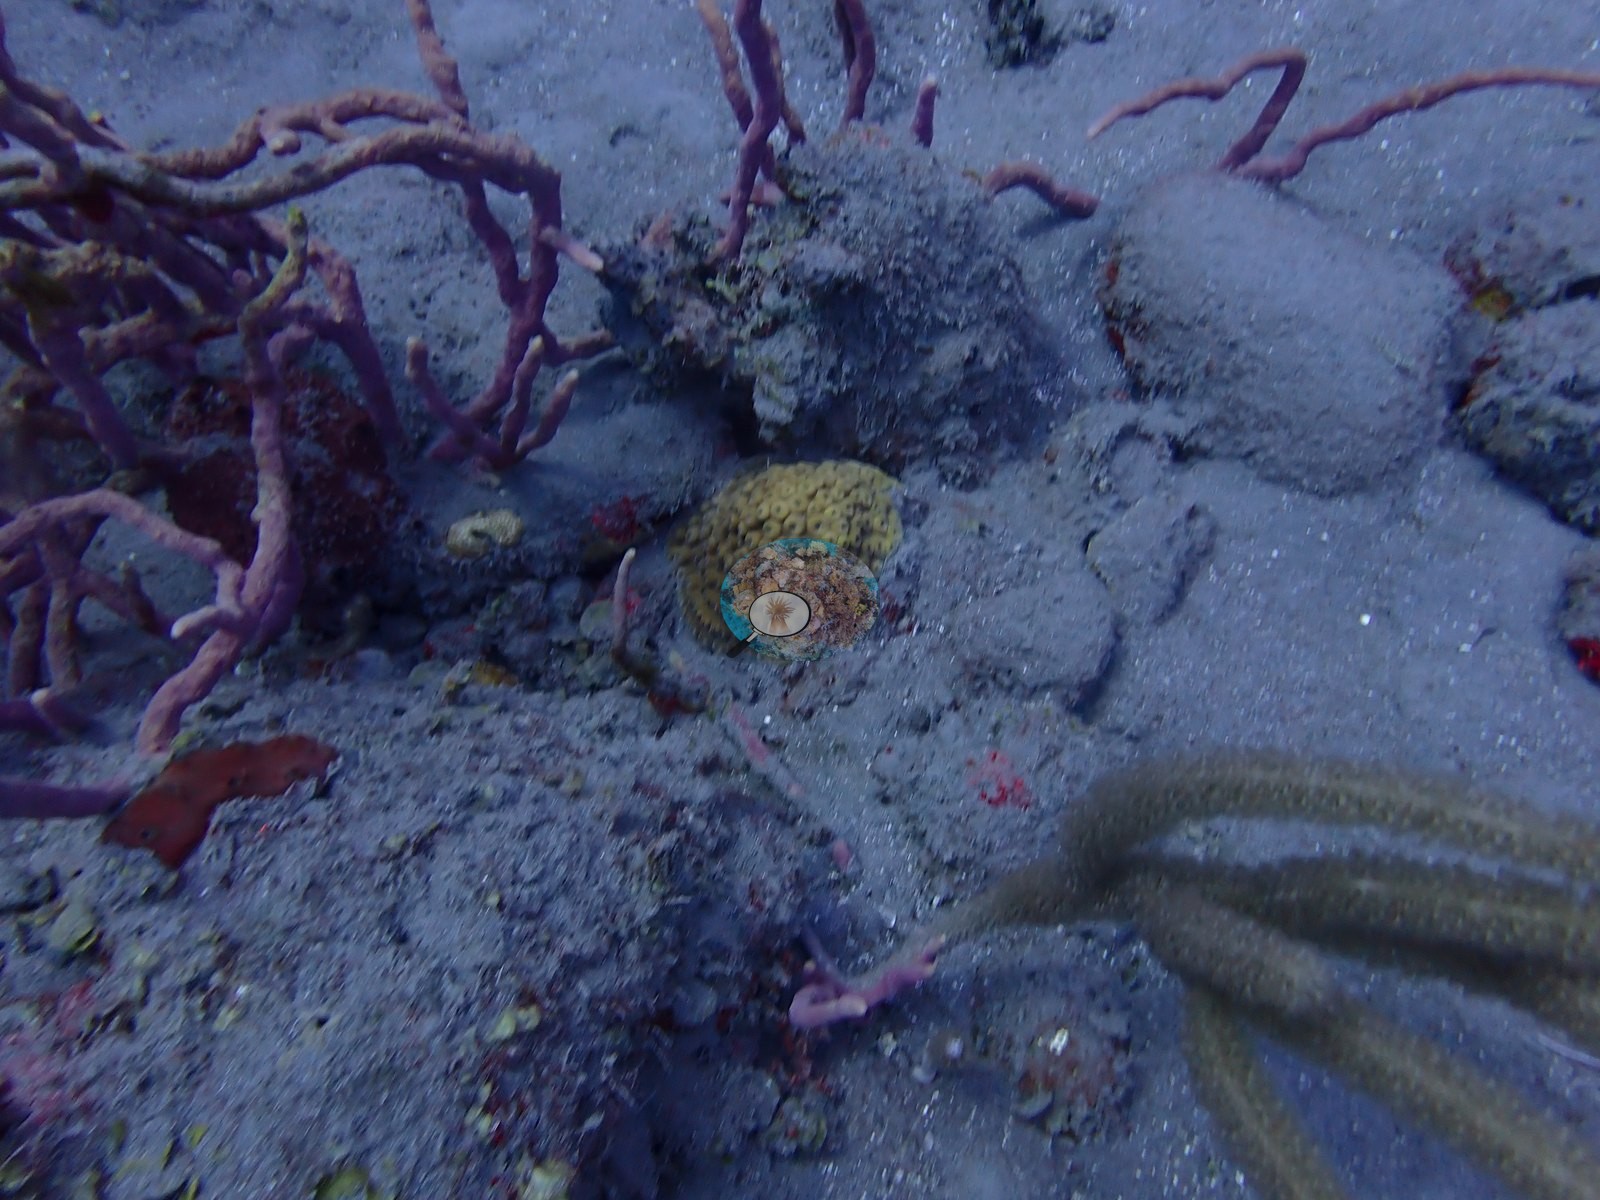
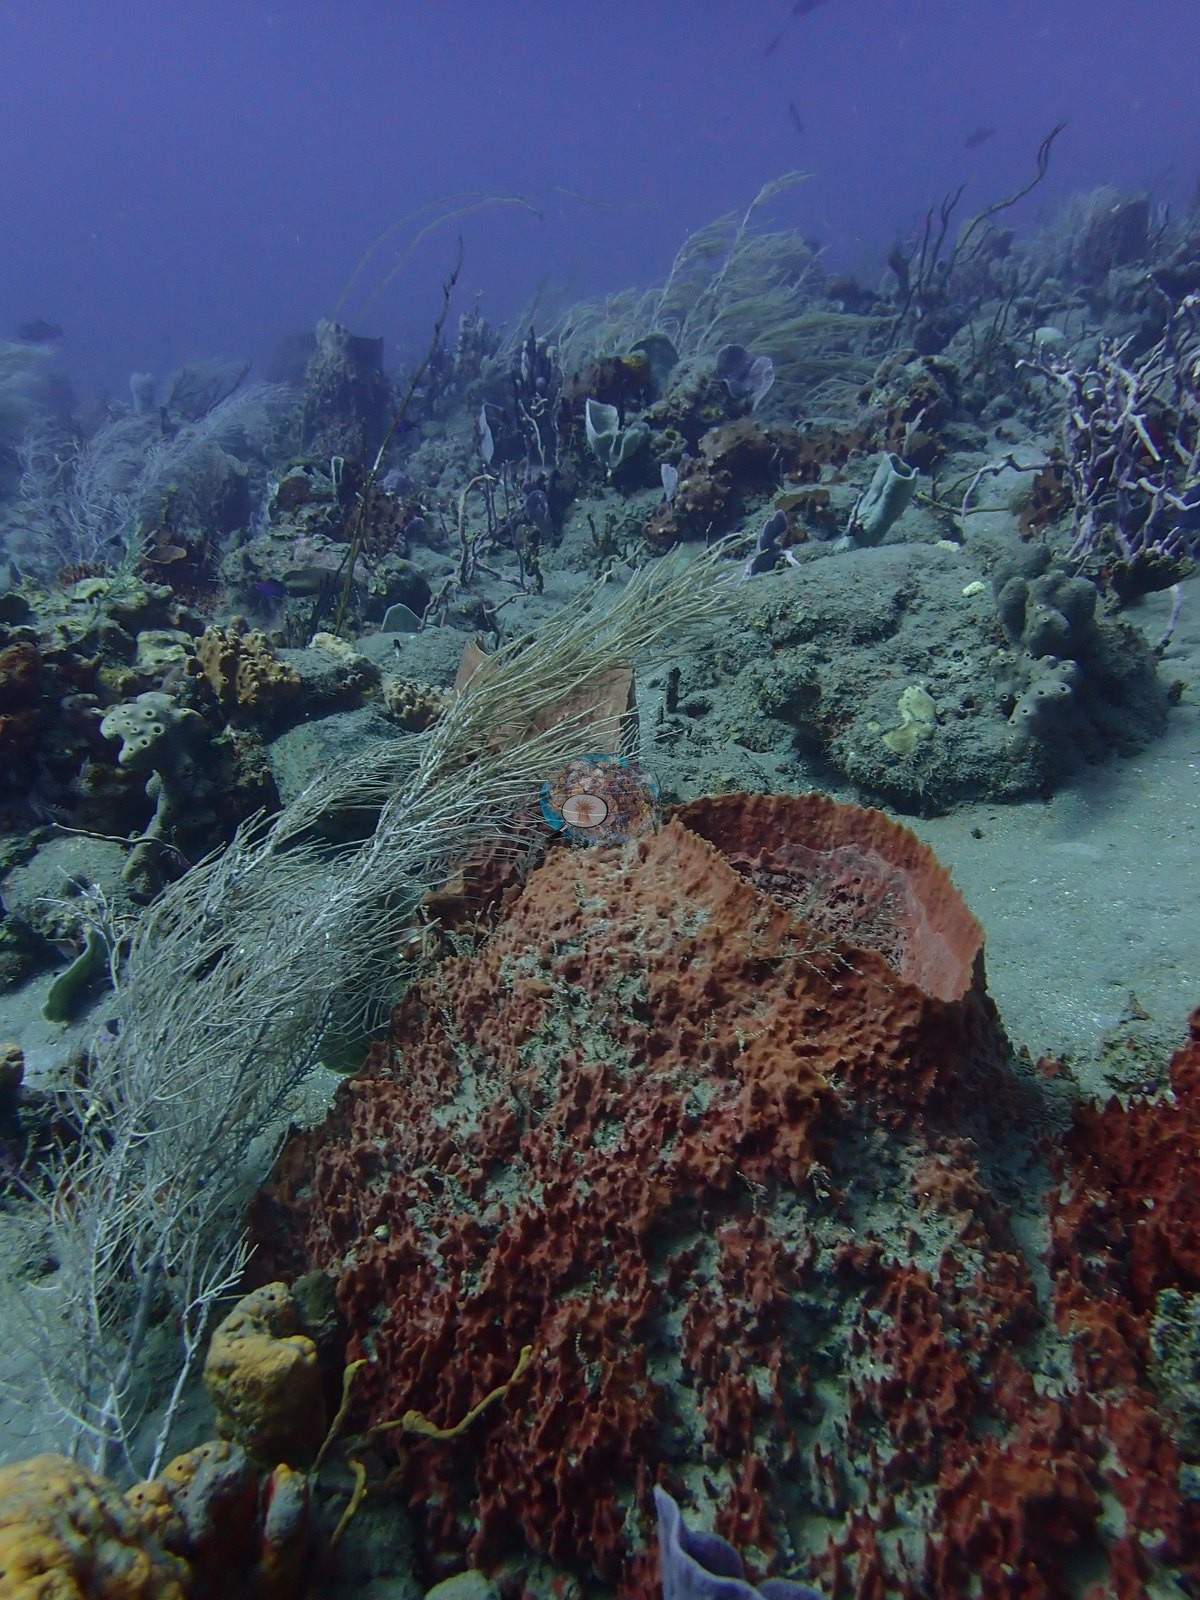
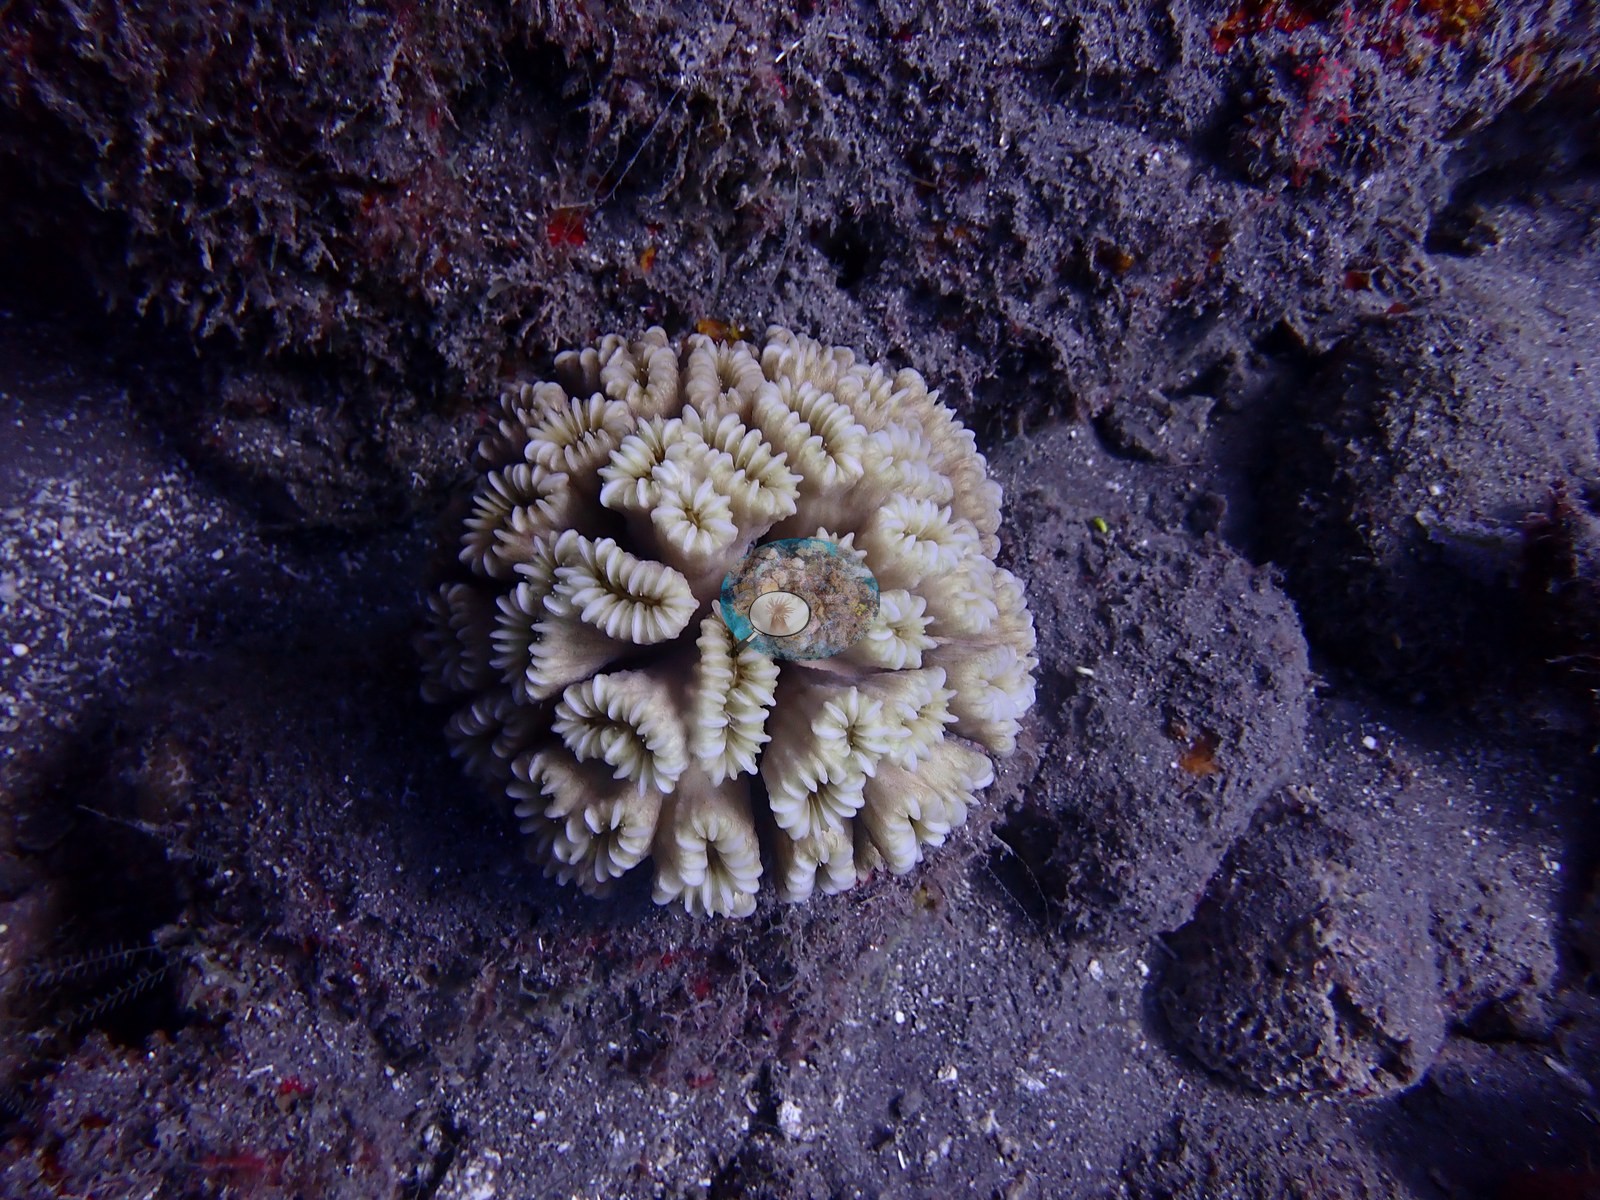
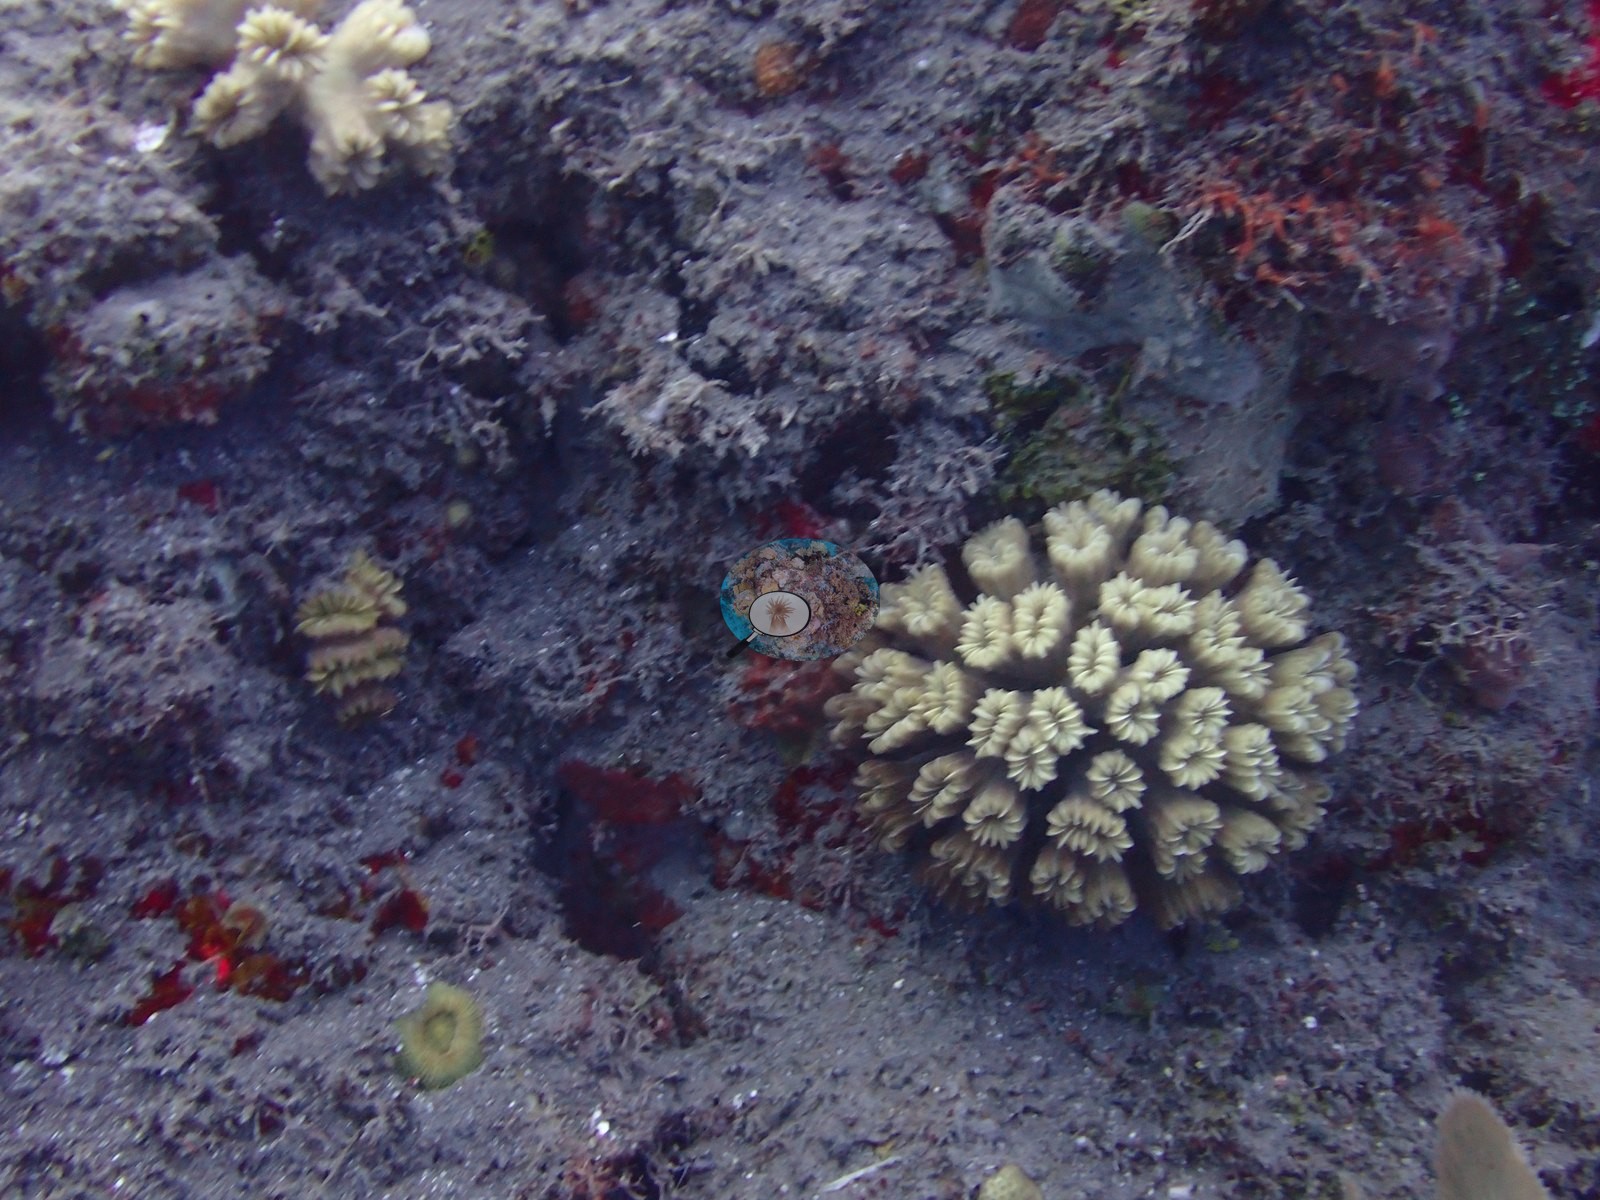
Stony coral is sparse and small-colony. Most photographed is smooth flower coral (Eusmilia fastigiata): at least eight colonies with fluted corallites, mostly cream to near-white and holding tan pigment only basally, reading as paling rather than full health (e.g., Image 4, Image 21, Image 38).
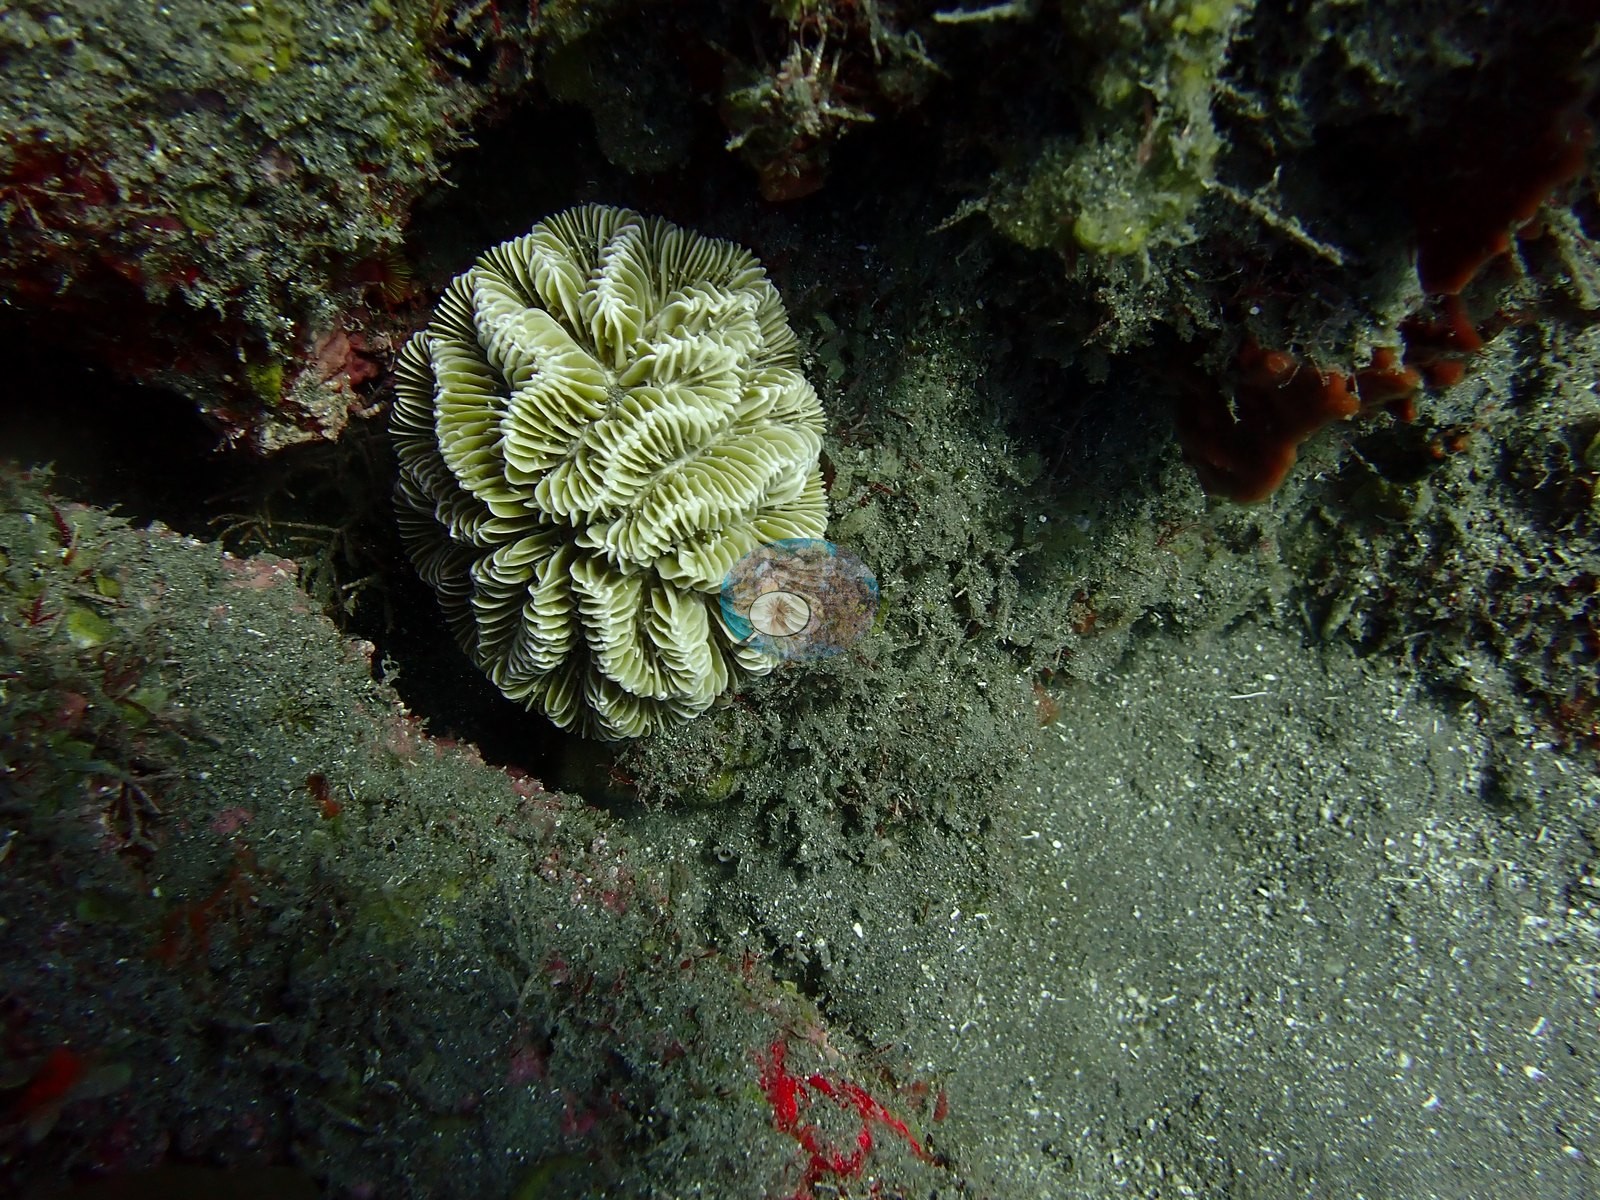
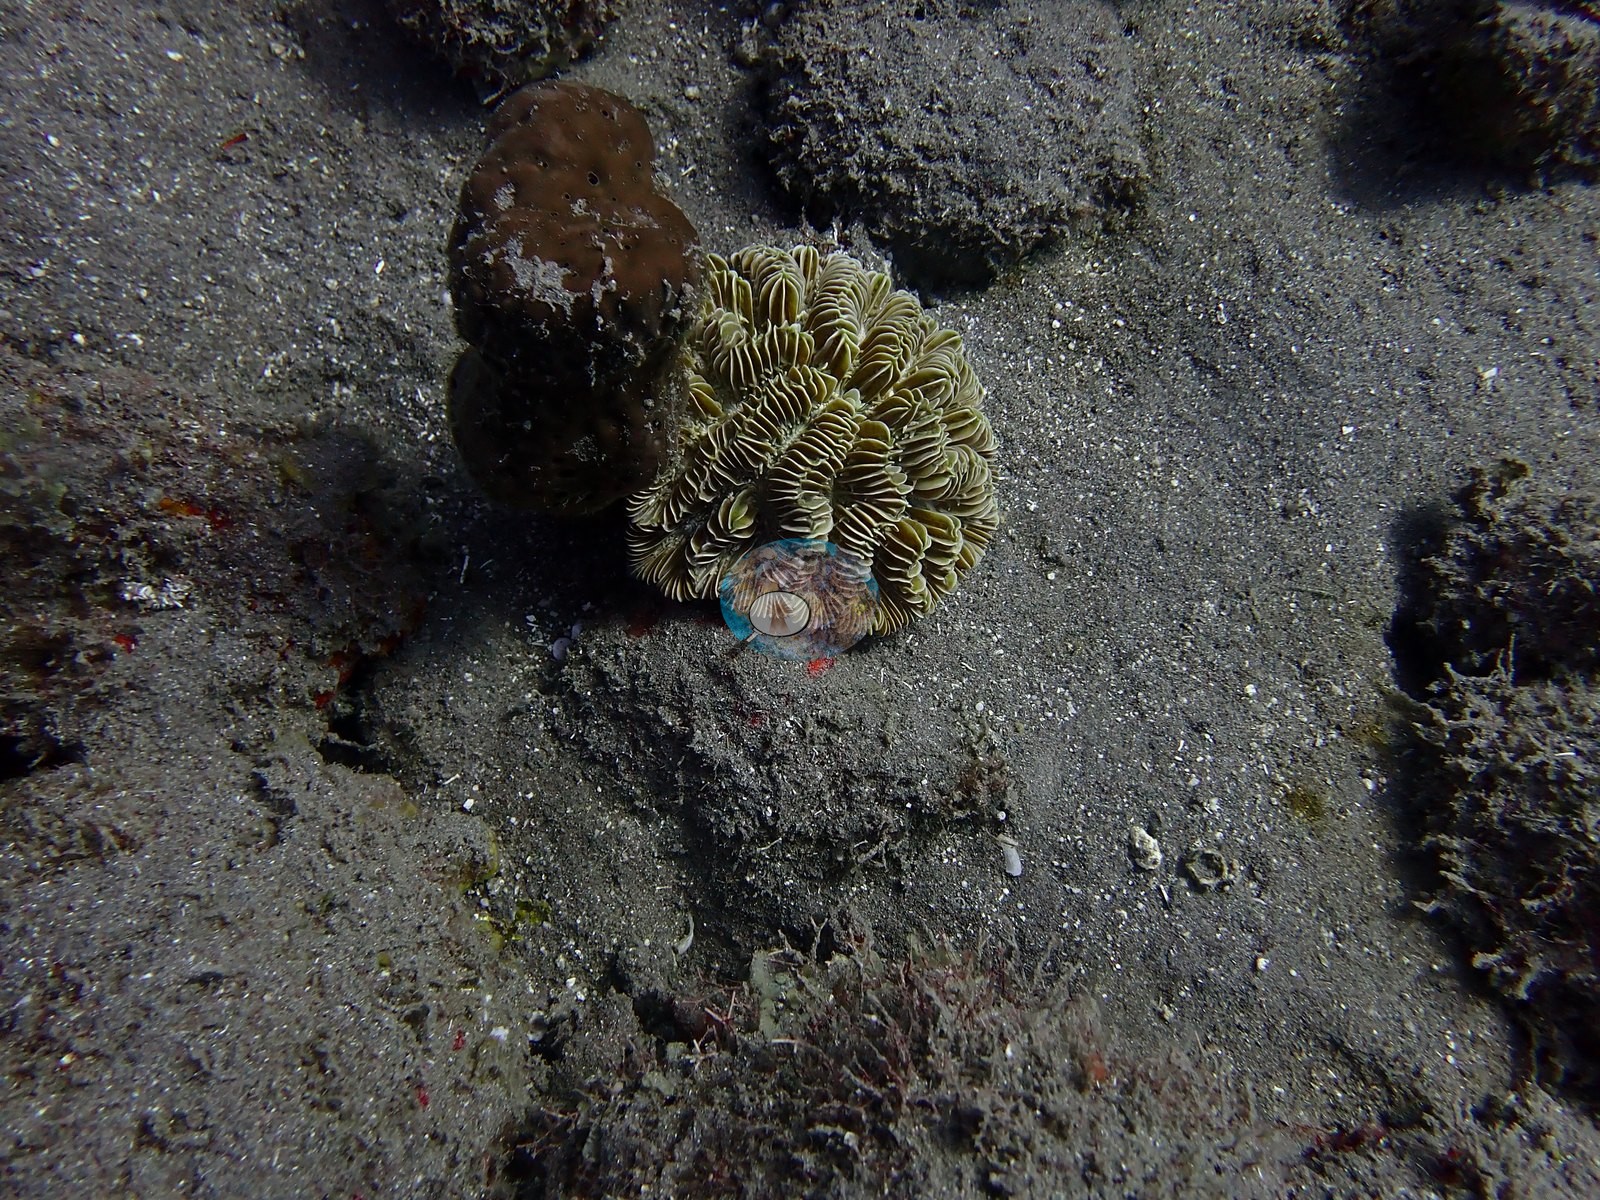
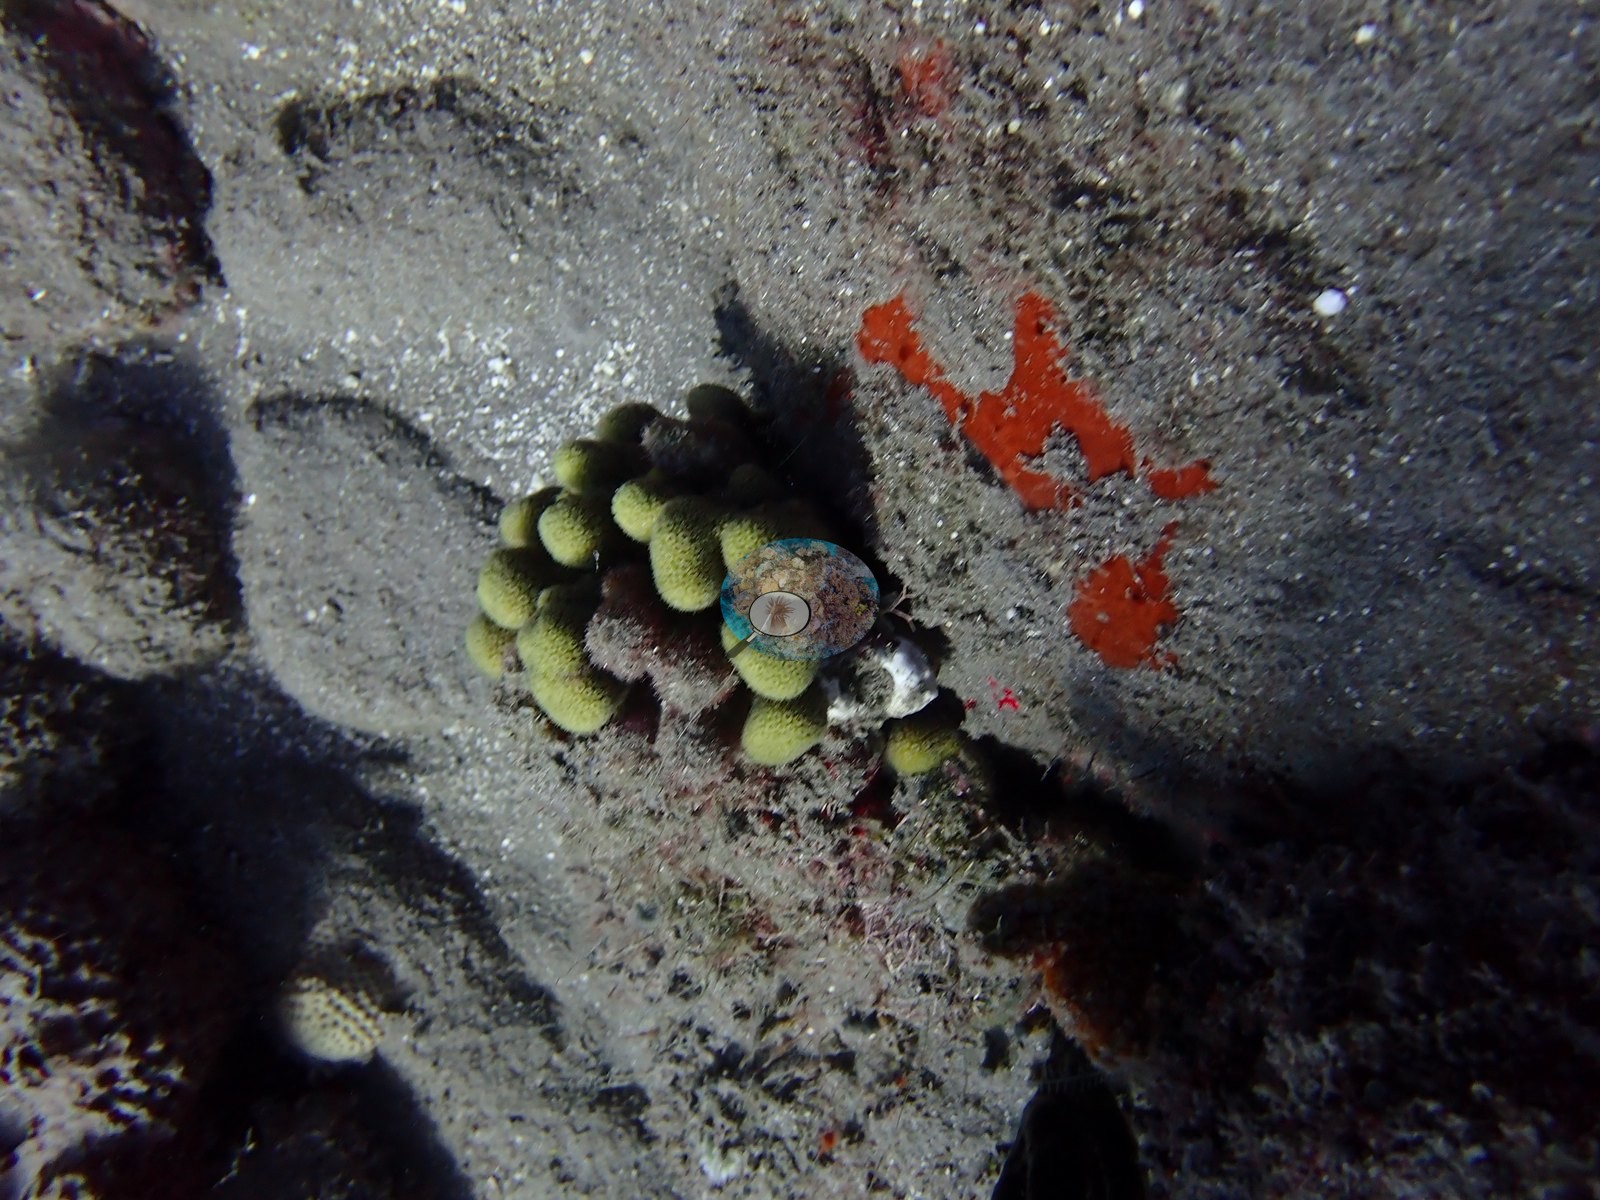
Grooved brain coral (Diploria labyrinthiformis) recurs as small yellow-green heads, two side by side in one frame, some with whitened flanks (e.g., Image 31, Image 36, Image 47).
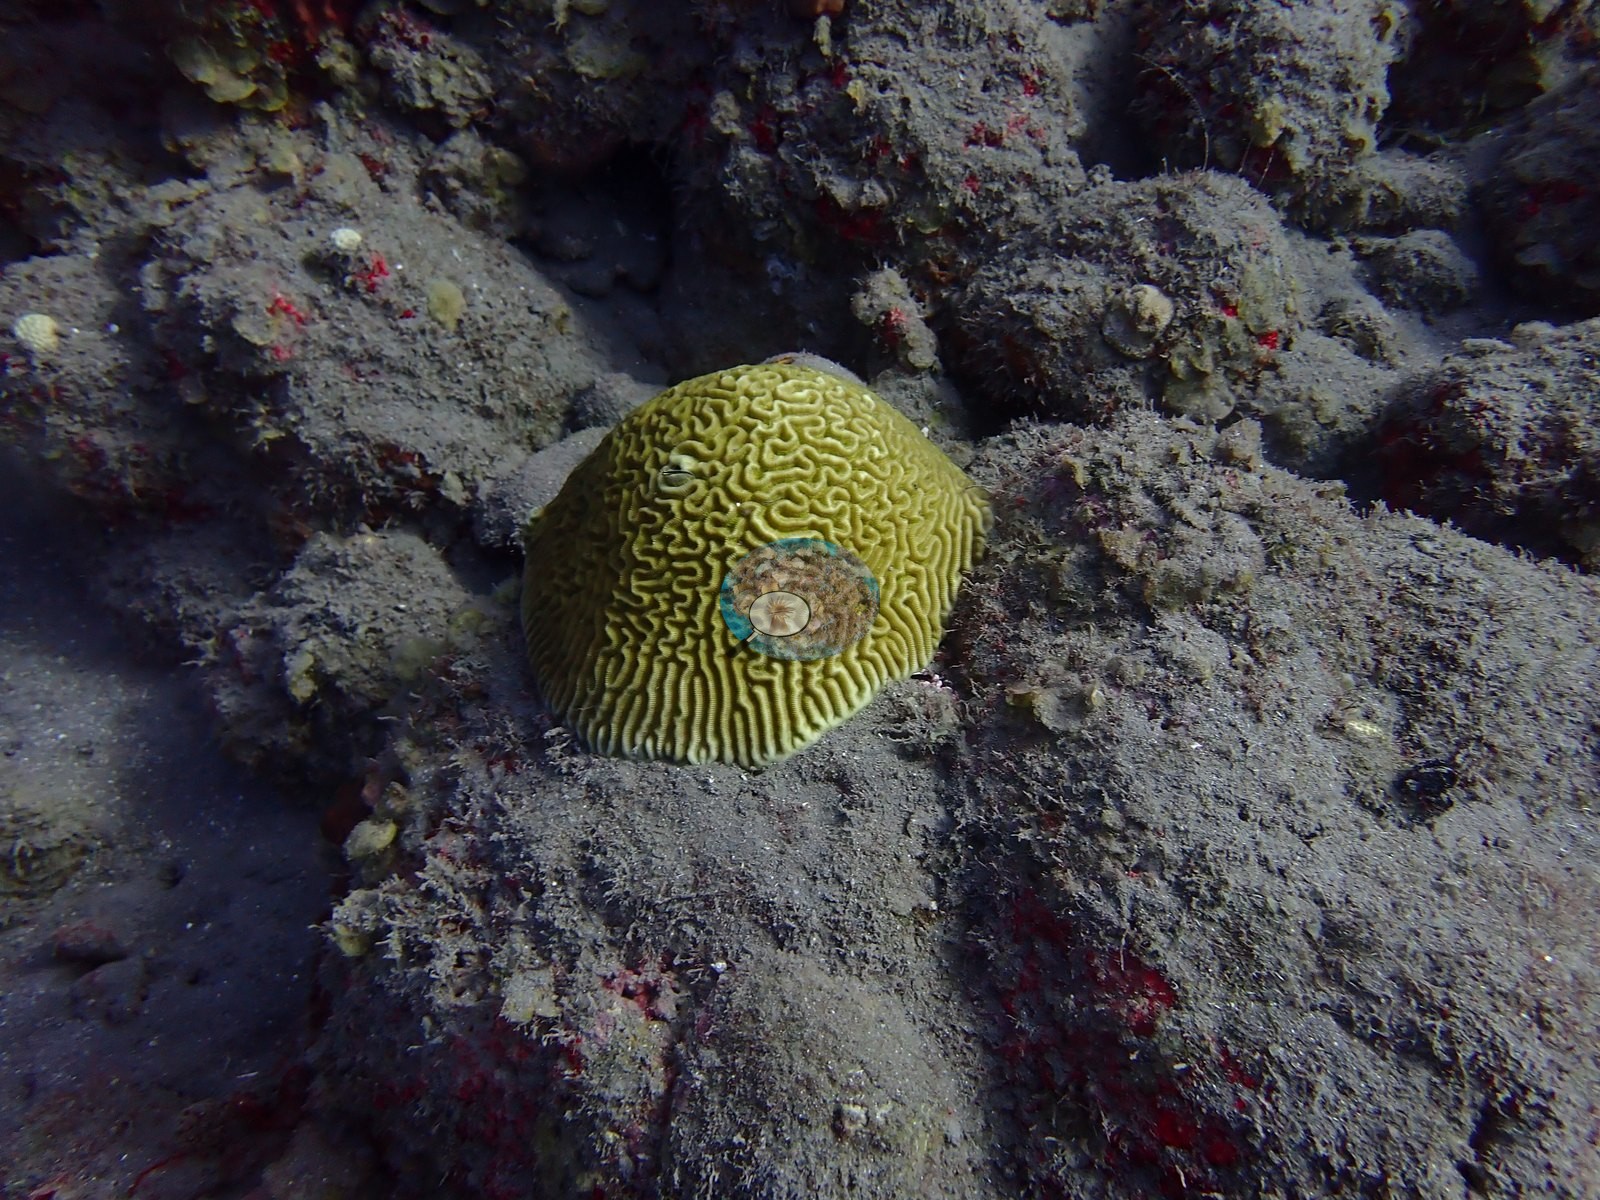
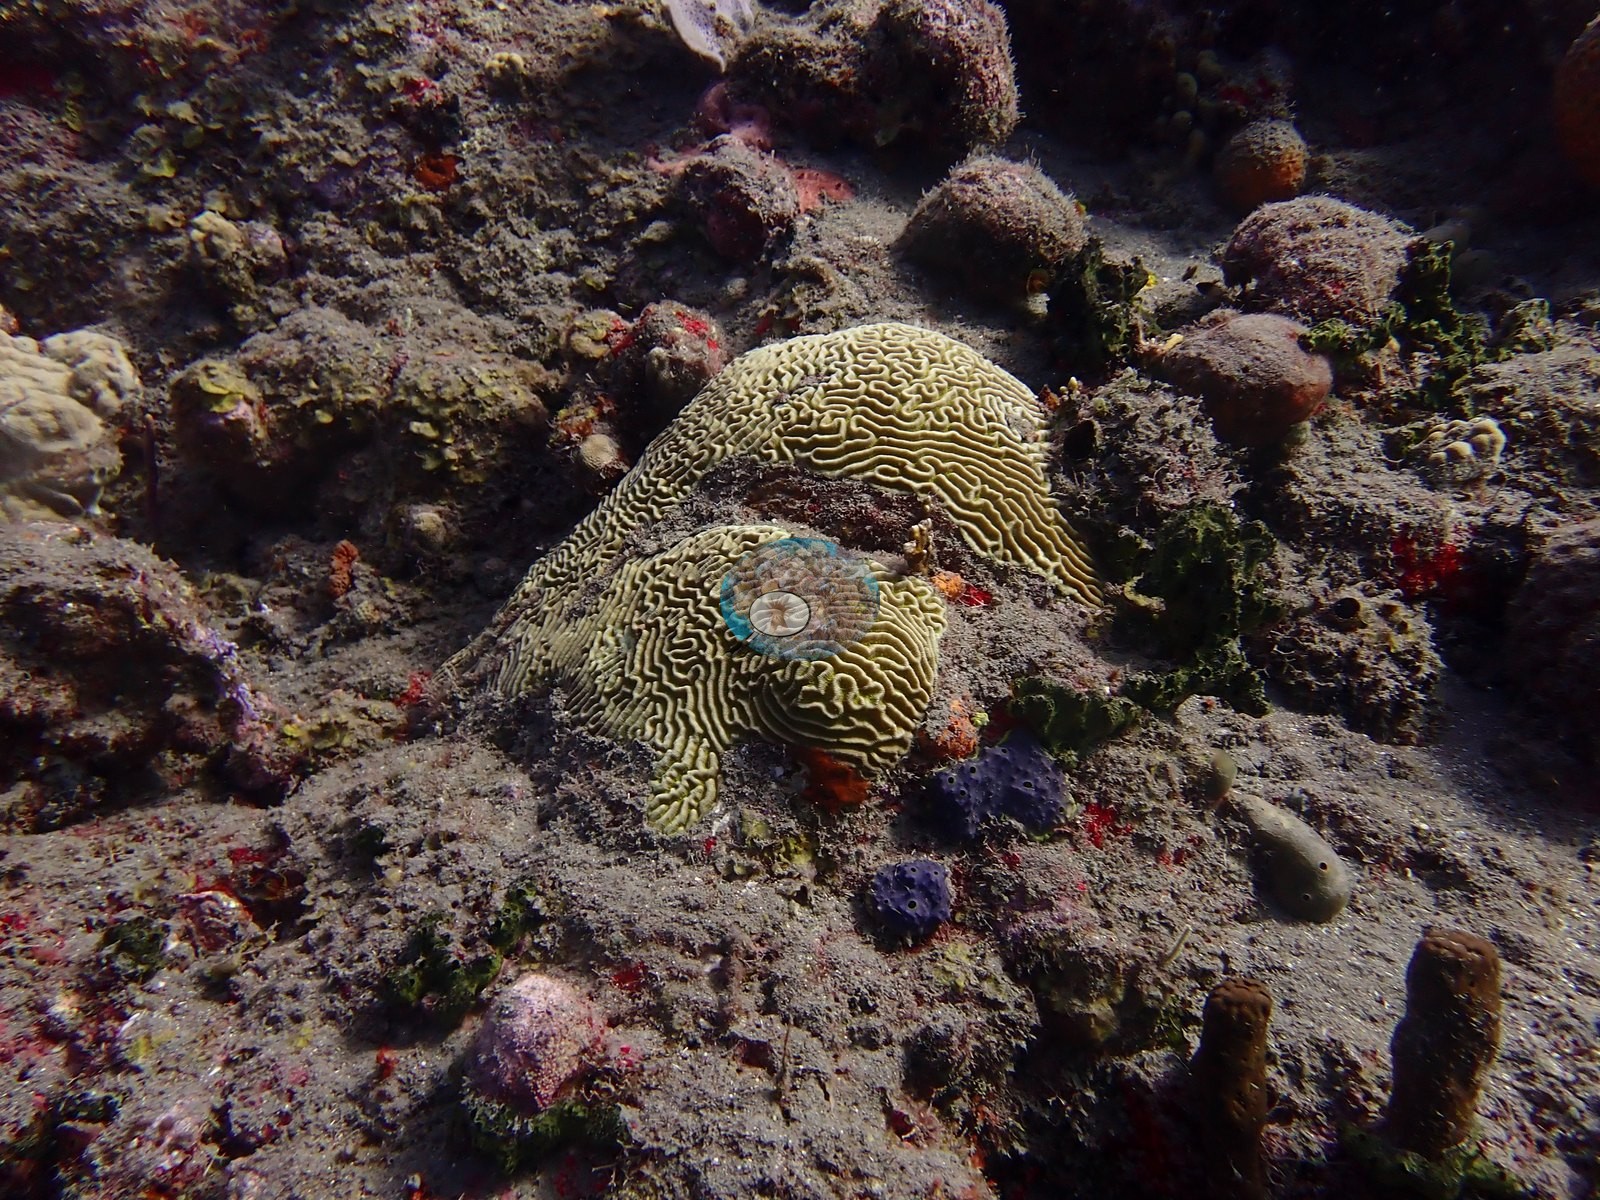
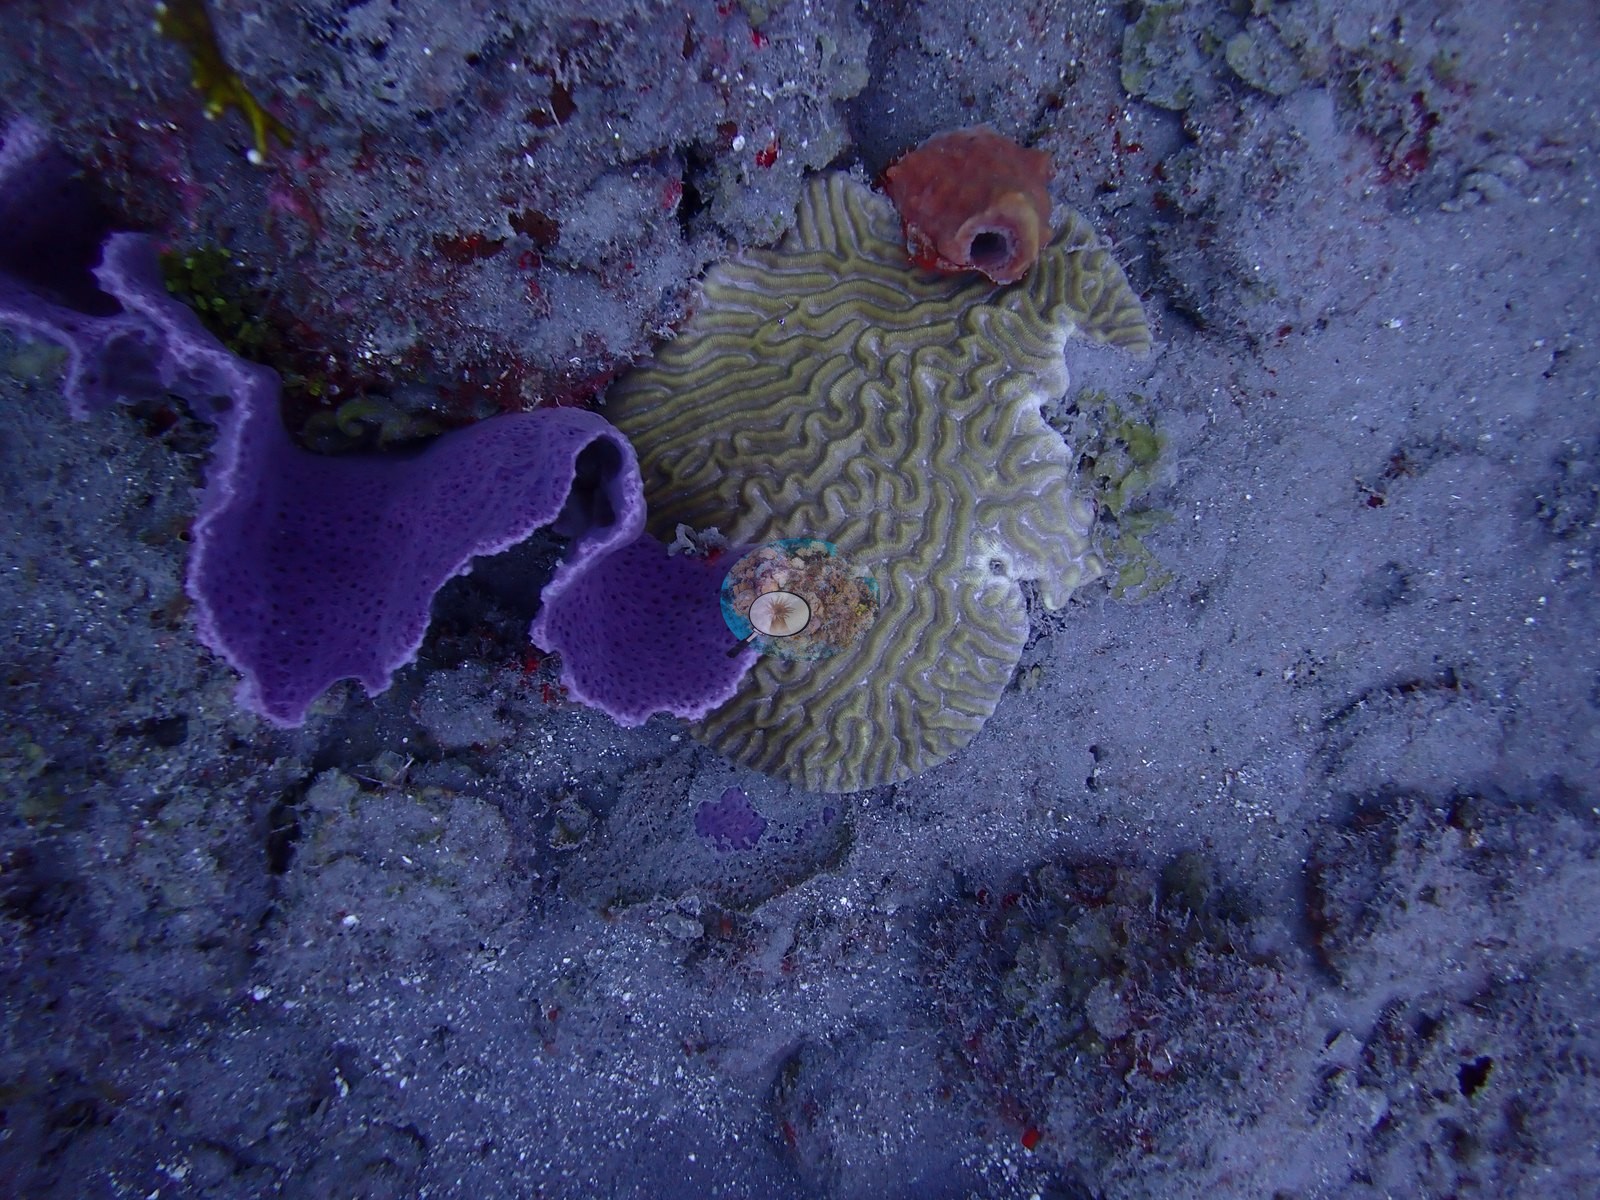
Mustard hill coral (Porites astreoides) forms olive to chartreuse encrusting plates and knobs (e.g., Image 14, Image 49, Image 52).
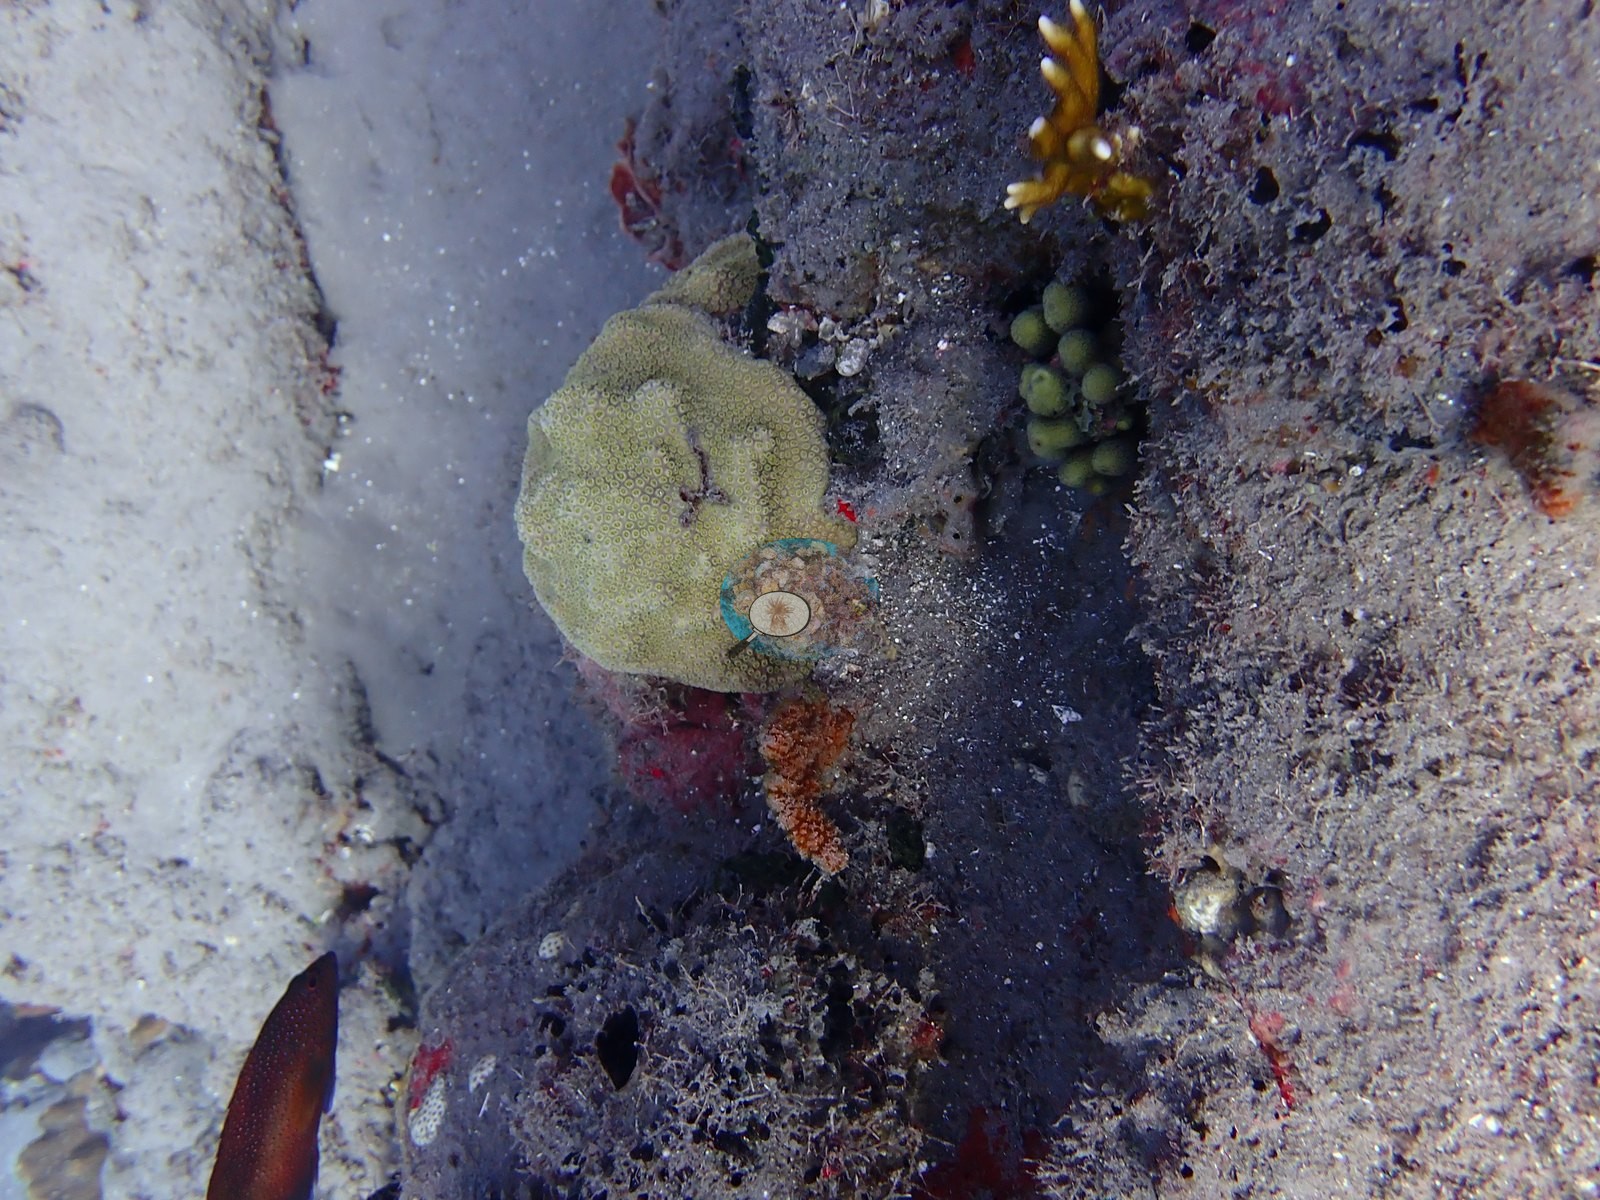
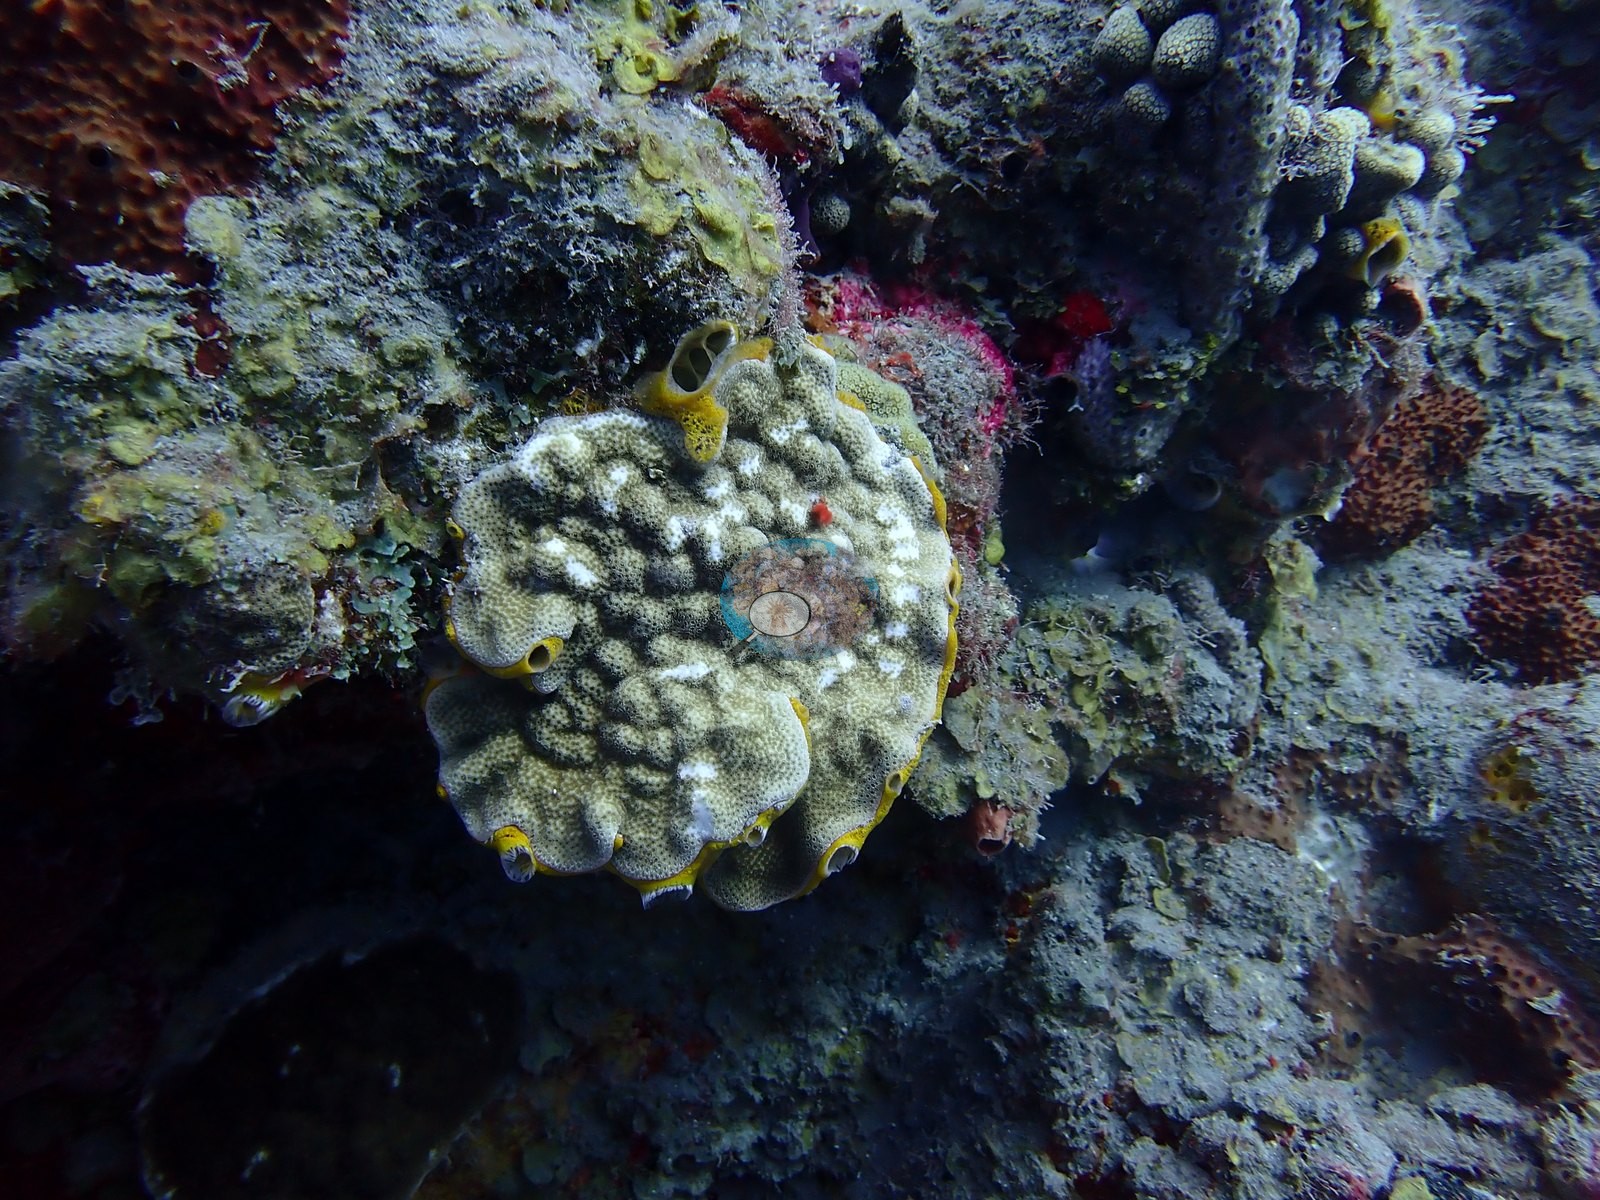
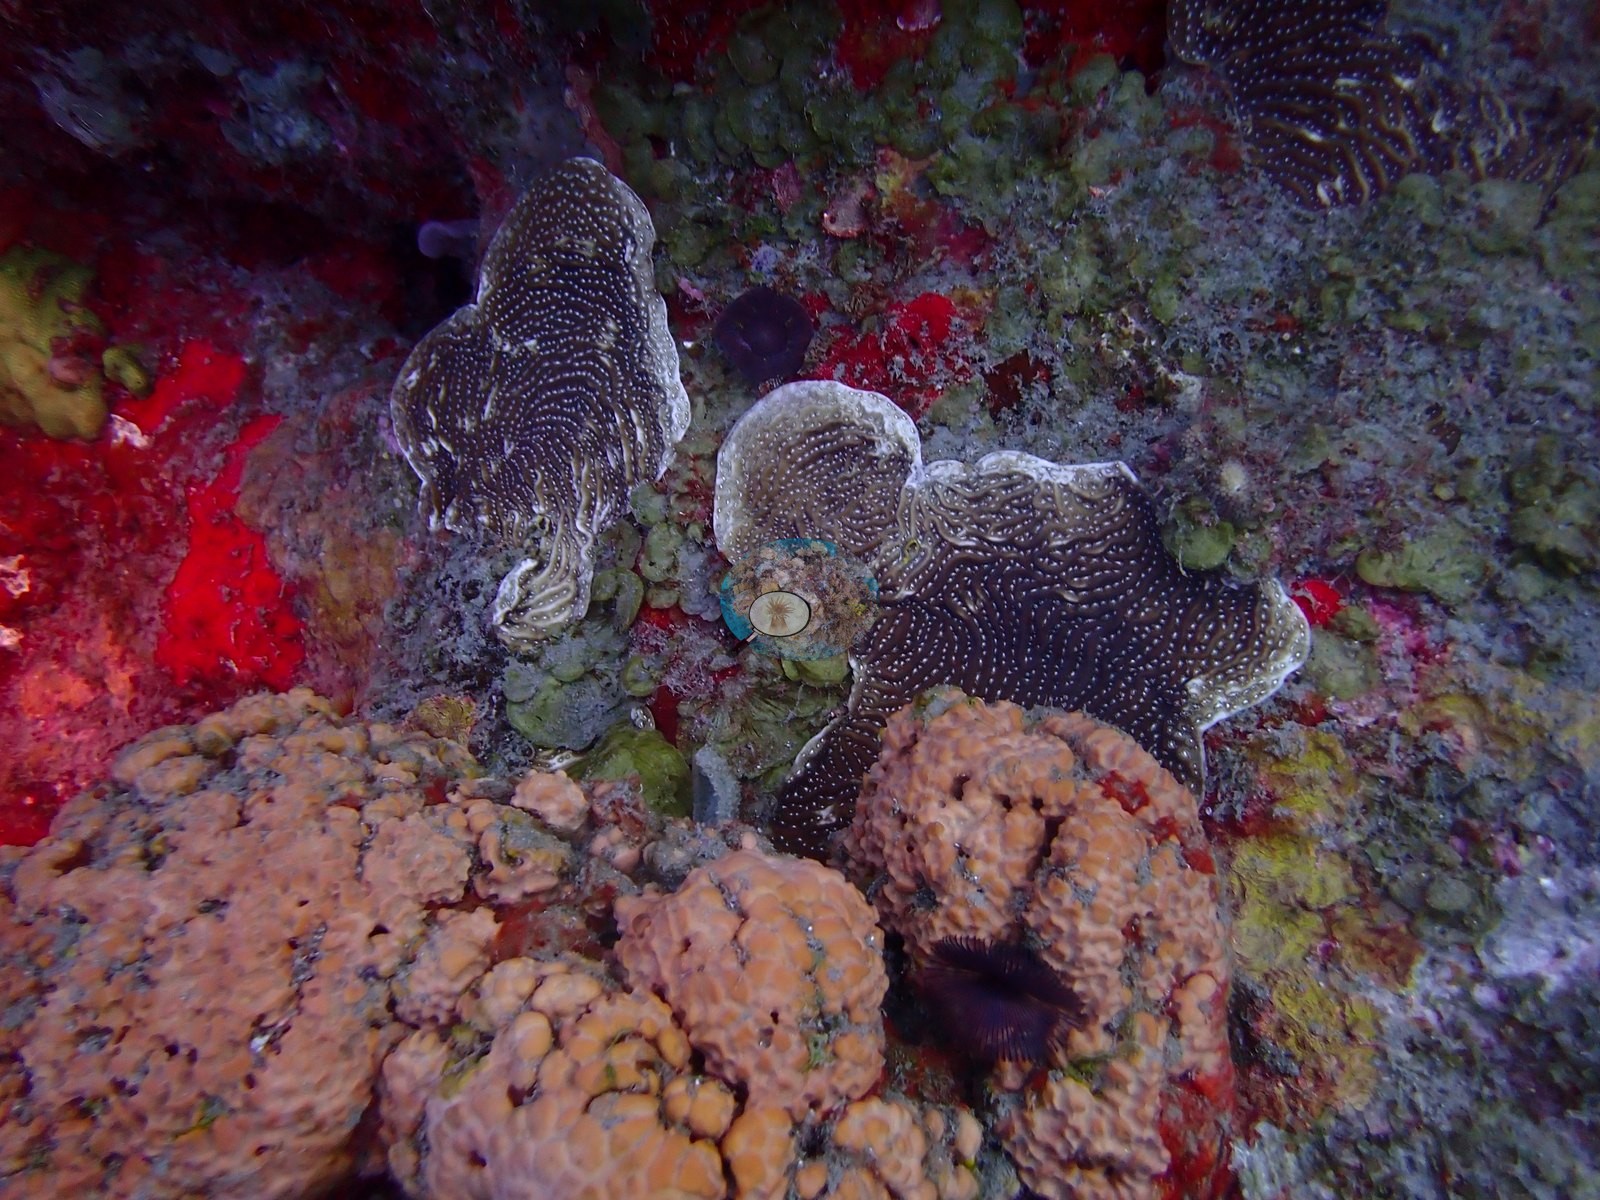
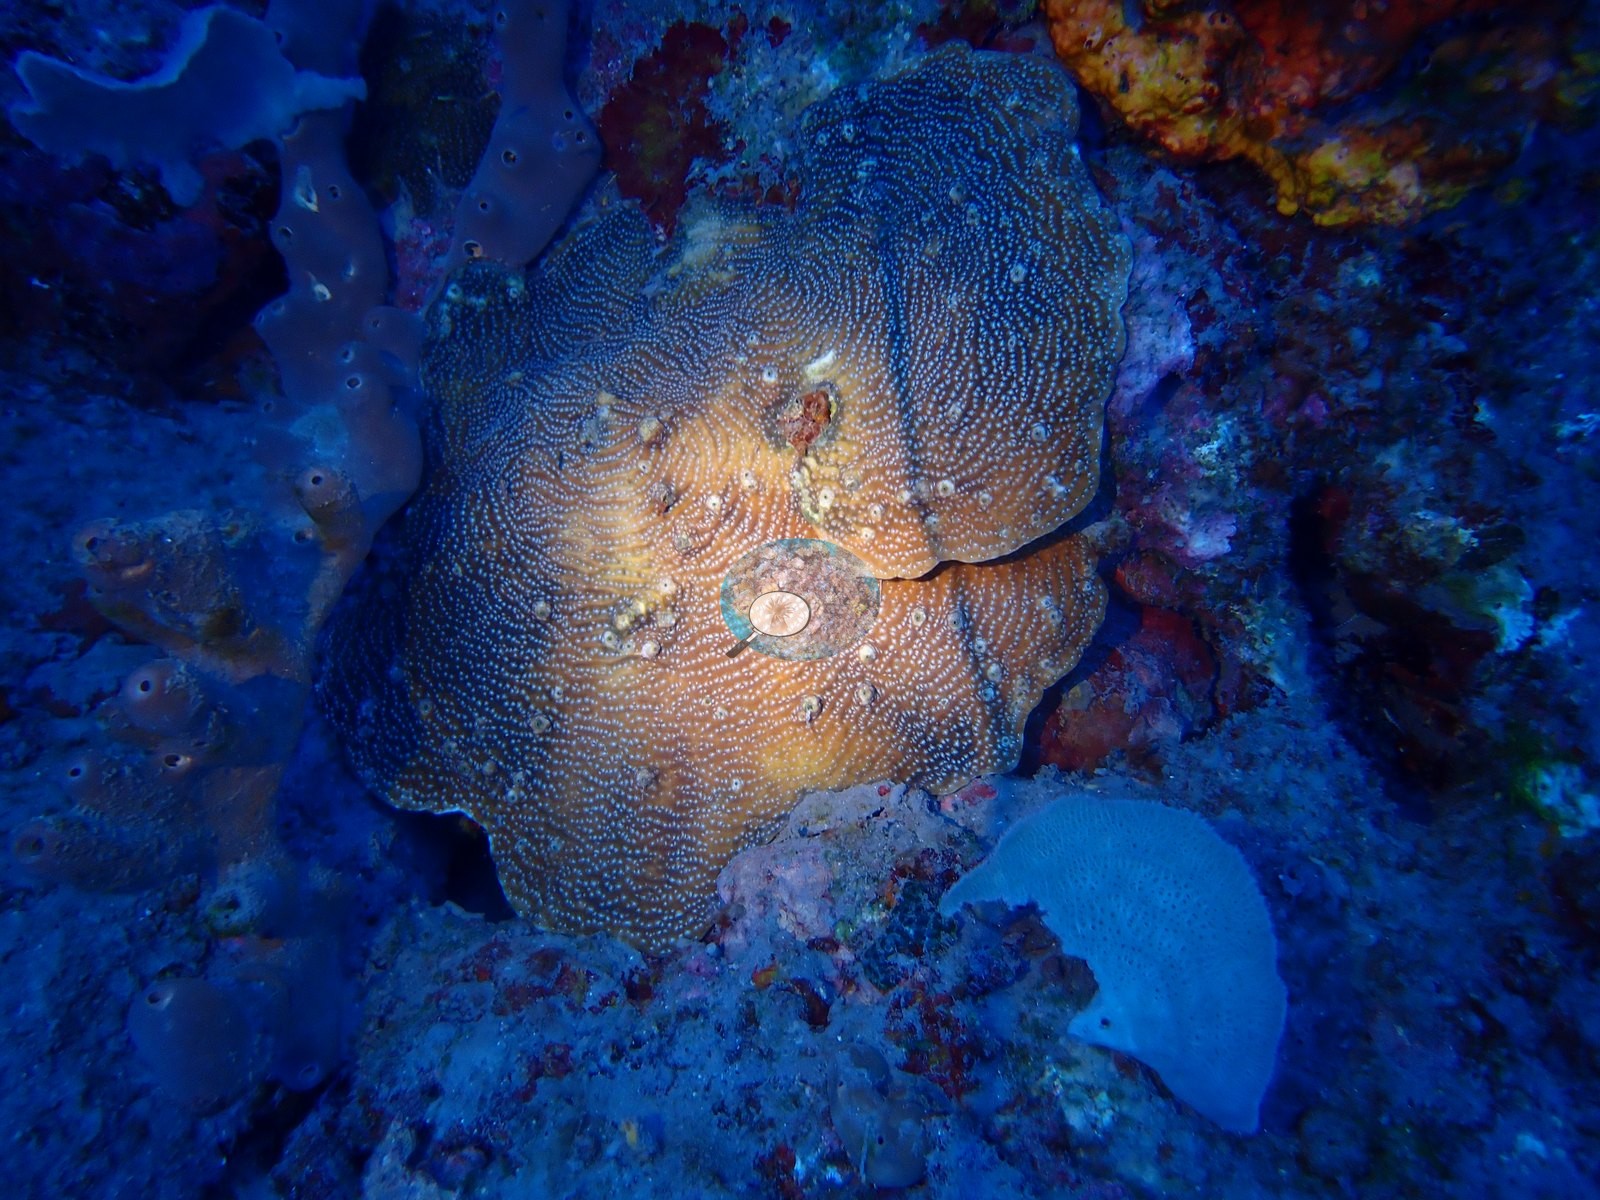
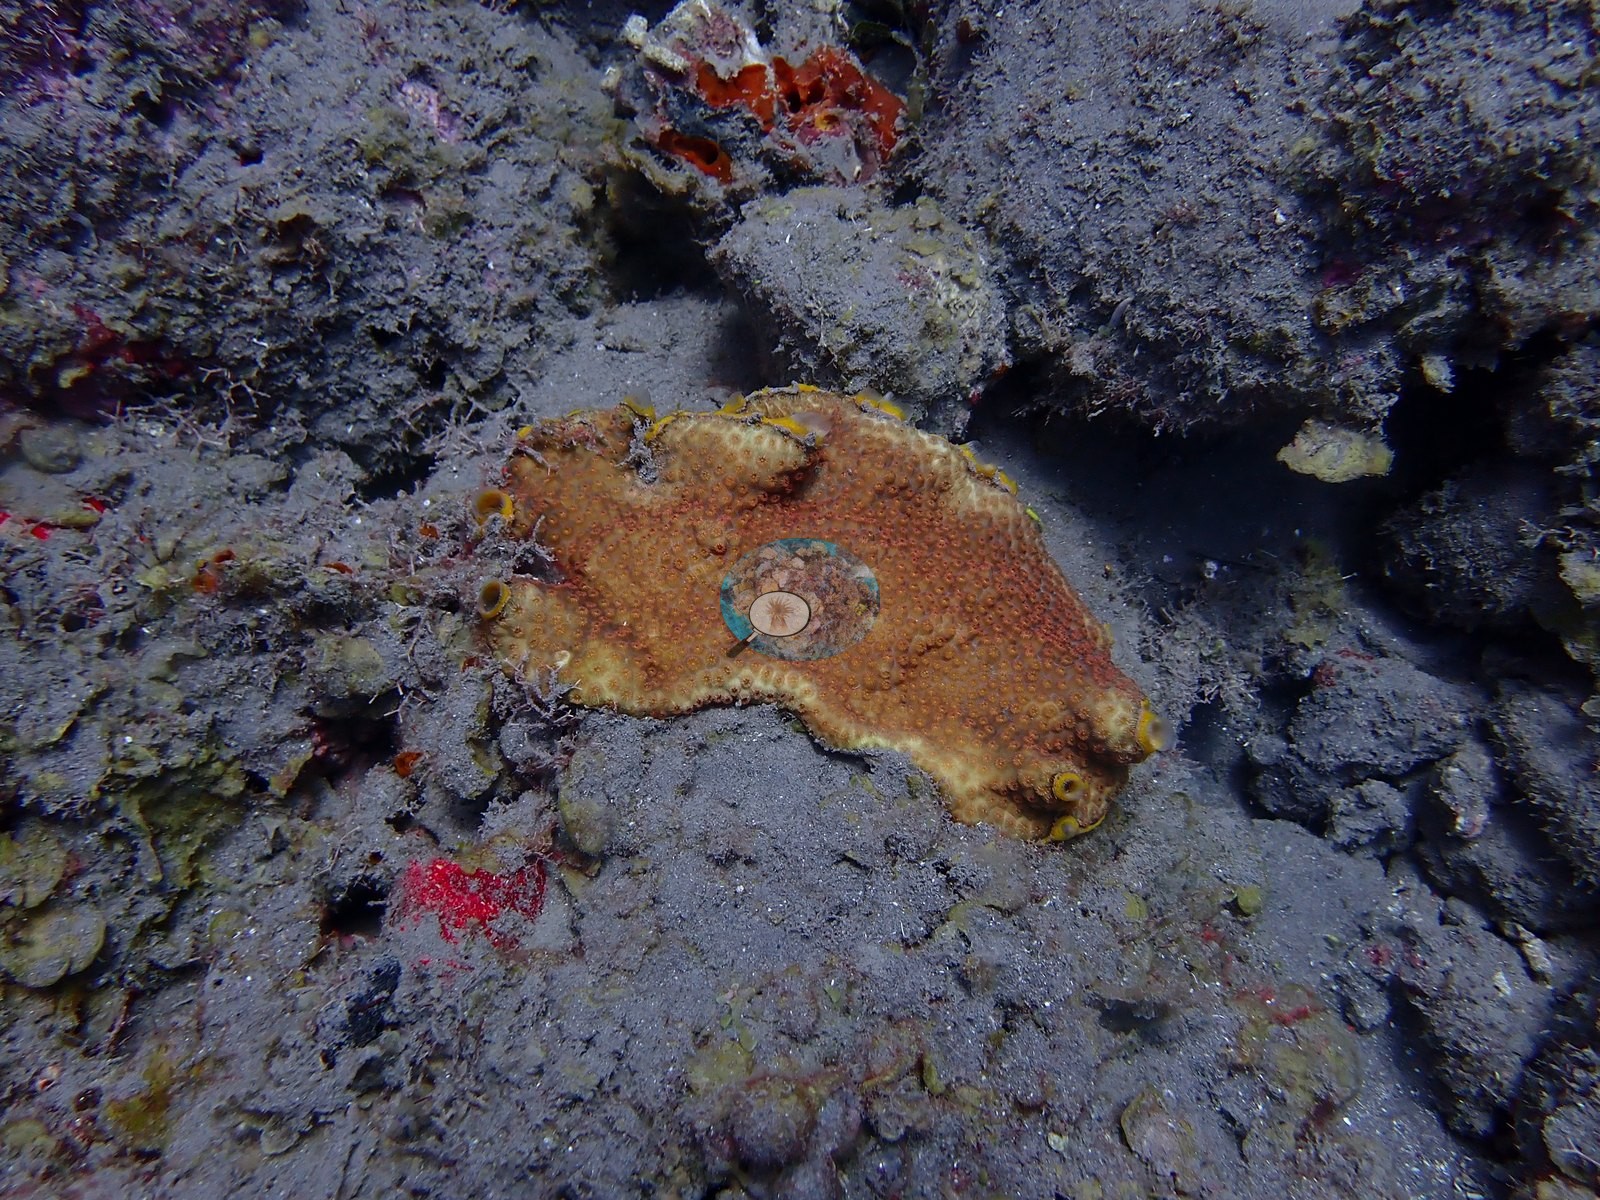
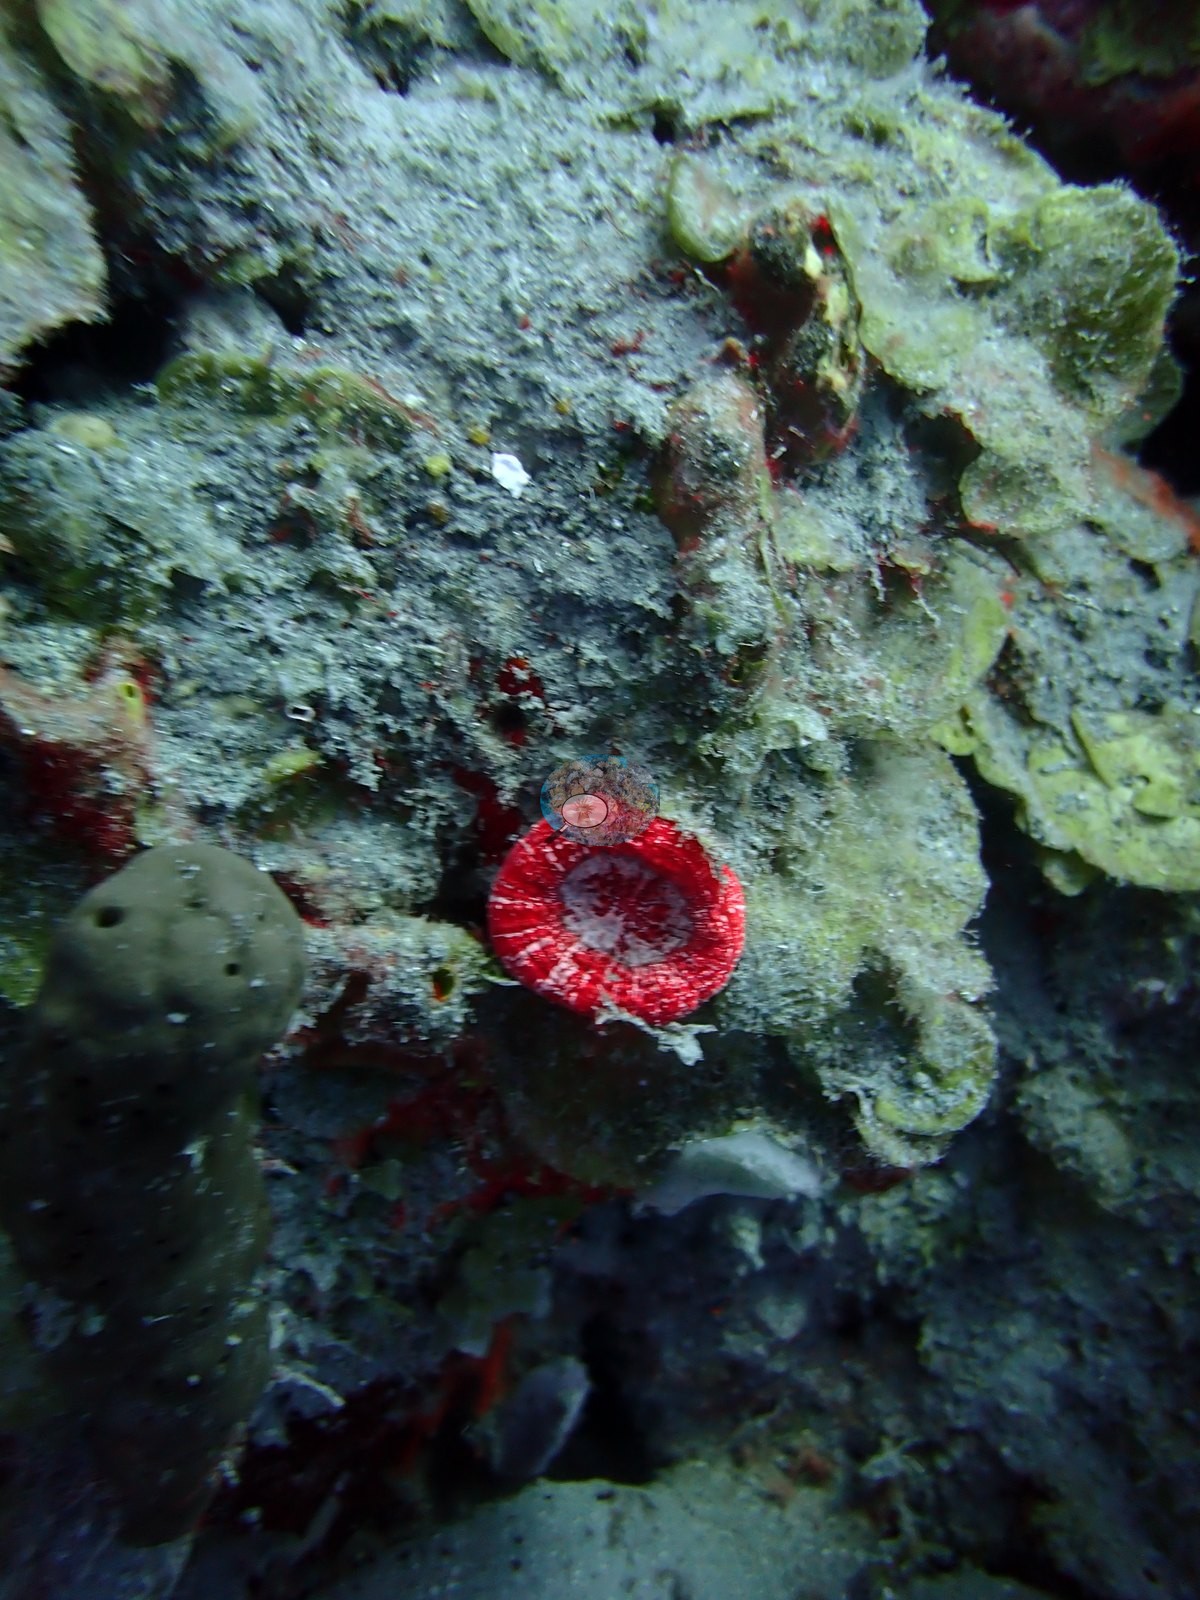
Agaricia plating colonies and one large plating star coral with a sharply bounded pale-orange patch sit in shaded recesses; a scarlet solitary cup coral, consistent with the invasive Tubastraea coccinea, appears twice (e.g., Image 44).
Coral cover
Coral cover: 4.3% — a blind Claude computer-vision point count of 73 of Anderson's unedited photographs (20 points per photo; water, fish, and obstructions excluded). Other computer-vision methods are listed in the method table. Frames were screened before scoring: open sand, mid-water, blown-out, and burst-duplicate frames, dive computers, topside, and diver shots, blue-light fluorescence, and macros were all removed.
Fish and other fauna
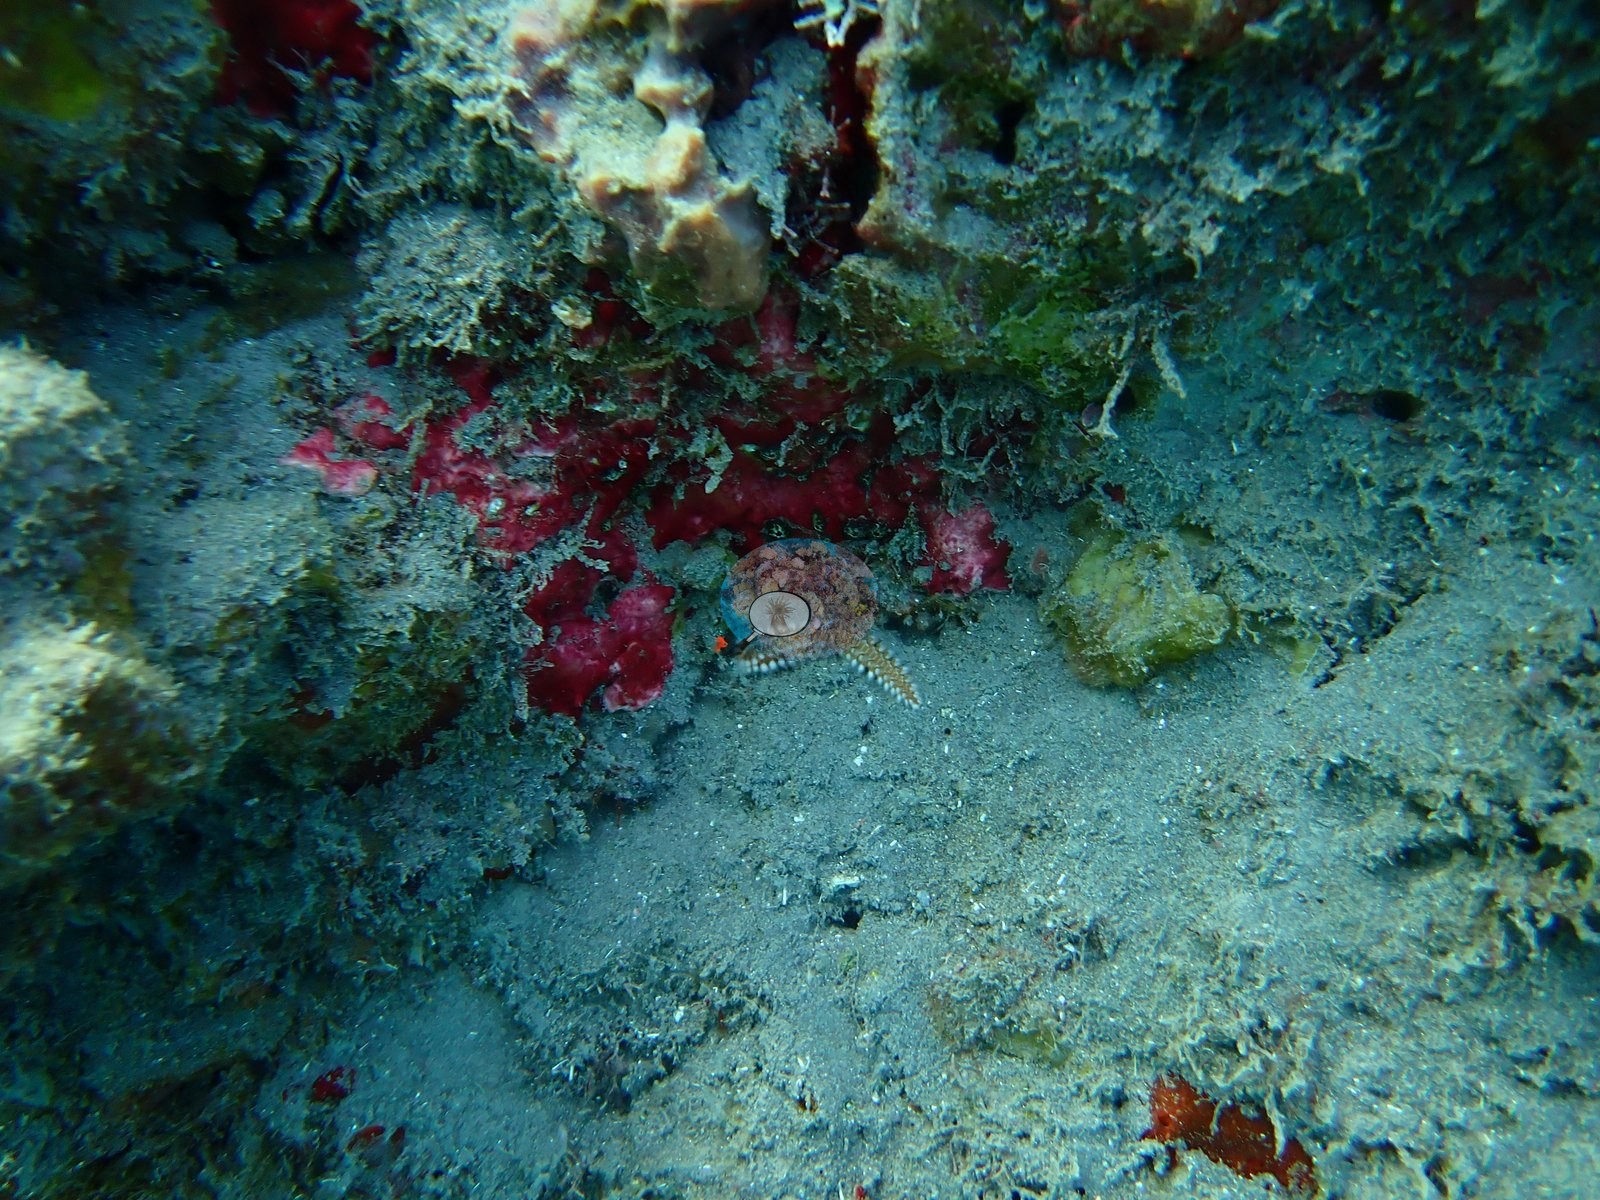
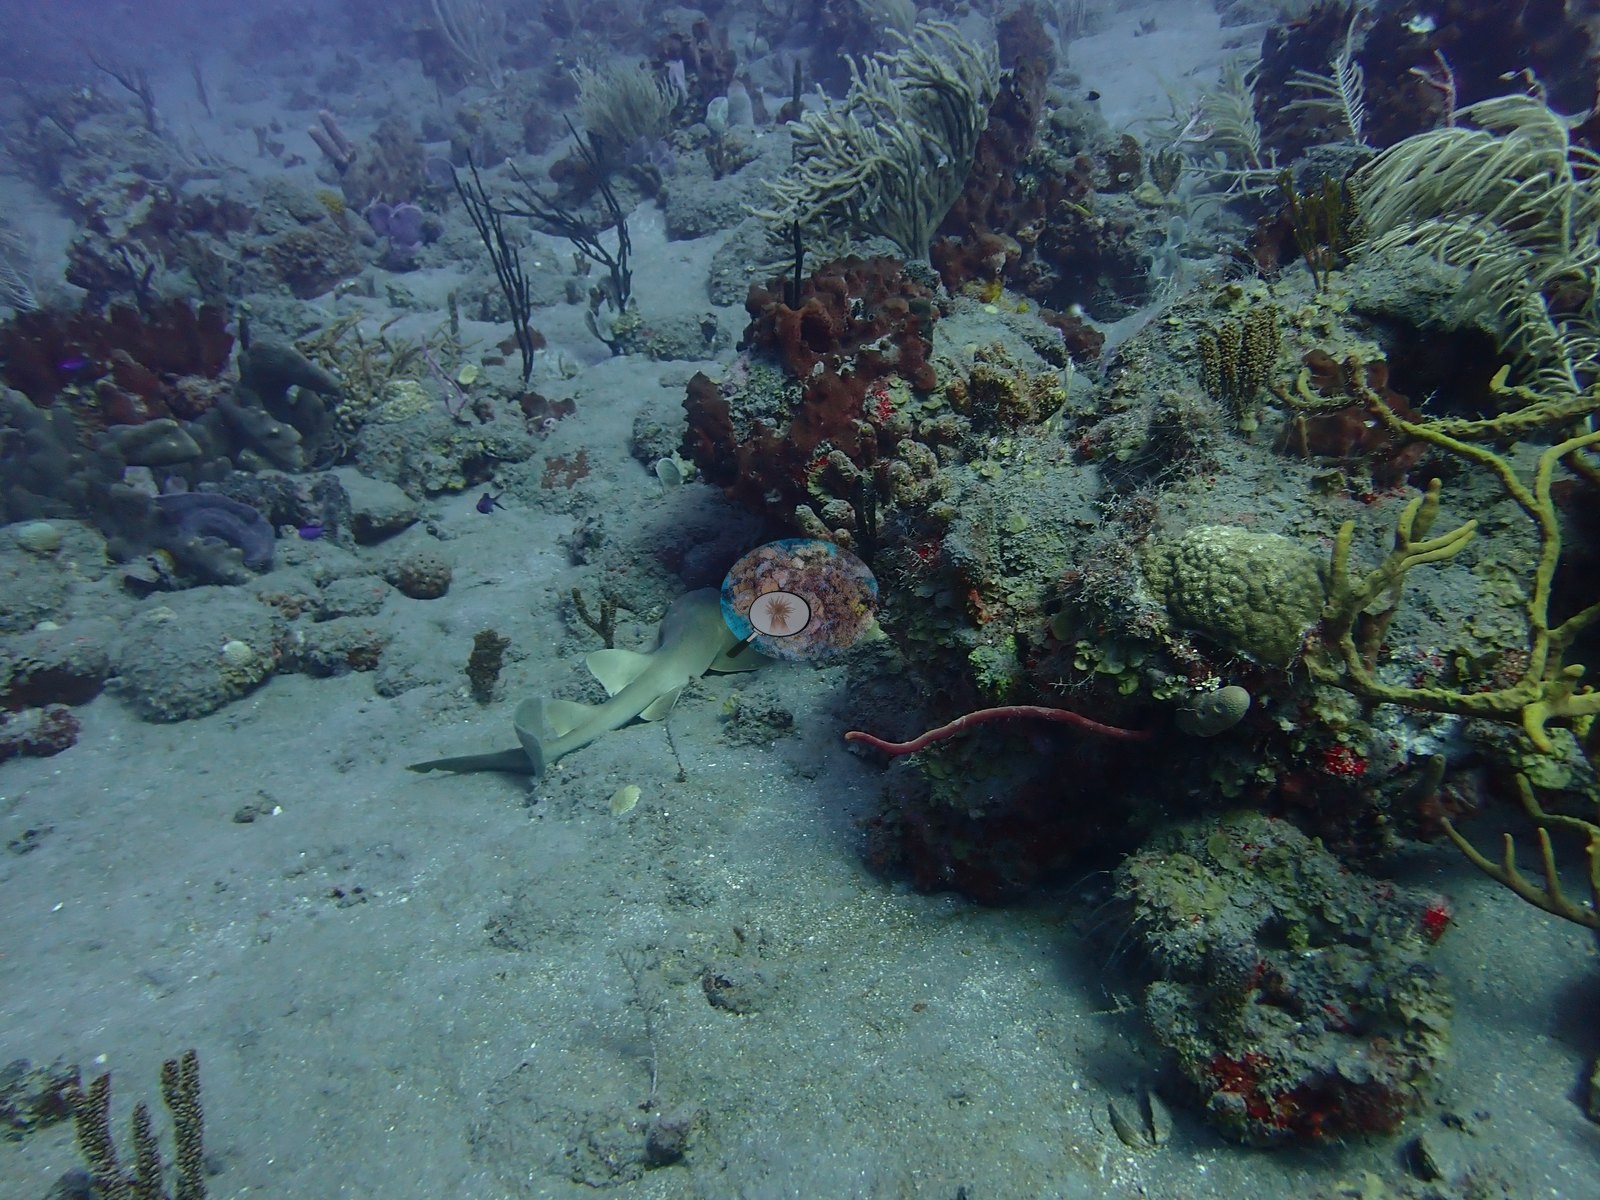
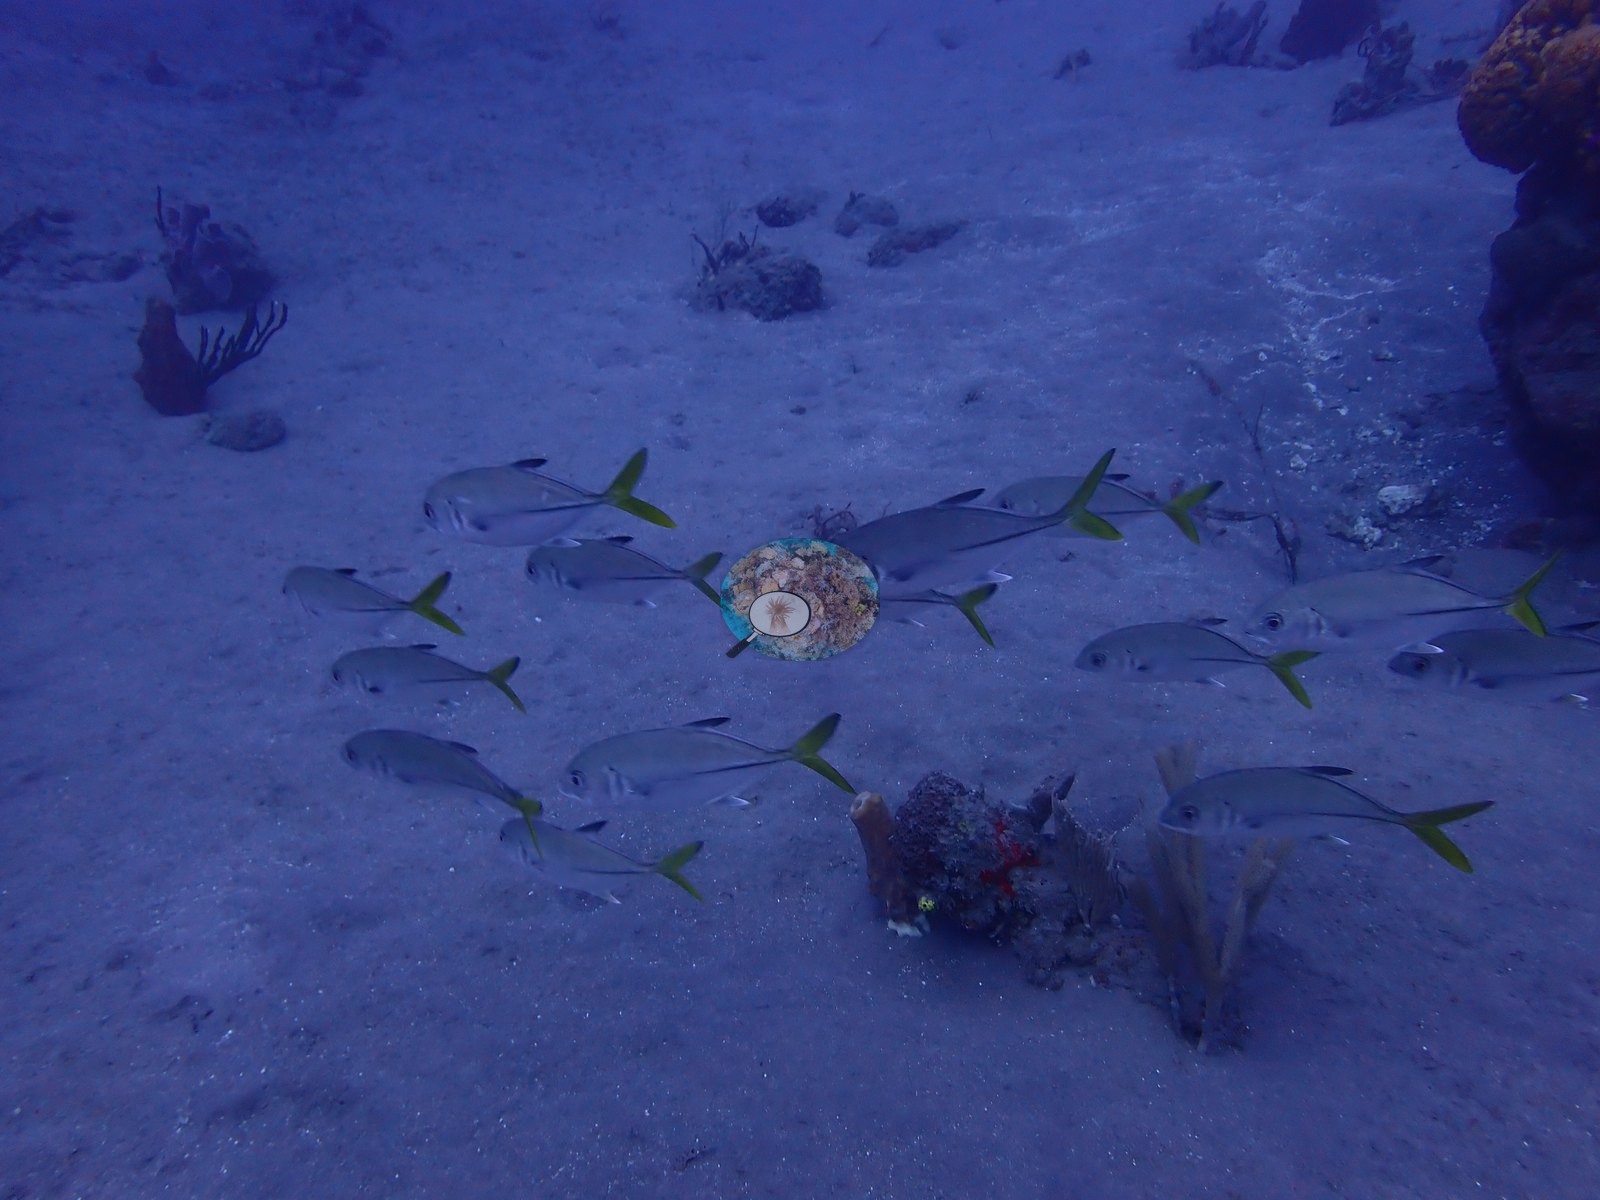
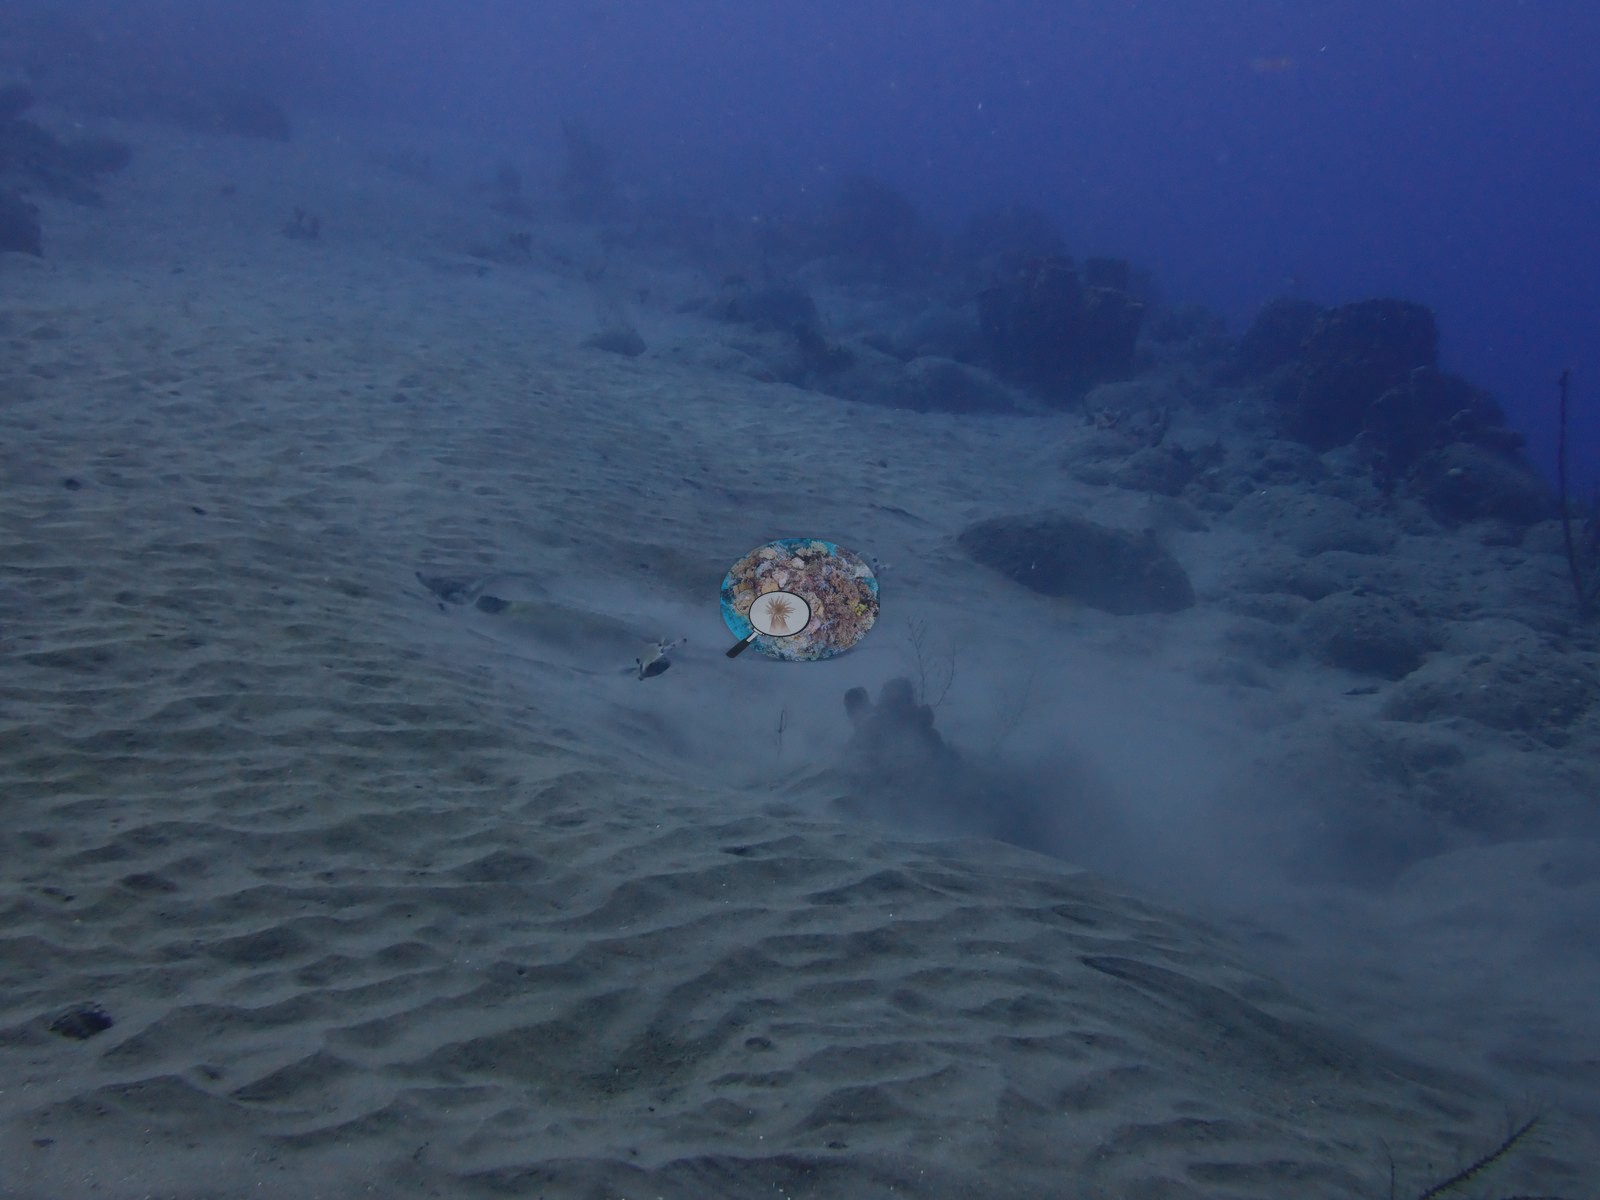
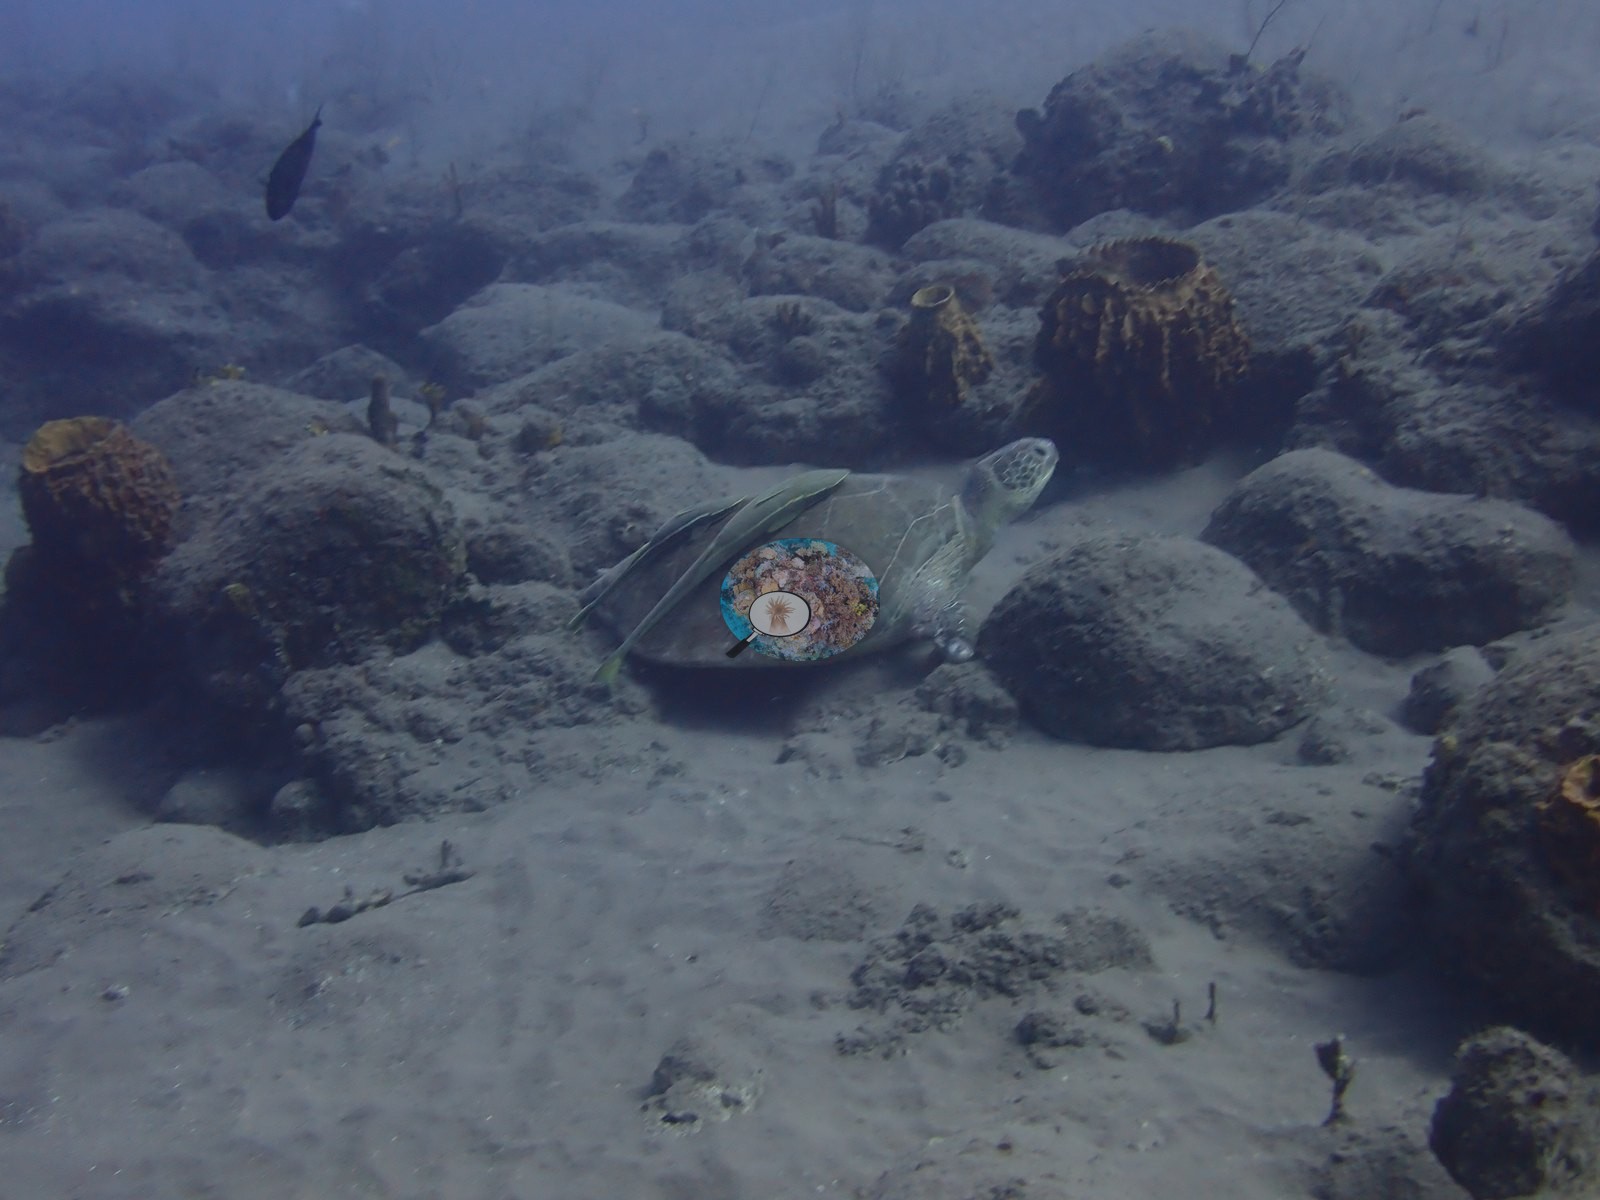
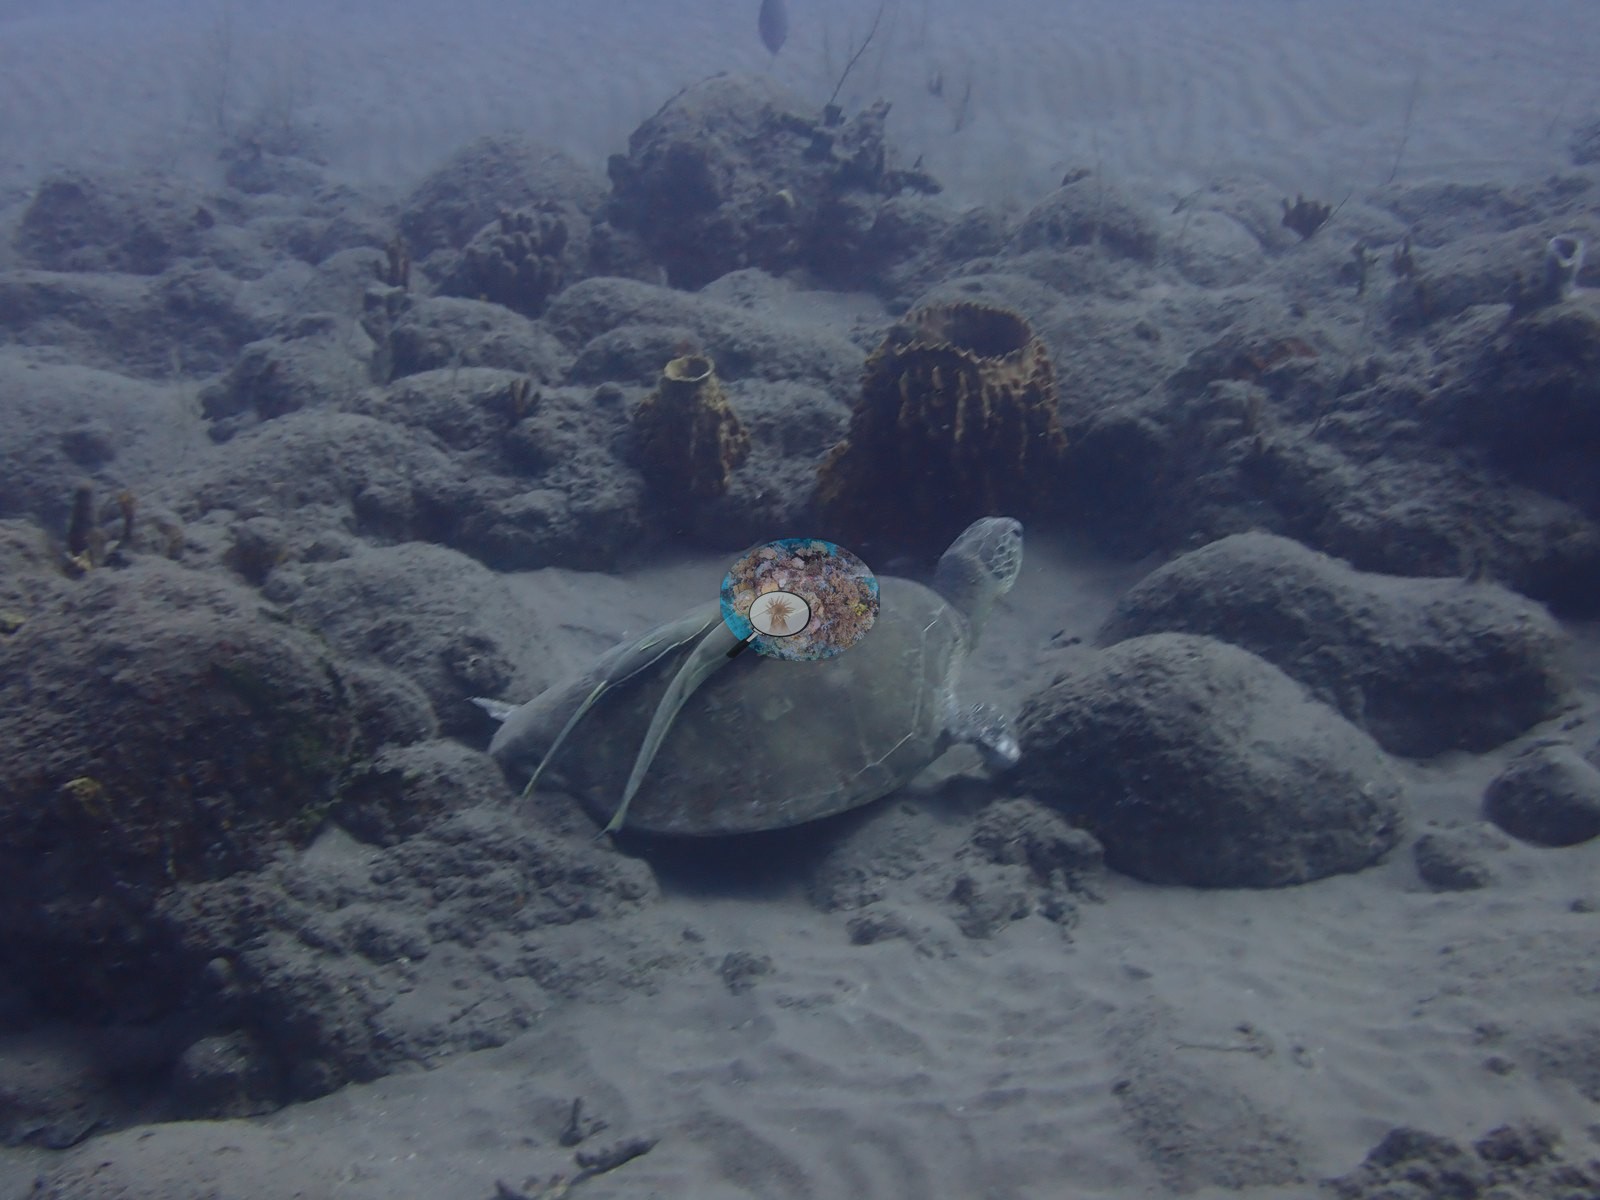
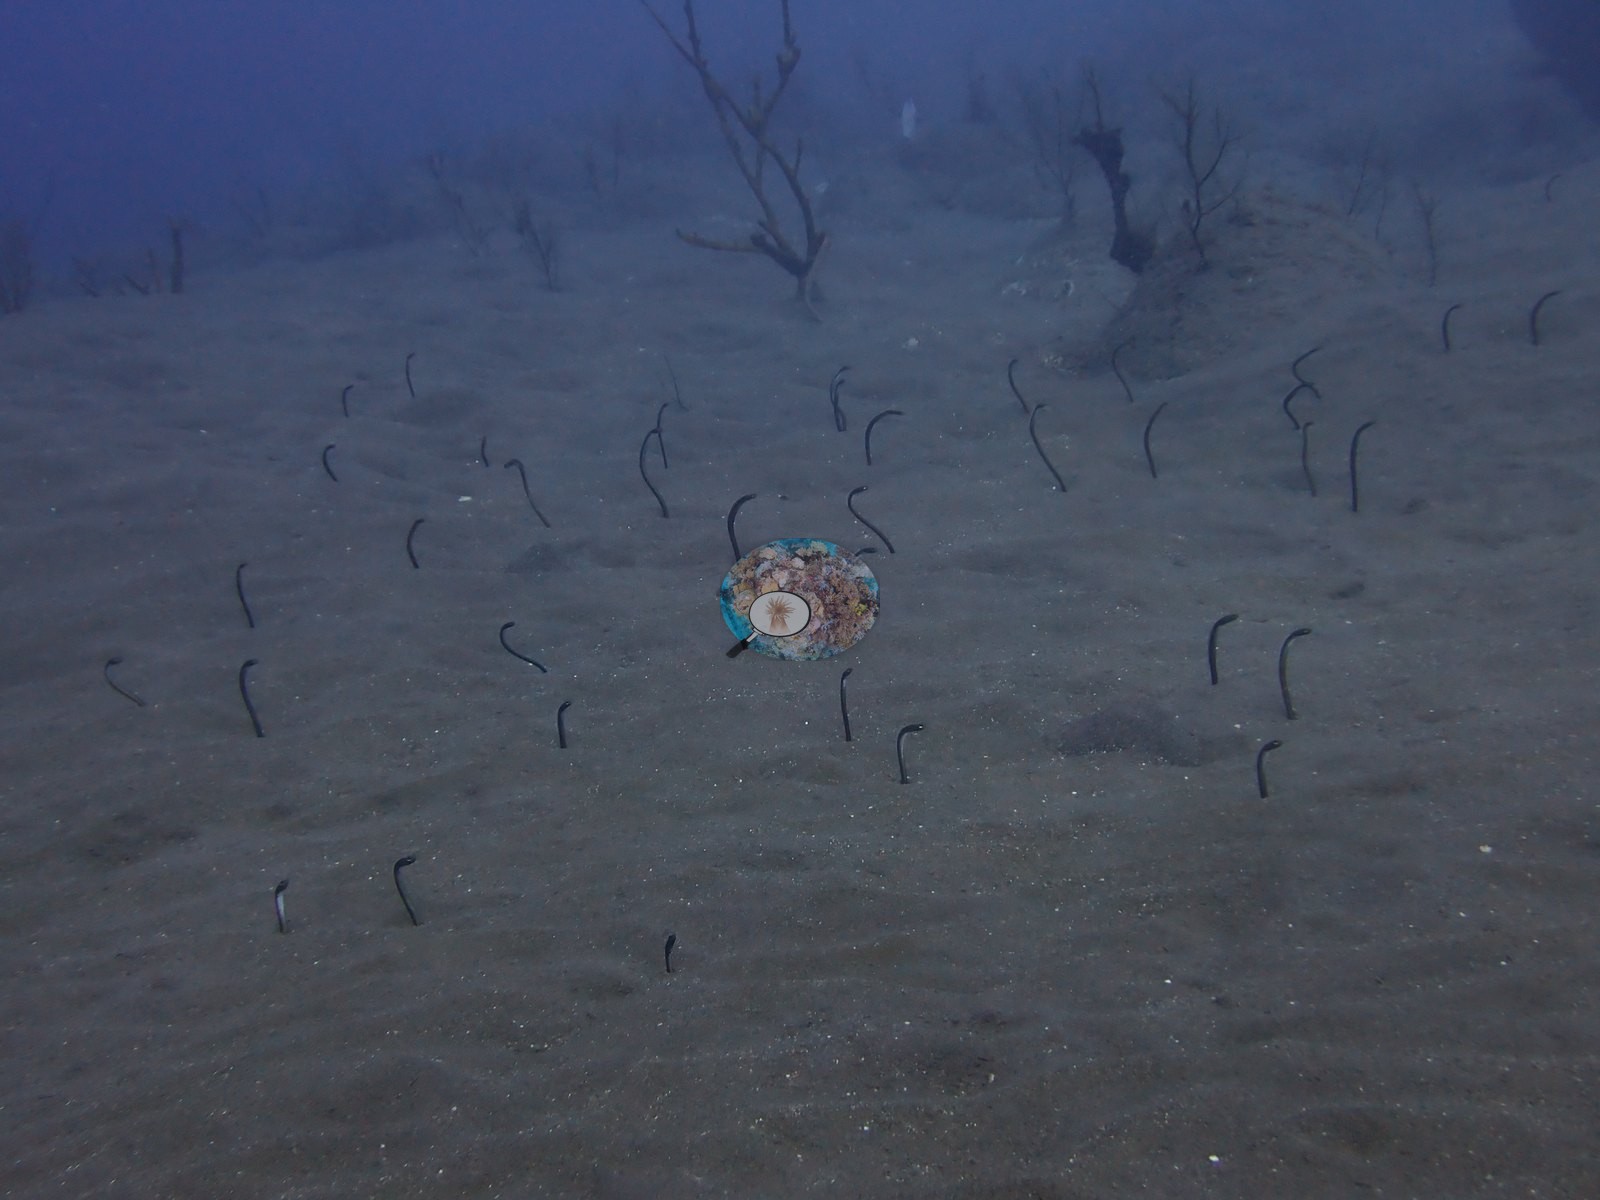
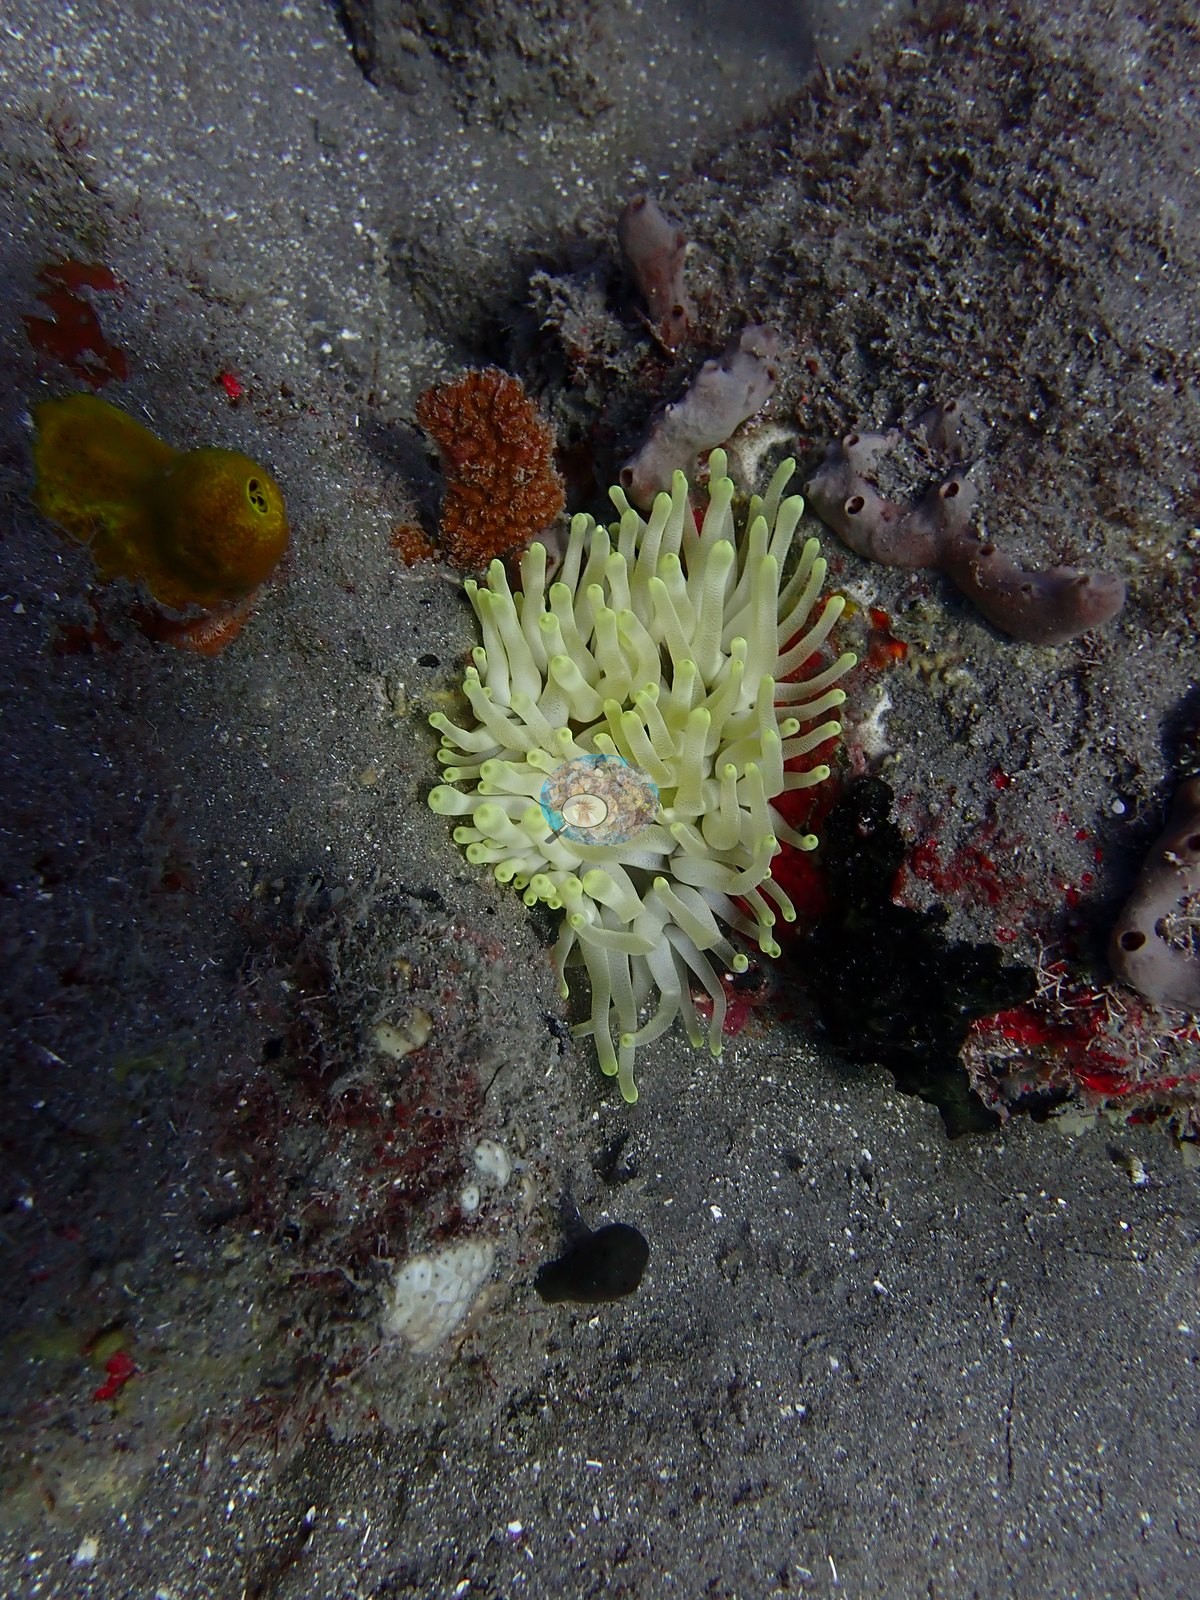
Fauna: a resting nurse shark (Ginglymostoma cirratum) over four frames; a southern stingray buried in rippled sand; a green turtle resting in the boulder field over four frames; a dense garden-eel colony on the sand plain; banded coral shrimp, a fairy basslet, and a fireworm in crevices; a giant anemone; schooling jacks, butterflyfish, and black durgon (e.g., Image 7, Image 8, Image 18, Image 23, Image 26, Image 43, Image 50).
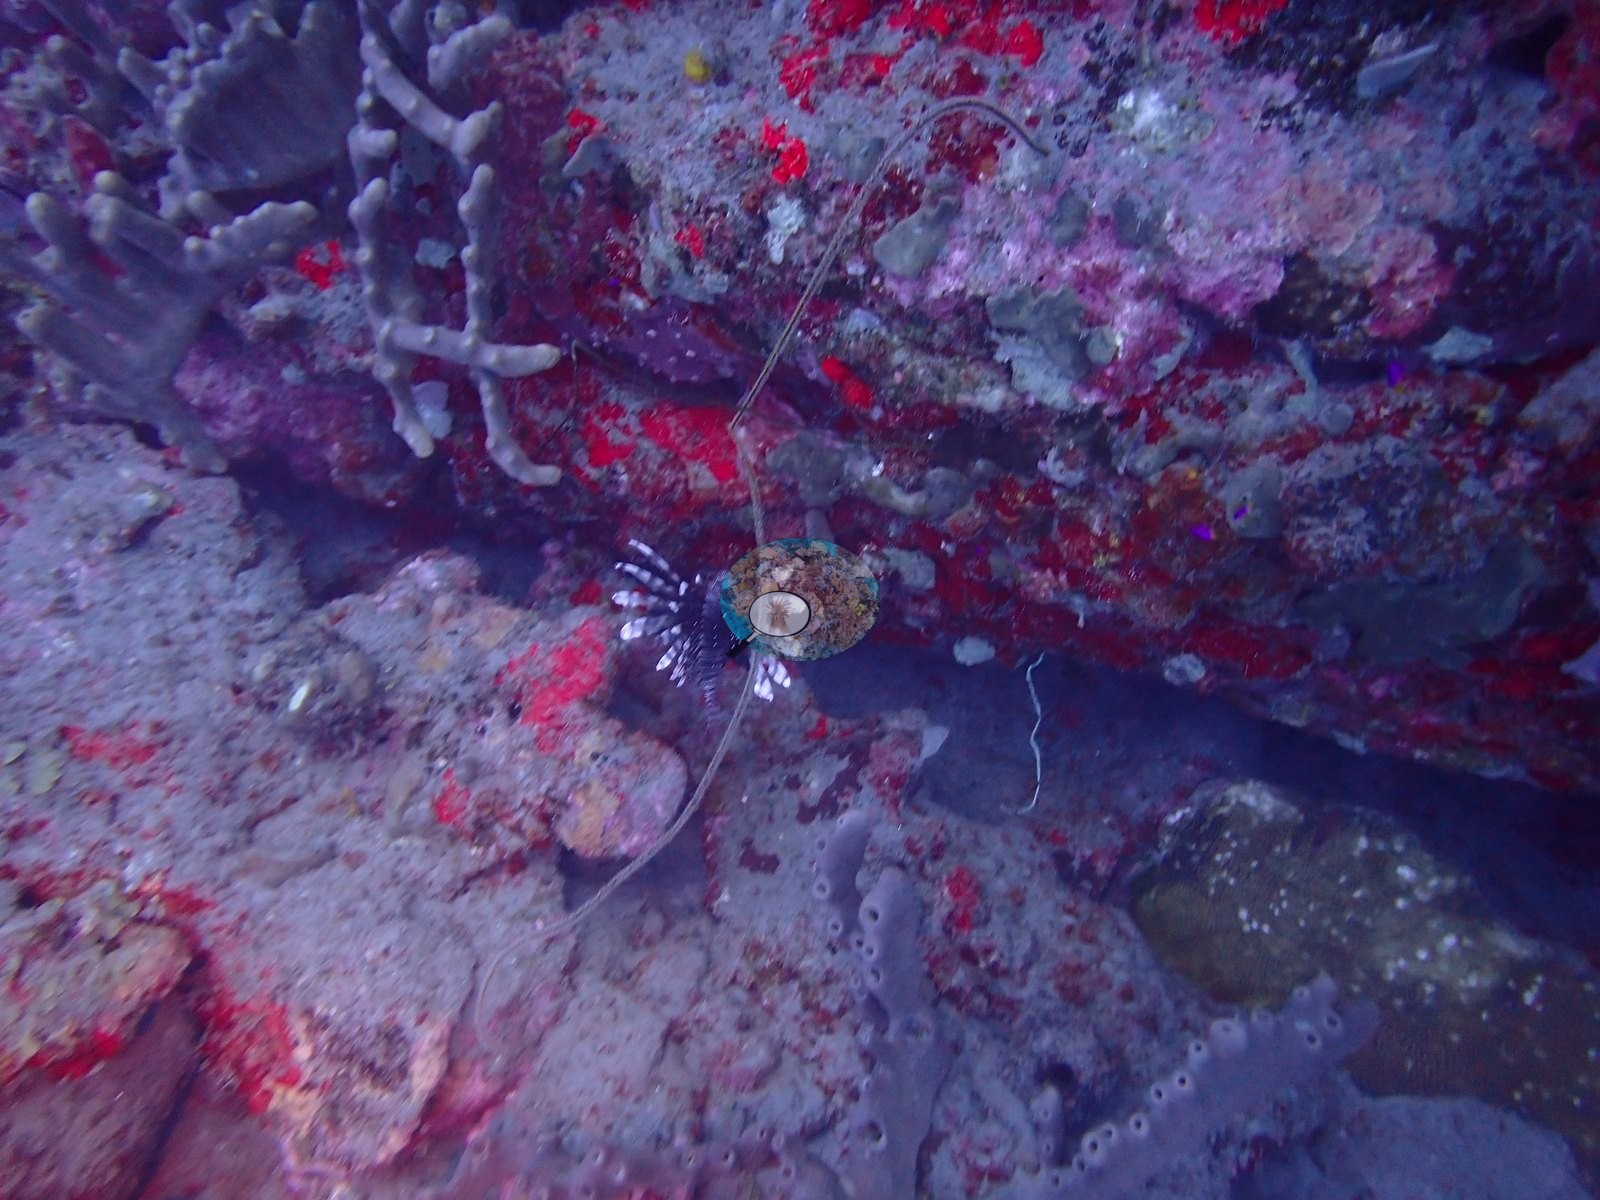
One invasive lionfish (Pterois volitans) sits between pink tube sponges (e.g., Image 45).
Comparisons with other data
No independent survey was made at this exact site; the nearest ones are listed in the table below.
Dive record
Tent Reef drift, Saba National Marine Park, reviewed frame by frame from all 82 unedited stills of dive 1, 21 Feb 2026.
CV model comparison
More info
DINOv3 and CoralSCOP were run on the same photos and are listed for comparison. Coralscapes v2 and v1 were also run but are not shown: Anderson does not consider Coralscapes reliable for these photos. No diver transect exists for this trip, so agreement between the rows is not accuracy, and as of September 2026 no computer-vision method estimates coral cover accurately on new images; treat every row as indicative.| Method | Hard-coral cover (%) |
|---|---|
| In-house DINOv3 | 17.7 |
| CoralSCOP unedited | 22.1 |
| Claude | 4.3 |
Independent surveys nearby
 Dr. Coral (CRD)
Within 5 km, 3 independent survey stations recorded hard coral cover in 7 surveys between 2024 and 2025. Of the 1 station surveyed in more than one year, 1 increased between their first and latest surveys. The longest record, Black_Rock_Donor (MERMAID project “Saba_Marina_Relocation”*, 1.52 km away), went from 1.7% in 2024 to 10% in 2025. Surveys since 2021 average 6.0% (range 1.7–10%, n=4). This site's own estimate (4.3%) sits within the recent range (1.7–10%); the methods differ, so the comparison is context, not a like-for-like test.
Collected by other programs using different methods (MERMAID is a data platform: each MERMAID row names the organization that did the survey, and its method is in the row's hover text. *Conducted by citizen scientists), so these are context for the figures above, not a like-for-like comparison. Where a station was surveyed more than once the range is shown. Station names are not dive-site names.
| Agency | Site / location | Date | Hard coral cover (%) | Distance | Link |
|---|---|---|---|---|---|
| MERMAID project “Saba_Marina_Relocation”* | Black_Rock_Donor | 2024–2025 | 1.7–10% (2 surveys) | 1.52 km | Bean T, Gould K, Re E. 2025. Saba_Marina_Relocation. MERMAID |
| MERMAID project “Saba_Marina_Relocation”* | Hole_in_the_Corner_(HITC)_Recipient | 2024 | 6.5% | 3.21 km | Bean T, Gould K, Re E. 2025. Saba_Marina_Relocation. MERMAID |
| MERMAID project “Saba_Marina_Relocation”* | Black_Rock_Donor (mean of 2 surveys, 2024–2025) | 2025 | 5.8% (4 surveys) | 1.52 km | Bean T, Gould K, Re E. 2025. Saba_Marina_Relocation. MERMAID |
Data & links
All images from Coral Reef Diagnostics. Data are from Coral Reef Diagnostics and the organizations named in the data-sources table above.
© Coral Reef Diagnostics.