Coral Reef Diagnostics

Bahrain

NOAA Coral Reef Watch

Regional summary of 4 dive sites. Figures are averages across the sites that report them (n = sites with a value); each site's own page has its individual values.

⬇ Download this region as a report card
05
Coral Reef Diagnostics
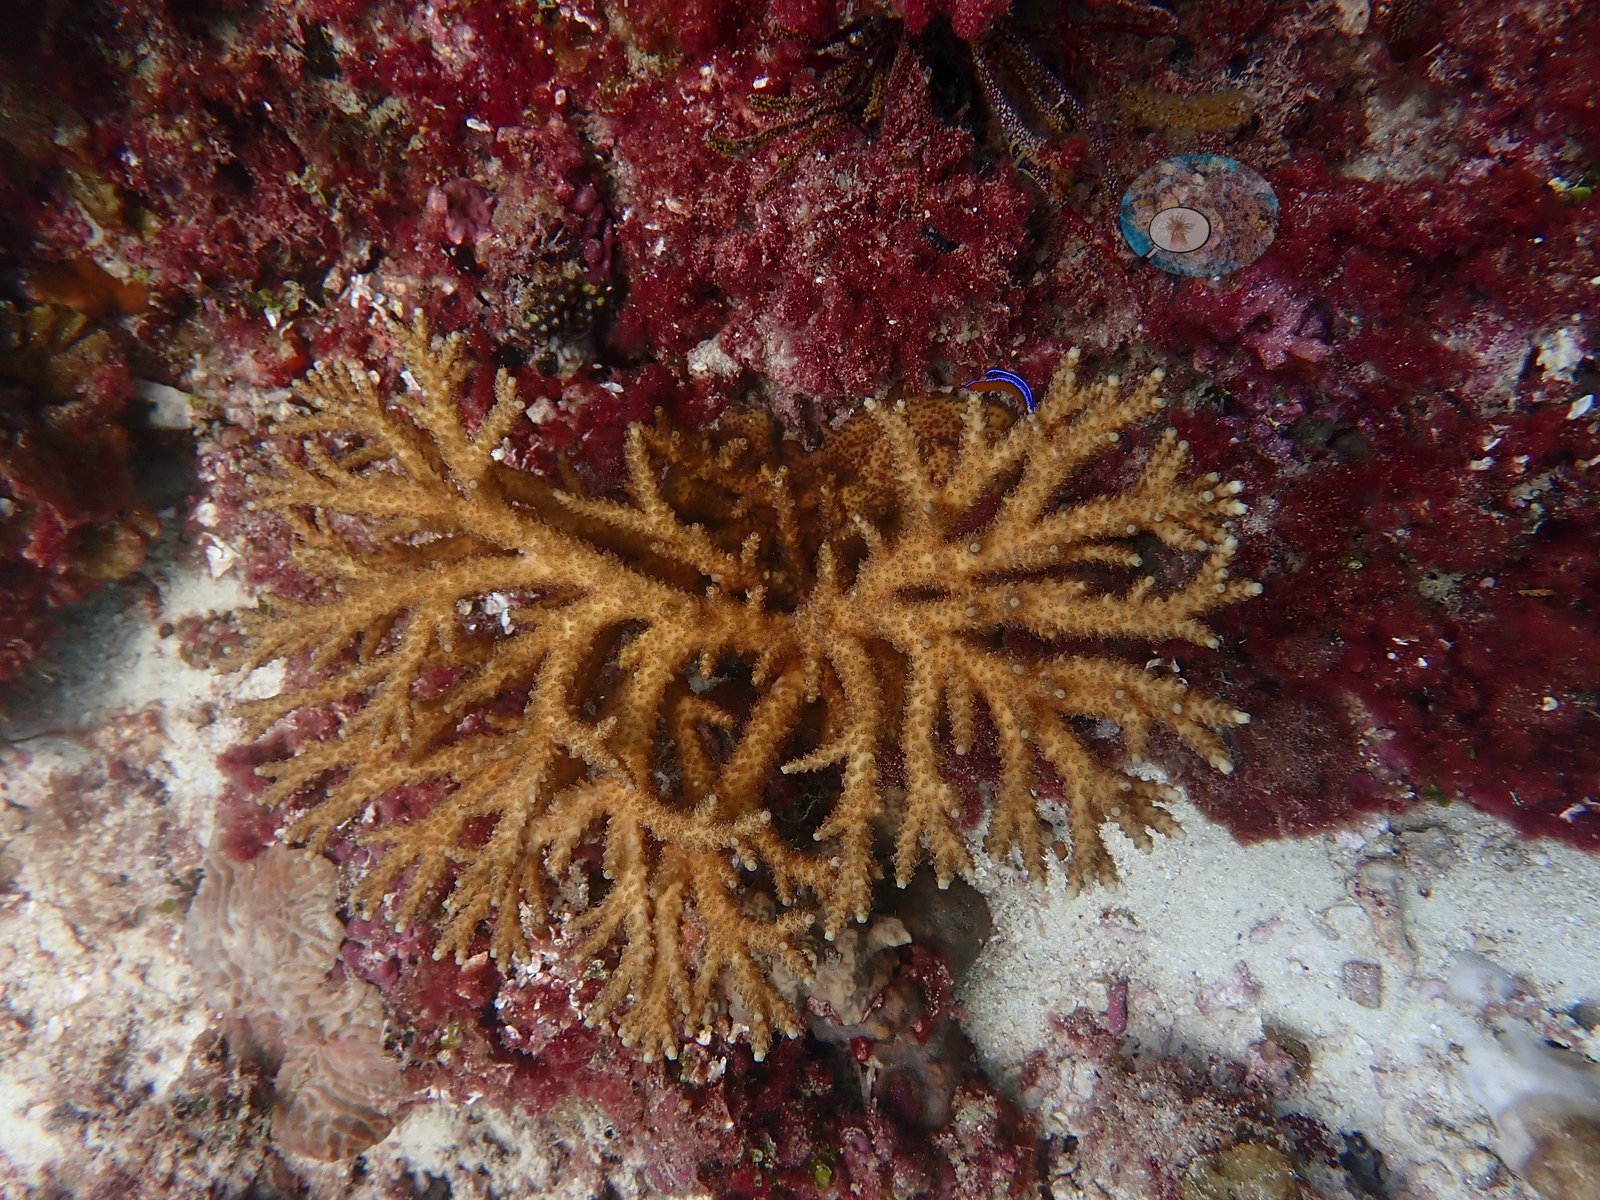
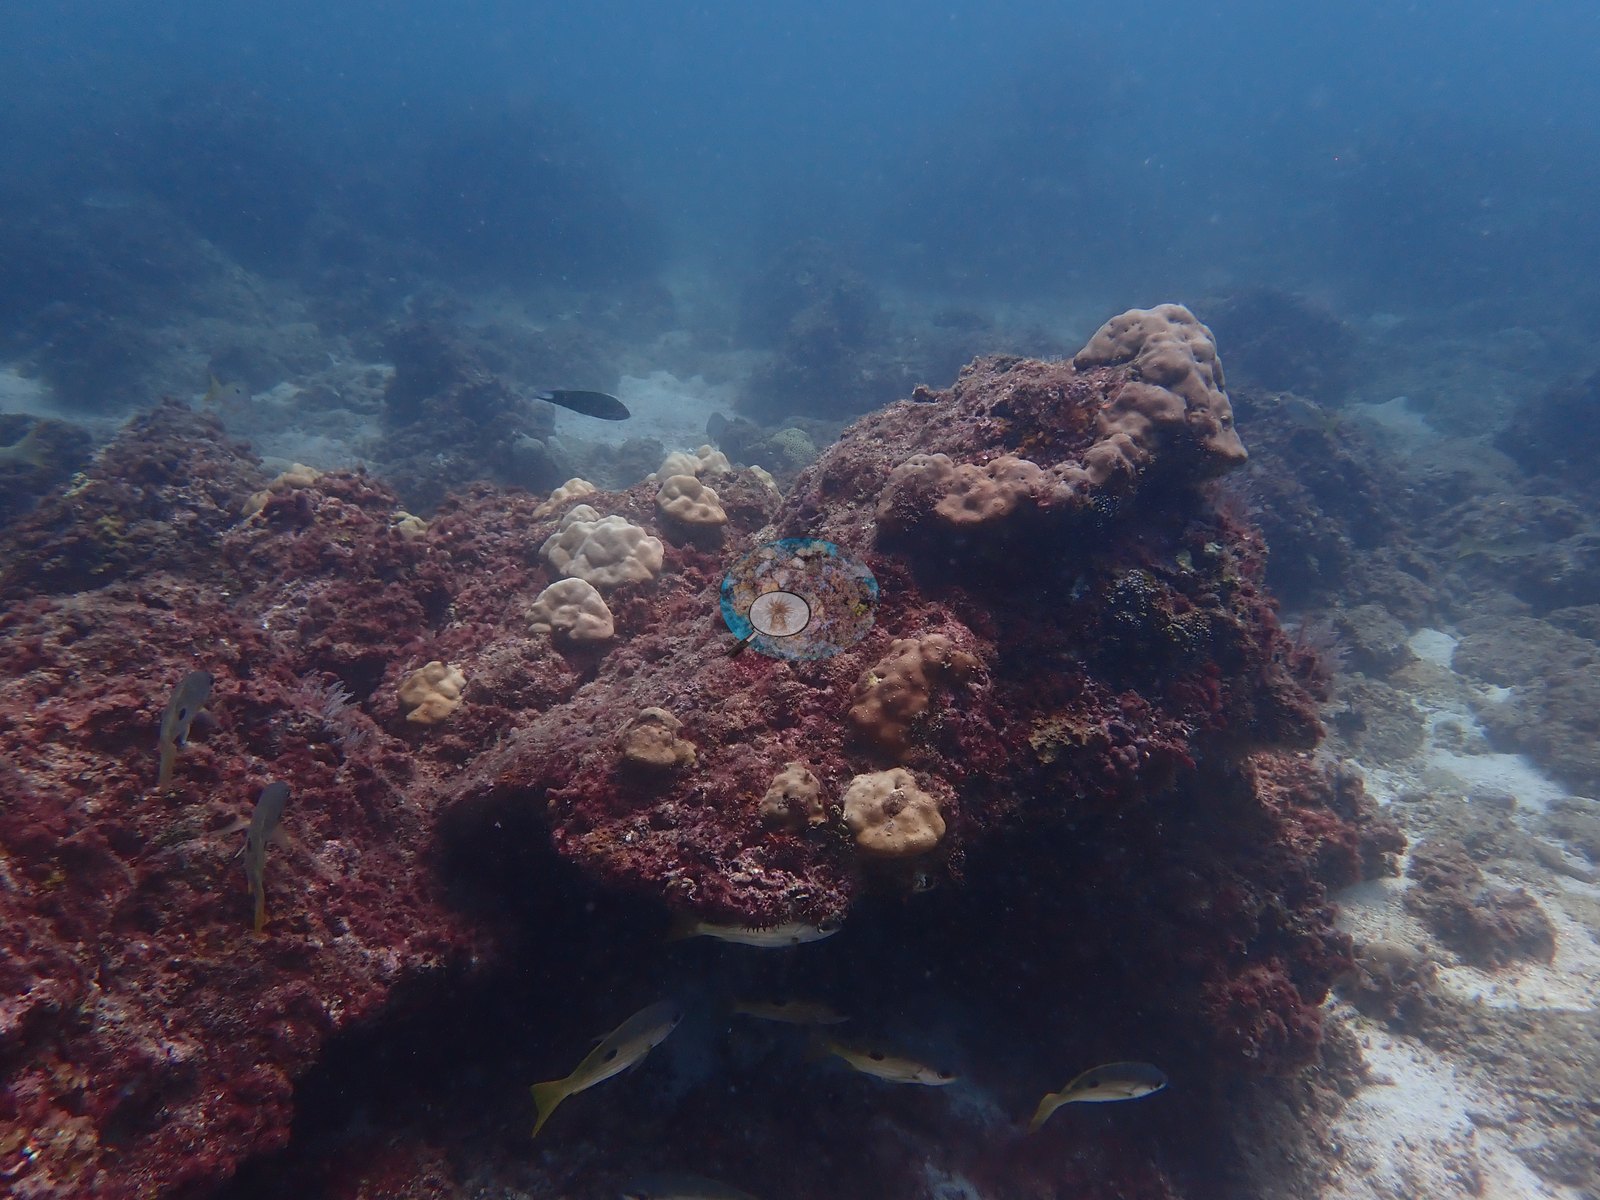
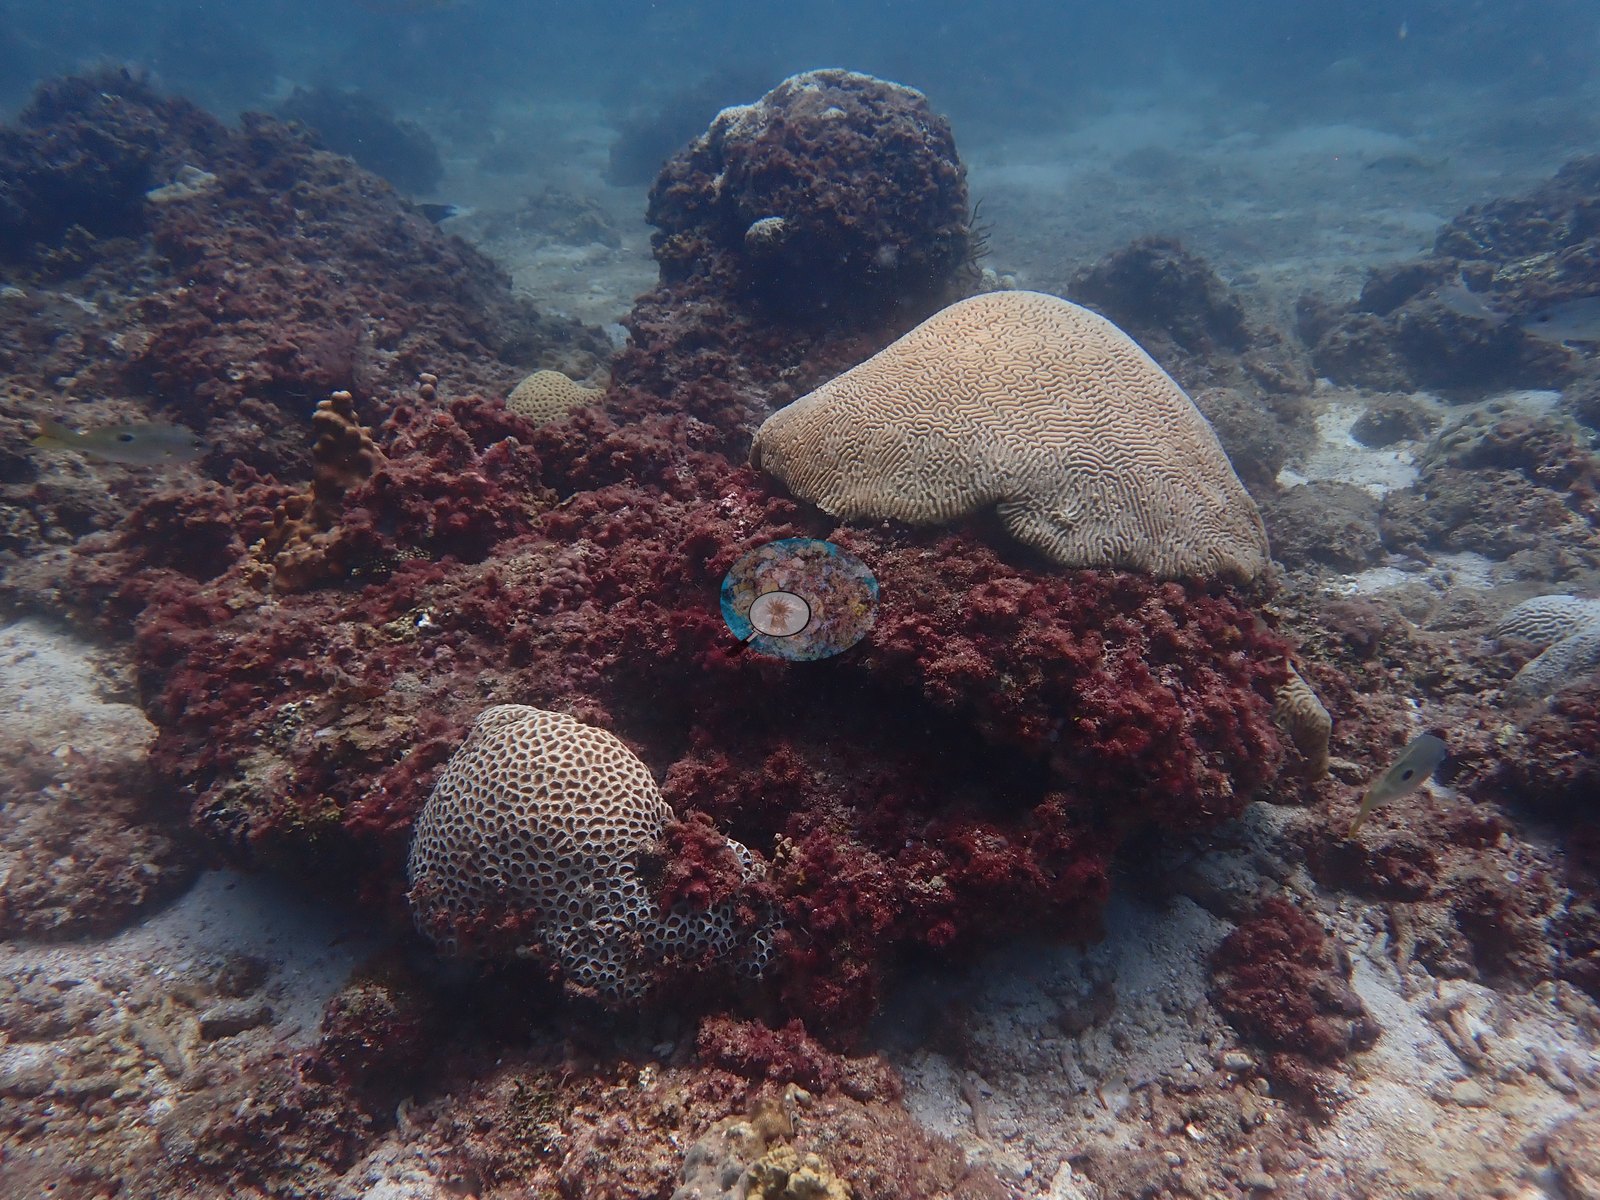
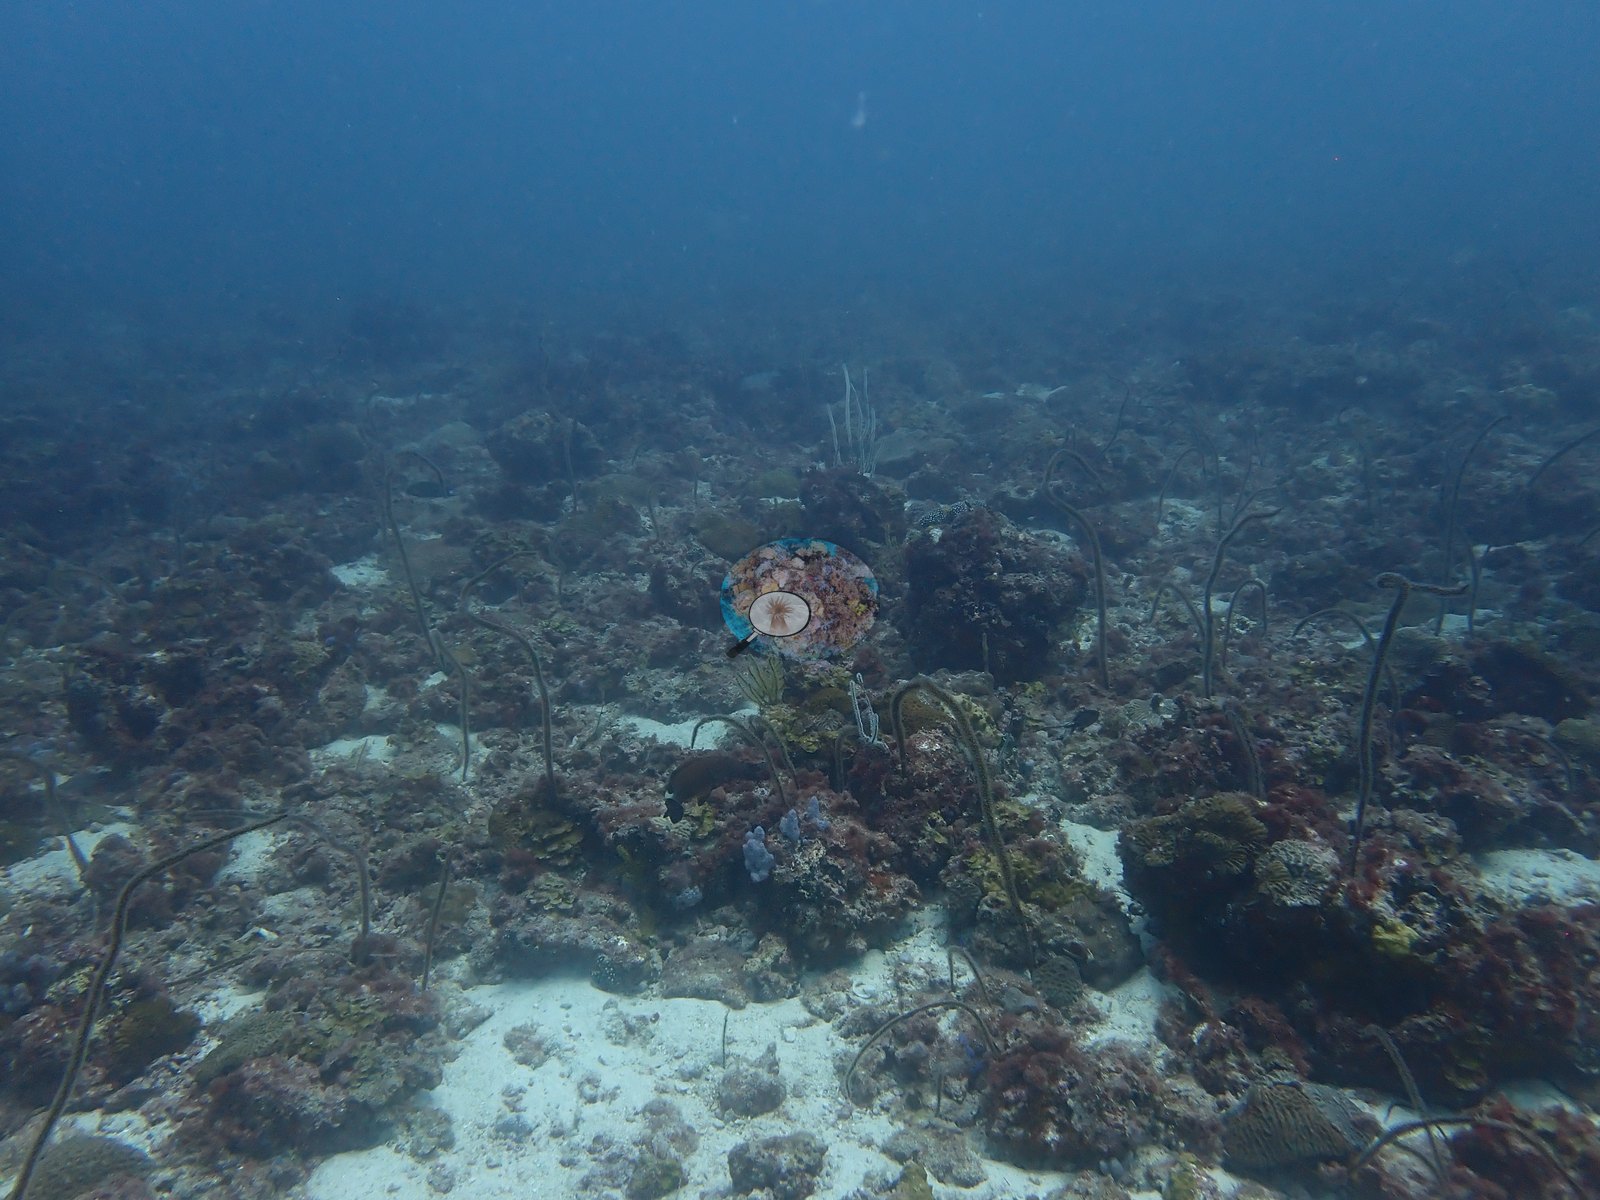
Photo: Anderson Mayfield/Coral Reef Diagnostics — Hayr Bul Thamah (Bahrain)
Country
Bahrain
Sites
4
each linked below
Hard coral cover (regional mean; Claude computer vision)
2.8% ± 4.7% (std. dev.)
n=4. range 0.0–9.9%
Water temp. during surveys (regional mean)
34.0°C
n = 3 of 4 sites; surveyed Sep 2023–Aug 2024
Coral Health Index (regional mean)
1.50 / 5
n = 1 of 4 sites; scale of zero to five, higher is healthier
Most recent water temperature record
26 Oct 2026 · Bahrain
Most recent heat stress record
26 Oct 2026 · NOAA alert that day: no stress (water now below the bleaching threshold; 11.1°C-weeks built up over the last 12 weeks)
Mean annual max degree heating weeks (DHW), last 5 years
2021–2025 · Bahrain
Highest annual heat stress
in 1986 · Bahrain
Severe heat-stress years
1985–2025 · 6 in the last 10 years
Heat-stress figures: NOAA Coral Reef Watch — Bahrain 5-km virtual station. Each pill links its source record and carries the values behind it.

Heat stress

04812Week of 2023-07-23: DHW 0.4°C-weeks (below the bleaching alert threshold); SST 34.15°CWeek of 2023-07-30: DHW 2.0°C-weeks (below the bleaching alert threshold); SST 35.05°CWeek of 2023-08-06: DHW 3.5°C-weeks (below the bleaching alert threshold); SST 34.87°CWeek of 2023-08-13: DHW 5.4°C-weeks (Alert Level 1: significant bleaching likely); SST 35.09°CWeek of 2023-08-20: DHW 7.3°C-weeks (Alert Level 1: significant bleaching likely); SST 35.08°CWeek of 2023-08-27: DHW 8.8°C-weeks (Alert Level 2+: severe bleaching and significant mortality likely); SST 34.85°CWeek of 2023-09-03: DHW 10.1°C-weeks (Alert Level 2+: severe bleaching and significant mortality likely); SST 34.56°CWeek of 2023-09-10: DHW 11.3°C-weeks (Alert Level 2+: severe bleaching and significant mortality likely); SST 34.50°CWeek of 2023-09-17: DHW 11.3°C-weeks (Alert Level 2+: severe bleaching and significant mortality likely); SST 33.36°CWeek of 2023-09-24: DHW 11.3°C-weeks (Alert Level 2+: severe bleaching and significant mortality likely); SST 33.50°CWeek of 2023-10-01: DHW 11.3°C-weeks (Alert Level 2+: severe bleaching and significant mortality likely); SST 32.92°CWeek of 2023-10-08: DHW 11.3°C-weeks (Alert Level 2+: severe bleaching and significant mortality likely); SST 32.35°CWeek of 2023-10-15: DHW 11.3°C-weeks (Alert Level 2+: severe bleaching and significant mortality likely); SST 32.14°CWeek of 2023-10-22: DHW 10.7°C-weeks (Alert Level 2+: severe bleaching and significant mortality likely); SST 31.39°CWeek of 2023-10-29: DHW 9.1°C-weeks (Alert Level 2+: severe bleaching and significant mortality likely); SST 30.65°CWeek of 2023-11-05: DHW 7.5°C-weeks (Alert Level 1: significant bleaching likely); SST 29.70°CWeek of 2023-11-12: DHW 5.6°C-weeks (Alert Level 1: significant bleaching likely); SST 29.11°CWeek of 2023-11-19: DHW 3.8°C-weeks (below the bleaching alert threshold); SST 28.10°CWeek of 2023-11-26: DHW 2.3°C-weeks (below the bleaching alert threshold); SST 27.19°CWeek of 2023-12-03: DHW 1.0°C-weeks (below the bleaching alert threshold); SST 26.31°CWeek of 2024-06-16: DHW 0.2°C-weeks (below the bleaching alert threshold); SST 34.00°CWeek of 2024-06-23: DHW 0.7°C-weeks (below the bleaching alert threshold); SST 34.41°CWeek of 2024-06-30: DHW 0.7°C-weeks (below the bleaching alert threshold); SST 33.51°CWeek of 2024-07-07: DHW 0.7°C-weeks (below the bleaching alert threshold); SST 33.72°CWeek of 2024-07-14: DHW 0.7°C-weeks (below the bleaching alert threshold); SST 34.04°CWeek of 2024-07-21: DHW 1.7°C-weeks (below the bleaching alert threshold); SST 34.57°CWeek of 2024-07-28: DHW 1.7°C-weeks (below the bleaching alert threshold); SST 33.85°CWeek of 2024-08-04: DHW 1.8°C-weeks (below the bleaching alert threshold); SST 33.99°CWeek of 2024-08-11: DHW 3.5°C-weeks (below the bleaching alert threshold); SST 34.94°CWeek of 2024-08-18: DHW 5.4°C-weeks (Alert Level 1: significant bleaching likely); SST 35.17°CWeek of 2024-08-25: DHW 7.2°C-weeks (Alert Level 1: significant bleaching likely); SST 35.13°CWeek of 2024-09-01: DHW 8.2°C-weeks (Alert Level 2+: severe bleaching and significant mortality likely); SST 34.49°CWeek of 2024-09-08: DHW 9.3°C-weeks (Alert Level 2+: severe bleaching and significant mortality likely); SST 34.57°CWeek of 2024-09-15: DHW 9.0°C-weeks (Alert Level 2+: severe bleaching and significant mortality likely); SST 33.97°CWeek of 2024-09-22: DHW 8.6°C-weeks (Alert Level 2+: severe bleaching and significant mortality likely); SST 33.39°CWeek of 2024-09-29: DHW 8.6°C-weeks (Alert Level 2+: severe bleaching and significant mortality likely); SST 32.72°CWeek of 2024-10-06: DHW 8.6°C-weeks (Alert Level 2+: severe bleaching and significant mortality likely); SST 31.84°CWeek of 2024-10-13: DHW 8.6°C-weeks (Alert Level 2+: severe bleaching and significant mortality likely); SST 31.77°CWeek of 2024-10-20: DHW 7.7°C-weeks (Alert Level 1: significant bleaching likely); SST 30.95°CWeek of 2024-10-27: DHW 7.7°C-weeks (Alert Level 1: significant bleaching likely); SST 29.47°CWeek of 2024-11-03: DHW 7.3°C-weeks (Alert Level 1: significant bleaching likely); SST 28.83°CWeek of 2024-11-10: DHW 5.6°C-weeks (Alert Level 1: significant bleaching likely); SST 27.96°CWeek of 2024-11-17: DHW 3.6°C-weeks (below the bleaching alert threshold); SST 27.46°CWeek of 2024-11-24: DHW 2.0°C-weeks (below the bleaching alert threshold); SST 26.80°CWeek of 2024-12-01: DHW 0.9°C-weeks (below the bleaching alert threshold); SST 25.48°CWeek of 2025-07-27: DHW 0.3°C-weeks (below the bleaching alert threshold); SST 34.23°CWeek of 2025-08-03: DHW 1.1°C-weeks (below the bleaching alert threshold); SST 34.43°CWeek of 2025-08-10: DHW 2.8°C-weeks (below the bleaching alert threshold); SST 35.03°CWeek of 2025-08-17: DHW 4.5°C-weeks (Alert Level 1: significant bleaching likely); SST 35.11°CWeek of 2025-08-24: DHW 6.3°C-weeks (Alert Level 1: significant bleaching likely); SST 35.05°CWeek of 2025-08-31: DHW 7.1°C-weeks (Alert Level 1: significant bleaching likely); SST 34.33°CWeek of 2025-09-07: DHW 7.1°C-weeks (Alert Level 1: significant bleaching likely); SST 34.16°CWeek of 2025-09-14: DHW 7.1°C-weeks (Alert Level 1: significant bleaching likely); SST 33.77°CWeek of 2025-09-21: DHW 7.1°C-weeks (Alert Level 1: significant bleaching likely); SST 32.64°CWeek of 2025-09-28: DHW 7.1°C-weeks (Alert Level 1: significant bleaching likely); SST 31.77°CWeek of 2025-10-05: DHW 7.1°C-weeks (Alert Level 1: significant bleaching likely); SST 31.27°CWeek of 2025-10-12: DHW 7.1°C-weeks (Alert Level 1: significant bleaching likely); SST 30.77°CWeek of 2025-10-19: DHW 7.1°C-weeks (Alert Level 1: significant bleaching likely); SST 30.40°CWeek of 2025-10-26: DHW 6.8°C-weeks (Alert Level 1: significant bleaching likely); SST 29.75°CWeek of 2025-11-02: DHW 5.7°C-weeks (Alert Level 1: significant bleaching likely); SST 29.06°CWeek of 2025-11-09: DHW 4.0°C-weeks (Alert Level 1: significant bleaching likely); SST 28.37°CWeek of 2025-11-16: DHW 2.3°C-weeks (below the bleaching alert threshold); SST 28.13°CWeek of 2025-11-23: DHW 0.6°C-weeks (below the bleaching alert threshold); SST 27.12°CWeek of 2026-07-26: DHW 0.4°C-weeks (below the bleaching alert threshold); SST 34.08°CWeek of 2026-08-02: DHW 2.3°C-weeks (below the bleaching alert threshold); SST 35.26°CWeek of 2026-08-09: DHW 4.7°C-weeks (Alert Level 1: significant bleaching likely); SST 35.68°CWeek of 2026-08-16: DHW 6.9°C-weeks (Alert Level 1: significant bleaching likely); SST 35.57°CWeek of 2026-08-23: DHW 8.6°C-weeks (Alert Level 2+: severe bleaching and significant mortality likely); SST 35.10°CWeek of 2026-08-30: DHW 9.6°C-weeks (Alert Level 2+: severe bleaching and significant mortality likely); SST 34.56°CWeek of 2026-09-06: DHW 10.6°C-weeks (Alert Level 2+: severe bleaching and significant mortality likely); SST 34.53°CWeek of 2026-09-13: DHW 11.5°C-weeks (Alert Level 2+: severe bleaching and significant mortality likely); SST 34.42°CWeek of 2026-09-20: DHW 11.8°C-weeks (Alert Level 2+: severe bleaching and significant mortality likely); SST 34.12°CWeek of 2026-09-27: DHW 11.9°C-weeks (Alert Level 2+: severe bleaching and significant mortality likely); SST 34.09°C18202224262830323436Bleaching threshold 34.4°C2023202420252026SST (°C)DHW (°C-weeks)
sea surface temperature (SST) (left axis)DHW under 2DHW 2–3DHW 3–5DHW 5–8DHW 8–10DHW over 10 (🔥 above 12)
Daily SST (line) and weekly maximum Degree Heating Weeks (bars), Jan 2023–Oct 2026, NOAA Coral Reef Watch 5-km Bahrain virtual station. Dashed line: bleaching threshold (maximum monthly mean 33.4°C + 1°C). DHW ≥ 4: bleaching likely; ≥ 8: severe bleaching and mortality likely. A bar is drawn only where DHW exceeds zero, so a stretch with no bar is accumulated heat stress of zero, not missing data — the SST line runs the full period.

Long-term record: 9 years from 1985 through 2025 reached 8 or more °C-weeks at NOAA’s Bahrain station. Download the annual DHW data (CSV).

4 sites in this region — click a marker to open that site.

Overview

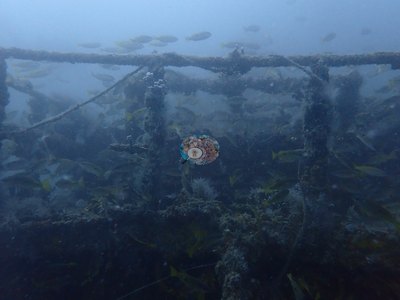
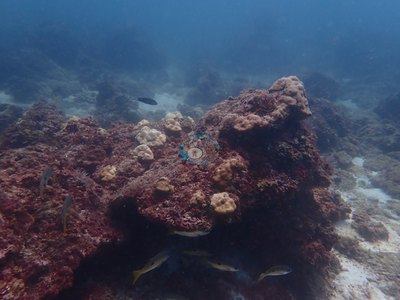
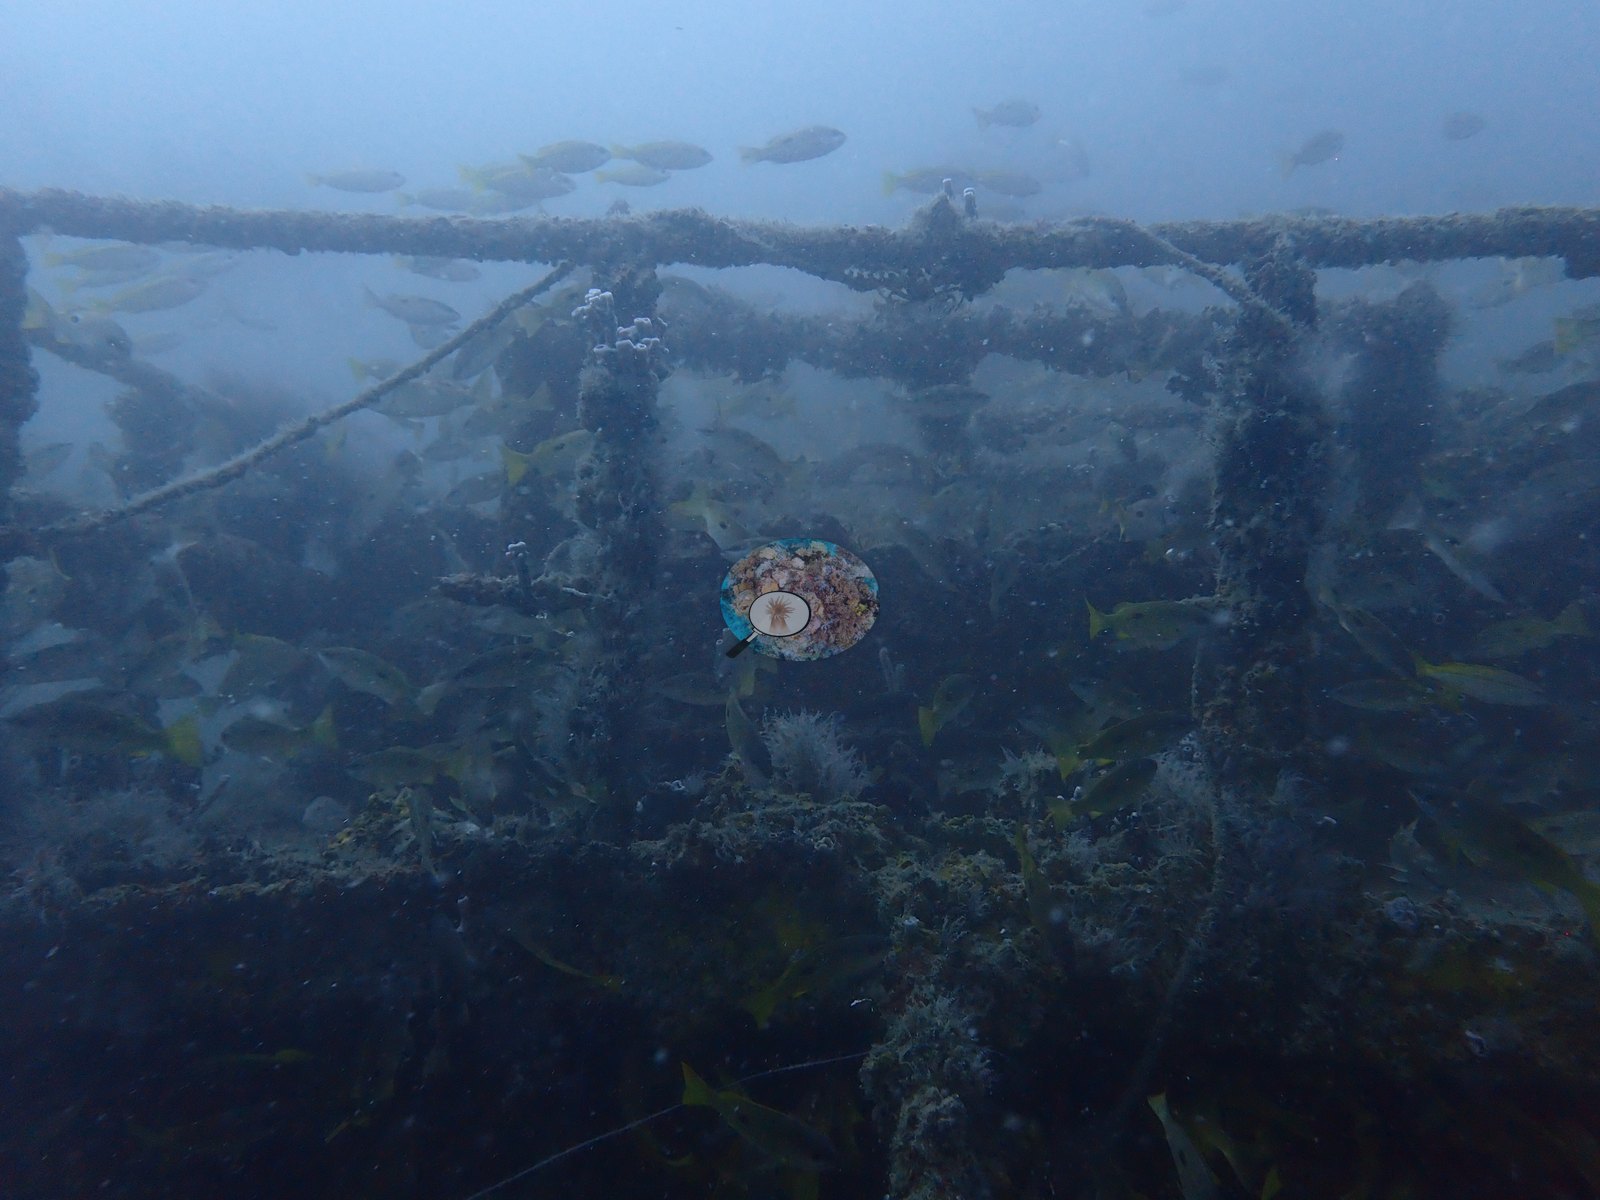
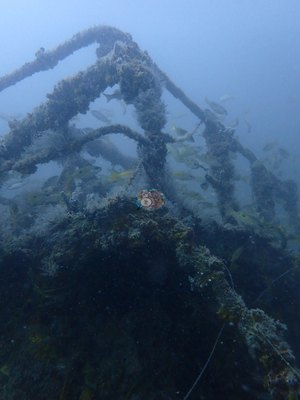
Bahrain's 4 sites come from two days in the Arabian Gulf. On 23 September 2023 Anderson dived Dilmunia Rock, a shallow rocky ledge less than 2 km off the coast, and a nearby artificial reef of dome-shaped units on sand in turbid water. On 23 August 2024 Anderson went offshore with Sea Addicts from Amwaj Marina, first to the Al-Boom wreck and then to Hayr Bul Thamah (Bul Thamah), an offshore reef about 80 km northeast of the main island inside a marine protected national park.

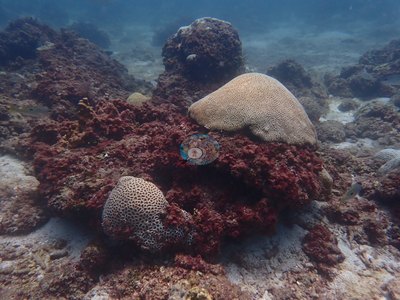
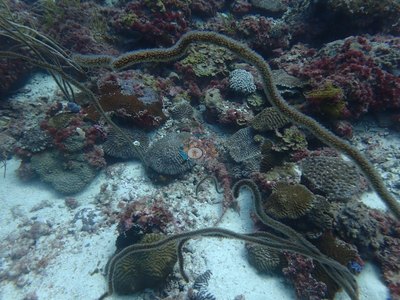
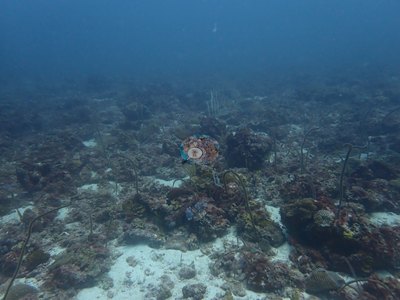
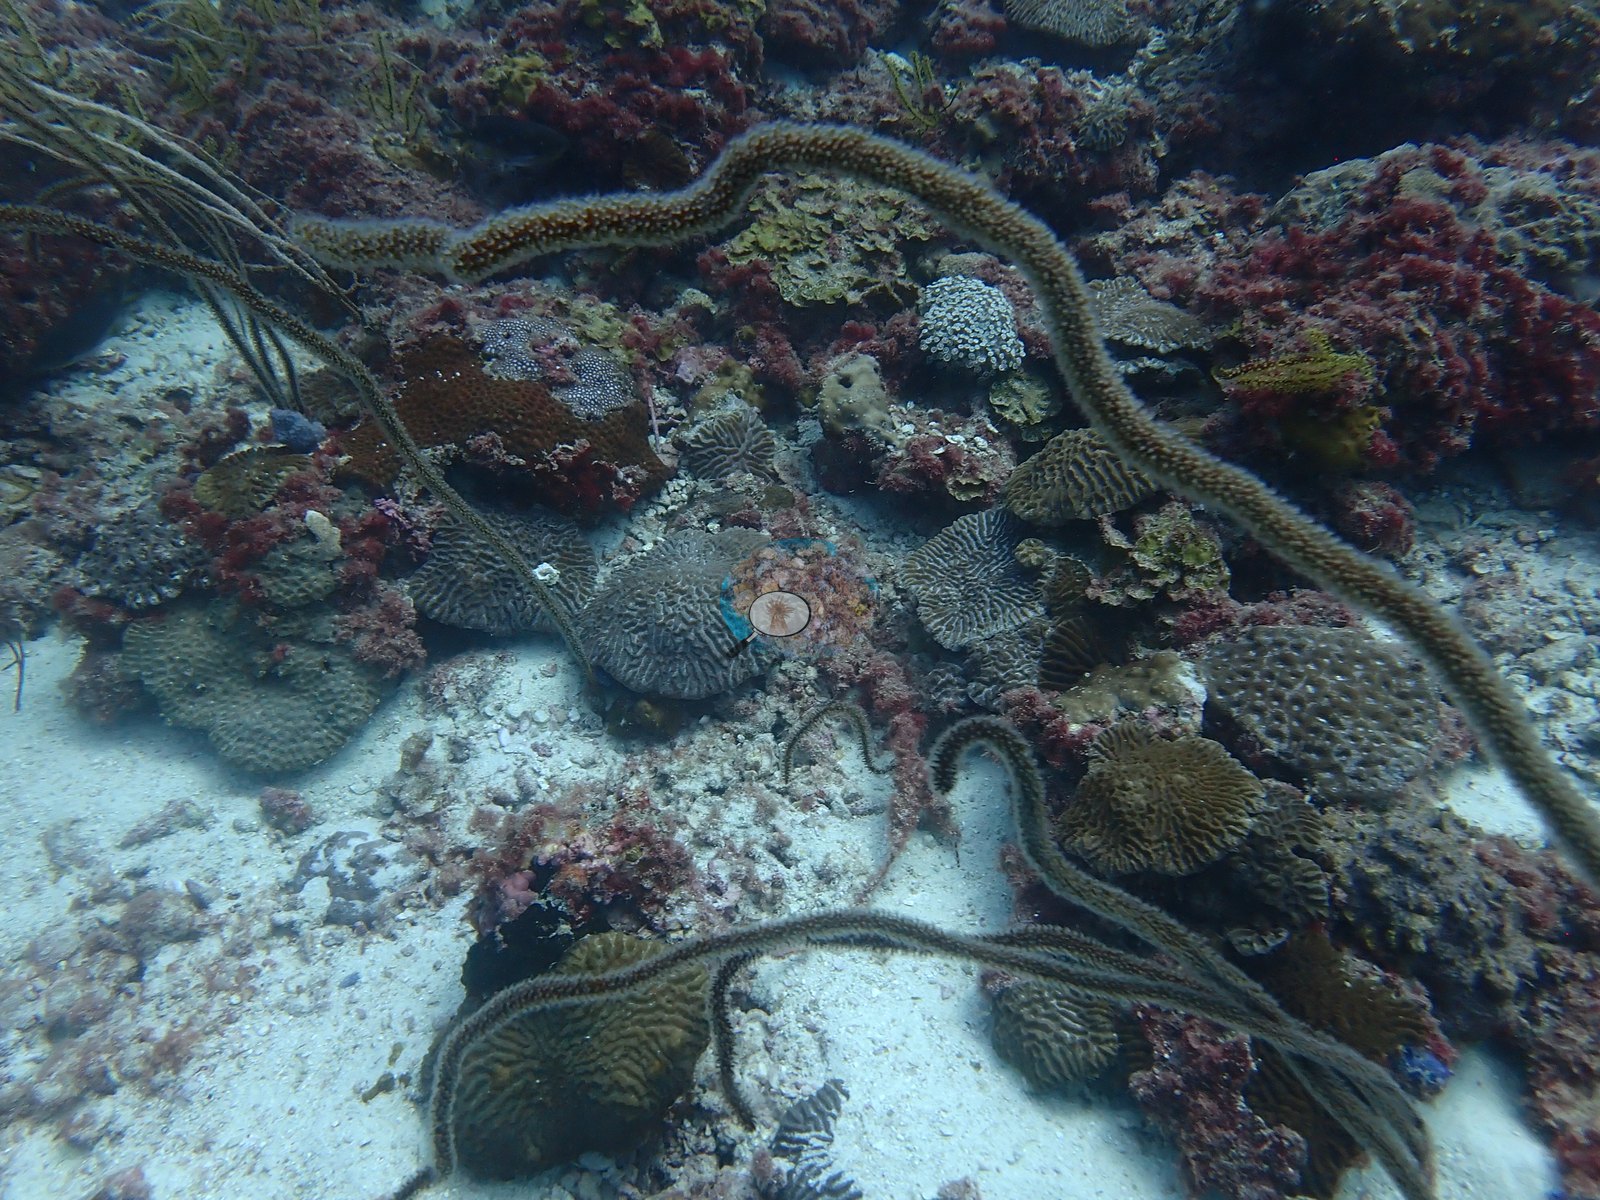
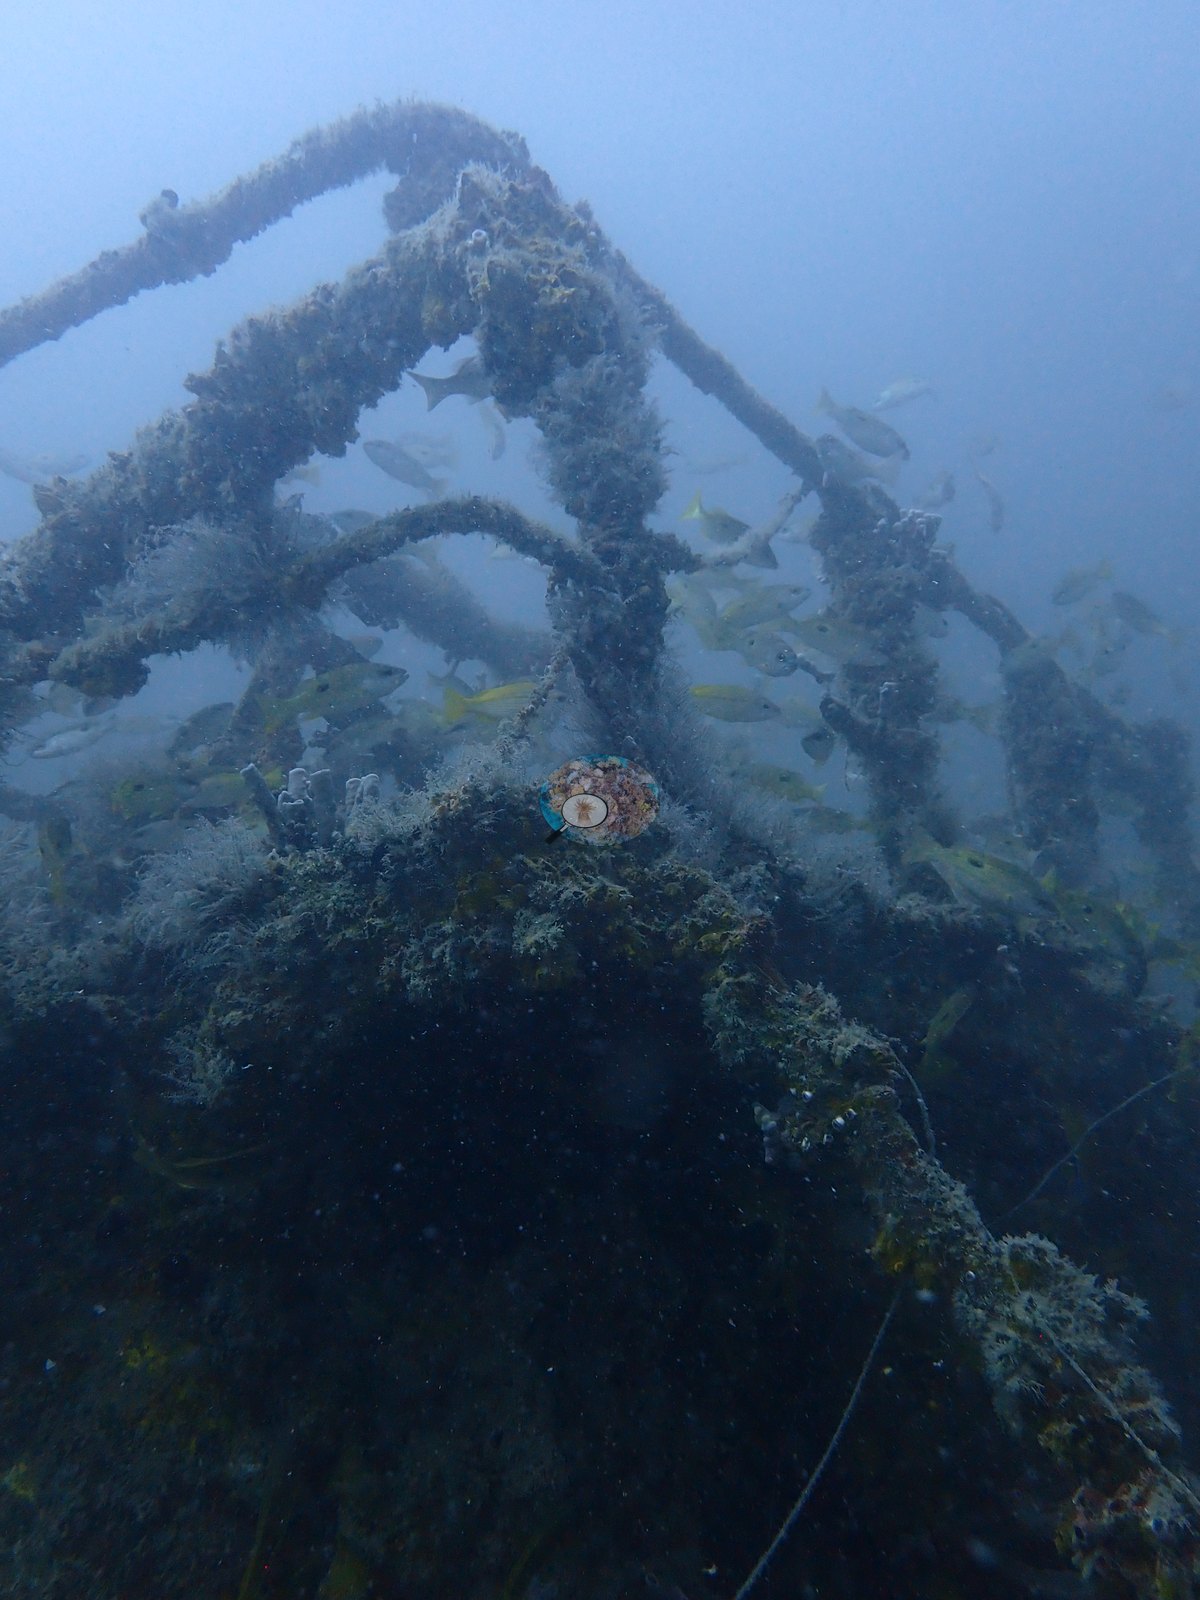
Coral cover is low everywhere. Blind Claude computer-vision point counts of Anderson's photographs give 0.5% at Dilmunia Rock and 0.9% at the artificial reef, where turf and sediment rather than coral cover the structures, and 9.9% at Hayr Bul Thamah, where red algal turf covers most of the rock between scattered brain and meandroid colonies, sea fans, and fields of whip corals. Hayr Bul Thamah also holds a single healthy-looking golden branching colony, notable because a 2017–2018 survey found no branching corals there. Some brain colonies there show patches of tissue loss now overgrown by algae, and a few colonies are pale or white. The Al-Boom wreck, an upright, heavily fouled hull wrapped in schools of yellow snappers, gave 0.0%; as a wreck it is counted in the regional mean like every other site.

Other programs' older surveys mostly put Bul Thamah above today's photo-based value: Reef Check recorded 24–46% hard coral in 1998–1999 but about 12% in 2000, published surveys found about 15–16% in the 2010s, and the 2010 bleaching event is estimated to have cost the reef about two-thirds of its coral. The 2024 dives were in late August, when Gulf water is at its warmest (34°C on Anderson's dive computer).

Highlights

Notable observations

Coral cover over time (pooled)

One point per year: the mean of every hard coral cover value available for this region that year — Anderson’s own dives and every independent survey station within 5 km of them. The vertical bar is the full range behind that mean. Different programs use different methods at different stations, so this is a regional summary, not a single comparable series. Years resting on fewer than three values are drawn as smaller points (1998, 1999, 2000, 2023, 2024). Non-CRD points are from Reef Check Foundation. Marker shape: Anderson’s own dives, other organizations’ surveys.
0%12%24%36%48%1998 bleaching1998201120241998: mean 30% of 2 values (range 24–36%)1999: mean 35% of 2 values (range 25–46%)2000: mean 12% of 2 values (range 12–13%)2023: mean 0.7% of 2 values (range 0.5–0.9%)2024: mean 5.0% of 2 values (range 0.0–9.9%)

Sites in this region

* Based on only 10–19 reef-habitat photos; this estimate is less certain.

Nearby external survey stations

6 independent survey records within 5 km of a site in this region (each record counted once).

All images from Coral Reef Diagnostics. Data are from Coral Reef Diagnostics and Reef Check Foundation.

© Coral Reef Diagnostics.