Coral Reef Diagnostics

Fiji - Nayau

Khaled bin Sultan Living Oceans Foundation — Global Reef Expedition

Island summary of 4 dive sites. Figures are averages across the sites that report them (n = sites with a value); each site's own page has its individual values. Part of the Fiji - Northern Lau (Vanua Balavu / Cicia / Nayau) regional summary.

⬇ Download this island as a report card
05
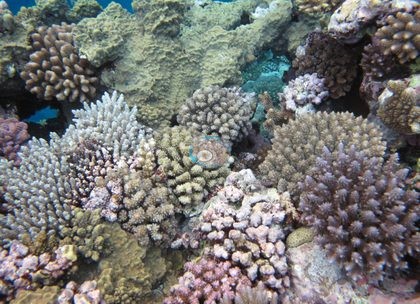
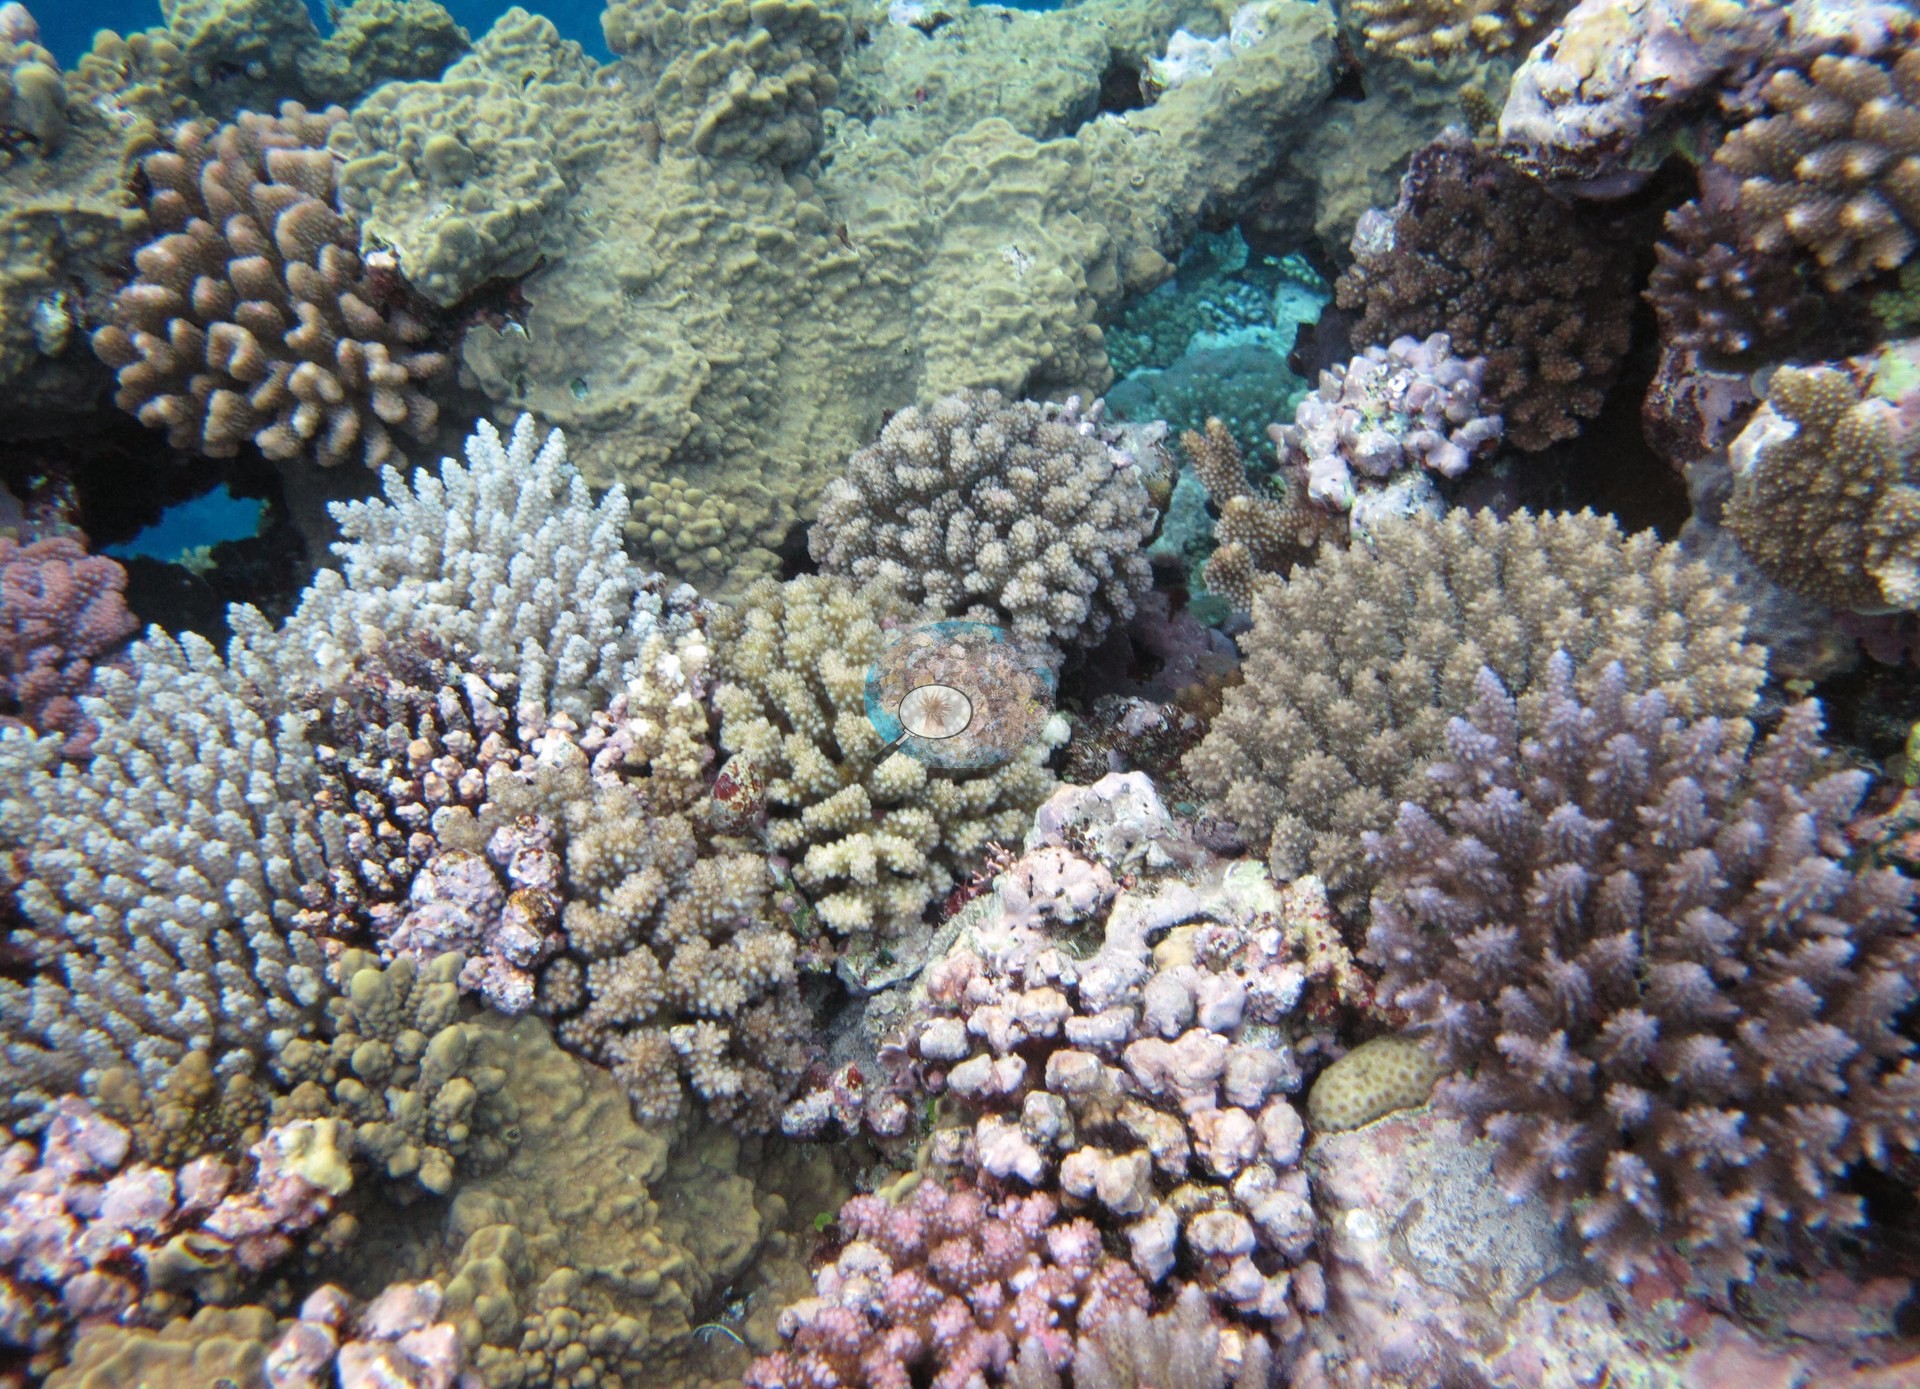
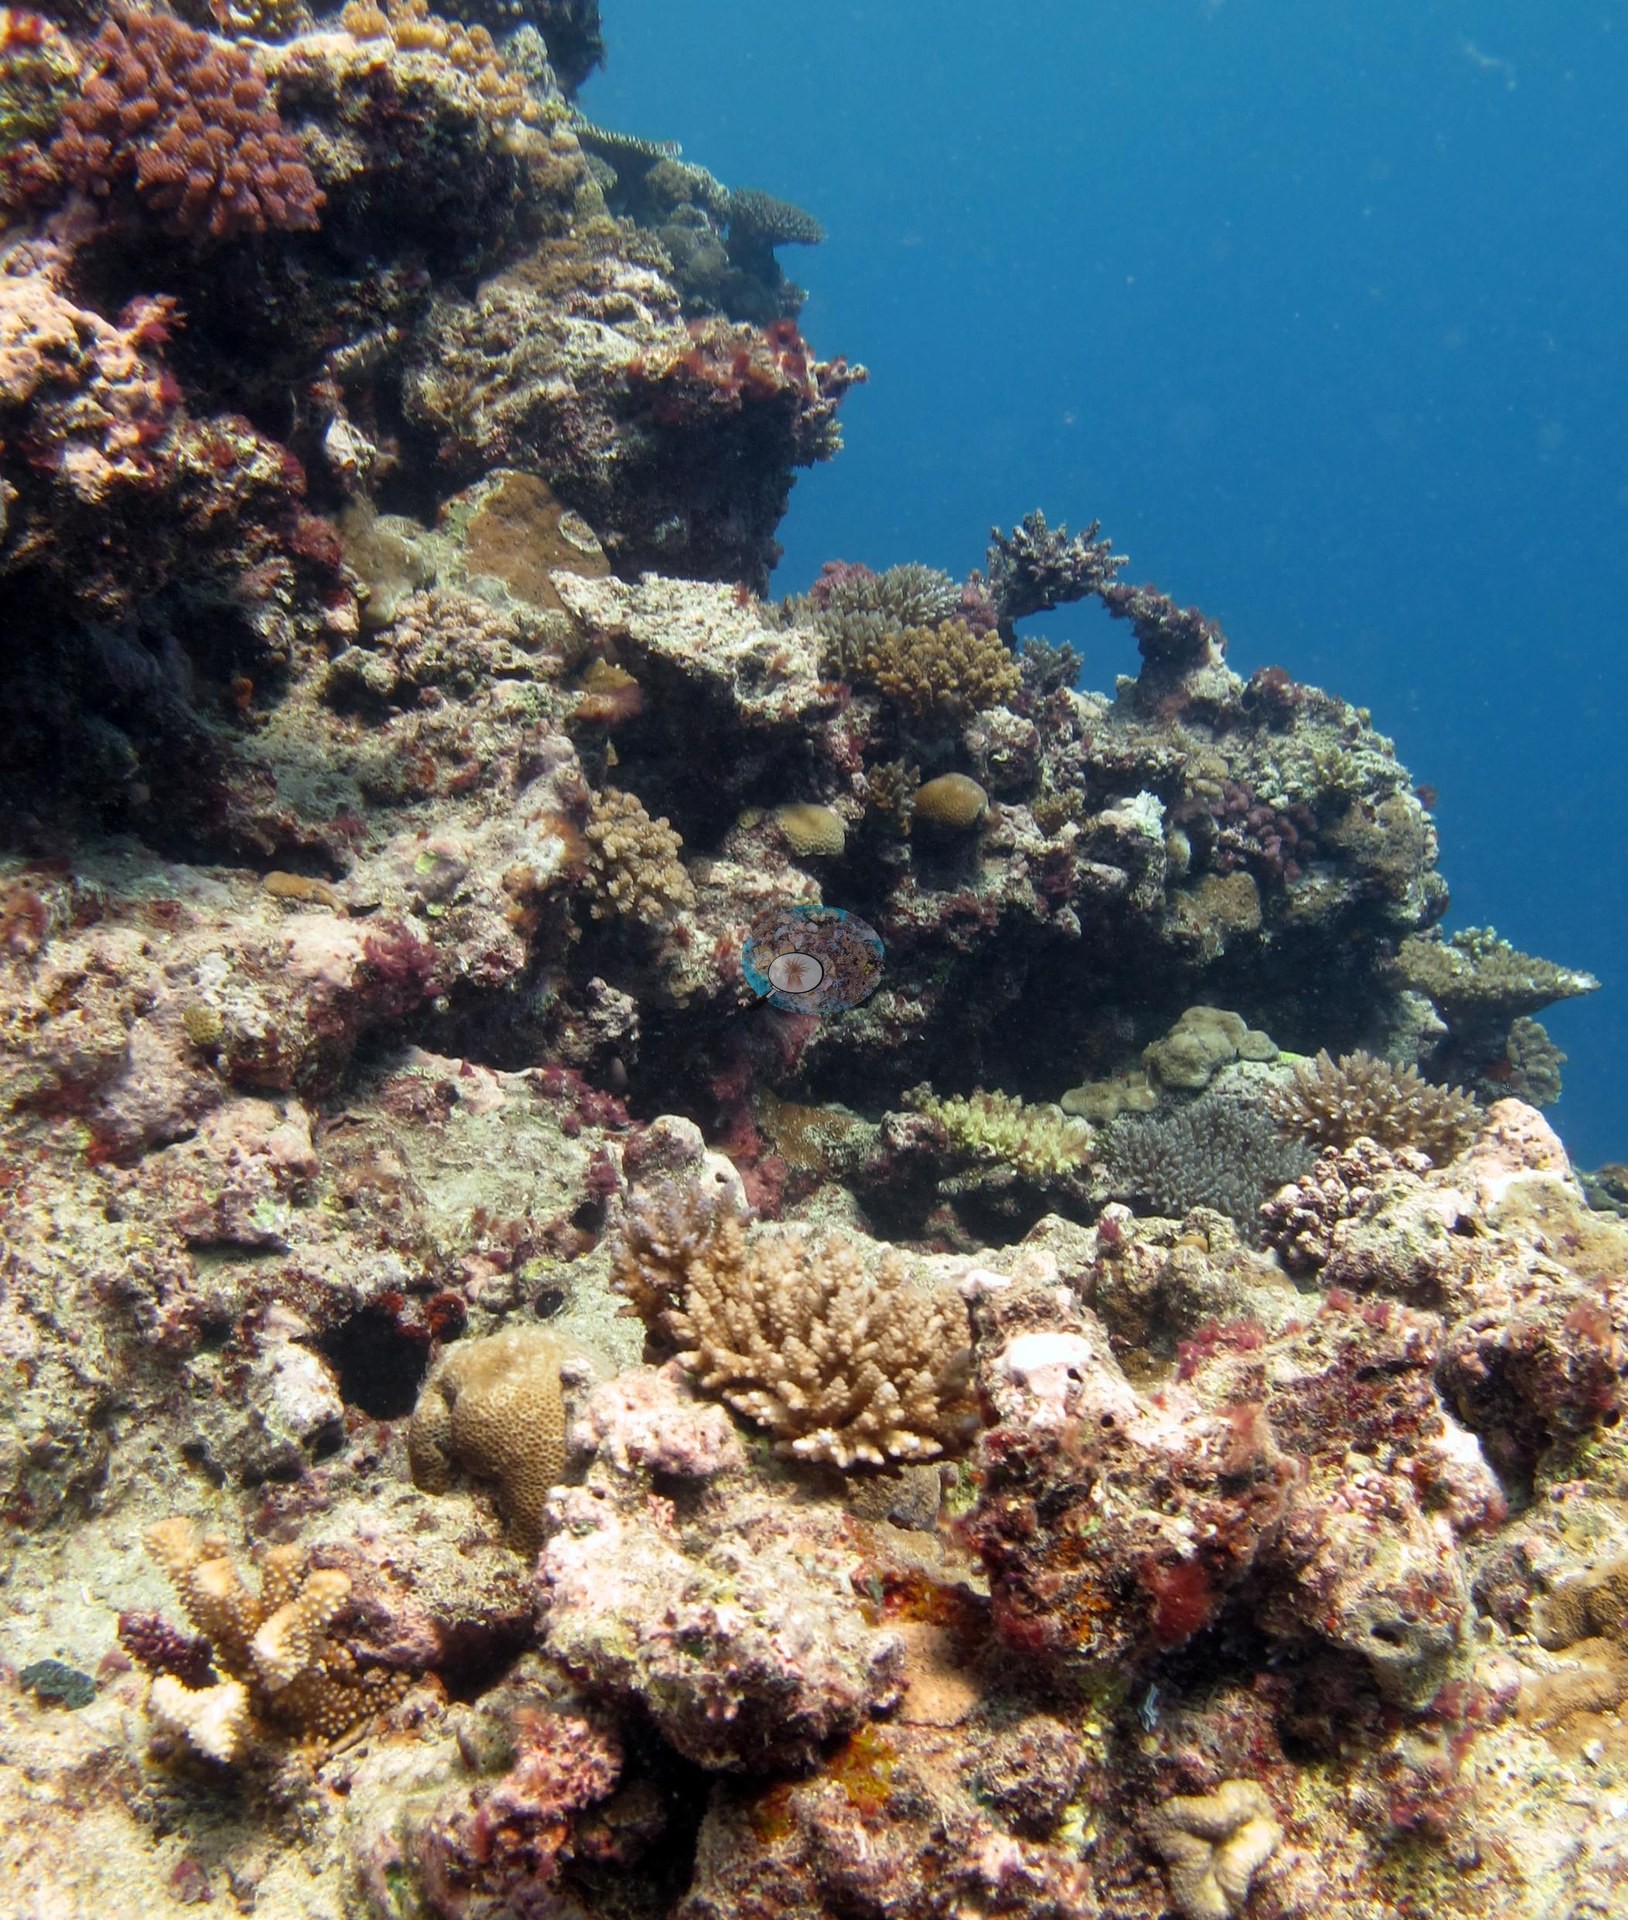
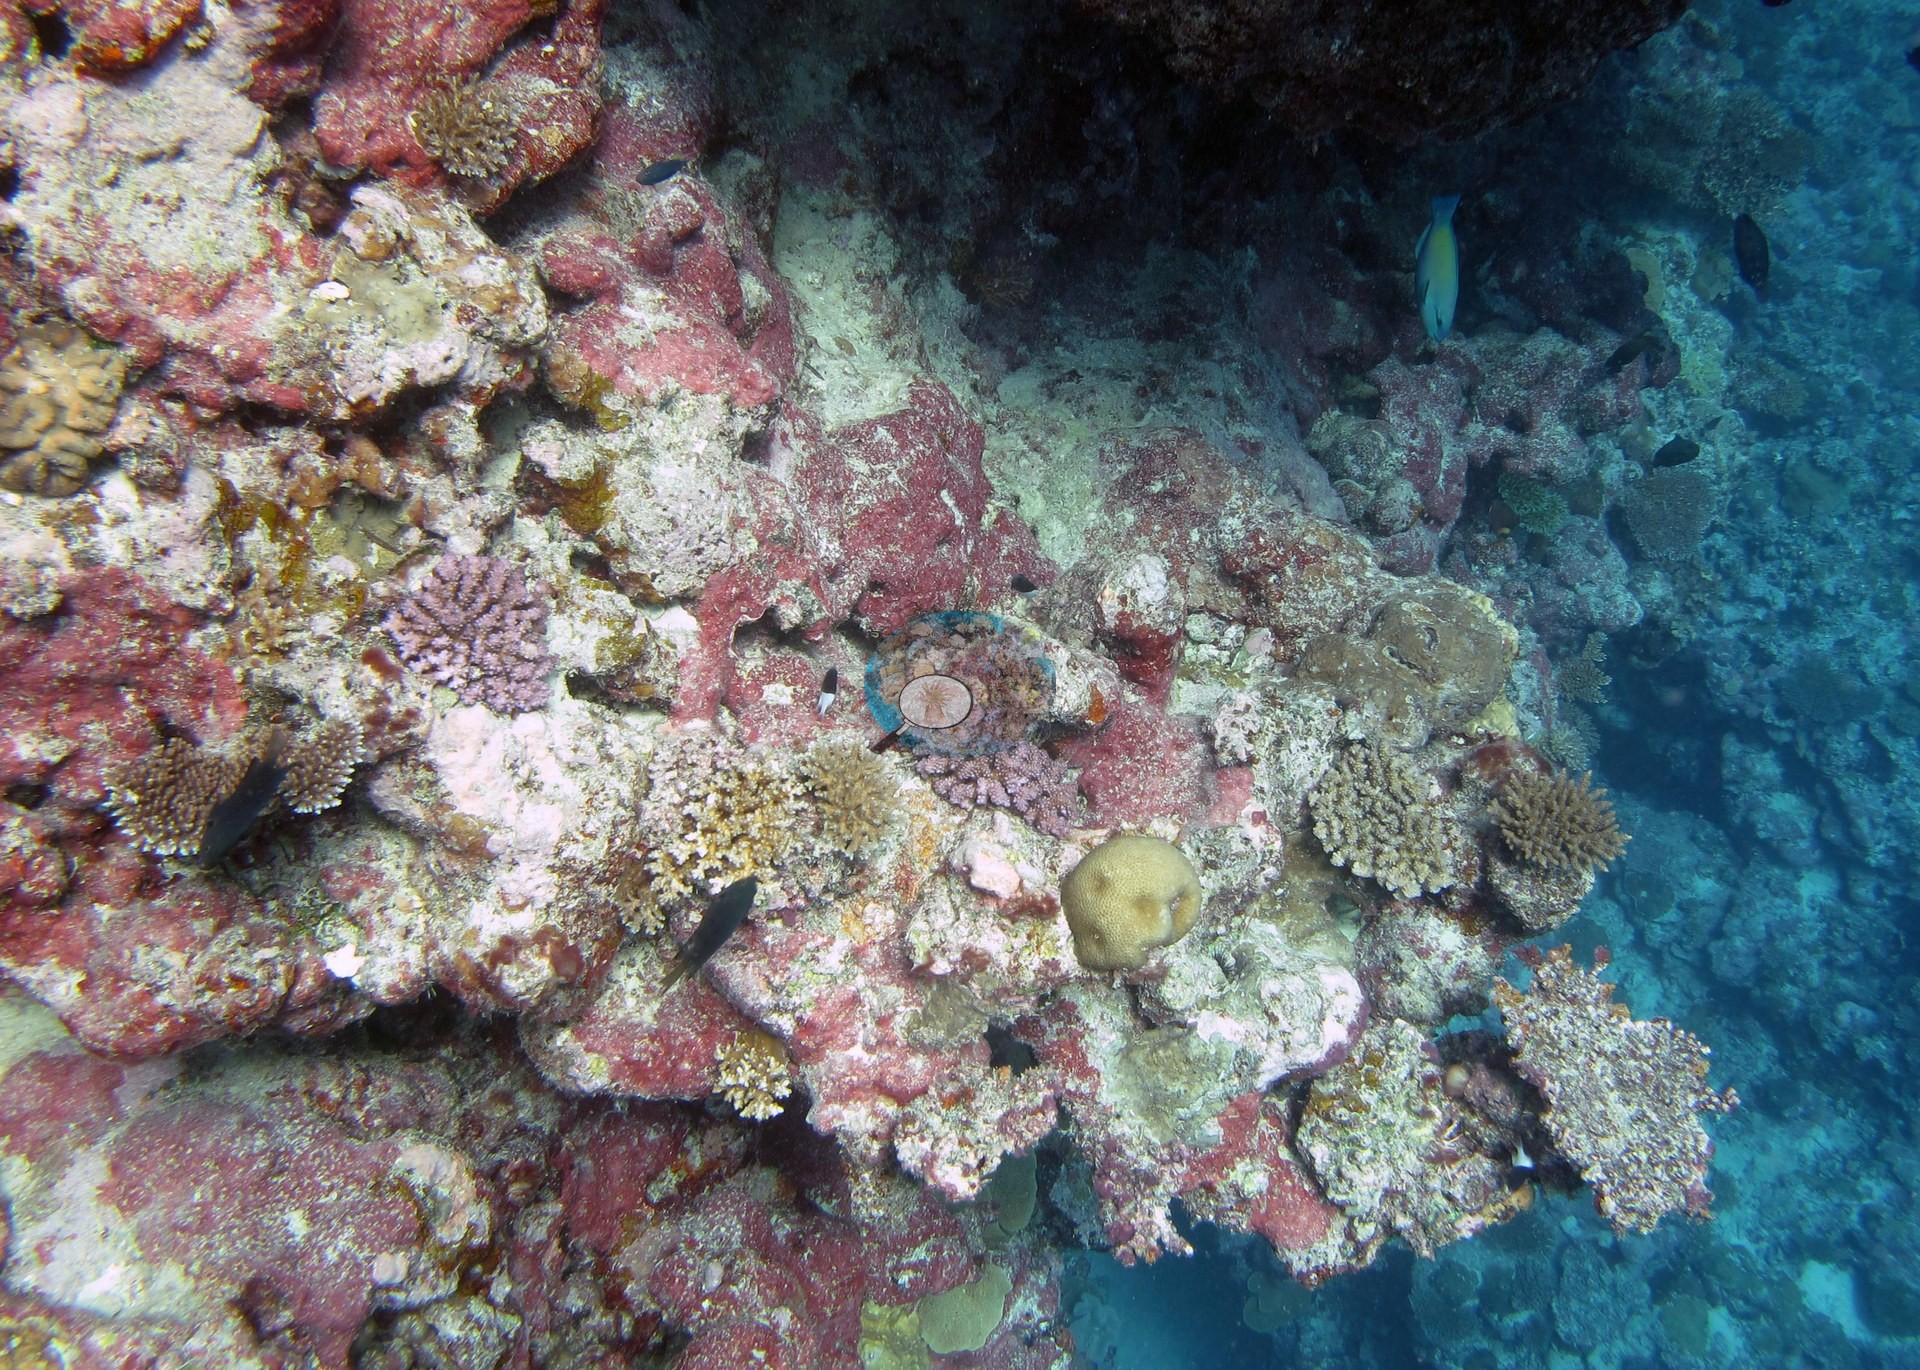
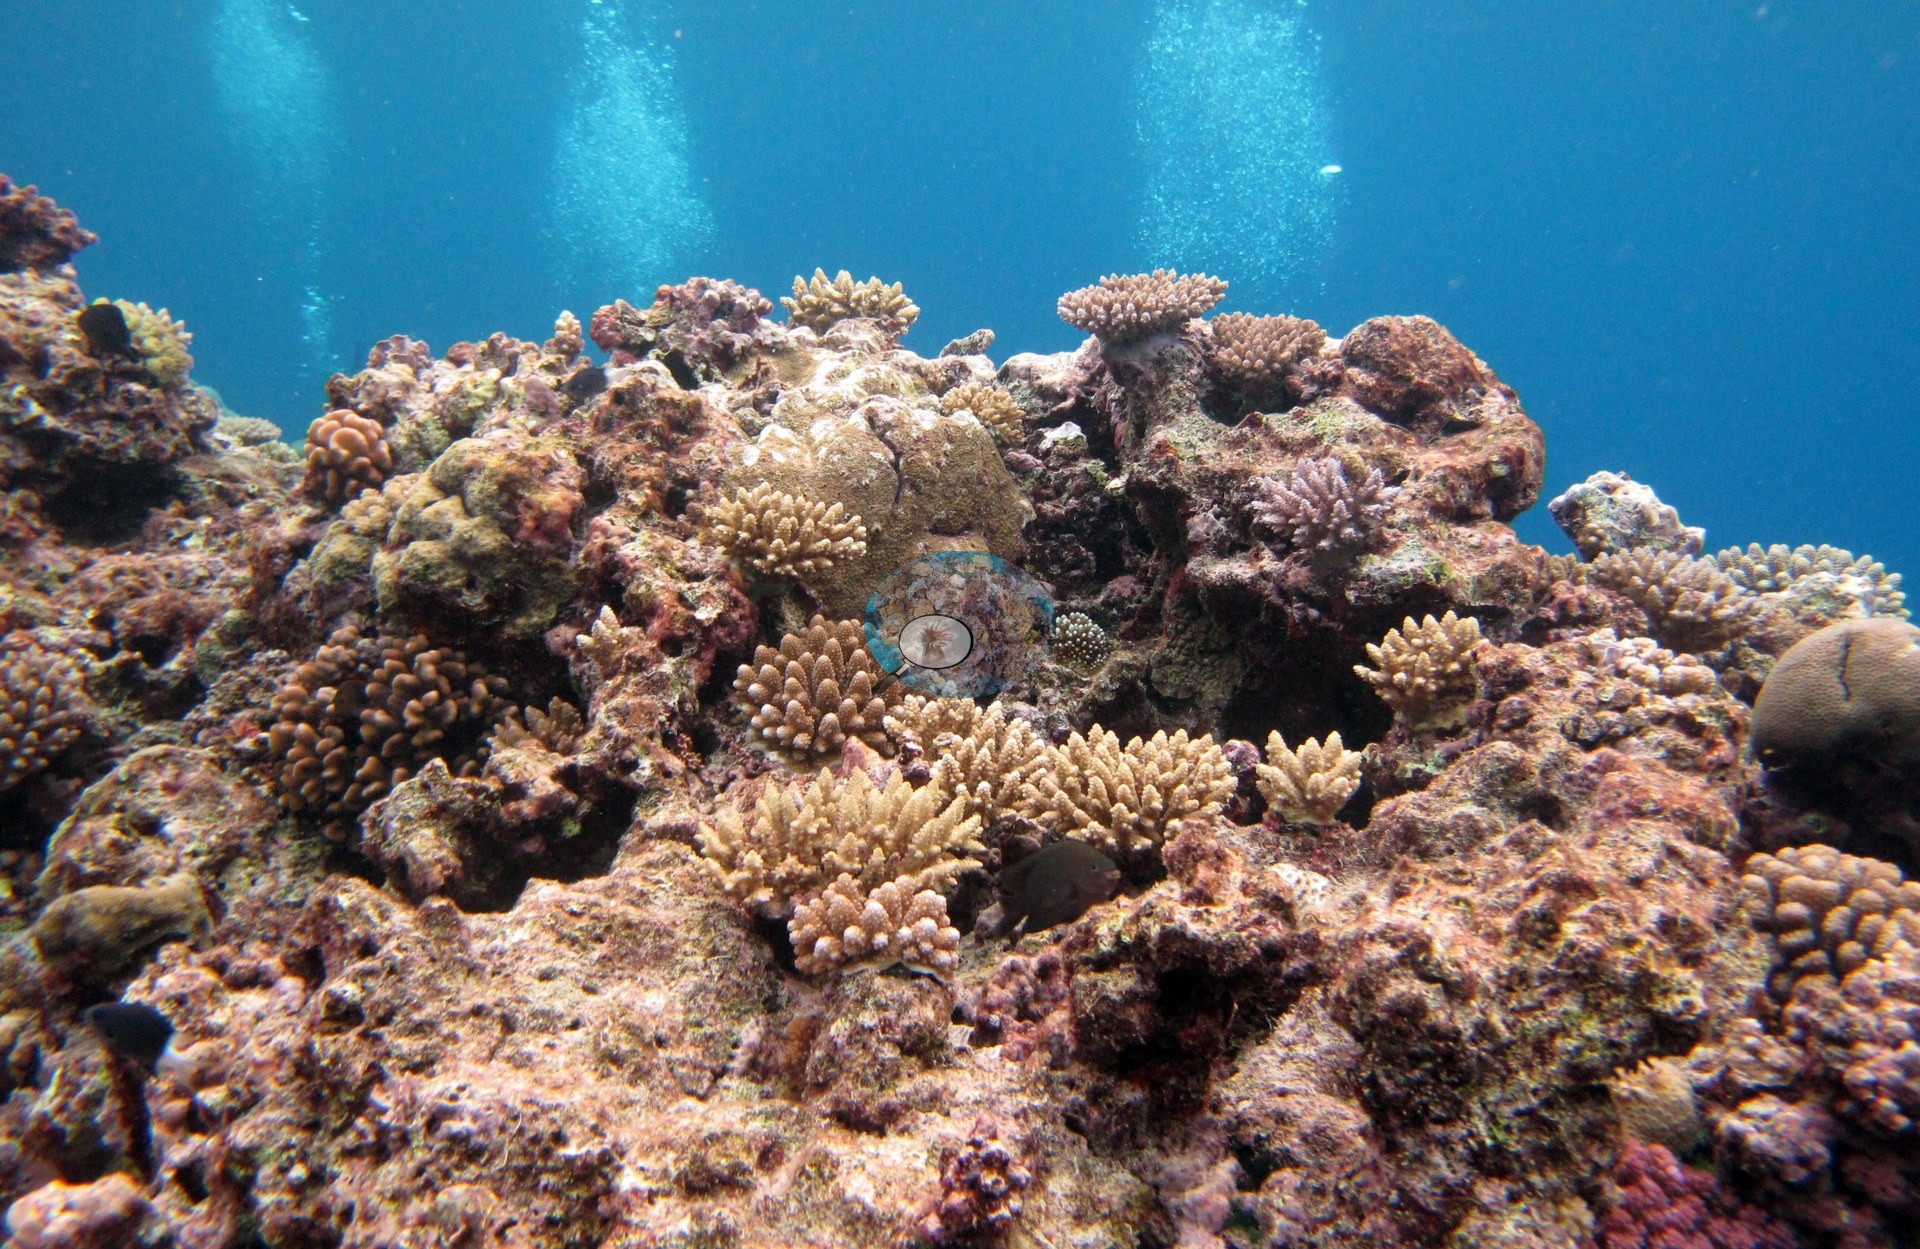
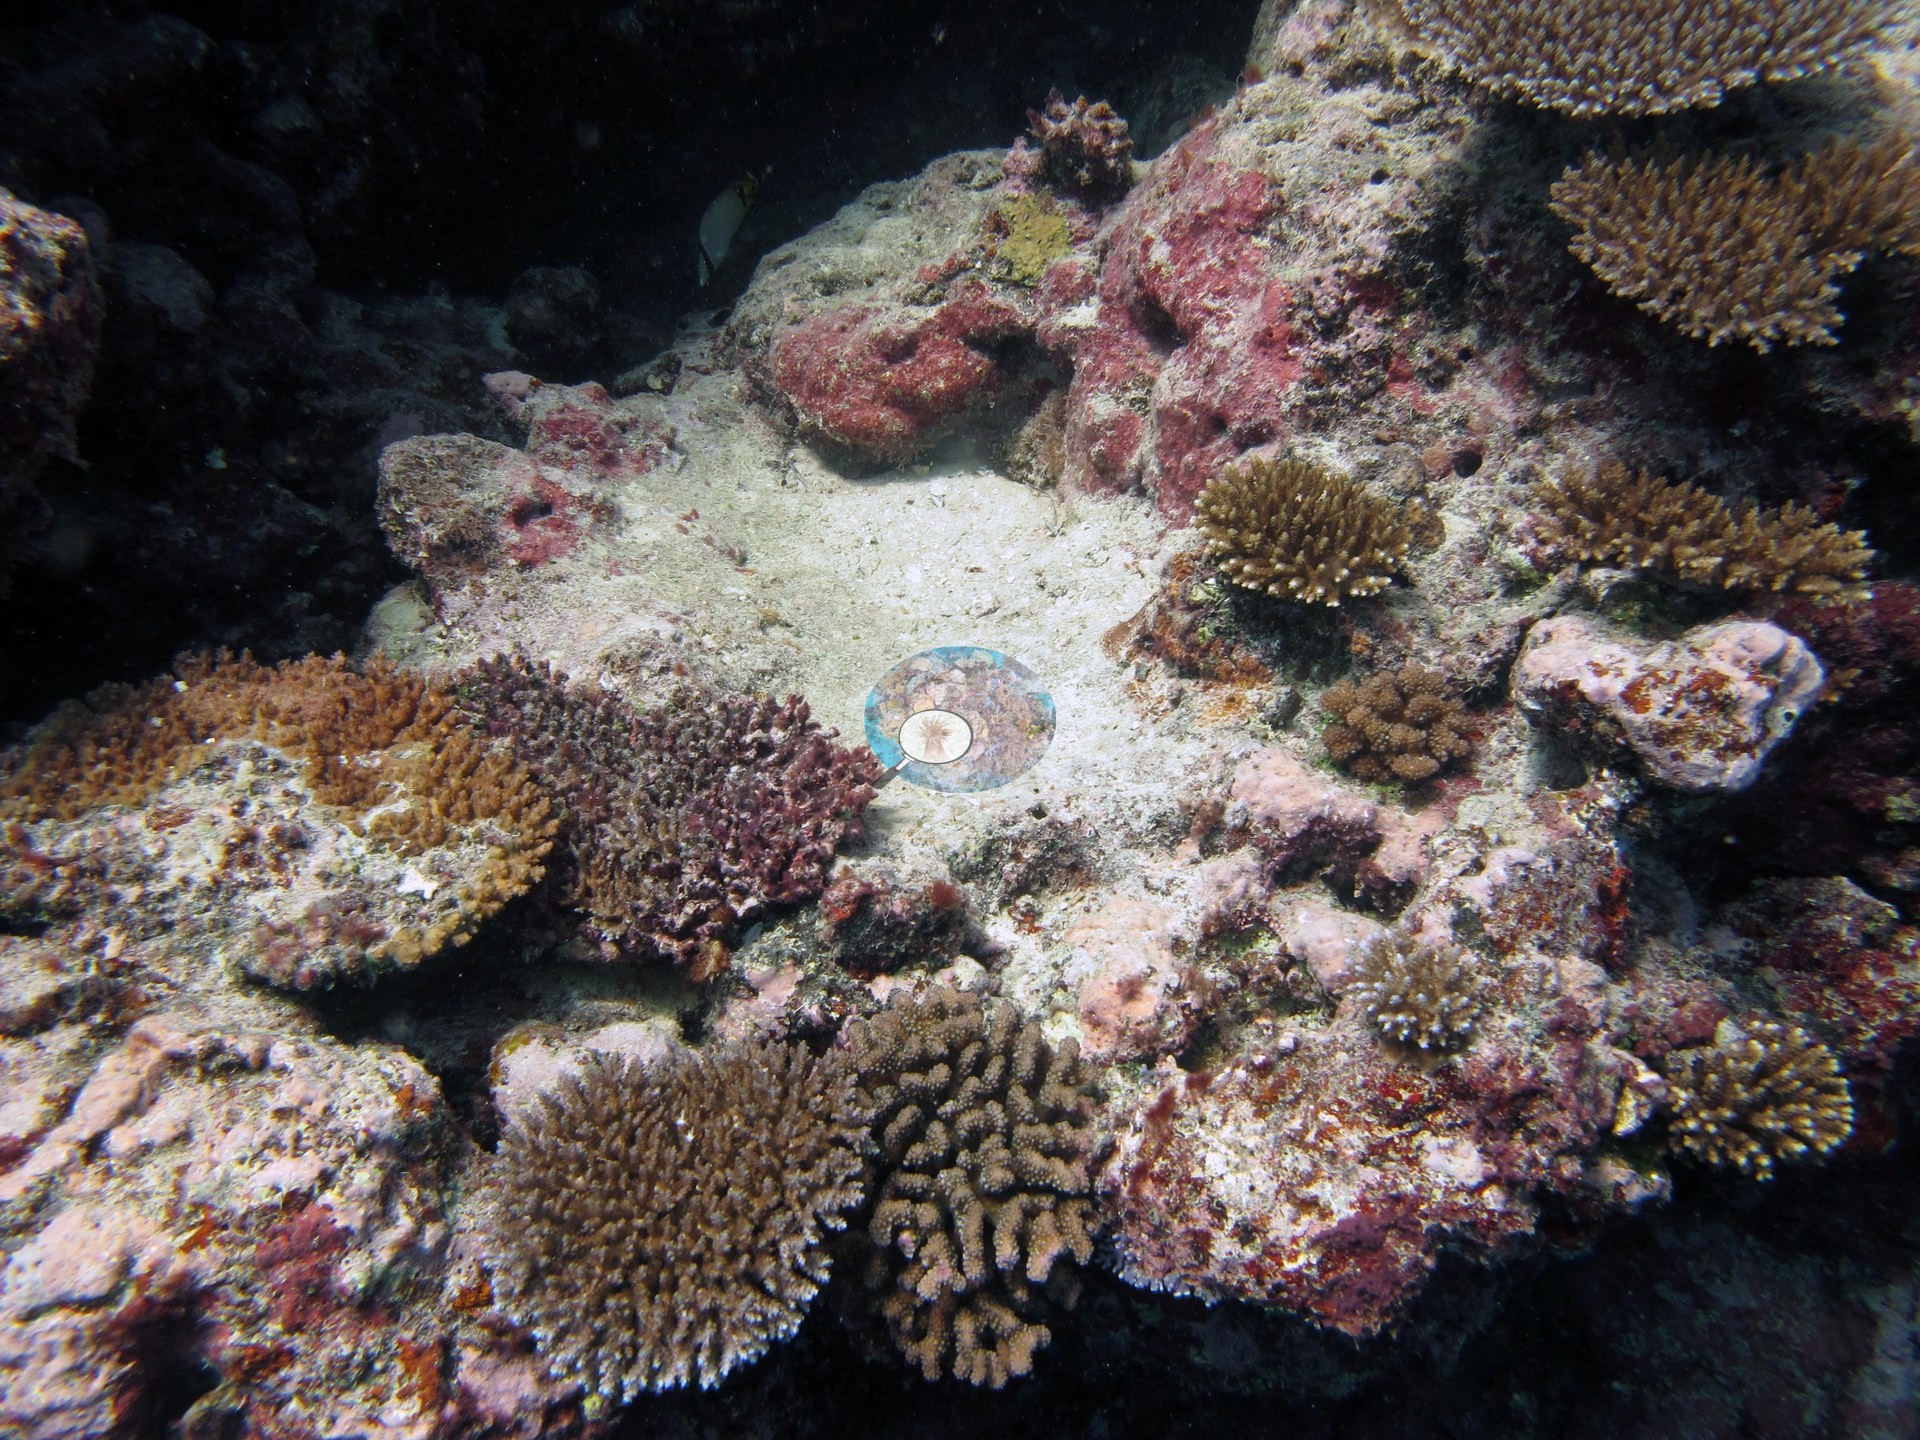
Photo: Anderson Mayfield/Coral Reef Diagnostics — Fiji - Nayau (FJNA40)
Country
Fiji
Sites
4
each linked below
Hard coral cover (island mean)
48% ± 4.4% (std. dev.)
n = 3 of 4 sites. range 44–52%
Water temp. during surveys (island mean)
27.1°C
n = 3 of 4 sites; surveyed Jun 2013; all are station CTD-cast midpoints, not dive readings
Coral Health Index (island mean)
not yet scored
n = 0 of 4 sites
Most recent water temperature record
26 Oct 2026 · Fiji
Most recent heat stress record
26 Oct 2026 · No heat stress
Mean annual max degree heating weeks (DHW), last 5 years
2021–2025 · Fiji
Highest annual heat stress
in 2026 (to date, 26 Oct) · Fiji
Severe heat-stress years
1985–2025 · 6 in the last 10 years
Heat-stress figures: NOAA Coral Reef Watch — Fiji 5-km virtual station. Each pill links its source record and carries the values behind it.
Island summary

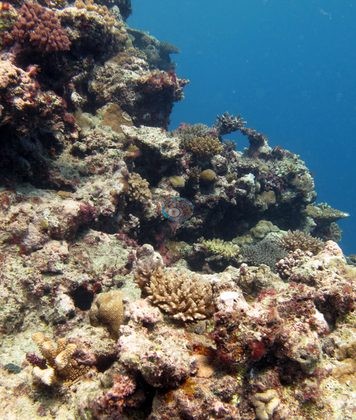
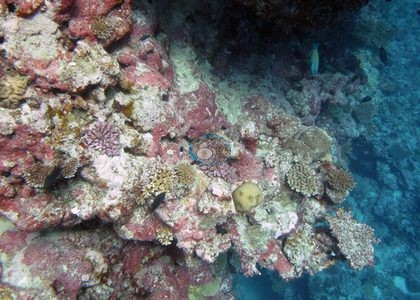
Nayau's northwest fore-reef slopes, surveyed in June 2013, held 44-52% coral on large Acropora build-ups, with Drupella snails on several colonies and an old anchor chain colonized by small corals.

Heat stress

048121620Week of 2023-01-01: DHW 2.6°C-weeks (below the bleaching alert threshold); SST 28.68°CWeek of 2023-01-08: DHW 3.5°C-weeks (below the bleaching alert threshold); SST 29.25°CWeek of 2023-01-15: DHW 4.9°C-weeks (Alert Level 1: significant bleaching likely); SST 28.95°CWeek of 2023-01-22: DHW 6.6°C-weeks (Alert Level 1: significant bleaching likely); SST 29.10°CWeek of 2023-01-29: DHW 8.5°C-weeks (Alert Level 2+: severe bleaching and significant mortality likely); SST 29.52°CWeek of 2023-02-05: DHW 10.0°C-weeks (Alert Level 2+: severe bleaching and significant mortality likely); SST 29.33°CWeek of 2023-02-12: DHW 11.1°C-weeks (Alert Level 2+: severe bleaching and significant mortality likely); SST 28.74°CWeek of 2023-02-19: DHW 12.2°C-weeks (Alert Level 2+: severe bleaching and significant mortality likely); SST 28.70°CWeek of 2023-02-26: DHW 12.4°C-weeks (Alert Level 2+: severe bleaching and significant mortality likely); SST 28.57°CWeek of 2023-03-05: DHW 12.3°C-weeks (Alert Level 2+: severe bleaching and significant mortality likely); SST 28.55°CWeek of 2023-03-12: DHW 12.3°C-weeks (Alert Level 2+: severe bleaching and significant mortality likely); SST 28.70°CWeek of 2023-03-19: DHW 12.1°C-weeks (Alert Level 2+: severe bleaching and significant mortality likely); SST 28.36°CWeek of 2023-03-26: DHW 12.4°C-weeks (Alert Level 2+: severe bleaching and significant mortality likely); SST 28.80°CWeek of 2023-04-02: DHW 12.7°C-weeks (Alert Level 2+: severe bleaching and significant mortality likely); SST 28.55°CWeek of 2023-04-09: DHW 12.5°C-weeks (Alert Level 2+: severe bleaching and significant mortality likely); SST 28.74°CWeek of 2023-04-16: DHW 11.7°C-weeks (Alert Level 2+: severe bleaching and significant mortality likely); SST 28.51°CWeek of 2023-04-23: DHW 10.0°C-weeks (Alert Level 2+: severe bleaching and significant mortality likely); SST 28.31°CWeek of 2023-04-30: DHW 8.1°C-weeks (Alert Level 2+: severe bleaching and significant mortality likely); SST 28.97°CWeek of 2023-05-07: DHW 6.6°C-weeks (Alert Level 1: significant bleaching likely); SST 28.82°CWeek of 2023-05-14: DHW 5.6°C-weeks (Alert Level 1: significant bleaching likely); SST 28.70°CWeek of 2023-05-21: DHW 4.4°C-weeks (Alert Level 1: significant bleaching likely); SST 28.51°CWeek of 2023-05-28: DHW 3.4°C-weeks (below the bleaching alert threshold); SST 28.58°CWeek of 2023-06-04: DHW 3.1°C-weeks (below the bleaching alert threshold); SST 28.02°CWeek of 2023-06-11: DHW 3.1°C-weeks (below the bleaching alert threshold); SST 27.88°CWeek of 2023-06-18: DHW 2.8°C-weeks (below the bleaching alert threshold); SST 27.45°CWeek of 2023-06-25: DHW 1.7°C-weeks (below the bleaching alert threshold); SST 27.18°CWeek of 2023-07-02: DHW 0.6°C-weeks (below the bleaching alert threshold); SST 27.26°CWeek of 2024-01-07: DHW 0.1°C-weeks (below the bleaching alert threshold); SST 29.47°CWeek of 2024-01-14: DHW 0.6°C-weeks (below the bleaching alert threshold); SST 29.58°CWeek of 2024-01-21: DHW 2.0°C-weeks (below the bleaching alert threshold); SST 29.63°CWeek of 2024-01-28: DHW 3.3°C-weeks (below the bleaching alert threshold); SST 29.33°CWeek of 2024-02-04: DHW 4.6°C-weeks (Alert Level 1: significant bleaching likely); SST 29.47°CWeek of 2024-02-11: DHW 6.0°C-weeks (Alert Level 1: significant bleaching likely); SST 29.35°CWeek of 2024-02-18: DHW 6.7°C-weeks (Alert Level 1: significant bleaching likely); SST 29.12°CWeek of 2024-02-25: DHW 8.4°C-weeks (Alert Level 2+: severe bleaching and significant mortality likely); SST 29.57°CWeek of 2024-03-03: DHW 10.0°C-weeks (Alert Level 2+: severe bleaching and significant mortality likely); SST 29.13°CWeek of 2024-03-10: DHW 11.2°C-weeks (Alert Level 2+: severe bleaching and significant mortality likely); SST 28.98°CWeek of 2024-03-17: DHW 11.8°C-weeks (Alert Level 2+: severe bleaching and significant mortality likely); SST 29.02°CWeek of 2024-03-24: DHW 13.0°C-weeks (Alert Level 2+: severe bleaching and significant mortality likely); SST 29.63°CWeek of 2024-03-31: DHW 13.3°C-weeks (Alert Level 2+: severe bleaching and significant mortality likely); SST 29.28°CWeek of 2024-04-07: DHW 13.3°C-weeks (Alert Level 2+: severe bleaching and significant mortality likely); SST 29.20°CWeek of 2024-04-14: DHW 12.7°C-weeks (Alert Level 2+: severe bleaching and significant mortality likely); SST 28.32°CWeek of 2024-04-21: DHW 11.3°C-weeks (Alert Level 2+: severe bleaching and significant mortality likely); SST 28.52°CWeek of 2024-04-28: DHW 10.4°C-weeks (Alert Level 2+: severe bleaching and significant mortality likely); SST 28.98°CWeek of 2024-05-05: DHW 9.1°C-weeks (Alert Level 2+: severe bleaching and significant mortality likely); SST 29.00°CWeek of 2024-05-12: DHW 7.8°C-weeks (Alert Level 1: significant bleaching likely); SST 28.44°CWeek of 2024-05-19: DHW 7.0°C-weeks (Alert Level 1: significant bleaching likely); SST 28.66°CWeek of 2024-05-26: DHW 5.3°C-weeks (Alert Level 1: significant bleaching likely); SST 28.43°CWeek of 2024-06-02: DHW 3.7°C-weeks (below the bleaching alert threshold); SST 27.74°CWeek of 2024-06-09: DHW 2.6°C-weeks (below the bleaching alert threshold); SST 27.27°CWeek of 2024-06-16: DHW 1.9°C-weeks (below the bleaching alert threshold); SST 27.27°CWeek of 2024-06-23: DHW 0.8°C-weeks (below the bleaching alert threshold); SST 27.37°CWeek of 2024-06-30: DHW 0.5°C-weeks (below the bleaching alert threshold); SST 27.26°CWeek of 2024-07-07: DHW 0.5°C-weeks (below the bleaching alert threshold); SST 27.09°CWeek of 2024-07-14: DHW 0.5°C-weeks (below the bleaching alert threshold); SST 26.73°CWeek of 2025-01-19: DHW 1.2°C-weeks (below the bleaching alert threshold); SST 29.36°CWeek of 2025-01-26: DHW 2.0°C-weeks (below the bleaching alert threshold); SST 28.87°CWeek of 2025-02-02: DHW 2.0°C-weeks (below the bleaching alert threshold); SST 28.85°CWeek of 2025-02-09: DHW 3.4°C-weeks (below the bleaching alert threshold); SST 29.33°CWeek of 2025-02-16: DHW 4.6°C-weeks (Alert Level 1: significant bleaching likely); SST 28.71°CWeek of 2025-02-23: DHW 5.3°C-weeks (Alert Level 1: significant bleaching likely); SST 28.89°CWeek of 2025-03-02: DHW 5.3°C-weeks (Alert Level 1: significant bleaching likely); SST 28.73°CWeek of 2025-03-09: DHW 5.3°C-weeks (Alert Level 1: significant bleaching likely); SST 28.73°CWeek of 2025-03-16: DHW 5.6°C-weeks (Alert Level 1: significant bleaching likely); SST 28.66°CWeek of 2025-03-23: DHW 5.7°C-weeks (Alert Level 1: significant bleaching likely); SST 28.71°CWeek of 2025-03-30: DHW 6.8°C-weeks (Alert Level 1: significant bleaching likely); SST 29.63°CWeek of 2025-04-06: DHW 7.9°C-weeks (Alert Level 1: significant bleaching likely); SST 29.63°CWeek of 2025-04-13: DHW 8.0°C-weeks (Alert Level 2+: severe bleaching and significant mortality likely); SST 29.33°CWeek of 2025-04-20: DHW 7.1°C-weeks (Alert Level 1: significant bleaching likely); SST 29.51°CWeek of 2025-04-27: DHW 7.1°C-weeks (Alert Level 1: significant bleaching likely); SST 28.95°CWeek of 2025-05-04: DHW 7.0°C-weeks (Alert Level 1: significant bleaching likely); SST 28.63°CWeek of 2025-05-11: DHW 5.6°C-weeks (Alert Level 1: significant bleaching likely); SST 28.27°CWeek of 2025-05-18: DHW 4.3°C-weeks (Alert Level 1: significant bleaching likely); SST 28.15°CWeek of 2025-05-25: DHW 3.8°C-weeks (below the bleaching alert threshold); SST 28.33°CWeek of 2025-06-01: DHW 3.8°C-weeks (below the bleaching alert threshold); SST 28.05°CWeek of 2025-06-08: DHW 3.8°C-weeks (below the bleaching alert threshold); SST 27.71°CWeek of 2025-06-15: DHW 3.6°C-weeks (below the bleaching alert threshold); SST 27.67°CWeek of 2025-06-22: DHW 3.3°C-weeks (below the bleaching alert threshold); SST 27.33°CWeek of 2025-06-29: DHW 2.2°C-weeks (below the bleaching alert threshold); SST 27.27°CWeek of 2025-07-06: DHW 1.1°C-weeks (below the bleaching alert threshold); SST 27.02°CWeek of 2025-07-13: DHW 0.7°C-weeks (below the bleaching alert threshold); SST 26.86°CWeek of 2026-01-18: DHW 1.2°C-weeks (below the bleaching alert threshold); SST 28.99°CWeek of 2026-01-25: DHW 2.5°C-weeks (below the bleaching alert threshold); SST 28.85°CWeek of 2026-02-01: DHW 4.2°C-weeks (Alert Level 1: significant bleaching likely); SST 29.25°CWeek of 2026-02-08: DHW 5.7°C-weeks (Alert Level 1: significant bleaching likely); SST 29.38°CWeek of 2026-02-15: DHW 7.5°C-weeks (Alert Level 1: significant bleaching likely); SST 29.58°CWeek of 2026-02-22: DHW 9.2°C-weeks (Alert Level 2+: severe bleaching and significant mortality likely); SST 29.36°CWeek of 2026-03-01: DHW 10.5°C-weeks (Alert Level 2+: severe bleaching and significant mortality likely); SST 28.77°CWeek of 2026-03-08: DHW 12.2°C-weeks (Alert Level 2+: severe bleaching and significant mortality likely); SST 29.37°CWeek of 2026-03-15: DHW 13.8°C-weeks (Alert Level 2+: severe bleaching and significant mortality likely); SST 29.55°CWeek of 2026-03-22: DHW 15.3°C-weeks (Alert Level 2+: severe bleaching and significant mortality likely); SST 29.32°CWeek of 2026-03-29: DHW 16.4°C-weeks (Alert Level 2+: severe bleaching and significant mortality likely); SST 28.99°CWeek of 2026-04-05: DHW 16.7°C-weeks (Alert Level 2+: severe bleaching and significant mortality likely); SST 28.86°CWeek of 2026-04-12: DHW 16.7°C-weeks (Alert Level 2+: severe bleaching and significant mortality likely); SST 29.31°CWeek of 2026-04-19: DHW 15.3°C-weeks (Alert Level 2+: severe bleaching and significant mortality likely); SST 29.07°CWeek of 2026-04-26: DHW 13.9°C-weeks (Alert Level 2+: severe bleaching and significant mortality likely); SST 29.06°CWeek of 2026-05-03: DHW 12.3°C-weeks (Alert Level 2+: severe bleaching and significant mortality likely); SST 28.91°CWeek of 2026-05-10: DHW 10.8°C-weeks (Alert Level 2+: severe bleaching and significant mortality likely); SST 28.68°CWeek of 2026-05-17: DHW 9.0°C-weeks (Alert Level 2+: severe bleaching and significant mortality likely); SST 28.45°CWeek of 2026-05-24: DHW 7.3°C-weeks (Alert Level 1: significant bleaching likely); SST 28.19°CWeek of 2026-05-31: DHW 6.0°C-weeks (Alert Level 1: significant bleaching likely); SST 27.84°CWeek of 2026-06-07: DHW 4.3°C-weeks (Alert Level 1: significant bleaching likely); SST 27.53°CWeek of 2026-06-14: DHW 2.7°C-weeks (below the bleaching alert threshold); SST 27.10°CWeek of 2026-06-21: DHW 1.2°C-weeks (below the bleaching alert threshold); SST 26.59°CWeek of 2026-06-28: DHW 0.2°C-weeks (below the bleaching alert threshold); SST 26.25°C24262830Bleaching threshold 29.4°C2023202420252026SST (°C)DHW (°C-weeks)
sea surface temperature (SST) (left axis)DHW under 2DHW 2–3DHW 3–5DHW 5–8DHW 8–10DHW over 10 (🔥 above 12)
Daily SST (line) and weekly maximum Degree Heating Weeks (bars), Jan 2023–Oct 2026, NOAA Coral Reef Watch 5-km Fiji virtual station. Dashed line: bleaching threshold (maximum monthly mean 28.4°C + 1°C). DHW ≥ 4: bleaching likely; ≥ 8: severe bleaching and mortality likely. A bar is drawn only where DHW exceeds zero, so a stretch with no bar is accumulated heat stress of zero, not missing data — the SST line runs the full period.

Long-term record: 11 years from 1985 through 2025 reached 8 or more °C-weeks at NOAA’s Fiji station. Download the annual DHW data (CSV).

4 sites in this region — click a marker to open that site.

Overview

Nayau is a small island in the Lau group of eastern Fiji. Four Global Reef Expedition stations were logged on its northwest side on 16 June 2013: three transect stations (FJNA38, FJNA39, FJNA40) and a 2 m snorkel site about 0.85 km away (FJNA38SN), which has no cover record. Maximum dive depths were 16.2 m at FJNA39 (Living Oceans Foundation (LOF) team log), 21.3 m at FJNA40, and 31.1 m at FJNA38, while the survey notes describe the setting as shallow fore-reef slopes.

Coral cover was high at all three transect stations, from 44% at FJNA40 to 52% at FJNA39, with FJNA38 at 48%. Algae covered 33% (FJNA39) to 39% (FJNA40) of the benthos. The survey team's notes for the northwest side describe large Acropora build-ups with rubble piled at their bases and Tydemania macroalgae creeping up their sides, and large plating Diploastrea prominent at 15 m. FJNA39 is a classic spur-and-groove reef with well-developed coral on the spur tops and grooves scoured and filled with rubble, and the FJNA38 frames show coralline-sheeted framework carrying many small colonies rather than a few large ones. An old anchor chain at FJNA38 has been colonized by small Pocillopora.

The survey notes record coral-eating Drupella snails on several Acropora colonies. At FJNA40 Anderson photographed a bleached pocilloporid and a second one with pale, partly bleached tissue. No crown-of-thorns is recorded for Nayau's own stations, and none carries a station-level Coral Health Index; Anderson's sampling sheet records four of the seven colonies sampled at FJNA38 as 1–10% pale or bleached, and the photographs of a tagged probe colony there (tag 092) show its upper branches partly bleached (photos not shown).

Highlights

Notable observations

Sites in this region

% coral cover by method

Pooled across 1 dive site

MethodMean % coral coverStd. dev. between dive sitesn dive sitesNote
CoralSCOP (SAM-based mask-sum), edited photos31%*—11 of these 1 values rests on 10–19 photographs (*)
Claude (Anthropic), blind point count28%*—11 of these 1 values rests on 10–19 photographs (*)
In-water diver transect (line/point intercept)44%—1—

The mean is an UNWEIGHTED mean of the dive site values — each dive site counts once, whatever its photo count — which is the convention of the published tables and of every other figure on this page. Each value is the one printed on that dive site's own page; a page that prints no value for a method (fewer than 10 photographs) is left out of that method's mean.

This table pools only the one dive site in this unit that has a method comparison; the table for all 10 dive sites is on the Fiji - Lau page.

Deviation from the reference

Over the dive sites where an independent reference exists, Claude (Anthropic), blind point count has a mean absolute deviation of 16.0 pp from it across 1 dive site. Not in this ranking: CoralSCOP (edited), which measures coral area rather than points. A mean absolute deviation is not an accuracy score: a model with a consistent offset is correctable, while one with the same deviation scattered in both directions is not.

By dive site

Dive siteCoralSCOP (edited)ClaudeDiver transect
FJNA4031%*
n=15
28%*
n=15
44%

n under each value is the number of photographs that method scored at that dive site. ⚠ marks a cell that is not an independent check. * marks a value resting on only 10–19 photographs, which is less certain.

Reference: LOF Global Reef Expedition in-water transects (mean of all the station's transects, Living Oceans Foundation per-transect benthic data). Denominator: line/point intercept along the transect; not a photo-point denominator. Source: LOF Global Reef Expedition 2013, per-transect benthic data ('GRE data-full benthic'): the mean of all of each station's transects For all 10 dive sites in the comparison: The transect is THE coral-cover value at every site; the Claude photo estimate is a methods comparison only, never averaged with the transect and never a headline. Site-level only: the photos come from the survey dives, not from the transect points. Few usable habitat photos exist for Fiji: only 10 sites have 10 or more, and 9 of them have fewer than 20 (low-n), so these are not confident site estimates. Accuracy, Claude vs transect, 10 sites: mean difference -5.4 pp (95% CI -12.7 to +1.9), mean absolute difference 10.3 pp, r 0.35. Claude reads lower than the transect at most sites and does not track it from site to site. This is a methods comparison, not a ranking.

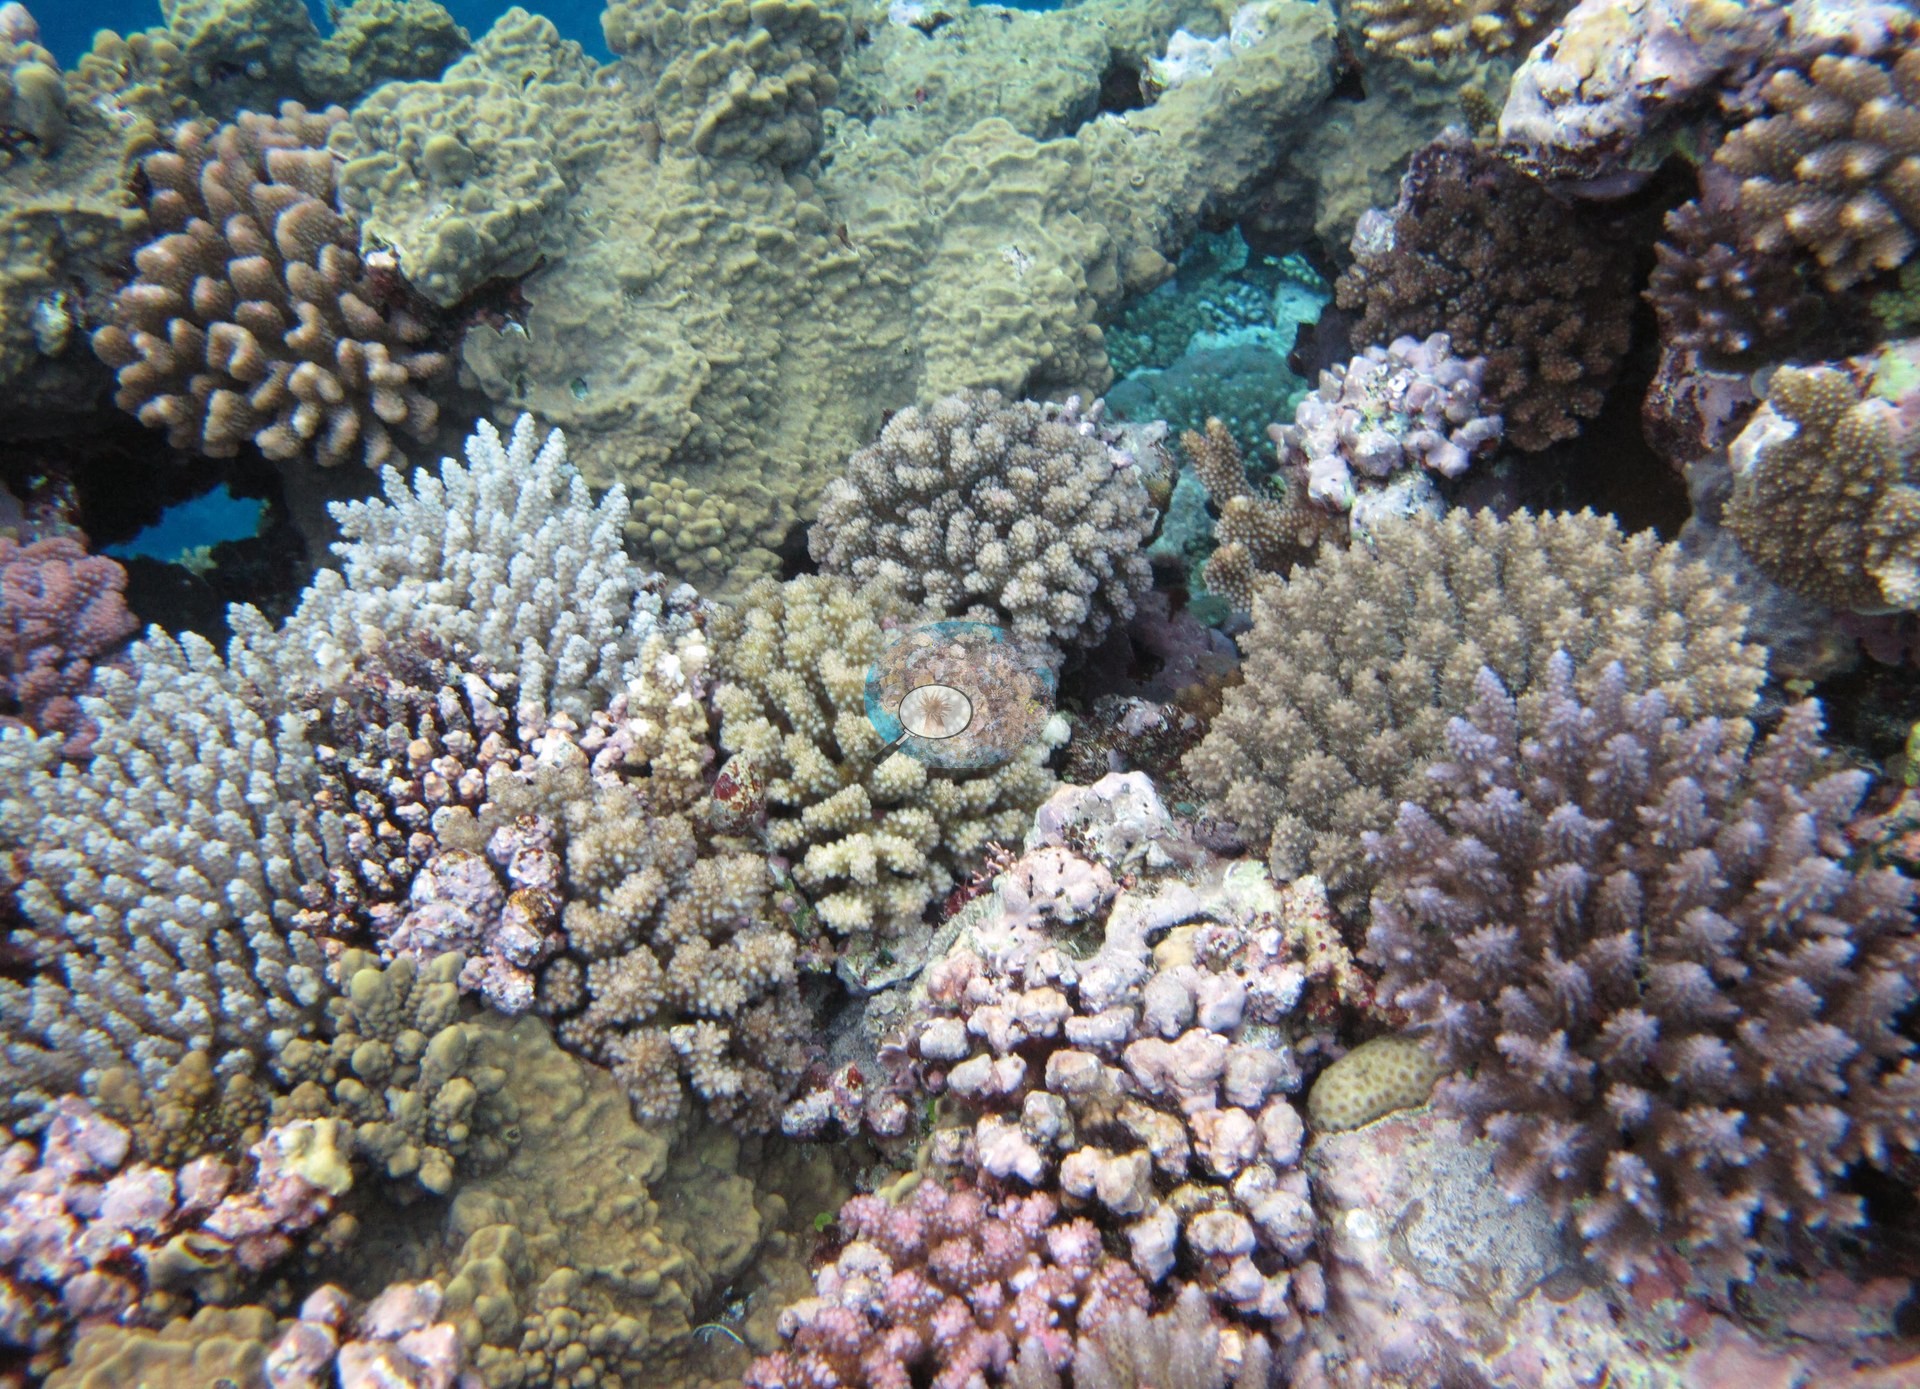
All images from Coral Reef Diagnostics. Data are from the Khaled bin Sultan Living Oceans Foundation Global Reef Expedition and Coral Reef Diagnostics.

© Coral Reef Diagnostics.

References