
Taiwan - Kenting / Nanwan (mainland)

Part of the regional summaries: Taiwan (mainland + offshore islands) and Taiwan
2008-02-28
2008-02-29
2008-06-30
2008-07-24
2008-09-05
2008-09-08
2008-09-09
2009-07-09
2010-03-12
2010-03-21
2010-05-06
2010-05-09
2010-05-11
2010-05-21
2010-06-07
2010-07-12
2010-07-13
2010-10-05
2010-10-09
2010-11-18
2011-04-11
2011-07-10
More info
Southern Taiwan (NOAA CRW virtual station)This regional pin covers the Kenting/Nanwan coast behind Anderson's SHVTS thermal-physiology work, comparing Seriatopora hystrix at cold-upwelling Houbihu against non-upwelling Houwan, with more than fifty logged dives from 2008-2011 including coral-spawning observations and work in a power-plant thermal outlet. The first three of its thirteen attached photographs show a robust Acropora thicket, a densely covered but turbid slope, and a plating/encrusting wall with feather stars; no coral-cover figure of its own has been derived for this site. Nearby surveys: 22% (Reef Check Houbihu, 2025, mean of 4 surveys, 1.52 km; the most recent year) and 15% (XL Catlin Seaview Survey transect 42011, 3 May 2018, 0.71 km; the headline, from the nearest survey station).
這個區域標記涵蓋了墾丁/南灣(Kenting/Nanwan)海岸,也就是 Anderson 進行 SHVTS 熱生理研究的地點,比較冷水湧升的後壁湖(Houbihu)與無湧升的後灣(Houwan)的細枝鹿角珊瑚(Seriatopora hystrix),2008-2011 年間記錄了五十多次潛水,包括珊瑚產卵觀察以及在發電廠溫排水口的工作。所附十三張照片中的前三張顯示粗壯的軸孔珊瑚(Acropora)叢、覆蓋茂密但水質混濁的斜坡,以及一面有羽星的板狀/殼狀珊瑚壁;此站尚未推算出自己的珊瑚覆蓋率數據。附近調查:22%(Reef Check 後壁湖,2025 年,4 次調查的平均,1.52 km;即最近一年)以及 15%(XL Catlin Seaview Survey 穿越線 42011,2018 年 5 月 3 日,0.71 km;為主要數據,取自最近的調查站)。
本摘要由 AI 翻譯;以英文版本為準。
22 independent survey stations shown with the program’s logo — click one to see how far it is from this site.
4 of the 13 photographs on this page are shown beside the text that discusses them under "Site description" below.
Site description
Setting
This is a regional marker covering the Kenting/Nanwan coast at Taiwan's southern tip — the reef system behind Anderson's SHVTS work, which compared Seriatopora hystrix thermal physiology at the cold-upwelling site Houbihu against non-upwelling Houwan up the coast (see coralreefdiagnostics.com/shvts). Visibility in two of the three described frames is plainly limited, consistent with the logs' repeated complaints of murk.
General benthic features
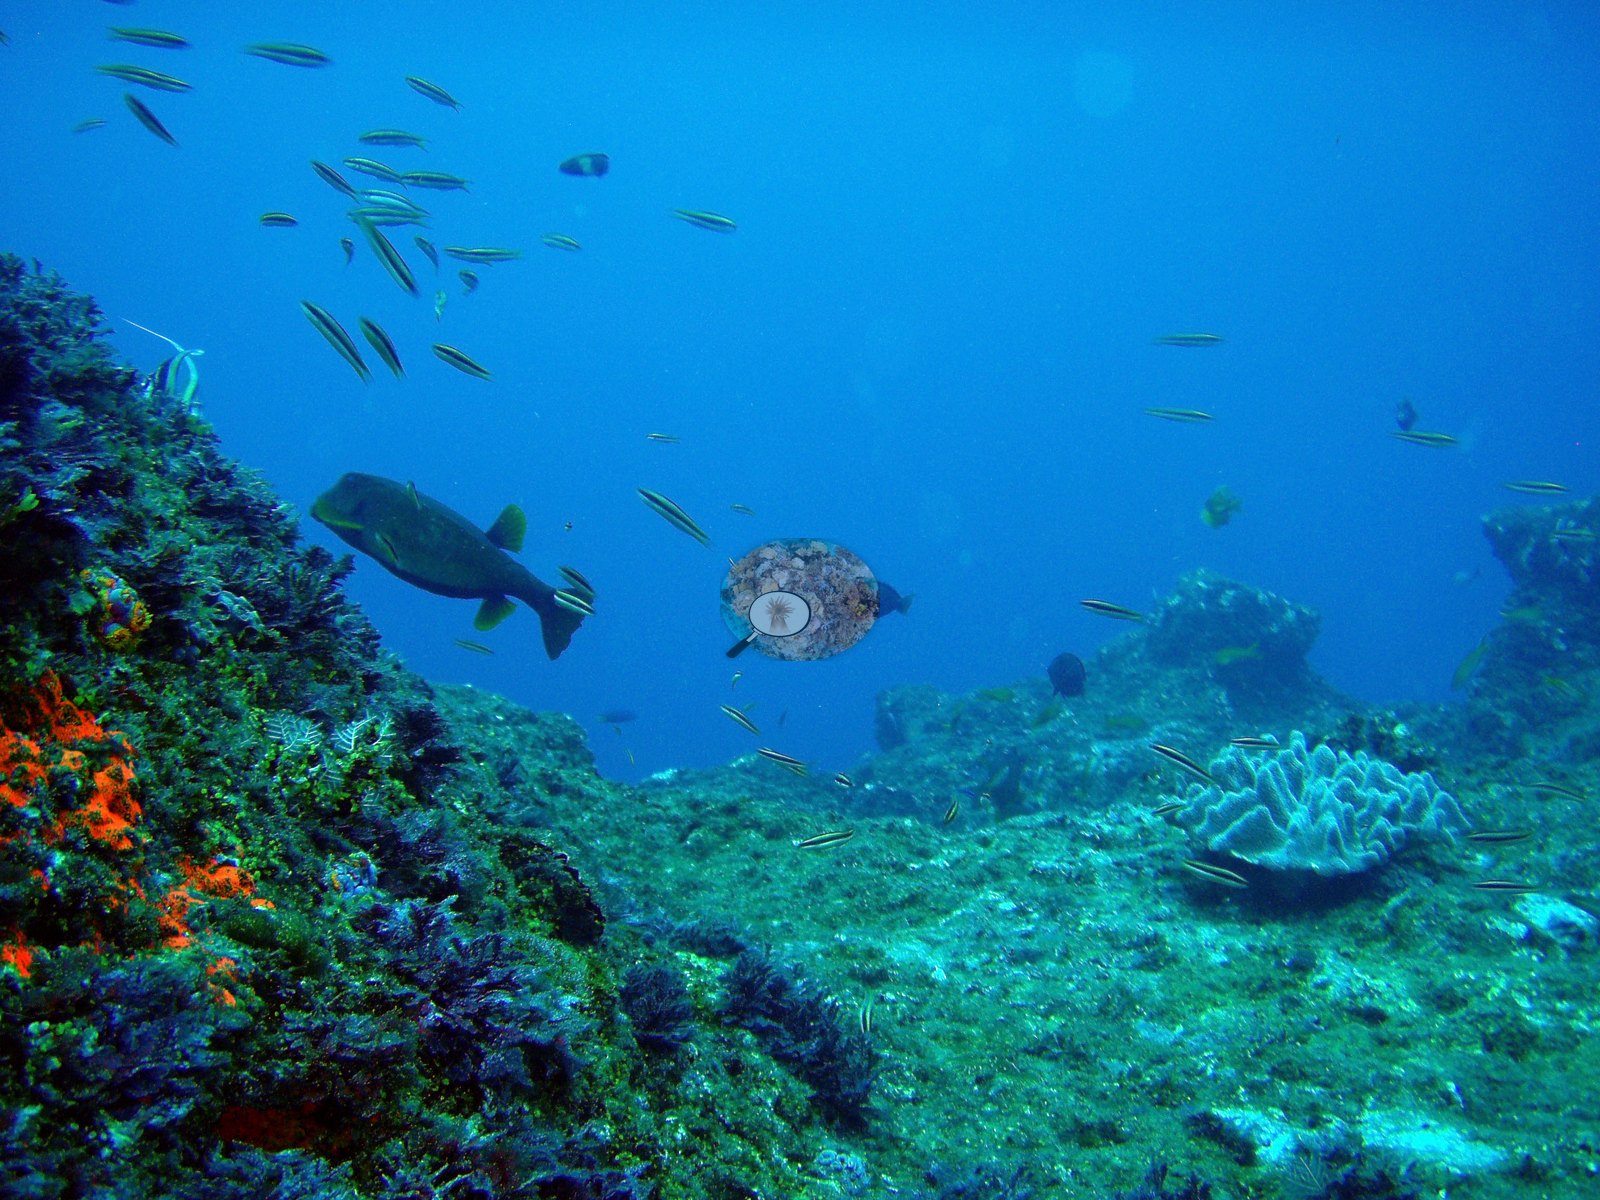
The first shows a robust tan branching Acropora thicket with white branch tips standing at the edge of a pale silt-sand plain, with a school of fifty-plus green chromis hovering over the sand margin, one black-and-white humbug damselfish, and a few darker damsels below — a coral patch abutting soft sediment, exactly the mosaic the logs describe (e.g., Image 1).

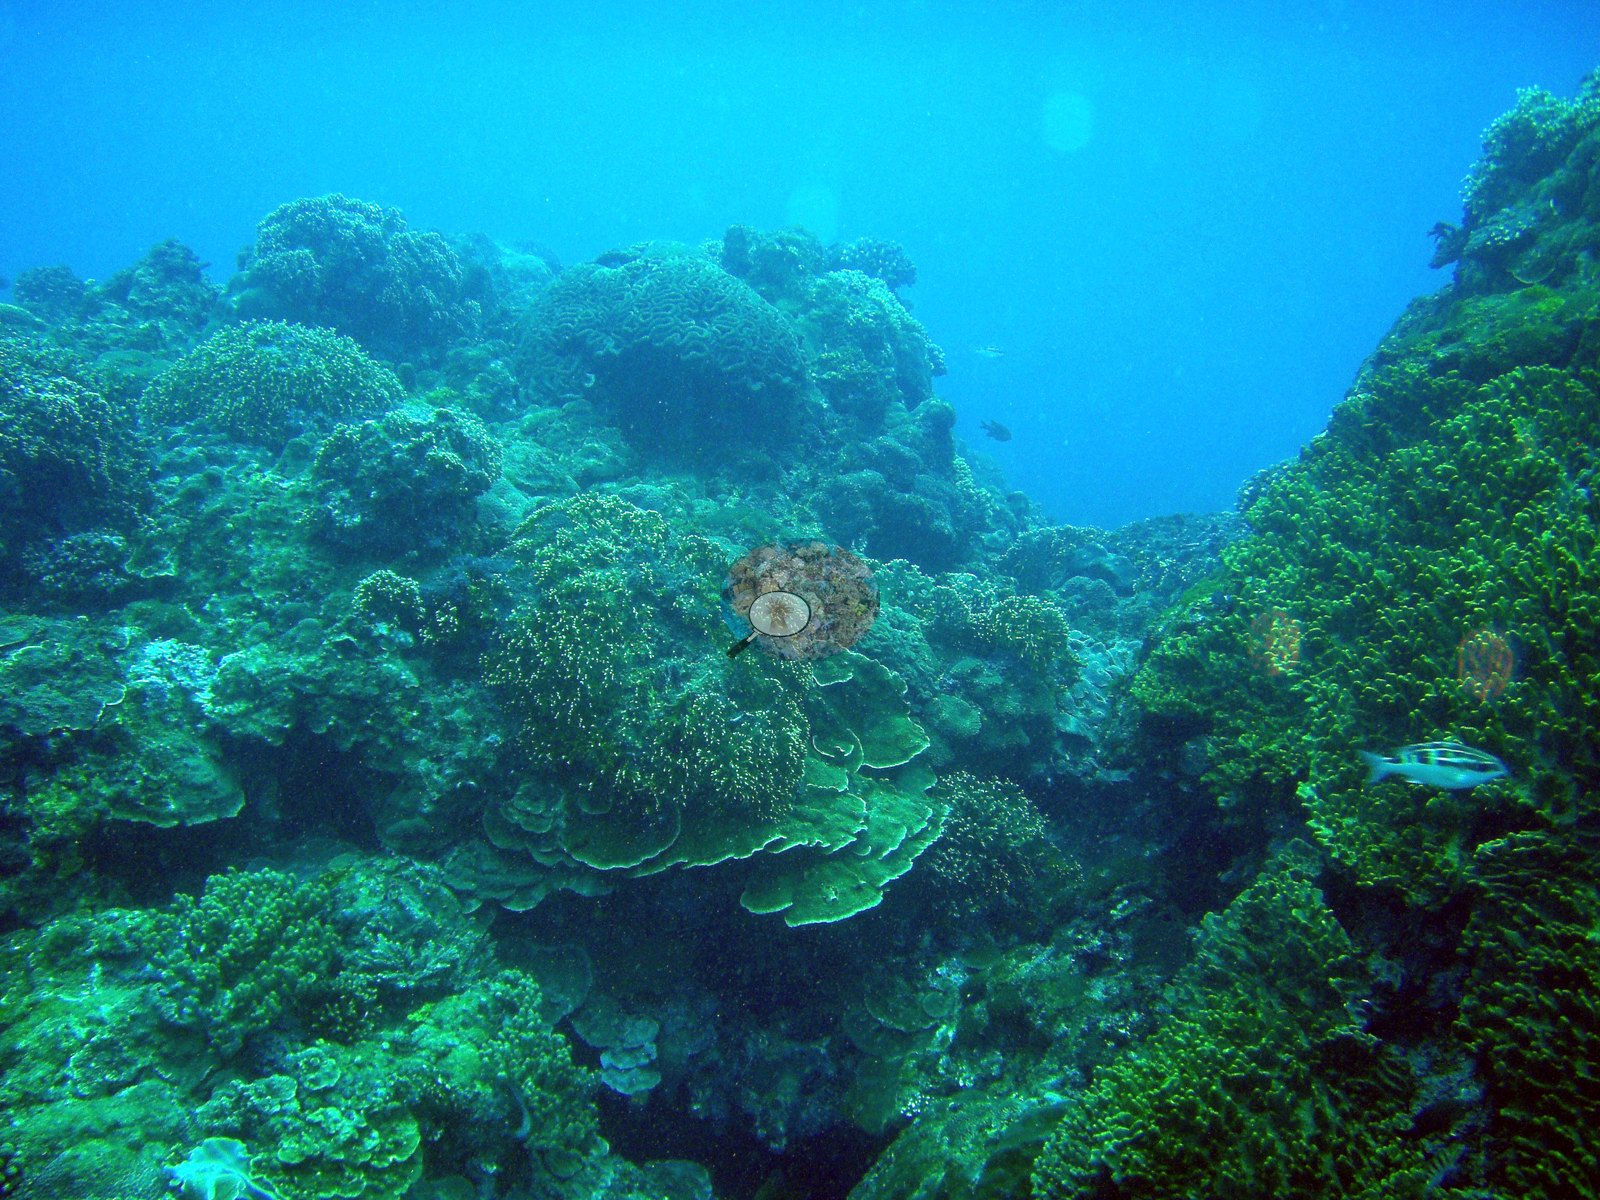
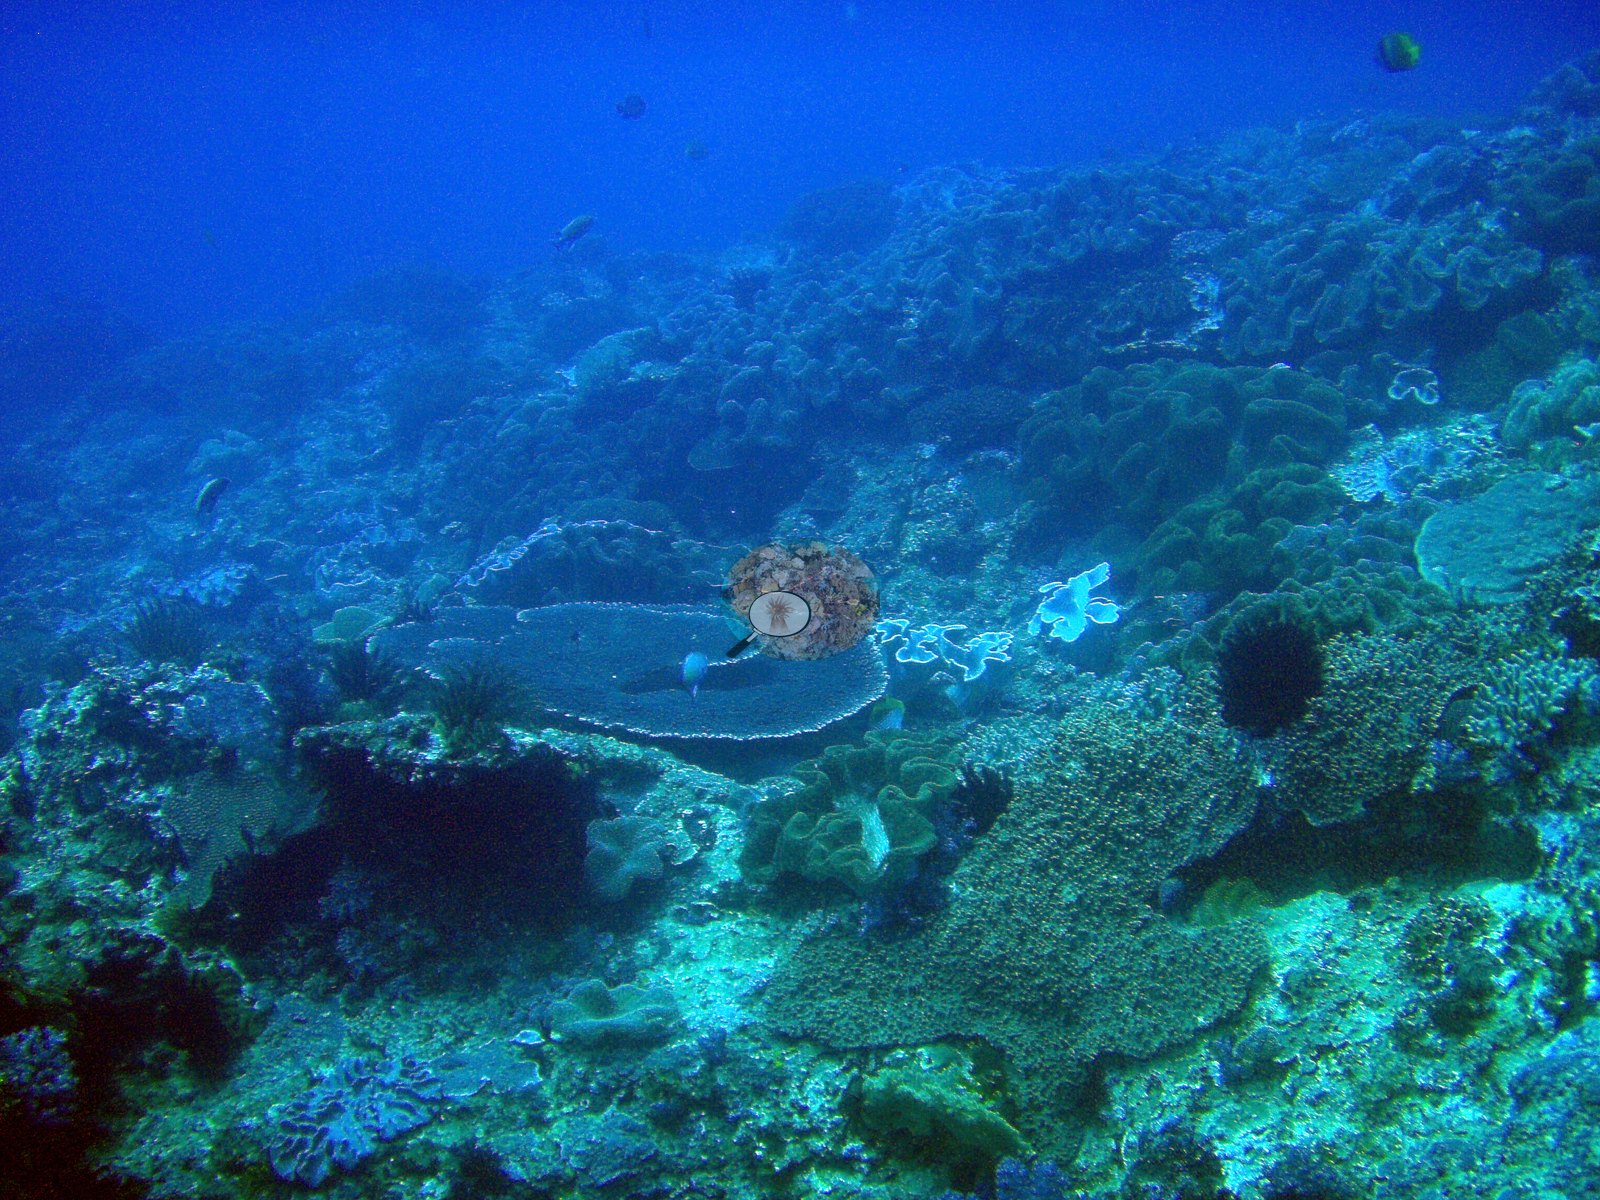
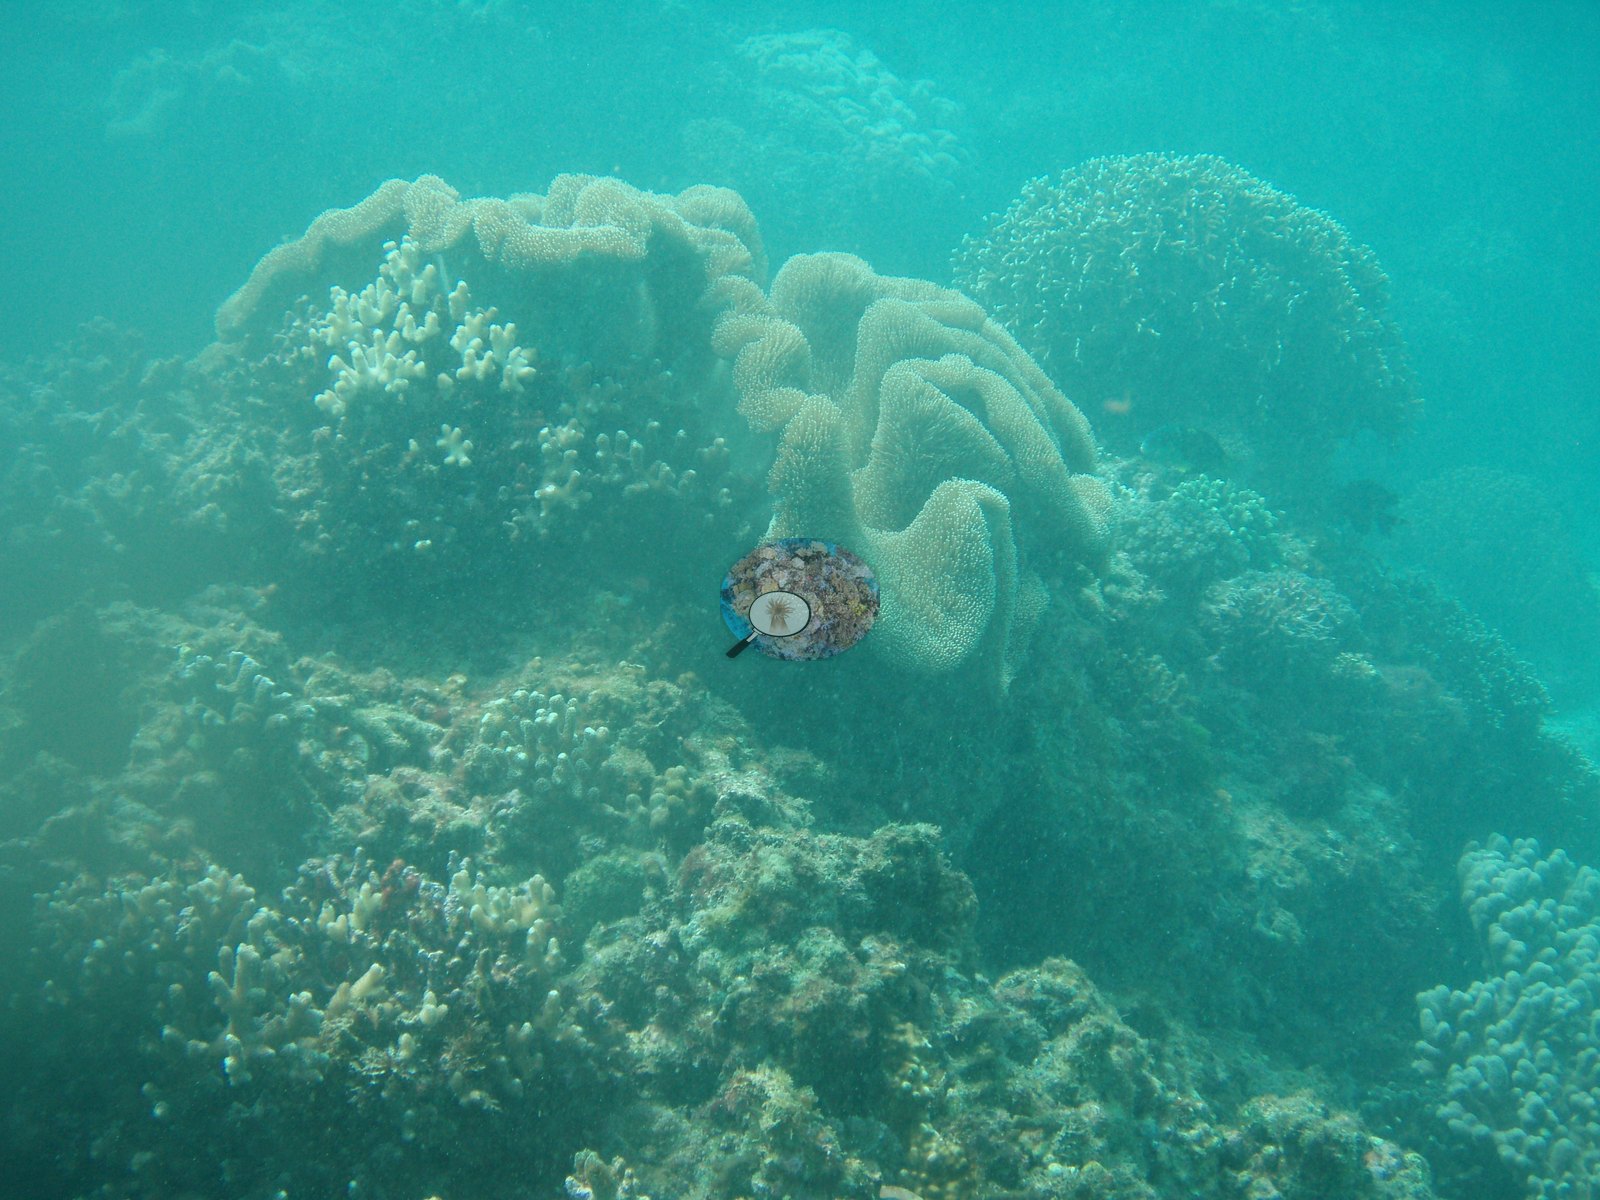
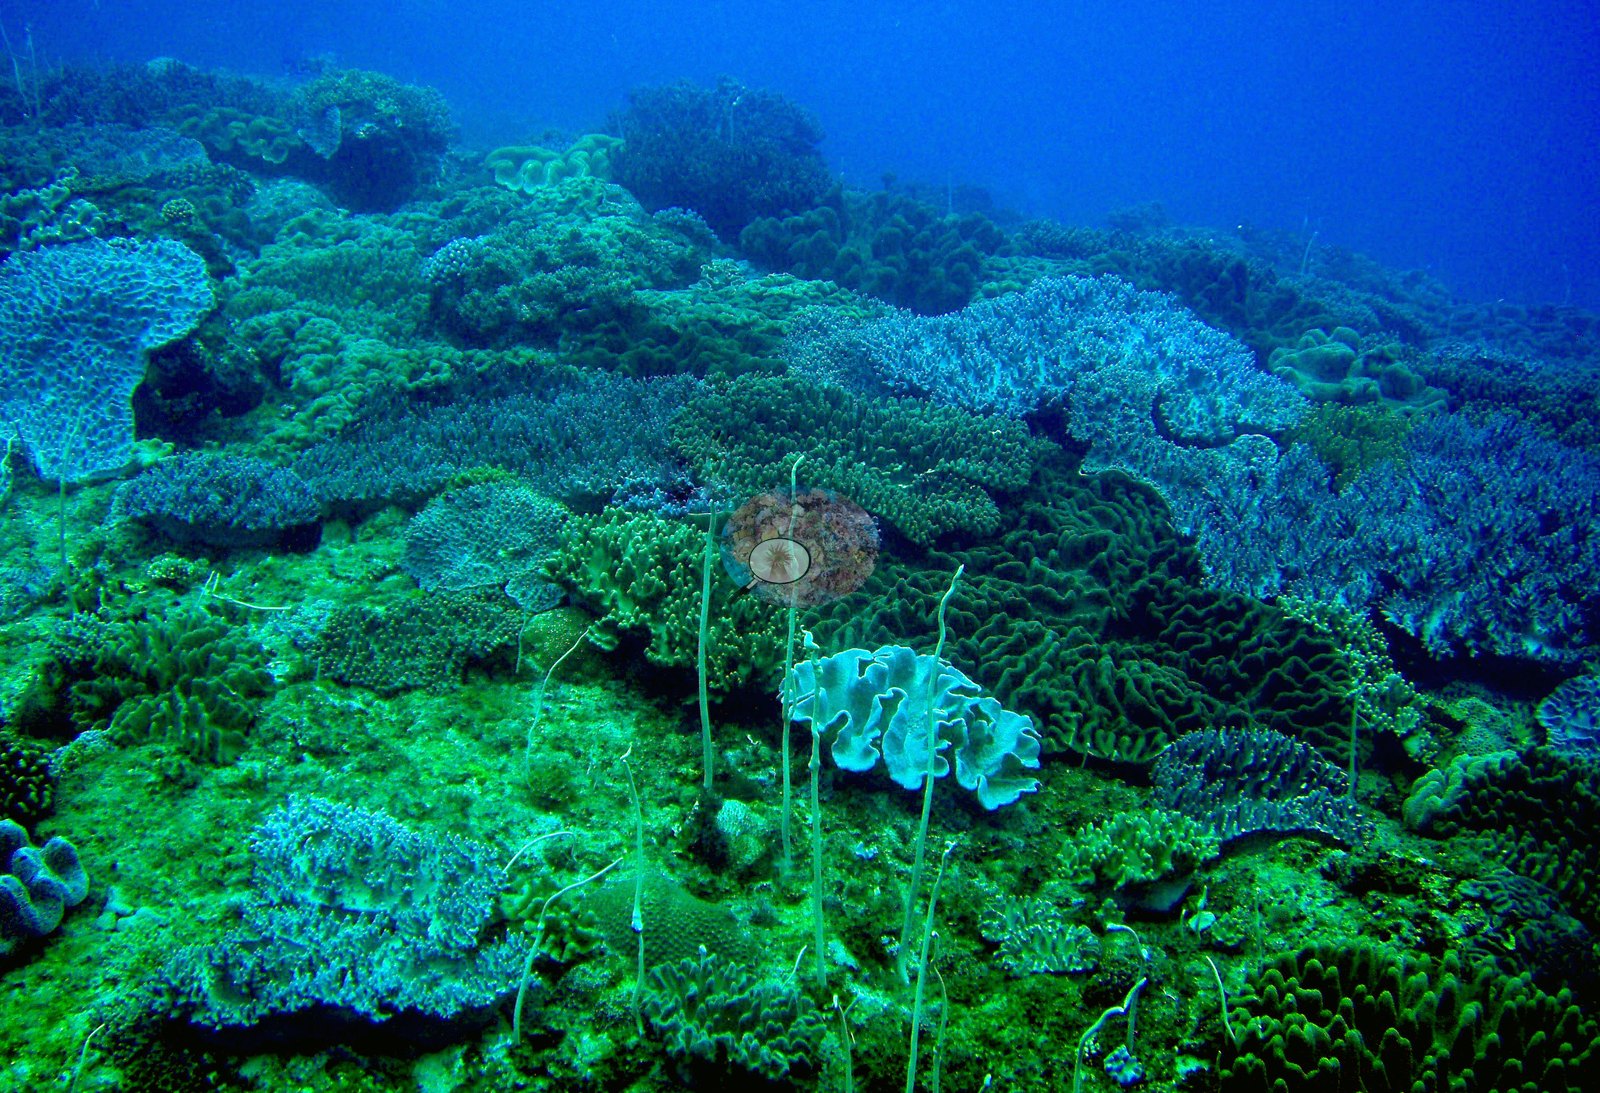
The second is a natural-light, green-cast wide view of a densely covered slope: stacked scalloped foliose and plating colonies, a large maze-patterned brain coral above them, bushy fine-branching colonies along the right ridge, encrusting growth throughout, and a striped bream-like fish — high living cover in visibly turbid, greenish water (e.g., Image 2).
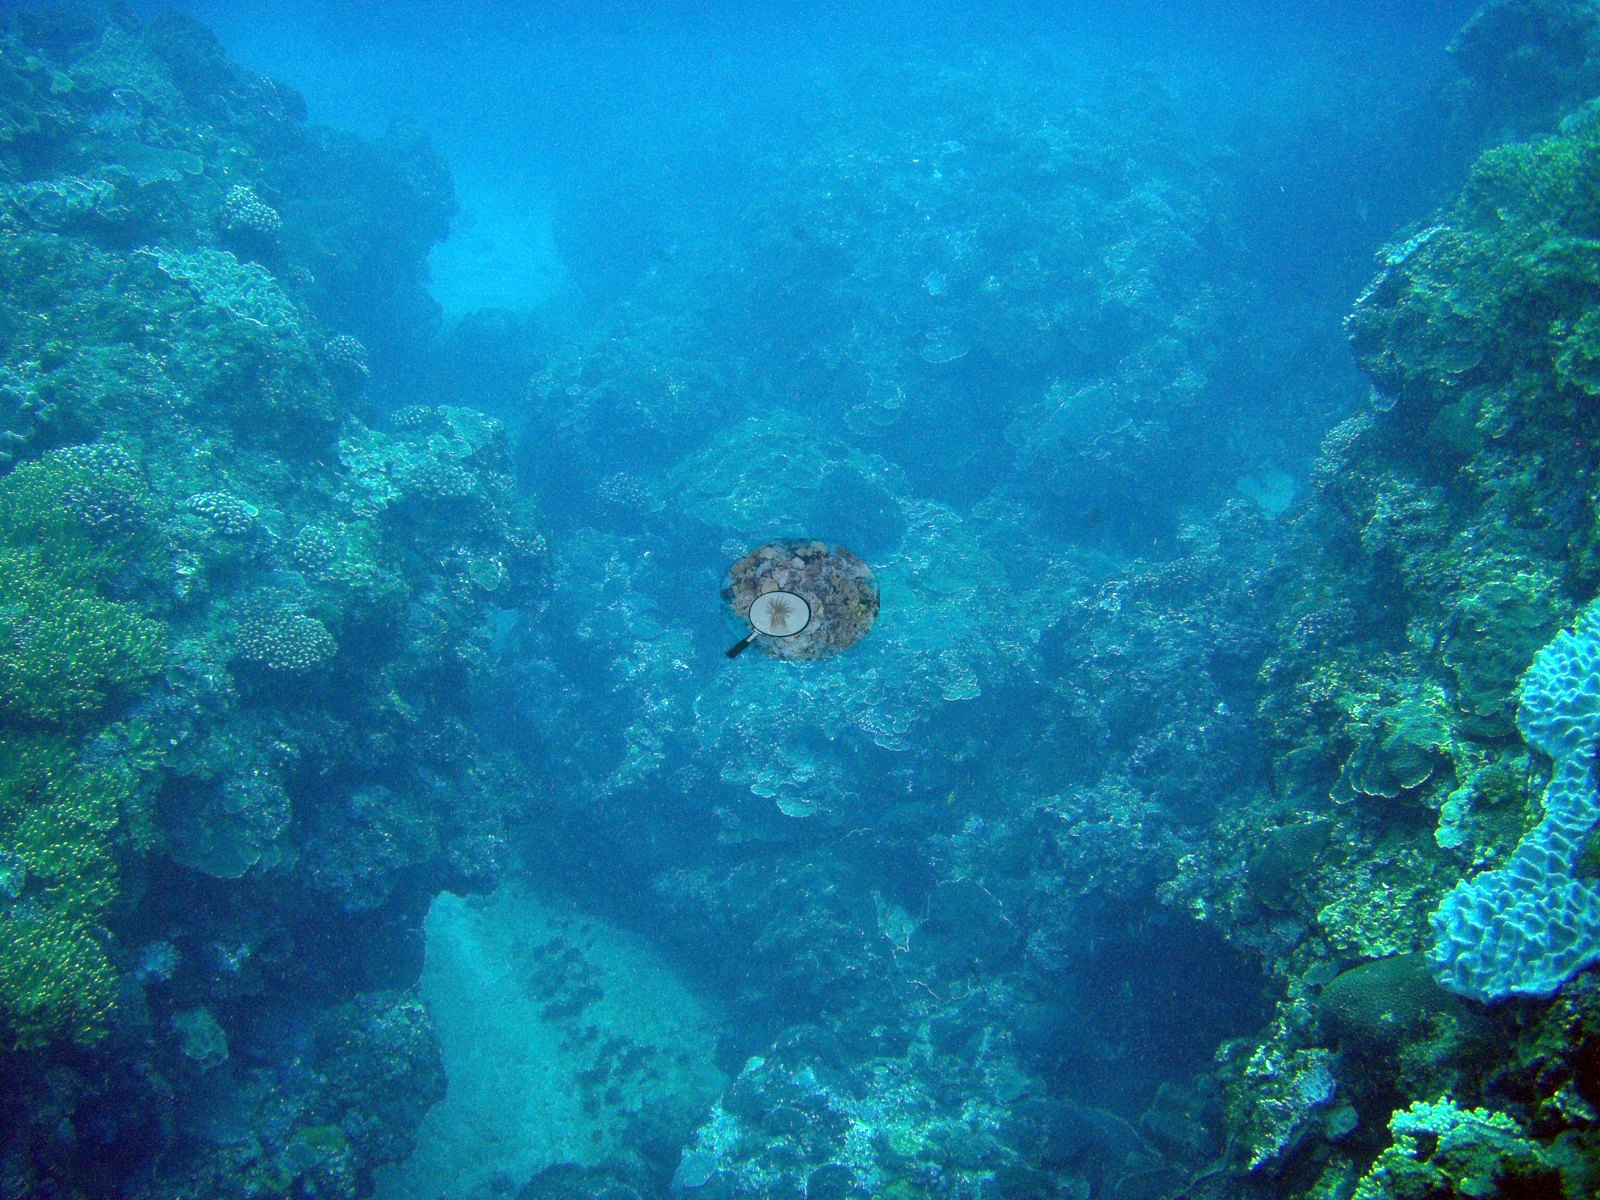
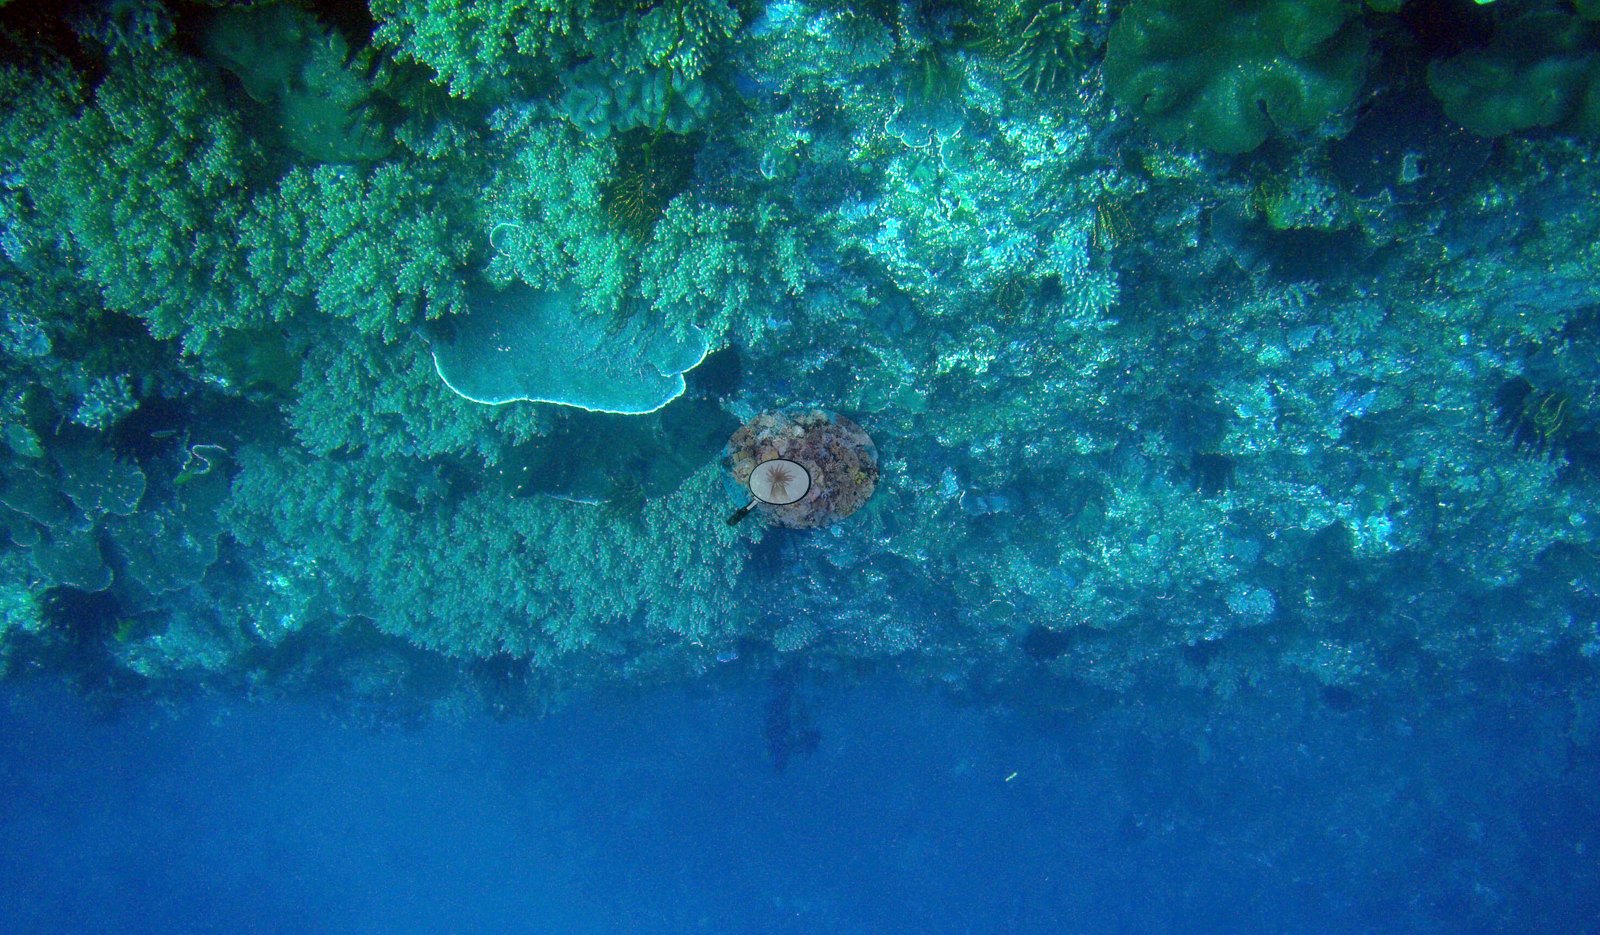
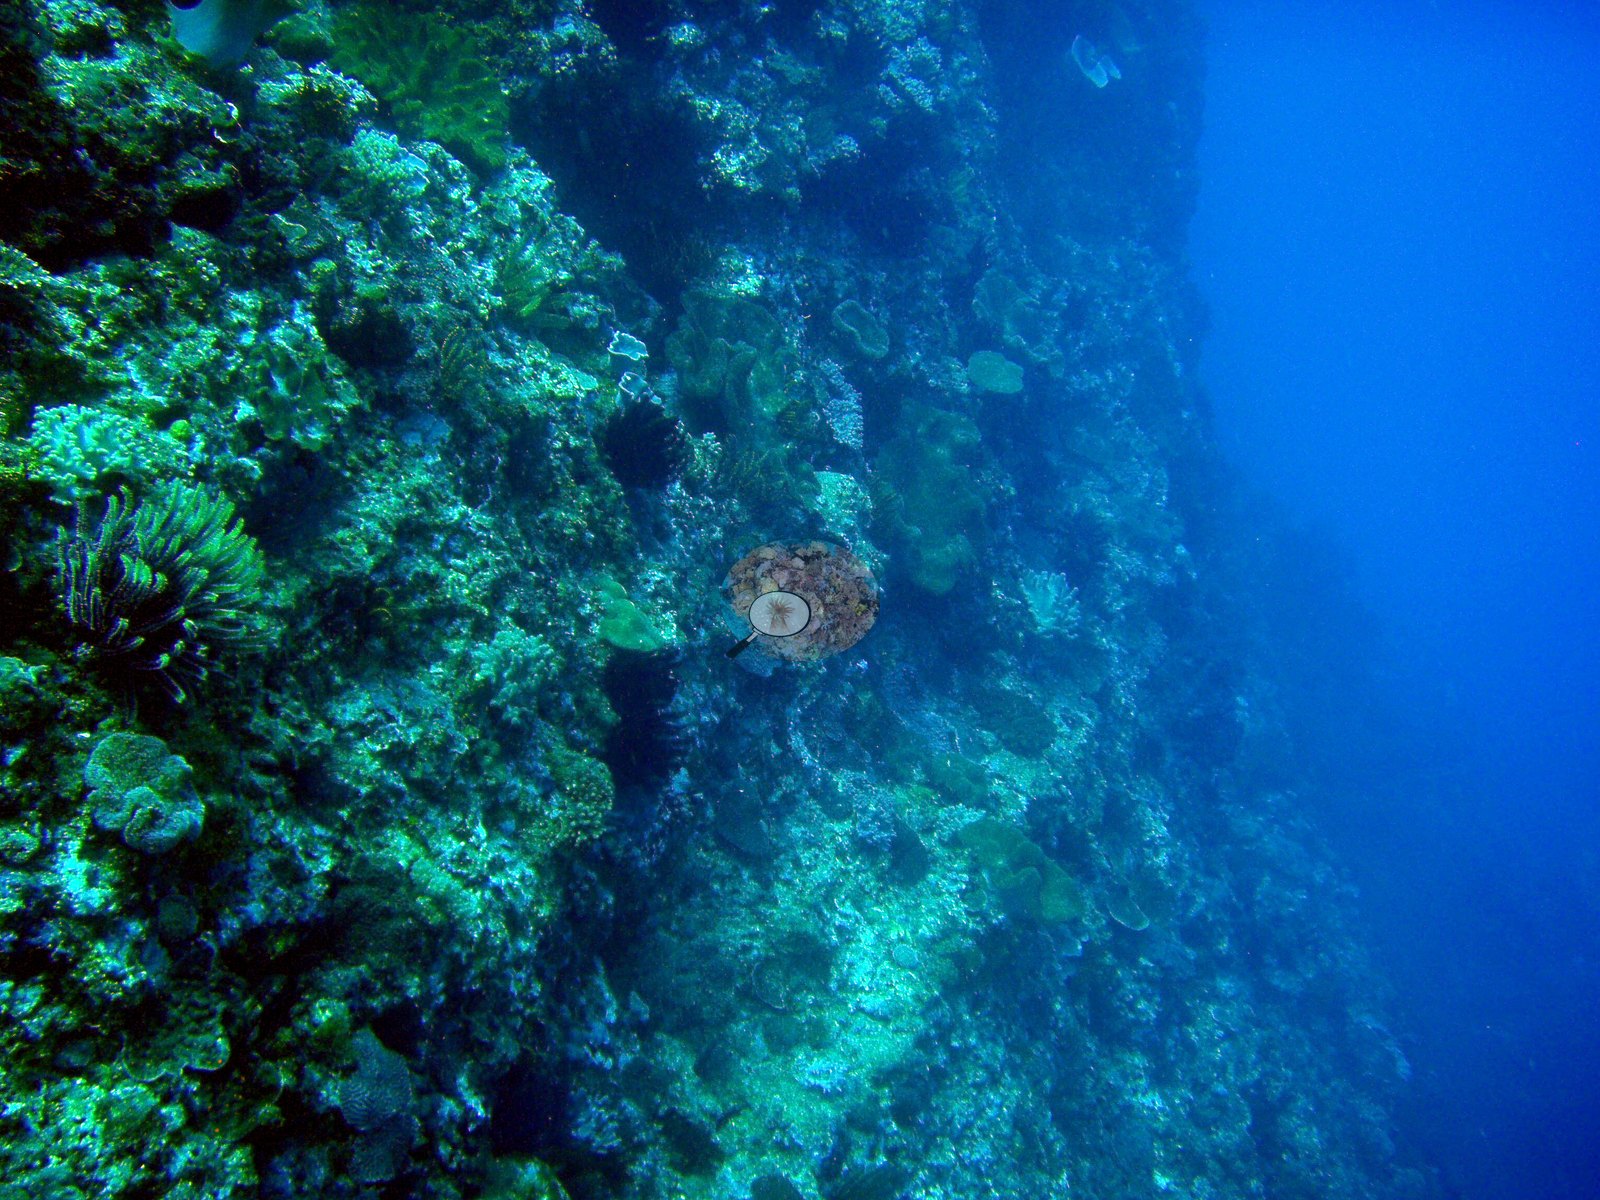
The third looks along a steep, near-vertical face falling into blue: plating and encrusting colonies the whole way down, small massive heads, shadowed crevices, and several large feather stars on the near wall, matching a 2008 log entry that reads simply "murky, many crinoids" (e.g., Image 3).
Coral cover
- No coral-cover value of its own is published here; nothing is estimated from these photographs.
Stressors
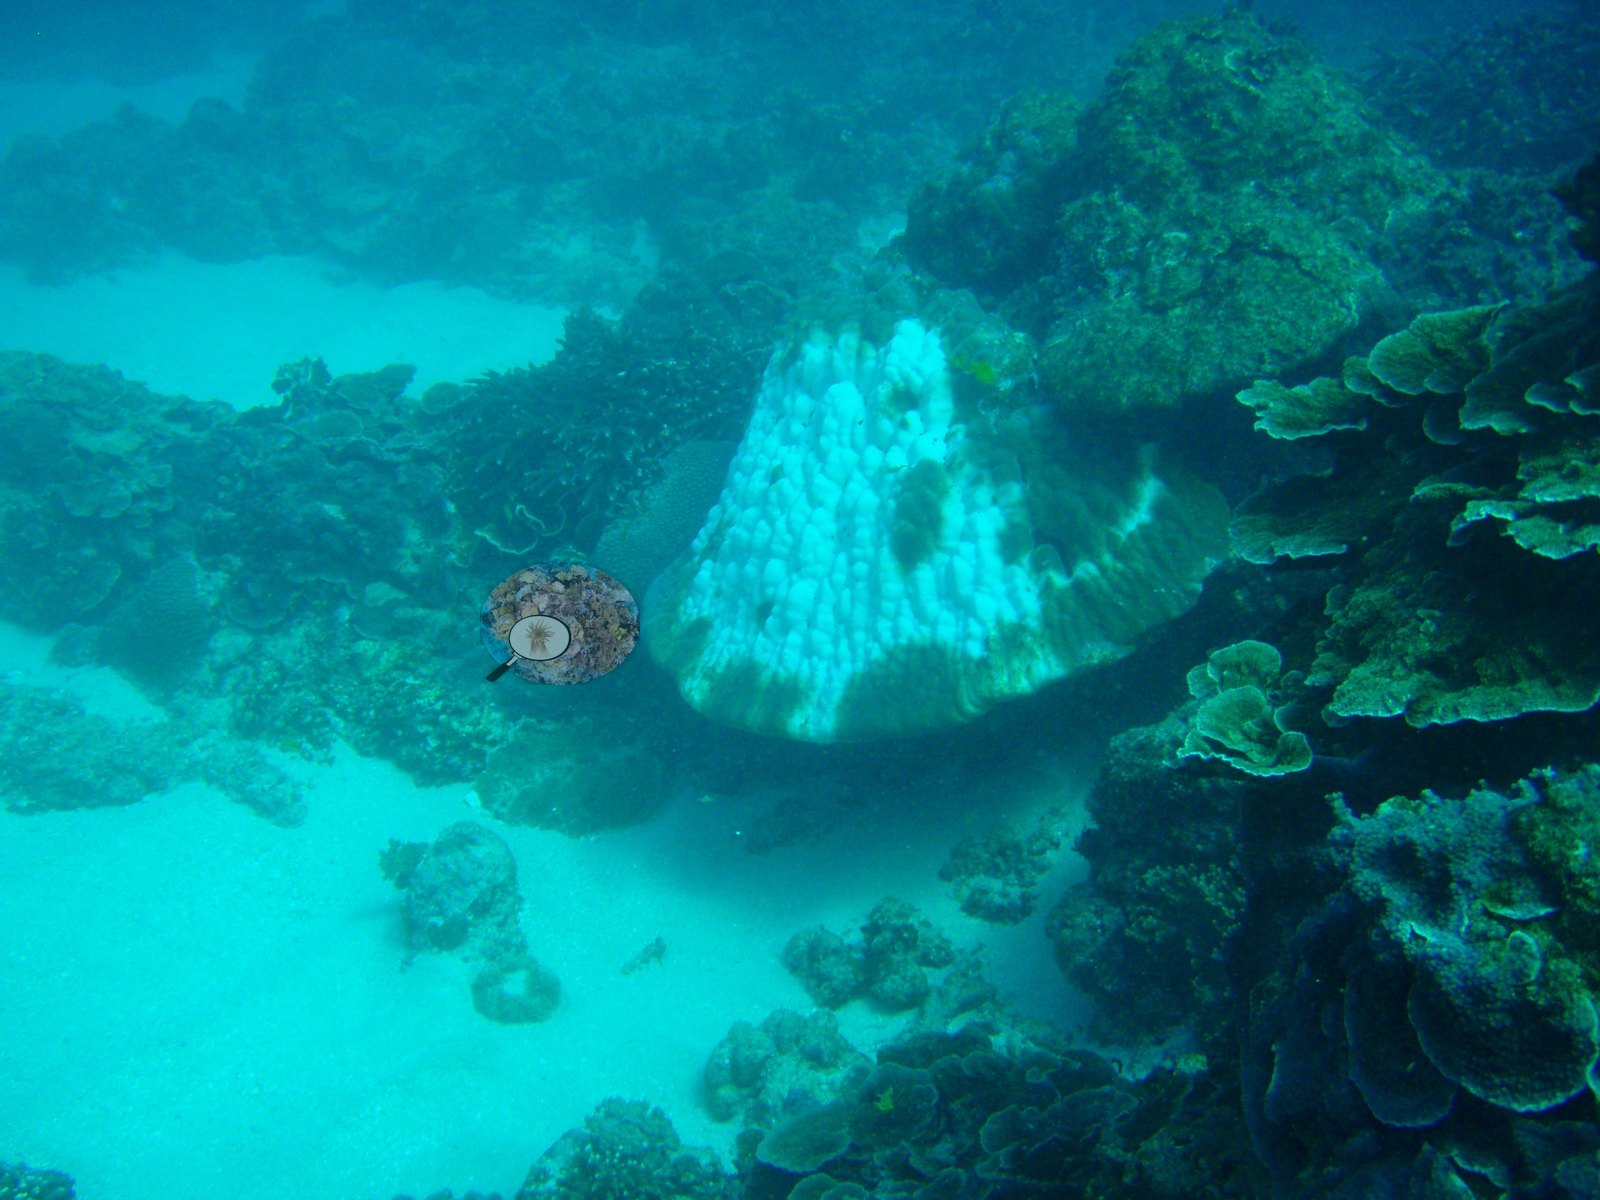
Image 6, filed by Anderson as 'bleaching', shows a large massive coral white over most of its upper surface with pigmented patches below, which is partial bleaching; the photograph is undated within the 2008-2010 dives.
No disease, predation or man-made object is resolvable in the frames described, and the green-blue color cast makes finer pigment calls unsafe.
Comparisons with other data
Tkachenko et al. (2007) and Dang et al. (2020) surveyed this site (Nanwan). Within 5 km, 22 independent stations recorded station-year means of 2.3–49% hard coral cover between 2003 and 2025; the nearest, XL Catlin Seaview Survey at transect 42011, 0.66 km away, read 15–18% between 2016 and 2018.
Dive record
Anderson's own 2008-2011 University of Hawaii, UCSB, and dive-computer logs carry more than fifty dives here, from 3.7 to 33.5 m: repeated Seriatopora, Pocillopora damicornis, and Stylophora pistillata collections, settlement-tile and underwater-platform work, a coral-spawning night dive, water and sediment transects, a dive on a Greek wreck, and dives in the power-plant thermal outlet at roughly 30°C and near a sewage outfall where coral was overgrown by algae.
Other notes
Thirteen photographs are attached to this site, from Anderson's website and a general Nanwan picture collection rather than a dive-by-dive set; only the first three are described in words.
Independent surveys nearby
| Agency / program | Year(s) | Stations / distance | Link |
|---|---|---|---|
| Meng et al. (Kenting monitoring, unpublished) | 2003–2006 | 3 stations, 2.28–2.34 km | Records ↓ |
| Reef Check | 2016–2025 | 2 stations, 1.52–3.98 km | Records ↓ |
| Ribas-Deulofeu et al. (2016) | 2011 | 7 stations, 1.11–4.27 km | Records ↓ |
| Tkachenko and Soong (2010) | 2007 | 3 stations, 1.11–3.49 km | Records ↓ |
| XL Catlin Seaview Survey | 2016–2018 | 7 stations, 0.66–4.09 km | Records ↓ |
Within 5 km, 22 independent survey stations recorded hard coral cover in 67 records between 2003 and 2025. Of the 10 stations surveyed in more than one year, 5 were scored by divers or by people annotating photographs: 3 declined (by 1.5–17 points) and 2 increased (by 2.0–4.0 points) between their first and latest surveys. The other 5 were scored by automated image analysis: 5 changed by 7 points or less, inside the 7-point method-noise floor (inconclusive). The longest record, Hejie (Reef Check, 3.98 km away), went from 43% in 2016 (mean of 2 surveys) to 26% in 2025 (mean of 4 surveys). Since 2021, station-year means average 24% (range 18–31%; n = 4 station-years from 16 records).
Collected by other programs using different methods (Reef Check uses point-intercept transects; the XL Catlin Seaview Survey uses photo-transects with automated image annotation), so these are context for the figures above, not a like-for-like comparison. Where a station was surveyed more than once, the cell shows either the range of its values or, as a single value, the mean of surveys made in one year. Station names are not dive-site names.
Show all 67 independent survey records
| Agency | Site / location | Date | Hard coral cover (%) | Distance | Link |
|---|---|---|---|---|---|
| Meng et al. (Kenting monitoring, unpublished) | Nuclear power plant outlet, right (出水口右) | 2003–2006 | 7.2–12% (range of yearly means; 4 surveys; 12 transects) | 2.28 km | — |
| Meng et al. (Kenting monitoring, unpublished) | Nuclear power plant outlet, left (出水口左) | 2003–2006 | 6.6–12% (range of yearly means; 4 surveys; 12 transects) | 2.28 km | — |
| Meng et al. (Kenting monitoring, unpublished) | Tiaoshi (跳石) | 2003–2006 | 29–38% (range of yearly means; 4 surveys; 12 transects) | 2.34 km | — |
| Tkachenko and Soong (2010) | Hobihu No-Take area | 2007 | 27% (2 records) | 1.11 km | — |
| Tkachenko and Soong (2010) | Tiaoshi | 2007 | 40% (2 records) | 2.34 km | — |
| Tkachenko and Soong (2010) | Outlet | 2007 | 30% (2 records) | 3.49 km | — |
| Ribas-Deulofeu et al. (2016) | Houbihu | 2011 | 48% | 1.11 km | doi:10.1371/journal.pone.0160601 |
| Ribas-Deulofeu et al. (2016) | Outlet | 2011 | 45% | 2.22 km | doi:10.1371/journal.pone.0160601 |
| Ribas-Deulofeu et al. (2016) | Tioashih | 2011 | 10% | 2.34 km | doi:10.1371/journal.pone.0160601 |
| Ribas-Deulofeu et al. (2016) | Leidashih | 2011 | 28% | 2.45 km | doi:10.1371/journal.pone.0160601 |
| Ribas-Deulofeu et al. (2016) | Tanzihwan | 2011 | 14% | 3.09 km | doi:10.1371/journal.pone.0160601 |
| Ribas-Deulofeu et al. (2016) | Hongchai | 2011 | 2.3% | 3.81 km | doi:10.1371/journal.pone.0160601 |
| Ribas-Deulofeu et al. (2016) | Dingbaisha | 2011 | 4.8% | 4.27 km | doi:10.1371/journal.pone.0160601 |
| XL Catlin Seaview Survey | transect 42011 | 2016–2018 | 15–18% (2 surveys) | 0.66 km | doi:10.14264/uql.2019.930 |
| XL Catlin Seaview Survey | transect 42012 | 2016–2018 | 5.1–9.9% (2 surveys) | 1.23 km | doi:10.14264/uql.2019.930 |
| XL Catlin Seaview Survey | transect 42017 | 2016–2018 | 9.6–14% (2 surveys) | 1.89 km | doi:10.14264/uql.2019.930 |
| XL Catlin Seaview Survey | transect 42016 | 2016 | 19% | 2.08 km | doi:10.14264/uql.2019.930 |
| XL Catlin Seaview Survey | transect 42013 | 2016–2018 | 13–16% (2 surveys) | 2.10 km | doi:10.14264/uql.2019.930 |
| XL Catlin Seaview Survey | transect 42015 | 2016 | 11% | 2.24 km | doi:10.14264/uql.2019.930 |
| Reef Check | Hejie | 2016–2025 | 26–49% (range of yearly means; 22 surveys) | 3.98 km | — |
| XL Catlin Seaview Survey | transect 42014 | 2016–2018 | 21–25% (2 surveys) | 4.09 km | doi:10.14264/uql.2019.930 |
| Reef Check | Houbihu | 2024–2025 | 18–22% (range of yearly means; 8 surveys) | 1.52 km | — |
Data & links
All images from Coral Reef Diagnostics. Data on this page are from Coral Reef Diagnostics (the dive record) and the organizations named in the data sources above; Coral Reef Diagnostics has no coral cover estimate of its own at this site.
© Coral Reef Diagnostics.
References
- Tkachenko KS, Soong K (2010). Protection of habitat types: a case study of the effectiveness of a small marine reserve and impacts of different habitats on the diversity and abundance of coral reef fishes. Zoological Studies 49:195-210.
- Ribas-Deulofeu L, Denis V, De Palmas S, Kuo CY, Hsieh HJ, Chen CA (2016). Structure of Benthic Communities along the Taiwan Latitudinal Gradient. PLOS ONE 11:e0160601. PDF
- Tkachenko KS, Wu BJ, Fang LS, Fan TY (2007). Dynamics of a coral reef community after mass mortality of branching Acropora corals and an outbreak of anemones. Marine Biology 151:185-194. DOI
- Dang VDH, Cheung PY, Fong CL, Mulla AJ, Shiu JH, Lin CH, et al. (2020). Sea urchins play an increasingly important role for coral resilience across reefs in Taiwan. Frontiers in Marine Science 7:581945. DOI
- Gonzalez-Rivero M, et al. (2019). Seaview Survey photo-quadrat and image classification dataset. The University of Queensland (UQ eSpace) data collection. DOI