
Part of the regional summaries: Chagos Archipelago - Salomon / Blenheim / Speakers Bank and Chagos Archipelago
More info
Chagos (NOAA CRW virtual station)One of the most Acropora-dominated reefs in Chagos: half the bottom is live coral, and 83% of that is Acropora, spread as broad, overlapping golden-brown table corals. Only 13 coral genera were recorded, and the reef looks the same at both depths surveyed. Surveyed on the Living Oceans Foundation's Global Reef Expedition.
One other CRD dive site within 5 km shown in orange — click a marker to open its page.
🗺 Detailed map of the Global Reef Expedition dive sites, Speakers Bank, Chagos (Khaled bin Sultan Living Oceans Foundation; opens in a new window)
4 of these 12 photographs are shown beside the text that discusses them under "Site description" below.
Site description
General benthic features
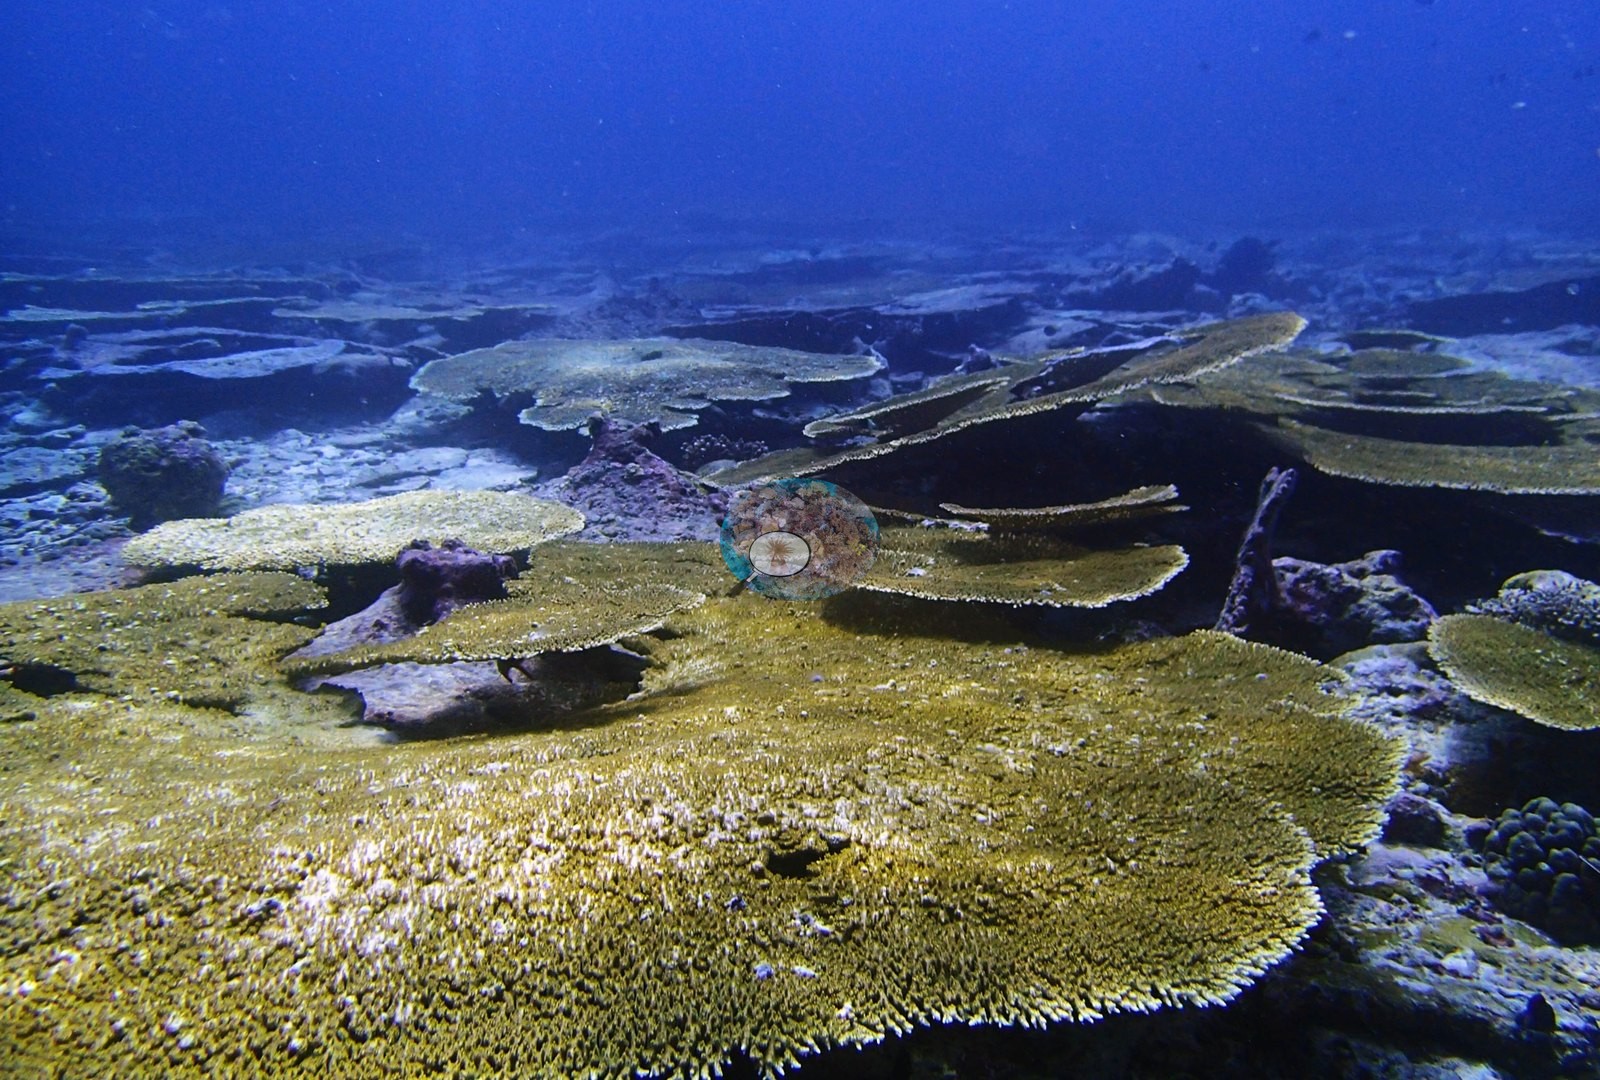
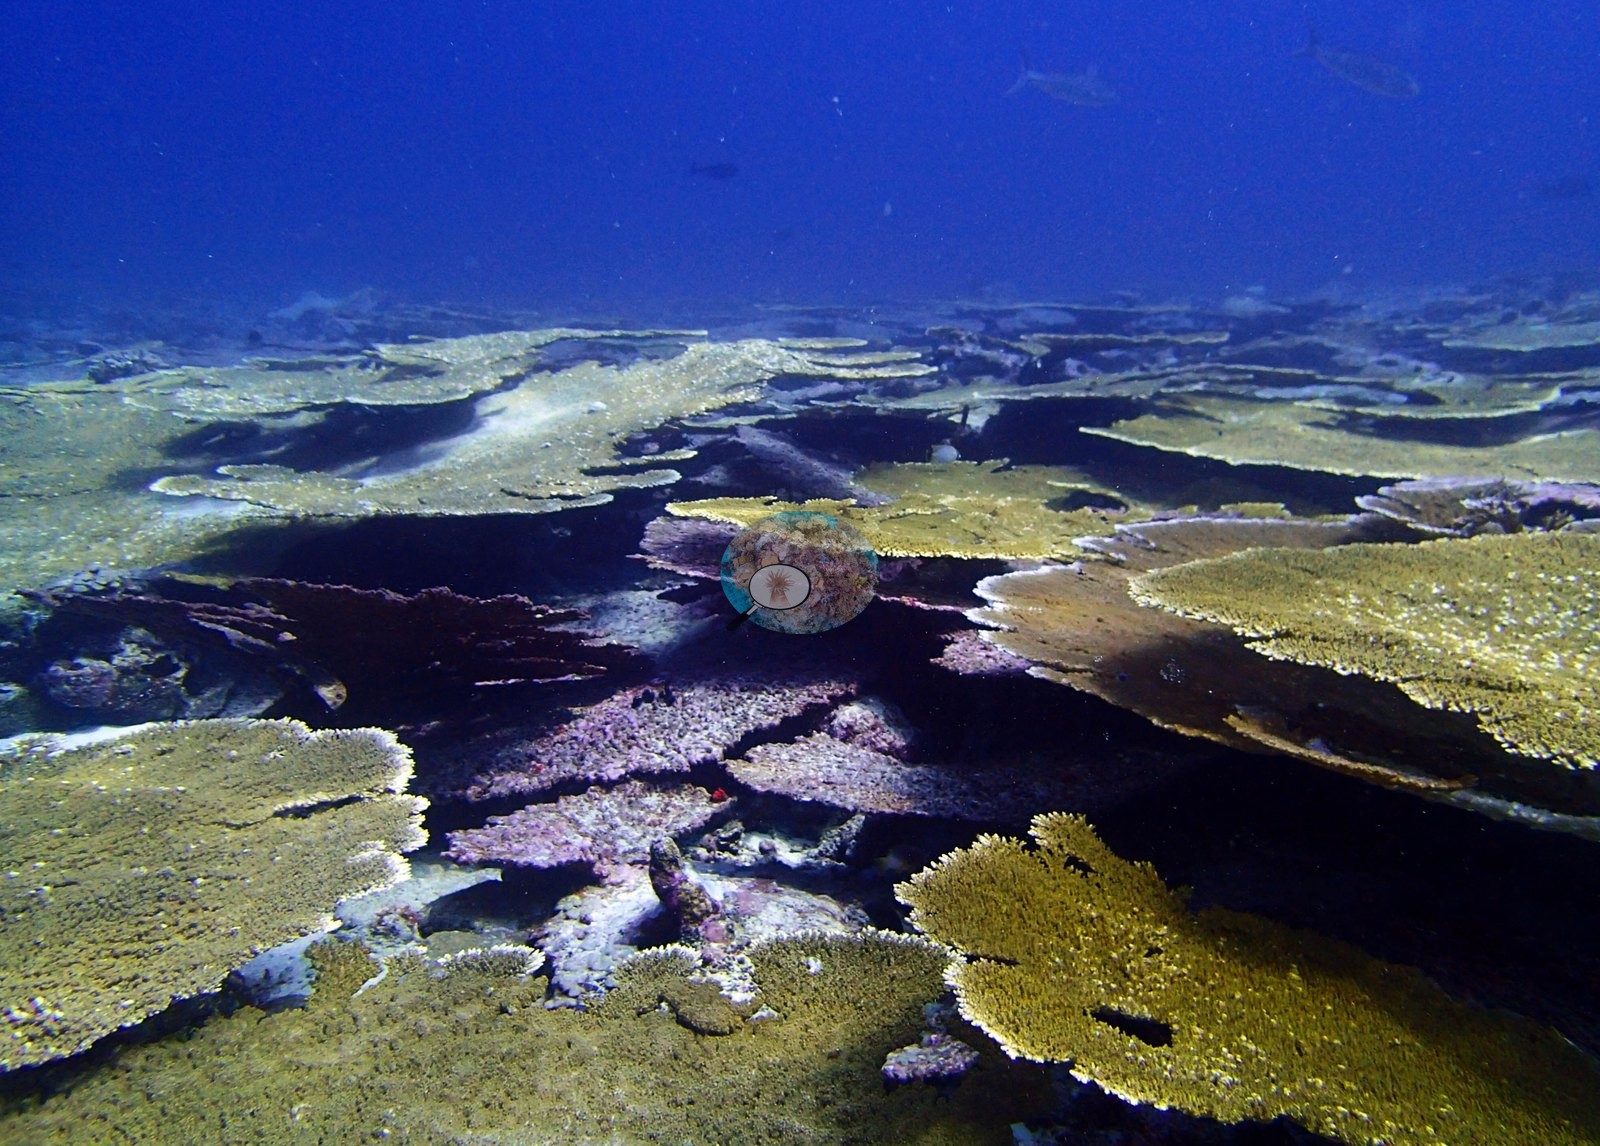
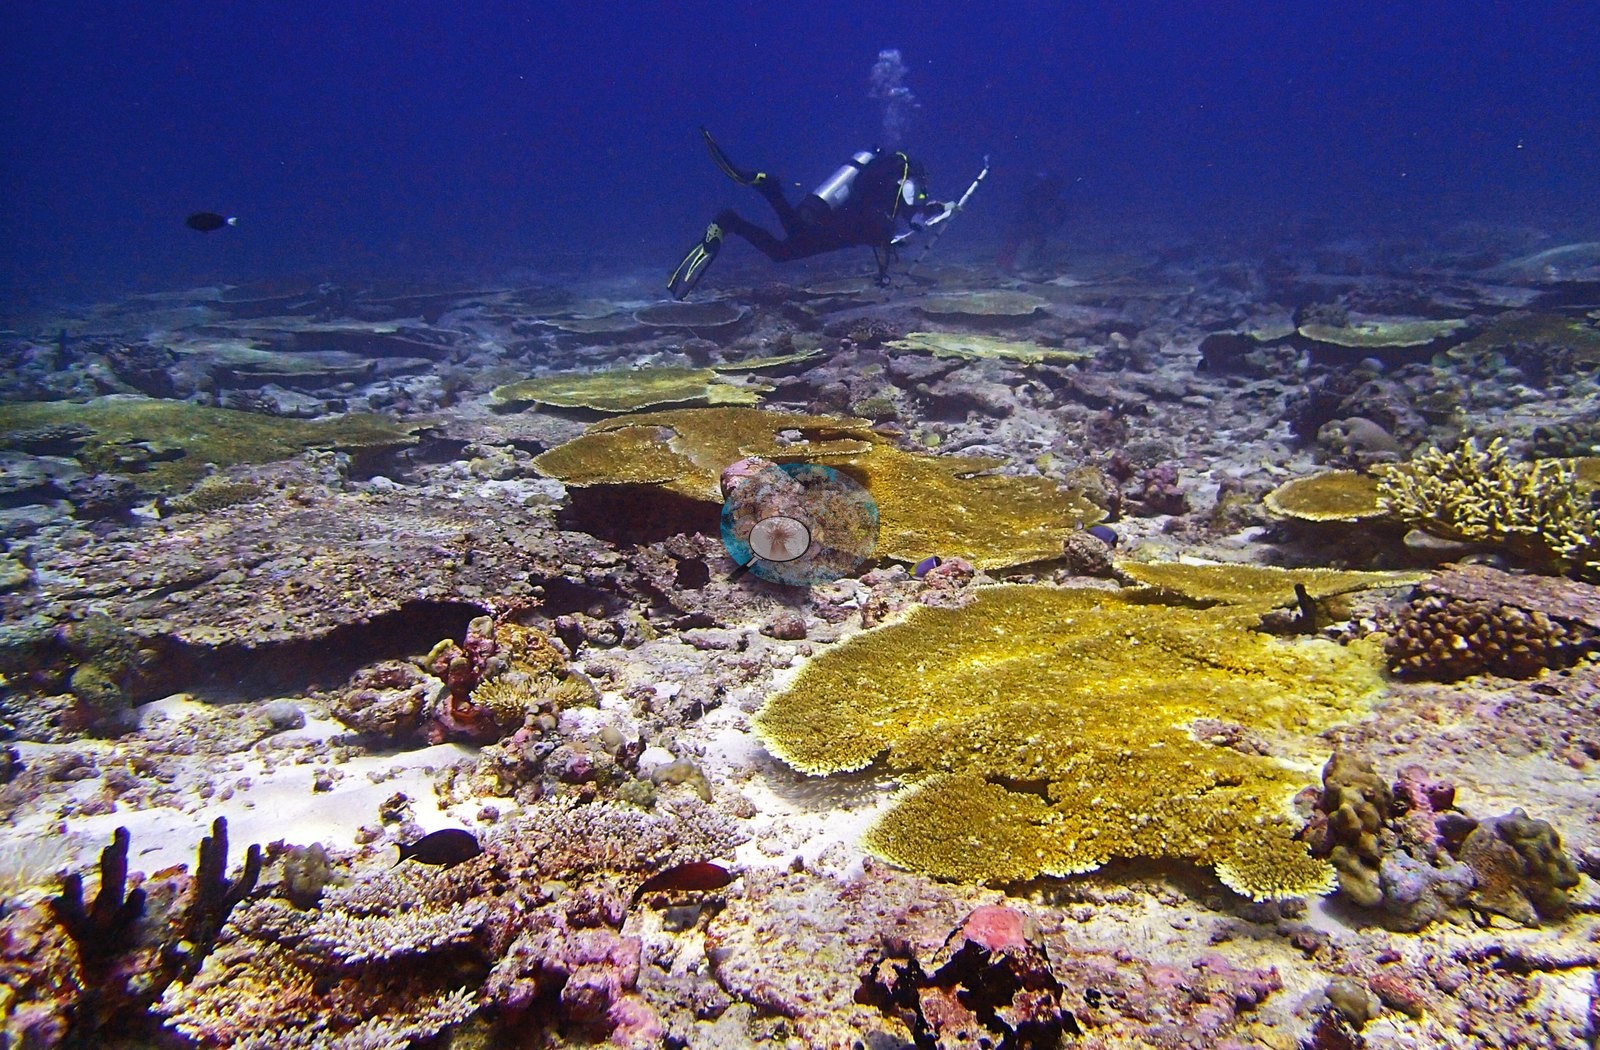
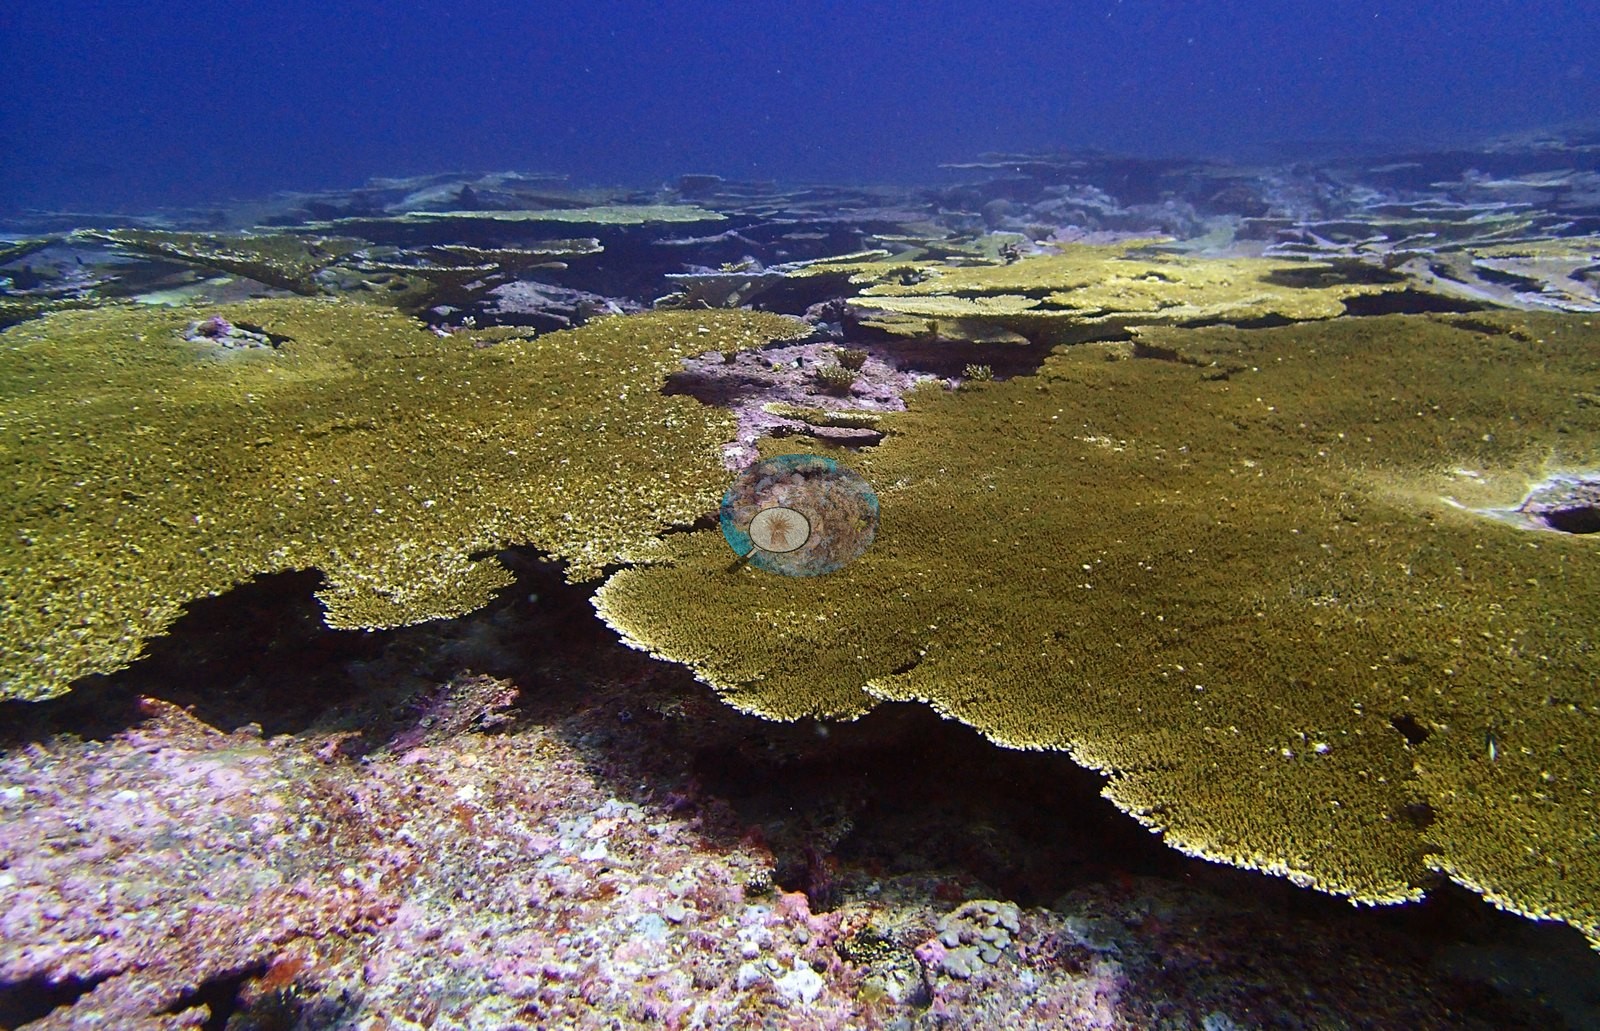
BISP101 is the most compositionally lopsided site in this batch and one of the most Acropora-dominated in the archipelago. Every other genus is a rounding error beside it: Montipora 3.36%, Pocillopora 1.93%, Leptastrea 0.61%, Psammocora 0.55%, Porites 0.53%, Astreopora 0.40%, and Favia 0.36%, with Pavona, Favites, Millepora, Cyphastrea, and Montastrea below that. Only 13 coral genera are non-zero — the shortest list of these five sites, and a striking contrast with the 28 and 29 recorded at BISA103 and BISA104. Crustose coralline algae hold 19.5% of the benthos, turf 9.5%, bare substrate 8.5%, macroalgae 3.2%, and non-coral invertebrates only 2.0%. Unlike every other site in this batch, the genus order does not rotate with depth — Acropora, then Montipora, in both bands. What changes is richness and algal cover, which rises from 33.7% to 45.0%. Reef structure is broad and laterally continuous rather than vertically towering. Large golden-brown plates recur from the foreground to the limit of visibility, often overlapping or standing on short central stalks, creating repeated horizontal shelves a short distance above the substrate and leaving open corridors between colony bases (e.g., Image 2).
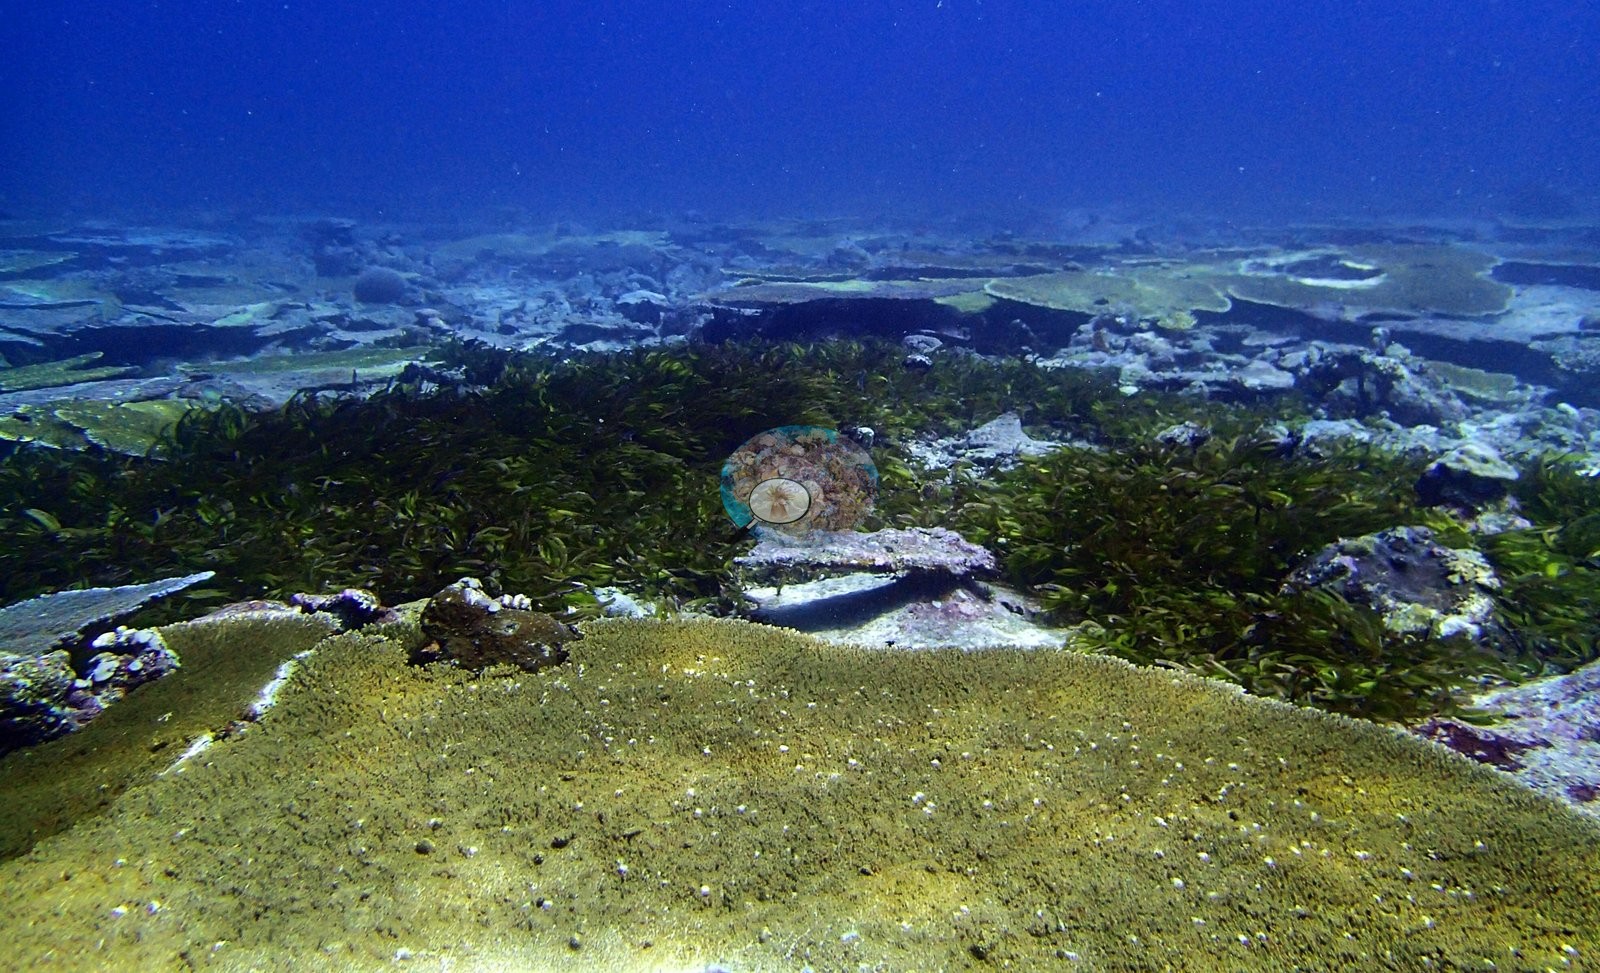
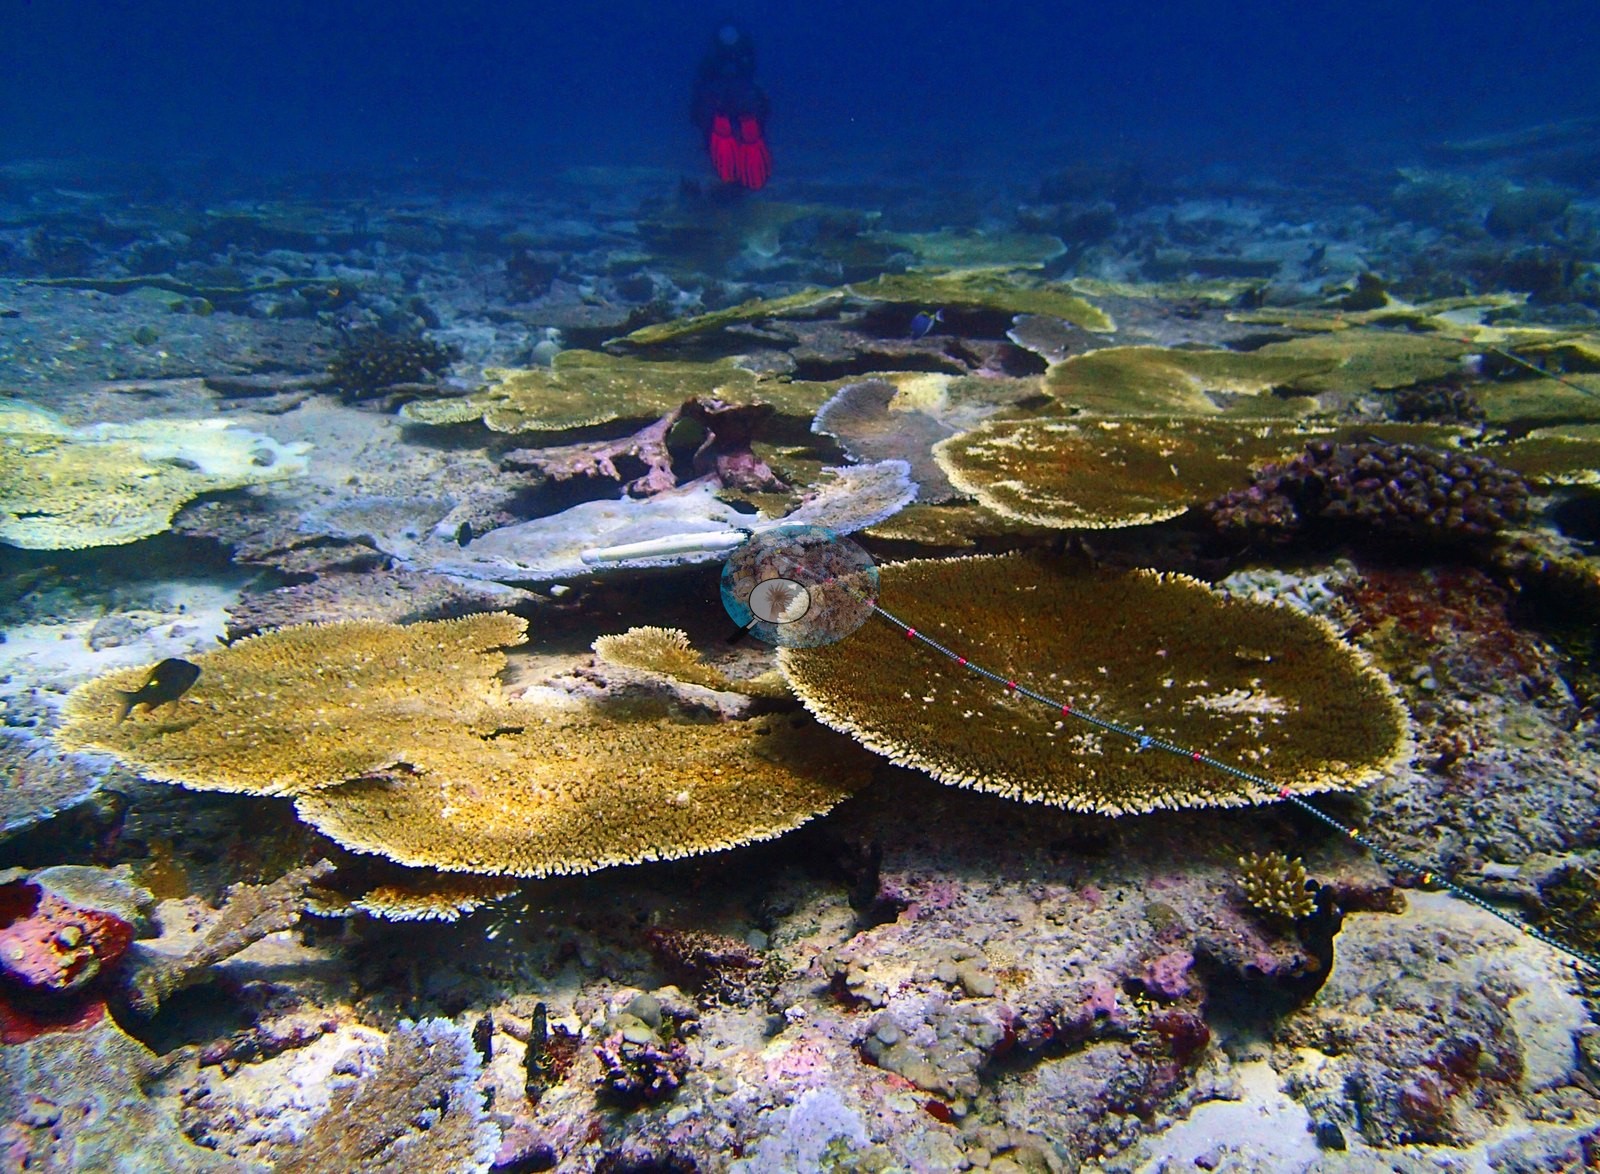
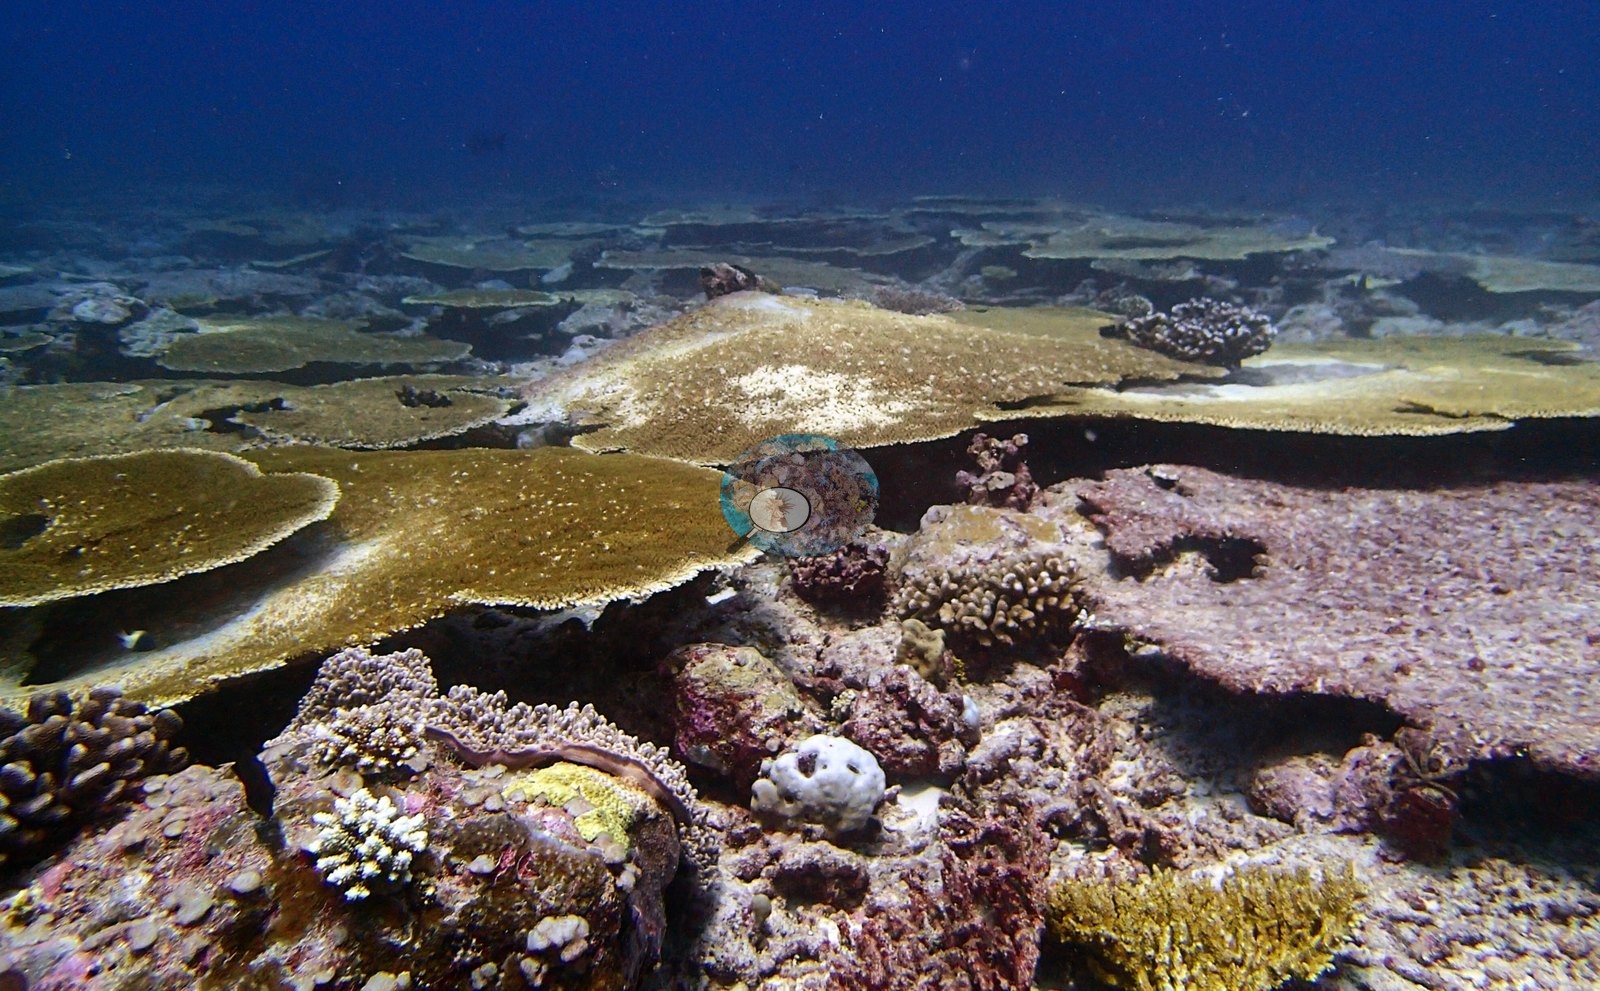
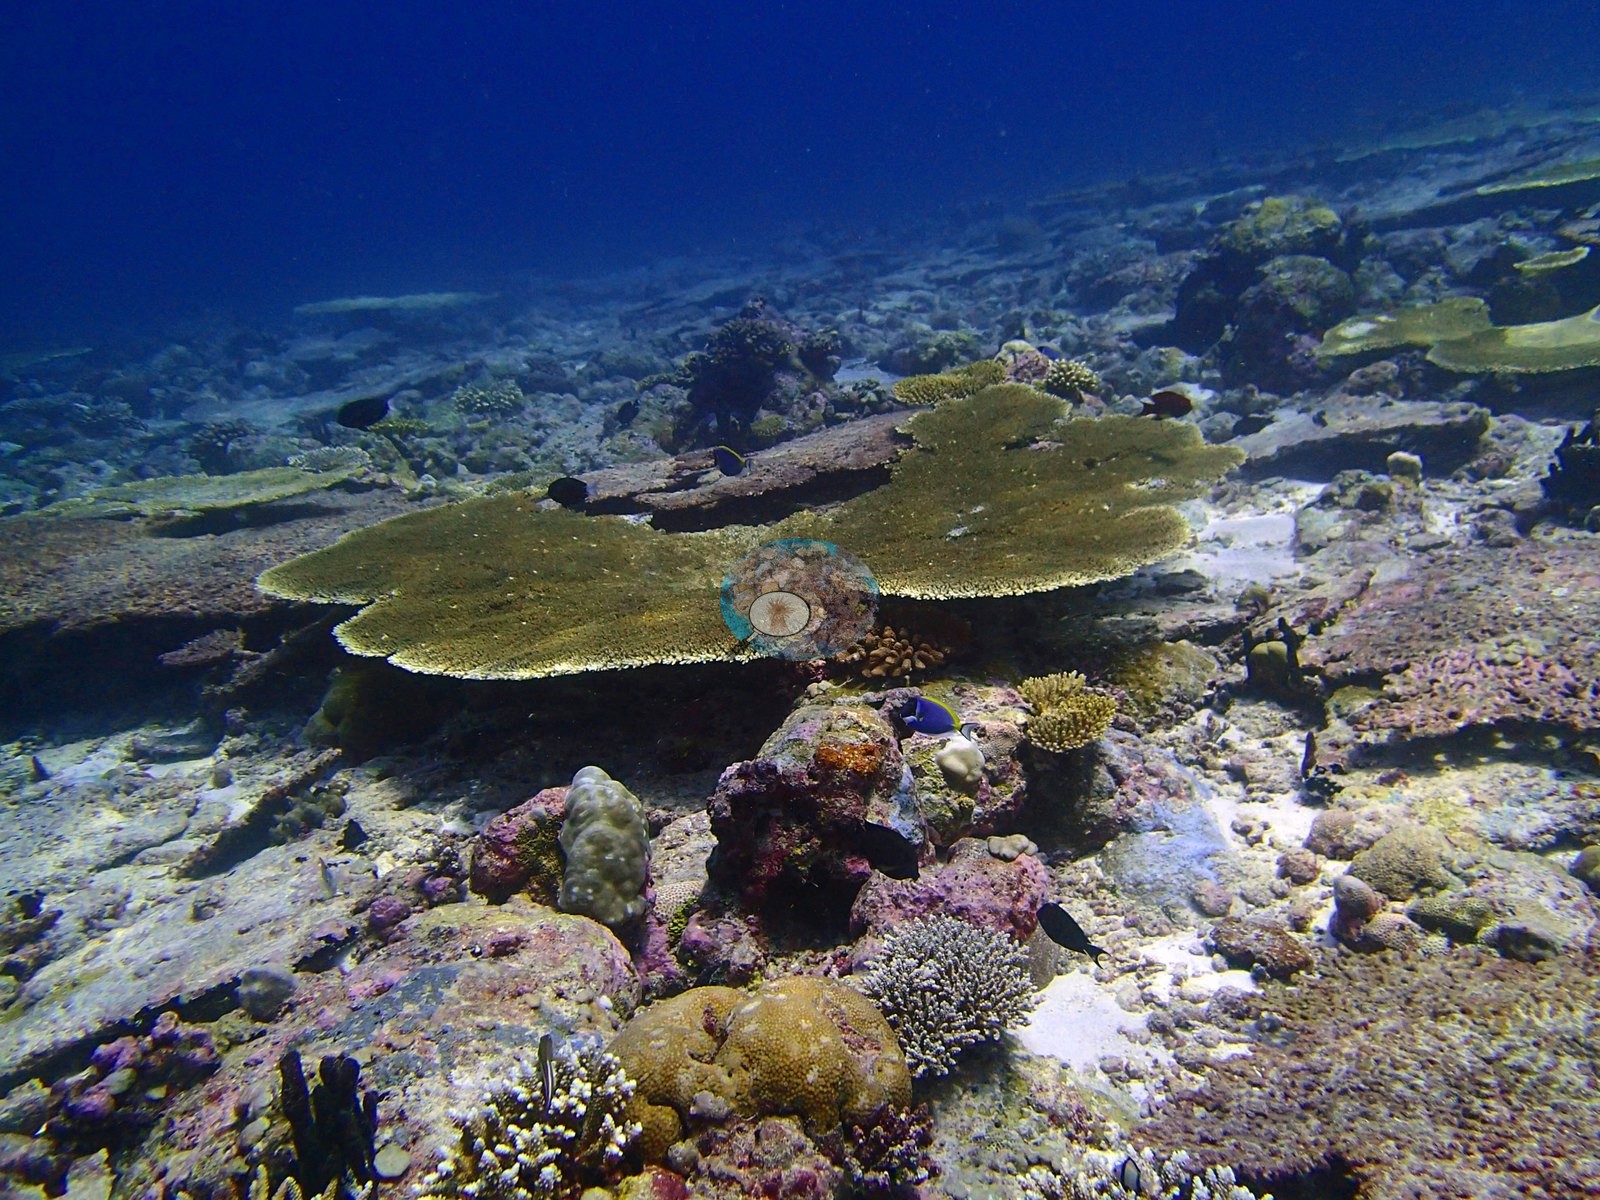
Two frames show the field extending across the frame; a later run of frames demonstrates that the pattern persists along the photographed route; another gives a close view of living table surfaces. Some plates appear thick and old, with irregular margins or localized dead patches; others retain fine radial branch texture and sharply defined edges. The spaces between the tables matter ecologically. Low rubble, consolidated pavement, and patches of brown or greenish growth form the understory, with occasional small branching and massive colonies (e.g., Image 1, Image 3).
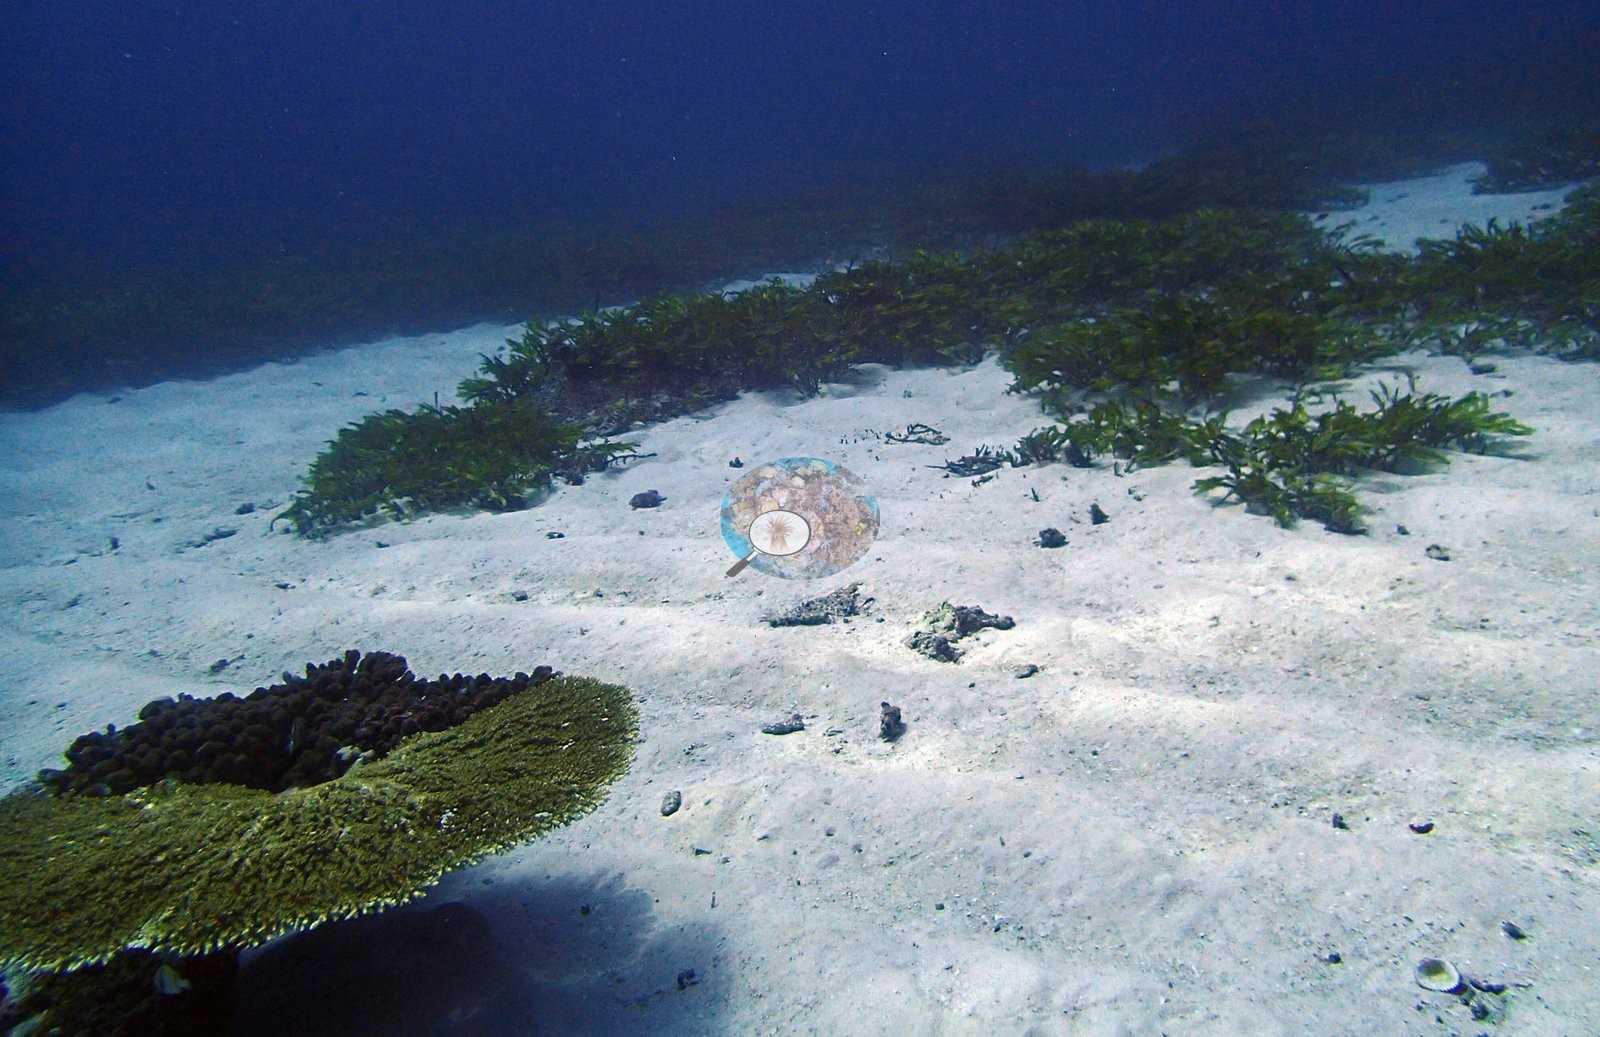
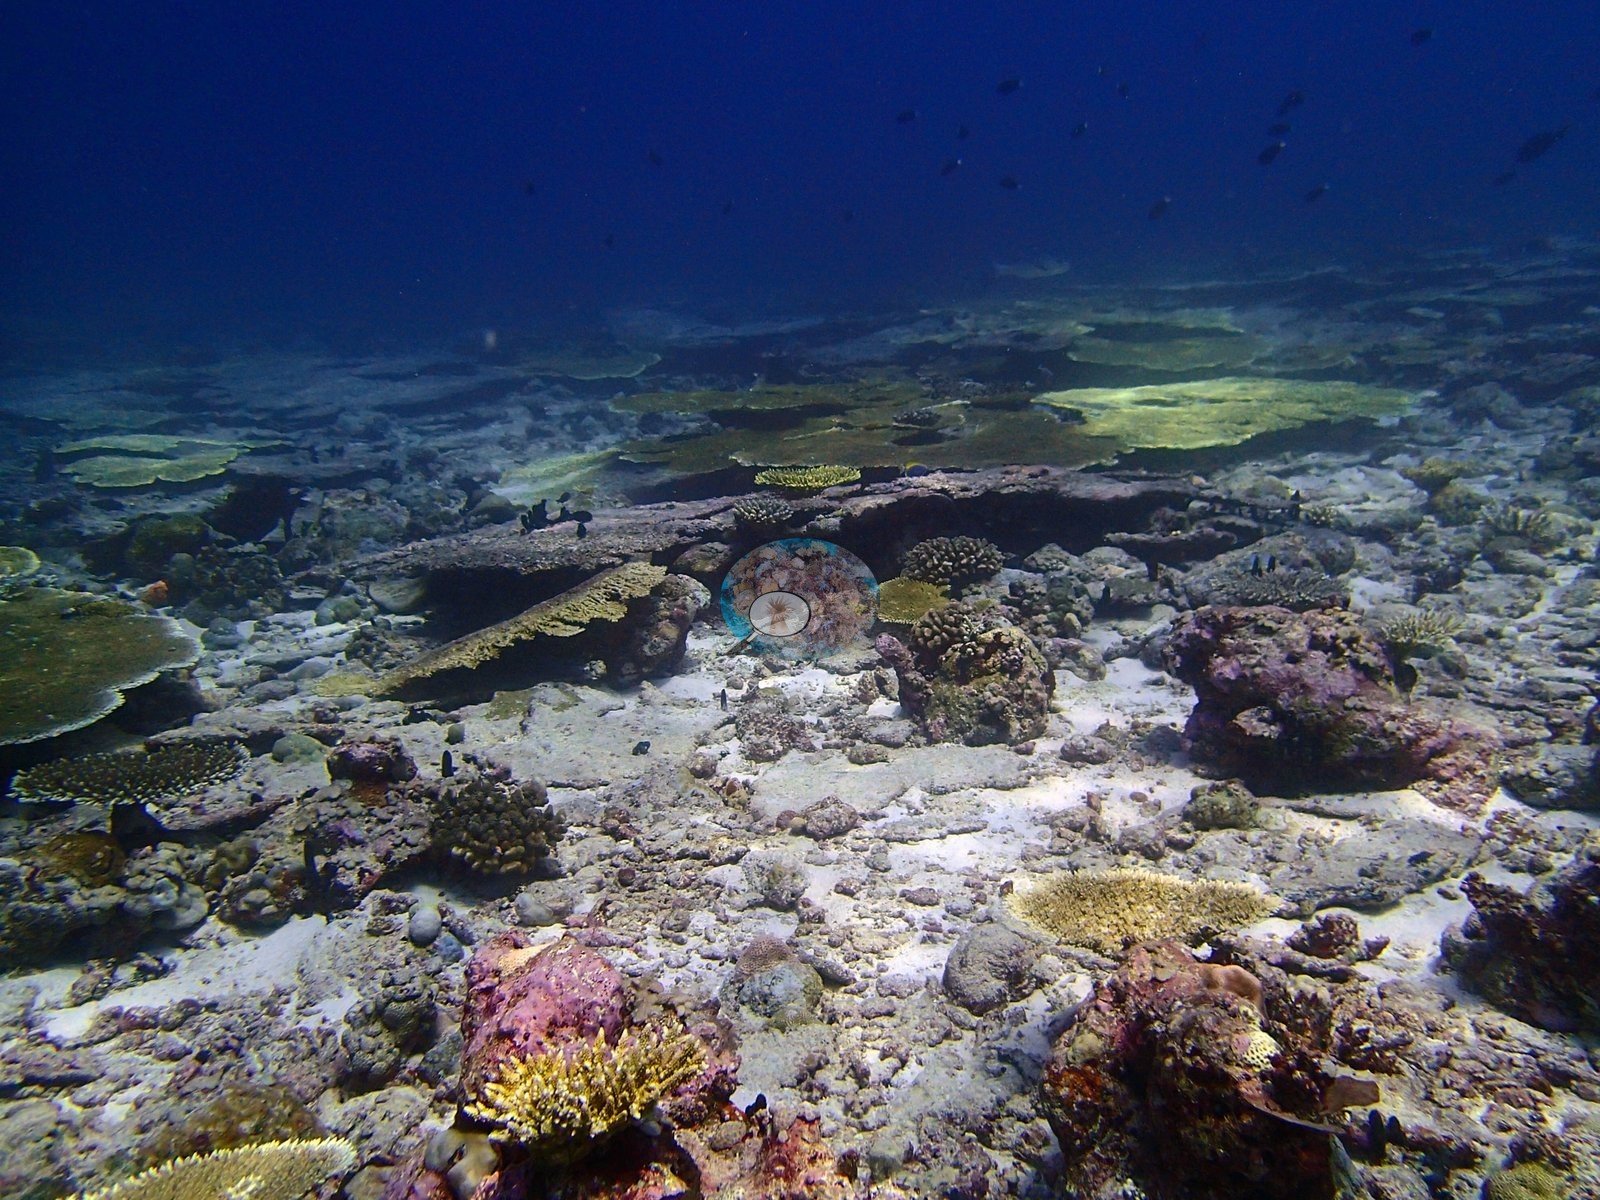
The photographs document an extensive field of overlapping golden-brown tables above low pavement, rubble, and vegetated patches, shaded refuge beneath the plates, and localized bleaching in one pale branching thicket.
Coral cover
Coral cover is 50%, 26th of the 109 Chagos sites, and Acropora alone holds 41.50% of the benthos — 83% of all coral recorded*. Both depth bands are the same reef. D3 carries 54.6% coral with Acropora at 42.40% across 13 genera; D4 carries 45.5% with Acropora at 40.60% across seven. This is the one site here where the site-level mean is a fair summary of both transects. Assemblage composition. Formal surveys give 50.0% coral, 39.4% algae and 2.0% non-coral invertebrates, the coral 83% Acropora in both depth bands.
Stressors
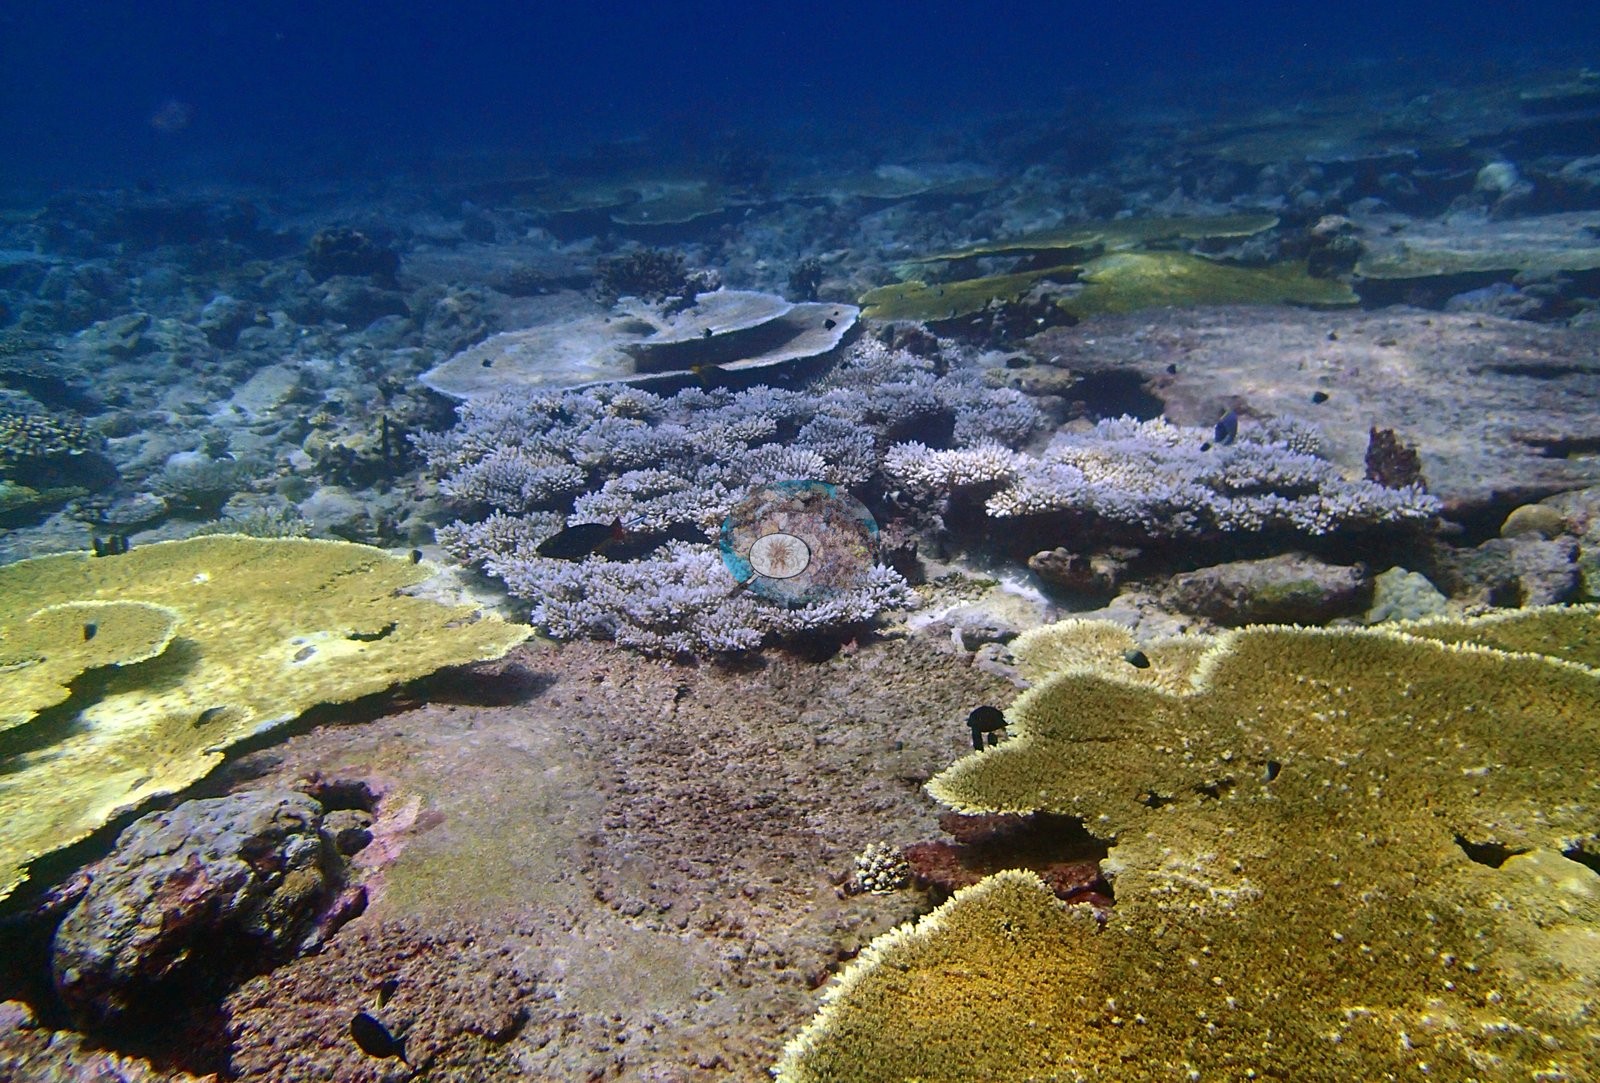
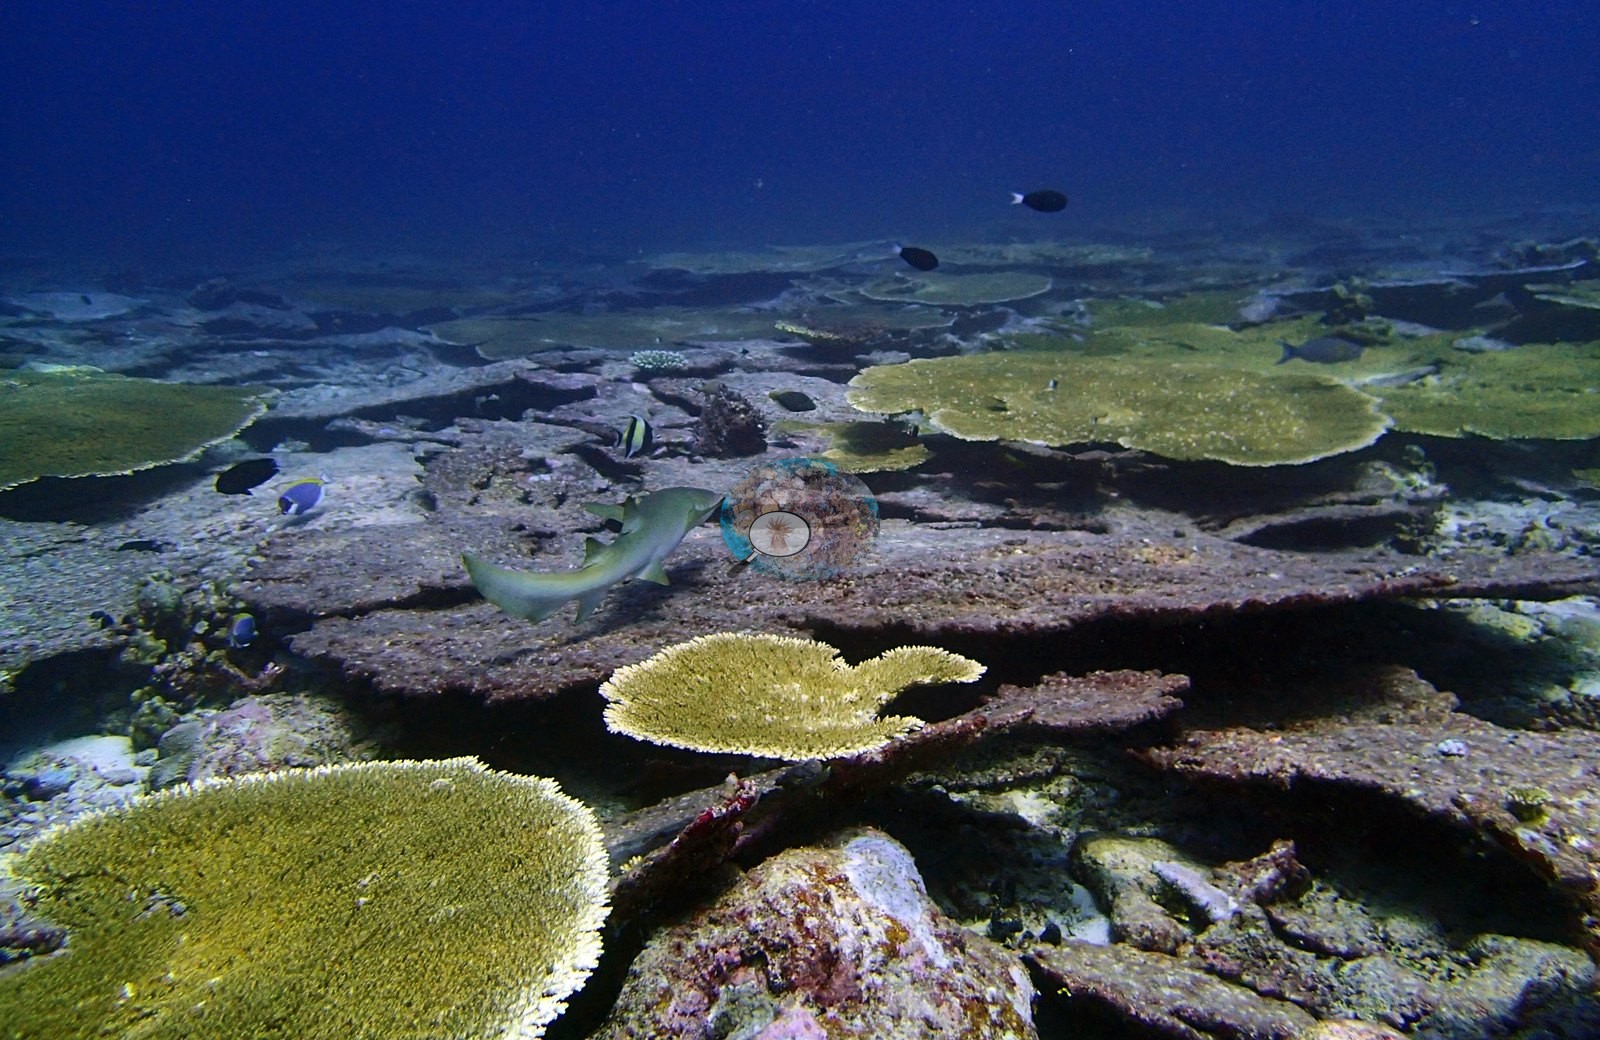
Bleaching is limited compared with the severe Salomon sites but is present, and the published figure of 7.1% ranks 49th of 98 — squarely mid-range. The clearest example is a frame where a compact field of branching colonies is pale lavender to white while surrounding tables retain gold-brown pigmentation; the pale thicket remains structurally intact and the coherent color difference makes bleaching convincing (e.g., Image 4).
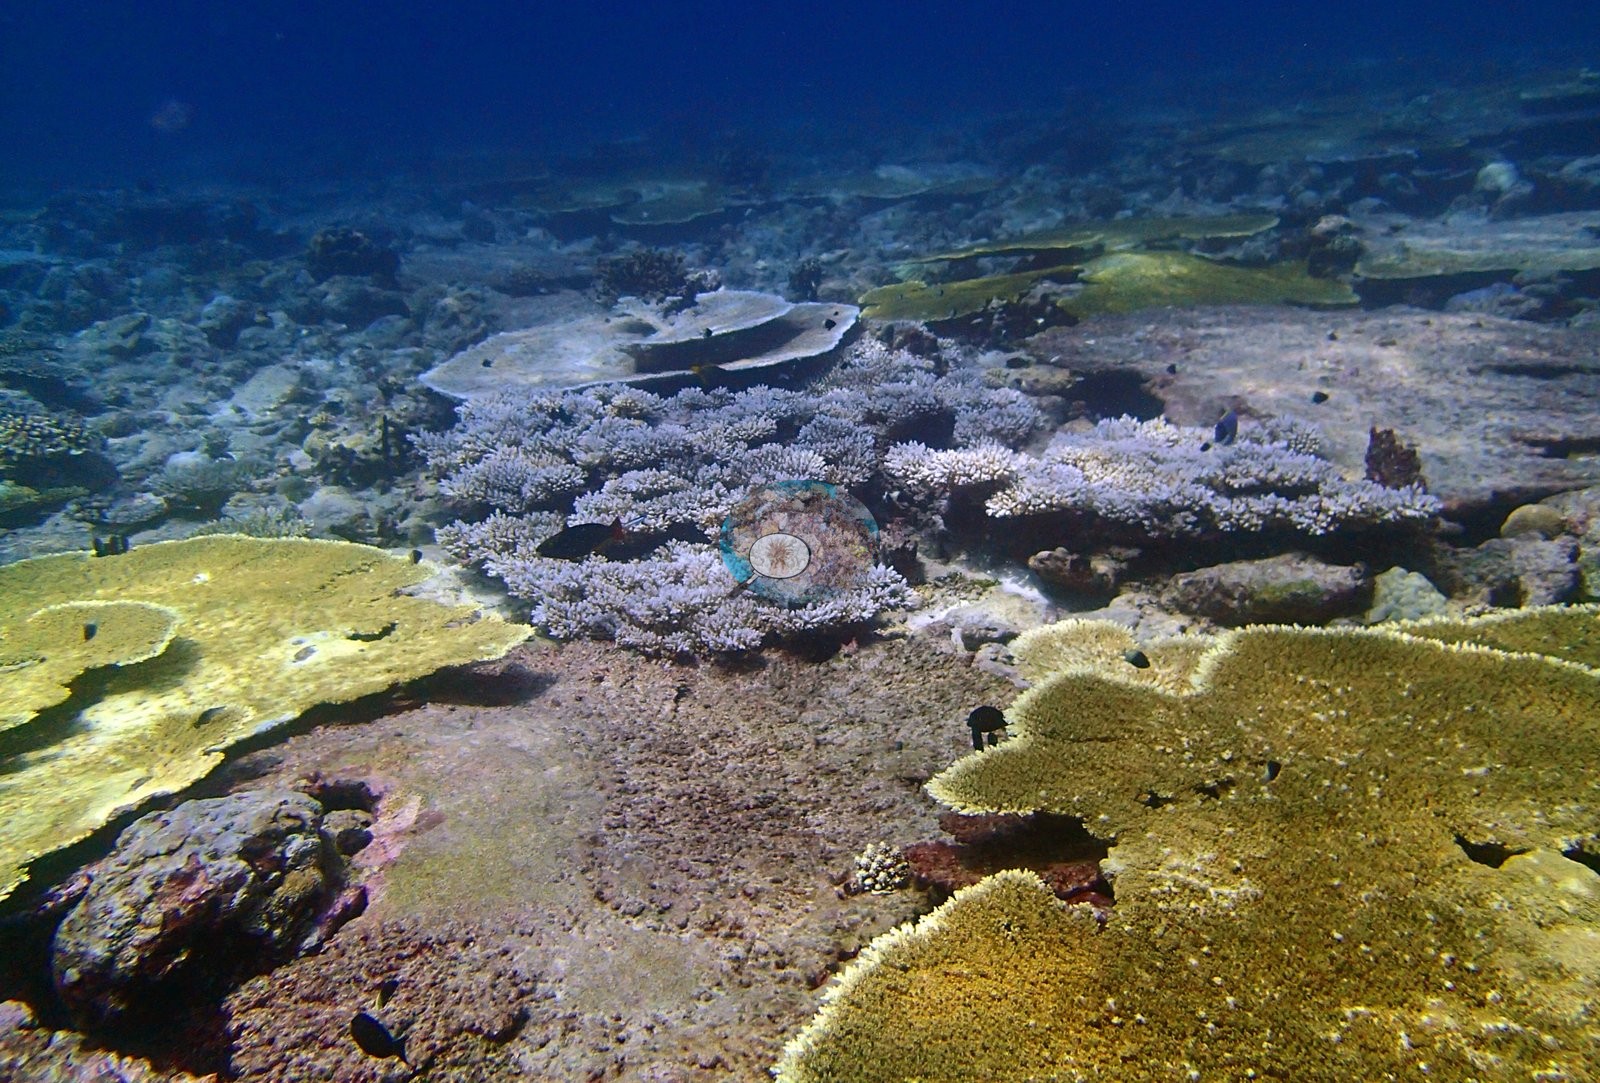
A few white table margins elsewhere could be growth tips, localized tissue loss, or lighting effects and are not individually flagged. Another frame is a close view of a colony with visibly pigmented polyps and is deliberately not treated as a bleaching record — it illustrates why bright skeletal-looking texture alone is insufficient, since the close frame reveals living pigmentation and polyp detail that a distant view would obscure. No crown-of-thorns starfish (COTS) or other corallivores evident.
Fish and other fauna
Several plate surfaces carry small dark fishes while others pass through the shaded gaps, so the table canopy provides habitat at multiple horizontal layers. One frame contains a large gray animal beneath a table; its outline is compatible with a reef shark, ray, or another large fish, but the head, fins, and tail are partly obscured by the plate and the viewing angle, so it is recorded only as a large shark- or ray-like animal sheltering under coral.
Comparisons with other data
No prior survey data from this site. If you would like to share yours, please email us.
CV model comparison
More info
Those are point counts on the photographs; this is a diver swimming a transect. The models and the reference never saw the same thing. ⚠ SITE-LEVEL ONLY. The 2,500 frames were not associated with any transect taken within 200 m of them, so transect-vs-image comparisons are site means, never frames. The transect value is already in the pin `cover` field (109 of 112 pins, sourced to the paper's suppl. S1) and is read from there, never re-imported. The transect is THE coral-cover value for this site and stands alone. The rows below it are a methods comparison only: no computer-vision value is averaged with it, feeds the headline, or carries over to the site's cover figure (Anderson, 2026-09-22).| Method | Hard-coral cover (%) |
|---|---|
| Transect (published) | 50.0 |
| CoralNet | 39.1 |
| In-house DINOv3 | 32.1 |
| CoralSCOP edited | 32.6 |
| Claude | 23.0 |
Data & links
- Read the full site report ↗
- Download benthic survey data (CSV) ↗
- Download all LOF-GRE data (933 sites) ↗
- CoralNet image repository for this region ↗
- Photo portfolio ↗
- Coral Reef Diagnostics page for this area ↗
All images from Coral Reef Diagnostics. Data are from Coral Reef Diagnostics.
 © Coral Reef Diagnostics.