
Part of the regional summaries: Chagos Archipelago - Salomon / Blenheim / Speakers Bank and Chagos Archipelago
More info
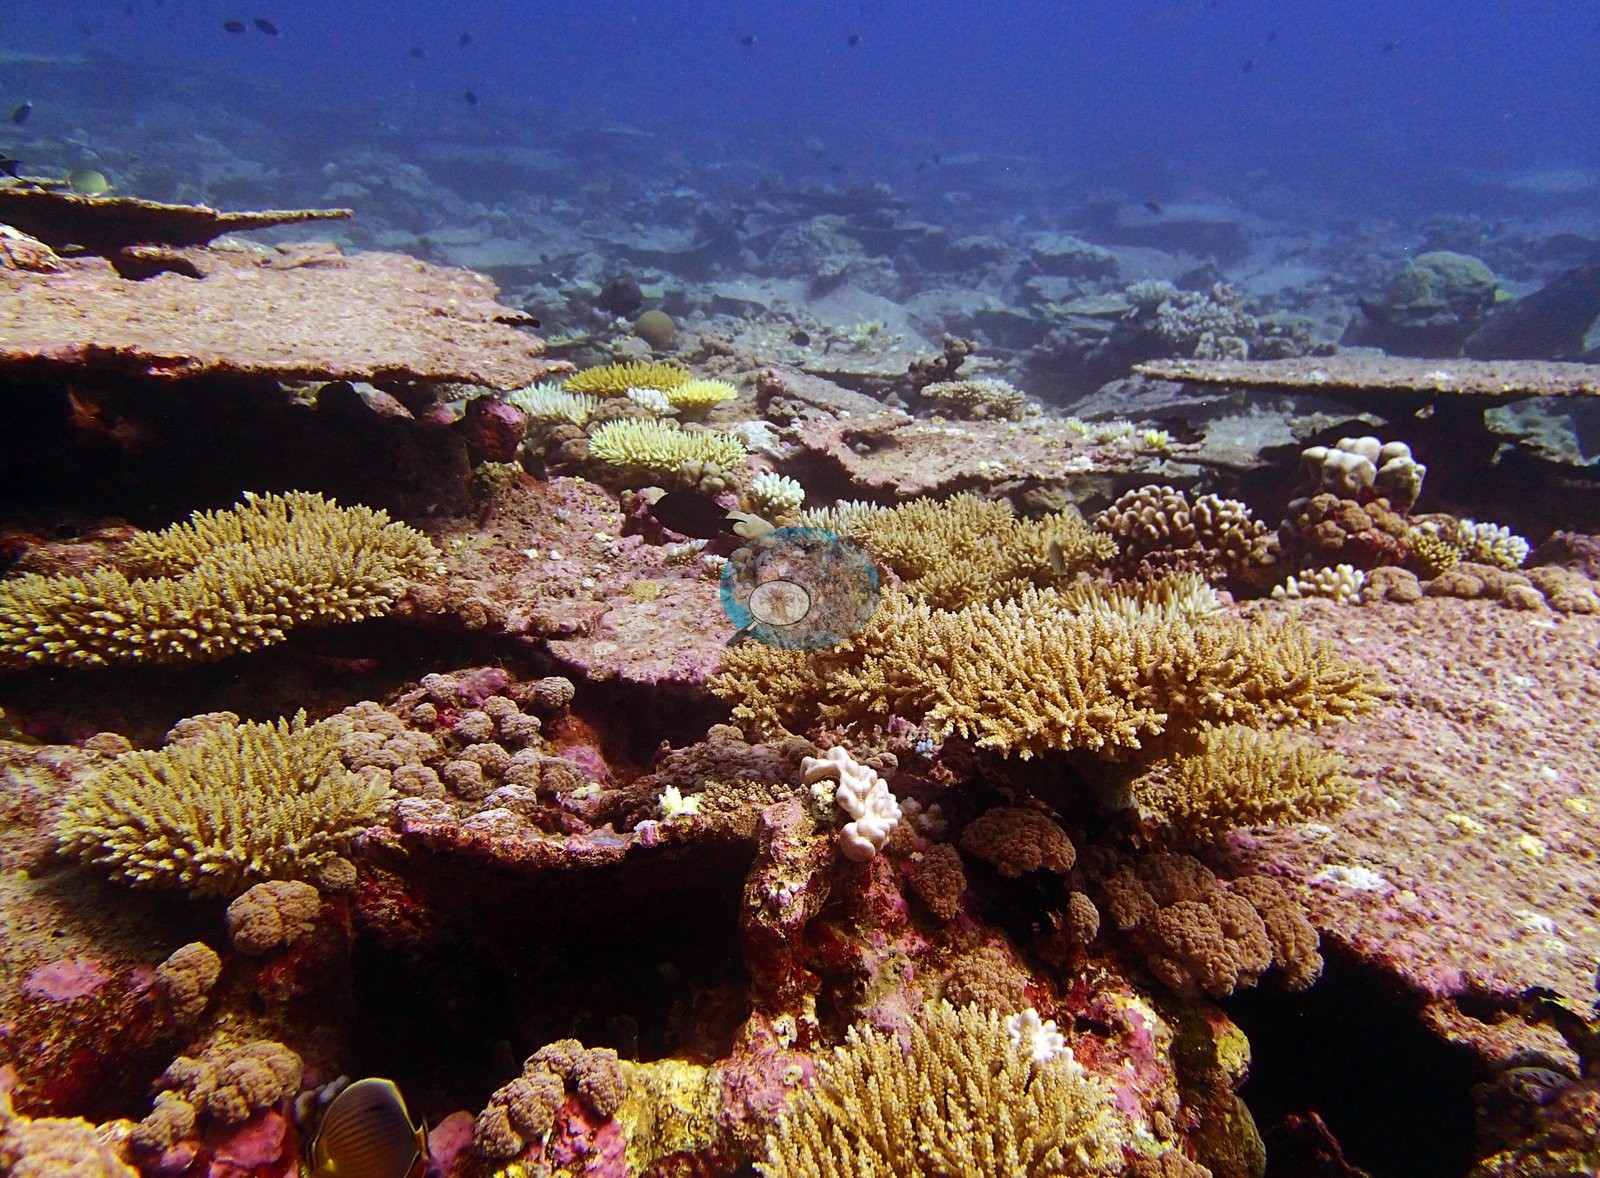
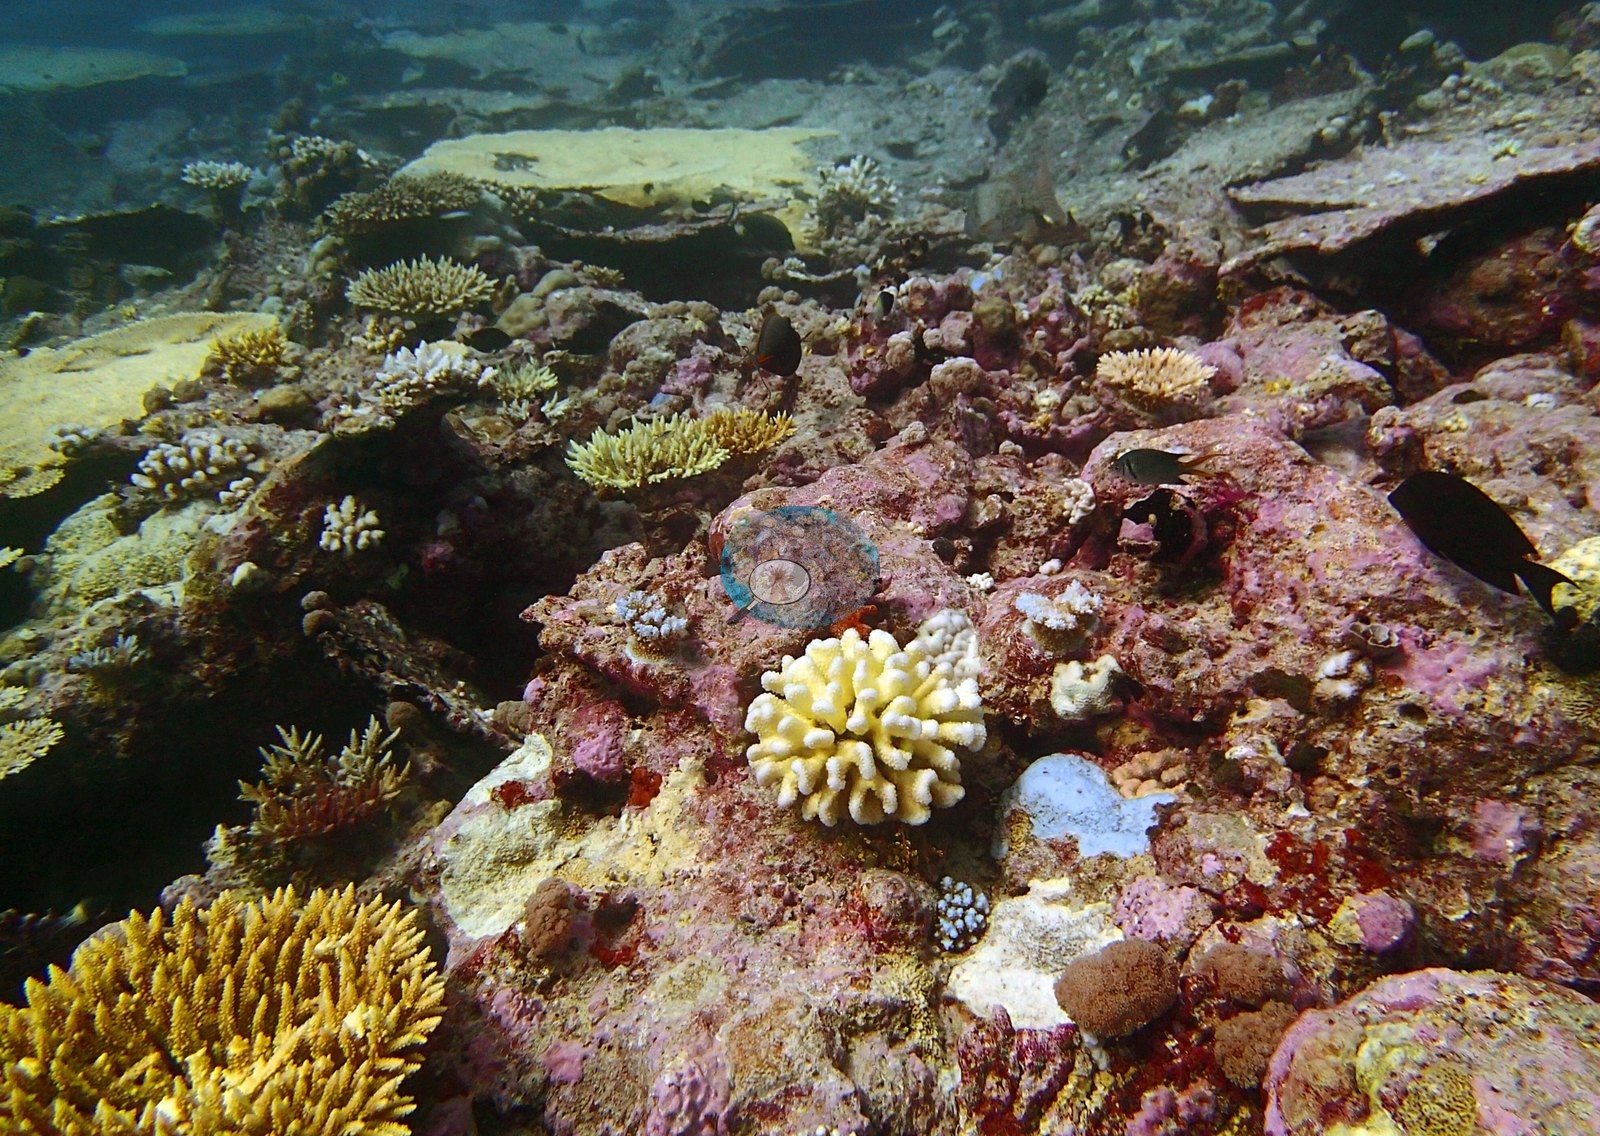
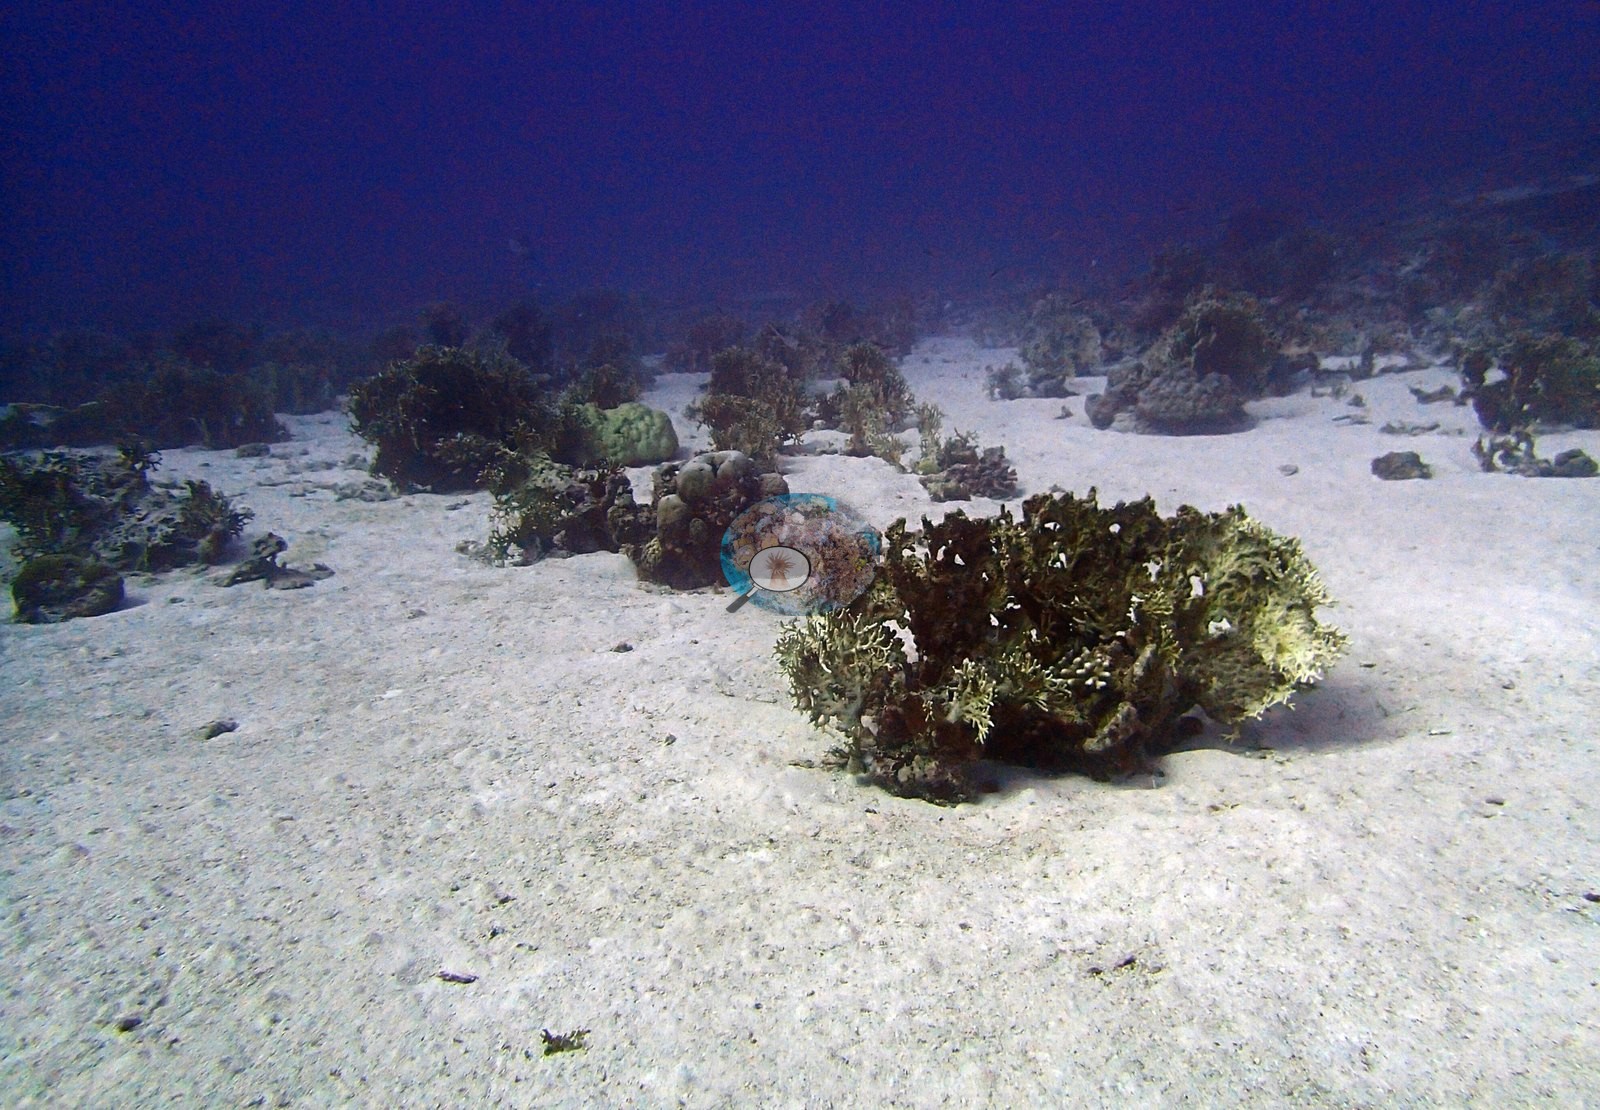
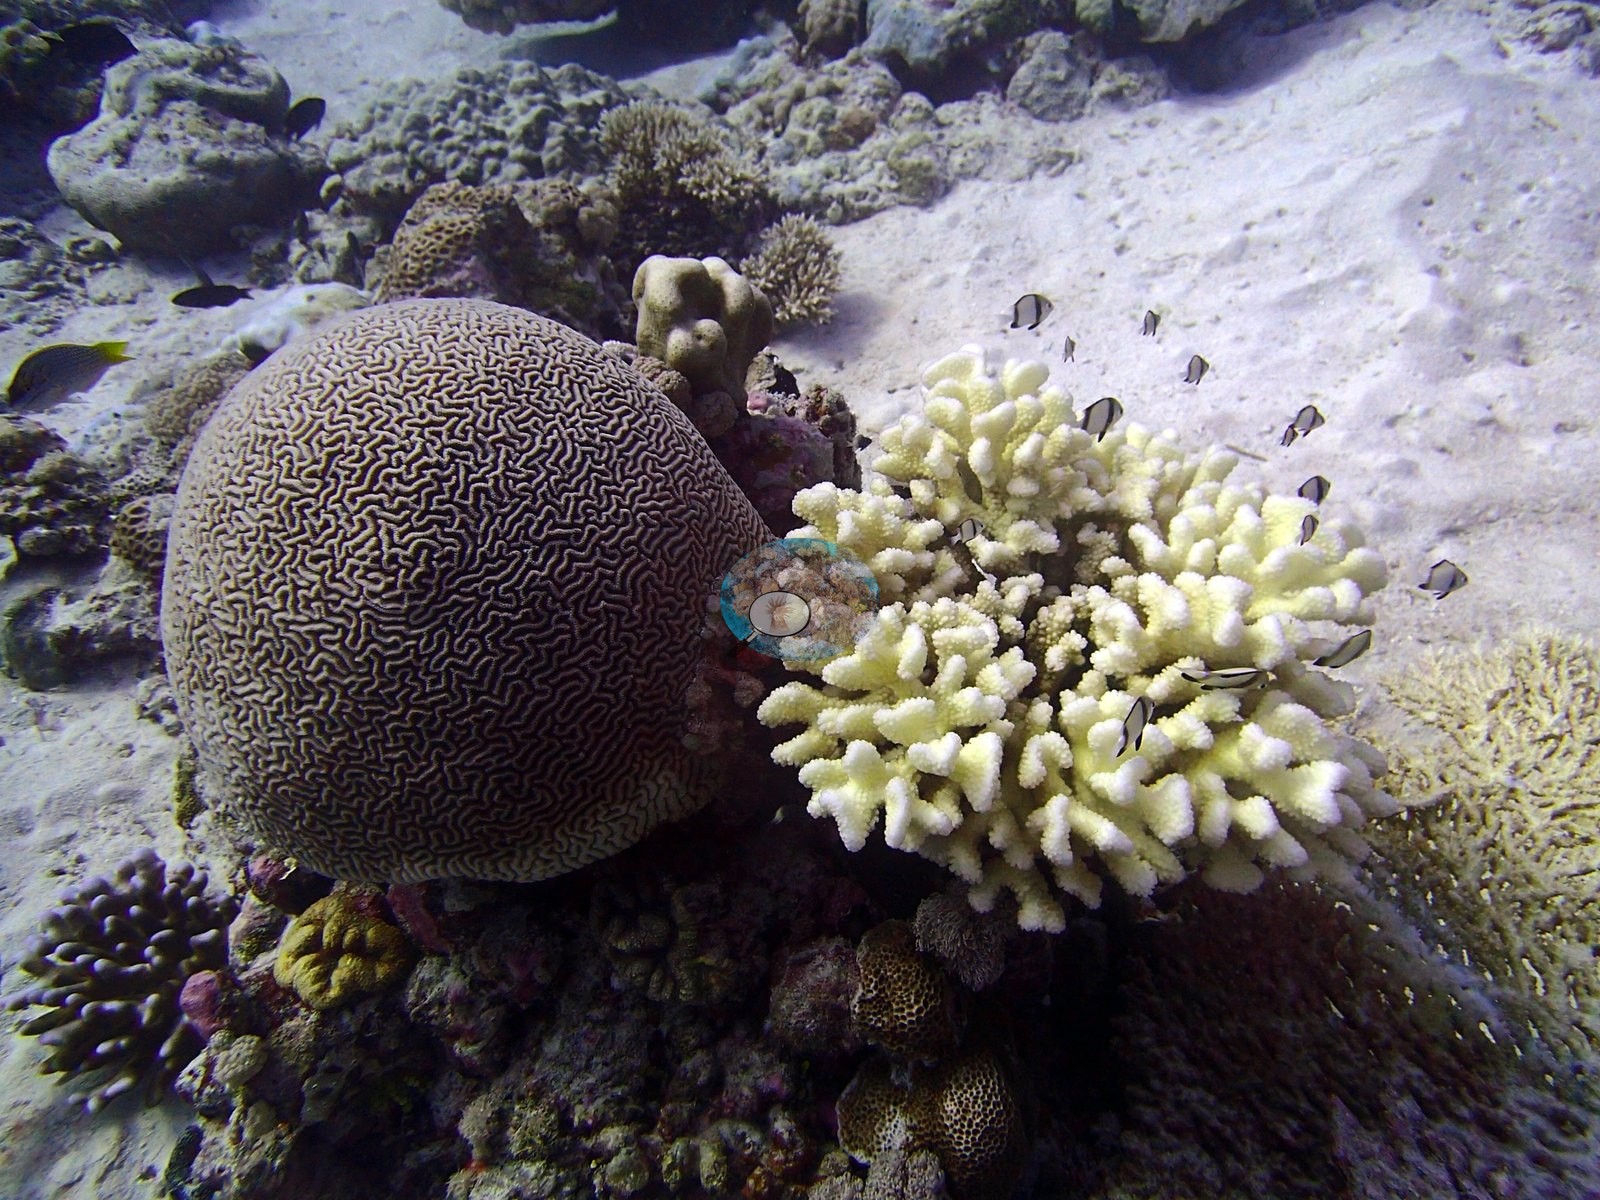
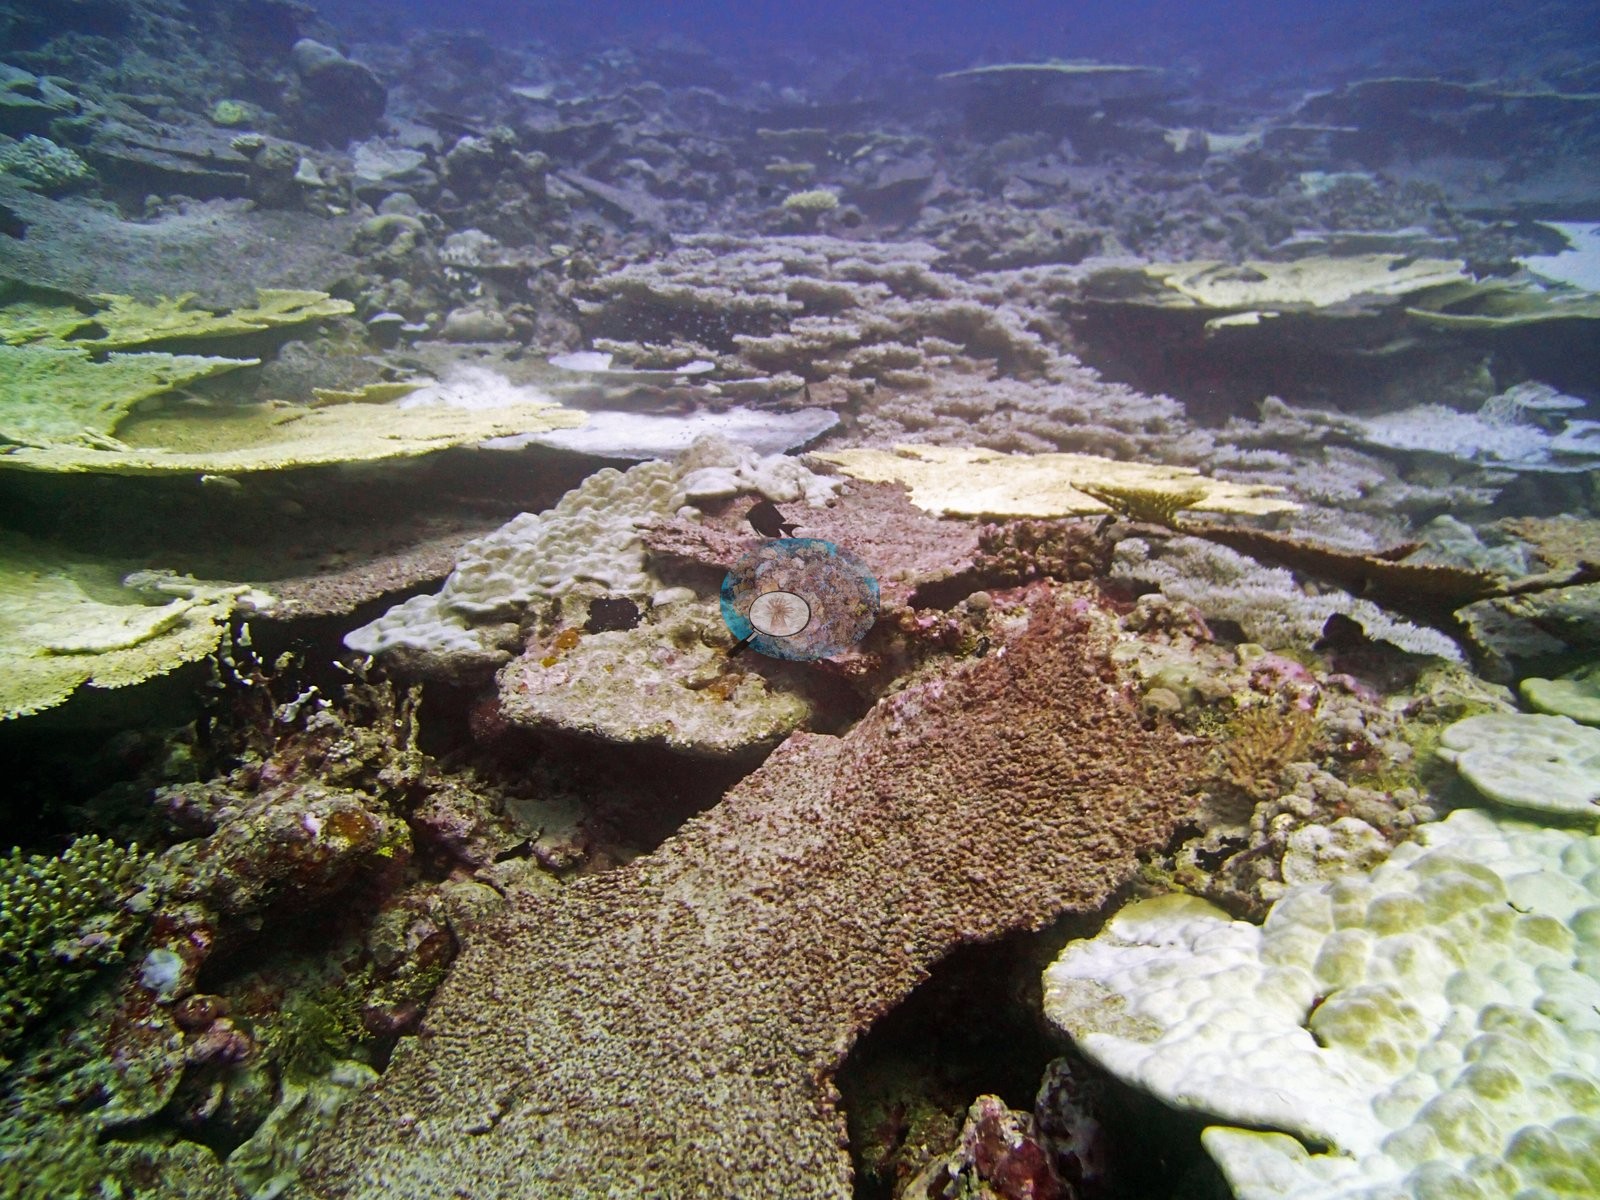
Chagos (NOAA CRW virtual station)A windward forereef outside Salomon atoll at 30 m with 49% coral cover, dominated by Acropora tables and branching colonies with Porites taking over at depth. It carries the highest bleaching value in the published Chagos table (34%), and photos show uniformly white branching colonies beside pigmented neighbors. Surveyed on the Living Oceans Foundation's Global Reef Expedition.
Nine independent survey stations shown with the program’s logo — click one to see how far it is from this site.
Seven other CRD dive sites within 5 km shown in orange — click a marker to open its page.
🗺 Detailed map of the Global Reef Expedition dive sites, Salomon Atoll, Chagos (Khaled bin Sultan Living Oceans Foundation; opens in a new window)
4 of these 10 photographs are shown beside the text that discusses them under "Site description" below.
Site description
Setting
BISA84 is a windward emergent fringing forereef outside Salomon atoll, surveyed 22 April 2015 at 30.0 m.
General benthic features
The assemblage is unusually concentrated, with Acropora (50% of all coral present) and Porites (25%) holding three-quarters of it between them across 25 genera.
Coral cover
Formal transects recorded 49% coral cover against 41.0% algae, 28th of 109 Chagos sites for cover — but the defining number is its bleaching: 34.0%, the highest value in the published Mean(%bleaching) column. Coral cover nearly doubles from the shallowest transect to mid-depth, where Acropora alone accounts for 70% of the coral, before Porites takes the lead at the deepest station. Image-based methods read this reef 32–38 points lower than the transects (CoralNet 11.0%, Coralscapes 16.7%); the three are not interchangeable and should not be averaged (see the full report).
Stressors
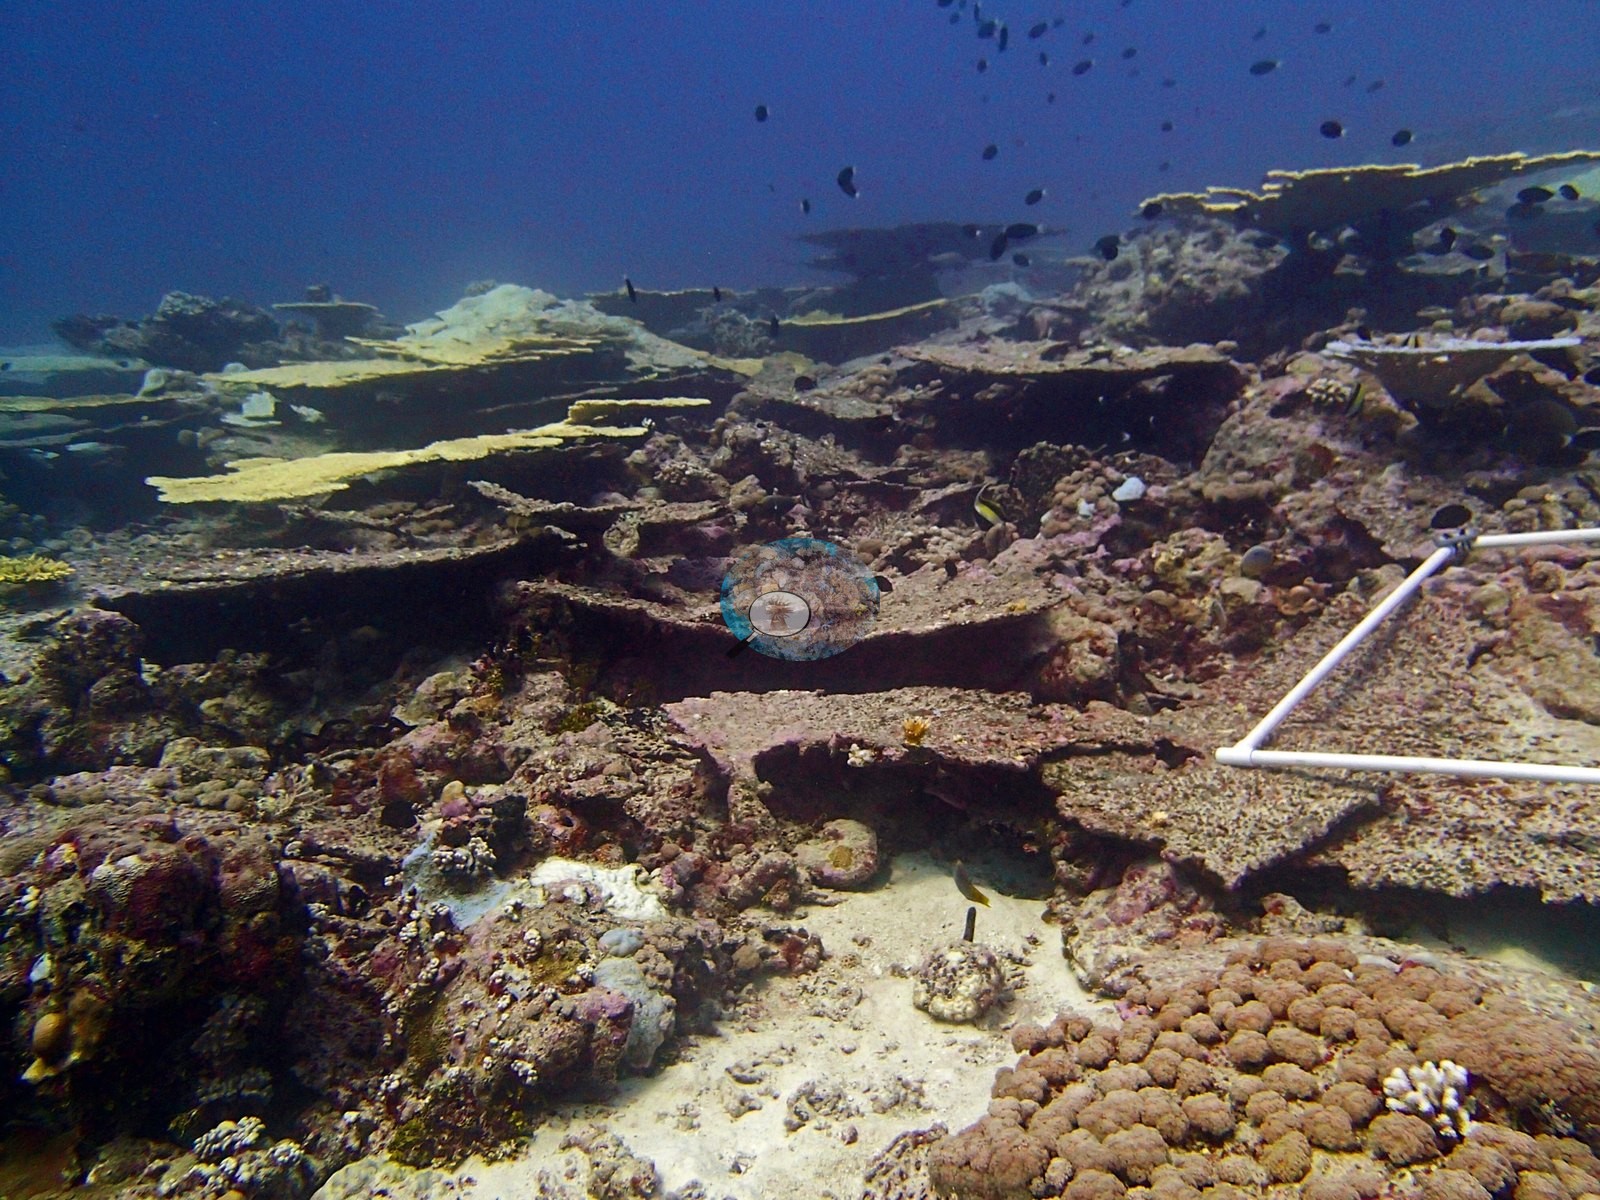
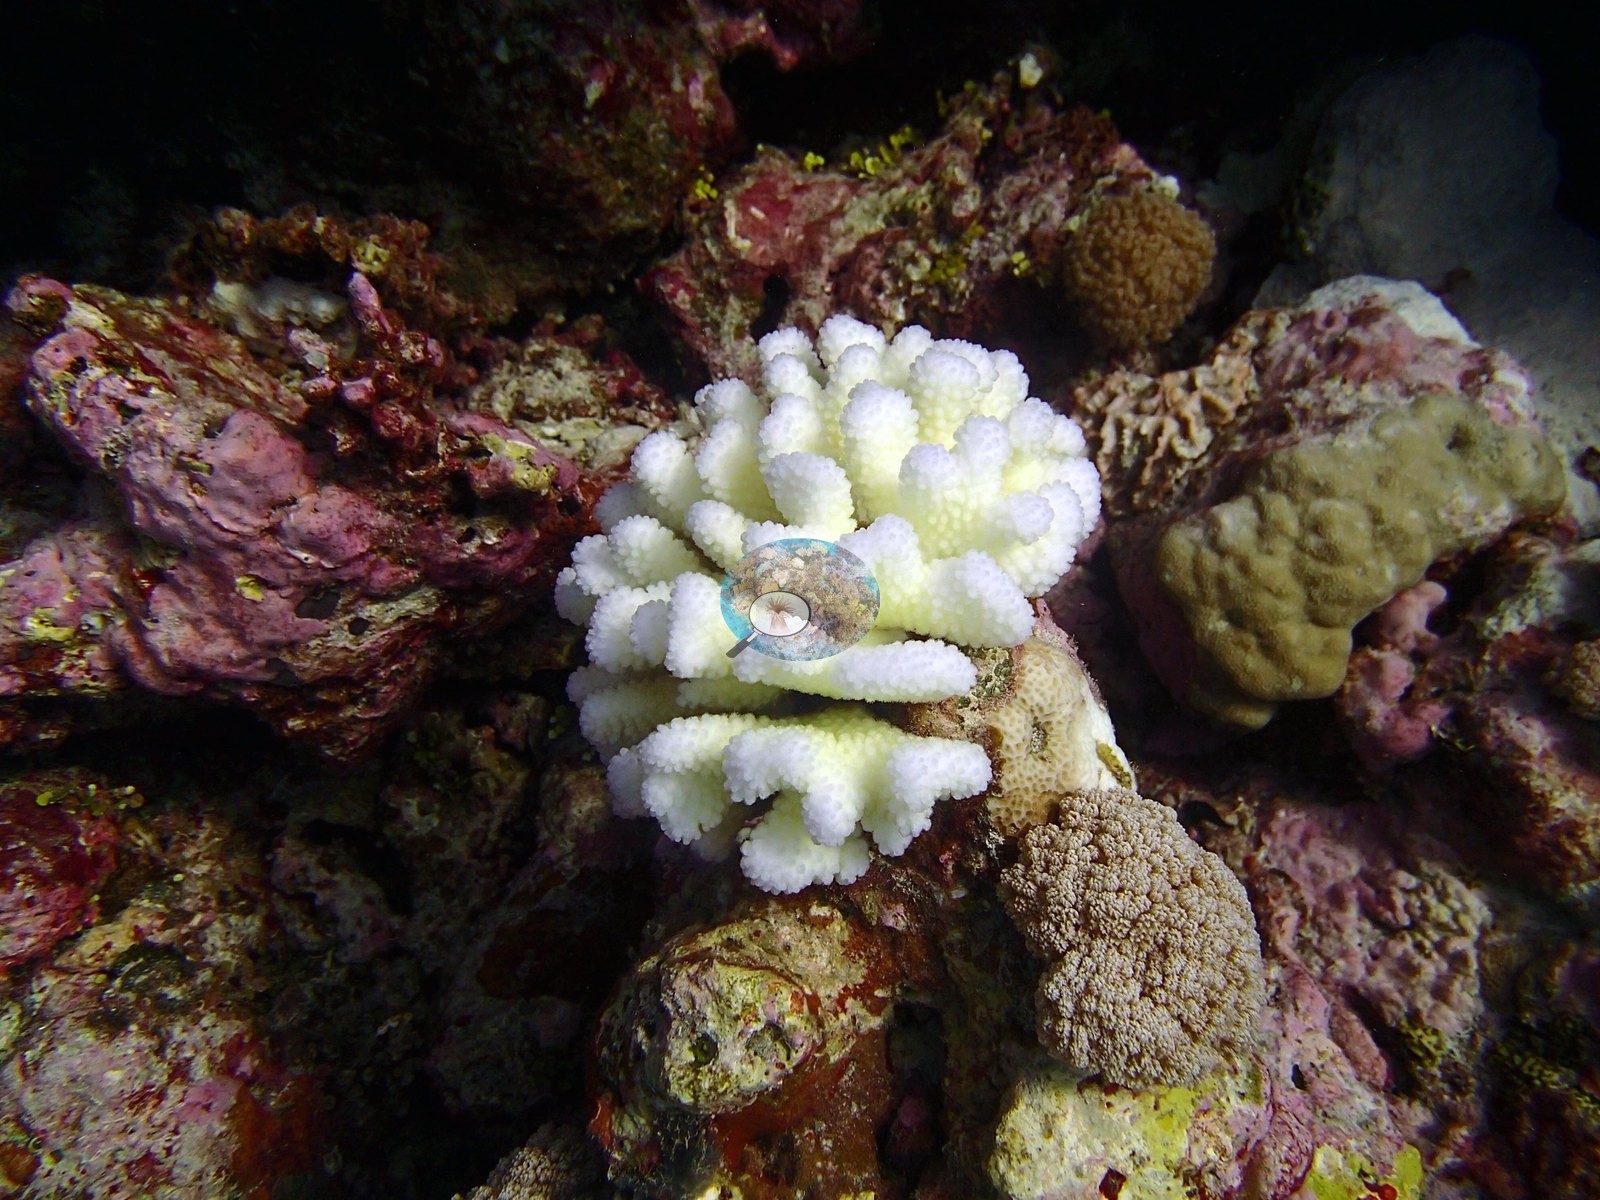
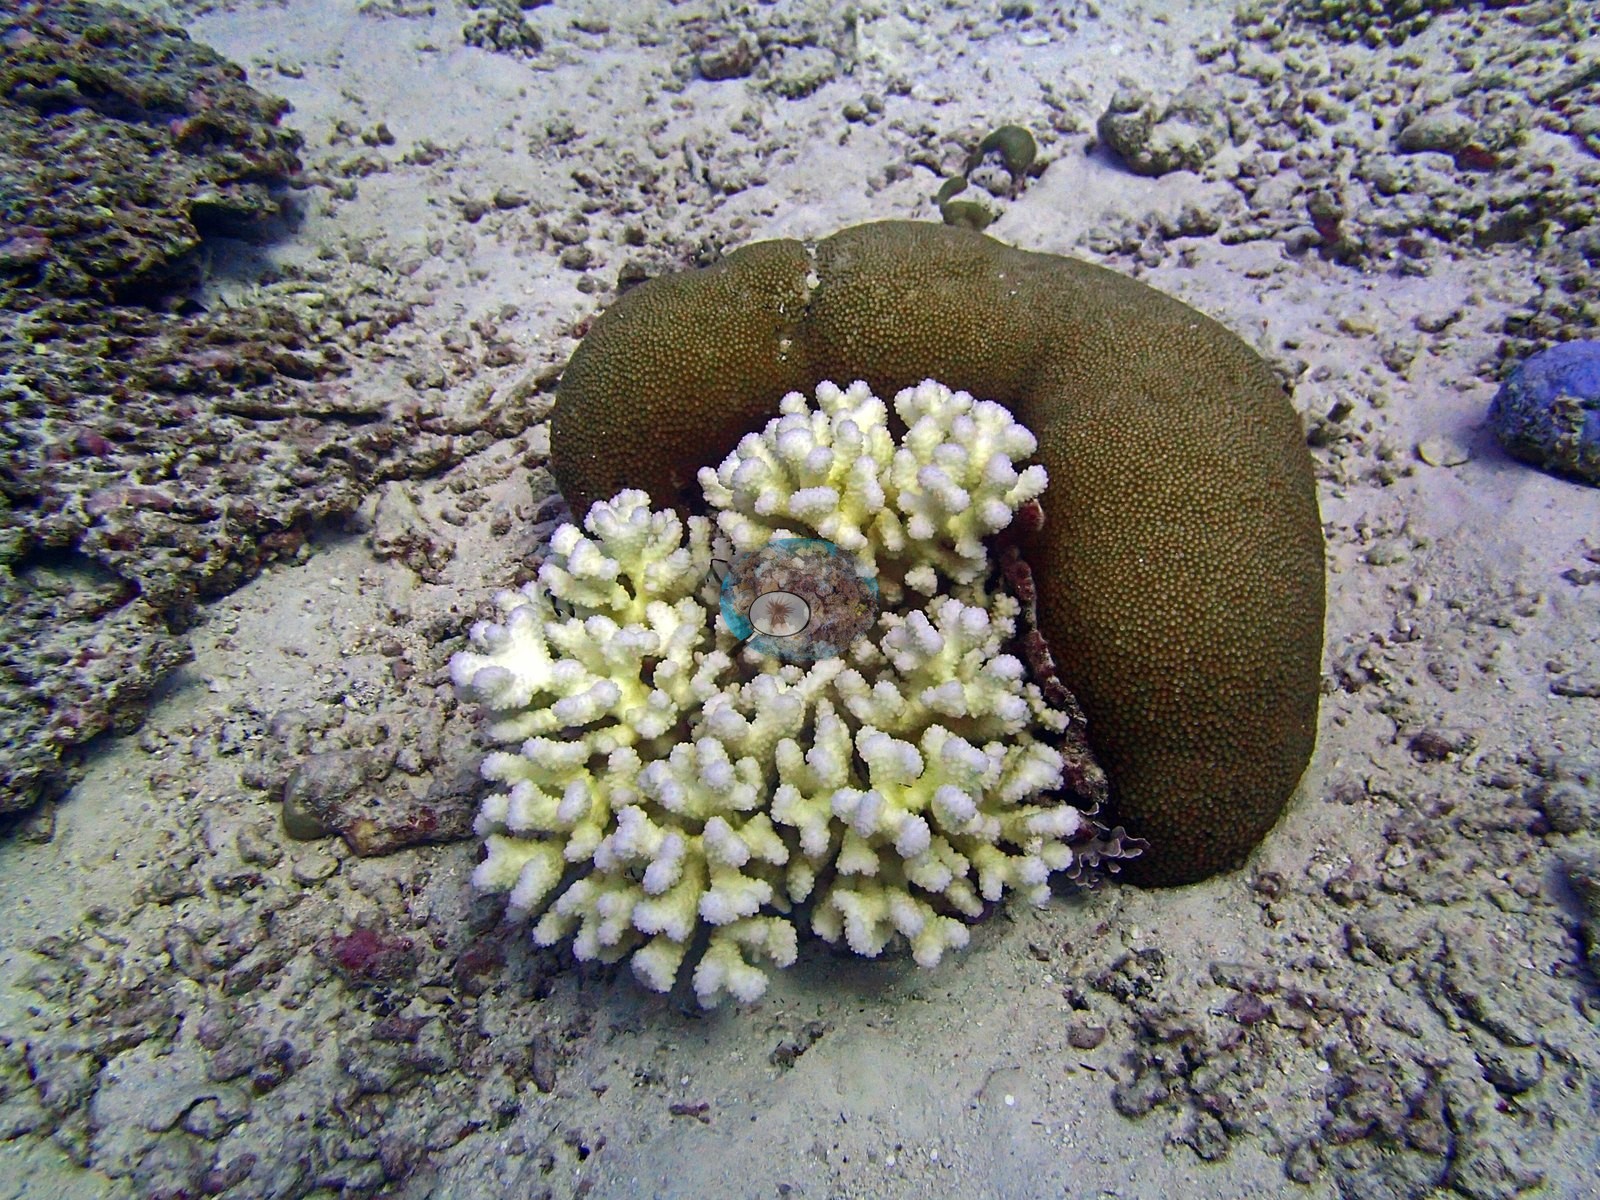
That column equals the first of two CoralNet training runs; under the second run BIPB112 reaches 38.2% and this site ranks 4th, so the "most bleached" claim depends on which column you read. The photographs corroborate the bleaching directly — uniformly white branching colonies against pigmented neighbors in several frames — over a table- and branch-dominated reef with local sand-and-rubble breaks (e.g., Image 1, Image 2, Image 3, Image 4).
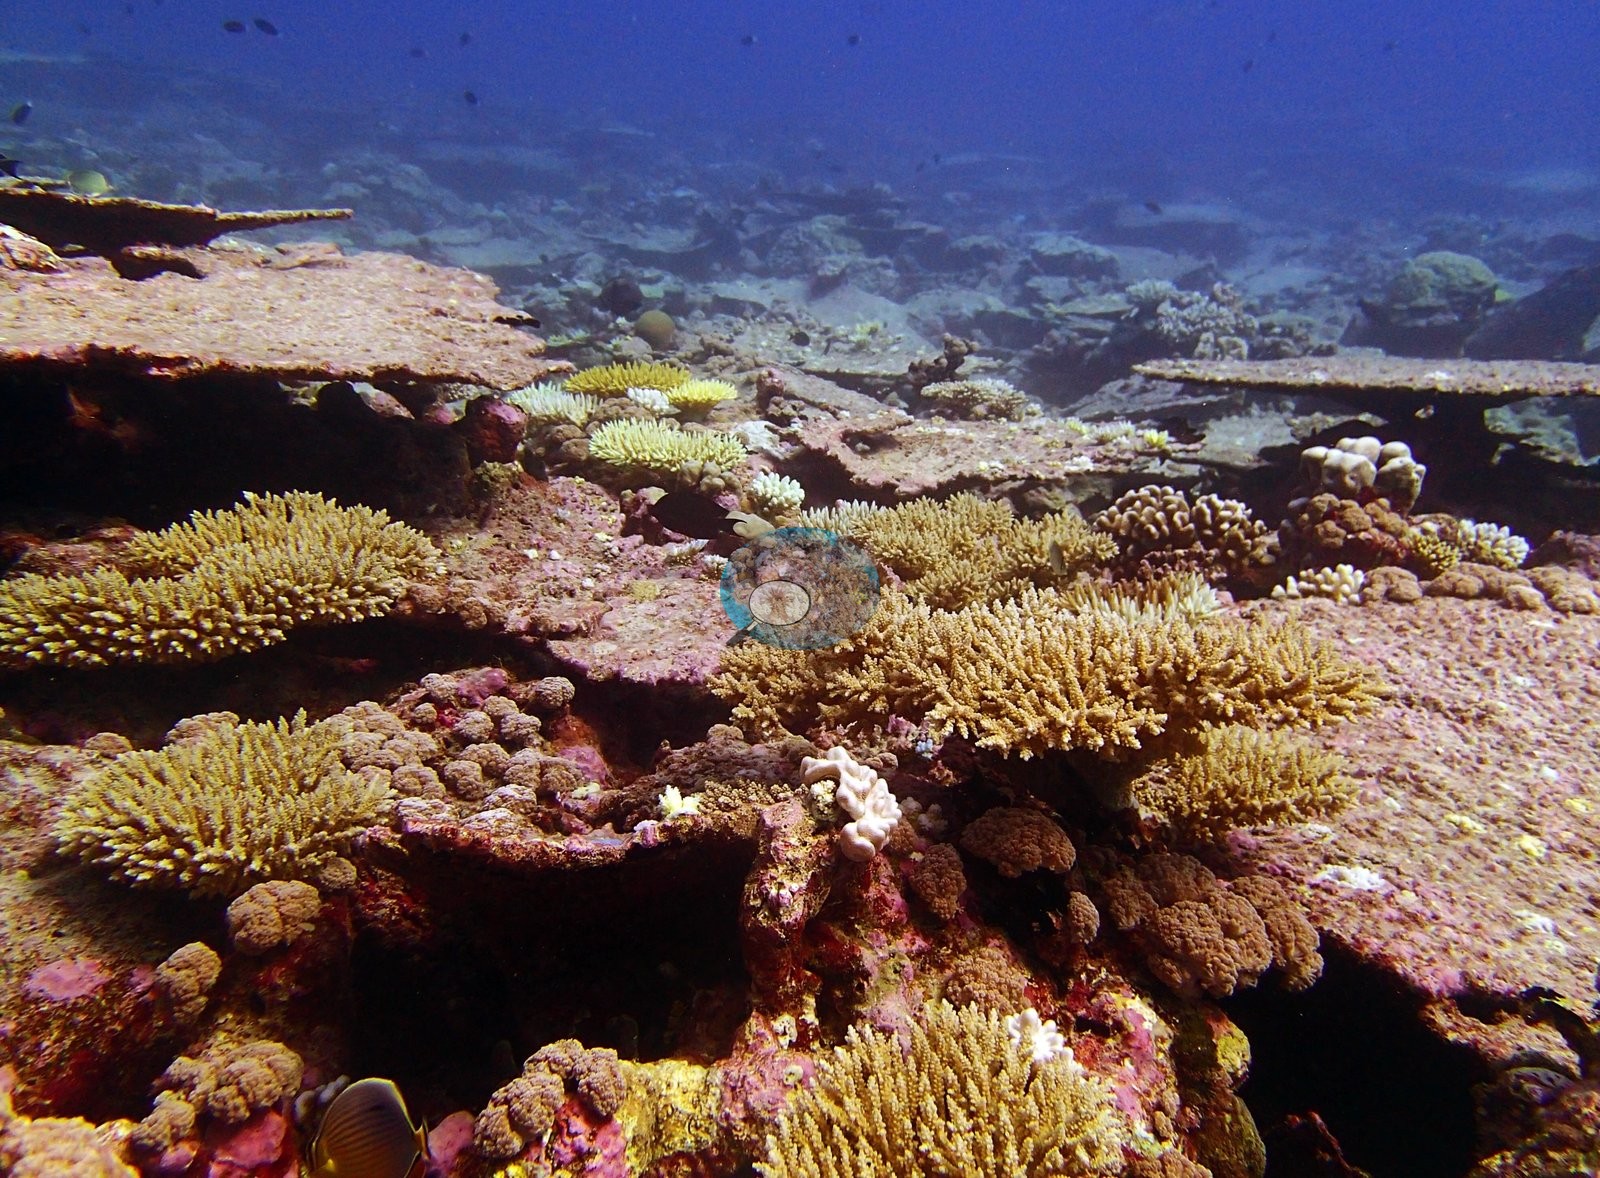
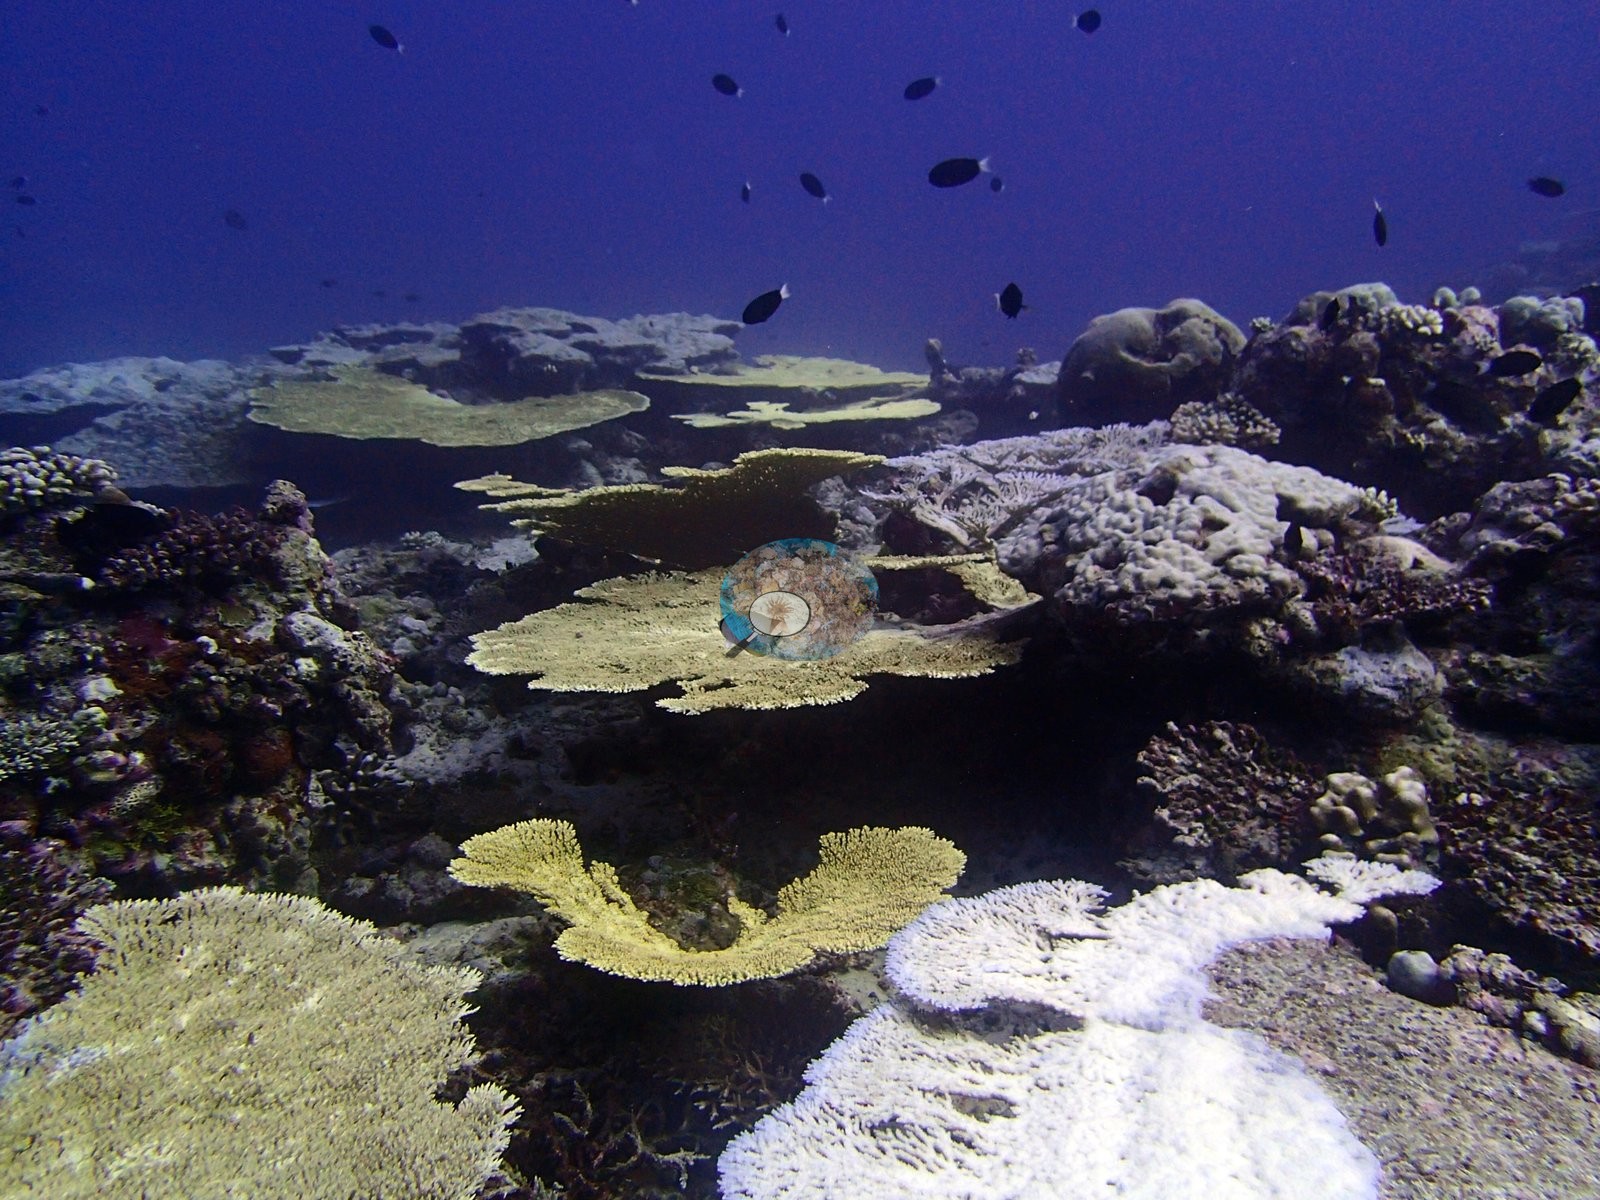
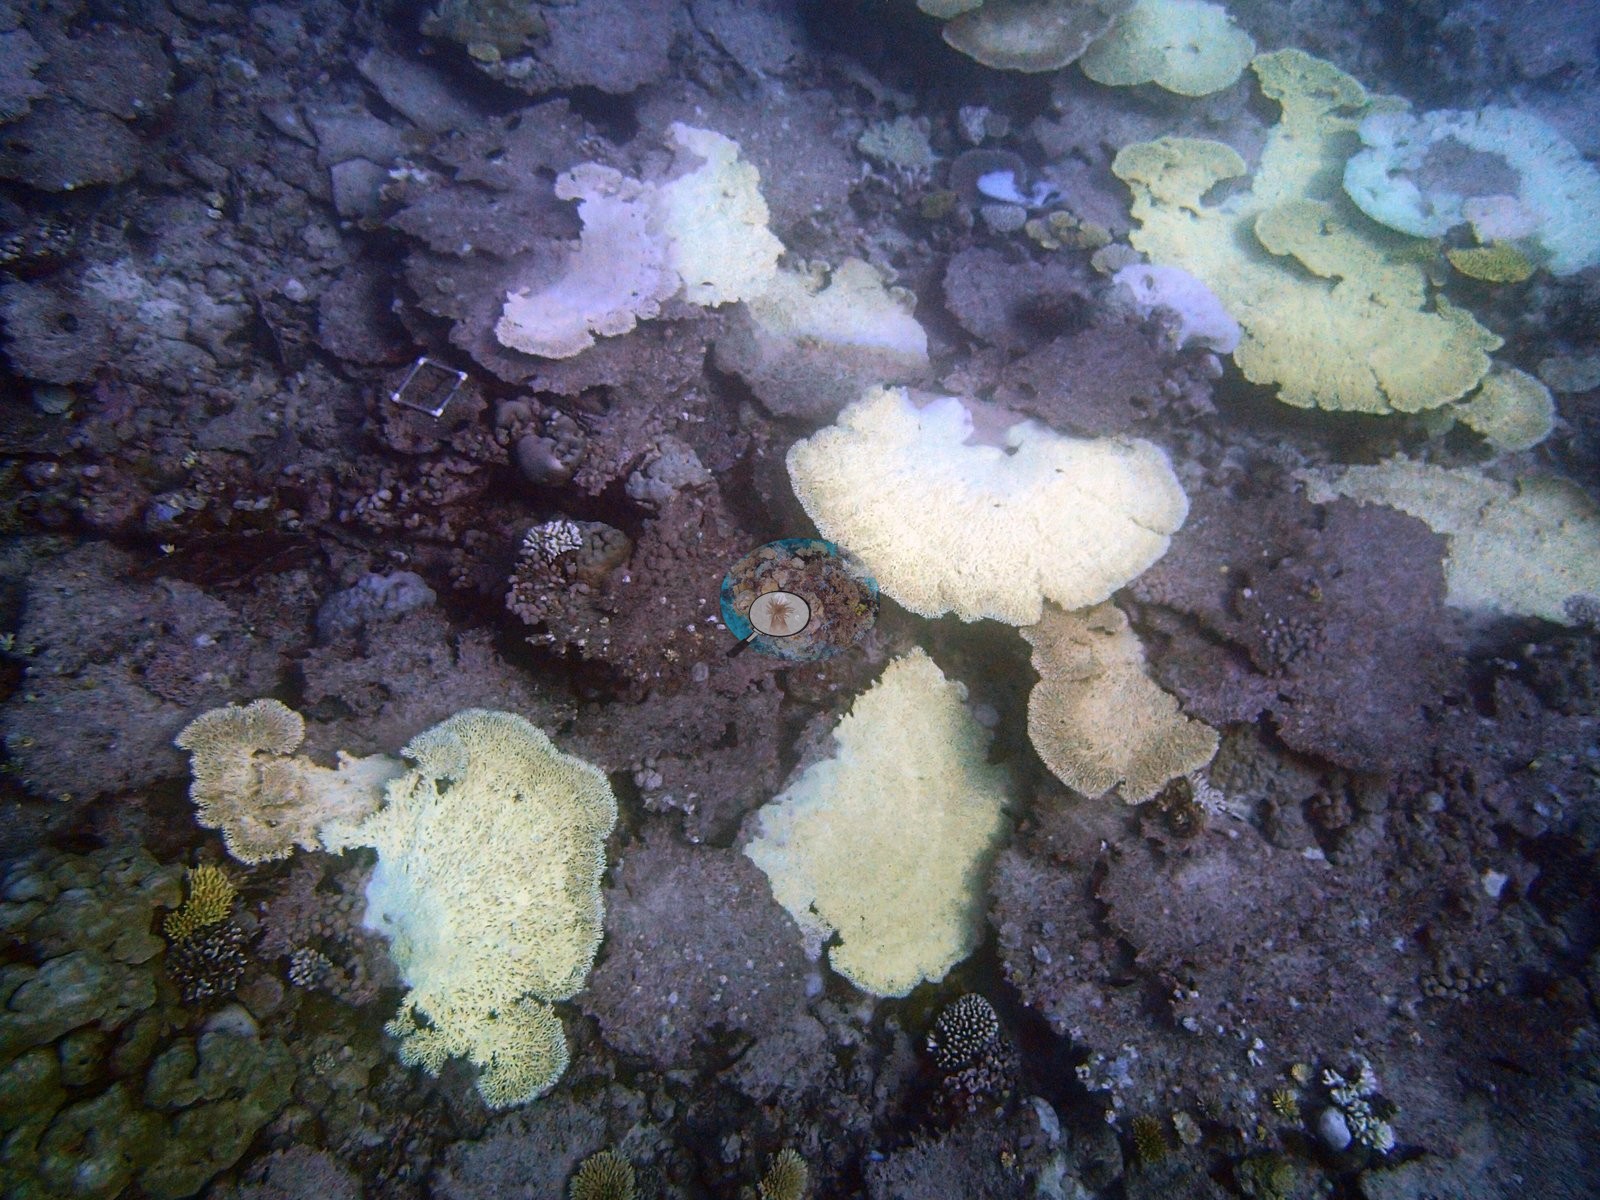
No crown-of-thorns or disease signs were identified in the 10 stills reviewed. The bleaching percentage is a computer vision figure — CoralNet annotation of the informal survey images, not a diver's field estimate — and human-vs-model agreement is weaker for bleaching (r = 0.40) than for coral cover (r = 0.72).
Comparisons with other data
No independent survey was made at this exact site; the nearest ones are listed in the table below.
CV model comparison
More info
Those are point counts on the photographs; this is a diver swimming a transect. The models and the reference never saw the same thing. ⚠ SITE-LEVEL ONLY. The 2,500 frames were not associated with any transect taken within 200 m of them, so transect-vs-image comparisons are site means, never frames. The transect value is already in the pin `cover` field (109 of 112 pins, sourced to the paper's suppl. S1) and is read from there, never re-imported. The transect is THE coral-cover value for this site and stands alone. The rows below it are a methods comparison only: no computer-vision value is averaged with it, feeds the headline, or carries over to the site's cover figure (Anderson, 2026-09-22).| Method | Hard-coral cover (%) |
|---|---|
| Transect (published) | 48.8 |
| CoralNet | 16.7 |
| In-house DINOv3 | 28.6 |
| CoralSCOP edited | 40.1 |
| Claude | 17.5 |
Independent surveys nearby
| Agency / program | Year(s) | Stations / distance | Link |
|---|---|---|---|
| Lange et al. (2021) | 2006–2020 | 1 station, 0.54 km | Records ↓ |
| MERMAID* | 2020 | 1 station, 0.93 km | Records ↓ |
| Sheppard et al. (2008) | 2006 | 1 station, 4.04 km | Records ↓ |
| Spalding et al. 2025 (Chagos 2024 bleaching report) | 2024 | 1 station, 4.72 km | Records ↓ |
| XL Catlin Seaview Survey | 2015 | 5 stations, 0.82–4.36 km | Records ↓ |
 Dr. Coral (CRD)Year-average (no detectable trend)
Within 5 km, 9 independent survey stations recorded hard coral cover in 20 records between 2006 and 2024. Of the 1 station surveyed in more than one year, 1 declined between their first and latest surveys. The longest record, Salomon Atoll (Lange et al. 2021, 0.54 km away), went from 48% in 2006 to 21% in 2020. One survey since 2021 recorded 65%. This site's own estimate (49%) sits 16.2 points below the recent value (65%); the methods differ, so the comparison is context, not a like-for-like test.
Collected by other programs using different methods (MERMAID is a data platform: each MERMAID row names the organization that did the survey, and its method is in the row's hover text; the XL Catlin Seaview Survey uses photo-transects with automated image annotation. *Conducted by citizen scientists), so these are context for the figures above, not a like-for-like comparison. Where a station was surveyed more than once the range is shown. Station names are not dive-site names.
| Agency | Site / location | Date | Hard coral cover (%) | Distance | Link |
|---|---|---|---|---|---|
| Lange et al. (2021) | Salomon Atoll | 2006–2020 | 6.8–63% (5 surveys) | 0.54 km | HeatCRD database |
| Sheppard et al. (2008) | Salomon | 2006 | 32% (5 surveys) | 4.04 km | HeatCRD database |
| XL Catlin Seaview Survey | transect 36013 | 2015 | 28% | 0.82 km | — |
| XL Catlin Seaview Survey | transect 36018 | 2015 | 22% | 2.17 km | — |
| XL Catlin Seaview Survey | transect 36014 | 2015 | 34% | 3.22 km | — |
| XL Catlin Seaview Survey | transect 36016 | 2015 | 19% | 3.71 km | — |
| XL Catlin Seaview Survey | transect 36015 | 2015 | 28% | 4.36 km | — |
| MERMAID* | Salomon 219 | 2020 | 30% (4 surveys) | 0.93 km | MERMAID |
| Spalding et al. 2025 (Chagos 2024 bleaching report) | Salomon - Boddam Lagoon (N, 1-4 m) | 2024 | 65% | 4.72 km | — |
Data & links
- Read the full site report ↗
- Download benthic survey data (CSV) ↗
- Download all LOF-GRE data (933 sites) ↗
- CoralNet image repository for this region ↗
- HeatCRD database ↗
- (reference) ↗
- Photo portfolio ↗
- Coral Reef Diagnostics page for this area ↗
All images from Coral Reef Diagnostics. Data are from Coral Reef Diagnostics and the organizations named in the data-sources table above.
 © Coral Reef Diagnostics.
References
- Mayfield AB, Dempsey AC (2026). Using tourist diver images to estimate coral cover and bleaching prevalence in a remote Indian Ocean coral reef system. Oceans 7(1):1. PDF
- Lange ID, Benkwitt CE, McDevitt-Irwin JM, Tietjen KL, Taylor B, Chinkin M, et al. (2021). Wave exposure shapes reef community composition and recovery trajectories at a remote coral atoll. Coral Reefs 40:1819-1829. PDF
- Sheppard C, Harris A, Sheppard A (2008). Archipelago-wide coral recovery patterns since 1998 in the Chagos Archipelago, central Indian Ocean. Marine Ecology Progress Series 362:109-117. PDF
- Spalding M, Bourasseau M, et al. (2025). Coral bleaching and mortality in the Chagos Archipelago, 2024. British Indian Ocean Territory Administration report (gray literature). PDF