
Part of the regional summaries: Chagos Archipelago - Salomon / Blenheim / Speakers Bank and Chagos Archipelago
More info
Chagos (NOAA CRW virtual station)A high-cover (50.3%), high-diversity lagoon patch reef that is emphatically not an Acropora reef: Porites, the fleshy Lobophyllia, and the long-polyped Goniopora make up two-thirds of the coral, each taking the lead at a different depth. Surveyed on the Living Oceans Foundation's Global Reef Expedition.
Nine independent survey stations shown with the program’s logo — click one to see how far it is from this site.
Twelve other CRD dive sites within 5 km shown in orange — click a marker to open its page.
🗺 Detailed map of the Global Reef Expedition dive sites, Salomon Atoll, Chagos (Khaled bin Sultan Living Oceans Foundation; opens in a new window)
3 of these 25 photographs are shown beside the text that discusses them under "Site description" below.
Site description
Setting
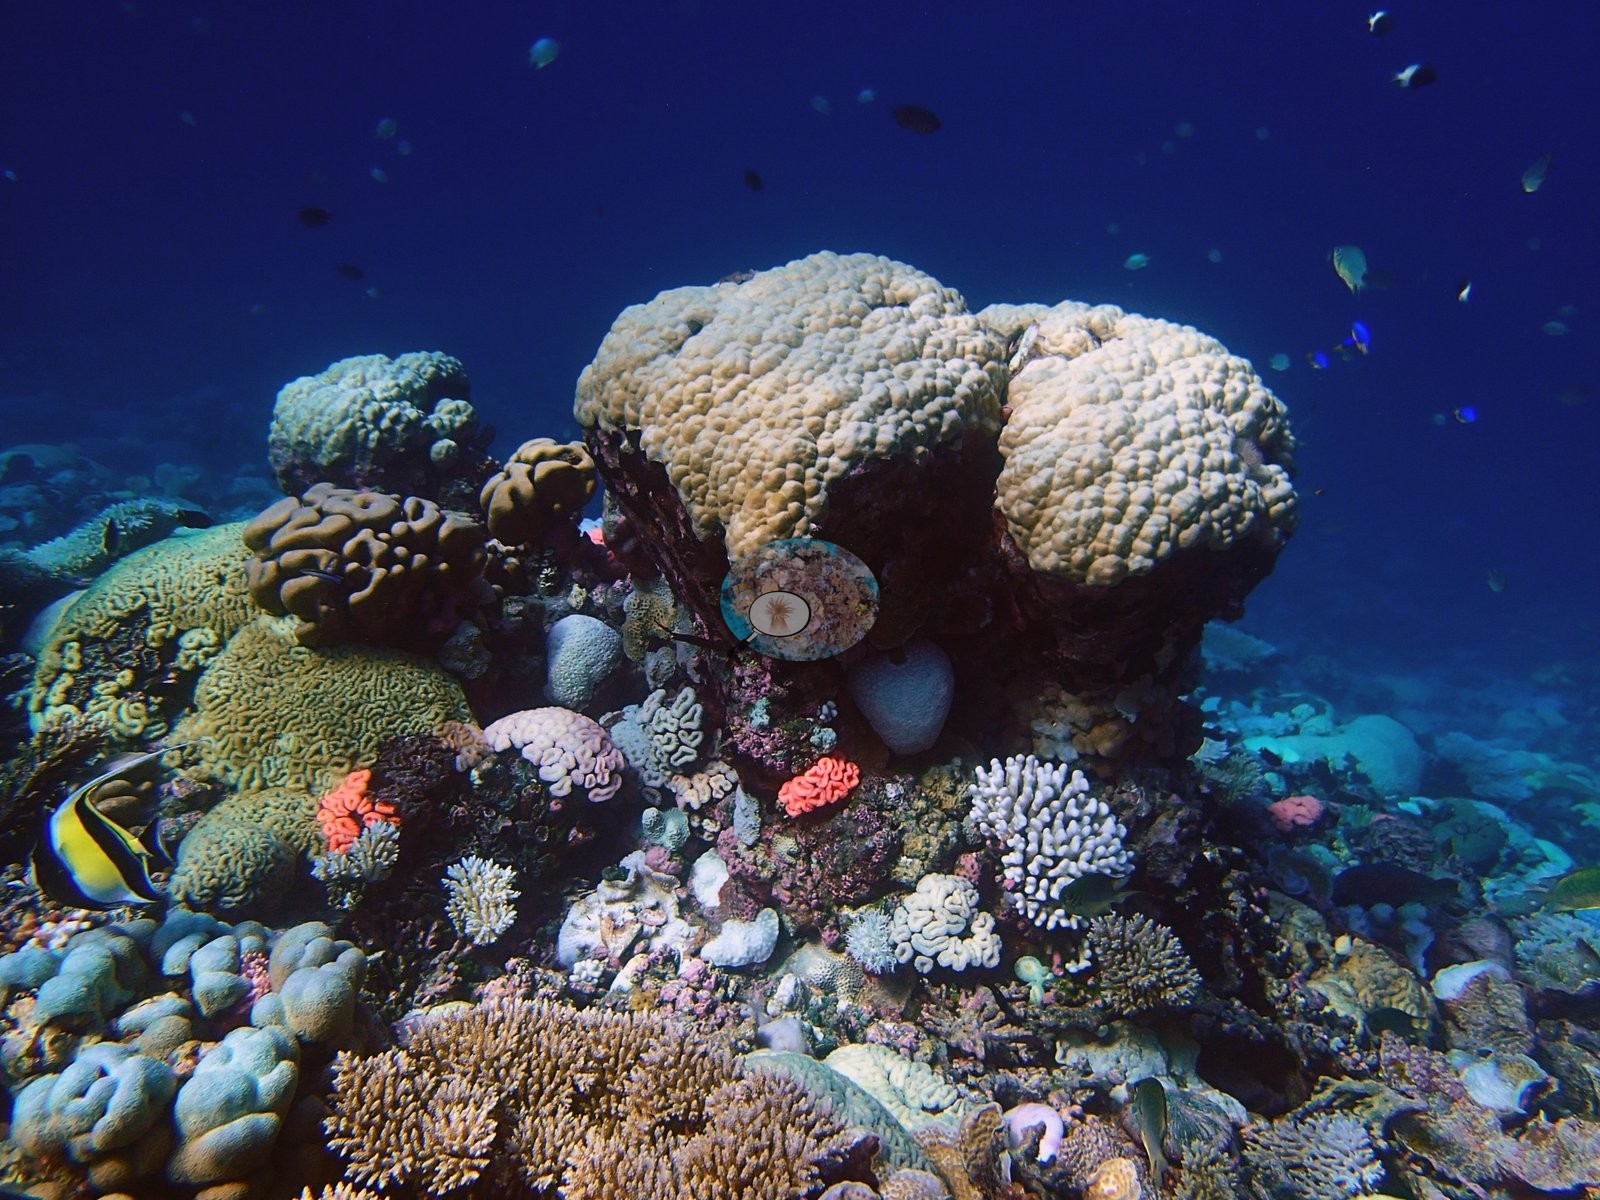
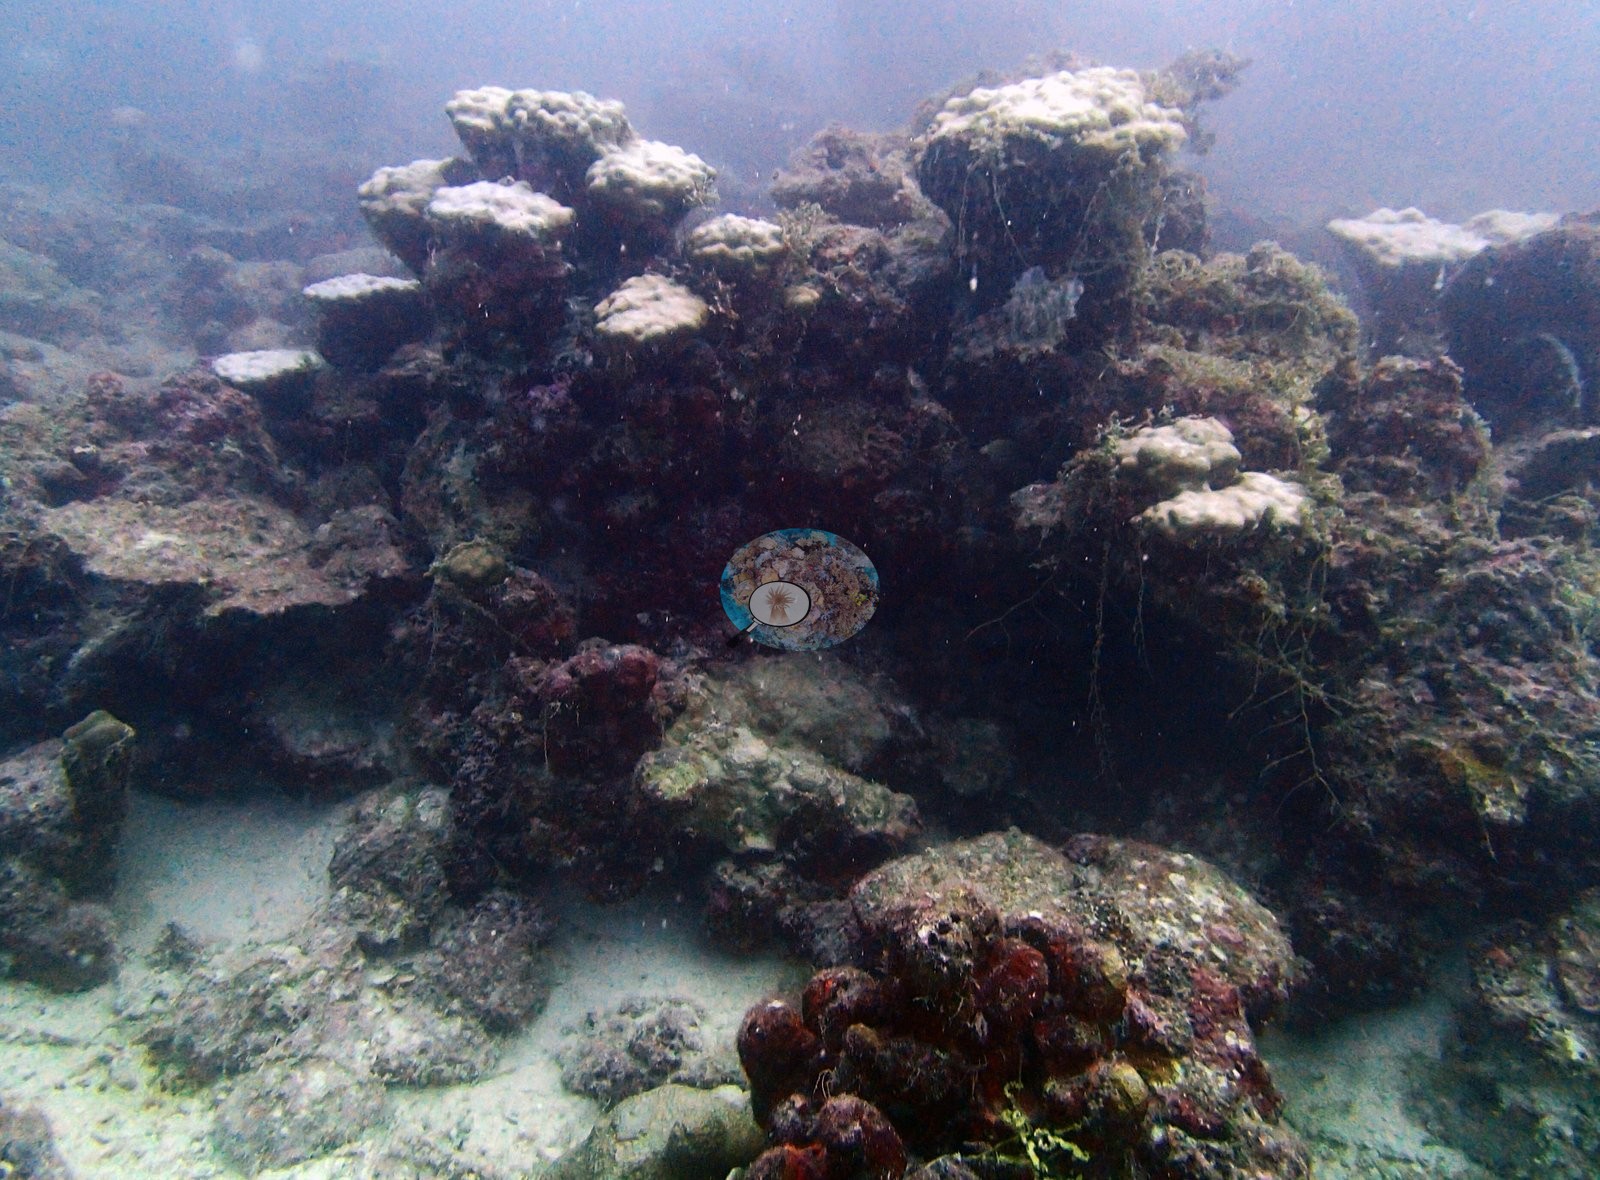
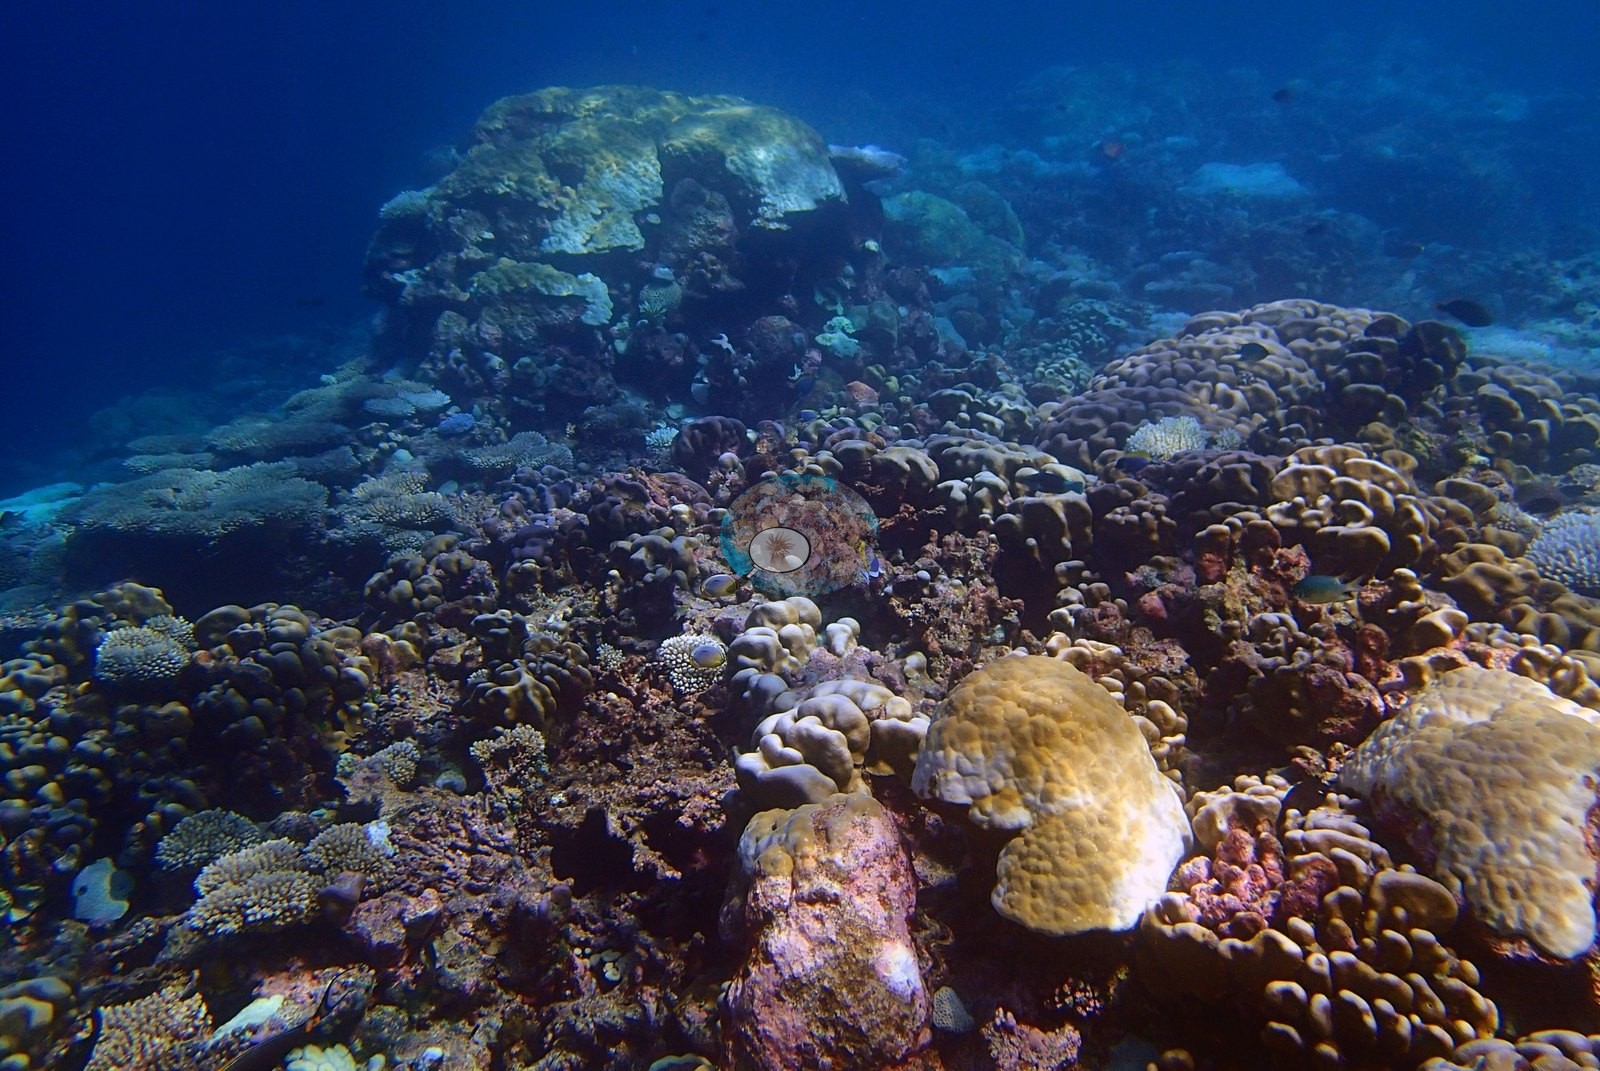
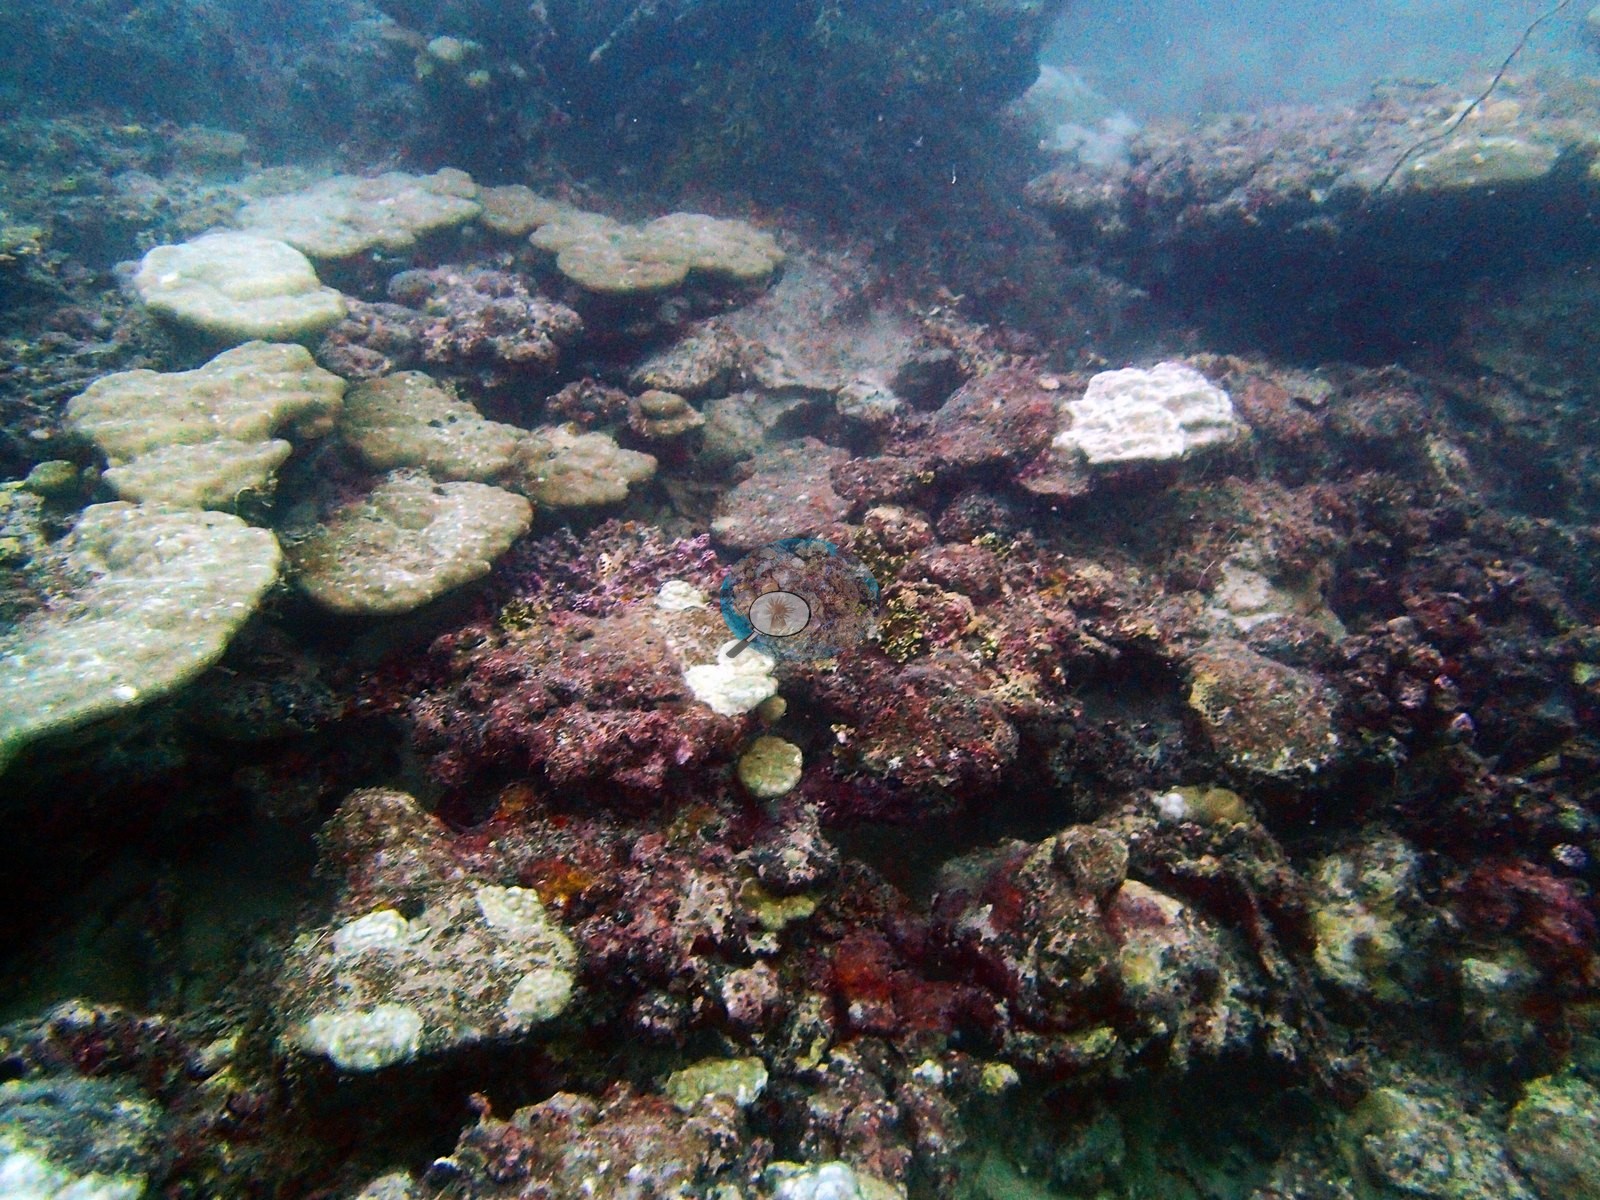
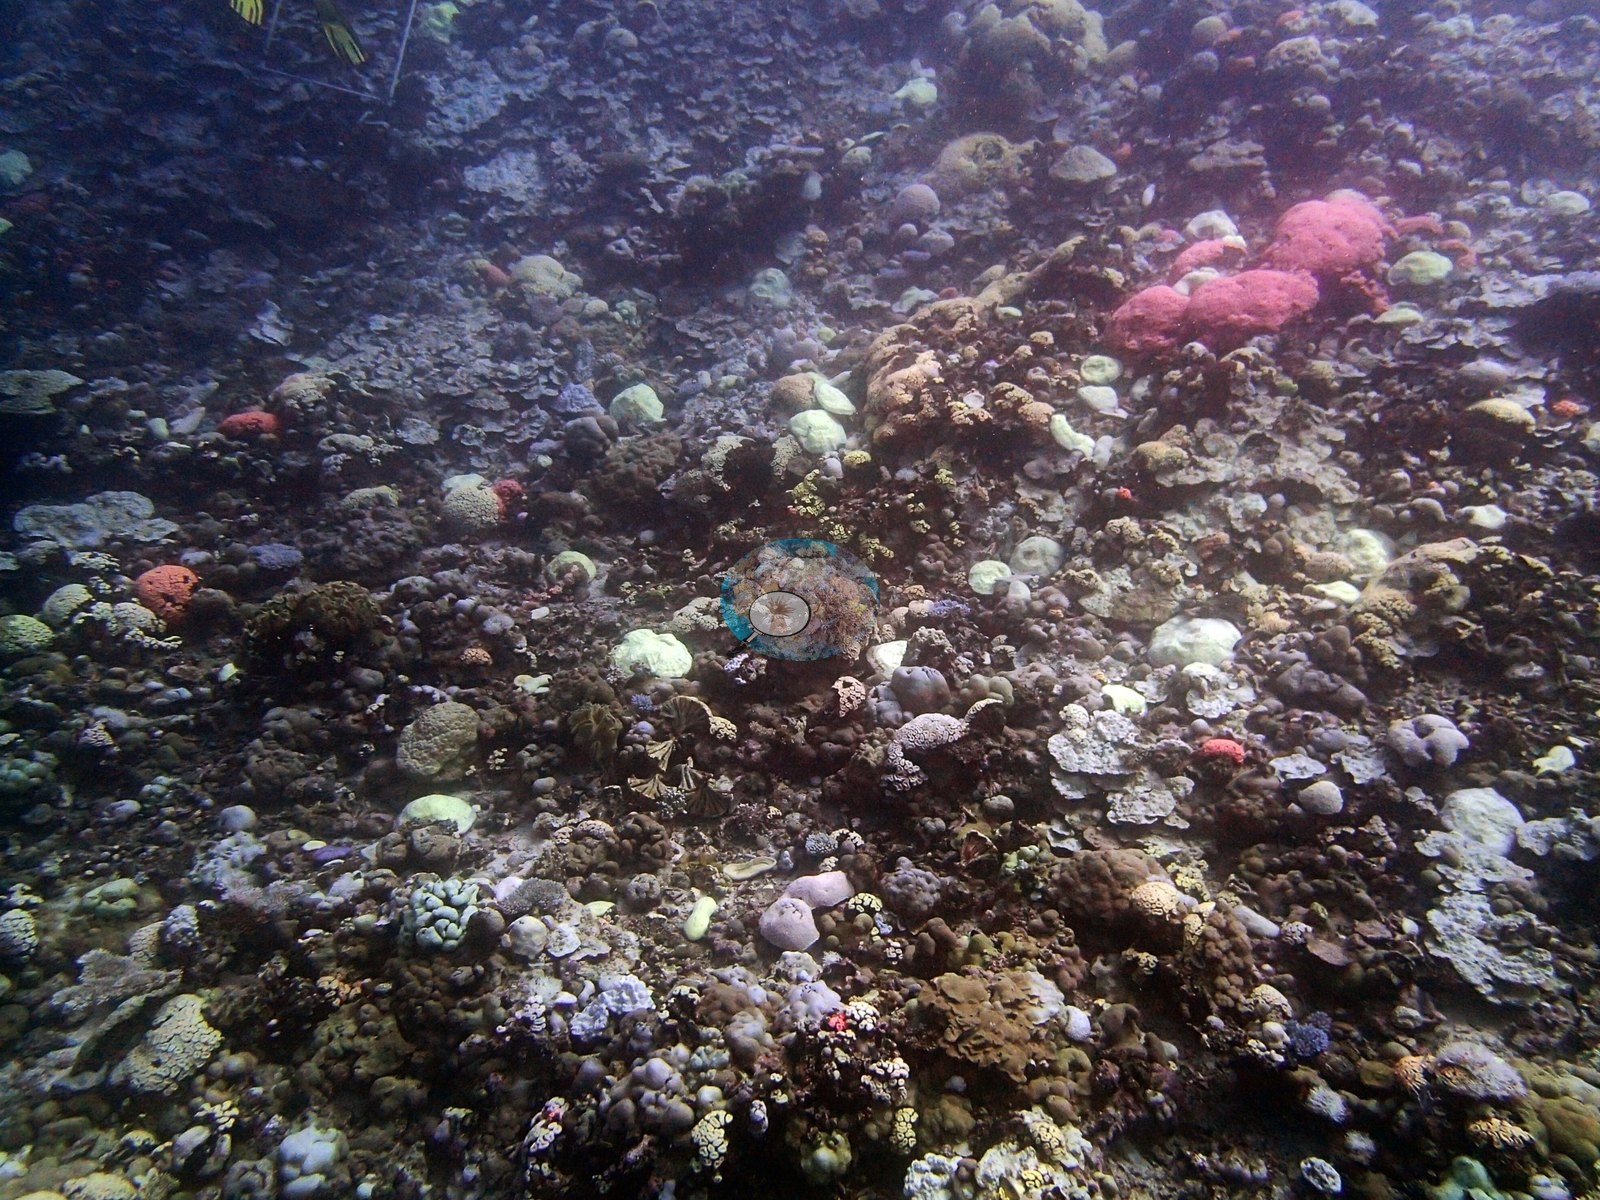
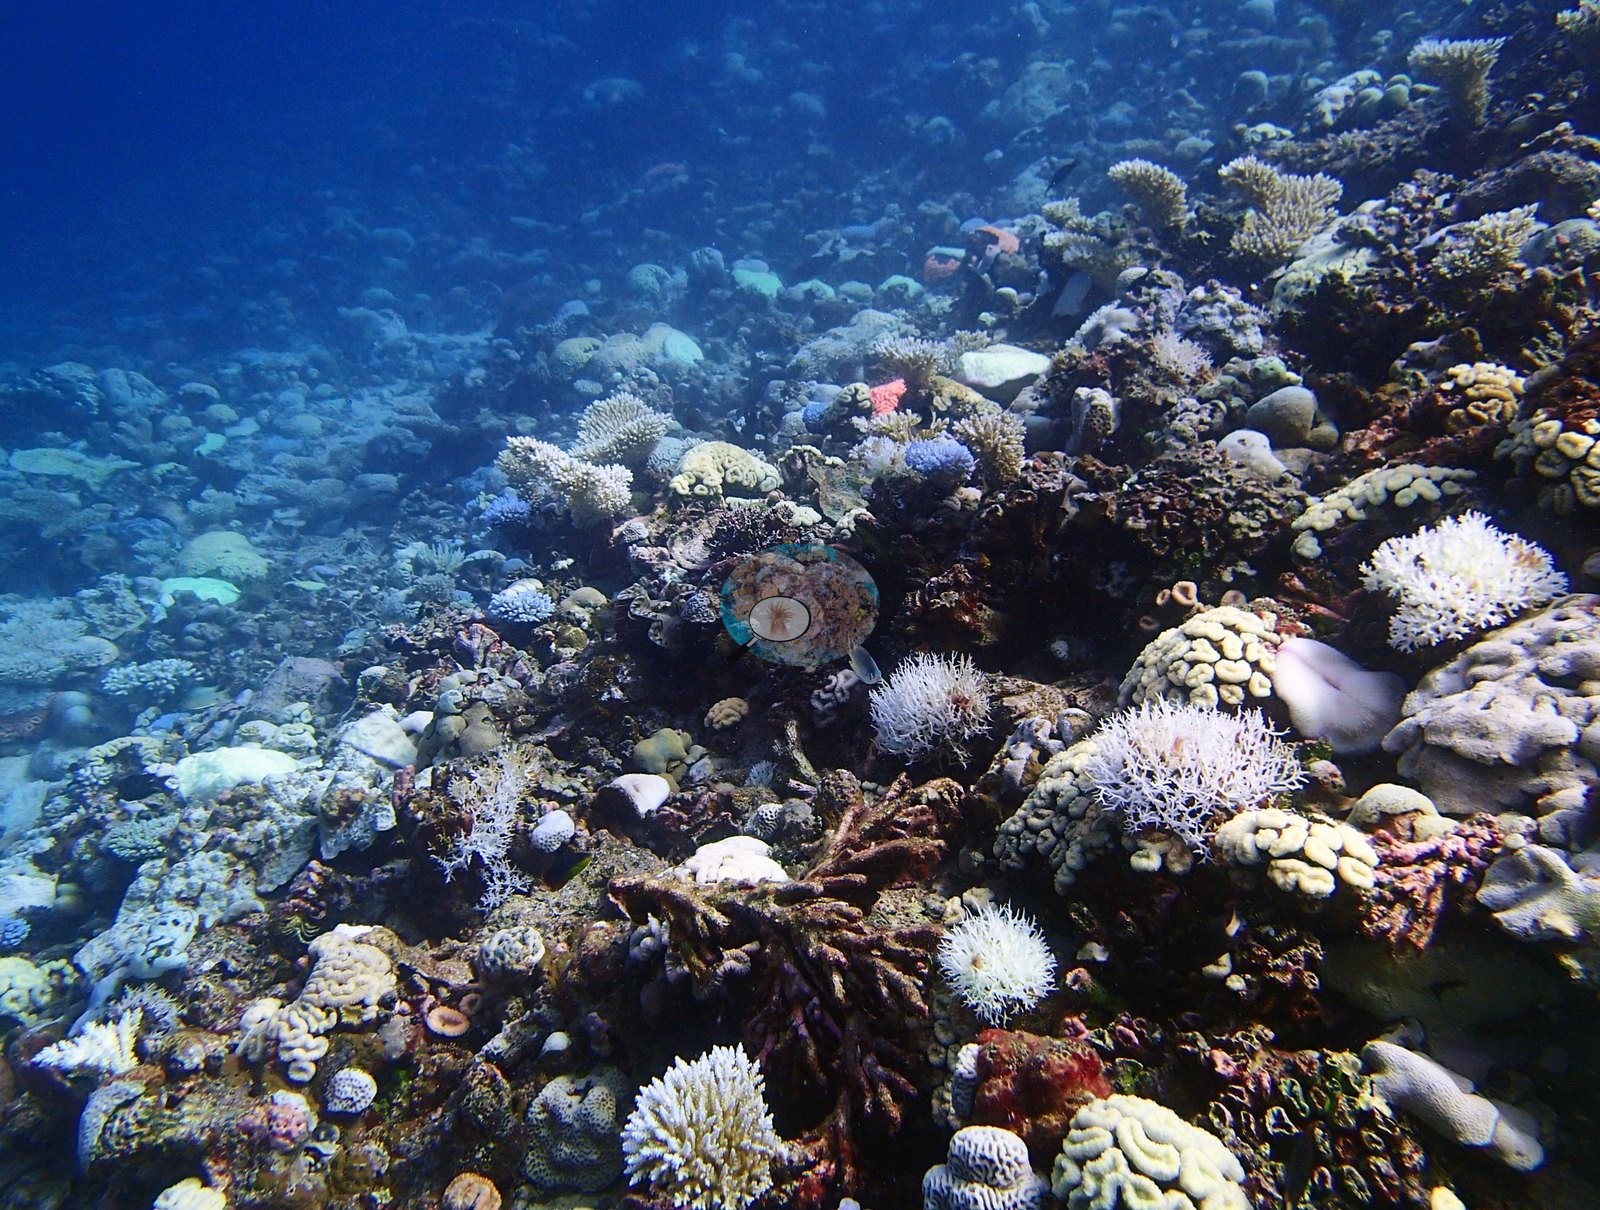
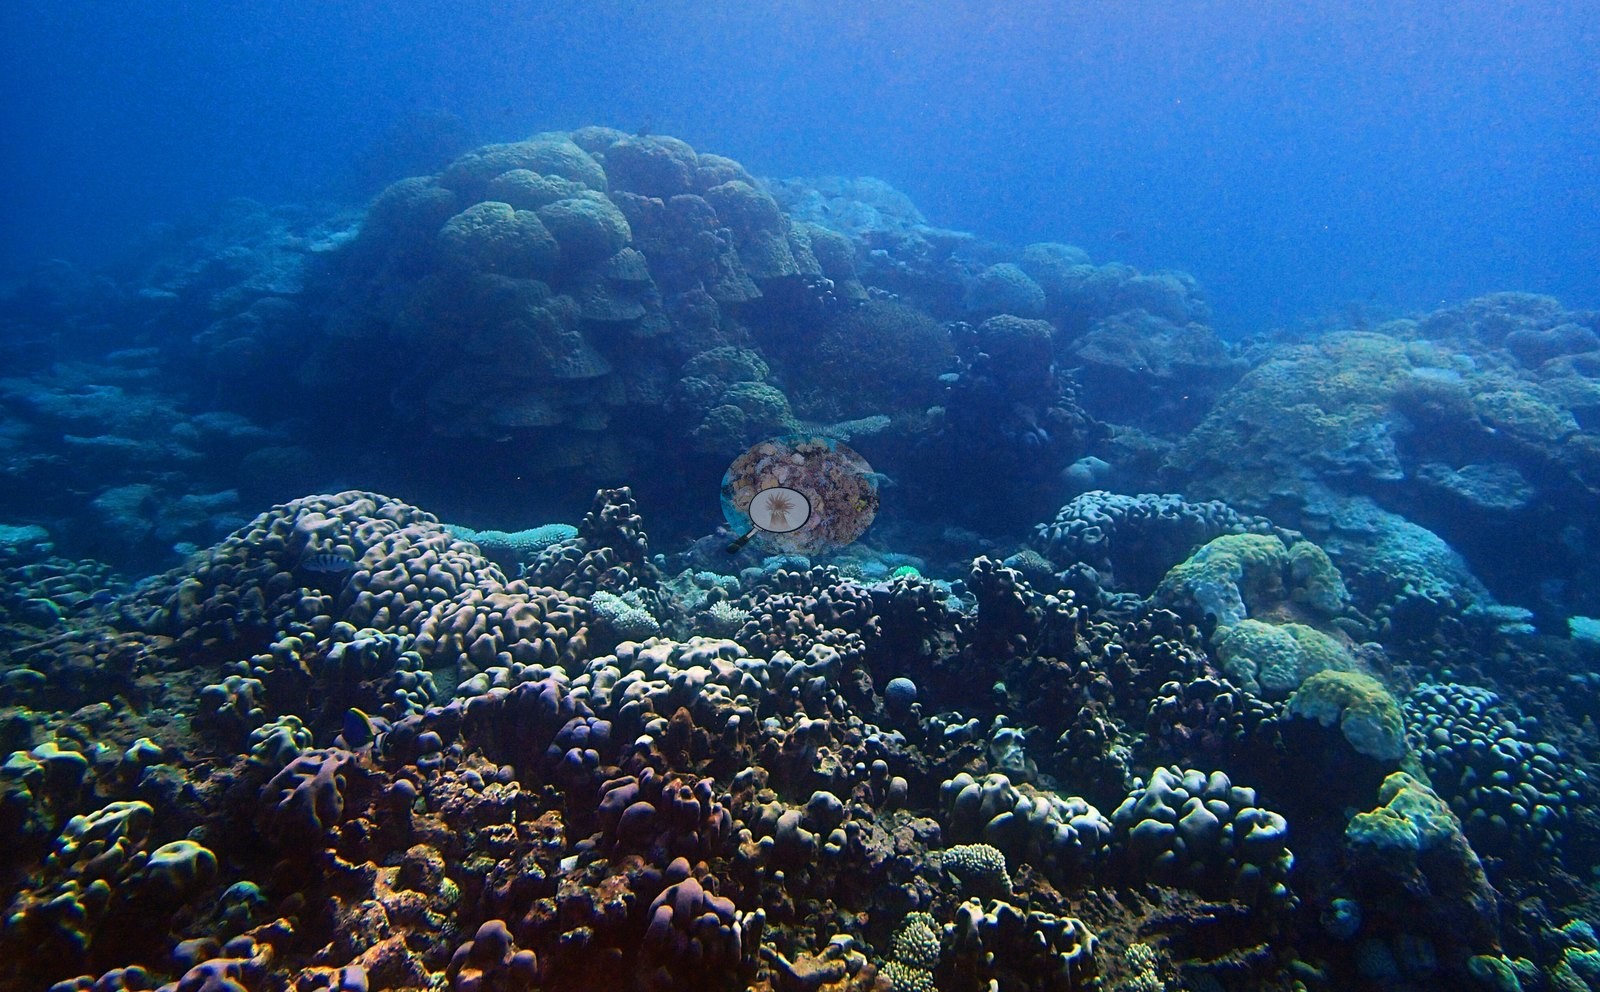
The characteristic architecture is a sequence of coral-capped blocks and pinnacles separated by narrow sediment pockets. Water clarity changes appreciably across the sequence. Suspended material softens contrast in the first several frames, and some surfaces appear muted or gray from distance and backscatter; later images use closer illumination and stronger color balance. No quantitative turbidity value is supported by the photographs and none is reported.
General benthic features
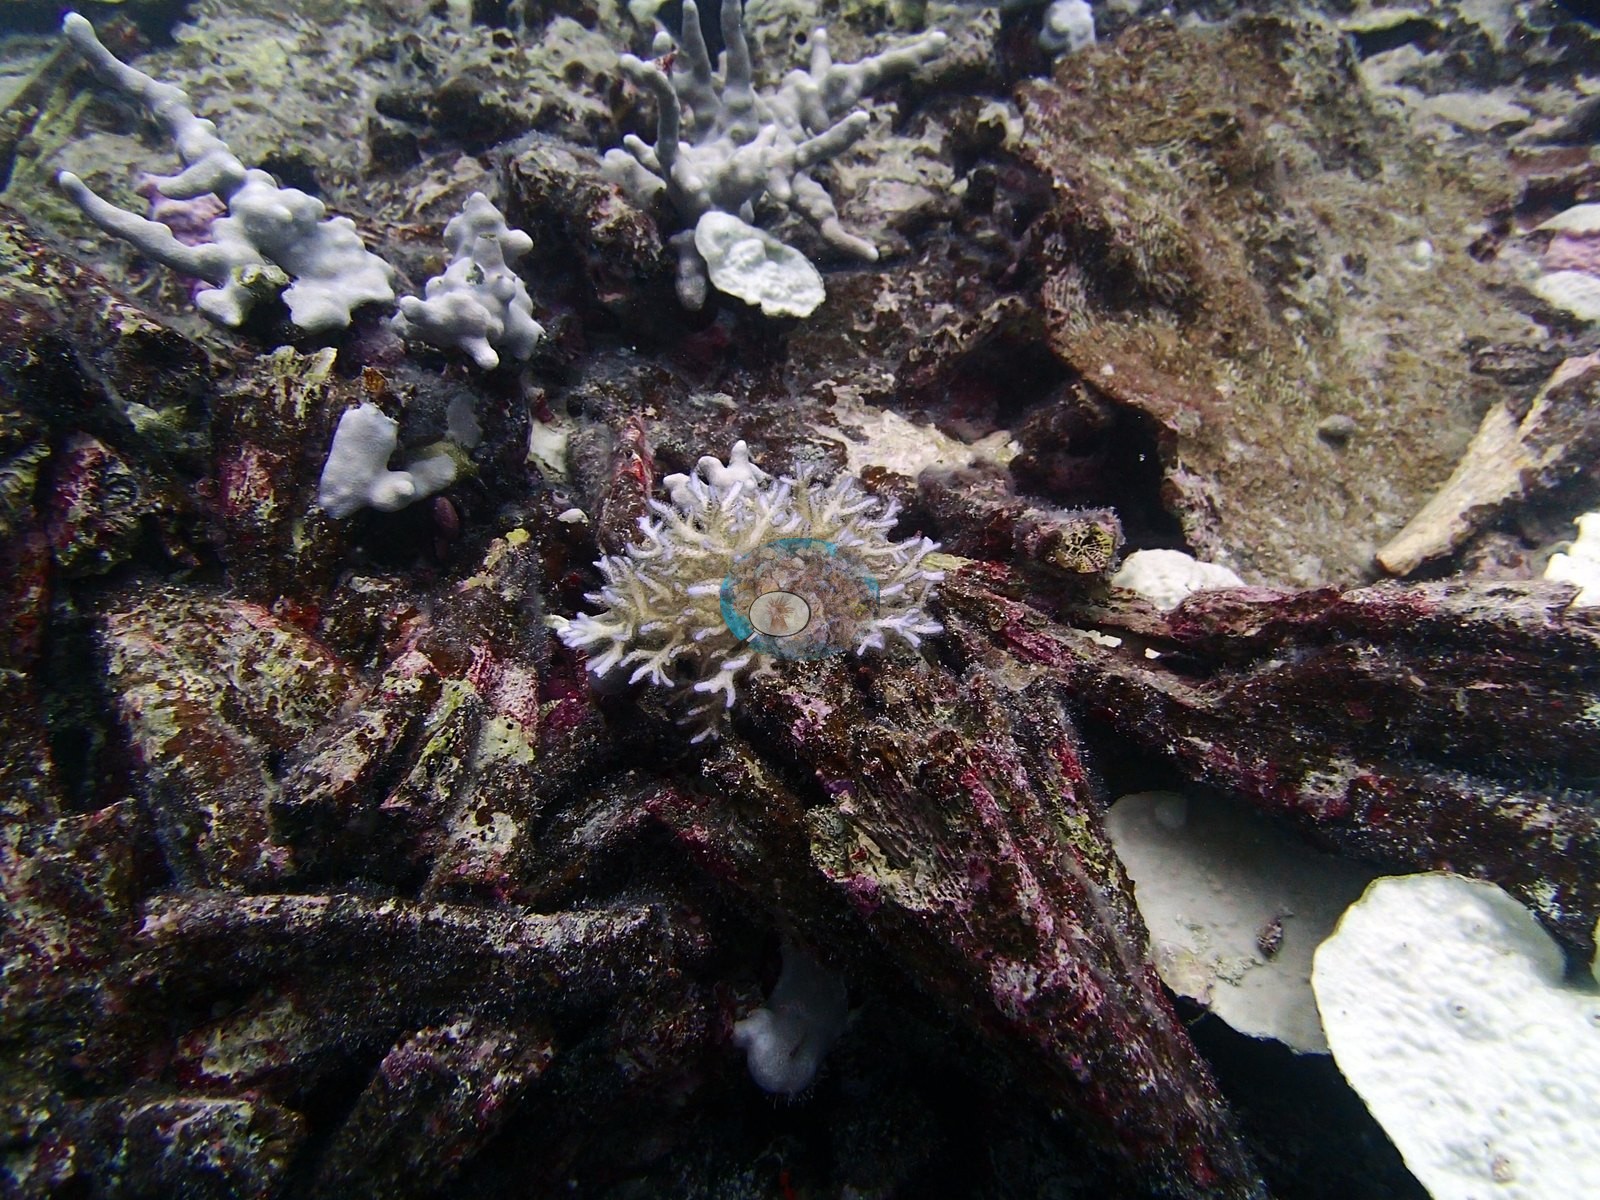
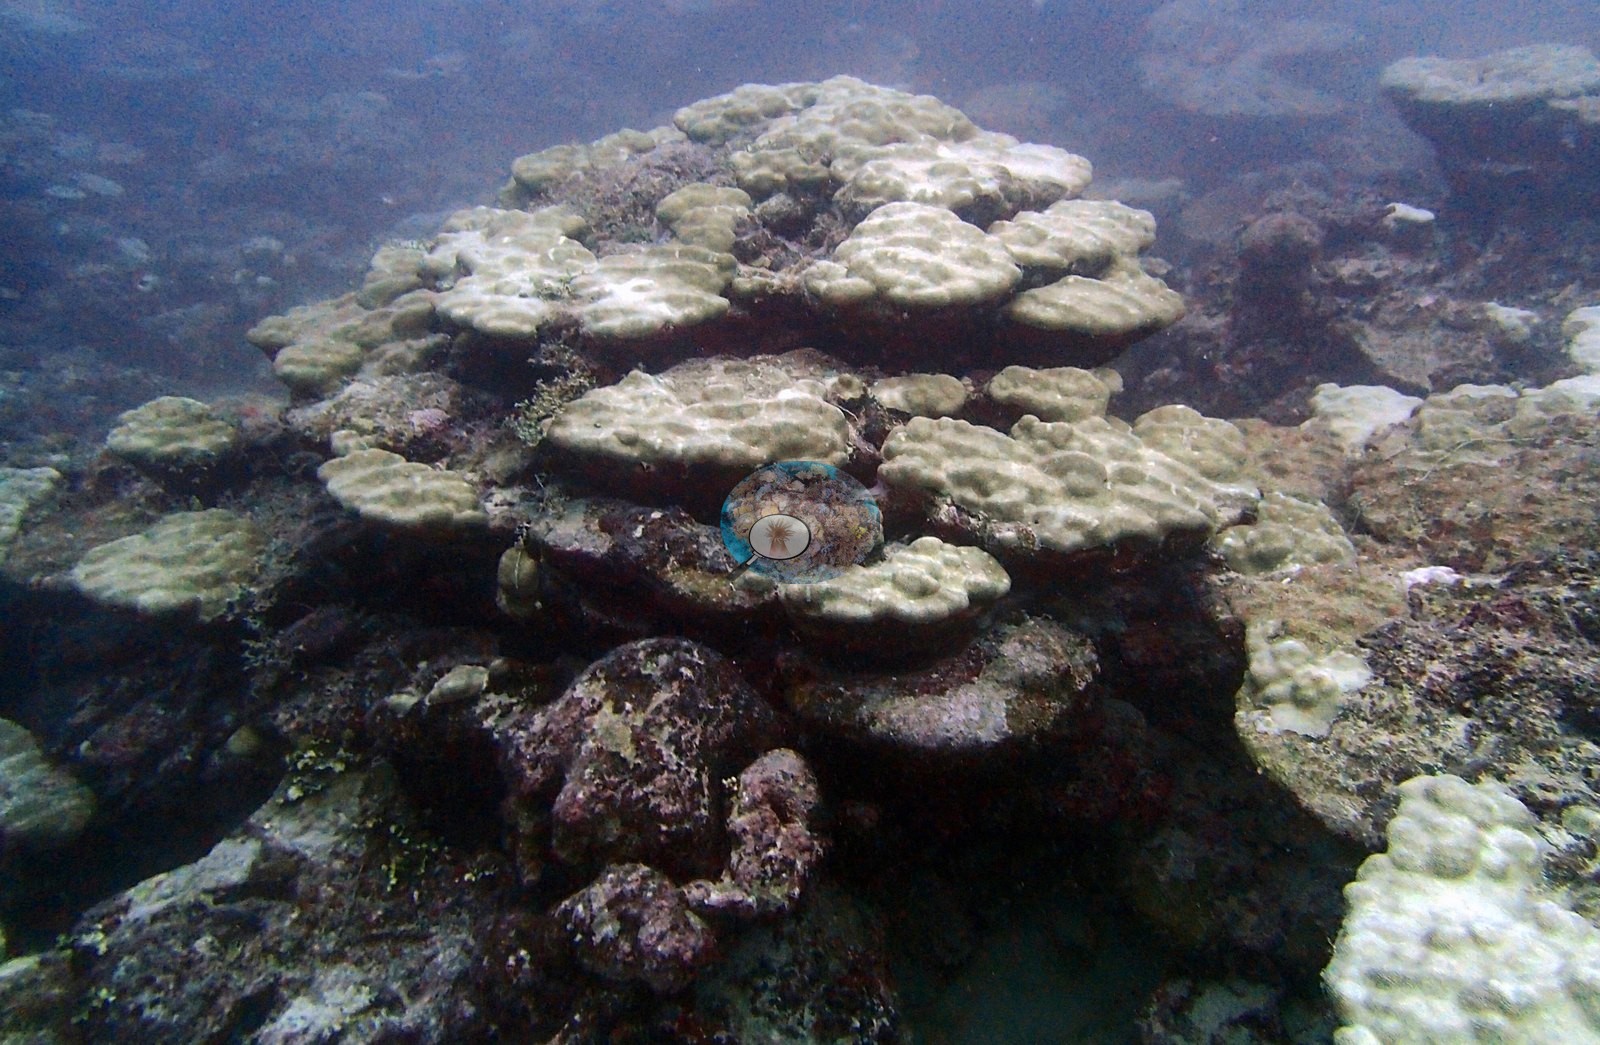
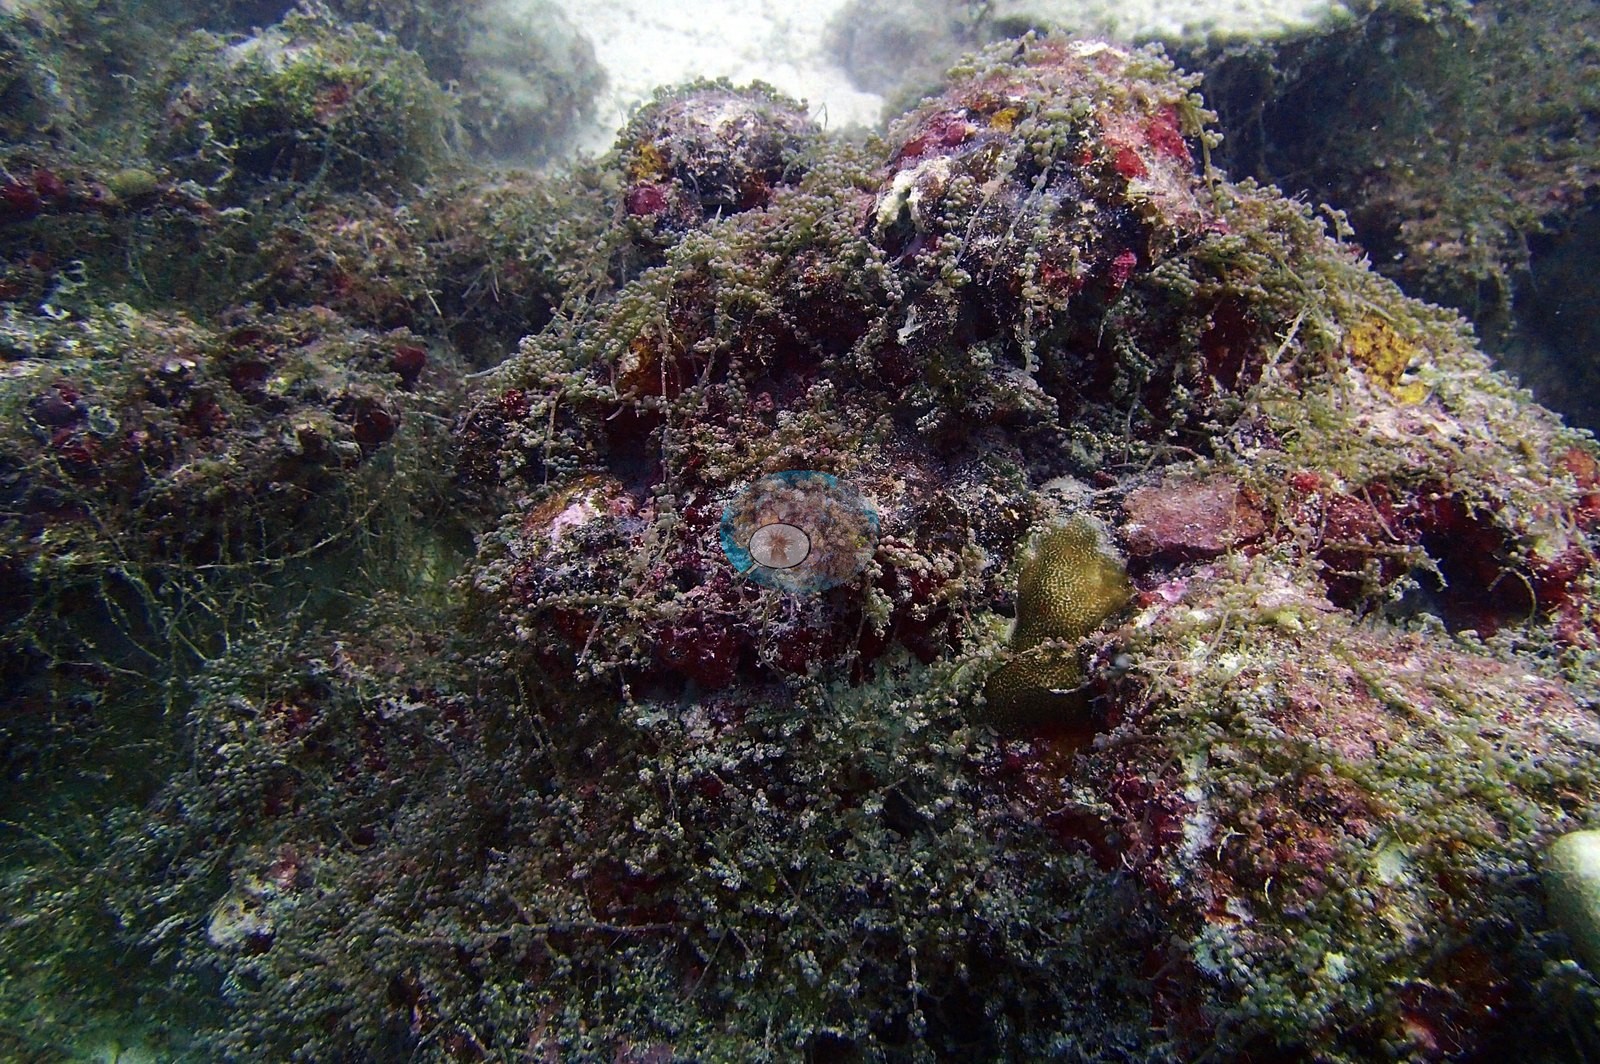
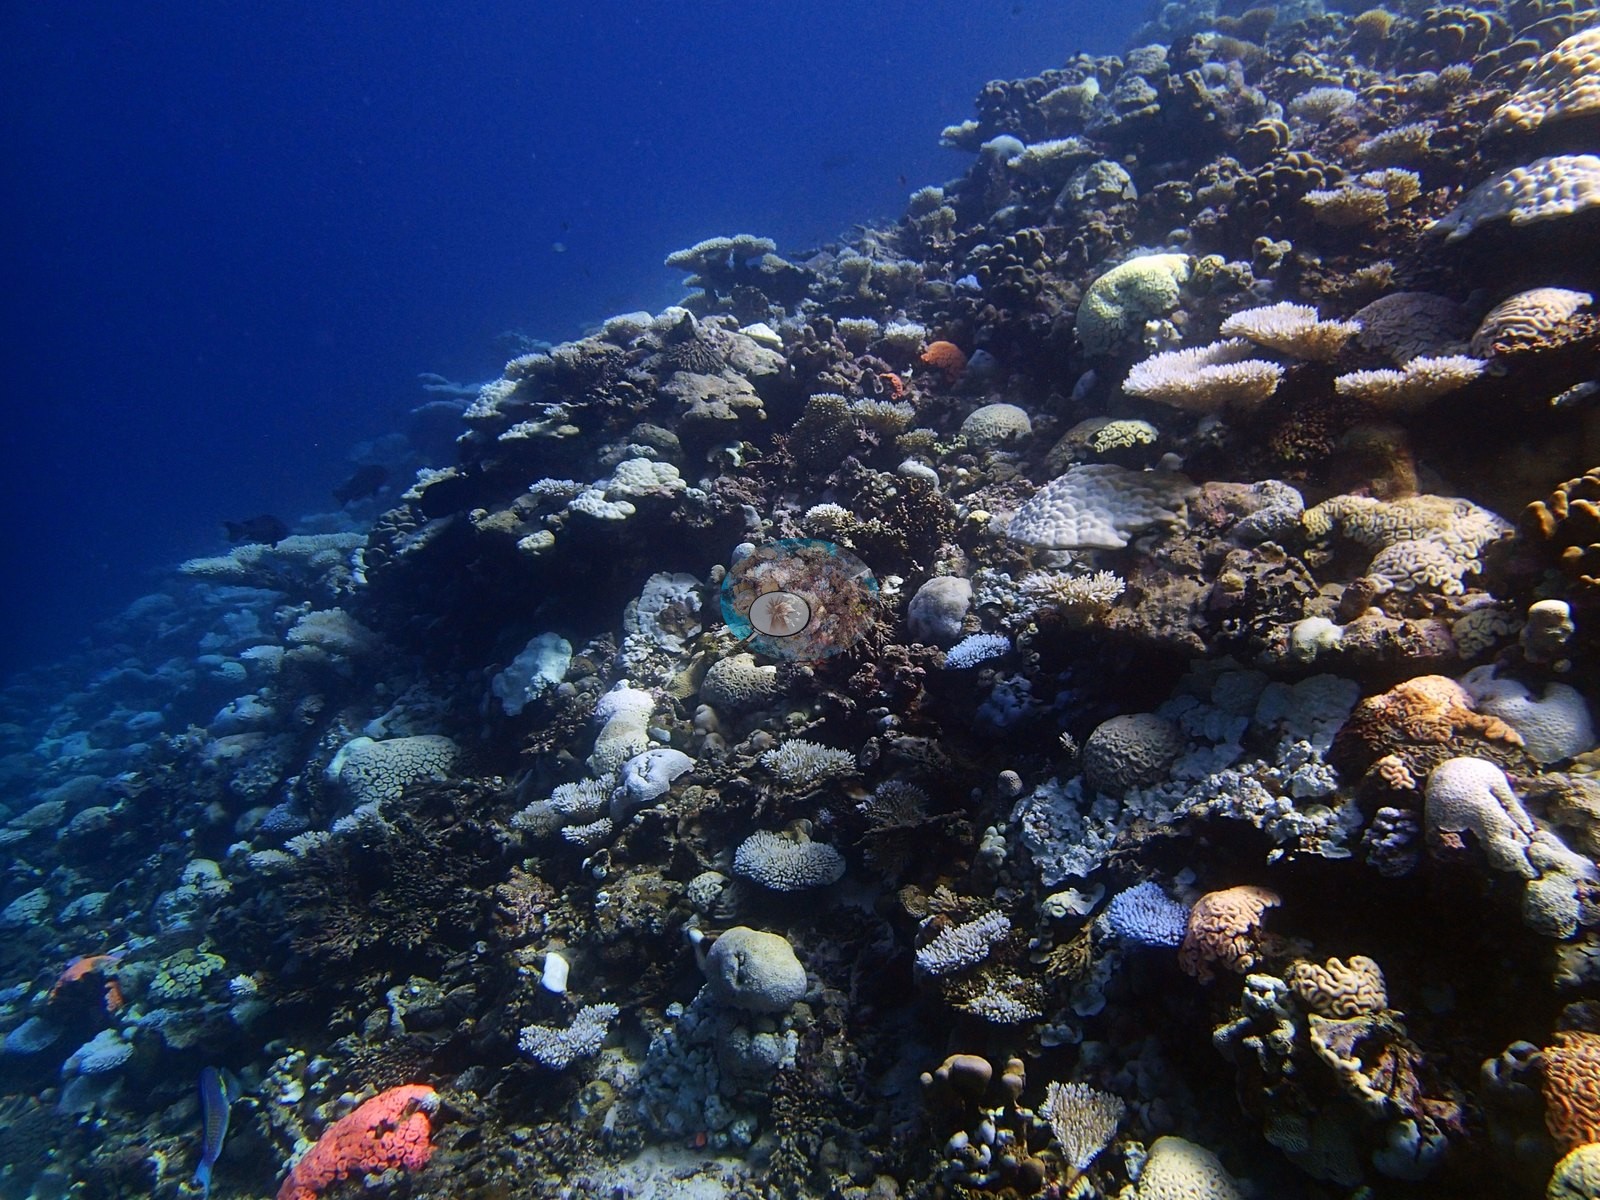
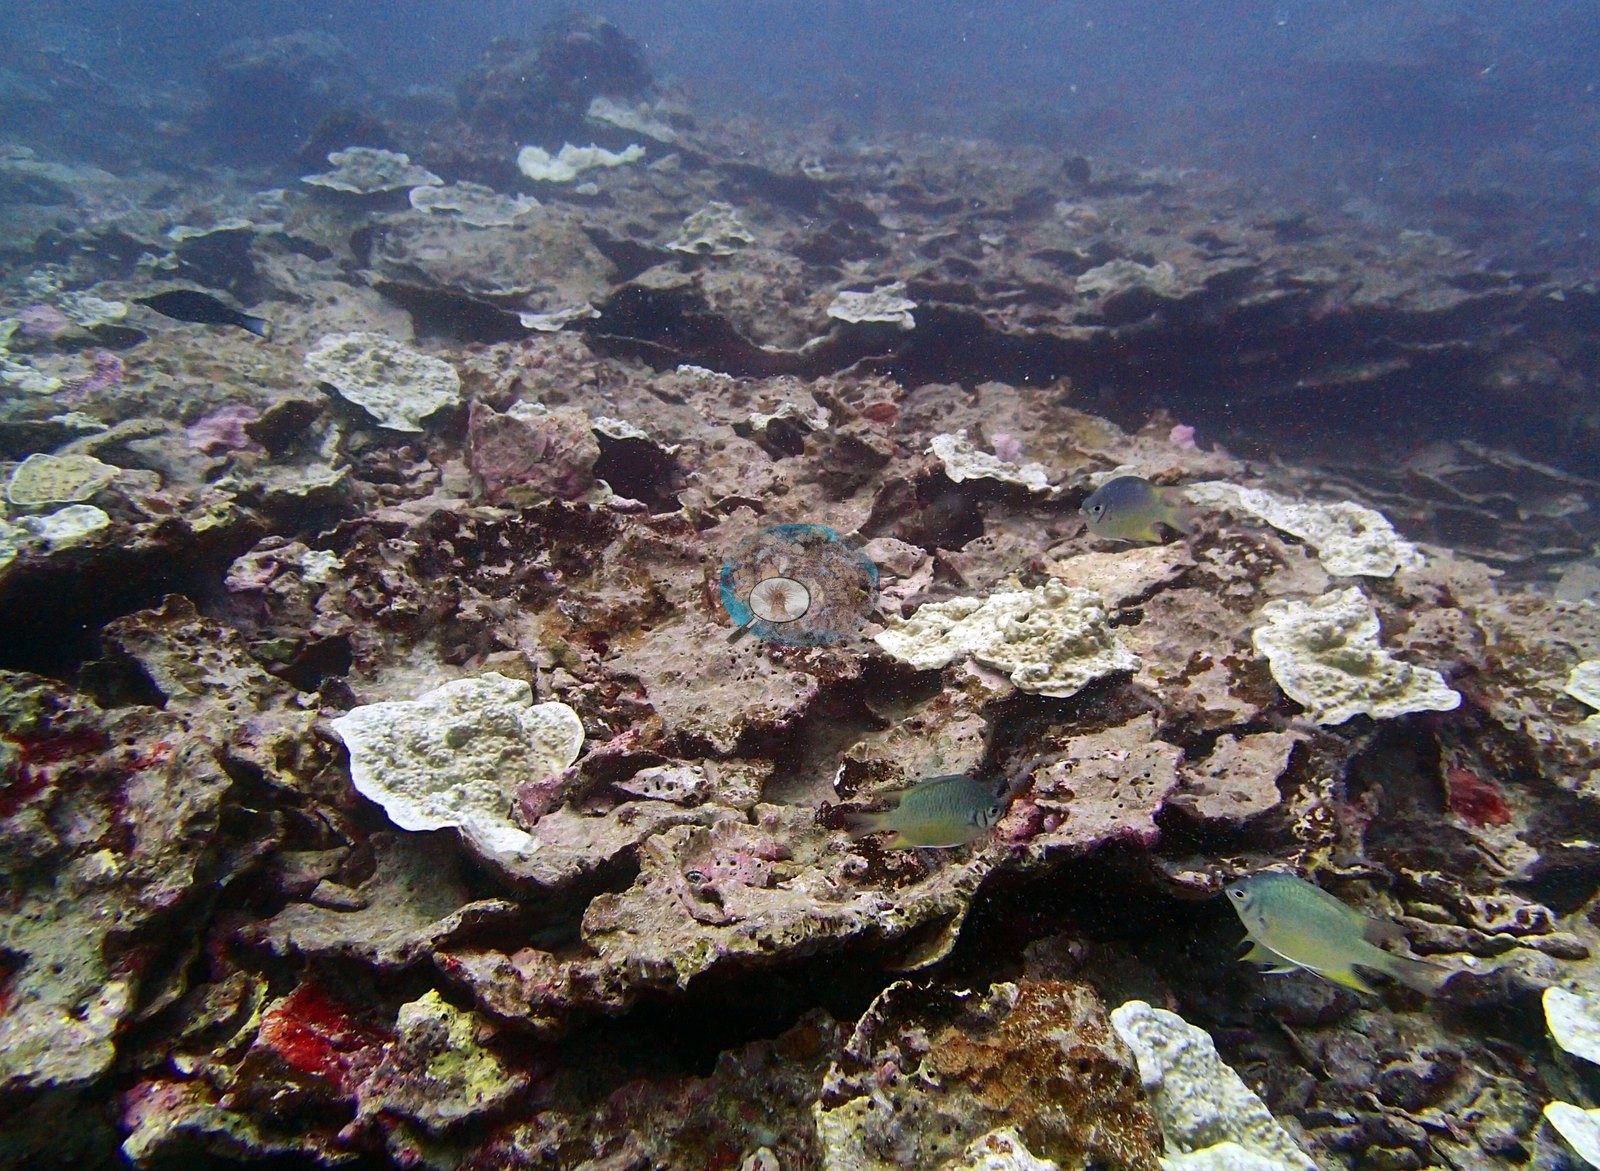
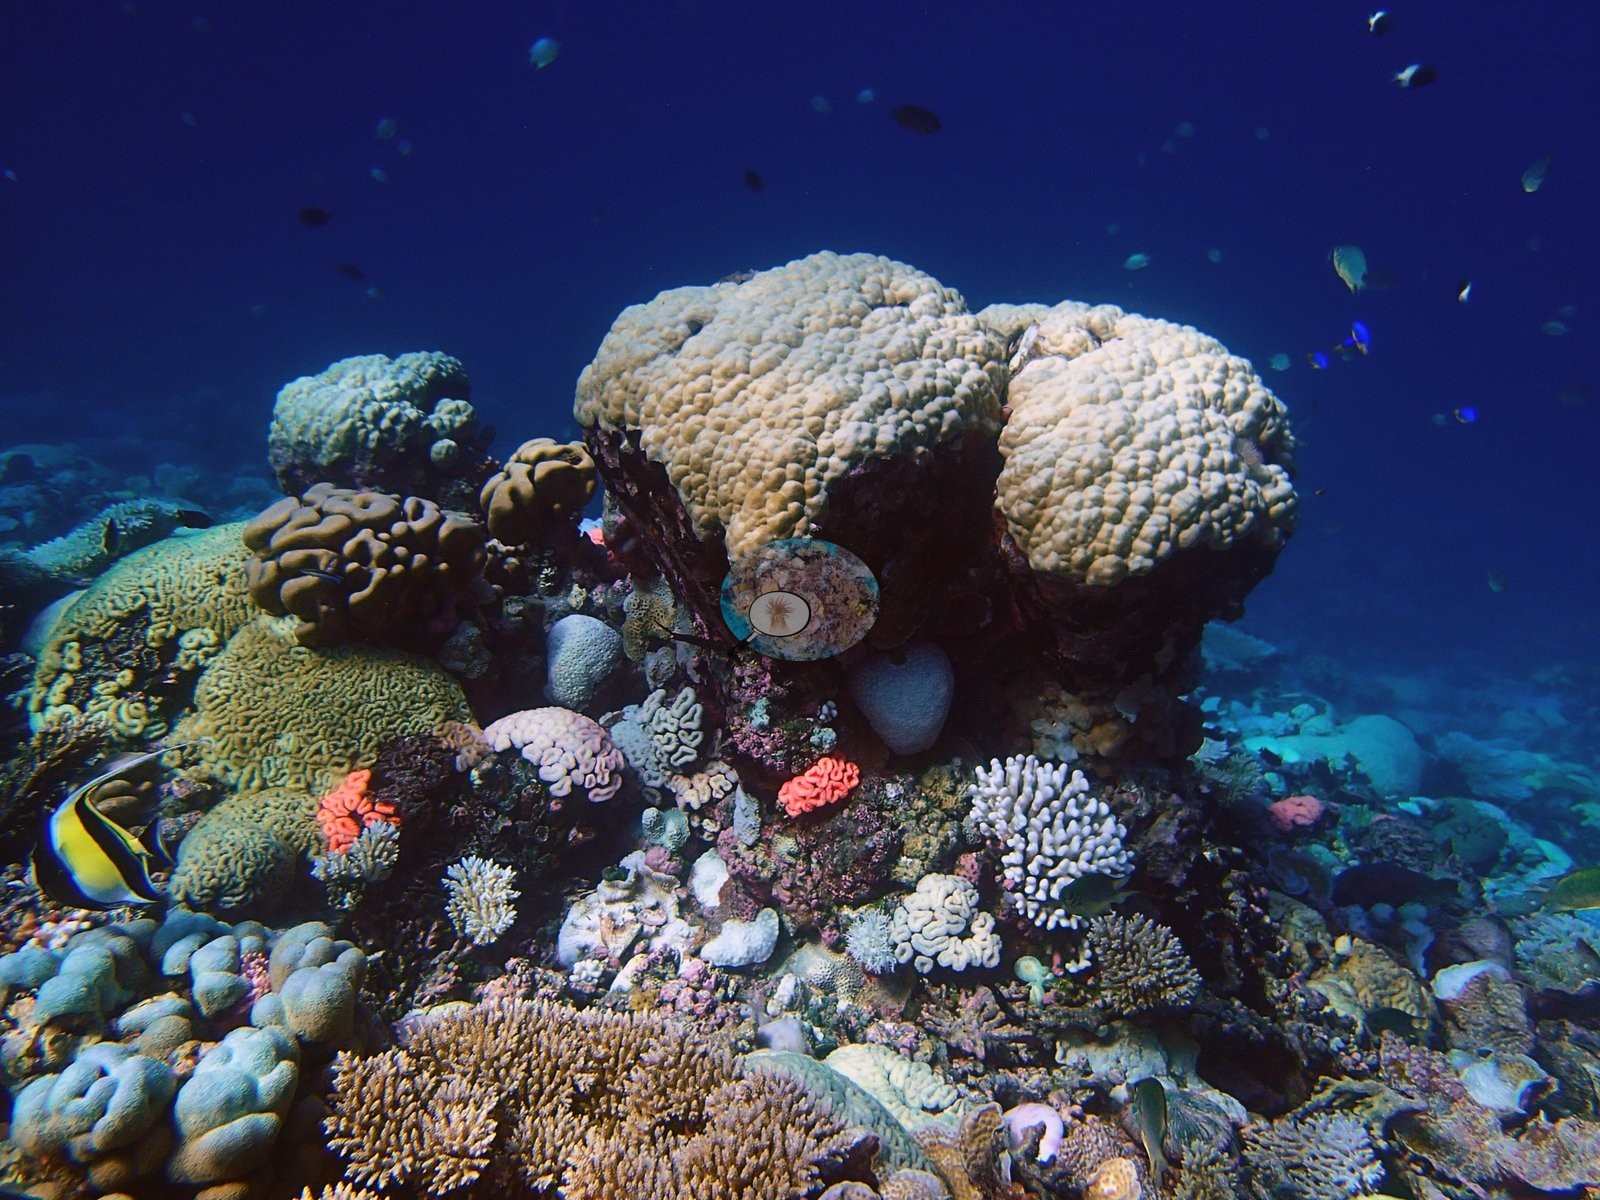
Porites leads at 14.50% of the benthos, followed by Lobophyllia at 10.83% and Goniopora at 8.92%, an unusual pairing that together with Porites accounts for 68% of all coral recorded. Pavona follows at 4.25%, Acropora only fifth at 3.00%, then Favia 1.75%, Goniastrea 1.17%, and Hydnophora 0.83%. A ten-genus tail below 0.5% includes Echinopora, Ctenactis, Physogyra, Astreopora, Turbinaria, Alveopora, Galaxea, Montastrea, Montipora, and Platygyra. Bare substrate holds 13.8% of the benthos, macroalgae 11.2%, non-coral invertebrates 9.2%, turf 7.7%, and crustose coralline algae 7.5%. The depth structure is a clean handover between the three lead genera. D2 carries 55.0% coral and is the Lobophyllia band — 16.50%, with Pavona 9.75% and Goniopora 5.75% — and is also the richest at 19 genera. D3 holds 54.0% and inverts to Goniopora at 21.00% with Porites 13.50% and Lobophyllia 9.50%, on the site's lowest algal cover of 10.0%. D4 falls to 42.0% and becomes a Porites reef outright at 27.00%, with algal cover rising sharply to 47.0% and richness dropping to eight genera. The site-level 14.50% Porites figure is therefore the average of a band where it is absent from the top three and one where it holds better than a quarter of the benthos. Two frames show plates projecting from older framework and massive colonies stacked above one another (e.g., Image 2).
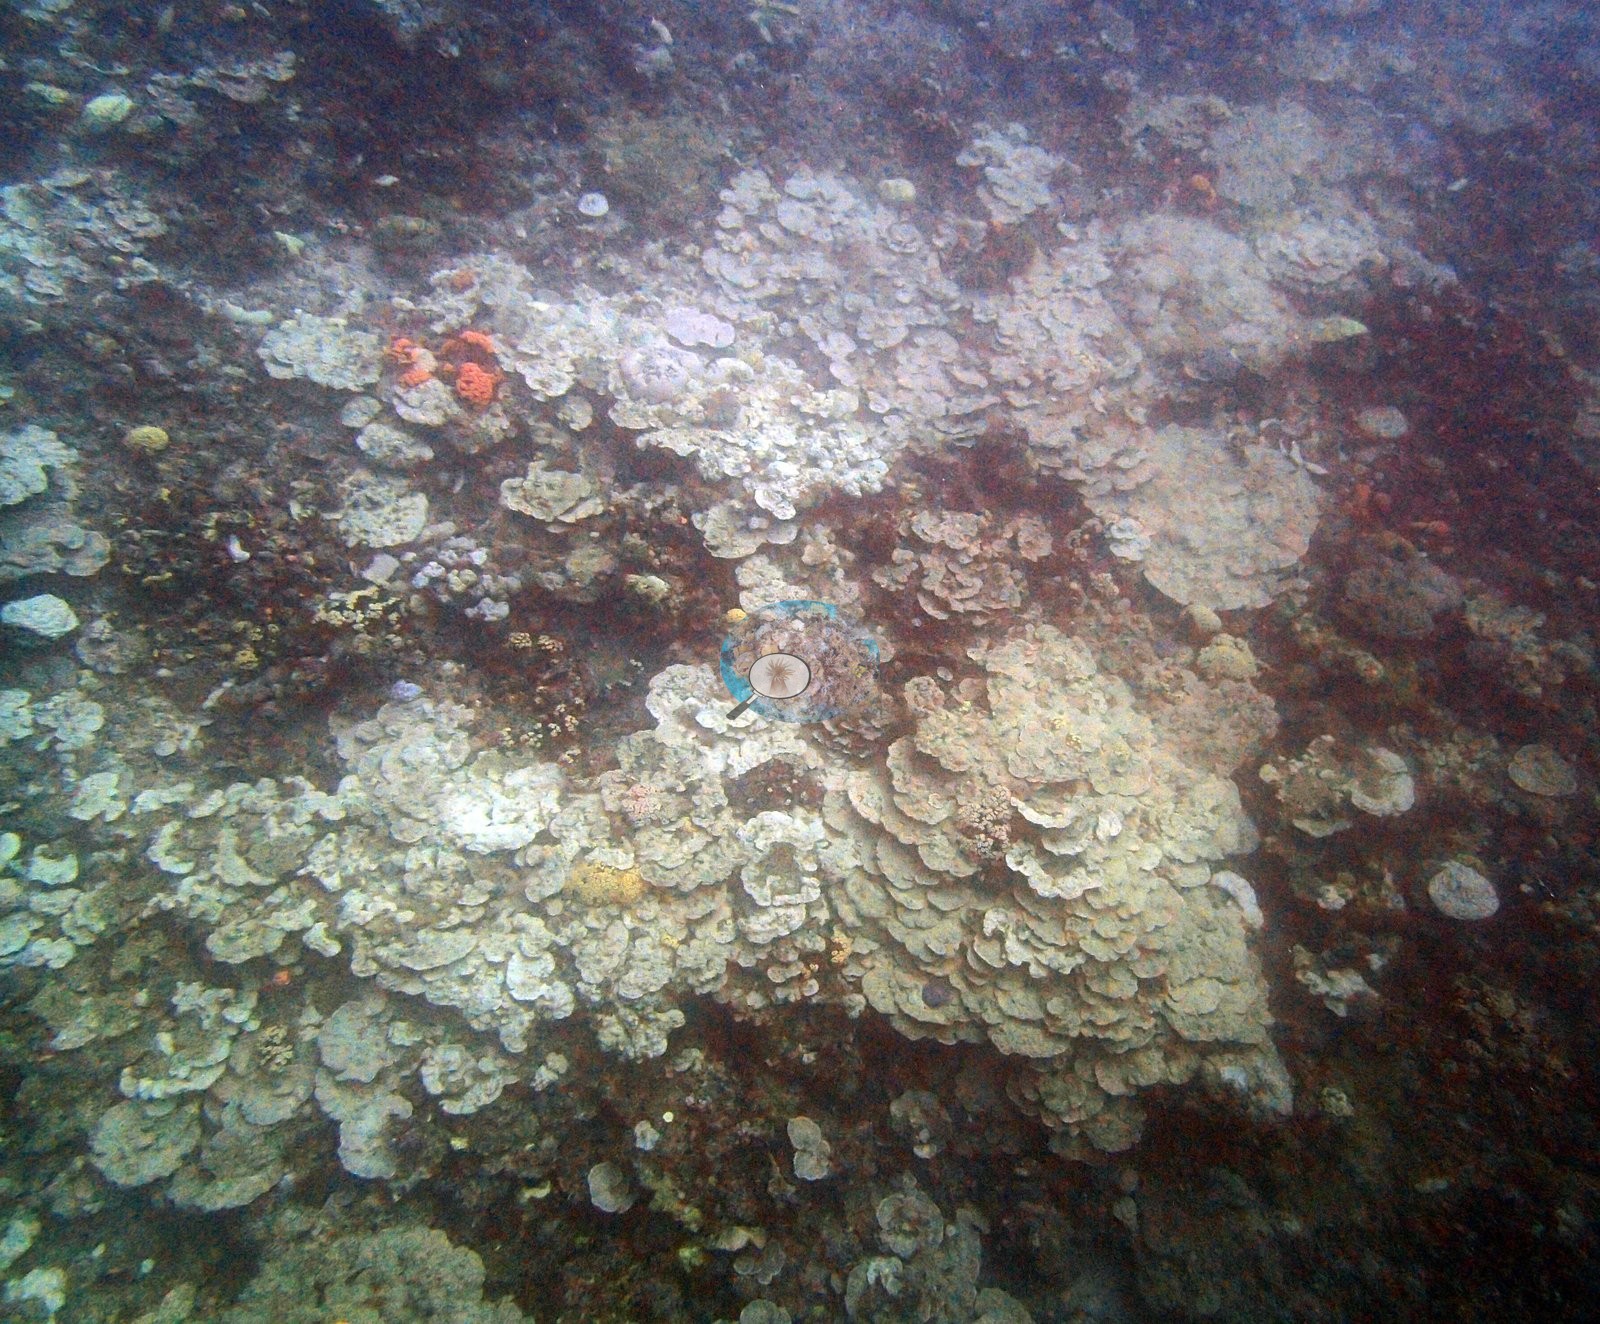
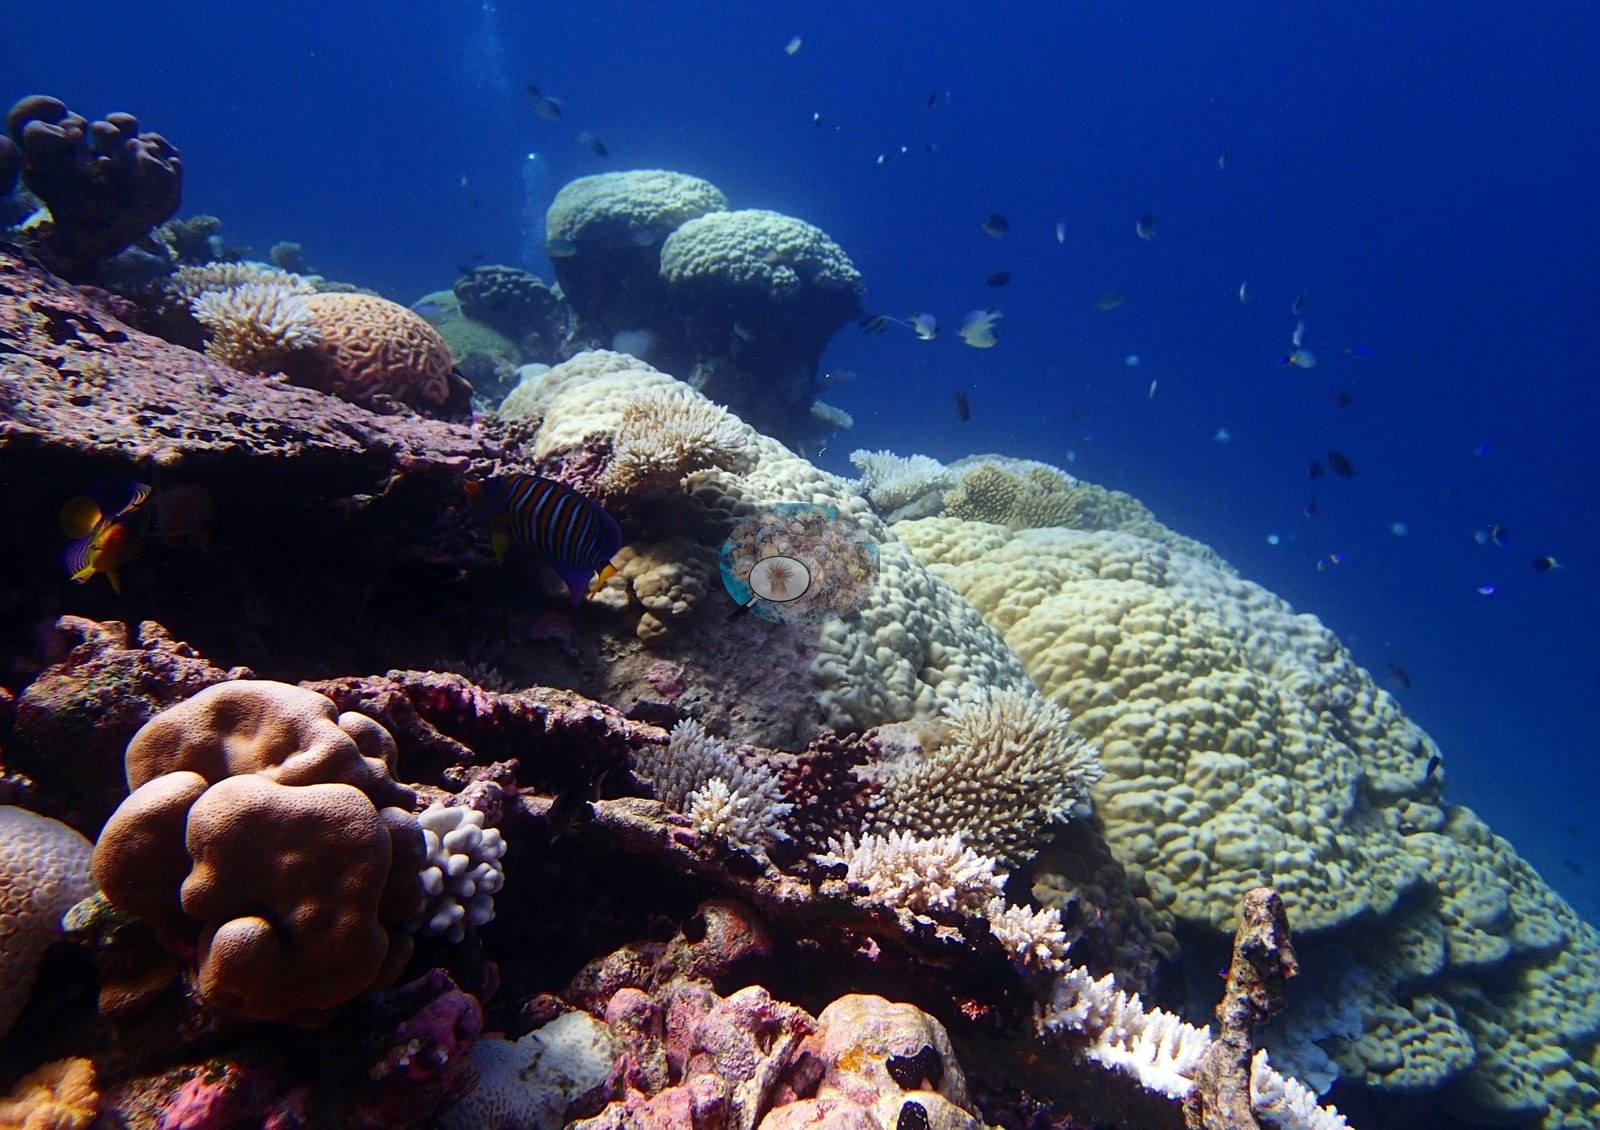
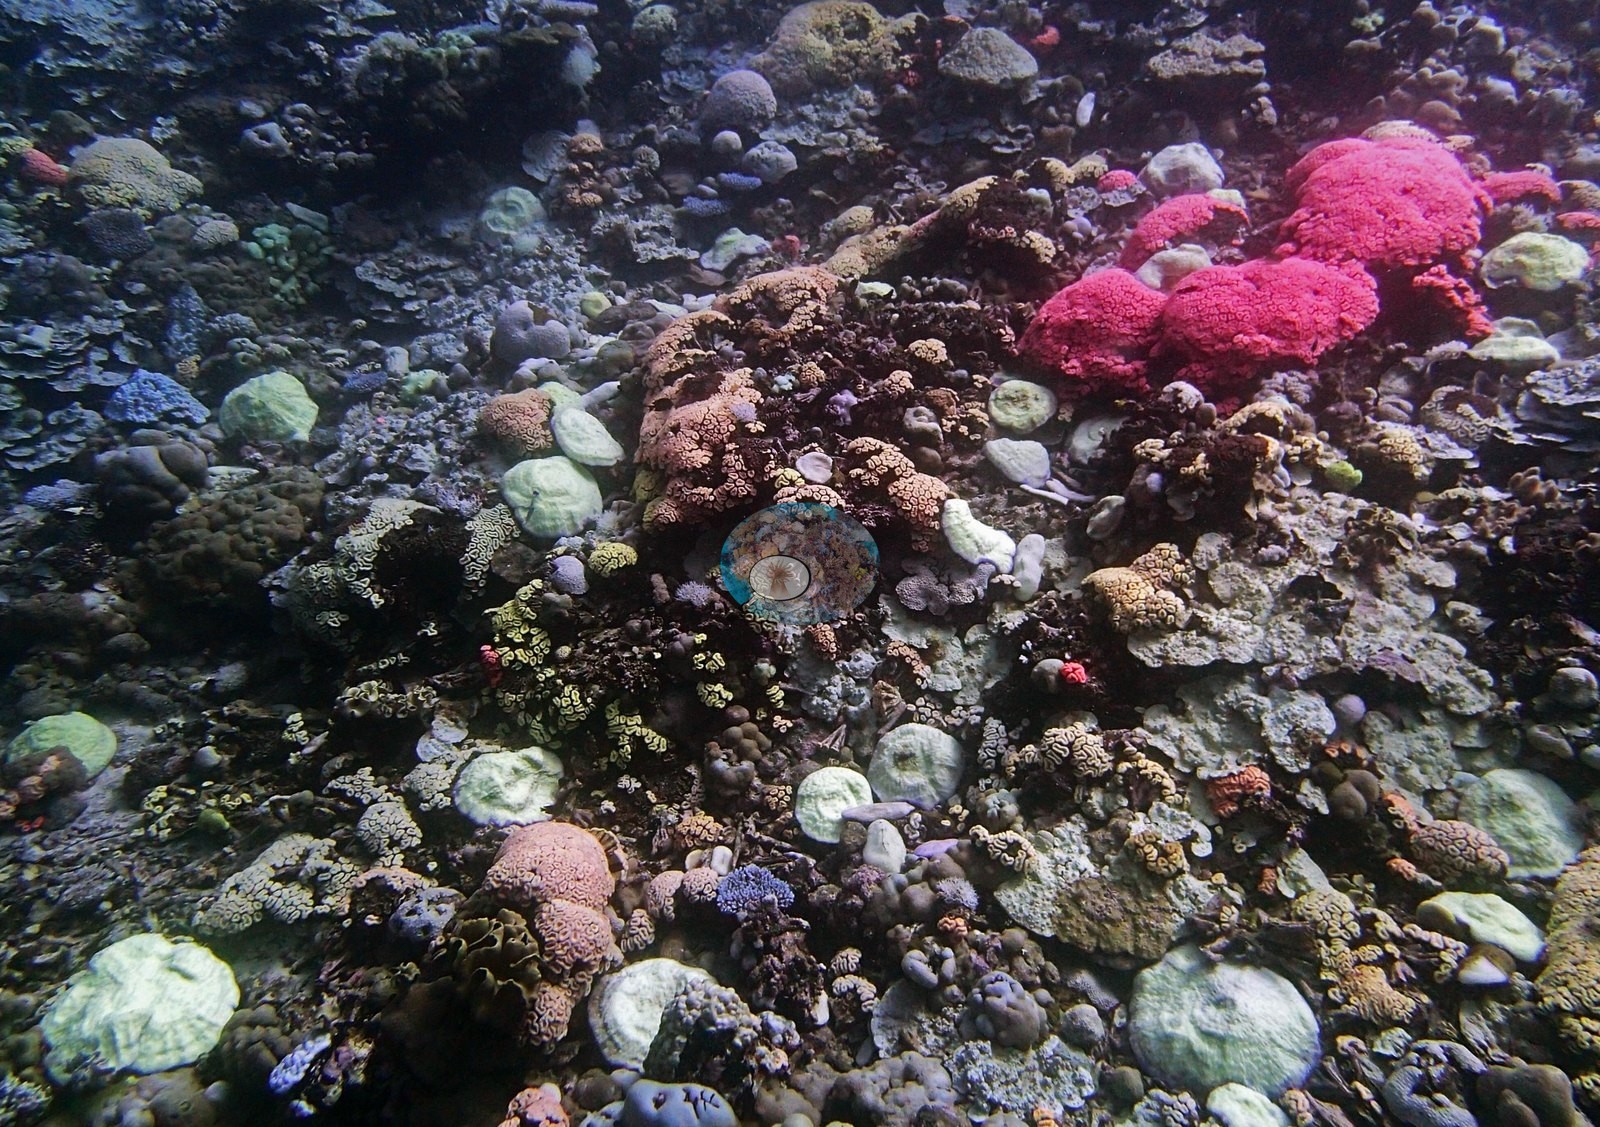
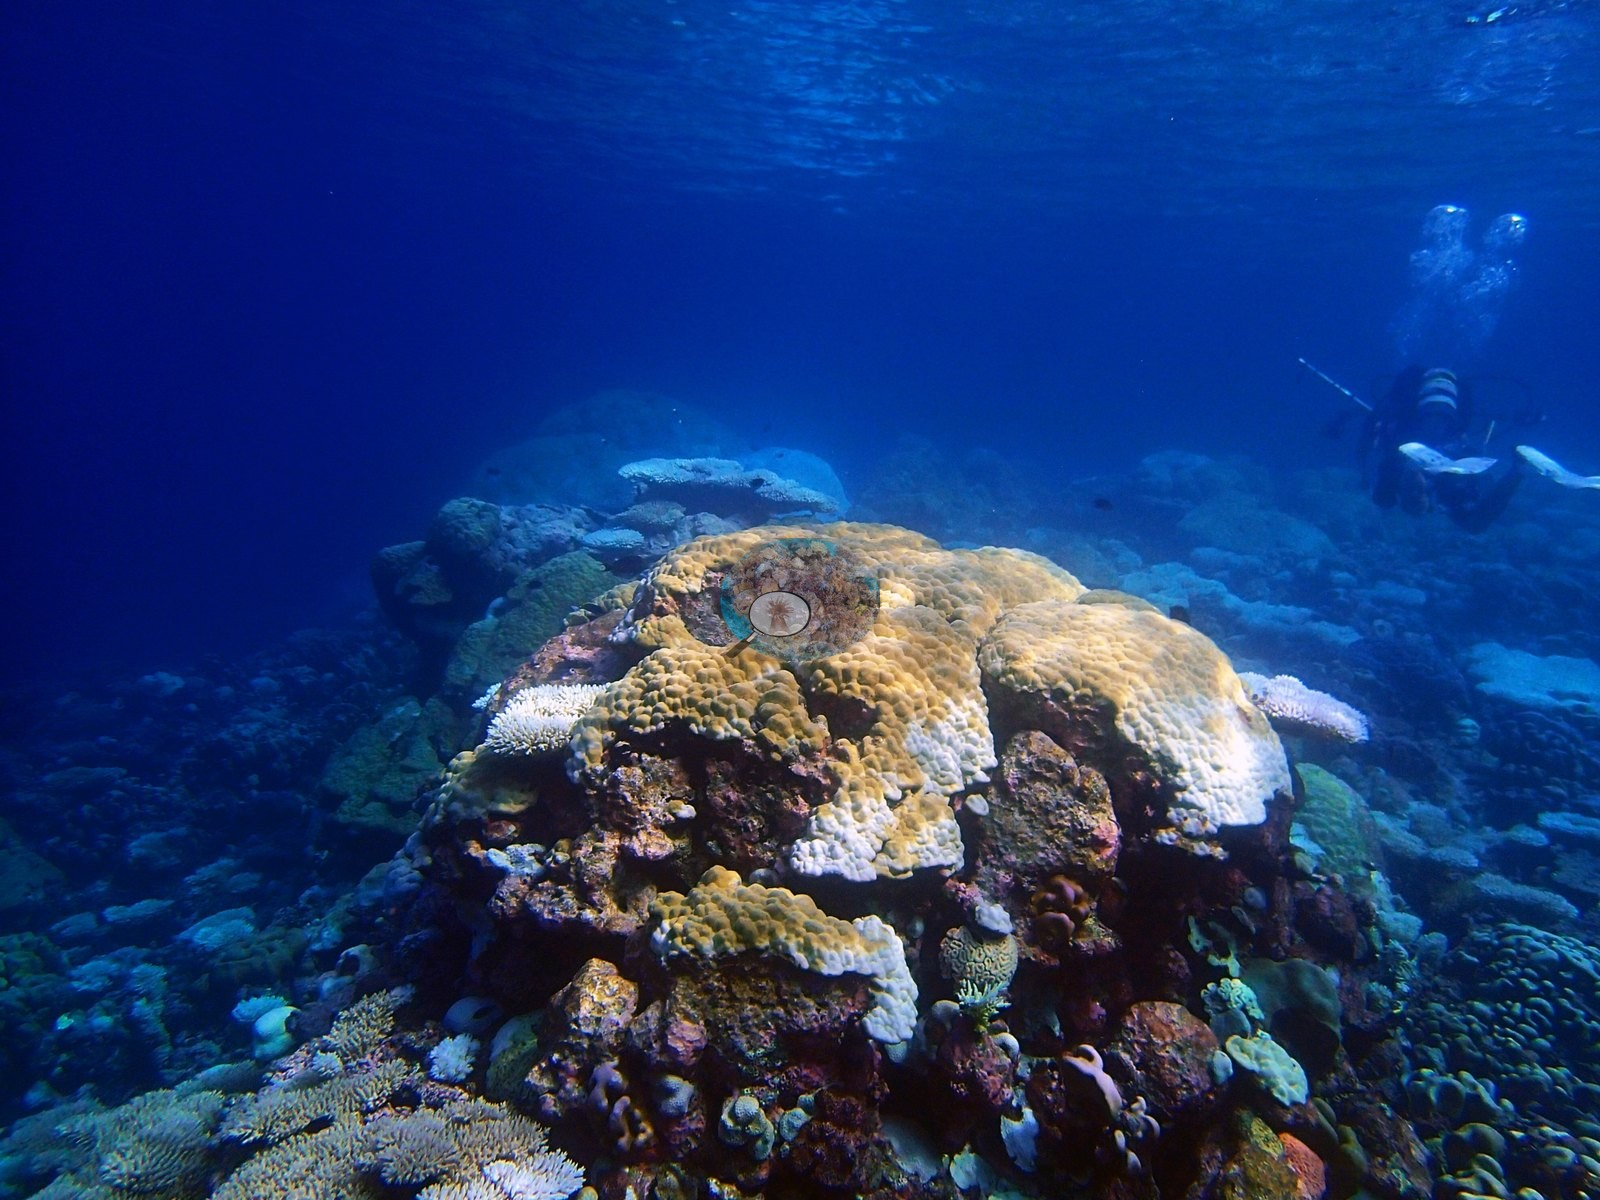
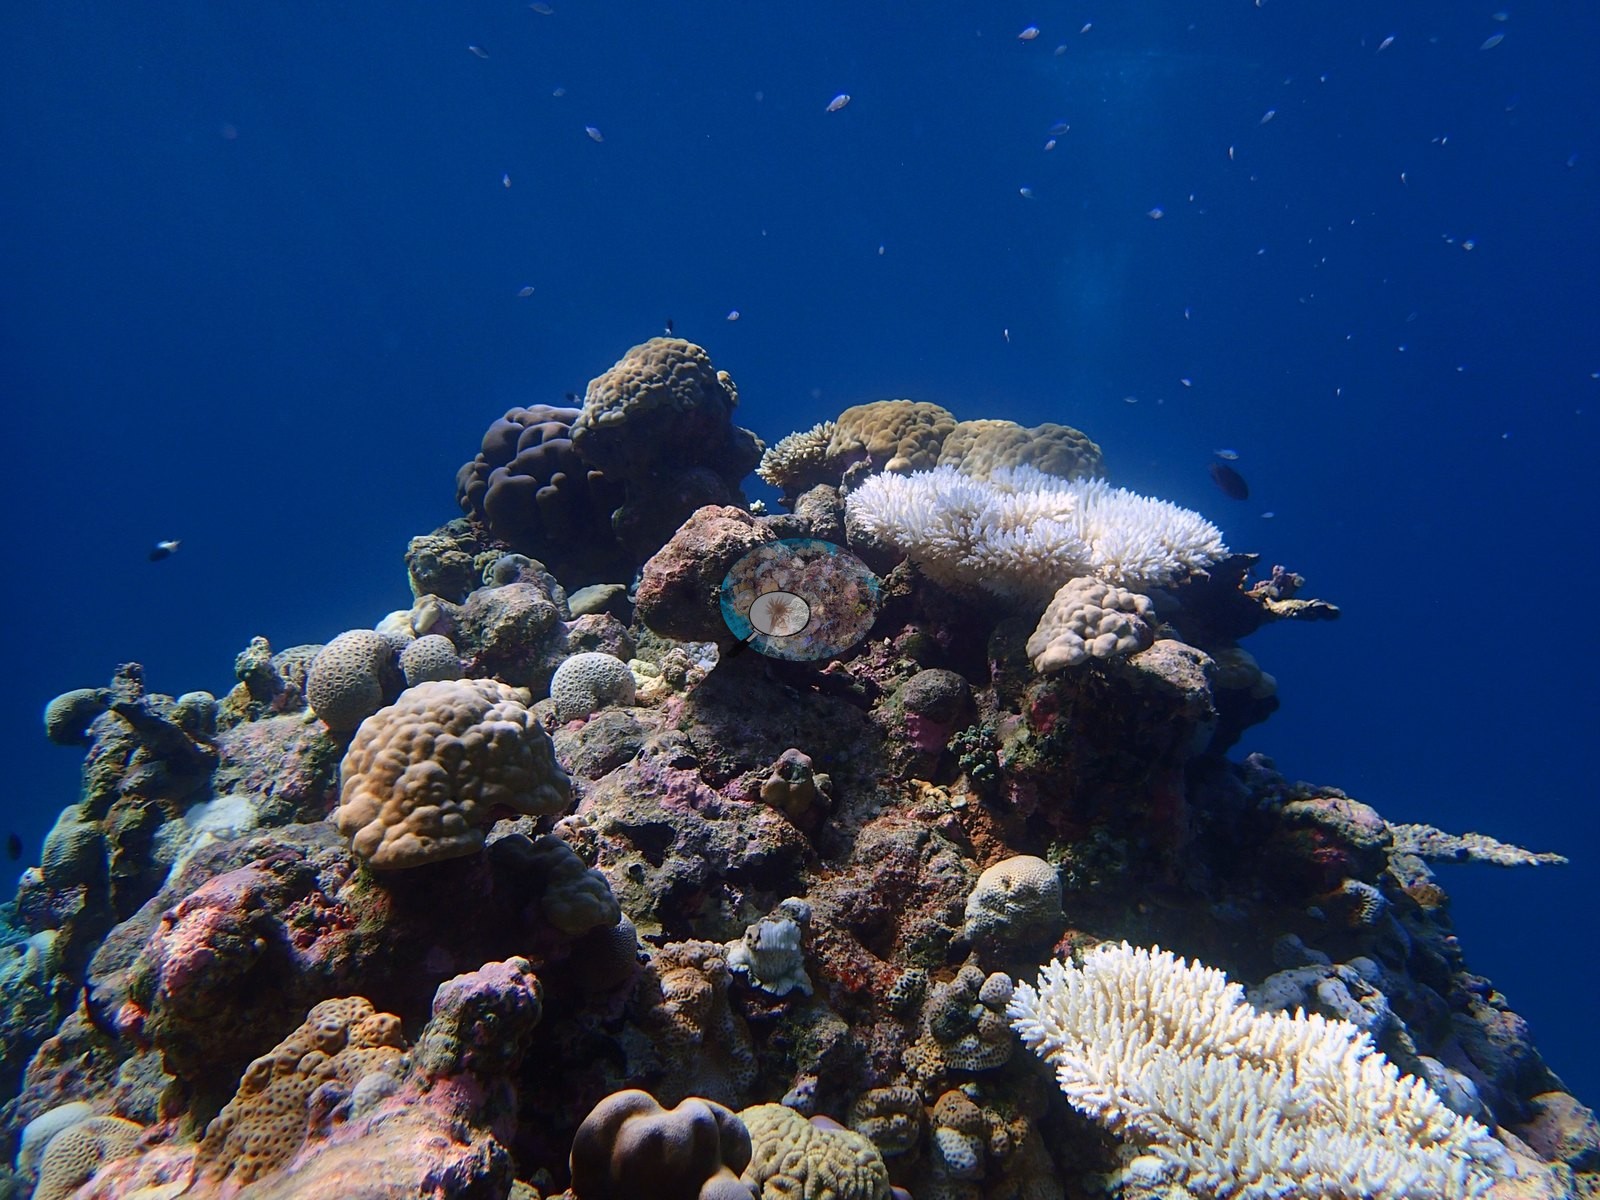
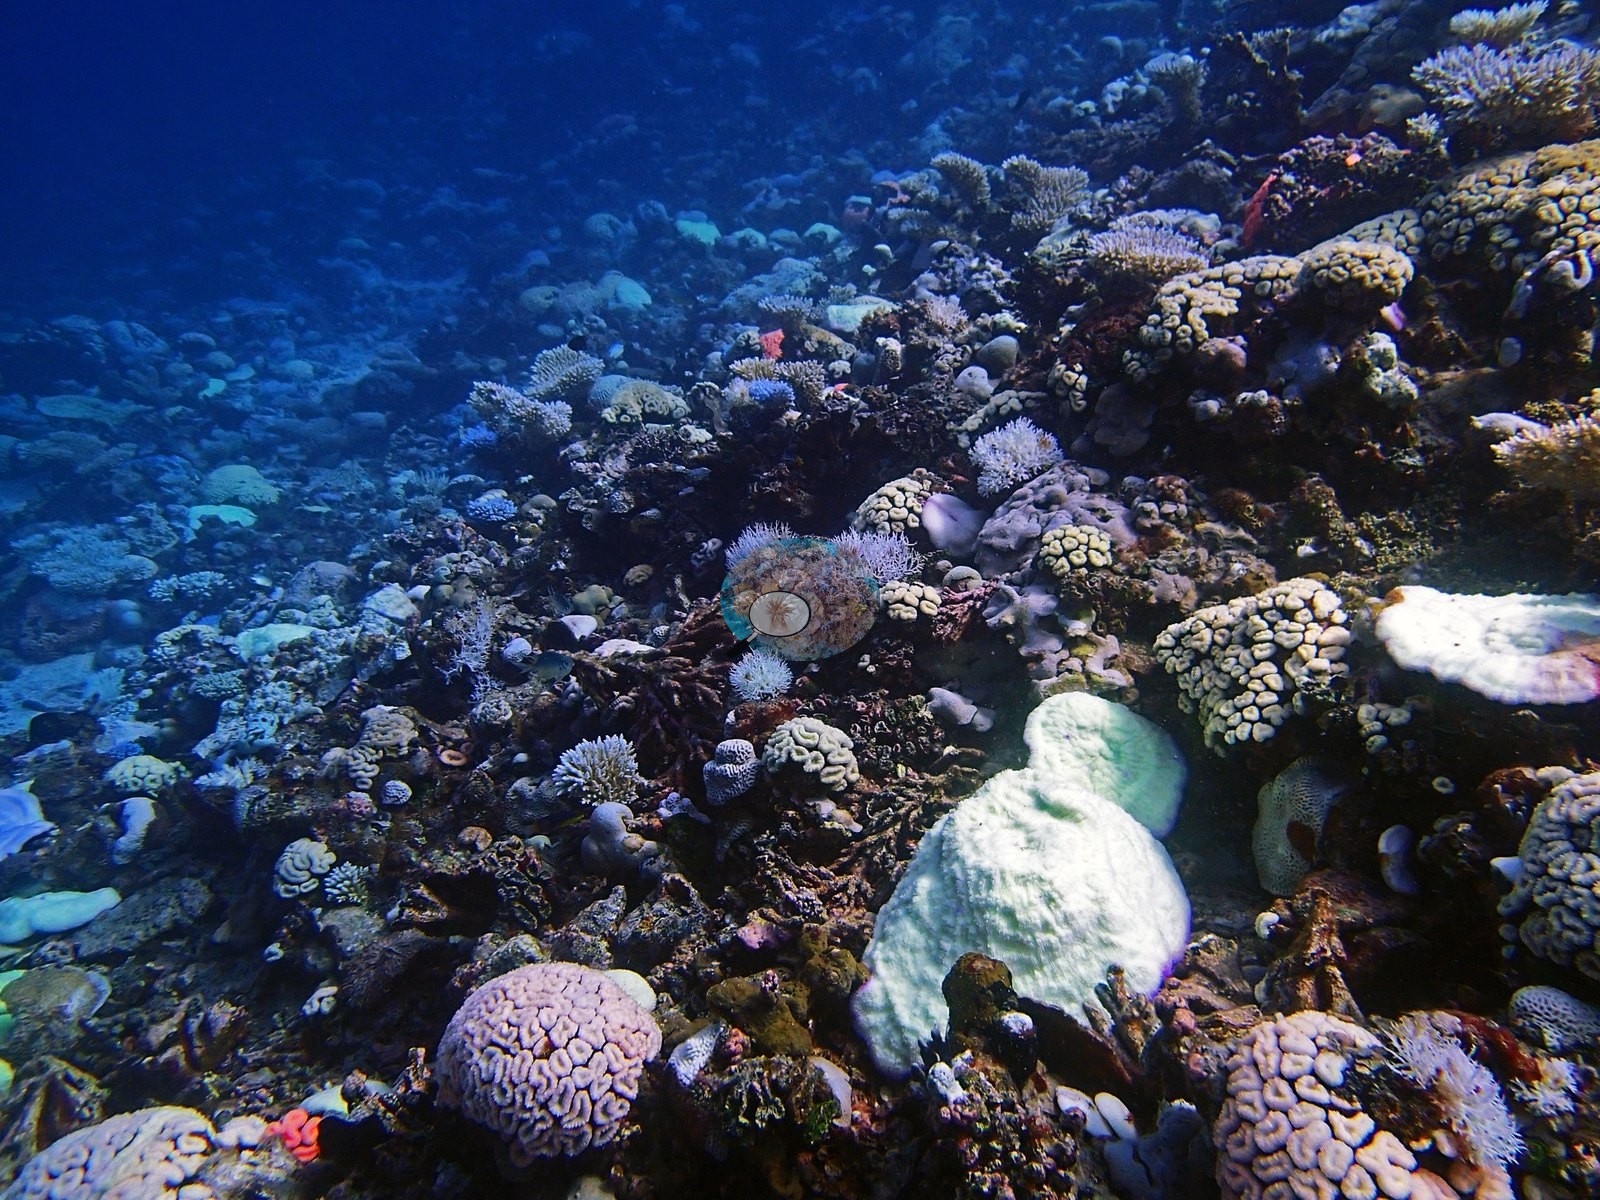
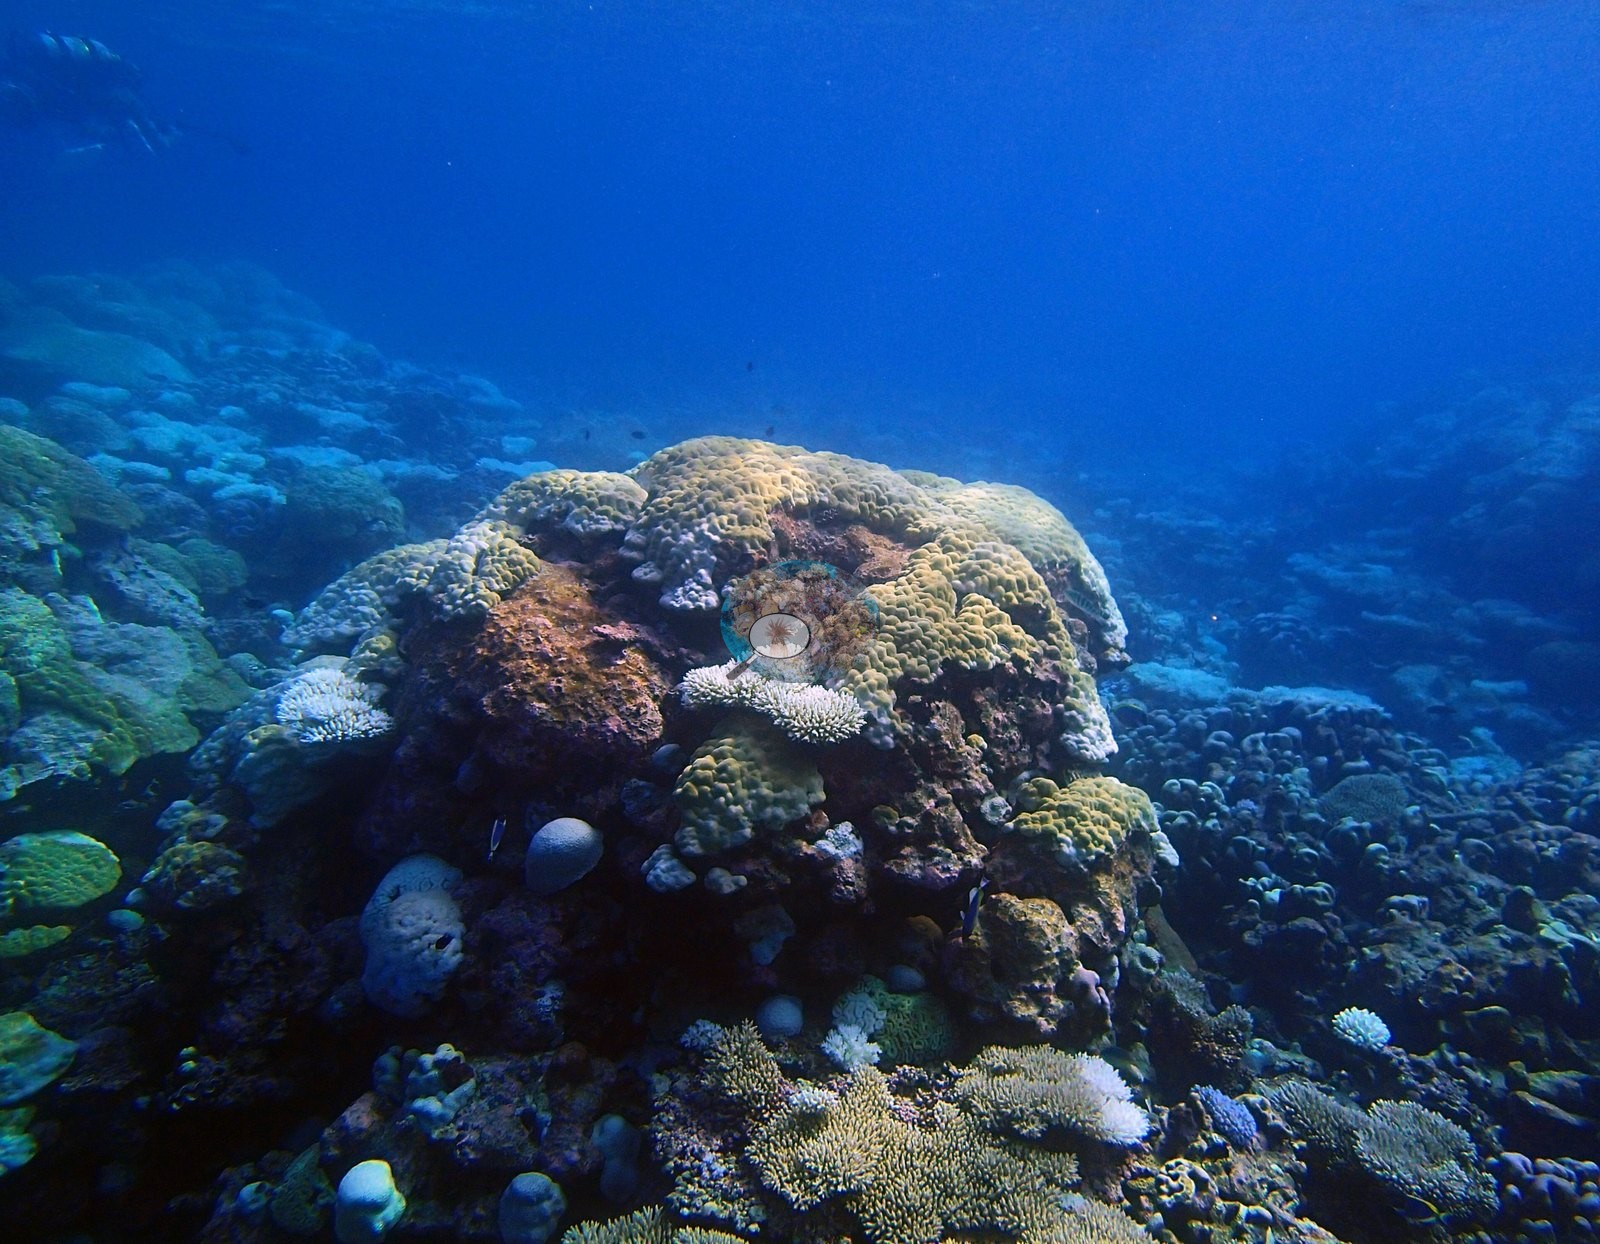
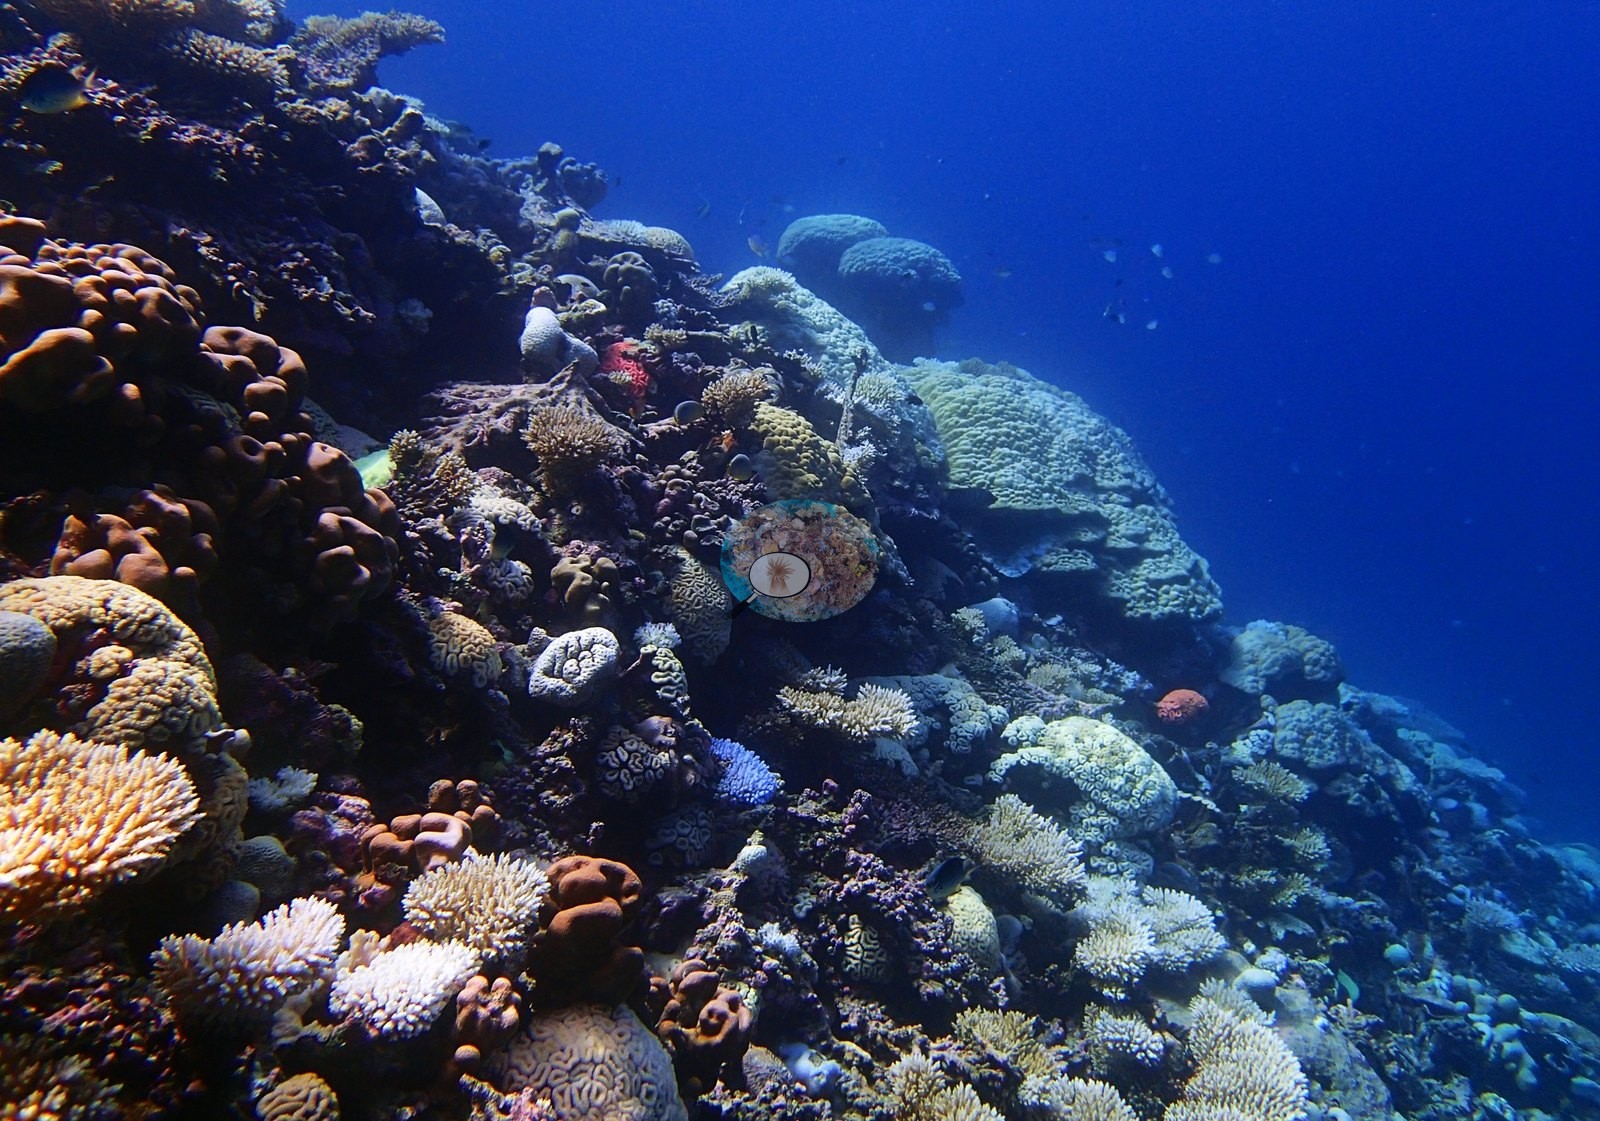
Two more frames show convoluted surfaces with deep crevices providing shelter and shaded microhabitat. One frame emphasizes a pinnacle rising into clear blue water, massive heads around the upper relief, and branching colonies along exposed edges (e.g., Image 4).
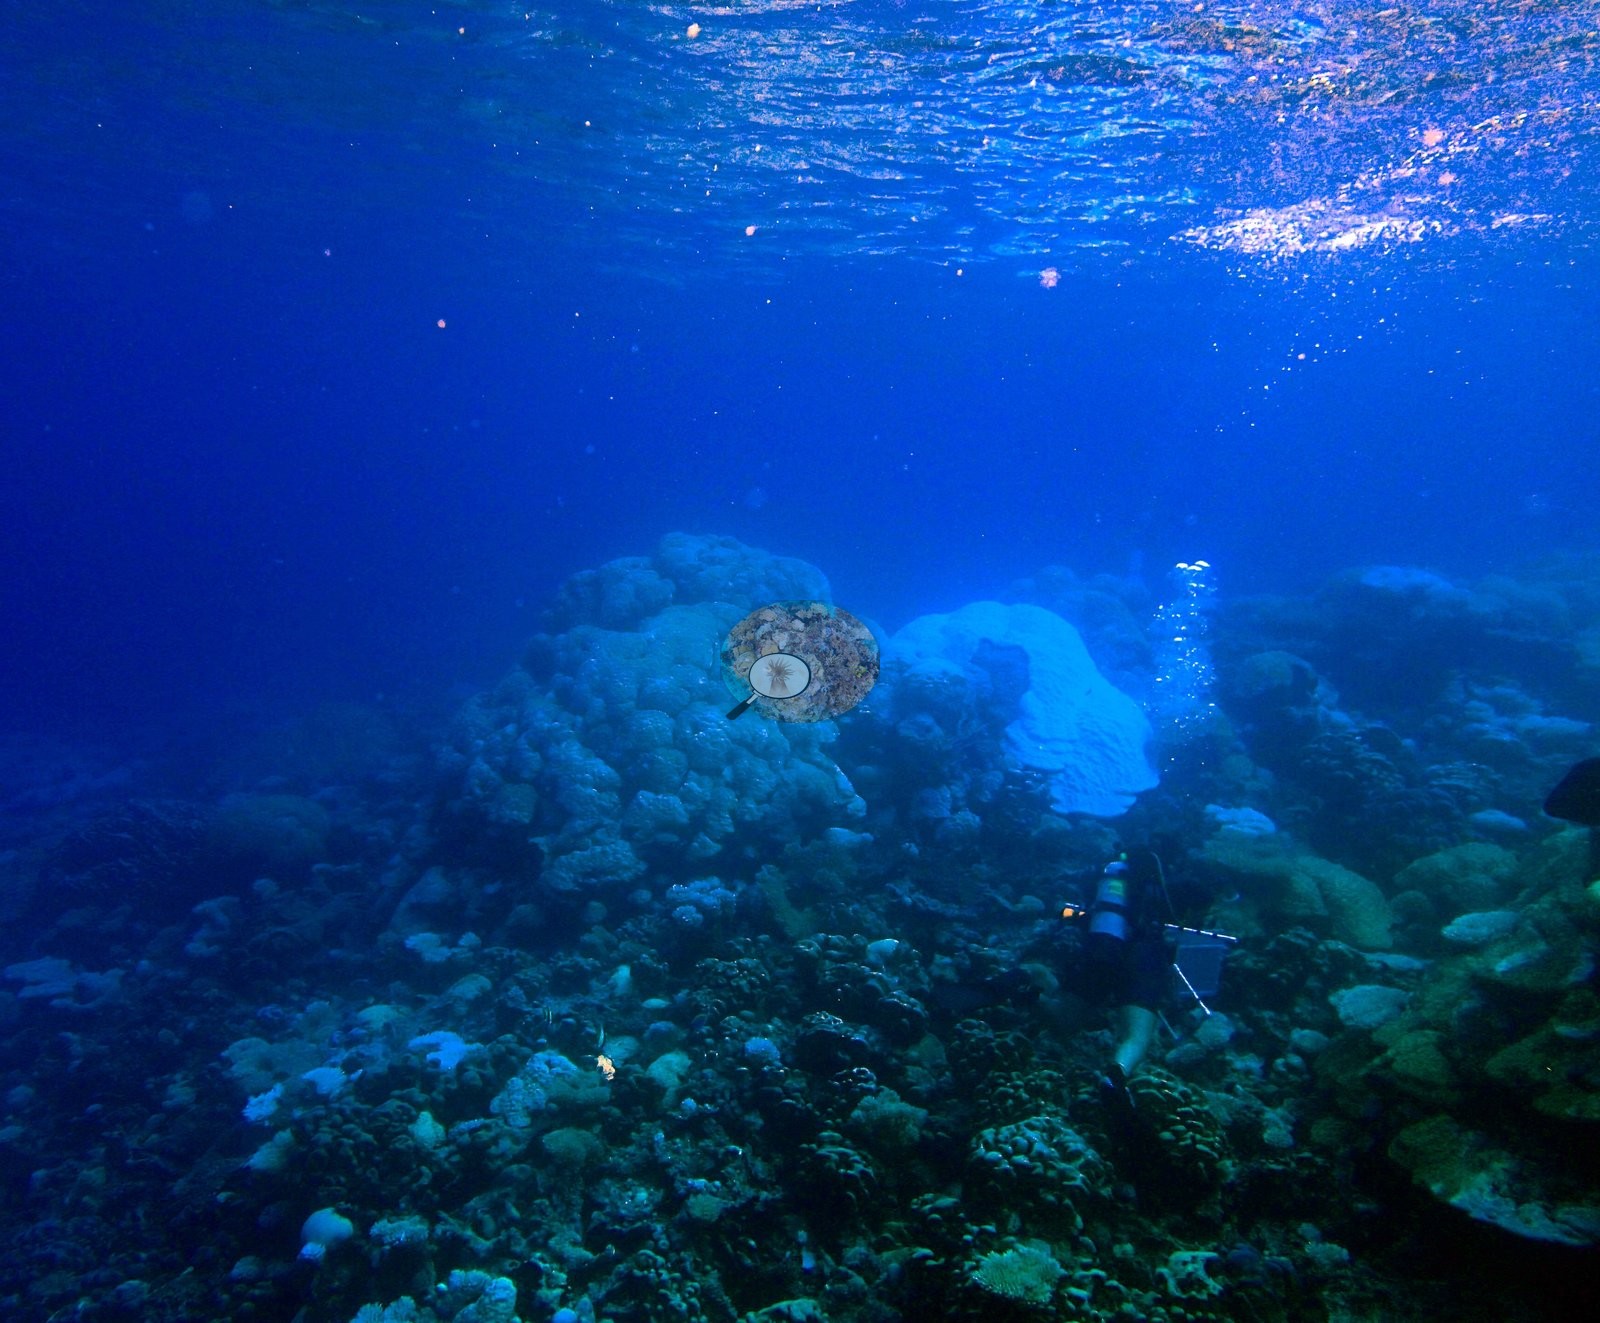
The prominence of massive, lobate, and mound-forming colonies in these frames is the photographic counterpart to a Porites–Lobophyllia–Goniopora assemblage. Non-coral color and texture are conspicuous. Bright magenta, red, and orange encrusting patches occur on vertical faces and shaded recesses, and brown foliose or blade-like growth appears around a pale branching colony in one frame. These are described morphologically because a still photograph cannot securely separate sponge, coralline algae, and other encrusting taxa in every case, but they demonstrate that shaded and exposed microhabitats differ strongly across the outcrop. The photographs document rugged pinnacles, stacked massive and plating colonies, narrow sediment pockets, and colorful encrusted framework under variable visibility, plus localized bleaching in branching colonies.
Coral cover
BISA105 is a high-cover, high-diversity lagoonal patch reef — 50.3% transect coral cover, 23rd of the 109 Chagos sites, carrying 24 non-zero coral genera — and it is emphatically not an Acropora reef. Assemblage composition. Formal surveys give 50.3% coral, 26.6% algae, and 9.2% non-coral invertebrates, the coral led by Porites, Lobophyllia, and Goniopora in a depth-dependent order.
Stressors
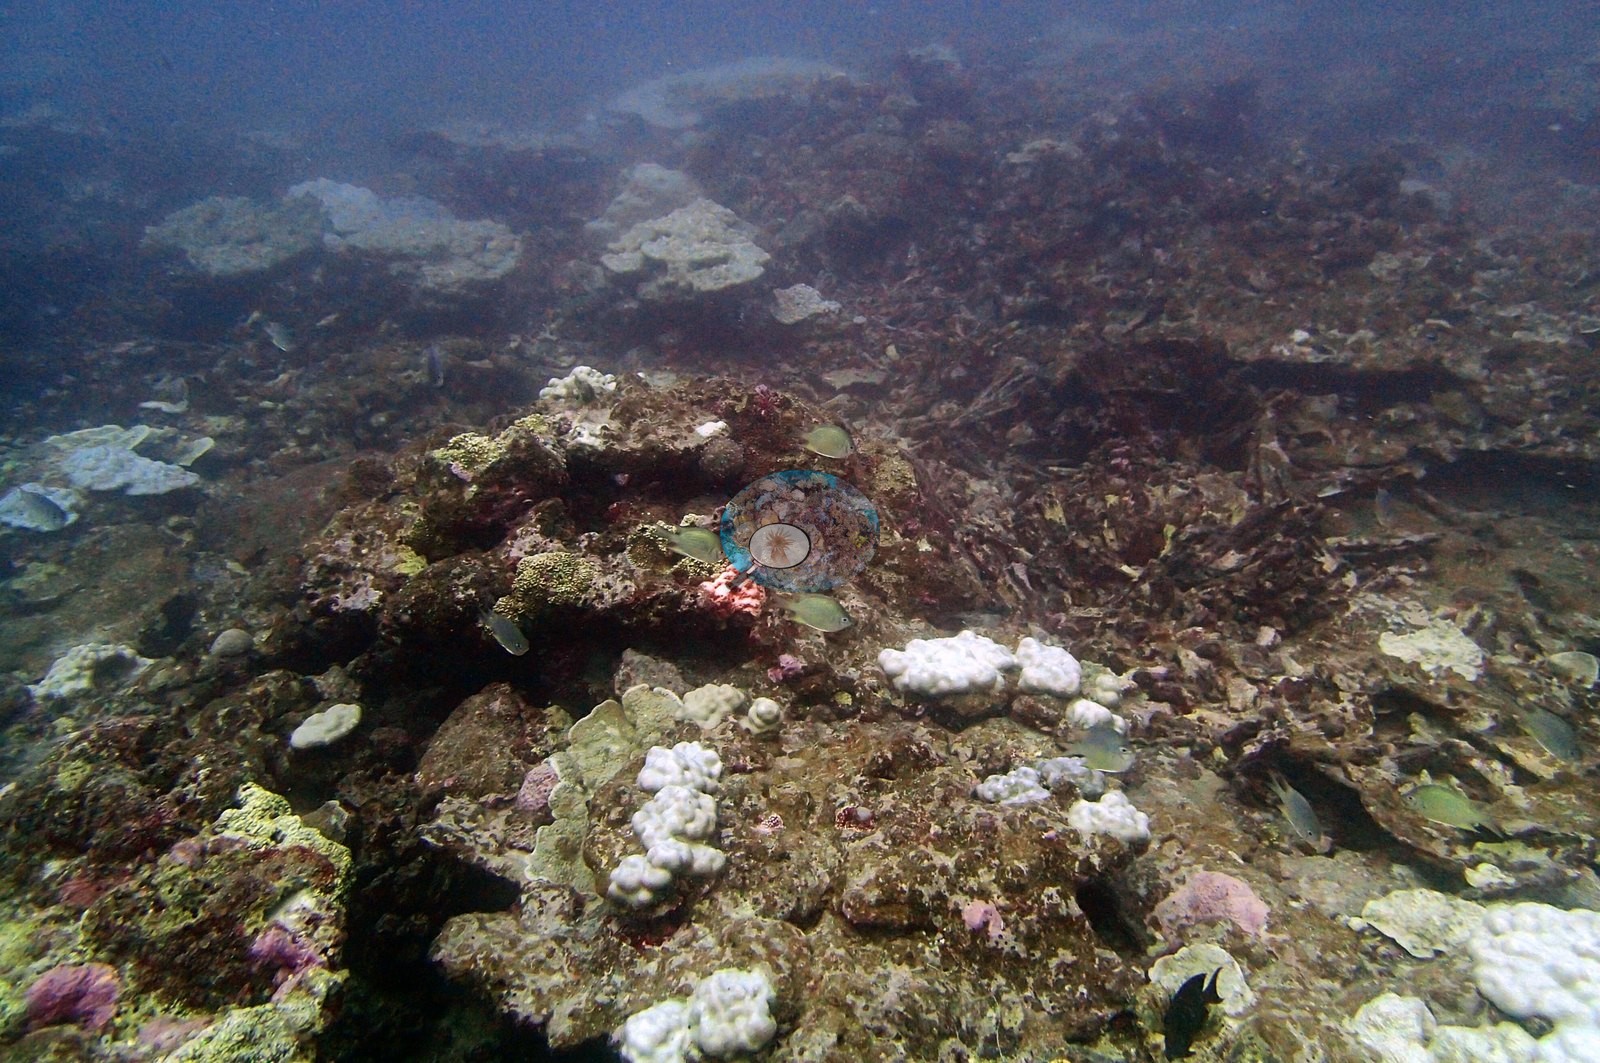
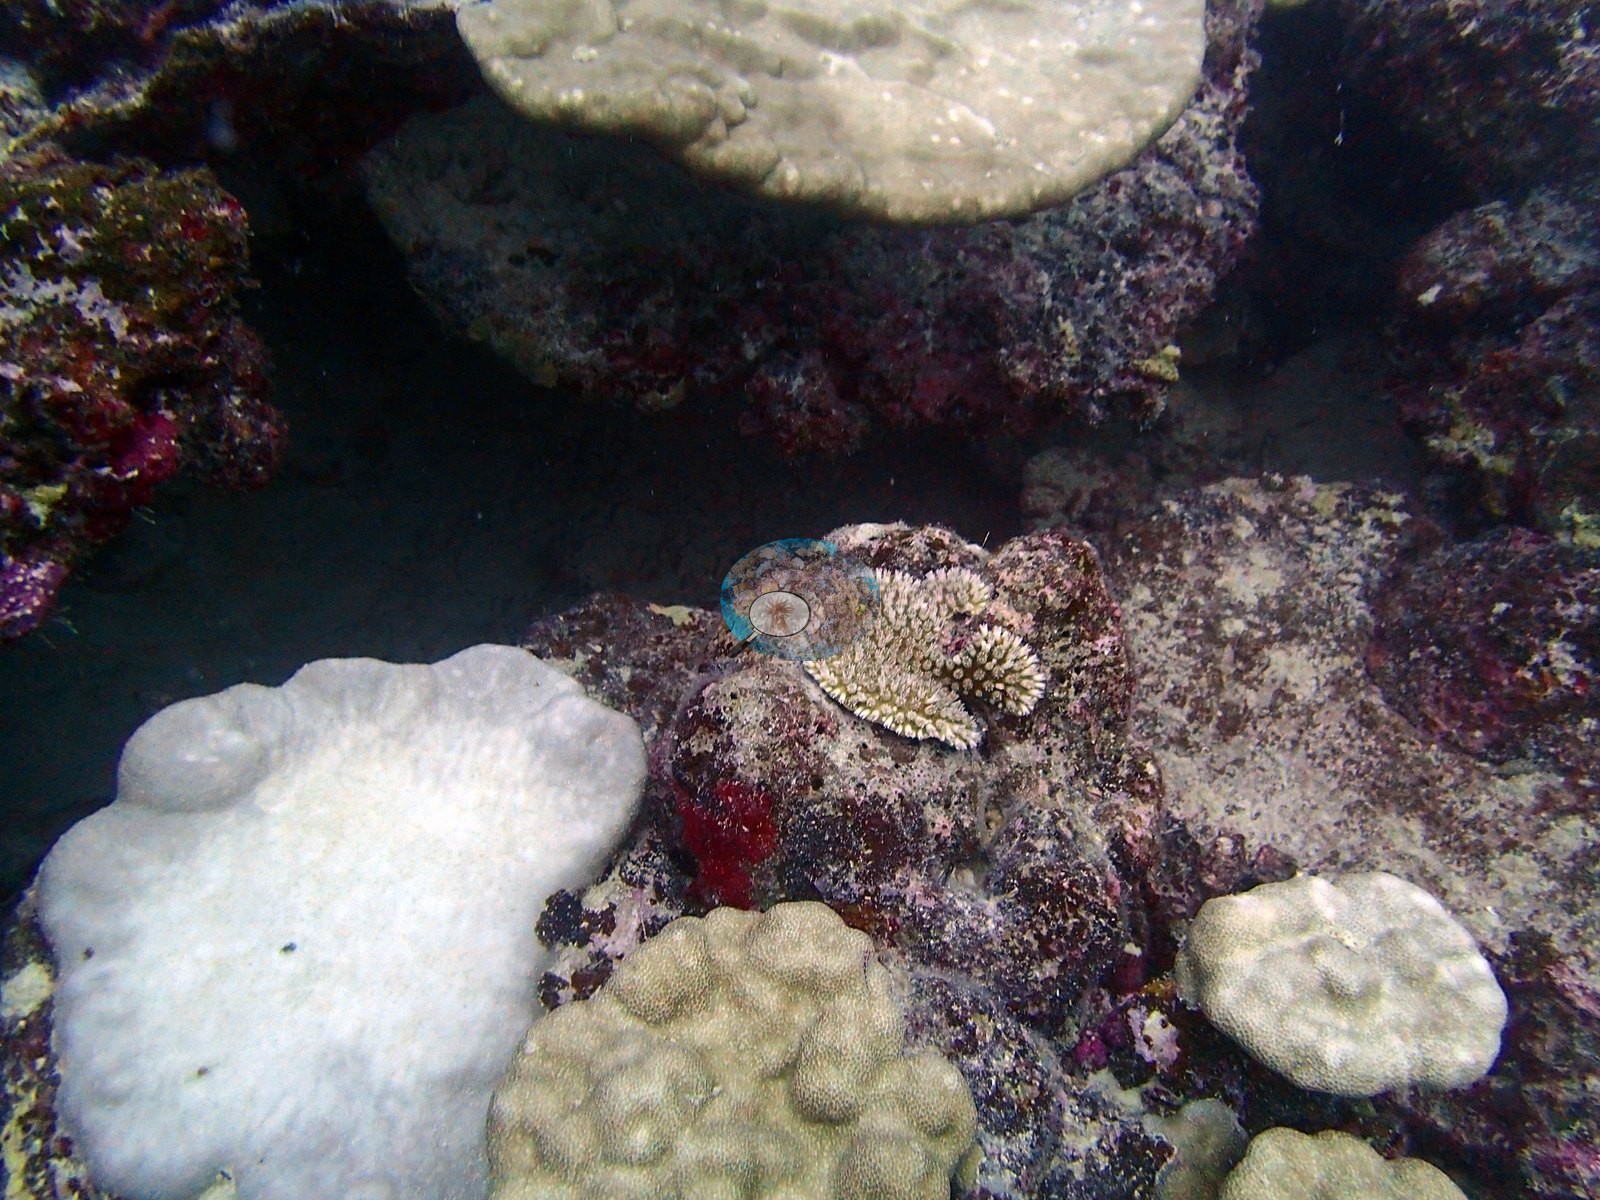
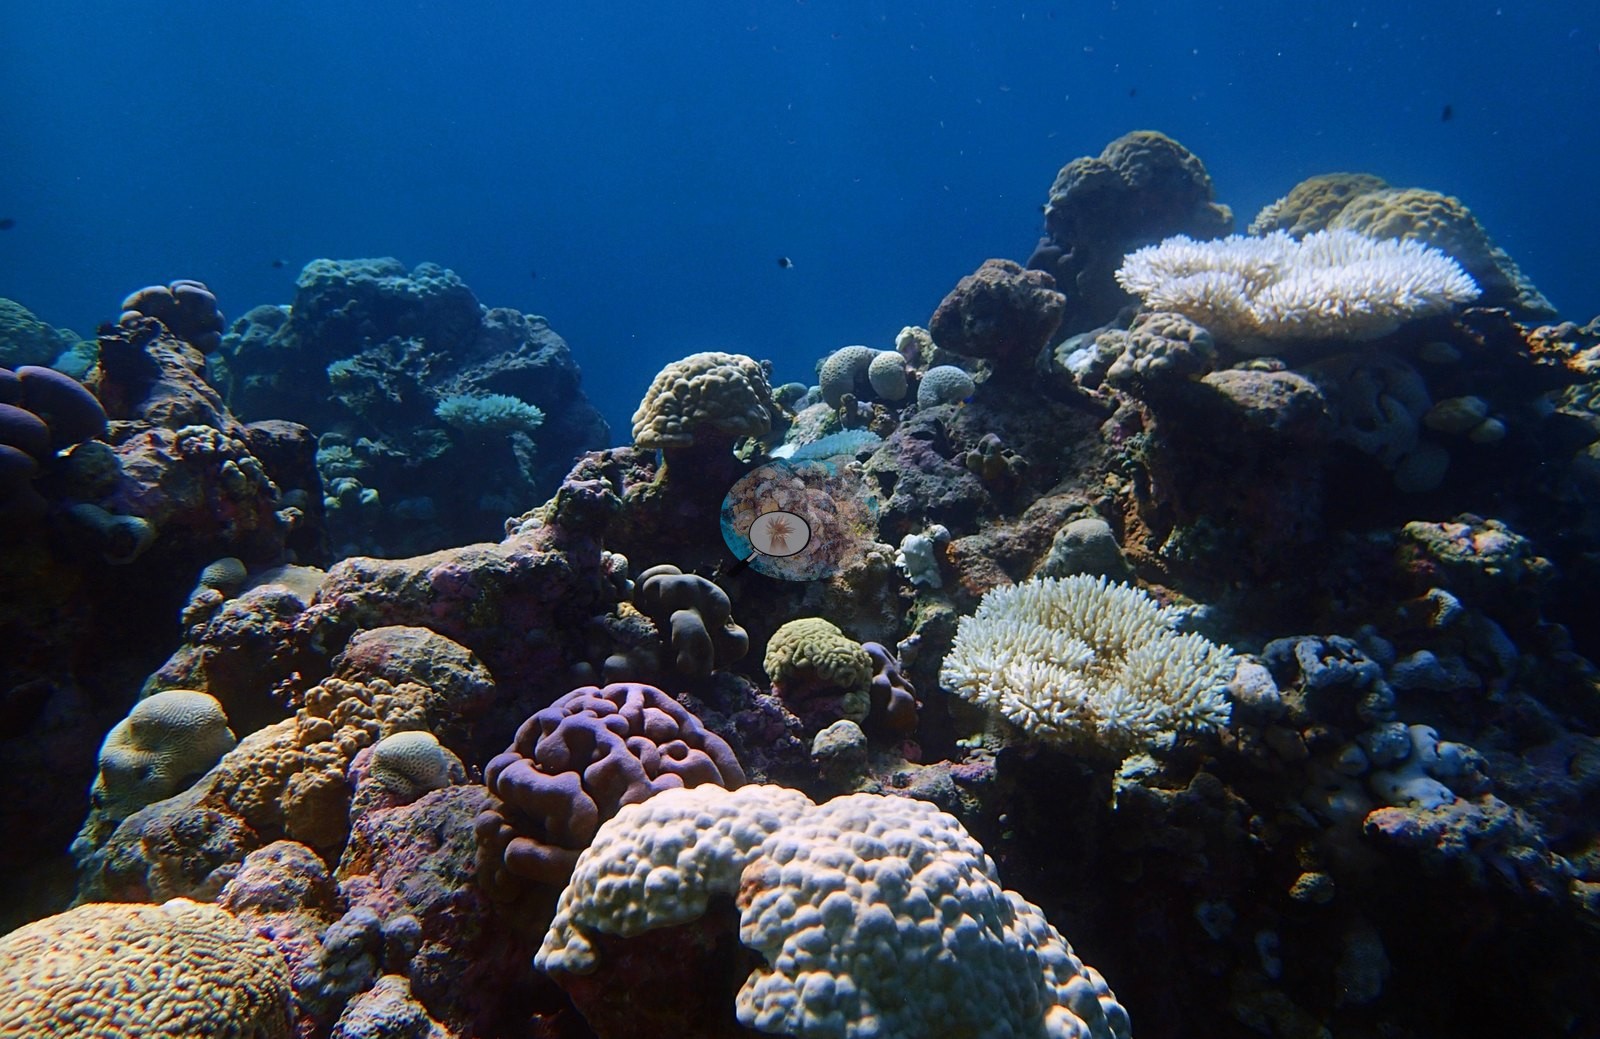
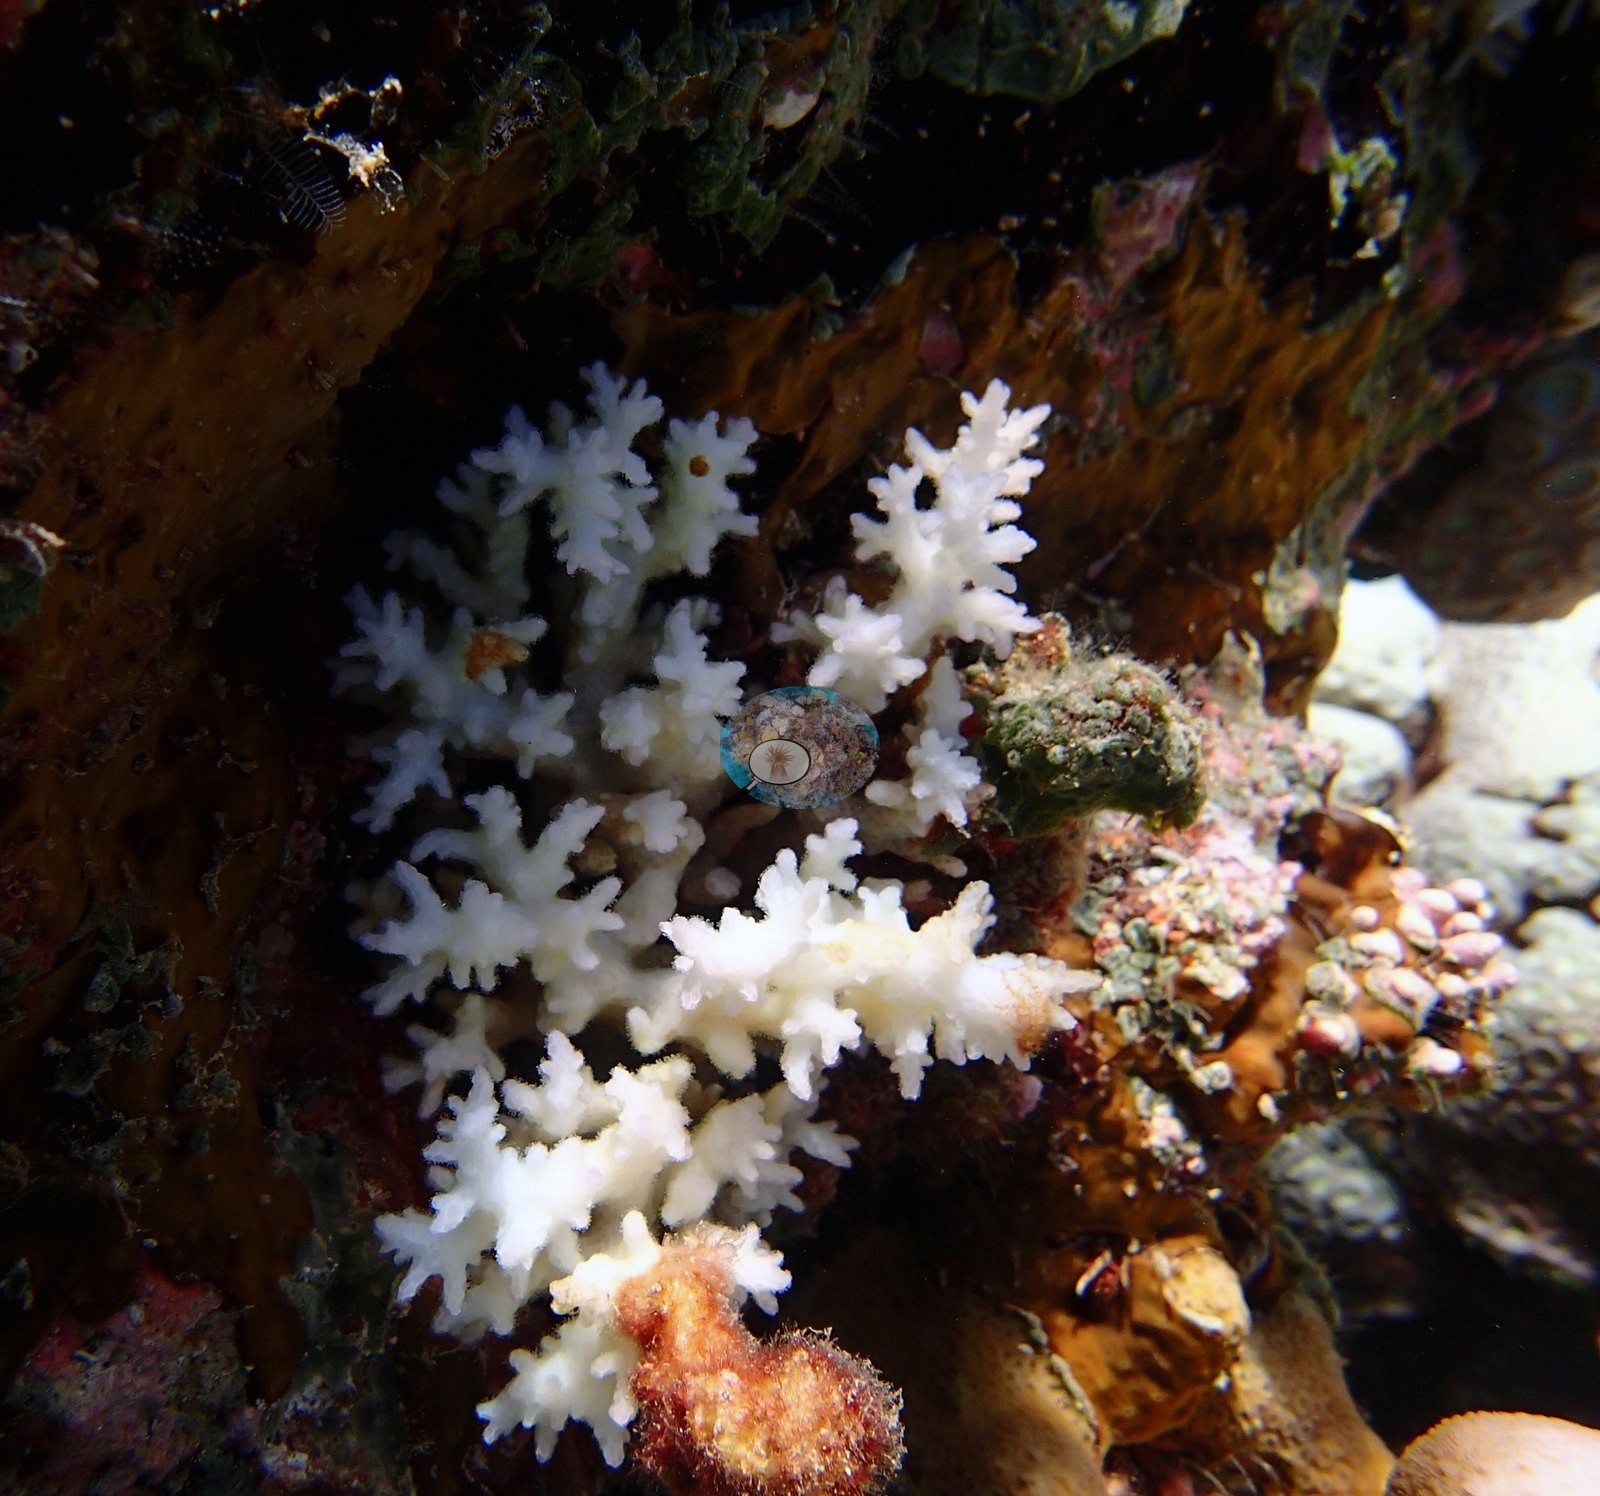
Condition calls are therefore based on coherent tissue pallor across intact colonies rather than isolated bright patches. Bleaching is localized but convincing. One frame shows a branching colony tucked beneath a ledge whose tissue is nearly uniformly white, fine branchlets intact, contrasting with surrounding brown macroalgae and pigmented encrusting surfaces. The pinnacle frame shows two bright branching colonies on a pinnacle contrasting sharply with neighboring brown and tan massive corals, and the next frame gives another angle on pale branches (e.g., Image 3).
Other pale surfaces were deliberately excluded: strobe reflection brightens smooth massive colonies, and exposed skeletal patches and naturally pale growth tips can mimic bleaching. The published site figure of 5.6% ranks 64th of 98 — comparatively low, and consistent with bleaching that is present in several branching colonies without being a site-wide event. No crown-of-thorns starfish (COTS) or other corallivores evident.
Fish and other fauna
Small planktivorous fishes occur against blue water in the pinnacle frame and darker reef fishes move among the crevices in earlier views; the frames are not standardized for fish abundance and no individual can be assumed unique across adjacent photographs.
Comparisons with other data
No independent survey was made at this exact site; the nearest ones are listed in the table below.
CV model comparison
More info
Those are point counts on the photographs; this is a diver swimming a transect. The models and the reference never saw the same thing. ⚠ SITE-LEVEL ONLY. The 2,500 frames were not associated with any transect taken within 200 m of them, so transect-vs-image comparisons are site means, never frames. The transect value is already in the pin `cover` field (109 of 112 pins, sourced to the paper's suppl. S1) and is read from there, never re-imported. The transect is THE coral-cover value for this site and stands alone. The rows below it are a methods comparison only: no computer-vision value is averaged with it, feeds the headline, or carries over to the site's cover figure (Anderson, 2026-09-22).| Method | Hard-coral cover (%) |
|---|---|
| Transect (published) | 50.3 |
| CoralNet | 23.8 |
| In-house DINOv3 | 36.0 |
| CoralSCOP edited | 23.4 |
| Claude | 27.8 |
Independent surveys nearby
| Agency / program | Year(s) | Stations / distance | Link |
|---|---|---|---|
| Lange et al. (2021) | 2006–2020 | 1 station, 2.56 km | Records ↓ |
| MERMAID* | 2020 | 1 station, 2.99 km | Records ↓ |
| Sheppard et al. (2008) | 2006 | 1 station, 1.78 km | Records ↓ |
| Spalding et al. 2025 (Chagos 2024 bleaching report) | 2024 | 1 station, 4.54 km | Records ↓ |
| XL Catlin Seaview Survey | 2015 | 5 stations, 2.04–4.06 km | Records ↓ |
 Dr. Coral (CRD)Year-average (no detectable trend)
Within 5 km, 9 independent survey stations recorded hard coral cover in 25 records between 2006 and 2024. Of the 1 station surveyed in more than one year, 1 declined between their first and latest surveys. The longest record, Salomon Atoll (Lange et al. 2021, 2.56 km away), went from 39% in 2006 to 17% in 2020. One survey since 2021 recorded 65%. This site's own estimate (50%) sits 14.7 points below the recent value (65%); the methods differ, so the comparison is context, not a like-for-like test.
Collected by other programs using different methods (MERMAID is a data platform: each MERMAID row names the organization that did the survey, and its method is in the row's hover text; the XL Catlin Seaview Survey uses photo-transects with automated image annotation. *Conducted by citizen scientists), so these are context for the figures above, not a like-for-like comparison. Where a station was surveyed more than once the range is shown. Station names are not dive-site names.
| Agency | Site / location | Date | Hard coral cover (%) | Distance | Link |
|---|---|---|---|---|---|
| Sheppard et al. (2008) | Salomon | 2006 | 32% (5 surveys) | 1.78 km | HeatCRD database |
| Lange et al. (2021) | Salomon Atoll | 2006–2020 | 6.8–53% (10 surveys) | 2.56 km | HeatCRD database |
| XL Catlin Seaview Survey | transect 36013 | 2015 | 28% | 2.04 km | — |
| XL Catlin Seaview Survey | transect 36018 | 2015 | 22% | 2.99 km | — |
| XL Catlin Seaview Survey | transect 36014 | 2015 | 34% | 3.16 km | — |
| XL Catlin Seaview Survey | transect 36015 | 2015 | 28% | 3.51 km | — |
| XL Catlin Seaview Survey | transect 36016 | 2015 | 19% | 4.06 km | — |
| MERMAID* | Salomon 219 | 2020 | 30% (4 surveys) | 2.99 km | MERMAID |
| Spalding et al. 2025 (Chagos 2024 bleaching report) | Salomon - Boddam Lagoon (N, 1-4 m) | 2024 | 65% | 4.54 km | — |
Data & links
- Read the full site report ↗
- Download benthic survey data (CSV) ↗
- Download all LOF-GRE data (933 sites) ↗
- CoralNet image repository for this region ↗
- HeatCRD database ↗
- (reference) ↗
- Photo portfolio ↗
- Coral Reef Diagnostics page for this area ↗
All images from Coral Reef Diagnostics. Data are from Coral Reef Diagnostics and the organizations named in the data-sources table above.
 © Coral Reef Diagnostics.
References
- Mayfield AB, Dempsey AC (2026). Using tourist diver images to estimate coral cover and bleaching prevalence in a remote Indian Ocean coral reef system. Oceans 7(1):1. PDF
- Sheppard C, Harris A, Sheppard A (2008). Archipelago-wide coral recovery patterns since 1998 in the Chagos Archipelago, central Indian Ocean. Marine Ecology Progress Series 362:109-117. PDF
- Lange ID, Benkwitt CE, McDevitt-Irwin JM, Tietjen KL, Taylor B, Chinkin M, et al. (2021). Wave exposure shapes reef community composition and recovery trajectories at a remote coral atoll. Coral Reefs 40:1819-1829. PDF
- Spalding M, Bourasseau M, et al. (2025). Coral bleaching and mortality in the Chagos Archipelago, 2024. British Indian Ocean Territory Administration report (gray literature). PDF