
Part of the regional summaries: Chagos Archipelago - Salomon / Blenheim / Speakers Bank and Chagos Archipelago
More info
Chagos (NOAA CRW virtual station)A Salomon reef with a broad mix of 28 coral genera led by Porites, with an unusual branching component of Stylophora and Pocillopora, at 33% cover that halves from the shallows to depth. Its standout number is bleaching: 24.1%, the fourth-highest of 98 Chagos sites. Surveyed on the Living Oceans Foundation's Global Reef Expedition.
Two independent survey stations shown with the program’s logo — click one to see how far it is from this site.
Seven other CRD dive sites within 5 km shown in orange — click a marker to open its page.
🗺 Detailed map of the Global Reef Expedition dive sites, Salomon Atoll, Chagos (Khaled bin Sultan Living Oceans Foundation; opens in a new window)
4 of these 19 photographs are shown beside the text that discusses them under "Site description" below.
Site description
General benthic features
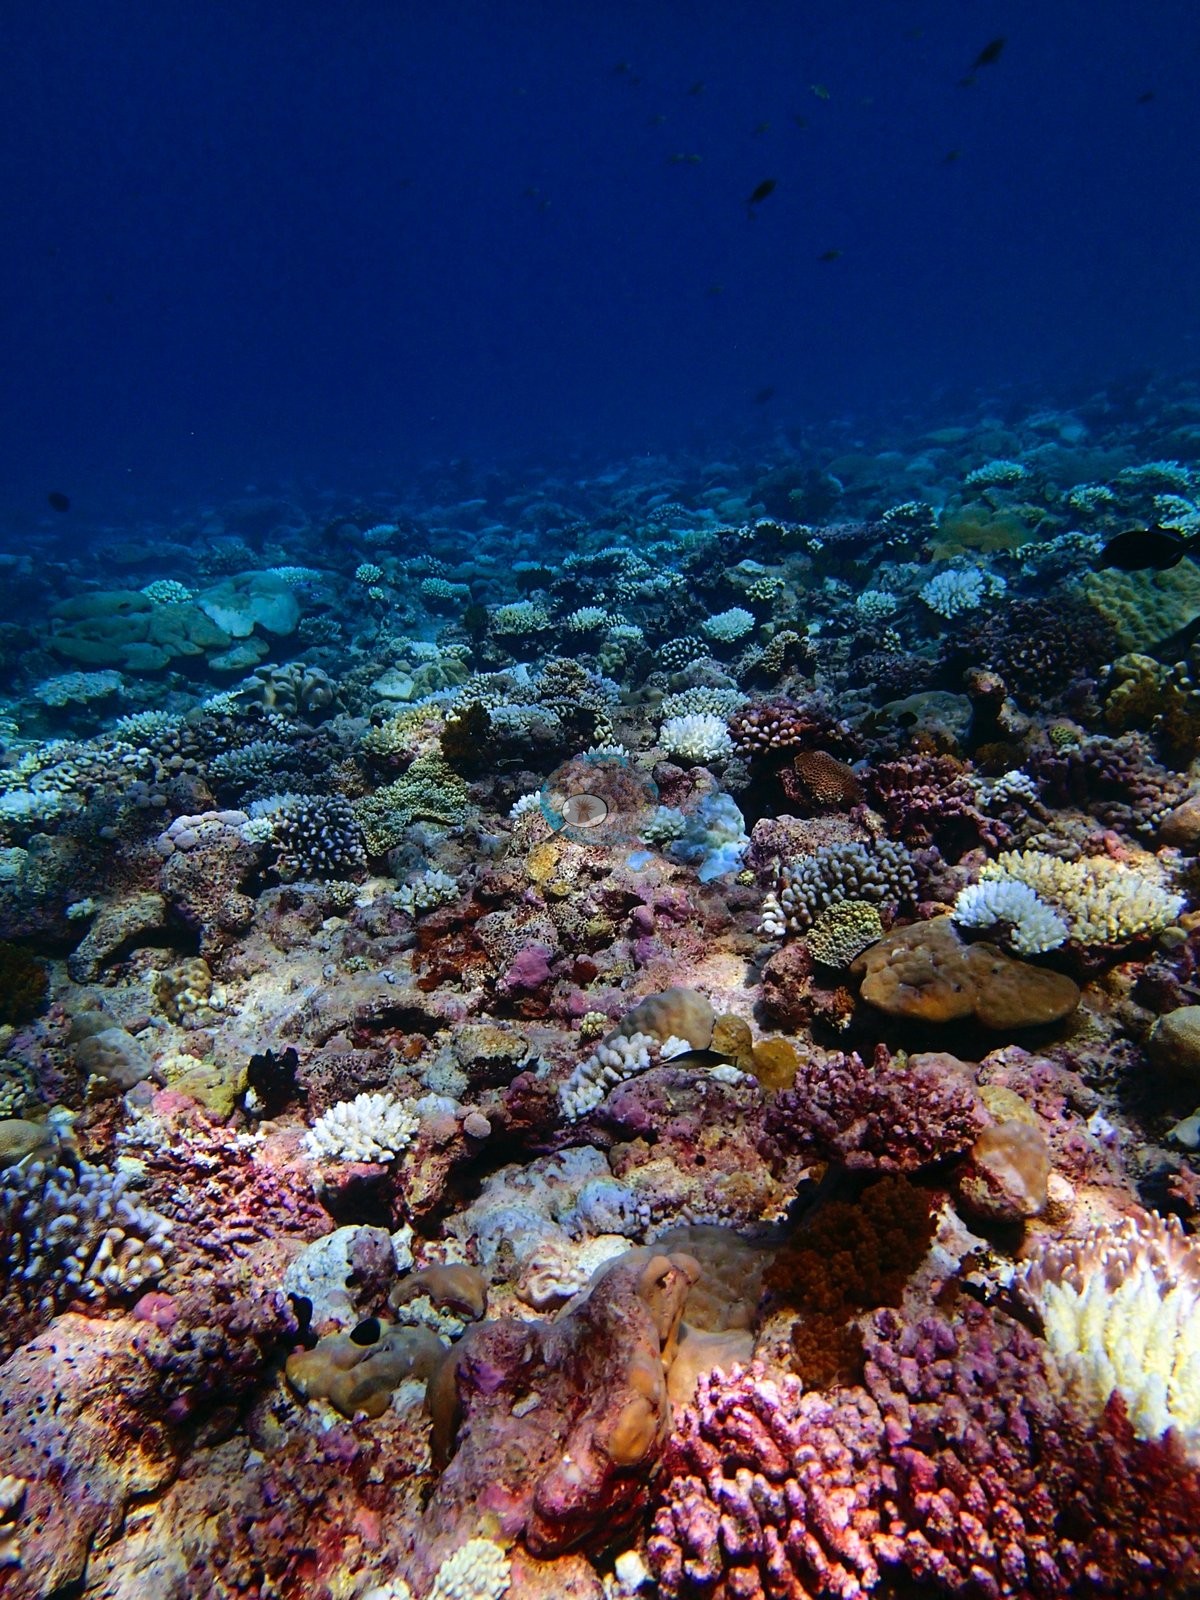
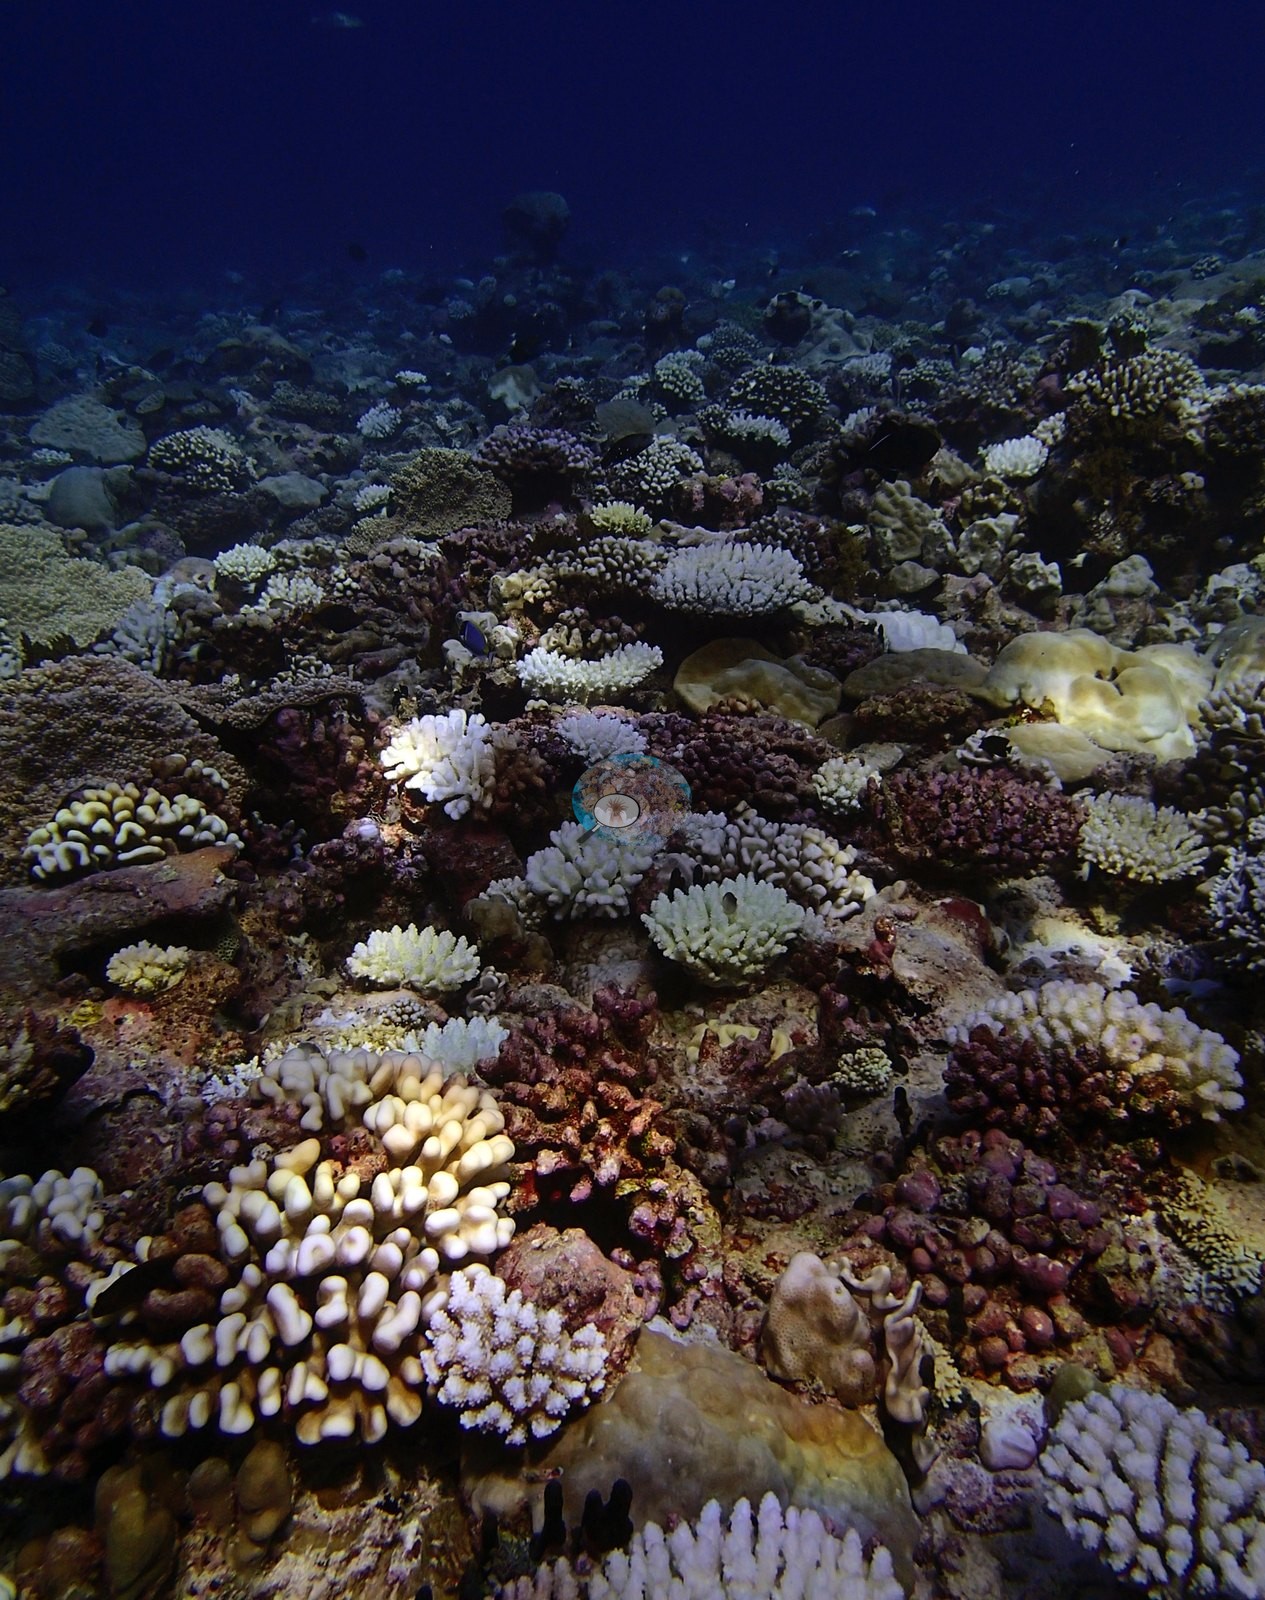
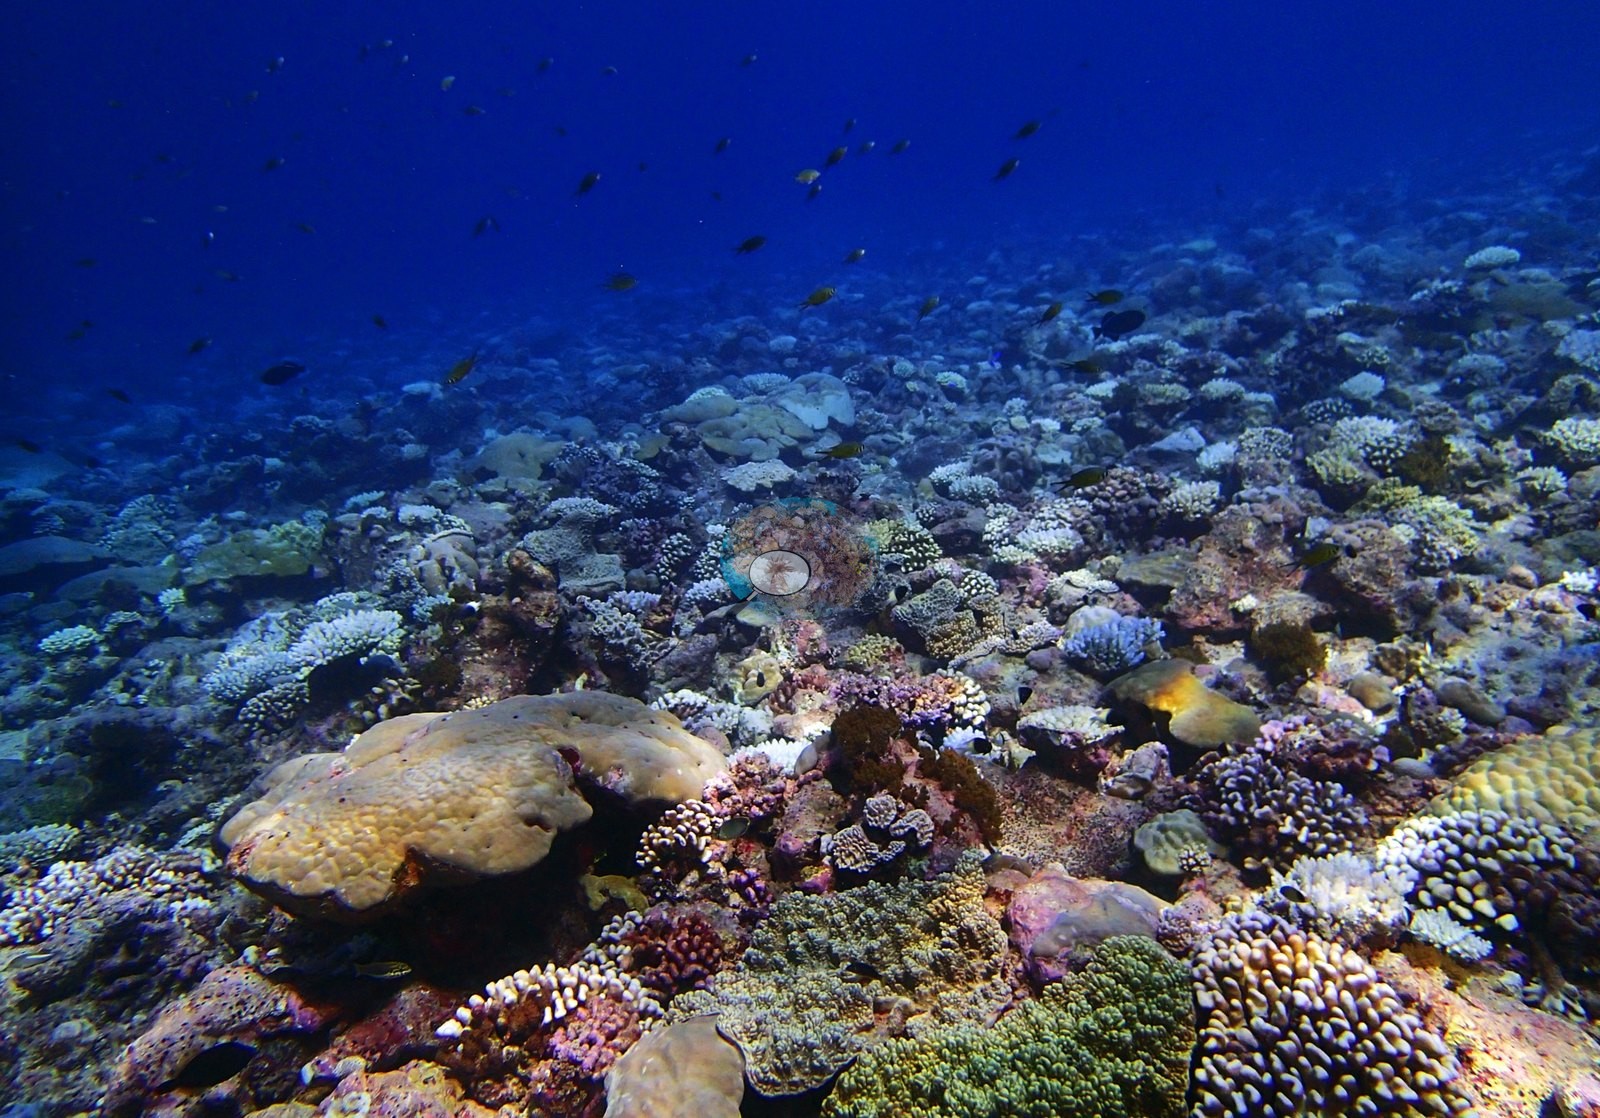
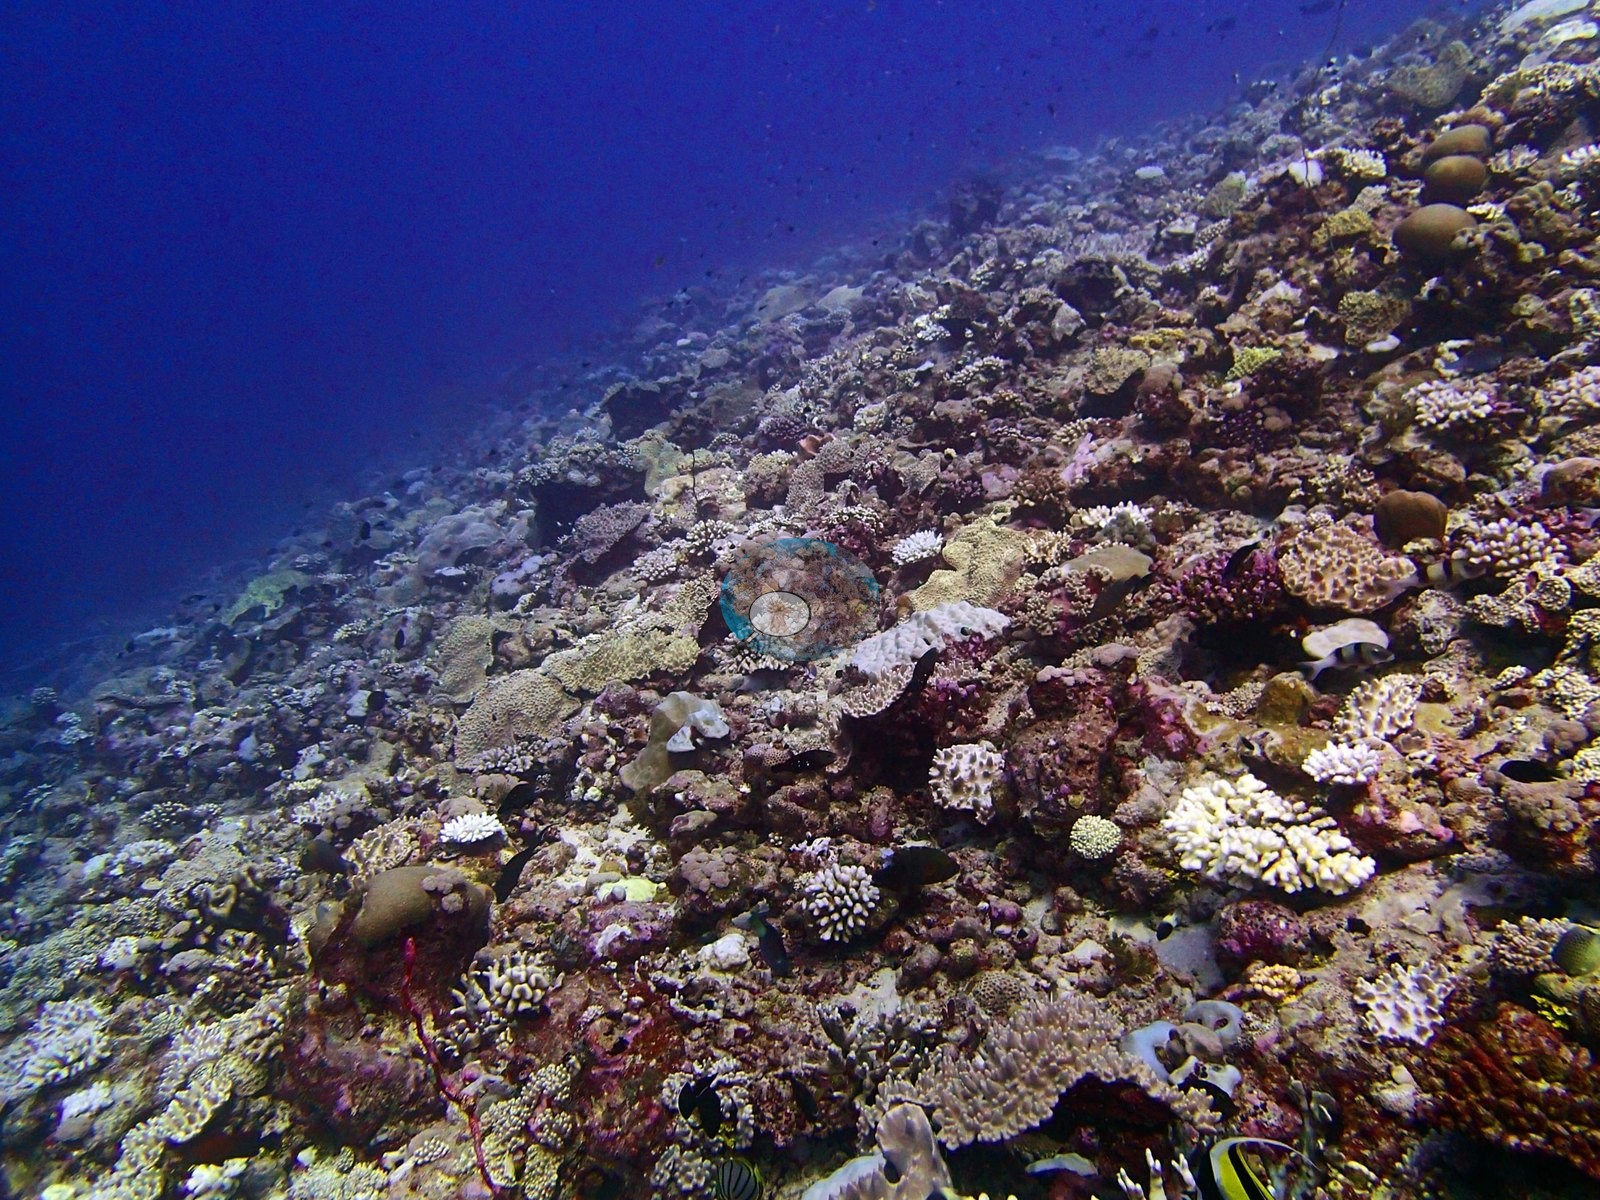
The assemblage is broad, with 28 non-zero coral genera. Porites leads at 13.23% of the benthos — 41% of all coral recorded — with the branching component carried by Stylophora at 4.84% and Pocillopora at 3.59%, an unusual pairing for Chagos. Pavona follows at 1.92%, Goniastrea 1.16%, Acropora only sixth at 1.11%, Montipora 1.09%, and Gardineroseris and Favia both at 0.82%. Sixteen further genera fall below 0.5%, including Physogyra, Oulophyllia, Cantharellus, Oxypora, and Hydnophora. Non-coral invertebrates hold 21.1% of the benthos, crustose coralline algae 16.4%, turf 15.3%, and bare substrate 5.3%. Reef architecture is moderate, with colonies set into older consolidated framework and separated by small sand or rubble pockets (e.g., Image 1).
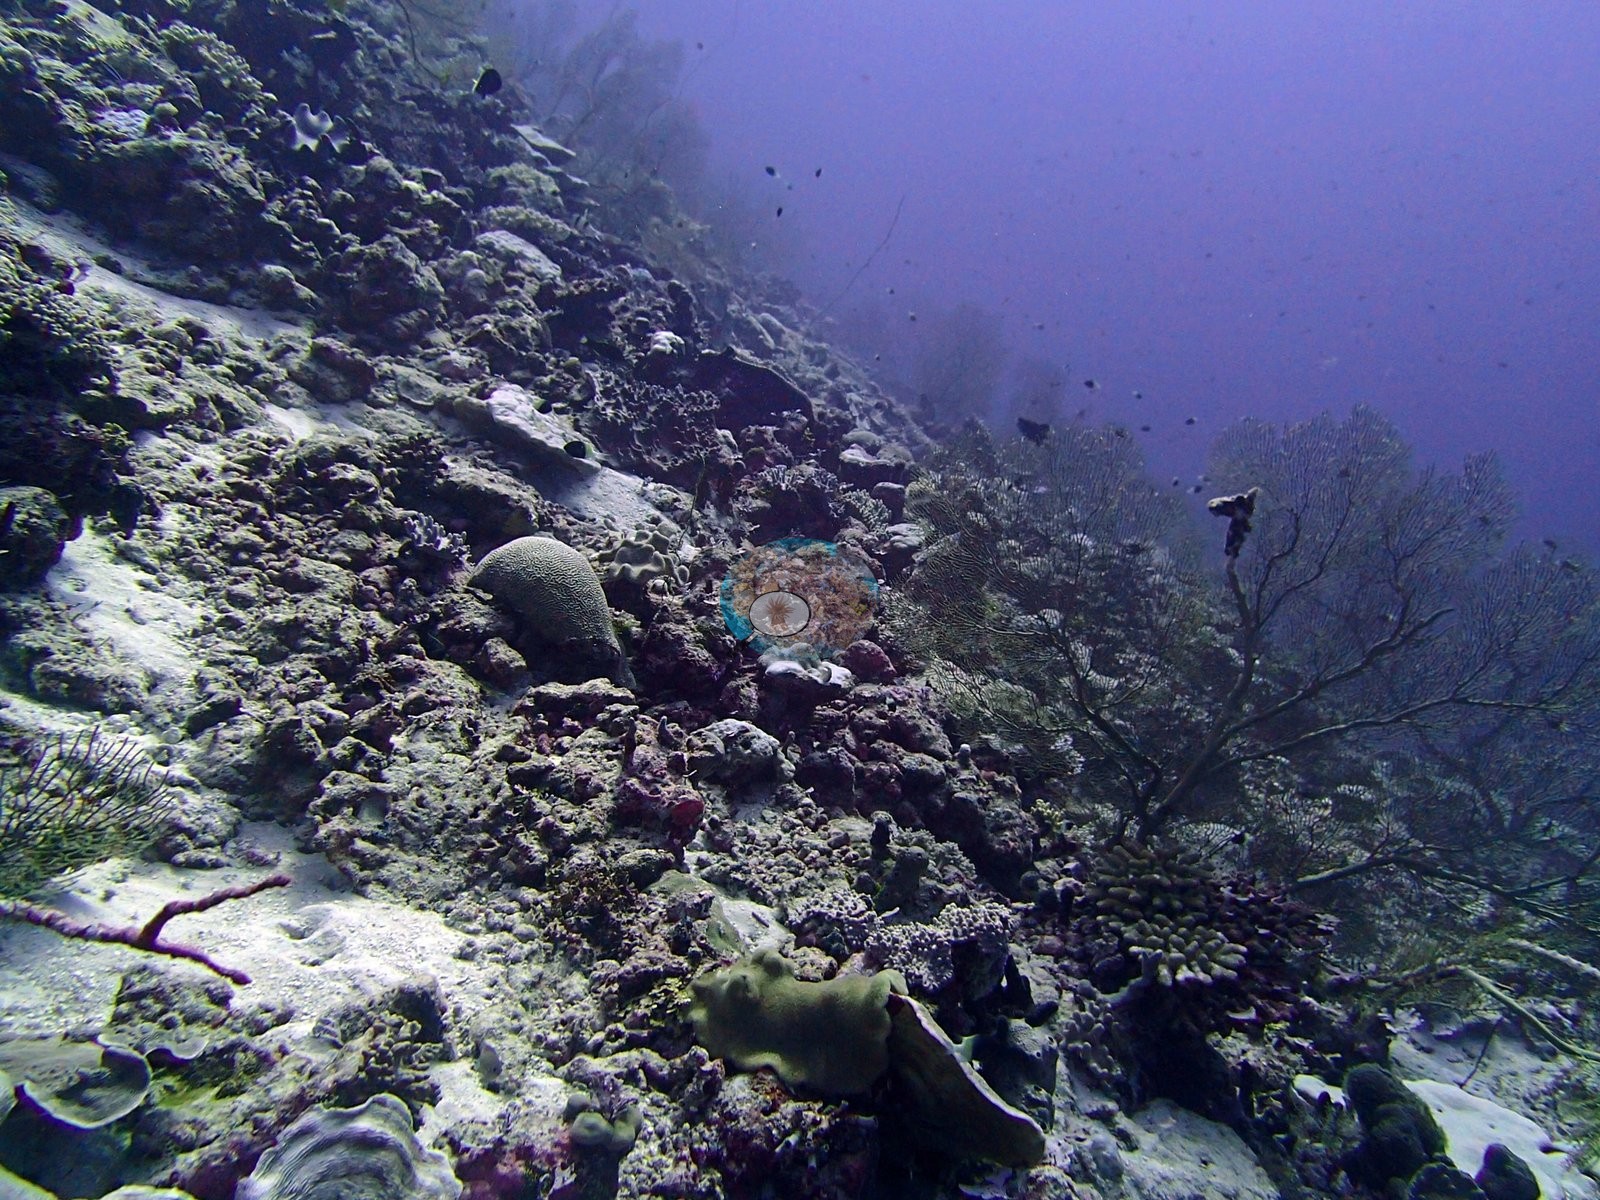
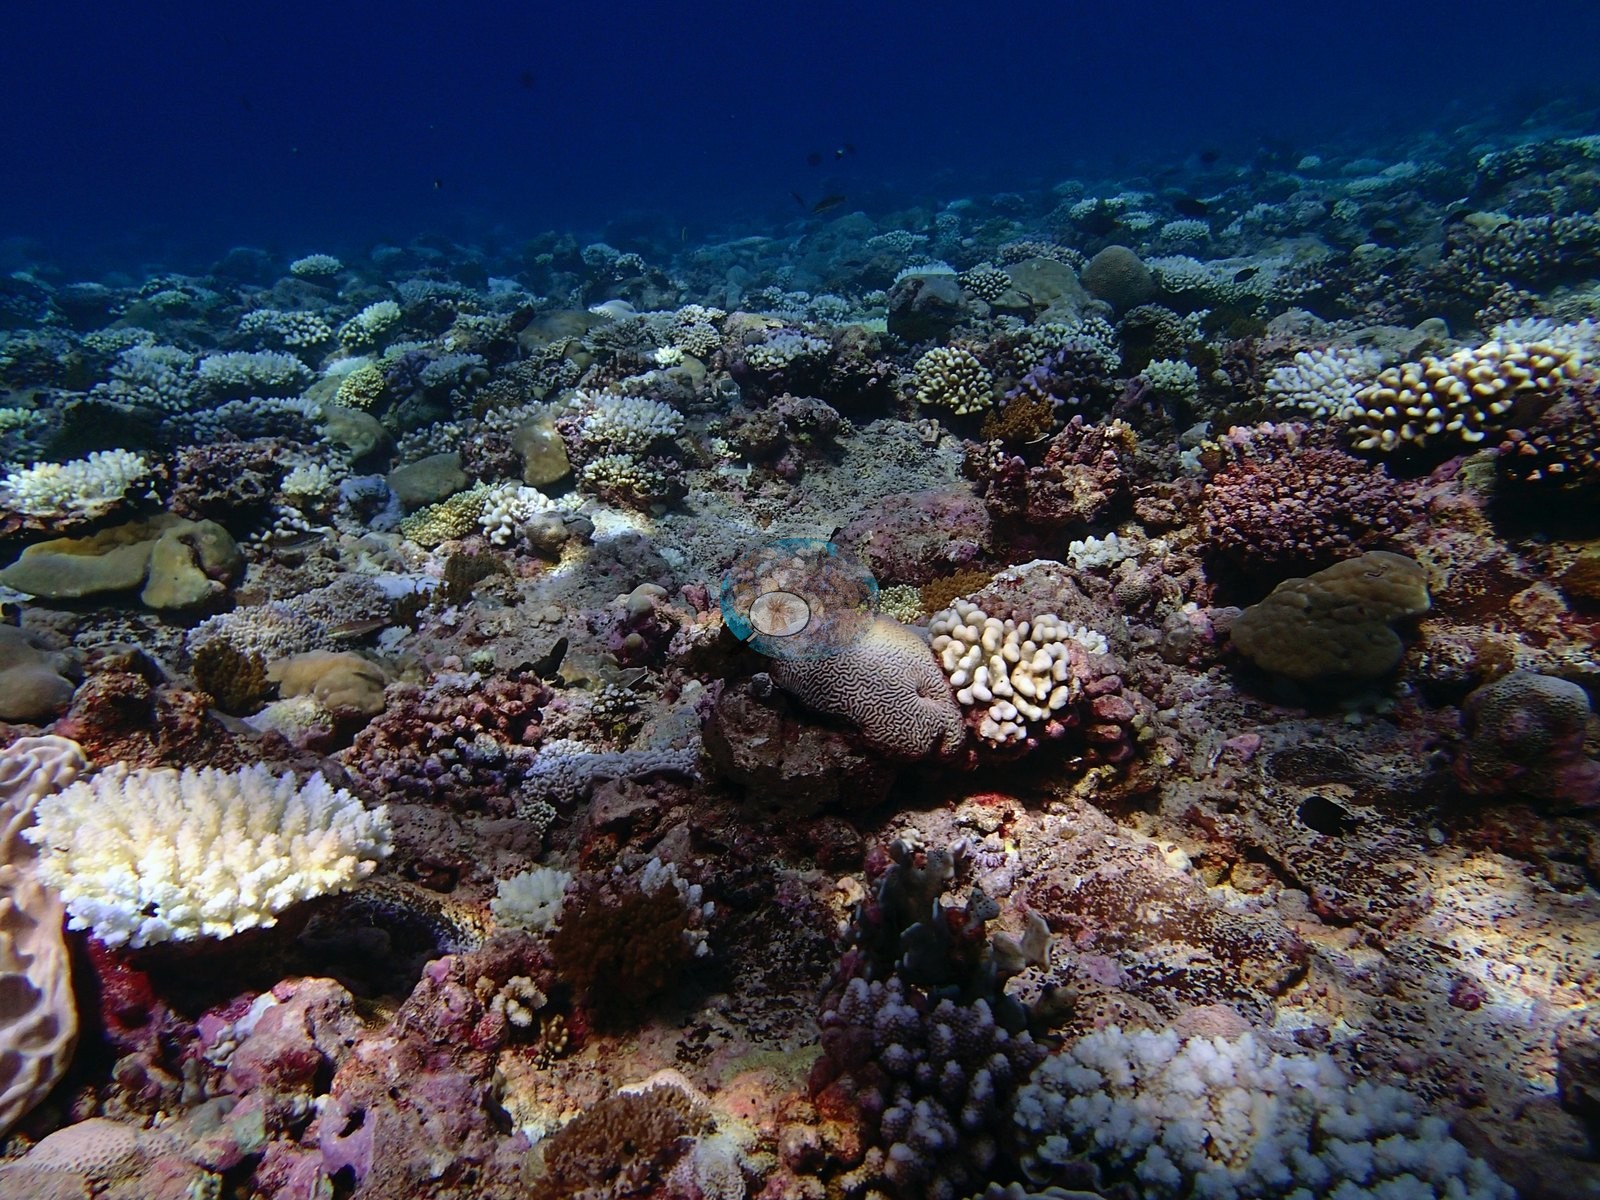
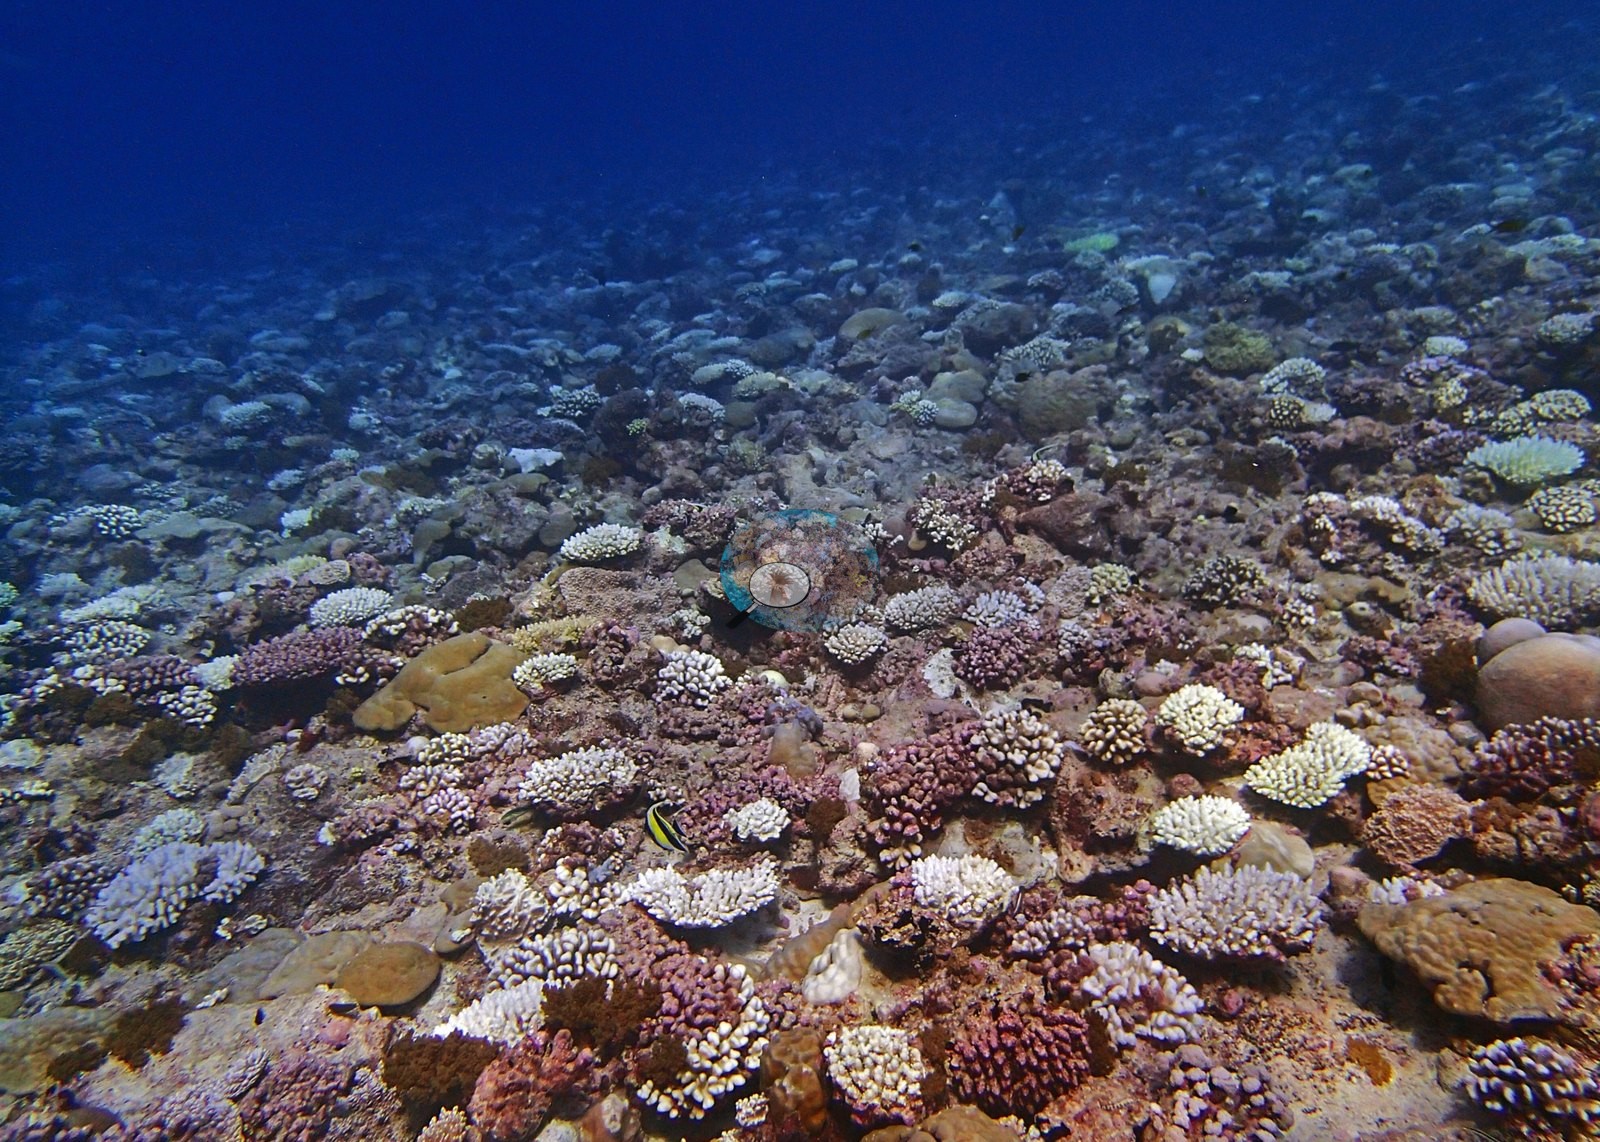
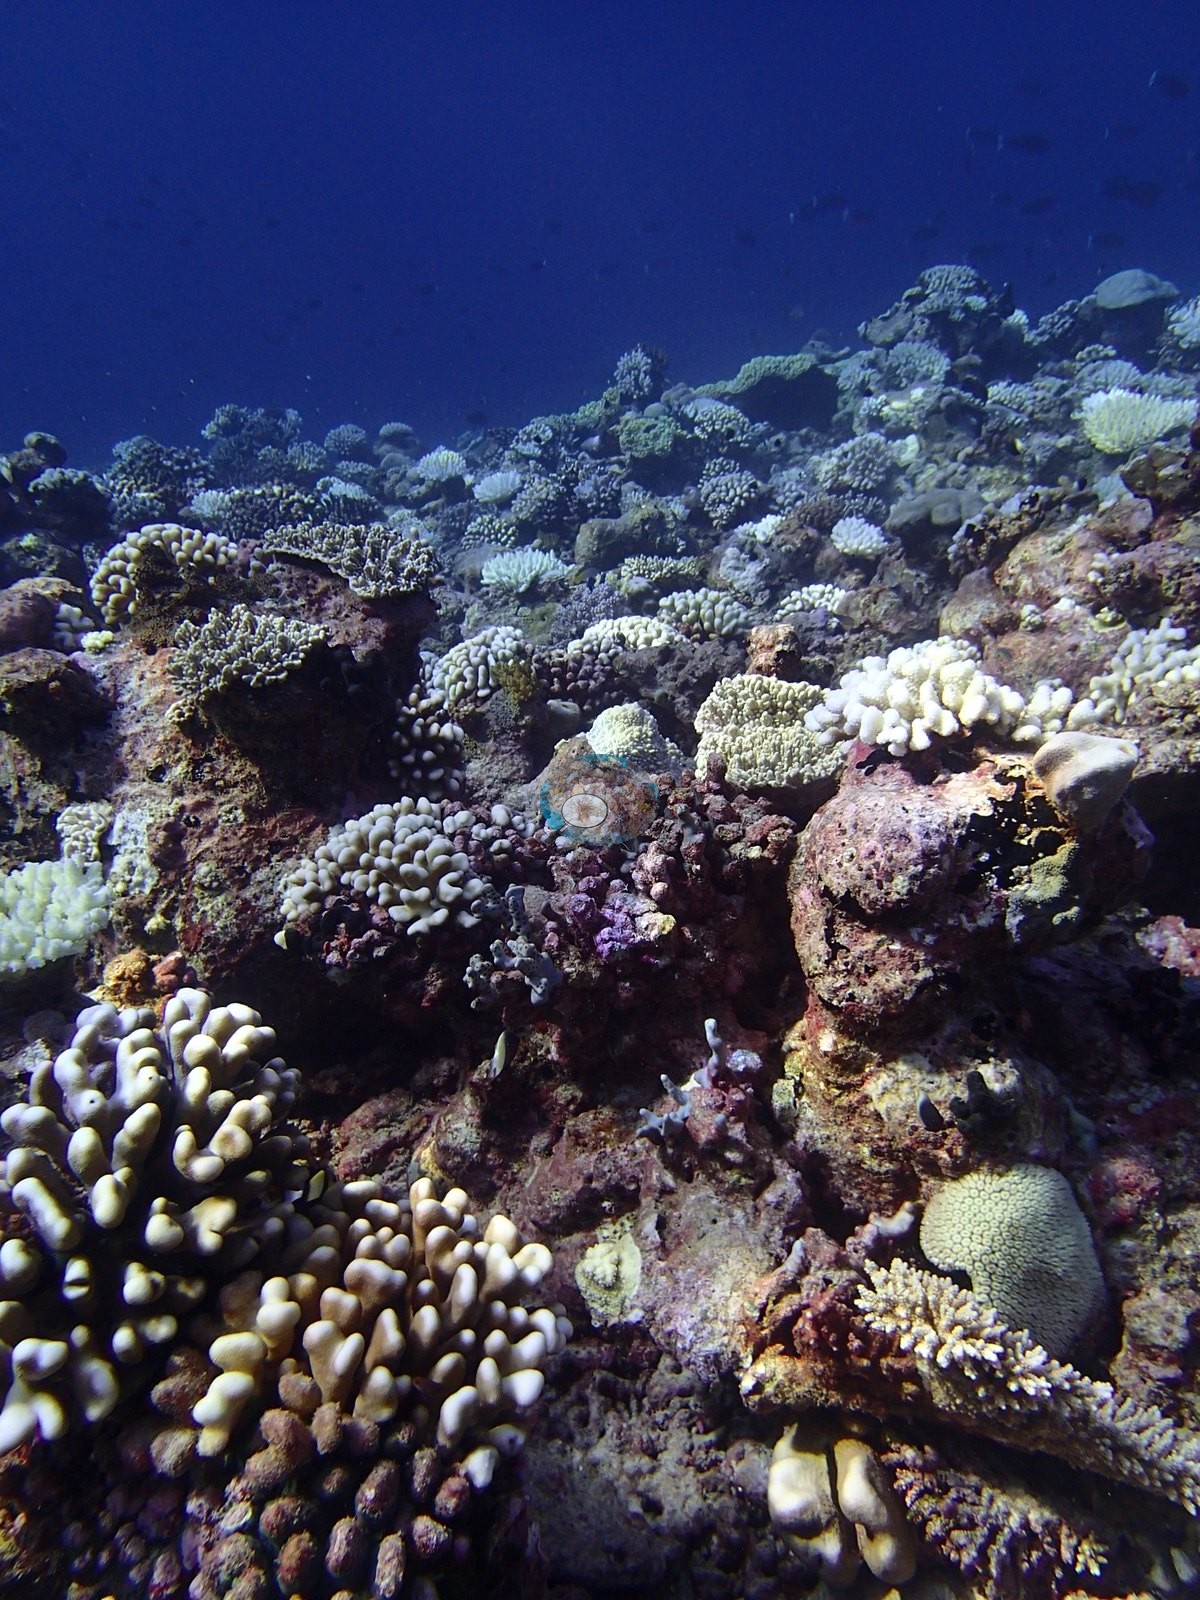
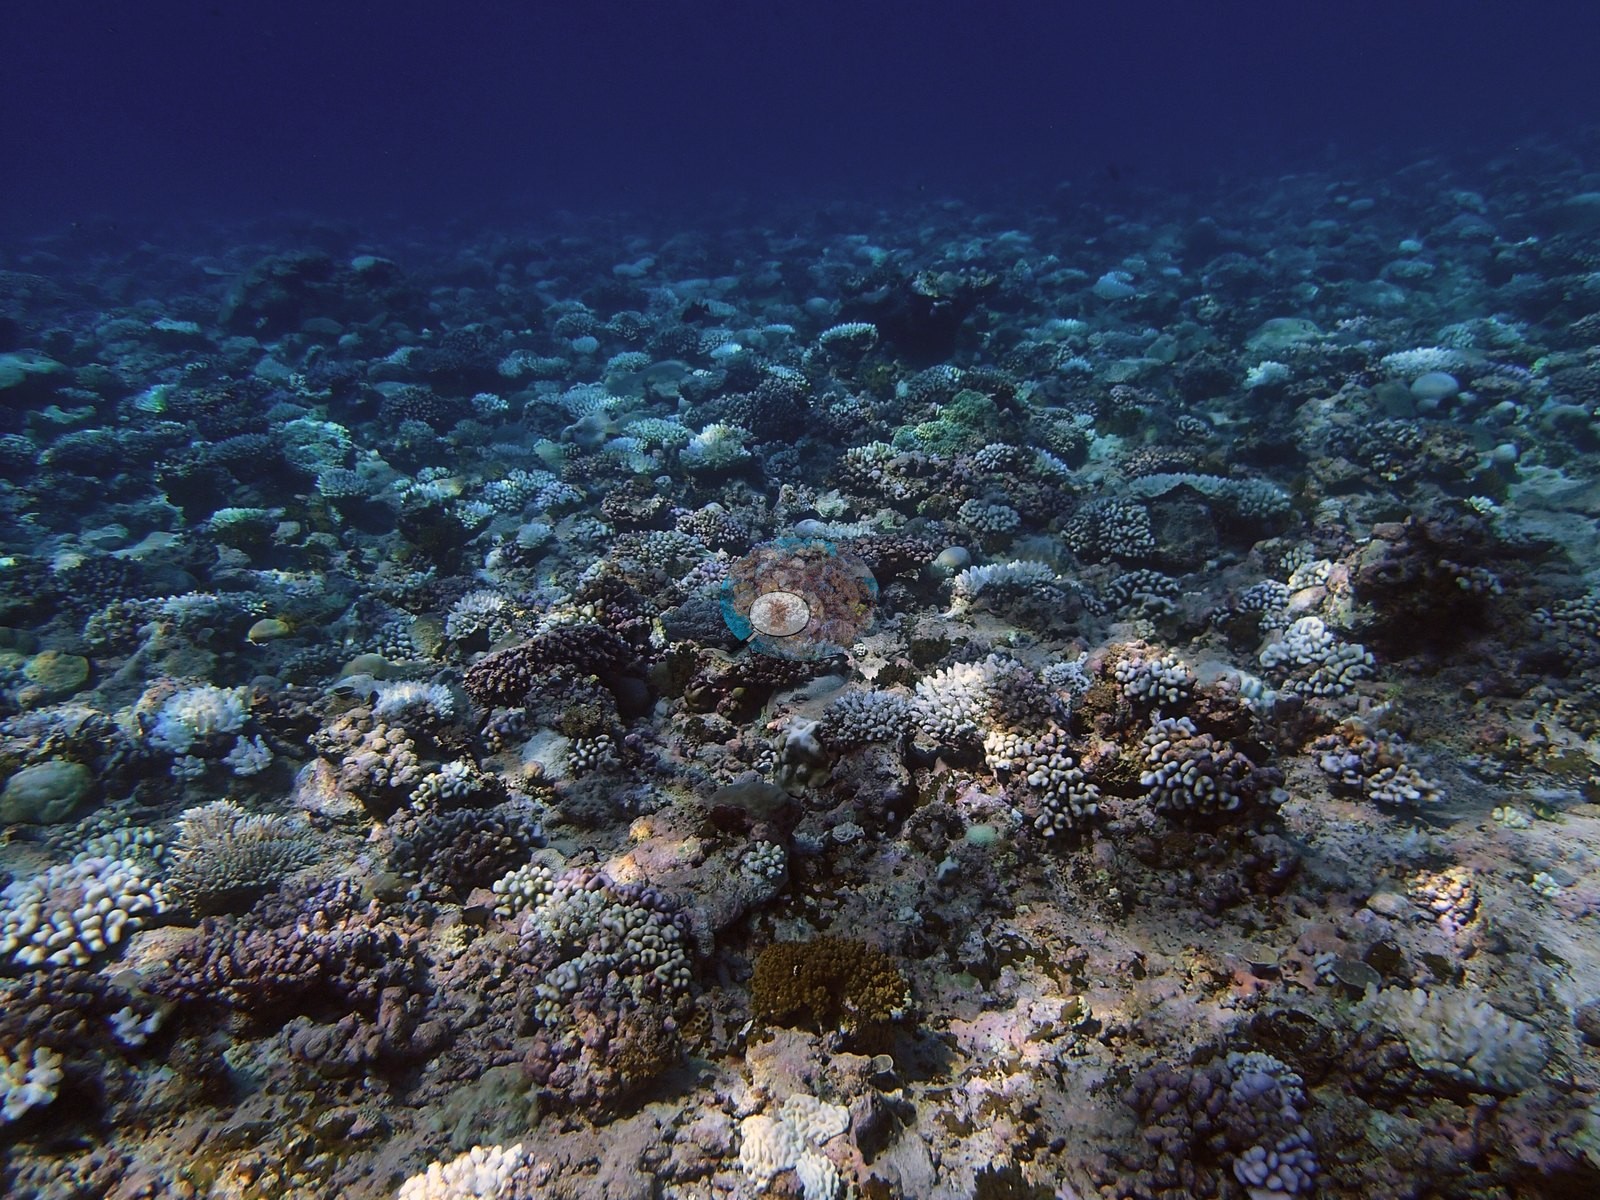
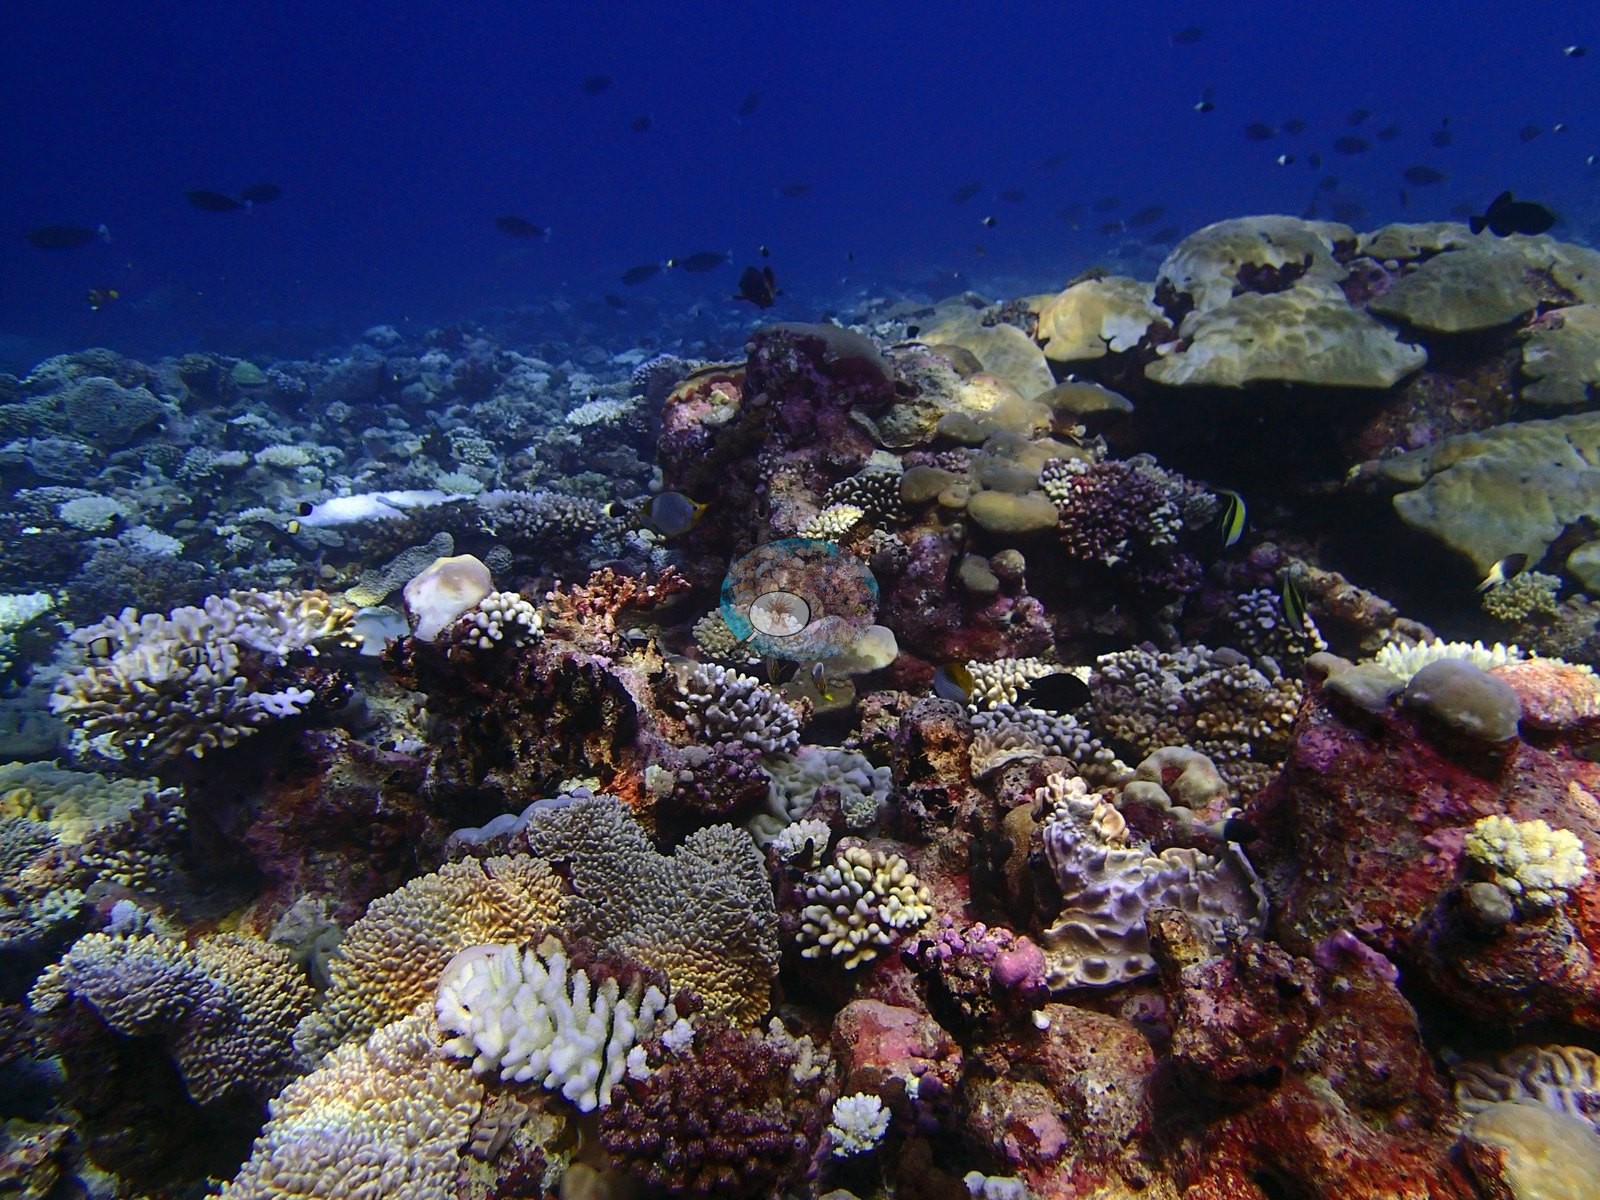
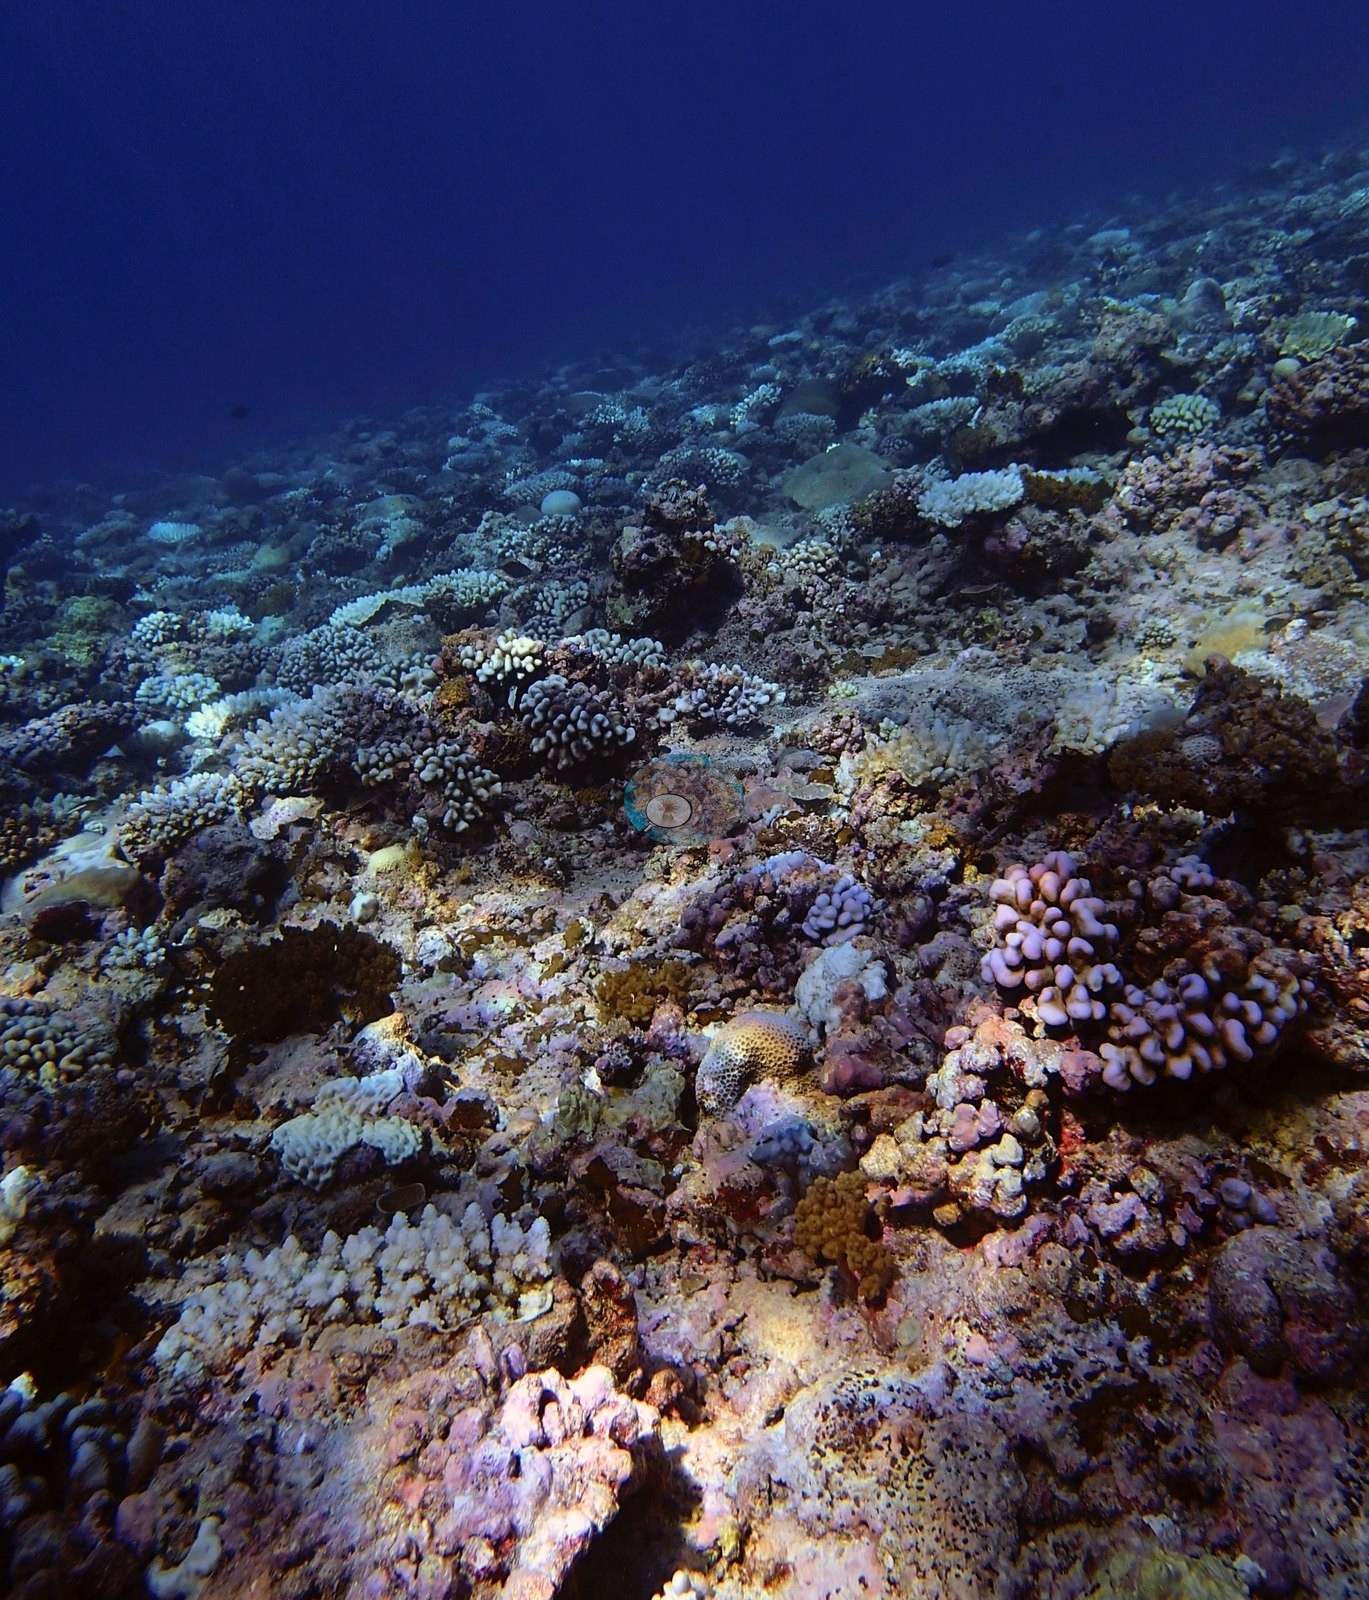
Broad views show rounded massive colonies, compact branching clusters, low plates, and encrusted surfaces rather than one continuous canopy (e.g., Image 3, Image 4).
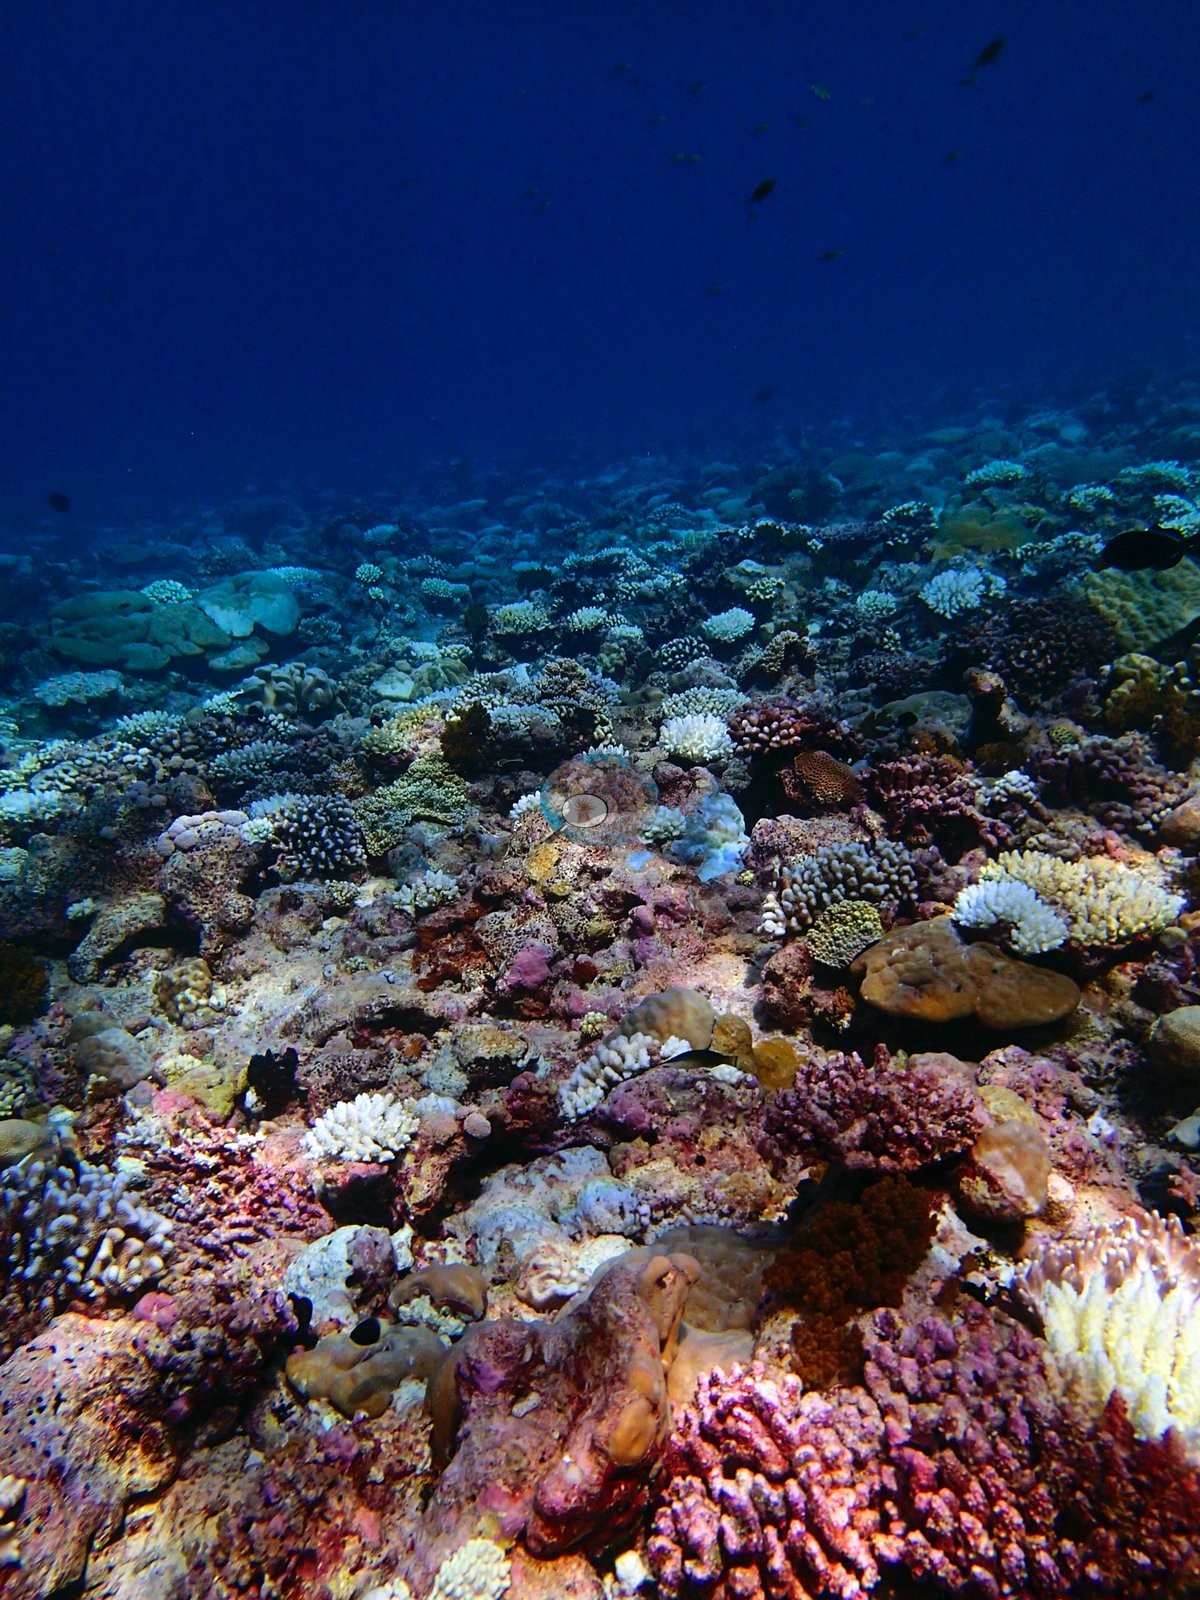
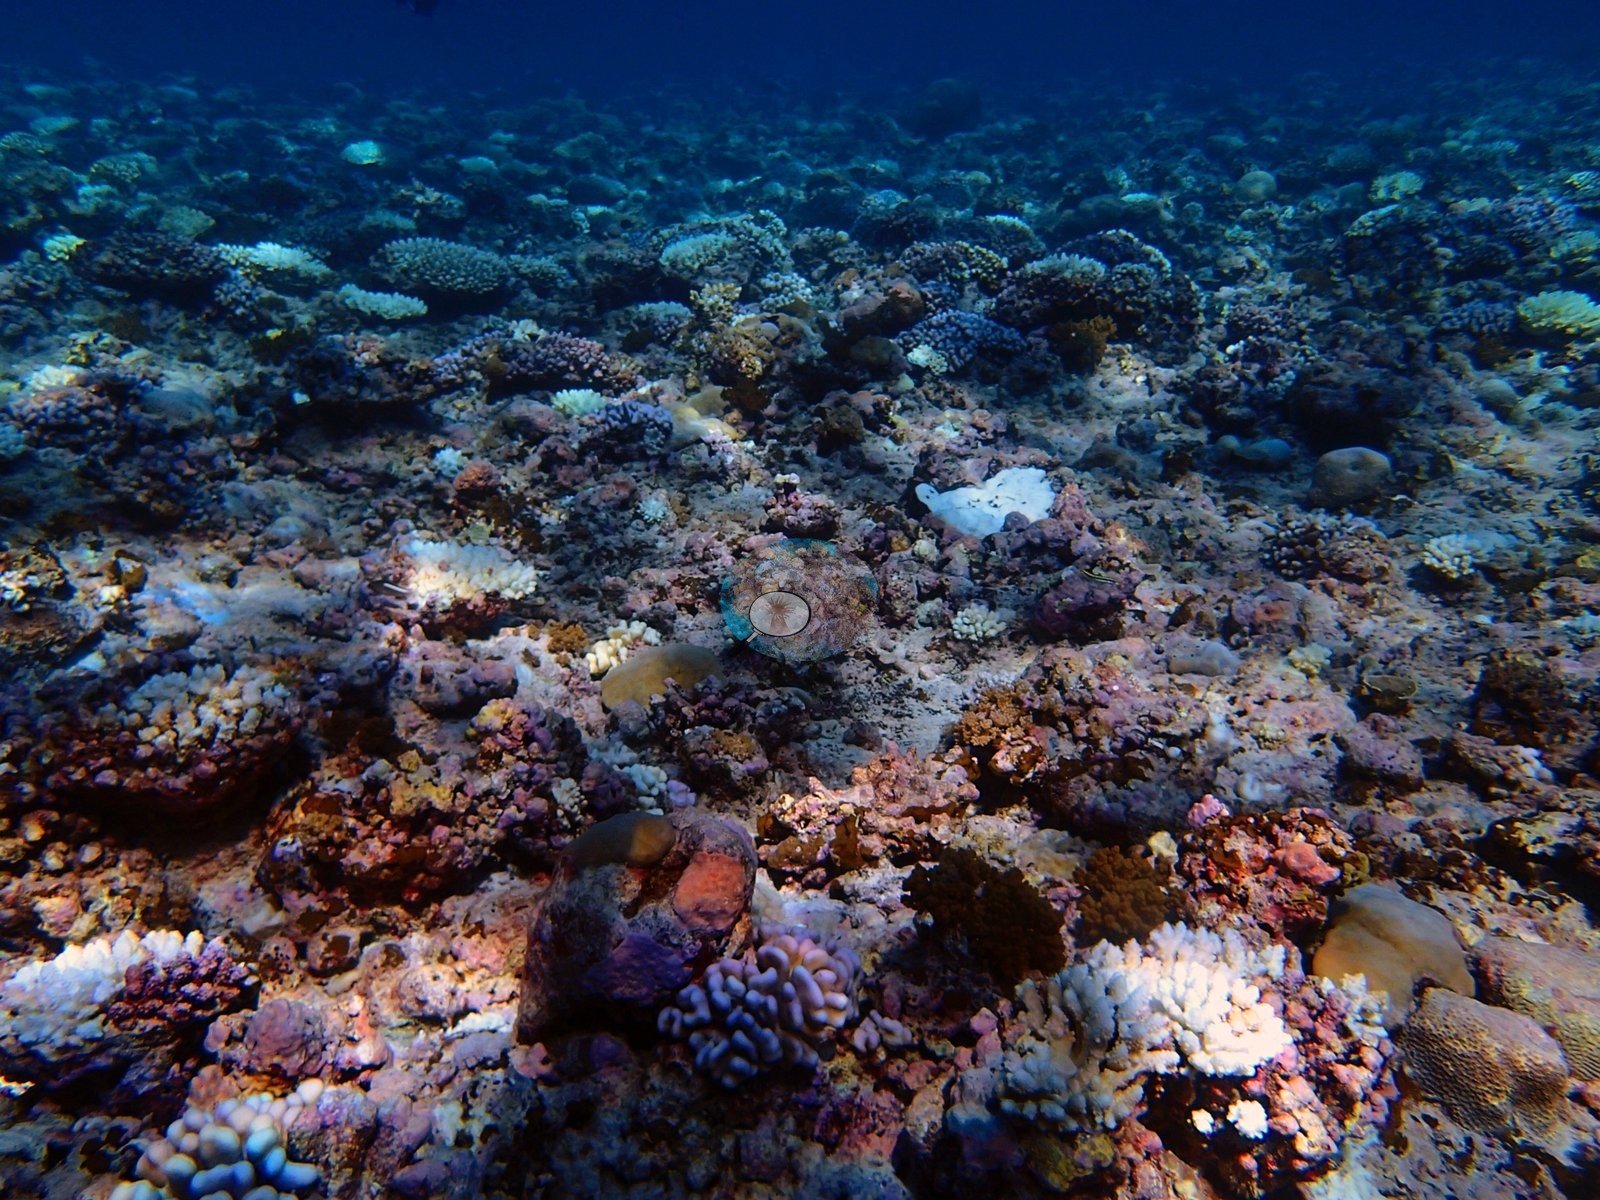
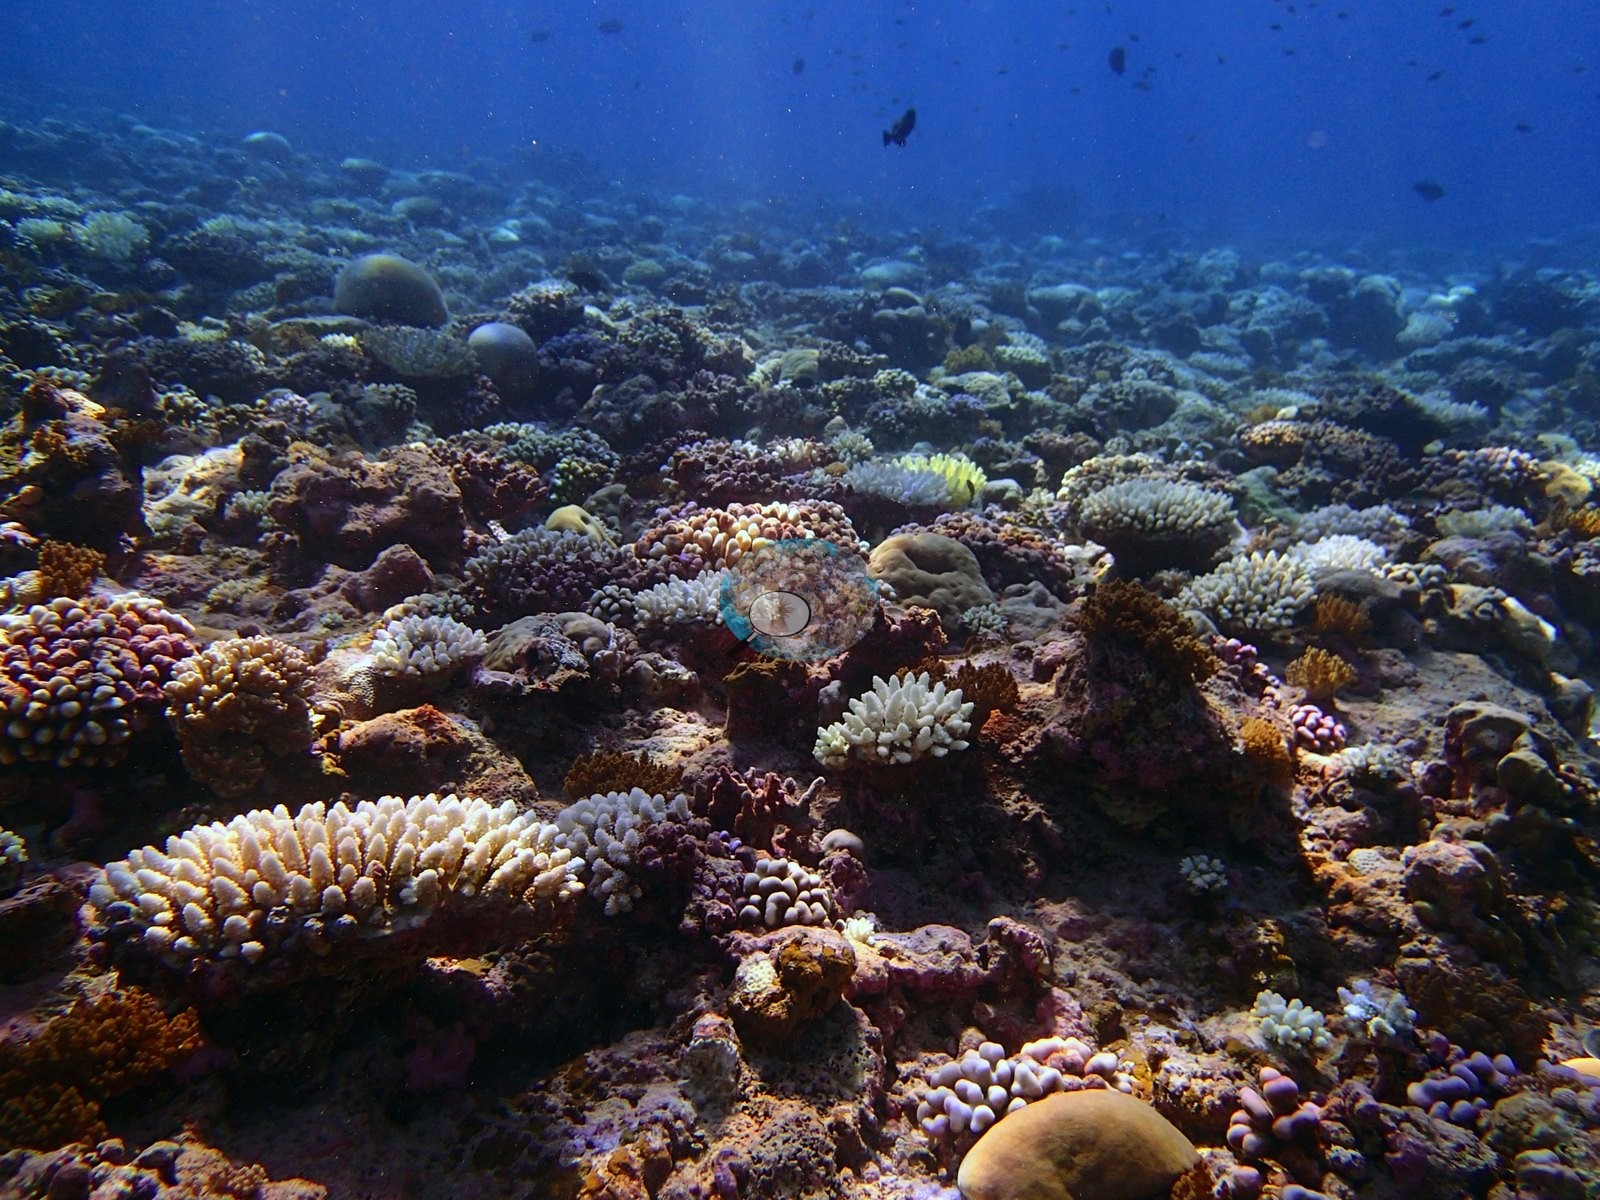
Two frames are useful for the juxtaposition of branching and massive forms around open substrate, and a later run of frames shows repeated changes in colony scale and relief over a short route. The result is a heterogeneous habitat with many edges and crevices but markedly less vertical layering than the dense channel reef at BIPB110. The photographed benthos includes purple and red encrusting surfaces, brown algal growth, and small mound-forming colonies, all adding texture and microhabitat diversity — the visible counterpart to a 21.1% non-coral invertebrate figure. The photographs show massive, compact branching, and plating forms embedded in encrusted framework with small sand and rubble openings, and bleaching common and conspicuous across multiple frames.
Coral cover
Coral cover is 33%, 70th of the 109 Chagos sites, against 41.2% algae — but published image bleaching is 24.1%, ranking 4th of 98. Coral cover falls by more than half from the shallowest band to the deepest. D2 carries 47.4% — a genuinely coral-abundant shallow reef, with Porites at 25.23% and Stylophora at 7.73%, across 24 genera. D3 drops to 28.6% and Porites collapses to 6.60%, leaving Stylophora (5.88%) and Pocillopora (5.25%) nearly level with it. D4 falls again to 21.4%, with Porites at 7.85% and algal cover at 39.8%. Genus richness declines with cover, from 24 to 22 to 19 codes. The 13.23% site-level Porites figure is therefore dominated by a single shallow transect and should never be quoted as a uniform value. Assemblage composition. Formal surveys give 32.5% coral, 41.2% algae, and 21.1% non-coral invertebrates, the coral Porites-led with a Stylophora–Pocillopora branching component and Acropora only sixth.
Stressors
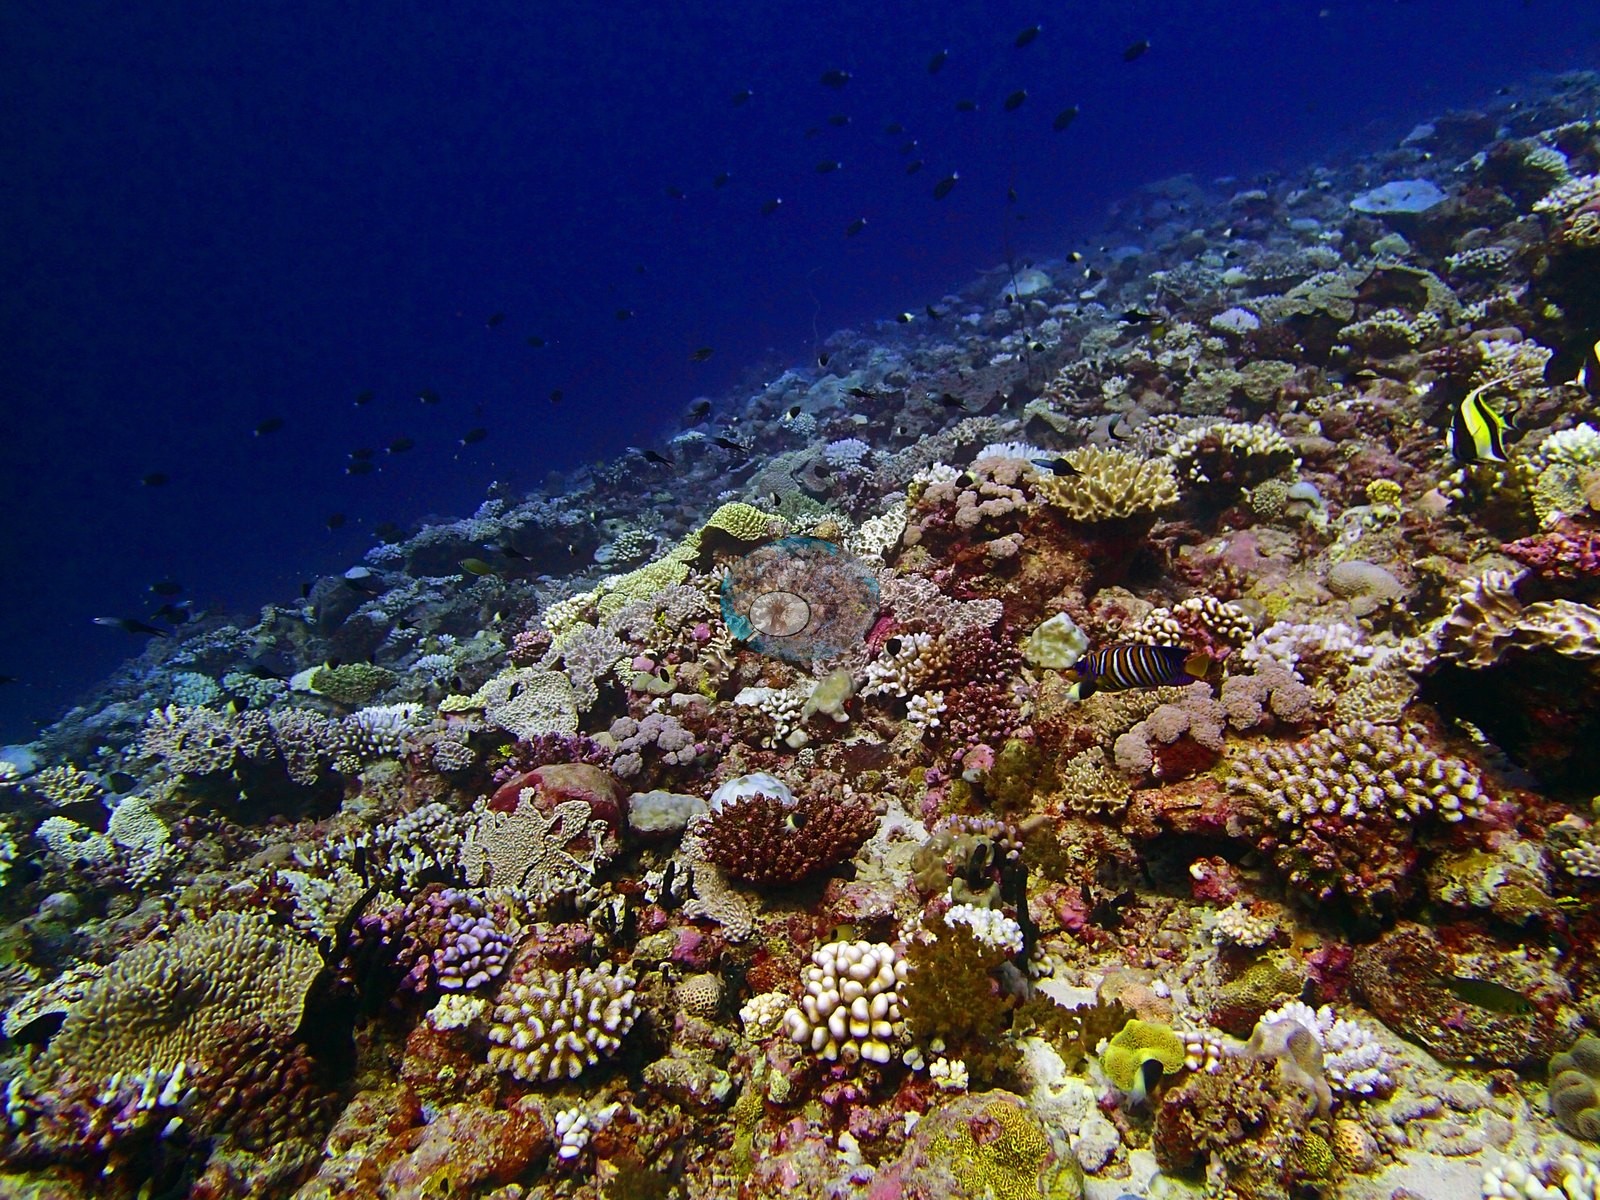
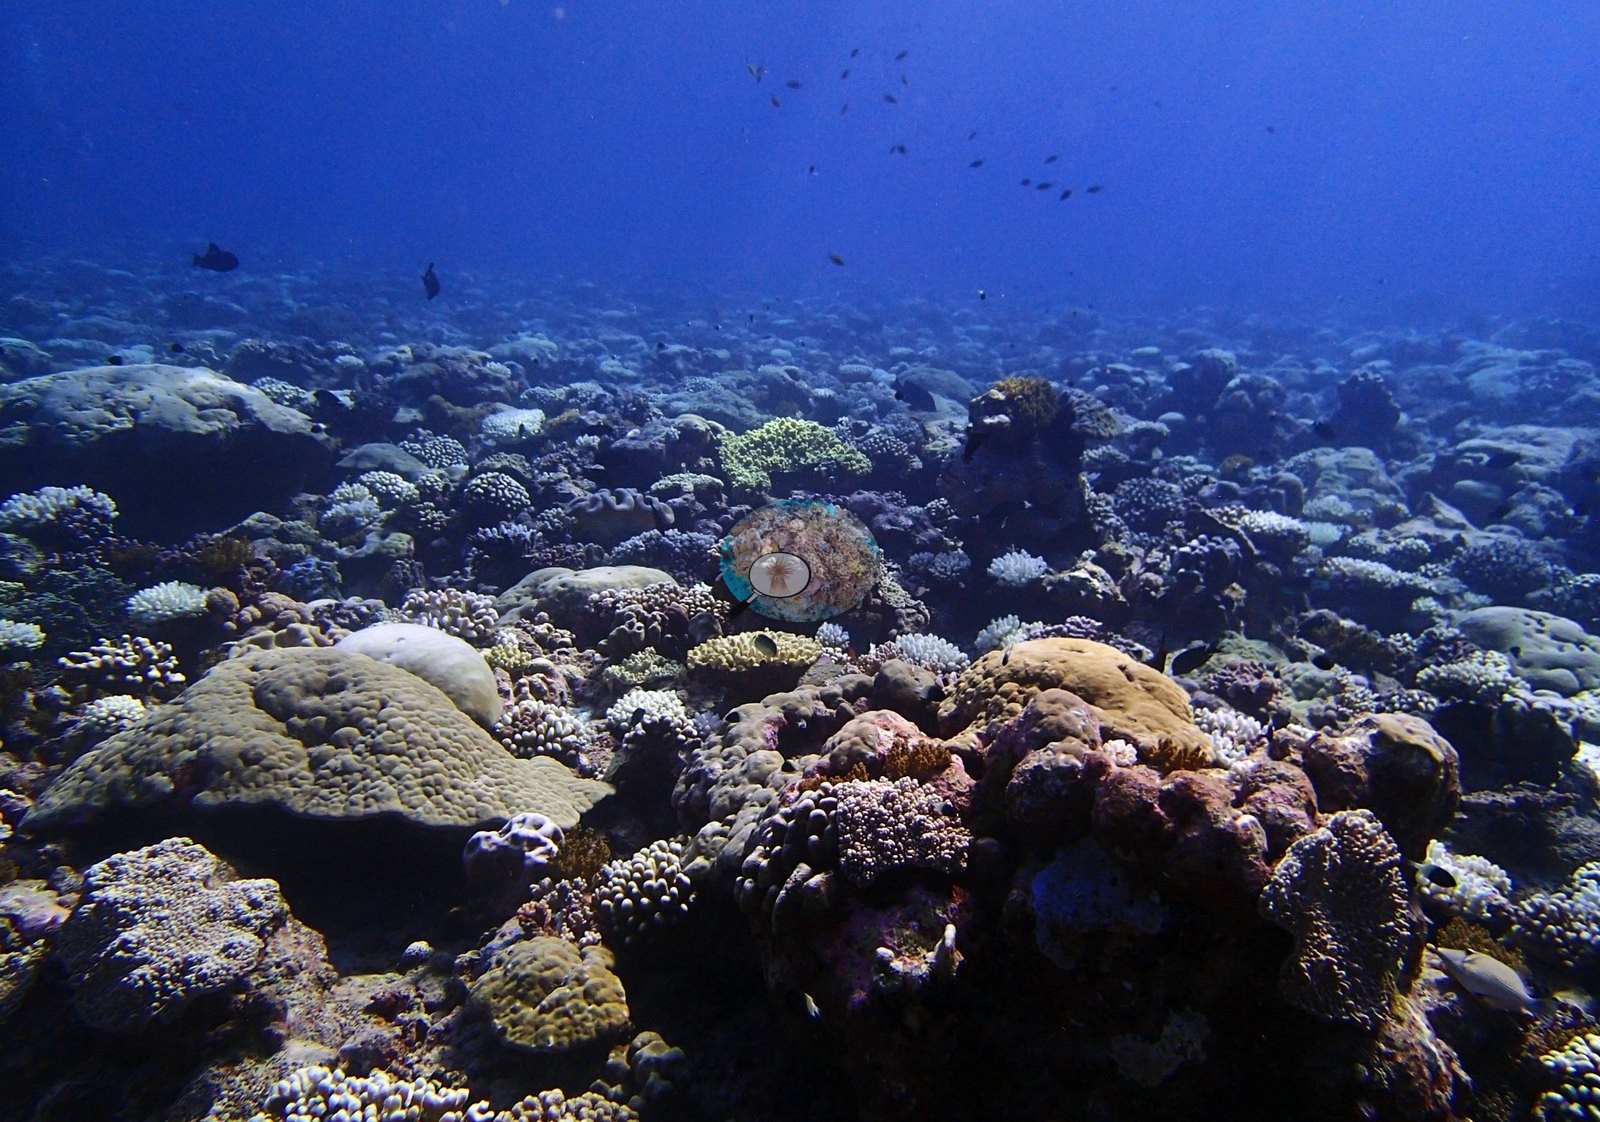
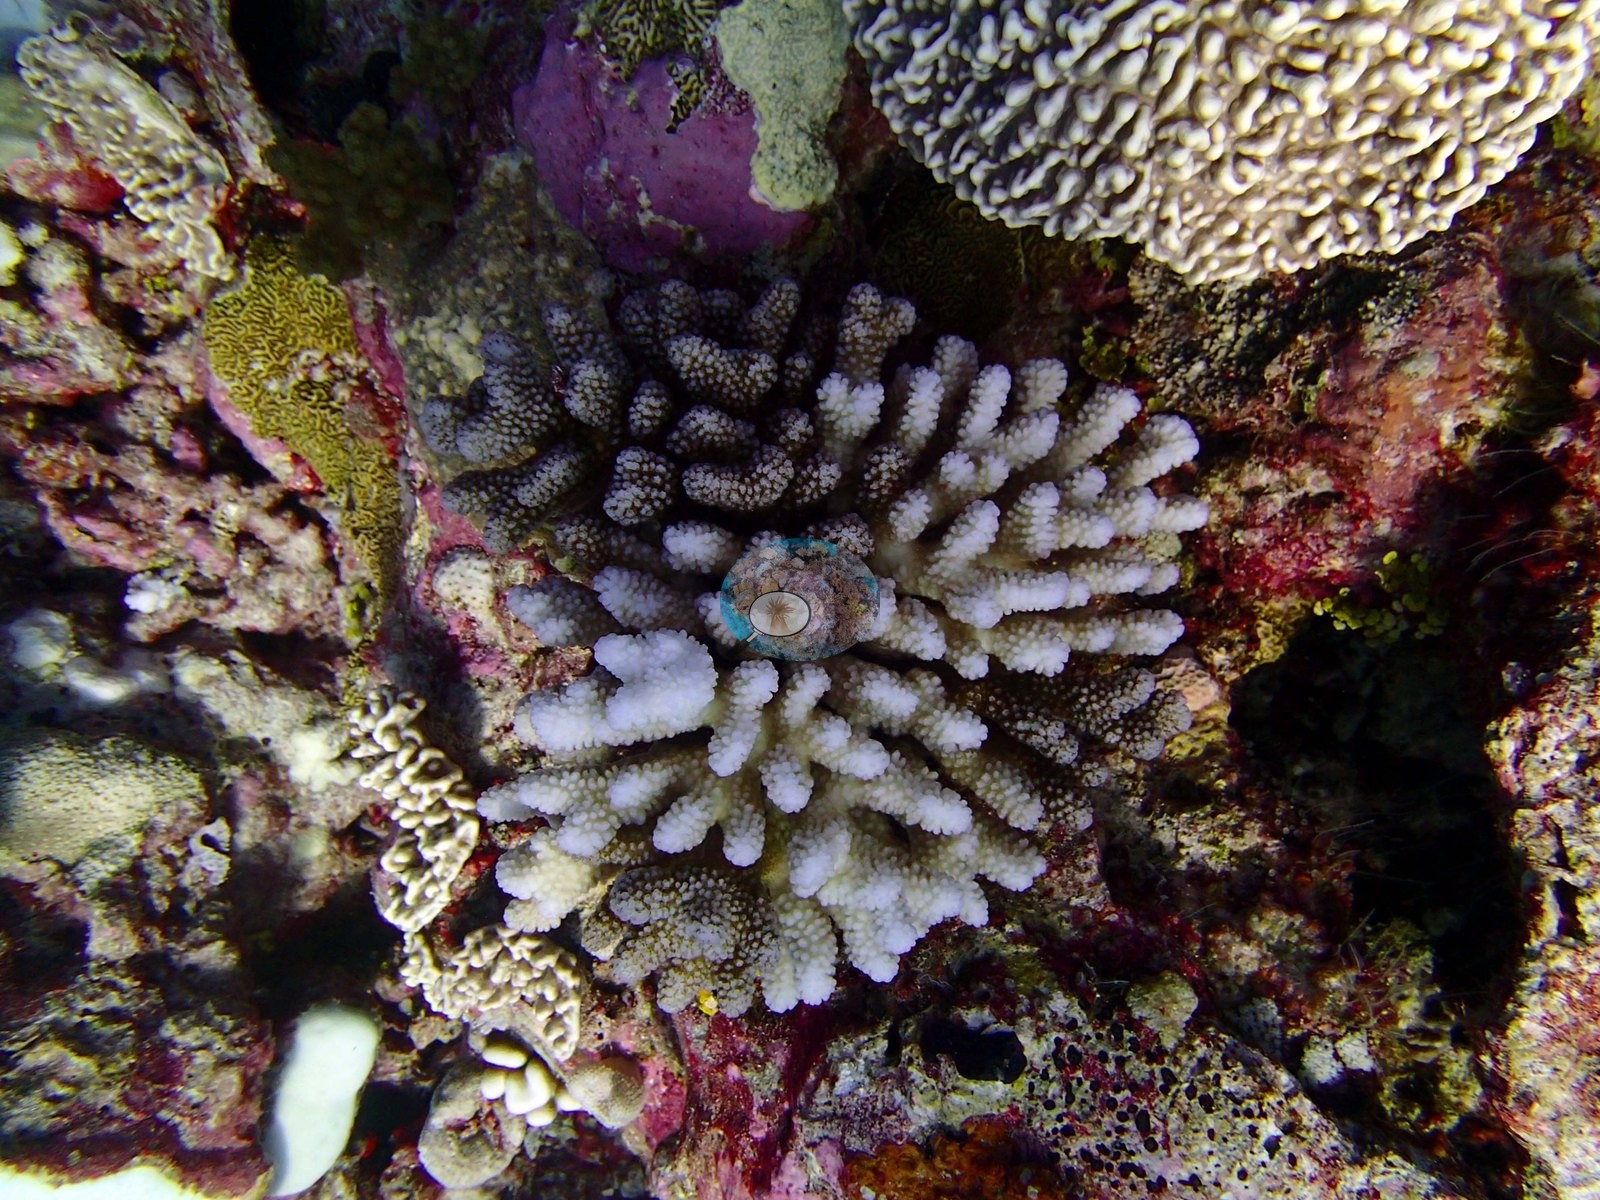
Bleaching is visually prominent and matches the high published figure. One frame contains several colonies at different degrees of pallor: one central branching colony has white branch ends and light tissue farther inward, while neighbors range from darkly pigmented to nearly white (e.g., Image 2).
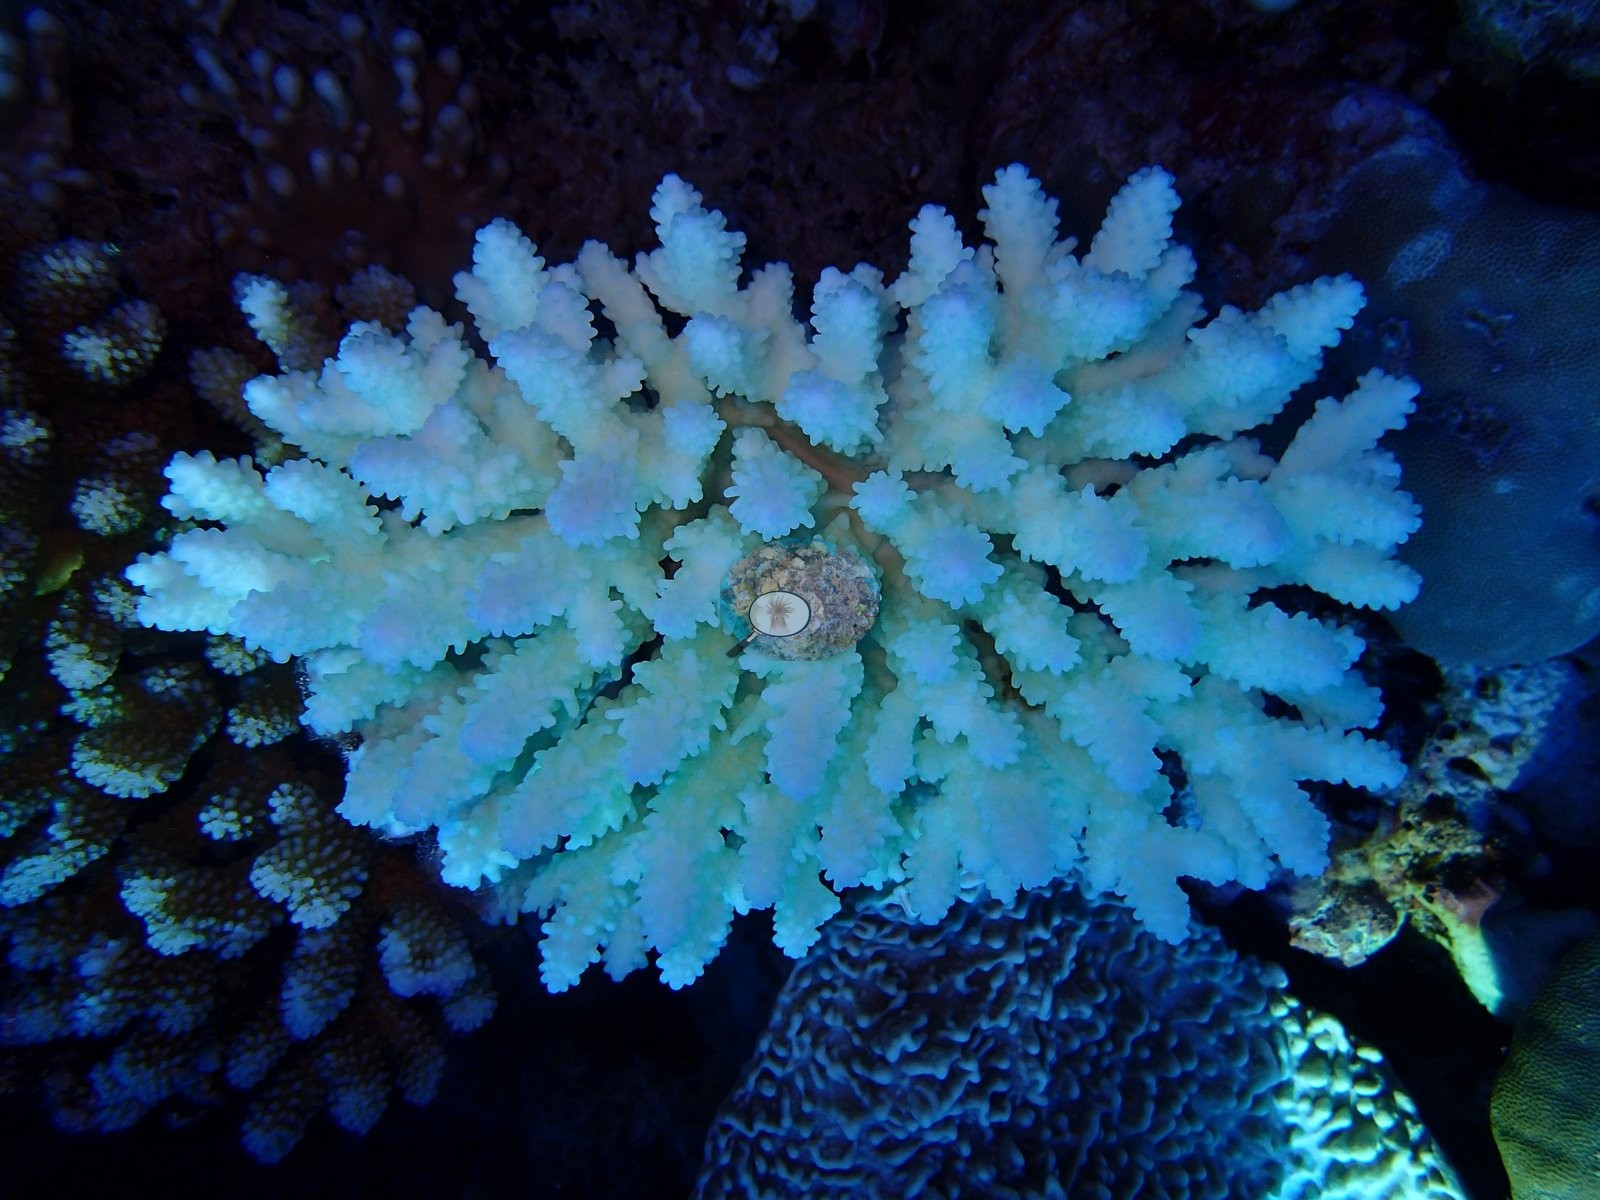
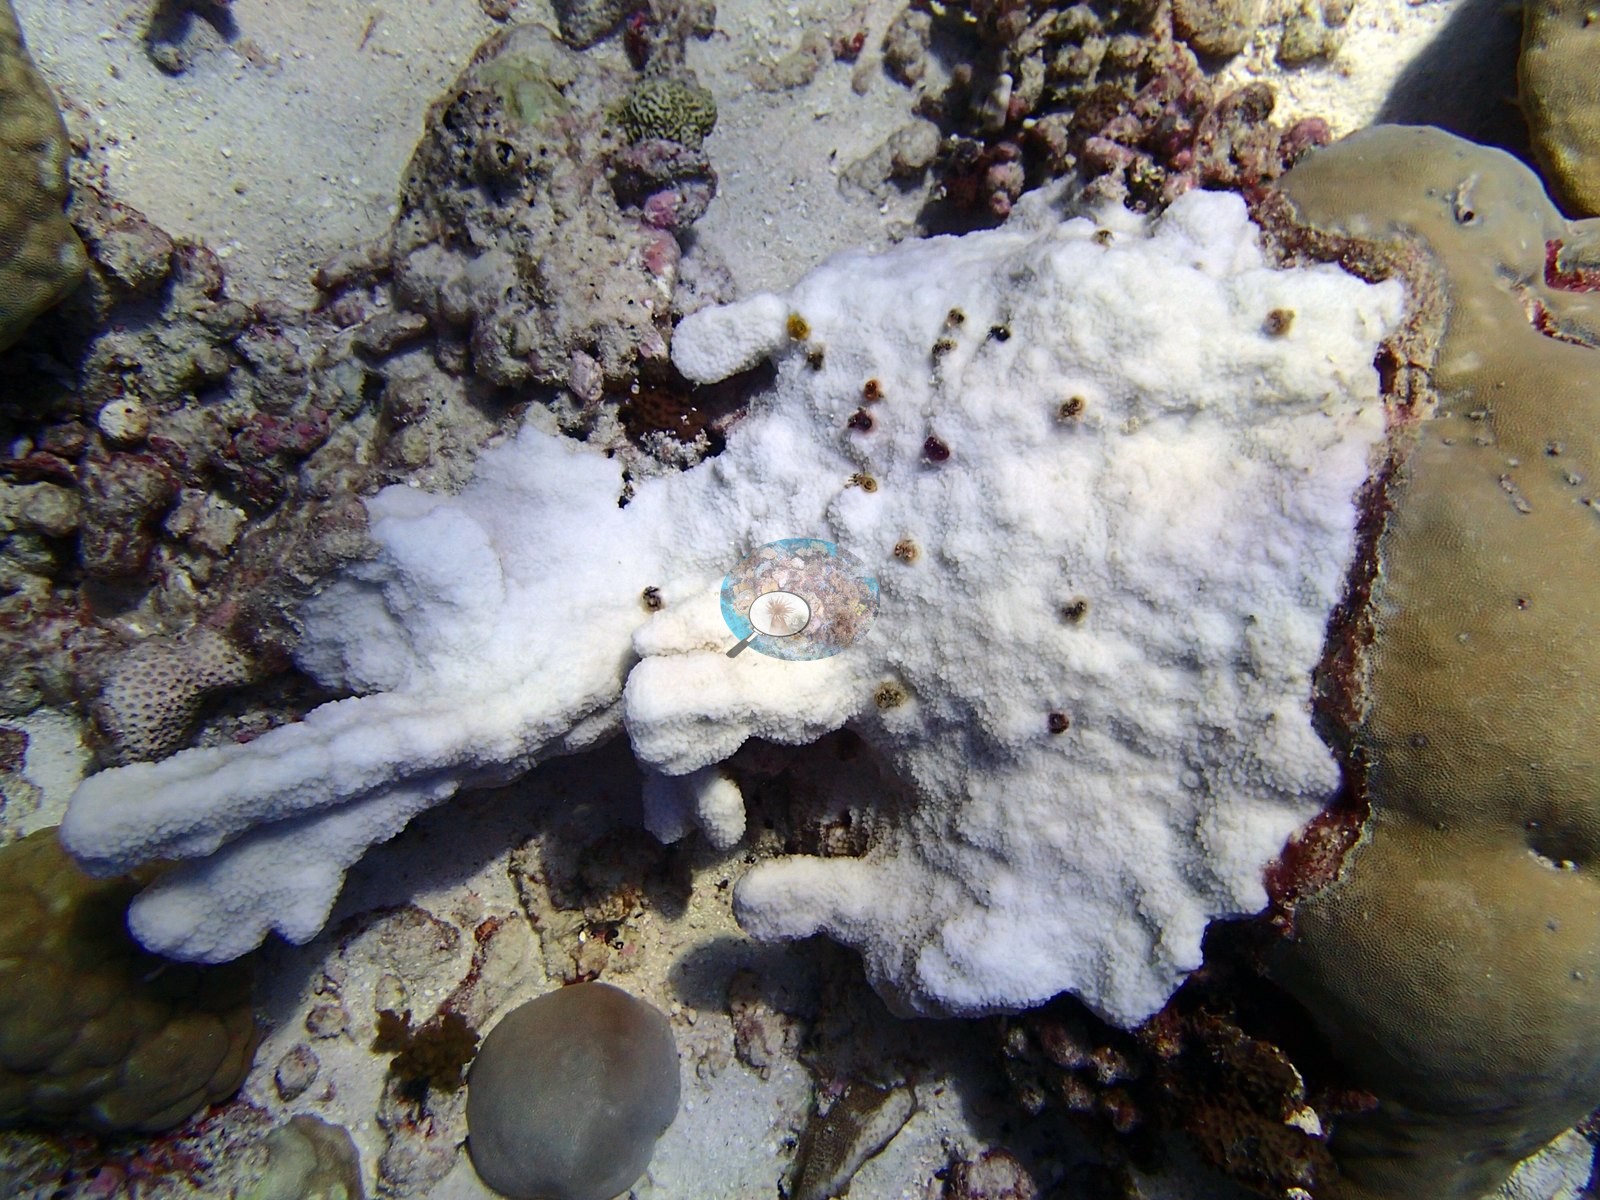
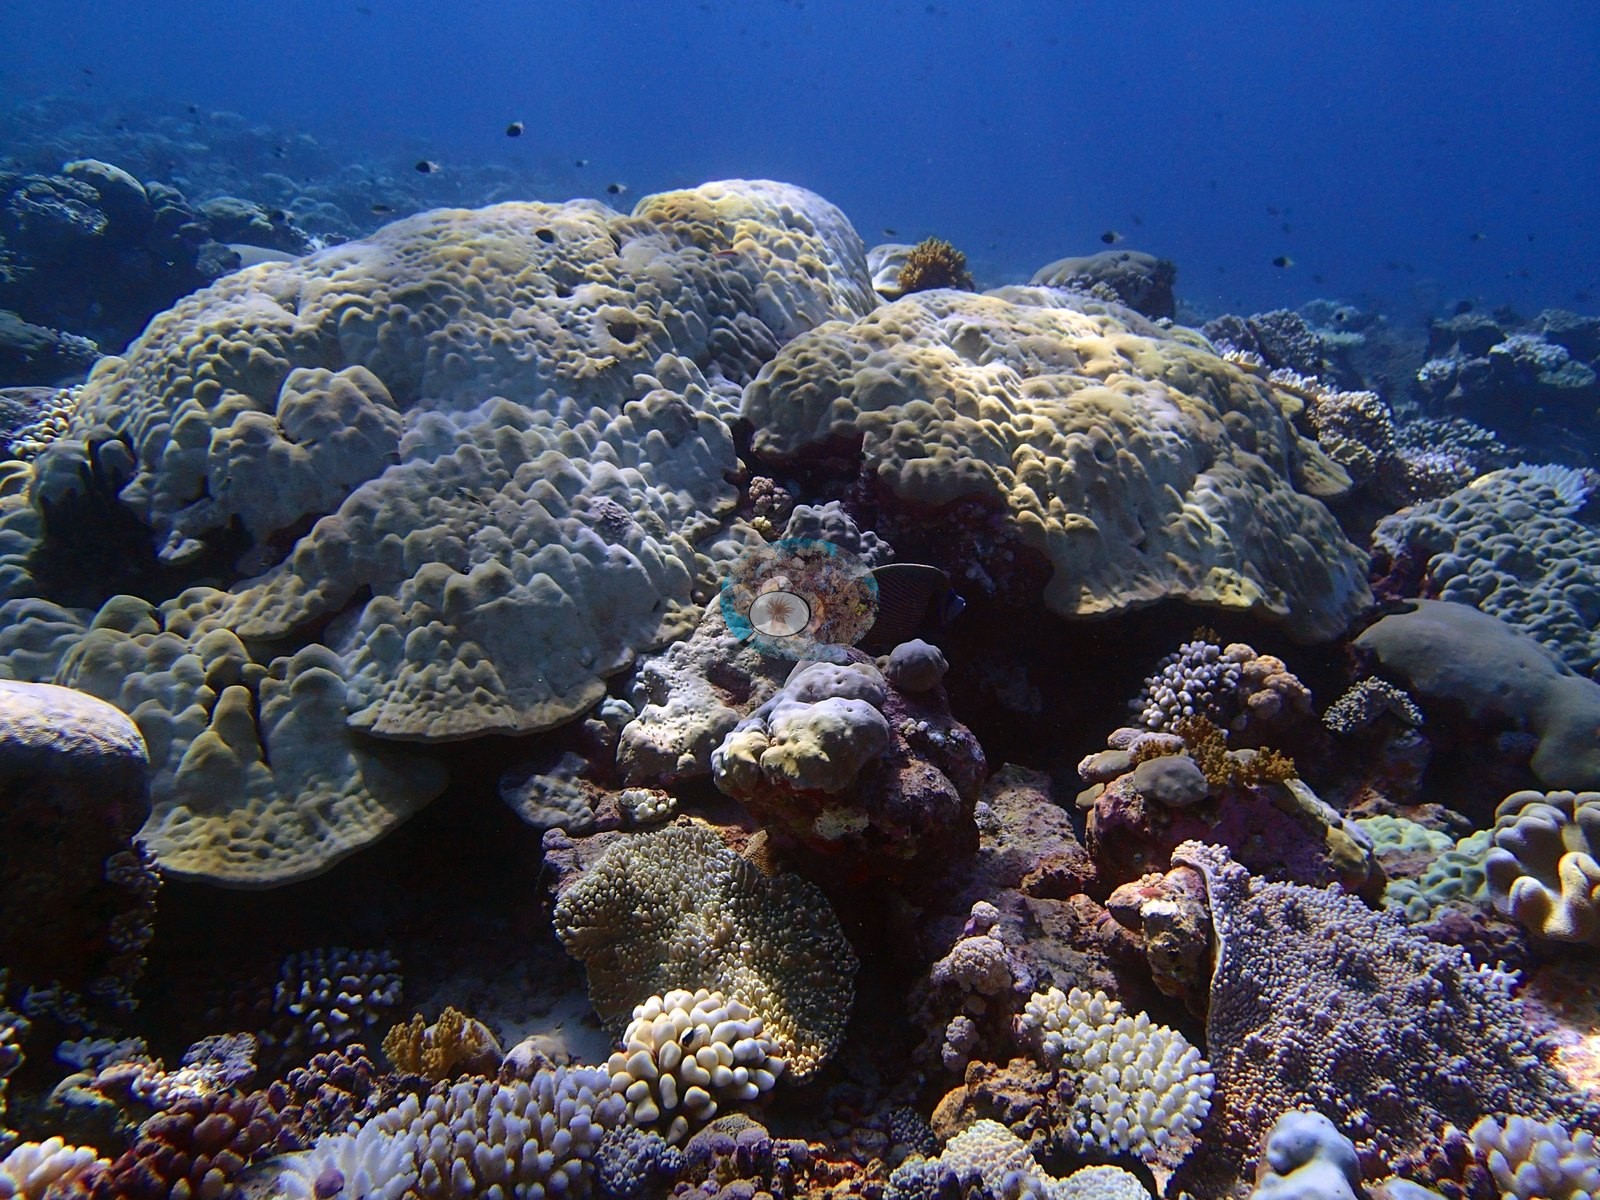
Another frame shows a large table- or foliose-like colony whose upper surface is coherently white, with intact corallite and plate structure still visible. Additional pale colonies occur in a later run of frames. The recurrence across both wide and close views makes bleaching the most parsimonious reading. Not every pale feature is classified as bleaching. White branch tips can reflect active growth, bright illumination, or normal interspecific color, and some exposed skeleton is already dulled by sediment or overgrowth. The flagged examples were selected because pallor extends broadly across intact tissue and contrasts with nearby pigmented colonies. Small dark points on the large pale table- or foliose-like colony could be attached organizms, sediment, or localized mortality, but they do not justify a disease diagnosis. No crown-of-thorns starfish (COTS) or other corallivores evident.
Fish and other fauna
Several frames show fish close to the substrate, including small damselfish-like and surgeonfish-like silhouettes, but the sequence is not a fish census.
Comparisons with other data
No independent survey was made at this exact site; the nearest ones are listed in the table below.
CV model comparison
More info
Those are point counts on the photographs; this is a diver swimming a transect. The models and the reference never saw the same thing. ⚠ SITE-LEVEL ONLY. The 2,500 frames were not associated with any transect taken within 200 m of them, so transect-vs-image comparisons are site means, never frames. The transect value is already in the pin `cover` field (109 of 112 pins, sourced to the paper's suppl. S1) and is read from there, never re-imported. The transect is THE coral-cover value for this site and stands alone. The rows below it are a methods comparison only: no computer-vision value is averaged with it, feeds the headline, or carries over to the site's cover figure (Anderson, 2026-09-22).| Method | Hard-coral cover (%) |
|---|---|
| Transect (published) | 32.5 |
| CoralNet | 28.4 |
| In-house DINOv3 | 37.2 |
| CoralSCOP edited | 36.1 |
| Claude | 30.1 |
Independent surveys nearby
| Agency / program | Year(s) | Stations / distance | Link |
|---|---|---|---|
| Lange et al. (2021) | 2006–2020 | 1 station, 0.97 km | Records ↓ |
| Sheppard et al. (2008) | 2006 | 1 station, 3.18 km | Records ↓ |
 Dr. Coral (CRD)
Within 5 km, 2 independent survey stations recorded hard coral cover in 10 surveys between 2006 and 2020. Of the 1 station surveyed in more than one year, 1 declined between their first and latest surveys. The longest record, Salomon Atoll (Lange et al. 2021, 0.97 km away), went from 29% in 2006 to 12% in 2020. The most recent nearby survey is from 2020, so these values predate recent heat stress. This site's own estimate (33%) sits within the range of these surveys (9.9–43%); the methods differ, so the comparison is context, not a like-for-like test.
Collected by other programs using different methods, so these are context for the figures above, not a like-for-like comparison. Where a station was surveyed more than once the range is shown. Station names are not dive-site names.
| Agency | Site / location | Date | Hard coral cover (%) | Distance | Link |
|---|---|---|---|---|---|
| Lange et al. (2021) | Salomon Atoll | 2006–2020 | 9.9–43% (5 surveys) | 0.97 km | HeatCRD database |
| Sheppard et al. (2008) | Salomon | 2006 | 32% (5 surveys) | 3.18 km | HeatCRD database |
Data & links
- Read the full site report ↗
- Download benthic survey data (CSV) ↗
- Download all LOF-GRE data (933 sites) ↗
- CoralNet image repository for this region ↗
- HeatCRD database ↗
- (reference) ↗
- Photo portfolio ↗
- Coral Reef Diagnostics page for this area ↗
All images from Coral Reef Diagnostics. Data are from Coral Reef Diagnostics and the organizations named in the data-sources table above.
 © Coral Reef Diagnostics.
References
- Mayfield AB, Dempsey AC (2026). Using tourist diver images to estimate coral cover and bleaching prevalence in a remote Indian Ocean coral reef system. Oceans 7(1):1. PDF
- Lange ID, Benkwitt CE, McDevitt-Irwin JM, Tietjen KL, Taylor B, Chinkin M, et al. (2021). Wave exposure shapes reef community composition and recovery trajectories at a remote coral atoll. Coral Reefs 40:1819-1829. PDF
- Sheppard C, Harris A, Sheppard A (2008). Archipelago-wide coral recovery patterns since 1998 in the Chagos Archipelago, central Indian Ocean. Marine Ecology Progress Series 362:109-117. PDF