
Part of the regional summaries: Chagos Archipelago - Salomon / Blenheim / Speakers Bank and Chagos Archipelago
More info
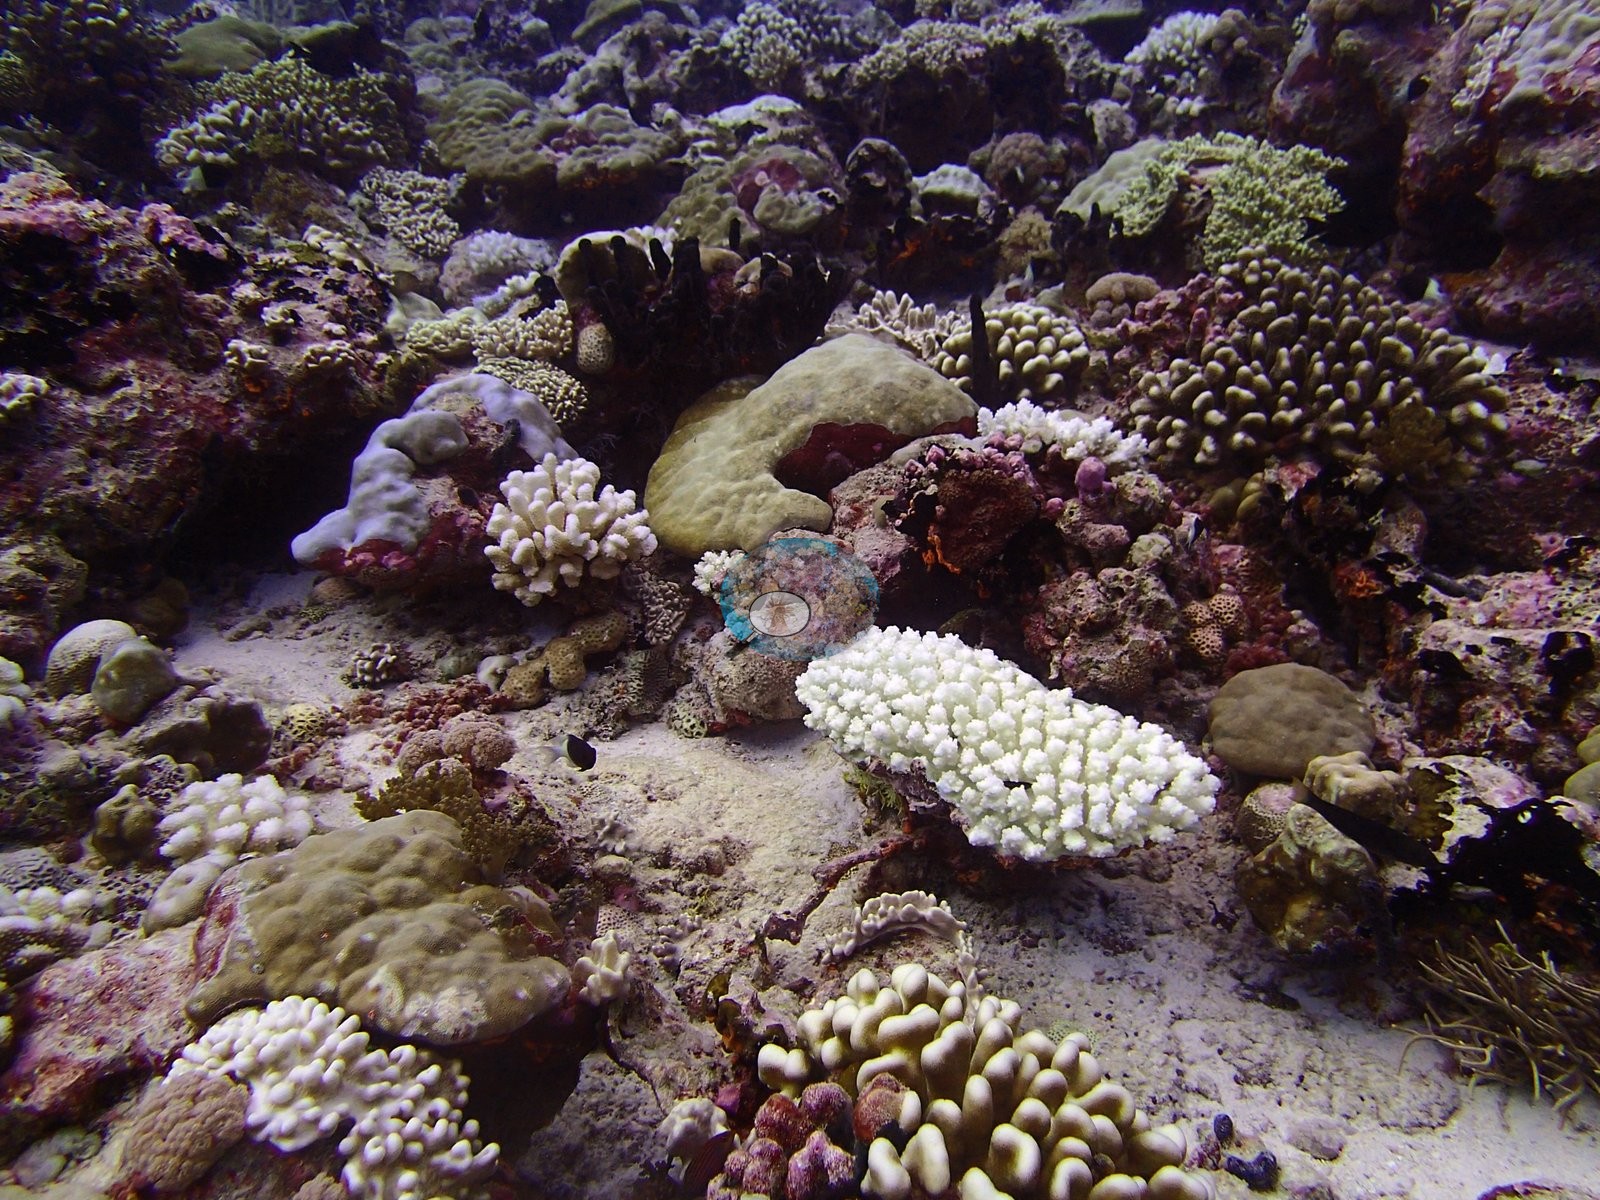
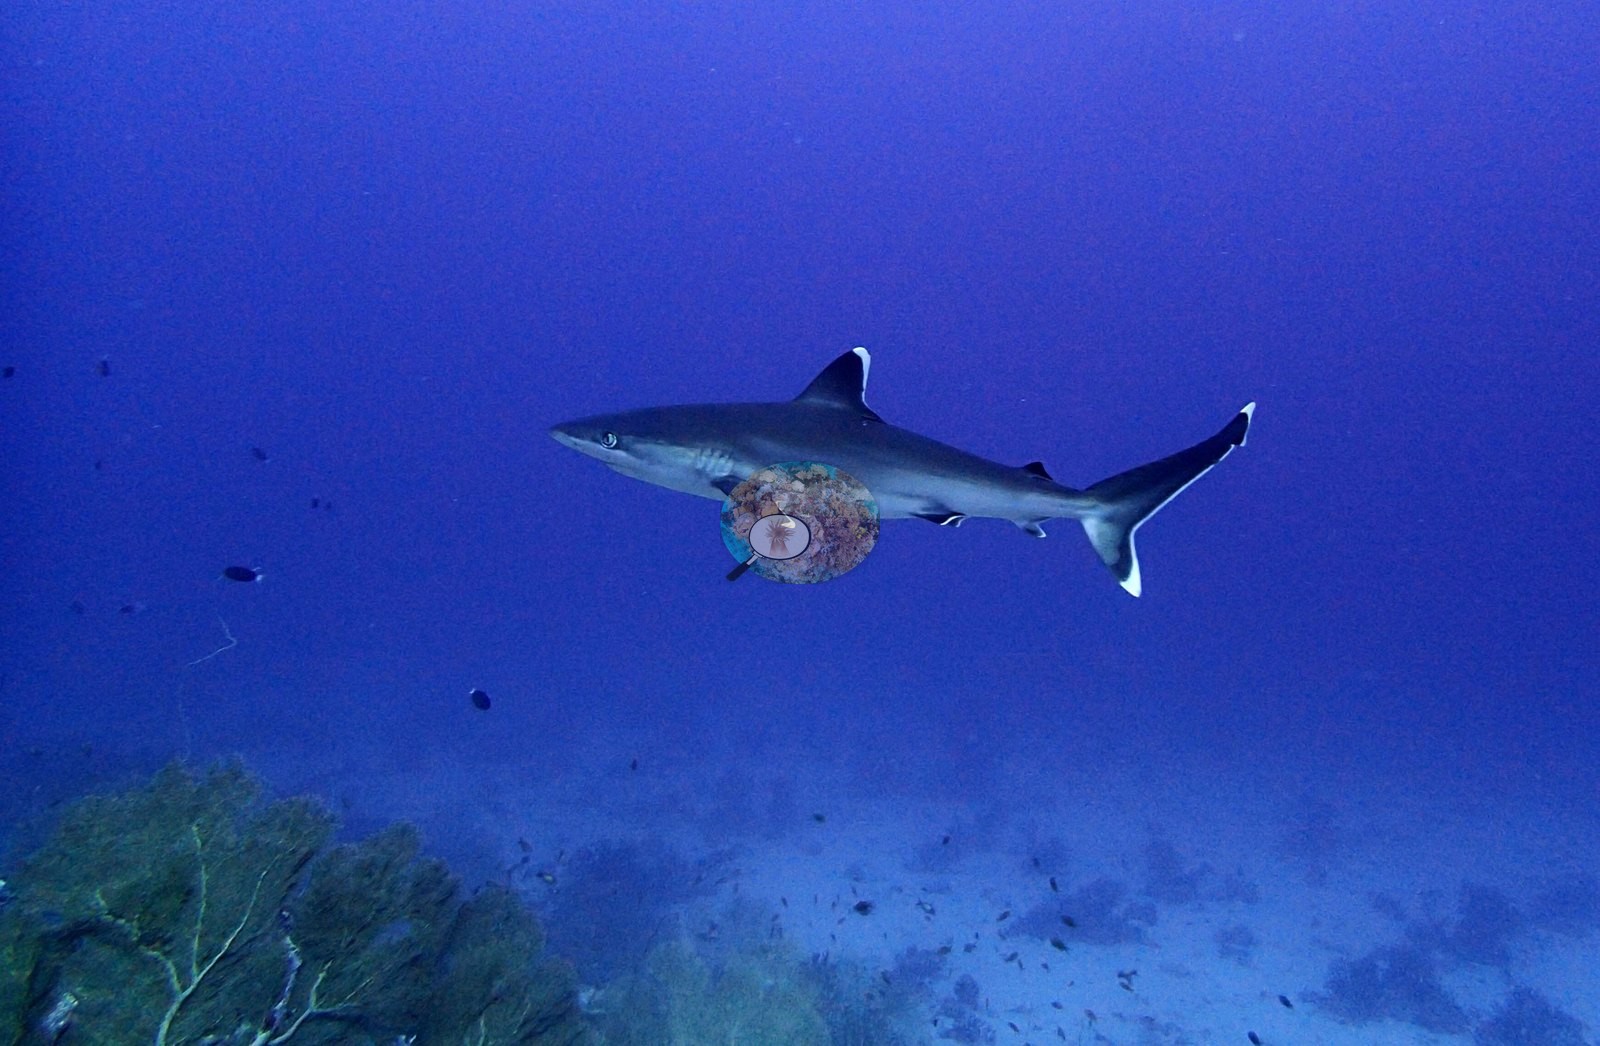
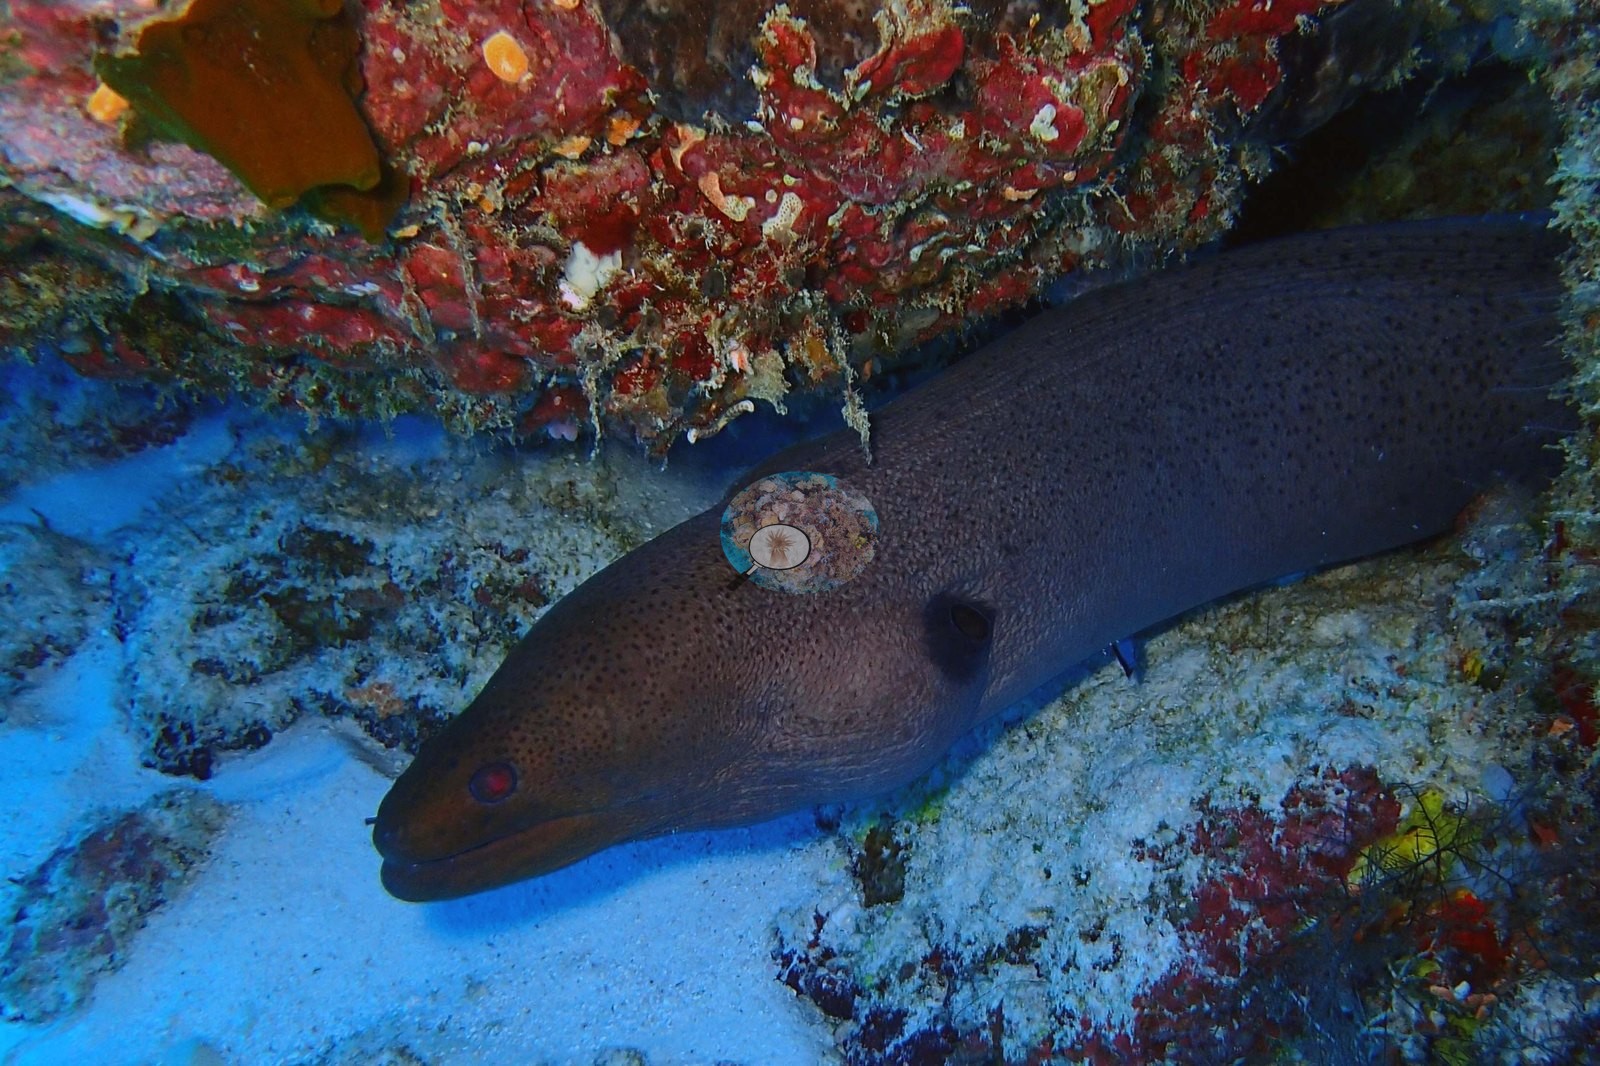
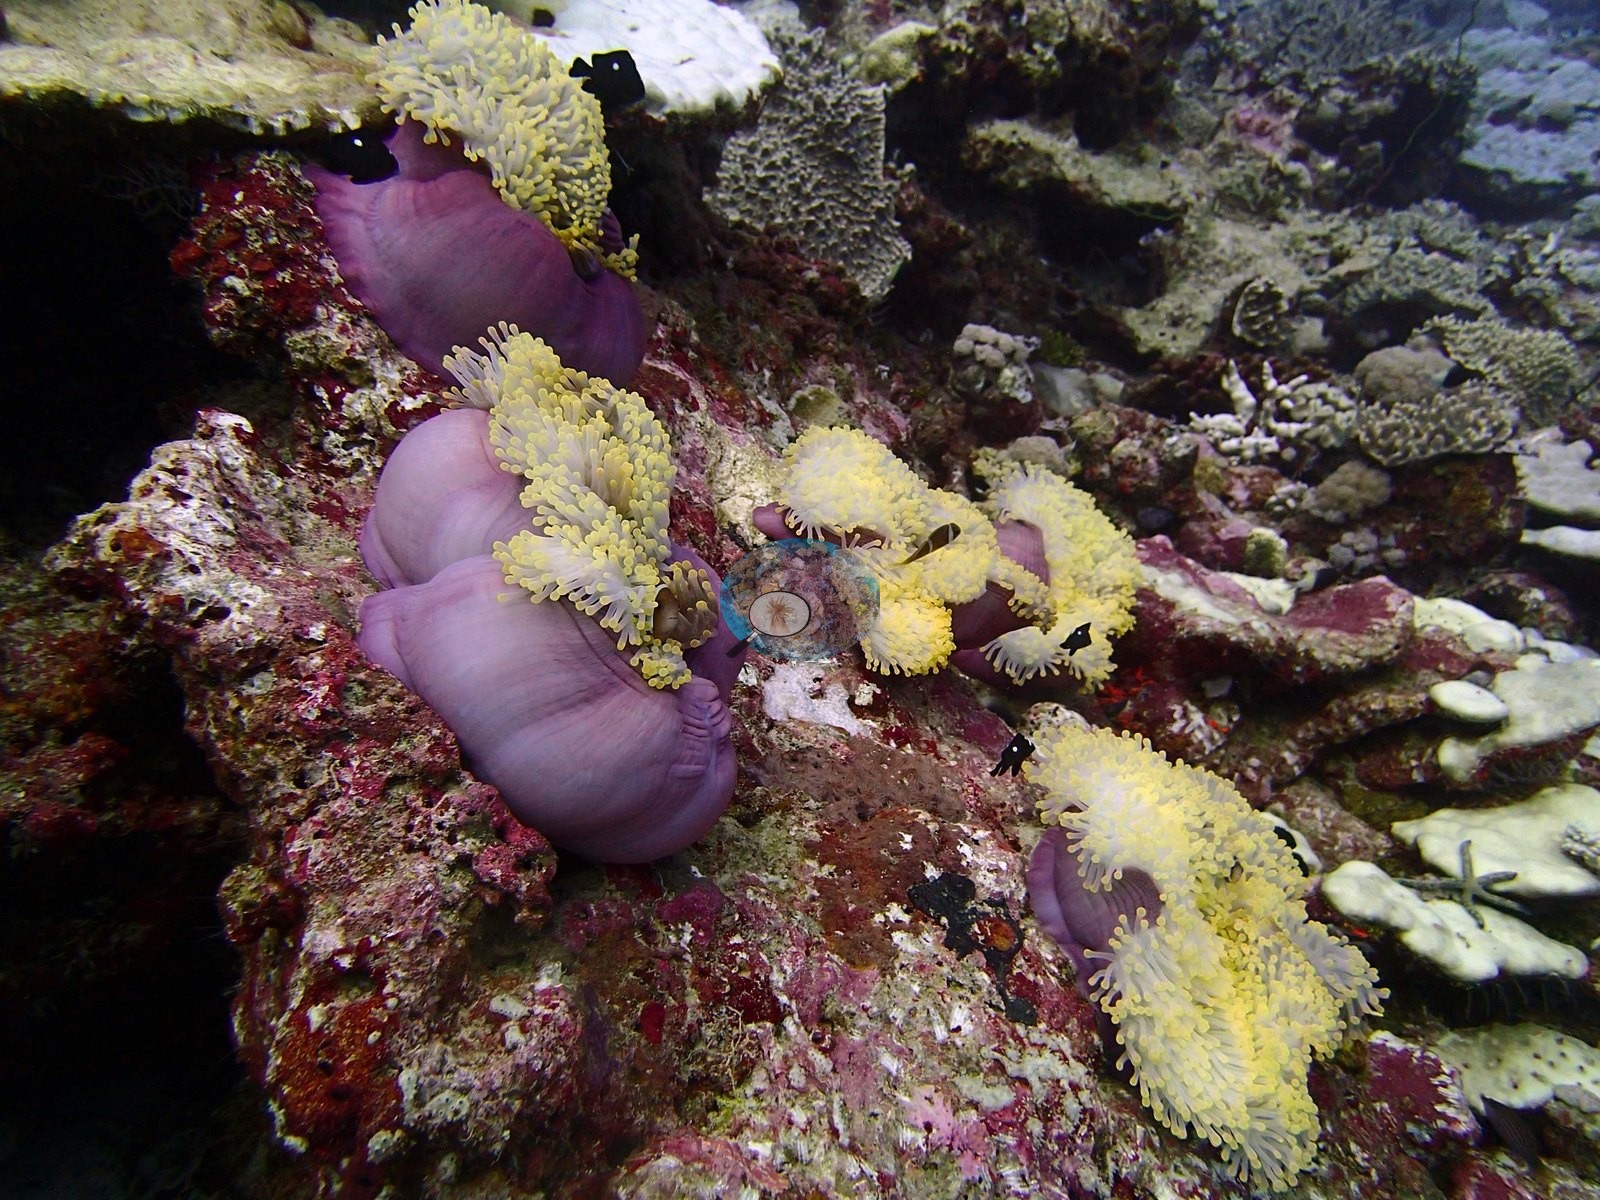
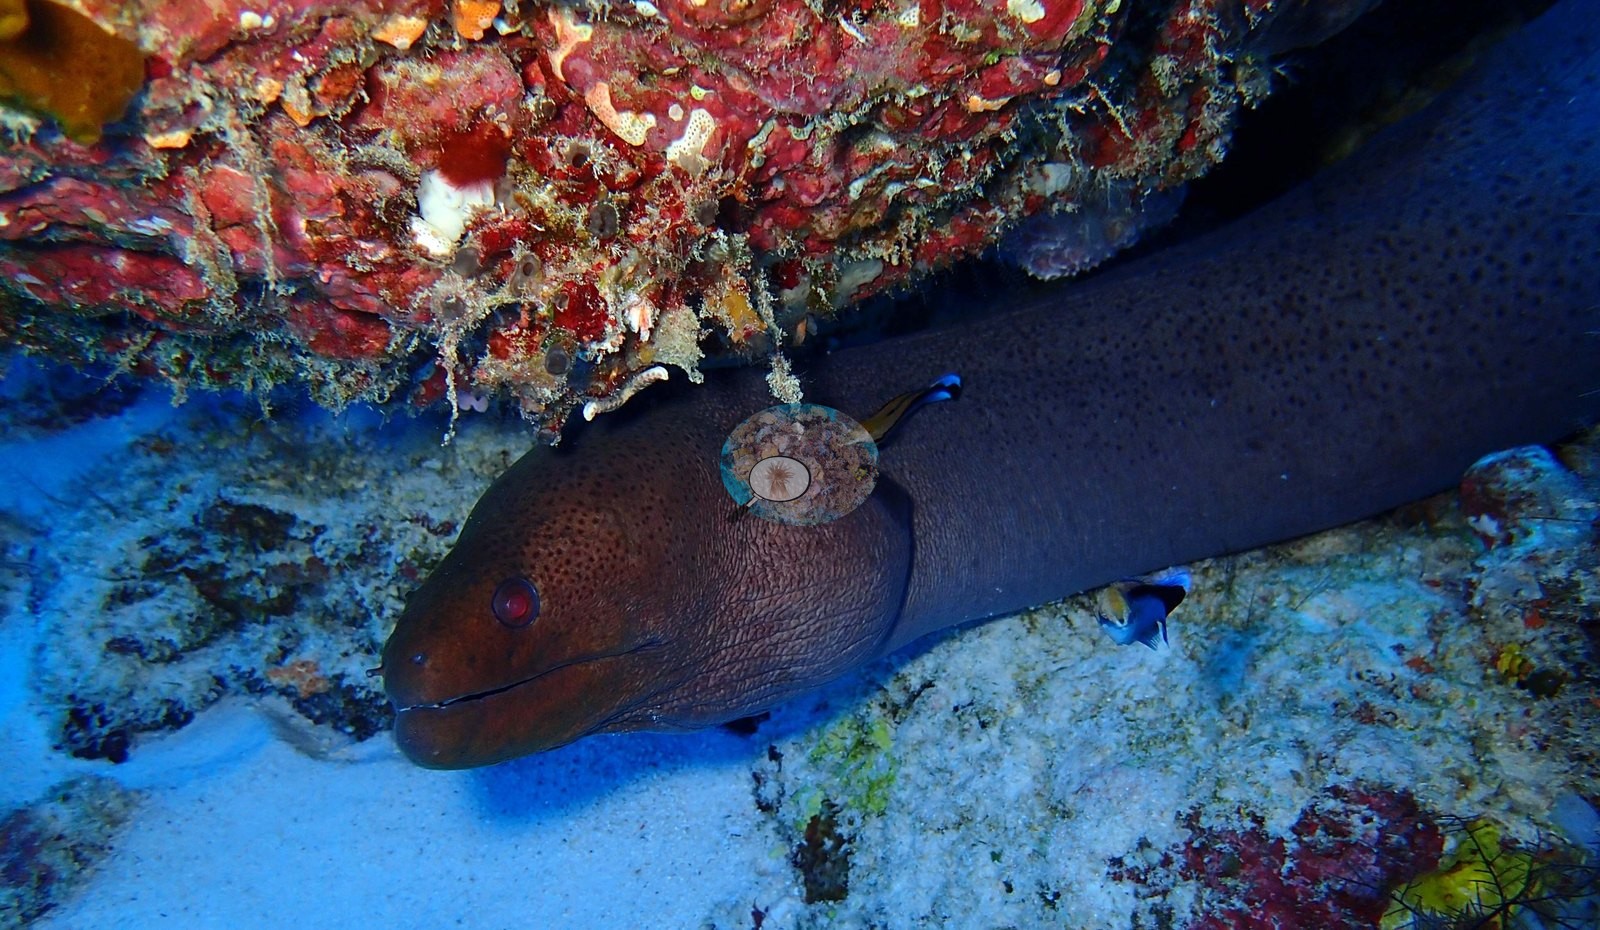
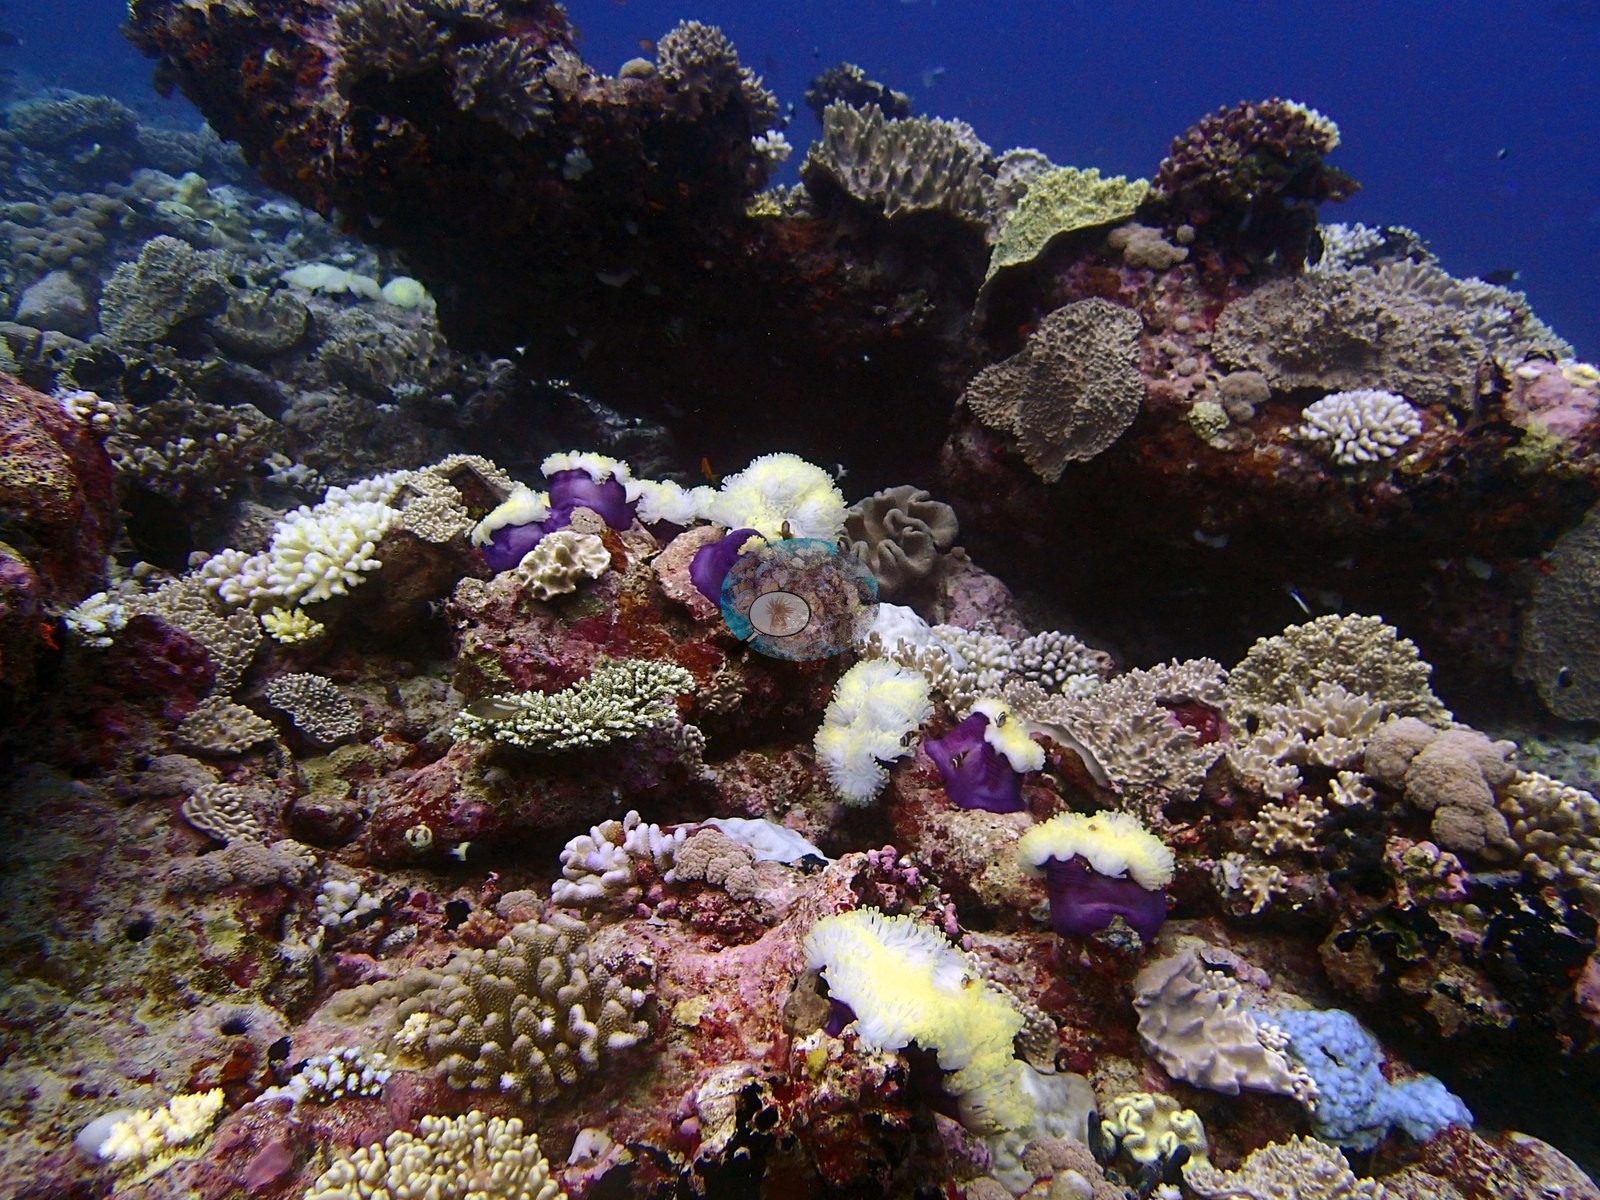
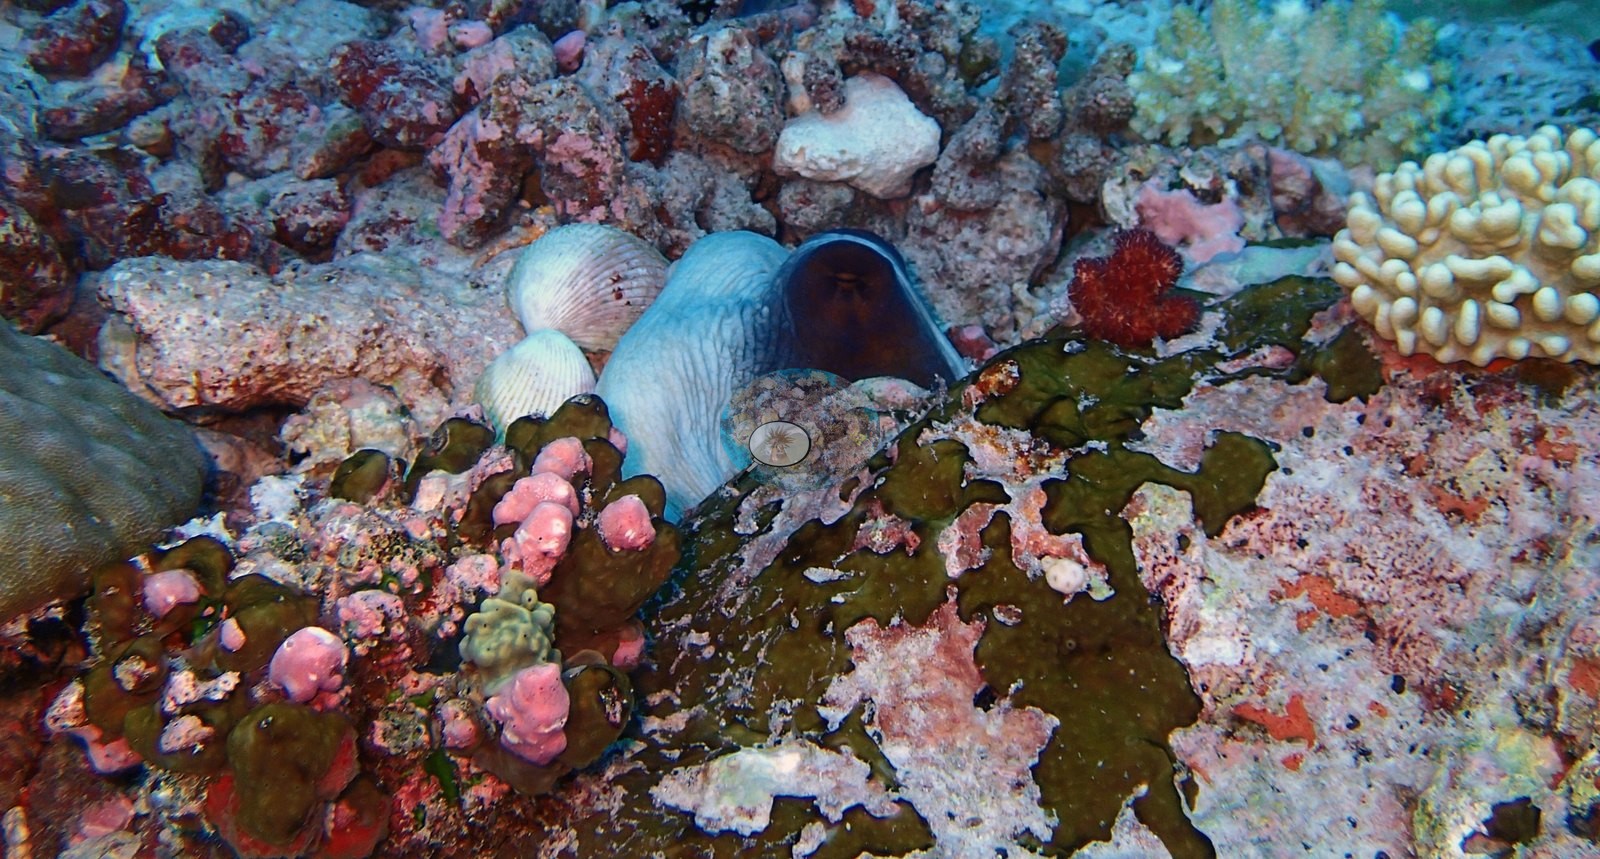
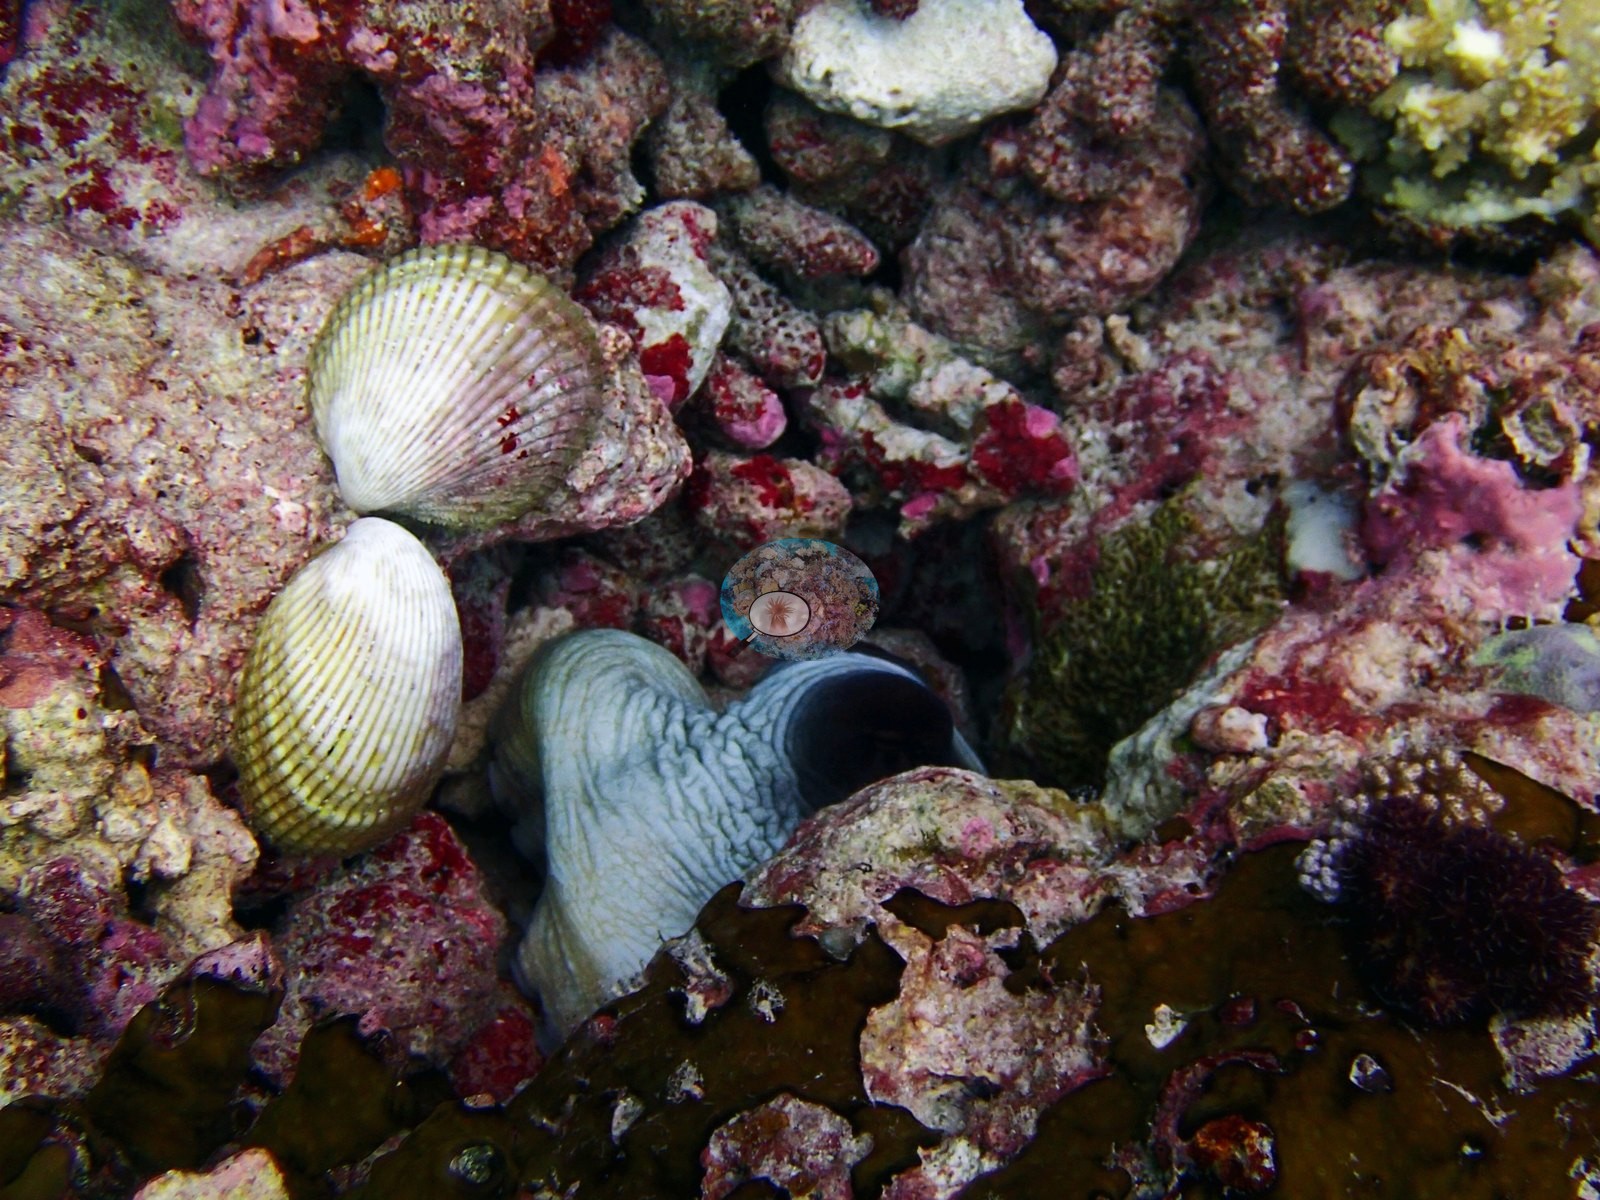
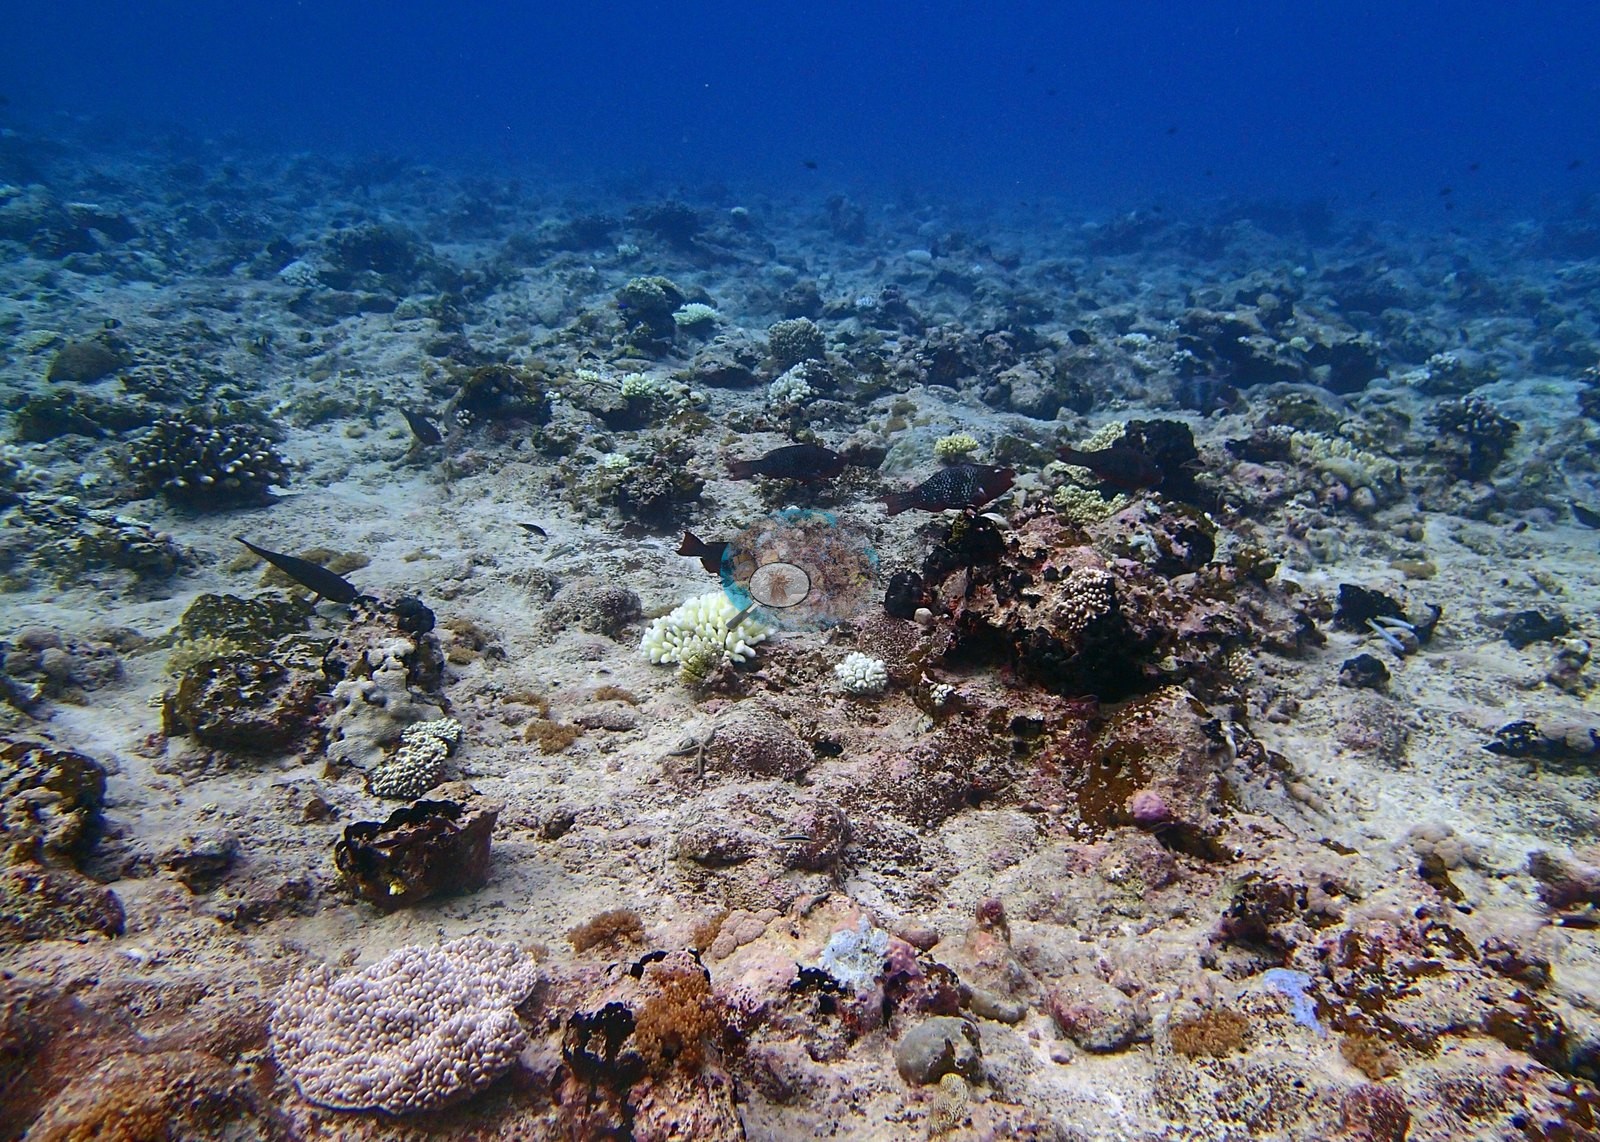
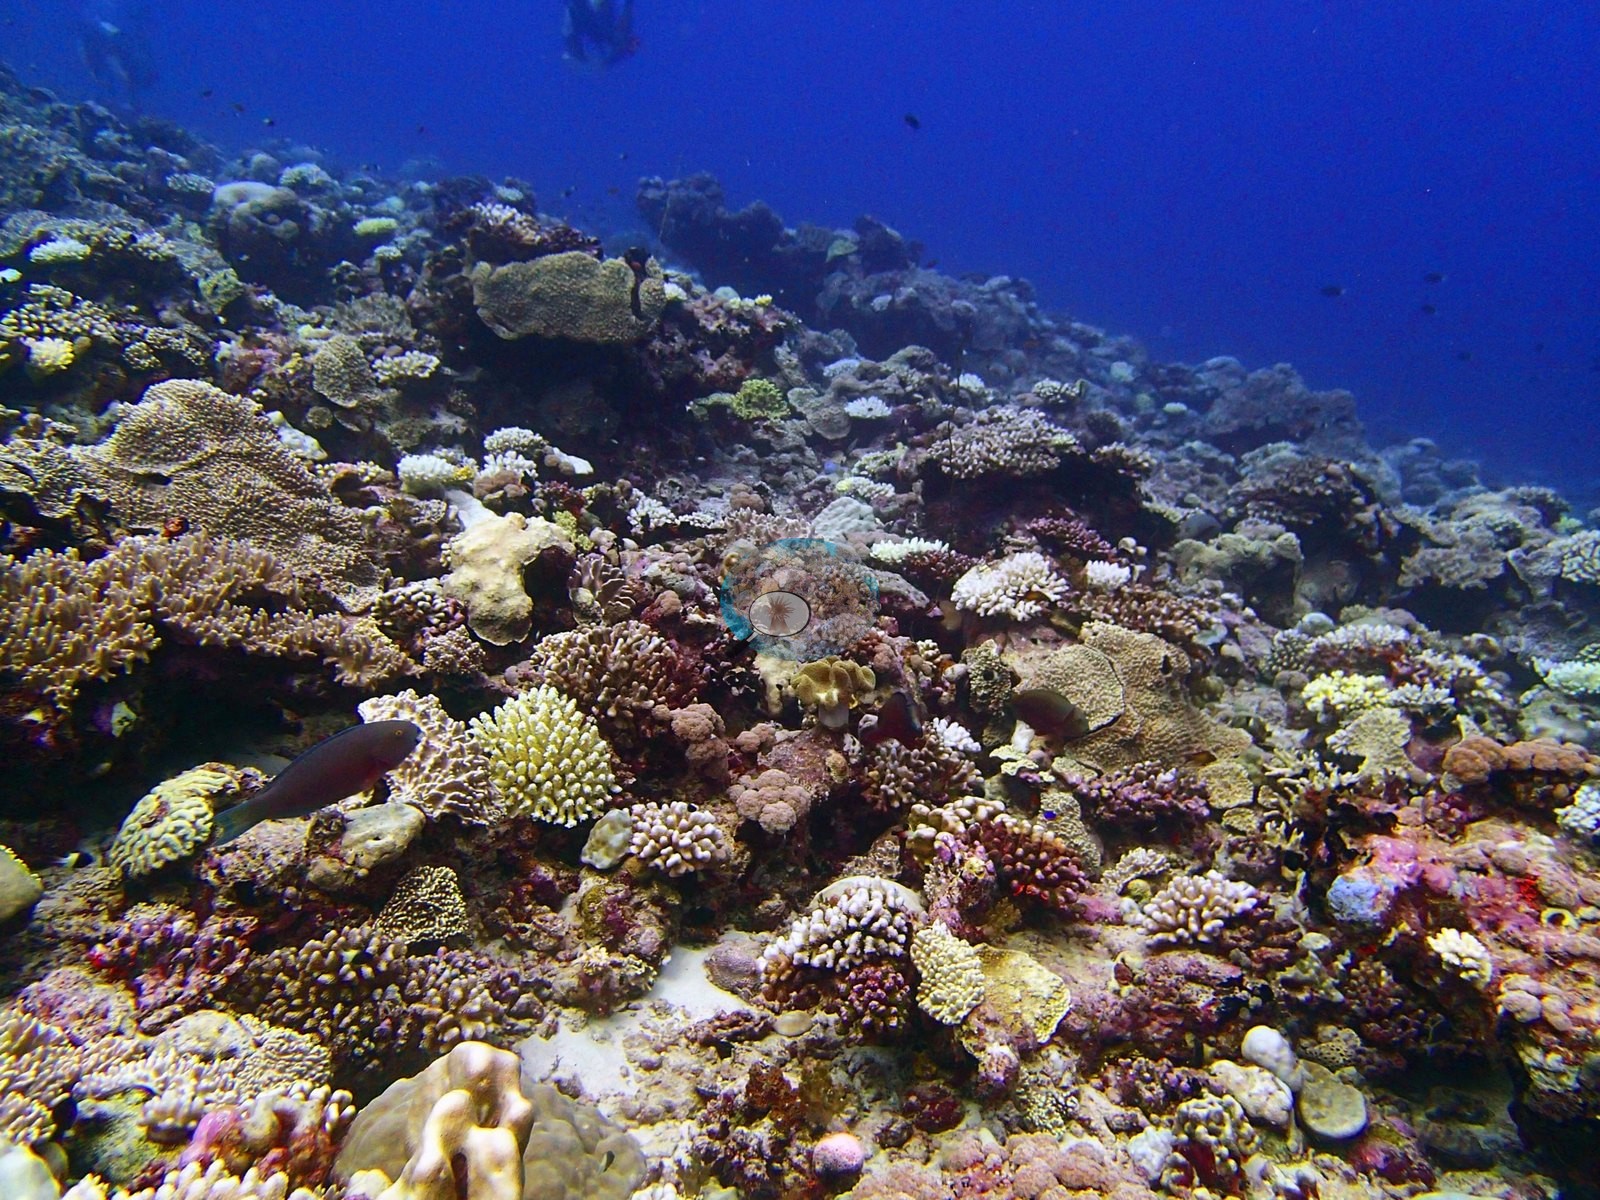
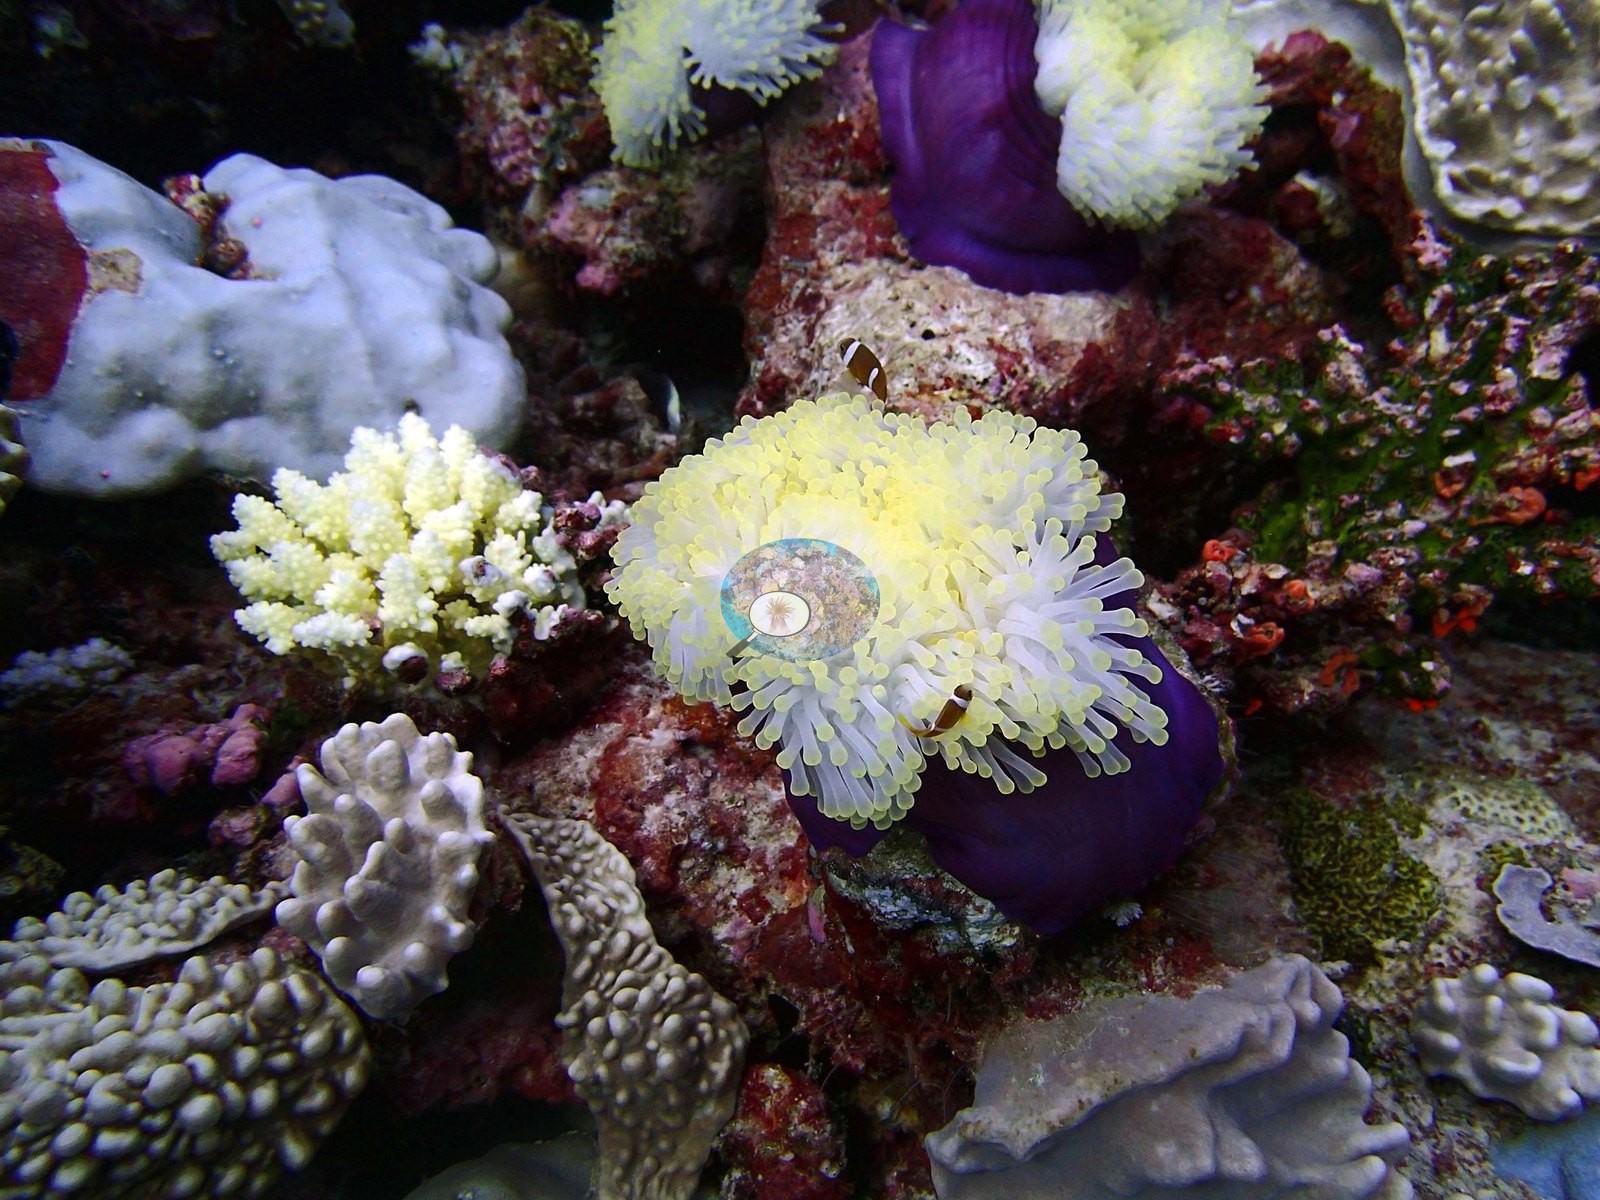
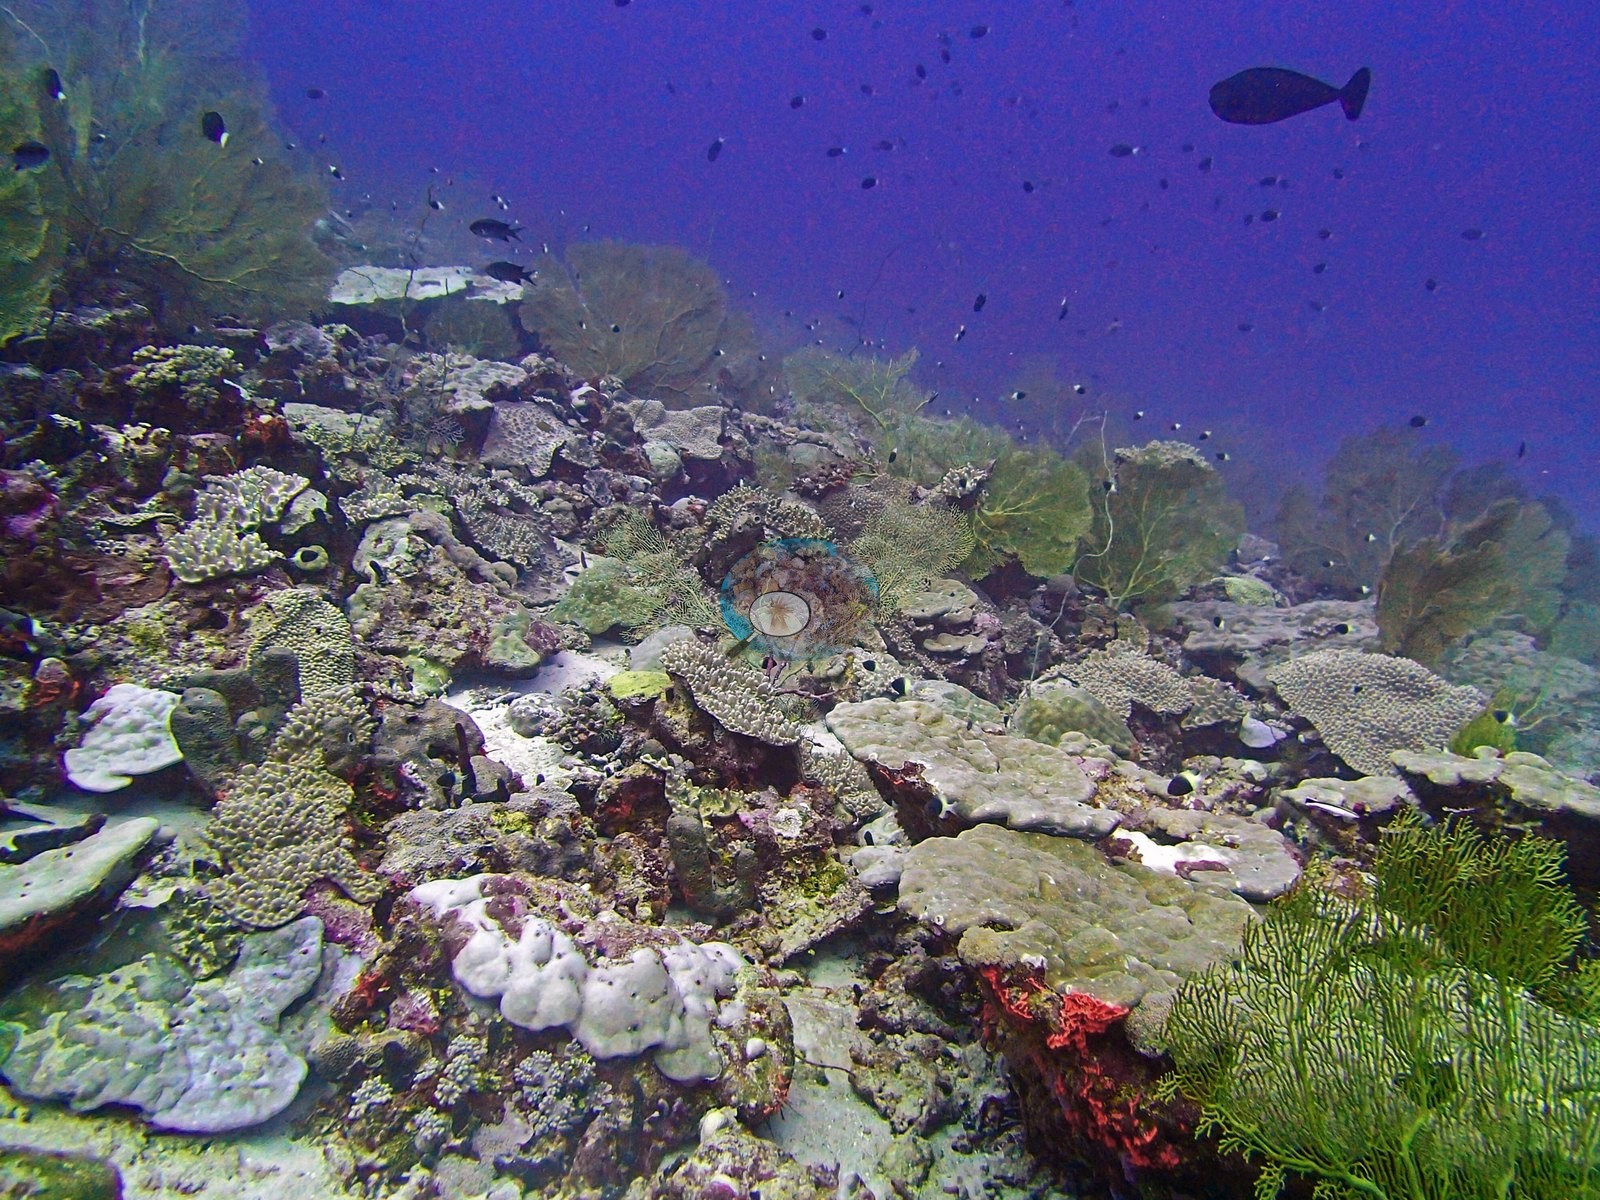
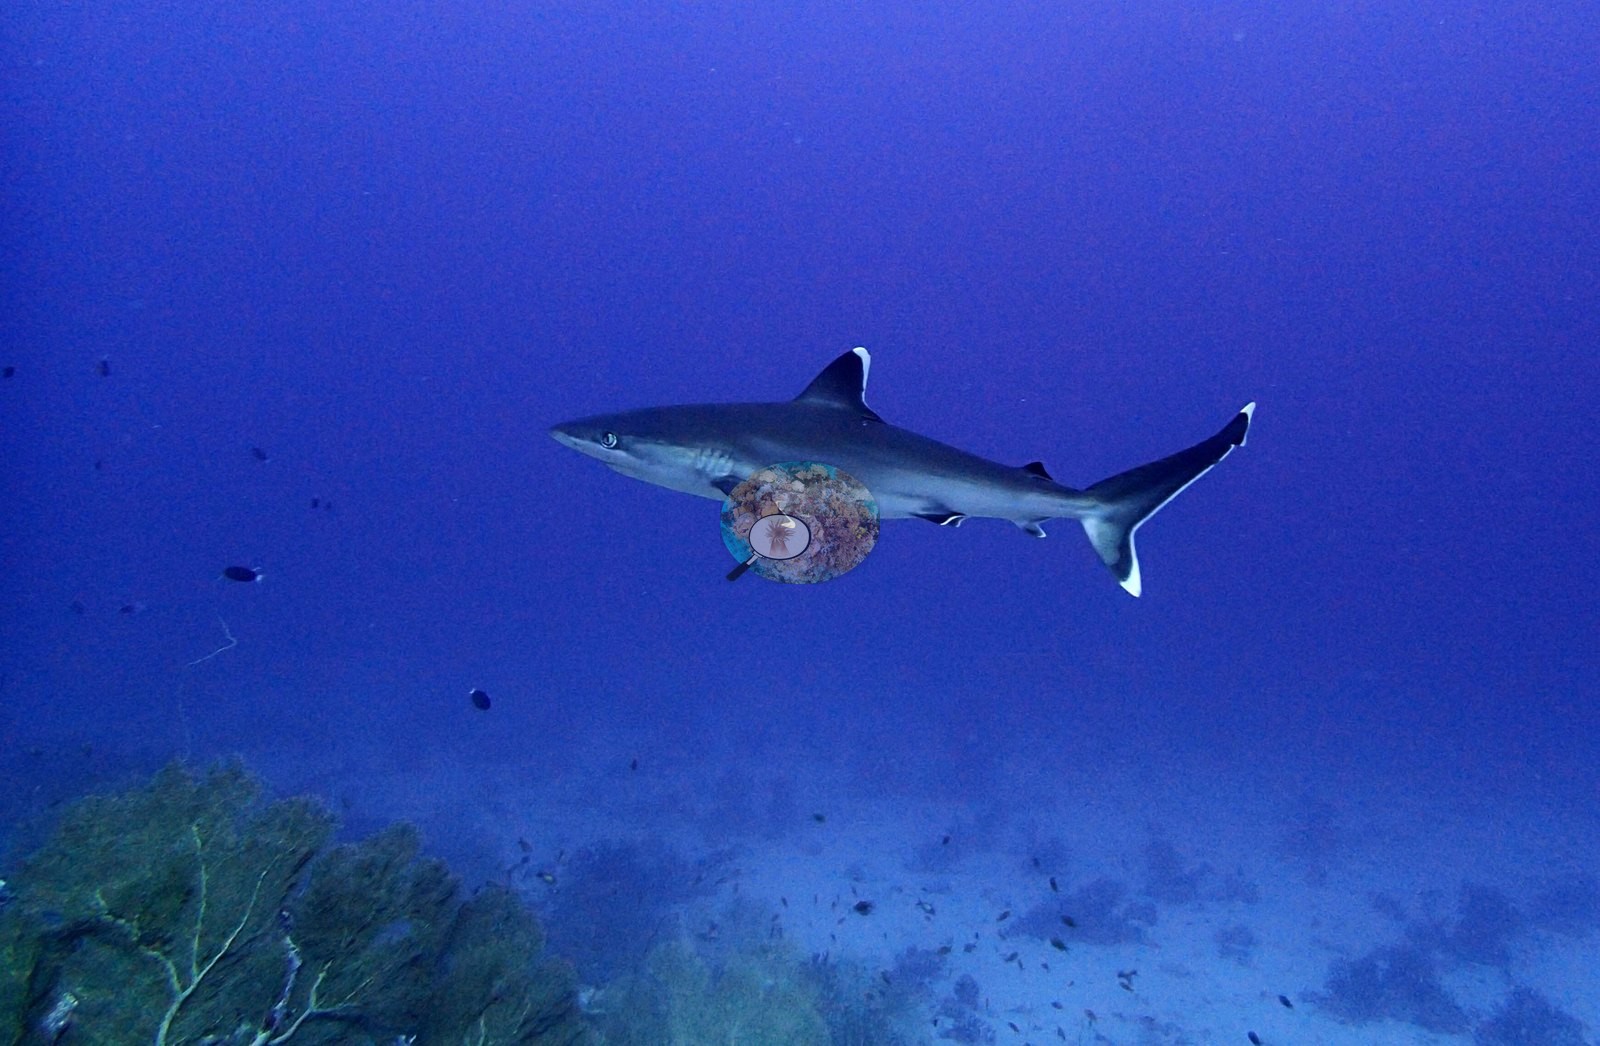
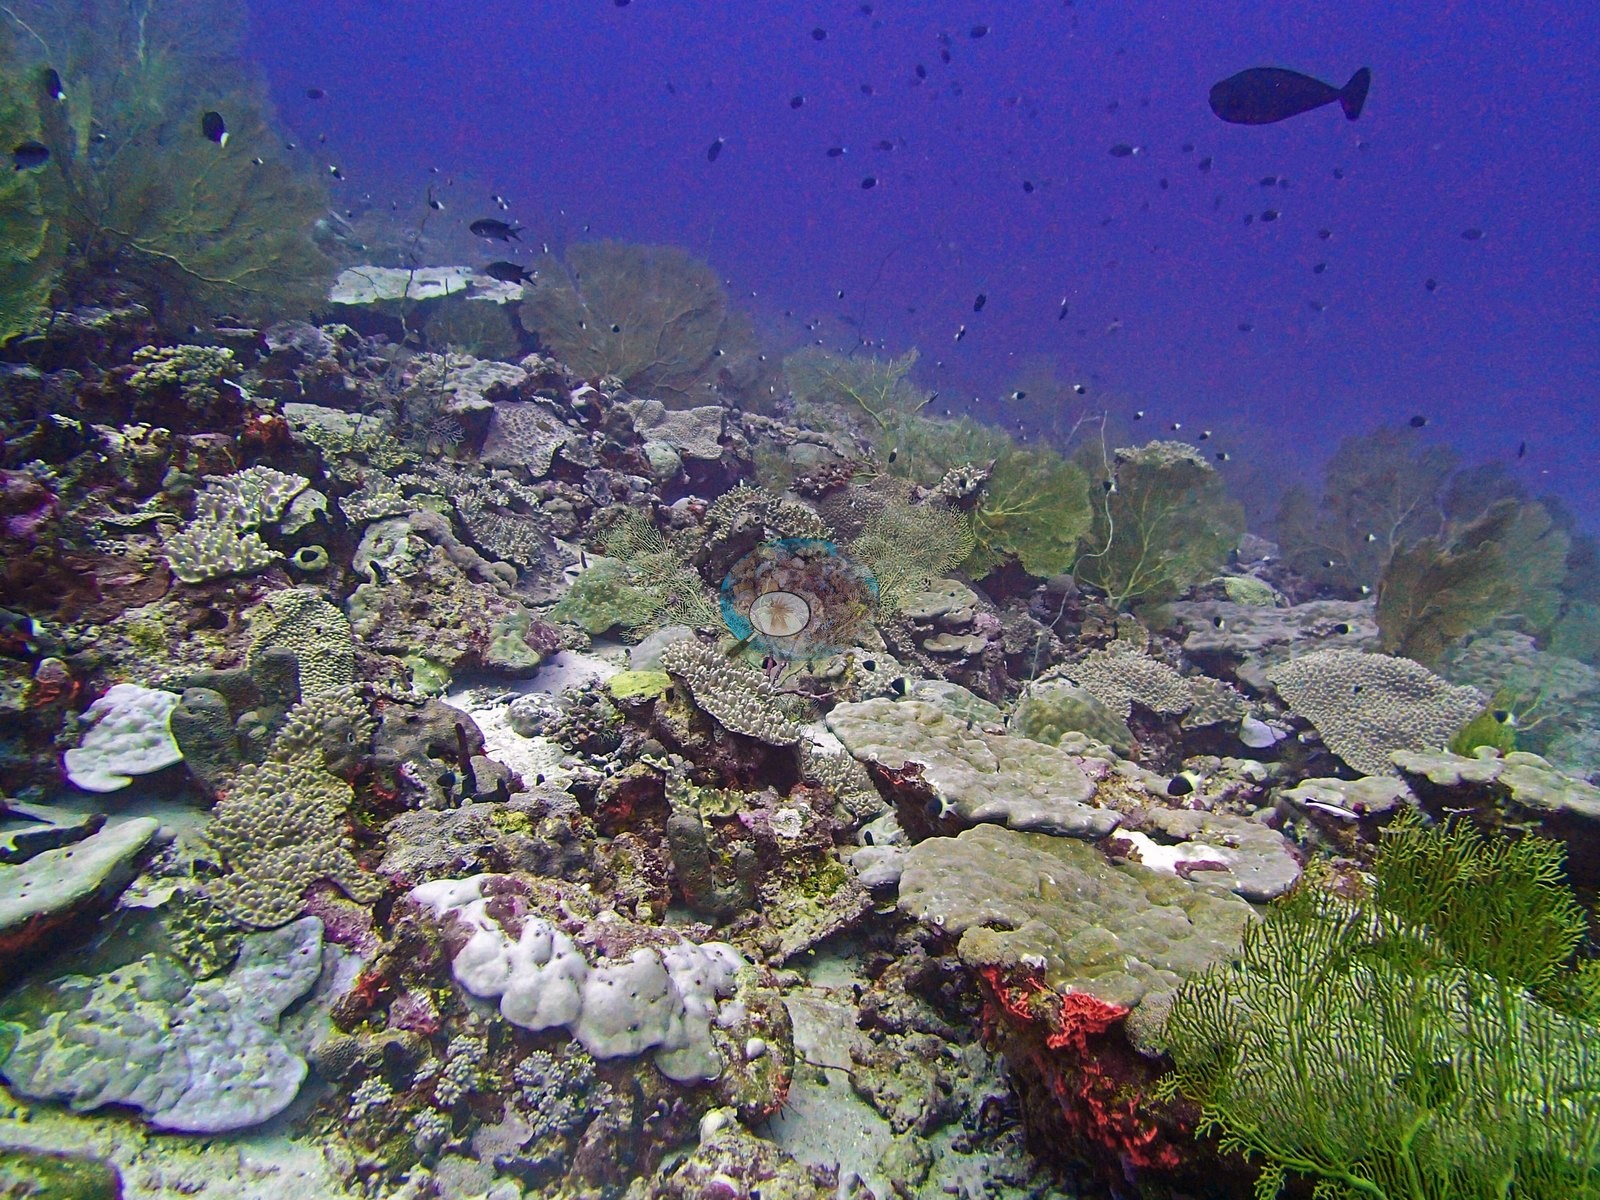
Chagos (NOAA CRW virtual station)A deep (33 m) exposed forereef outside Salomon atoll where anemones with anemonefish, soft corals, sponges, gorgonians, and giant clams cover slightly more ground than the coral itself (30.9%). Bleaching ranked among the worst in Chagos (19.2%), with stark-white colonies beside pigmented ones, and a silvertip-type shark, two giant morays, and an octopus were photographed. Surveyed on the Living Oceans Foundation's Global Reef Expedition.
Five independent survey stations shown with the program’s logo — click one to see how far it is from this site.
Three other CRD dive sites within 5 km shown in orange — click a marker to open its page.
🗺 Detailed map of the Global Reef Expedition dive sites, Salomon Atoll, Chagos (Khaled bin Sultan Living Oceans Foundation; opens in a new window)
3 of these 43 photographs are shown beside the text that discusses them under "Site description" below.
Site description
Setting
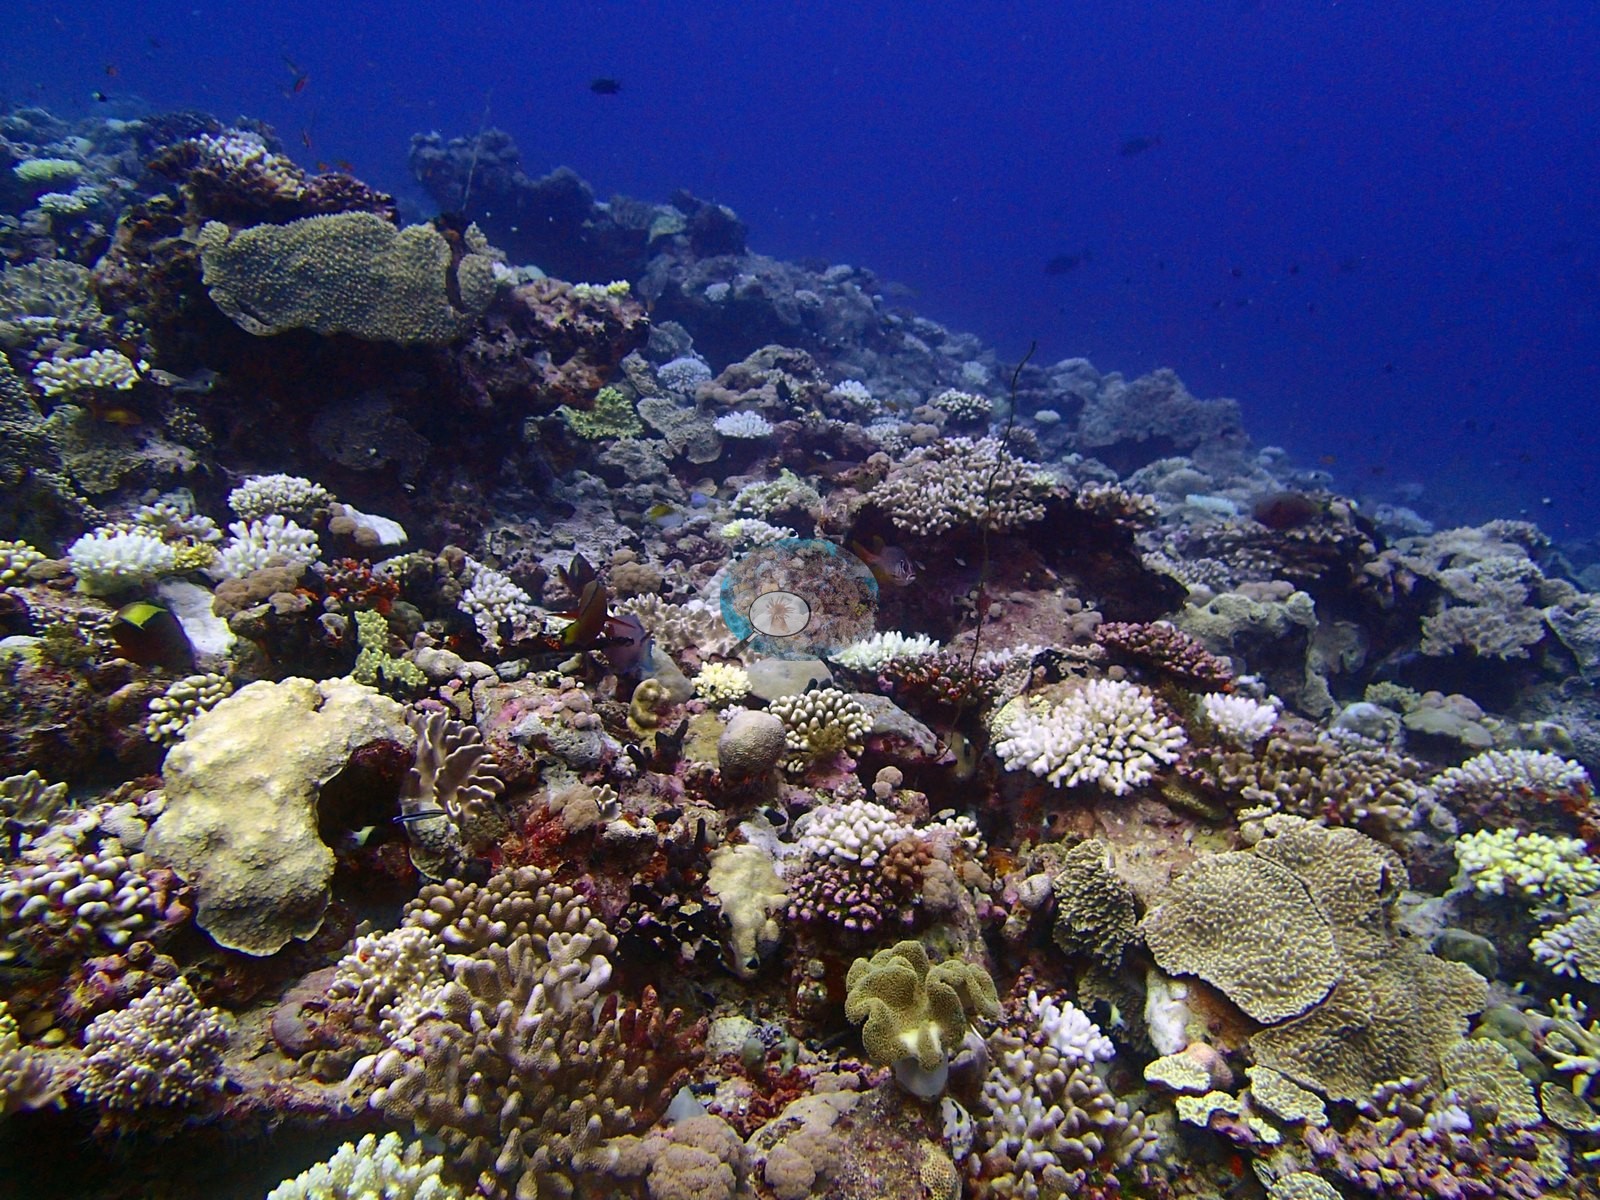
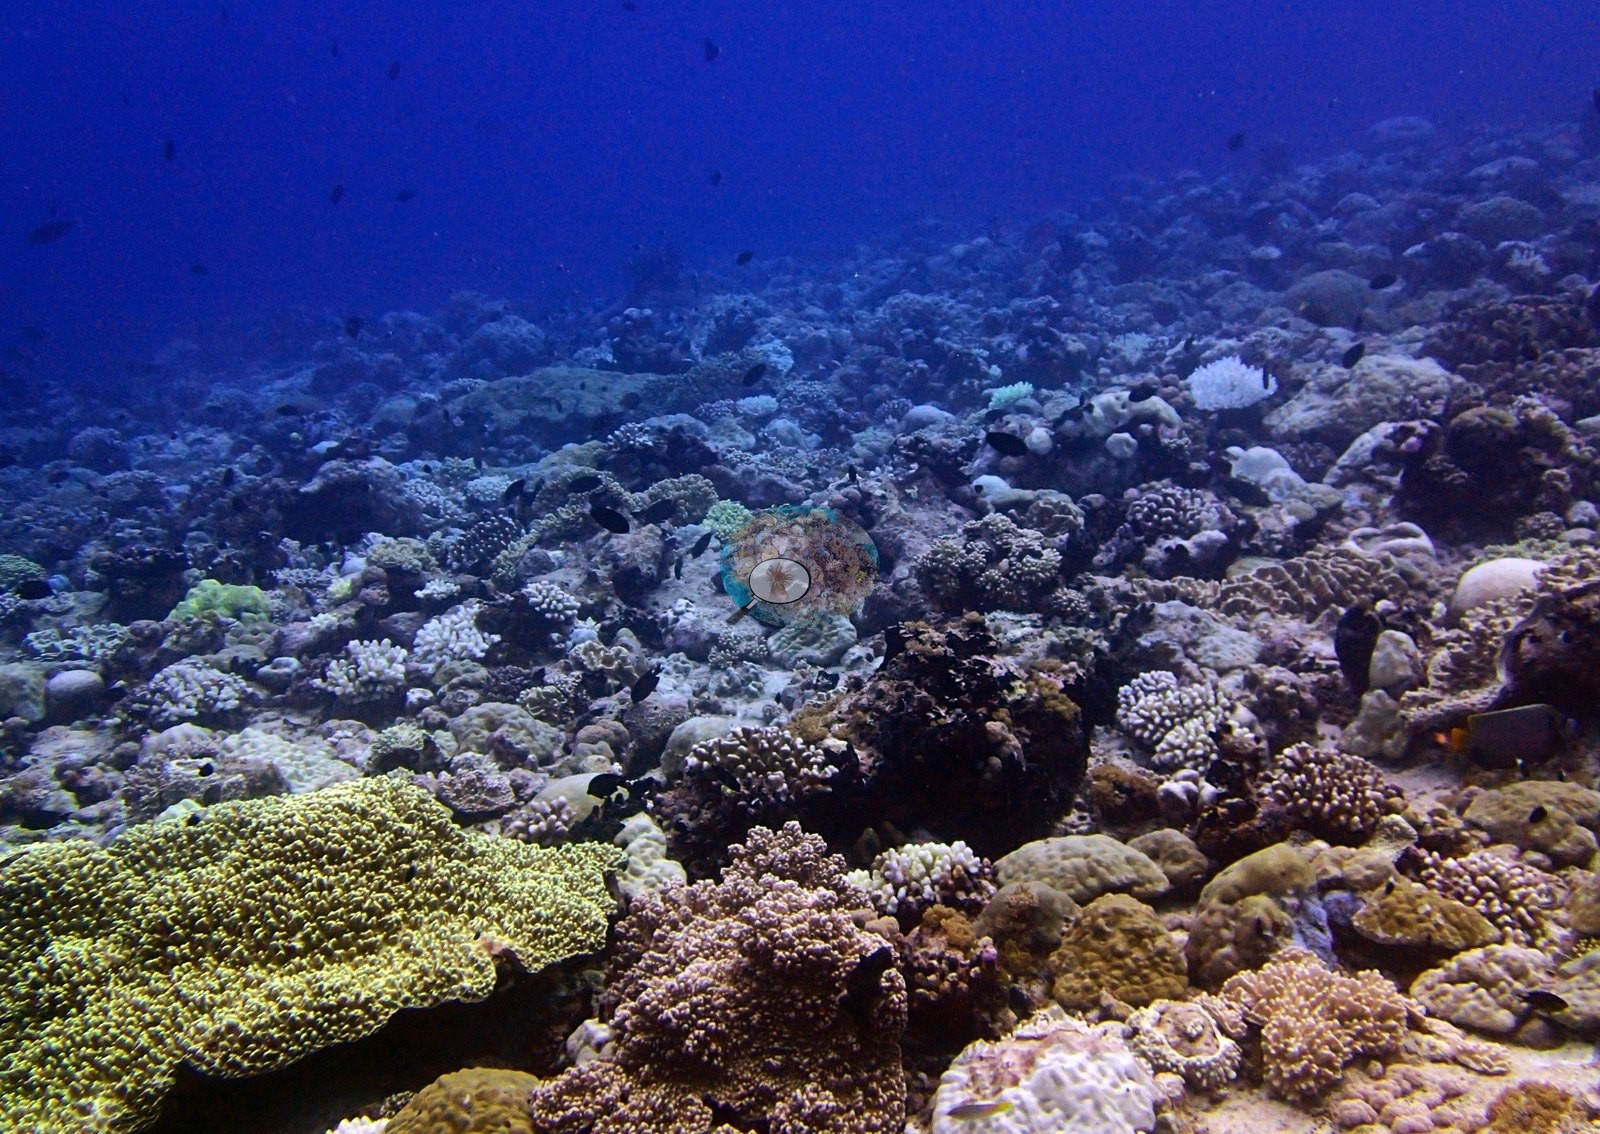
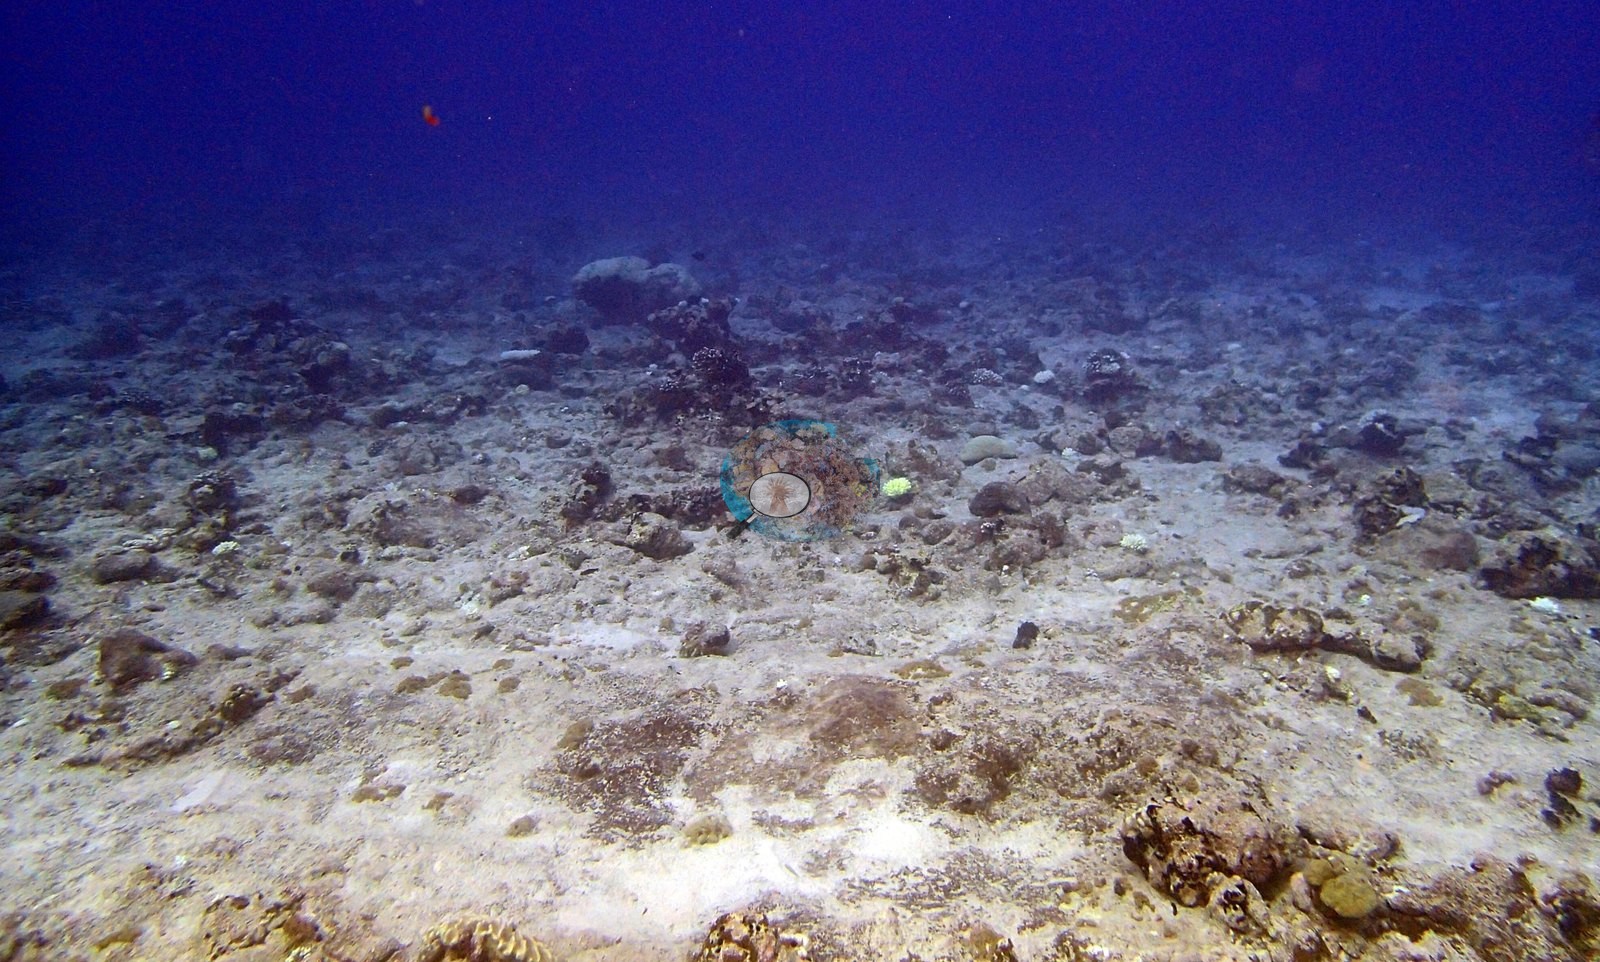
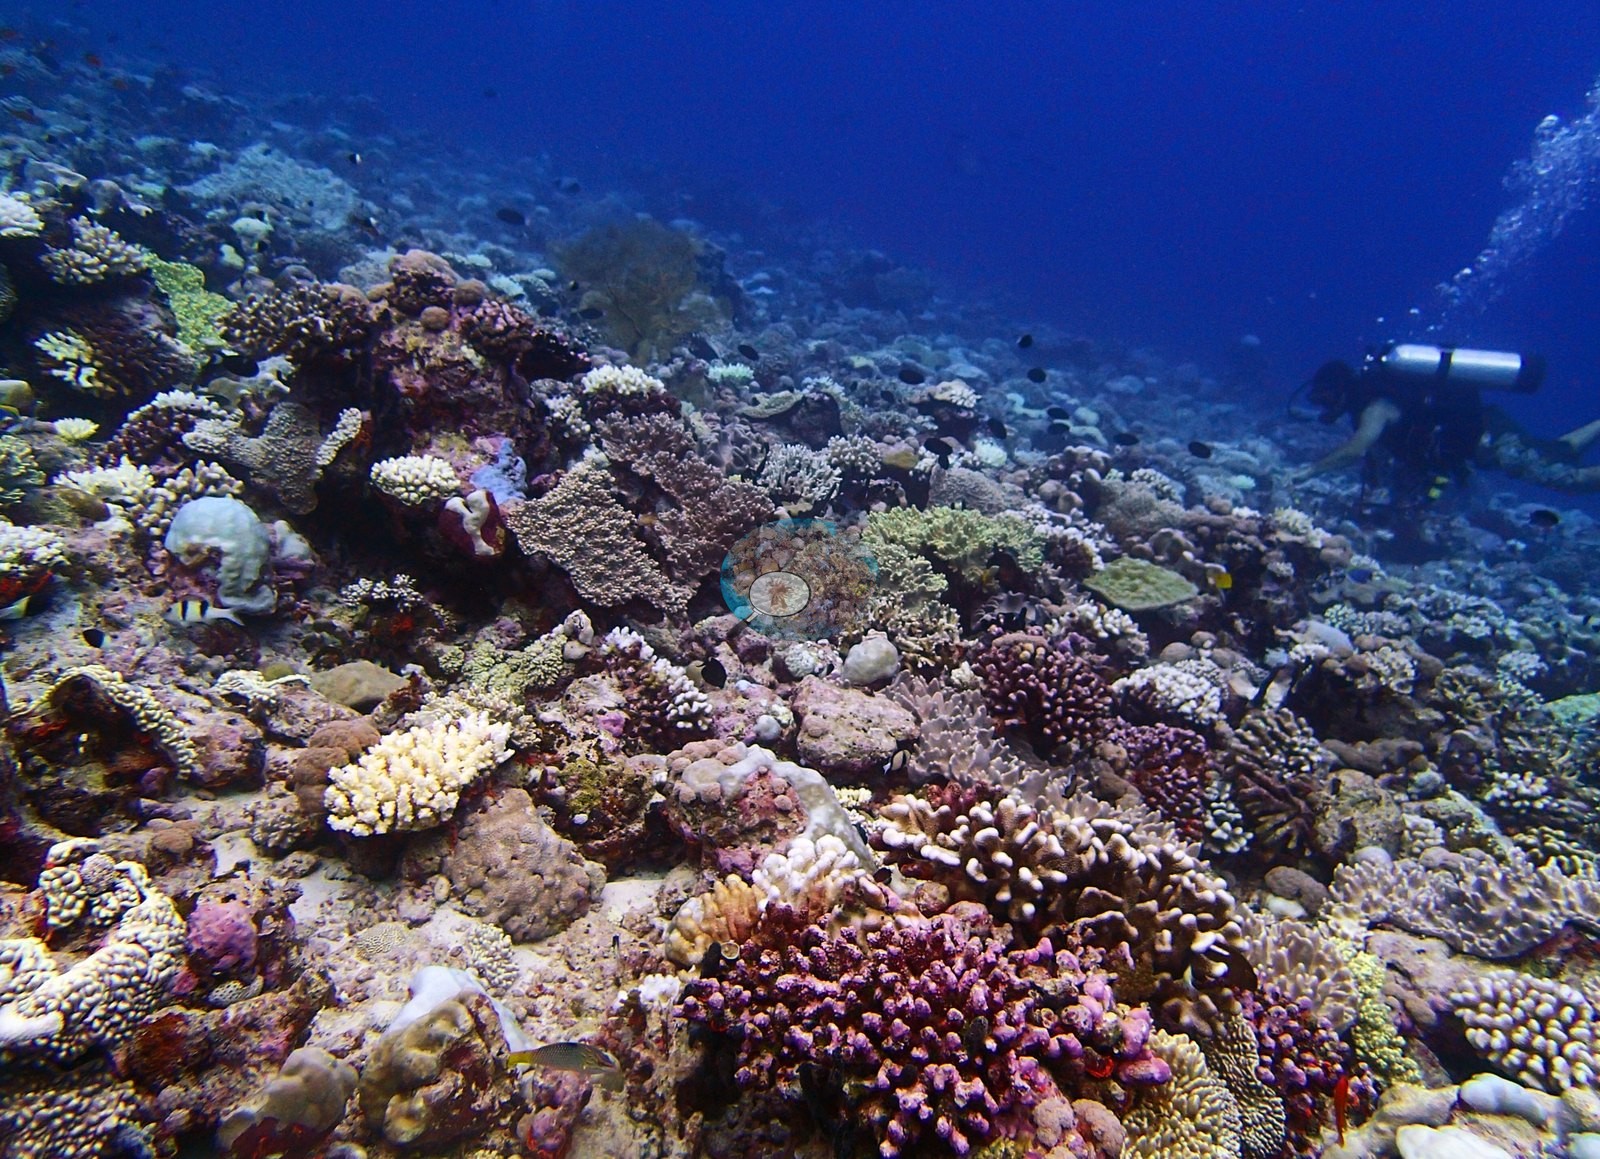
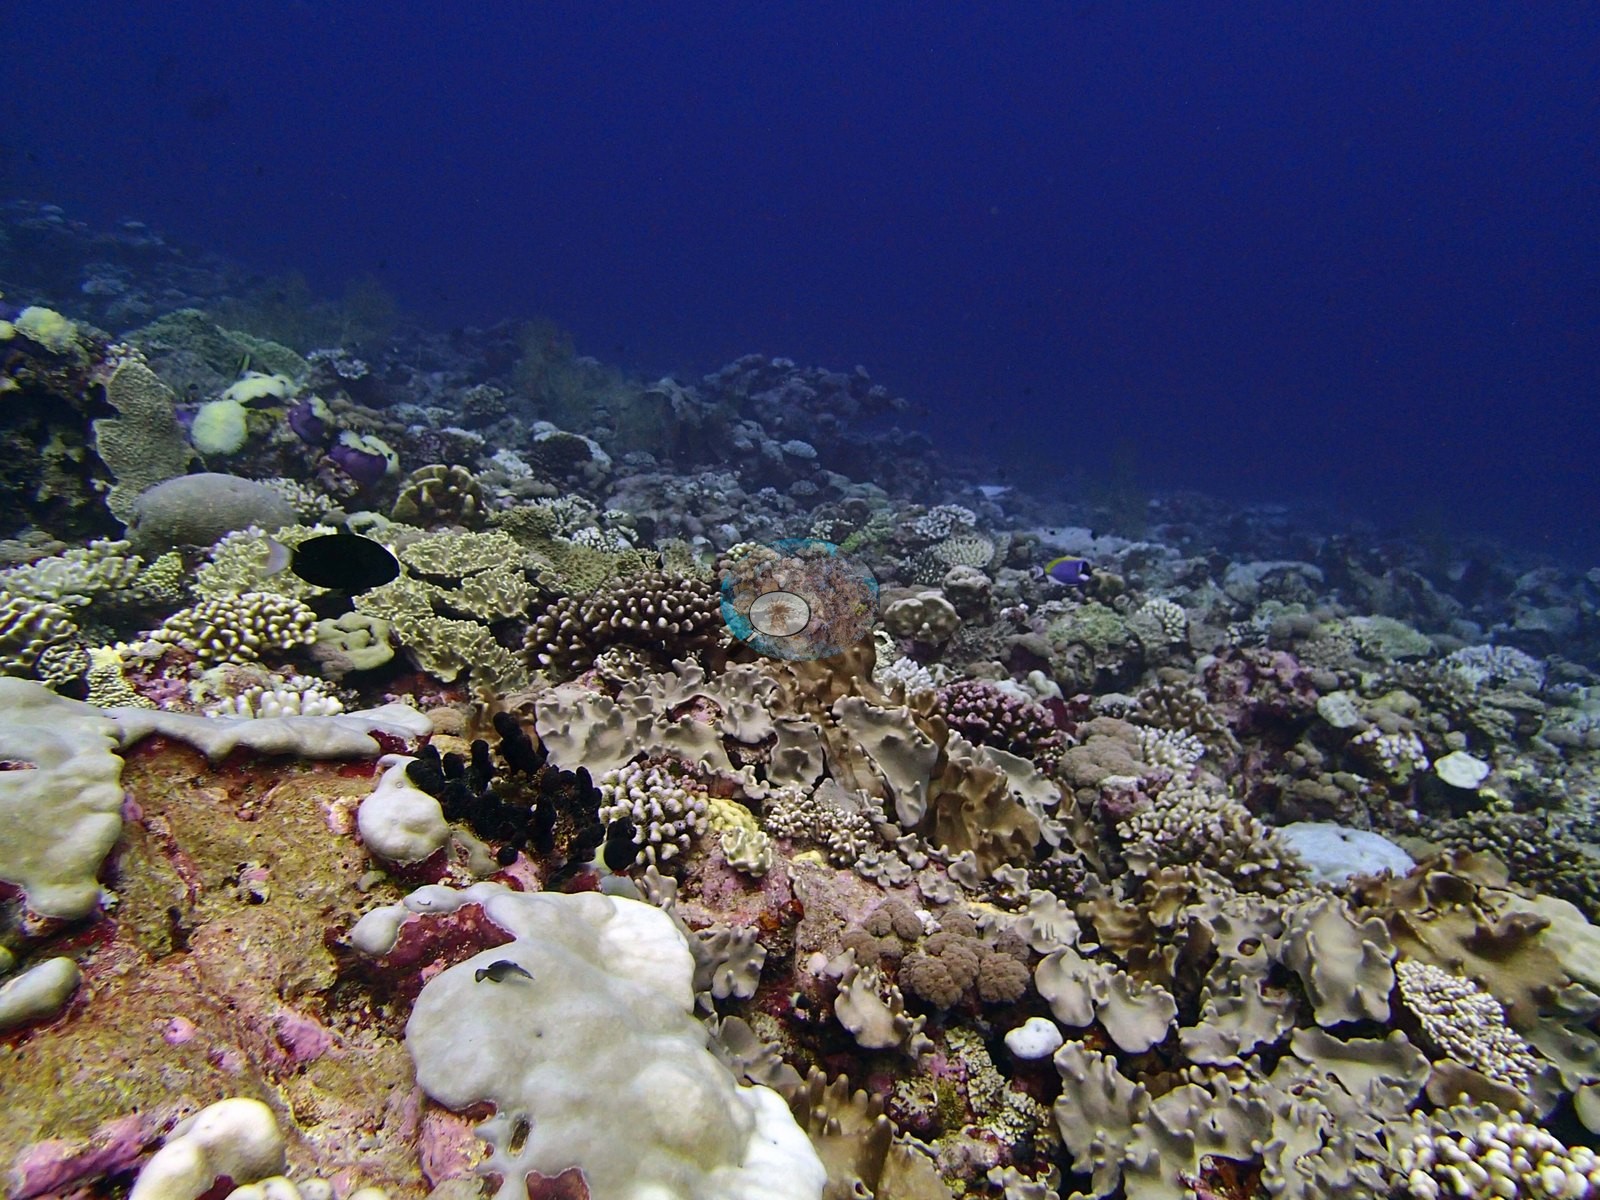
BISA102 is a deep exposed emergent forereef outside Salomon atoll at 32.8 m, surveyed 28 April 2015 (e.g., Image 1).
General benthic features
Across 24 genera the assemblage is Porites-led rather than Acropora-led, Porites holding 46% of all coral, Pocillopora 20%, and Acropora only 11%. Down the profile the Porites share climbs steadily — 39%, 34%, 52%, 58% — while genus richness collapses from 22 genera at the best transect to just five at the deepest, where invertebrates take 39.0% of the ground.
Coral cover
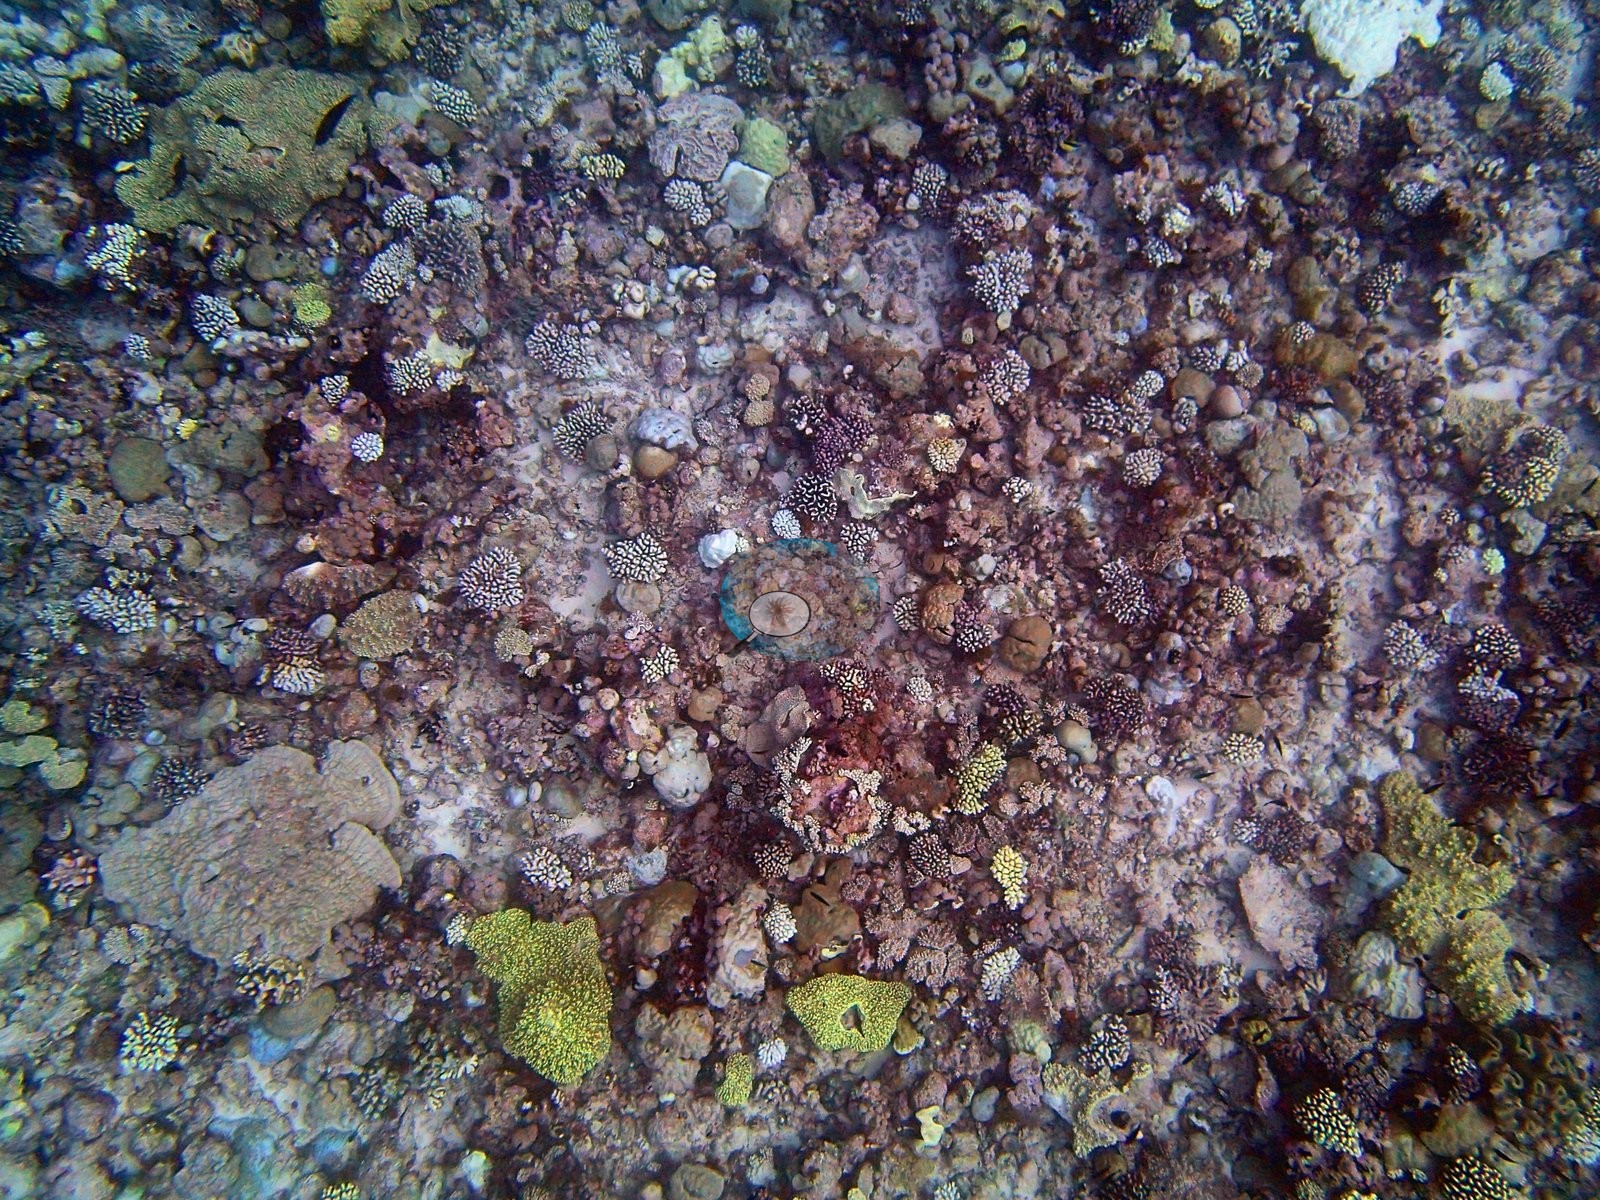
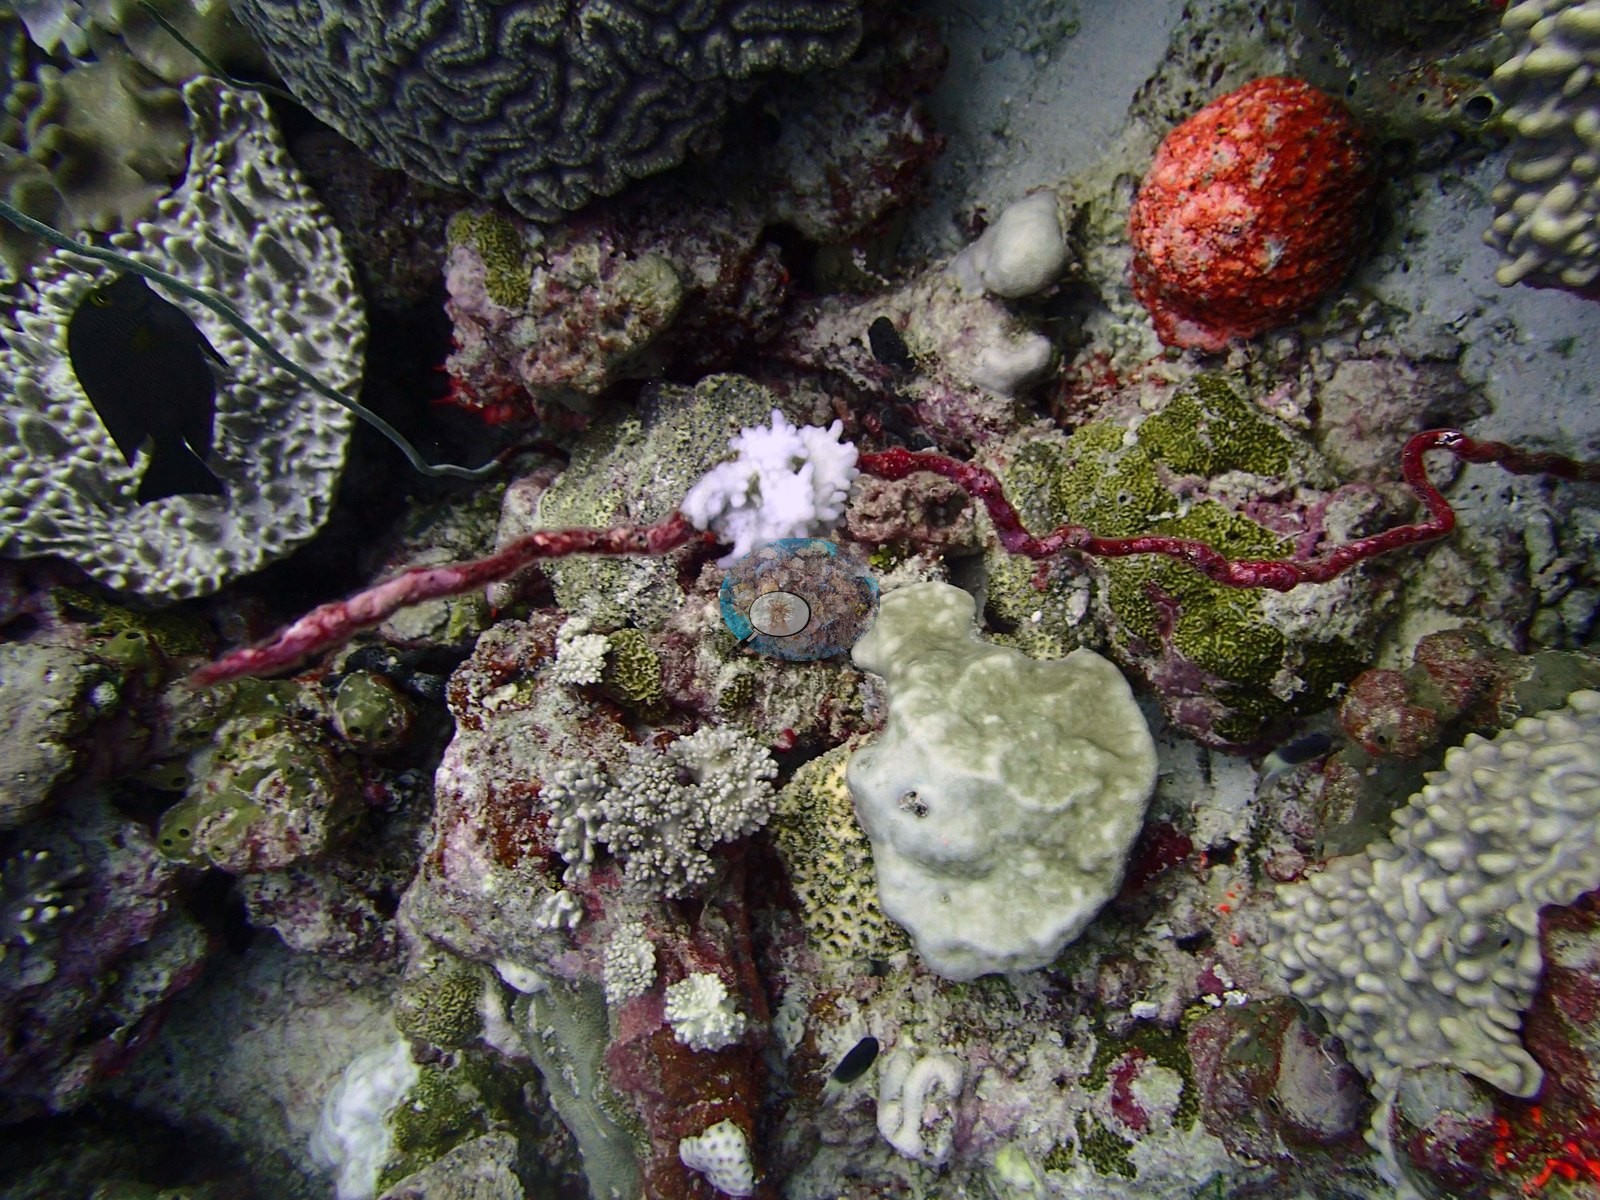
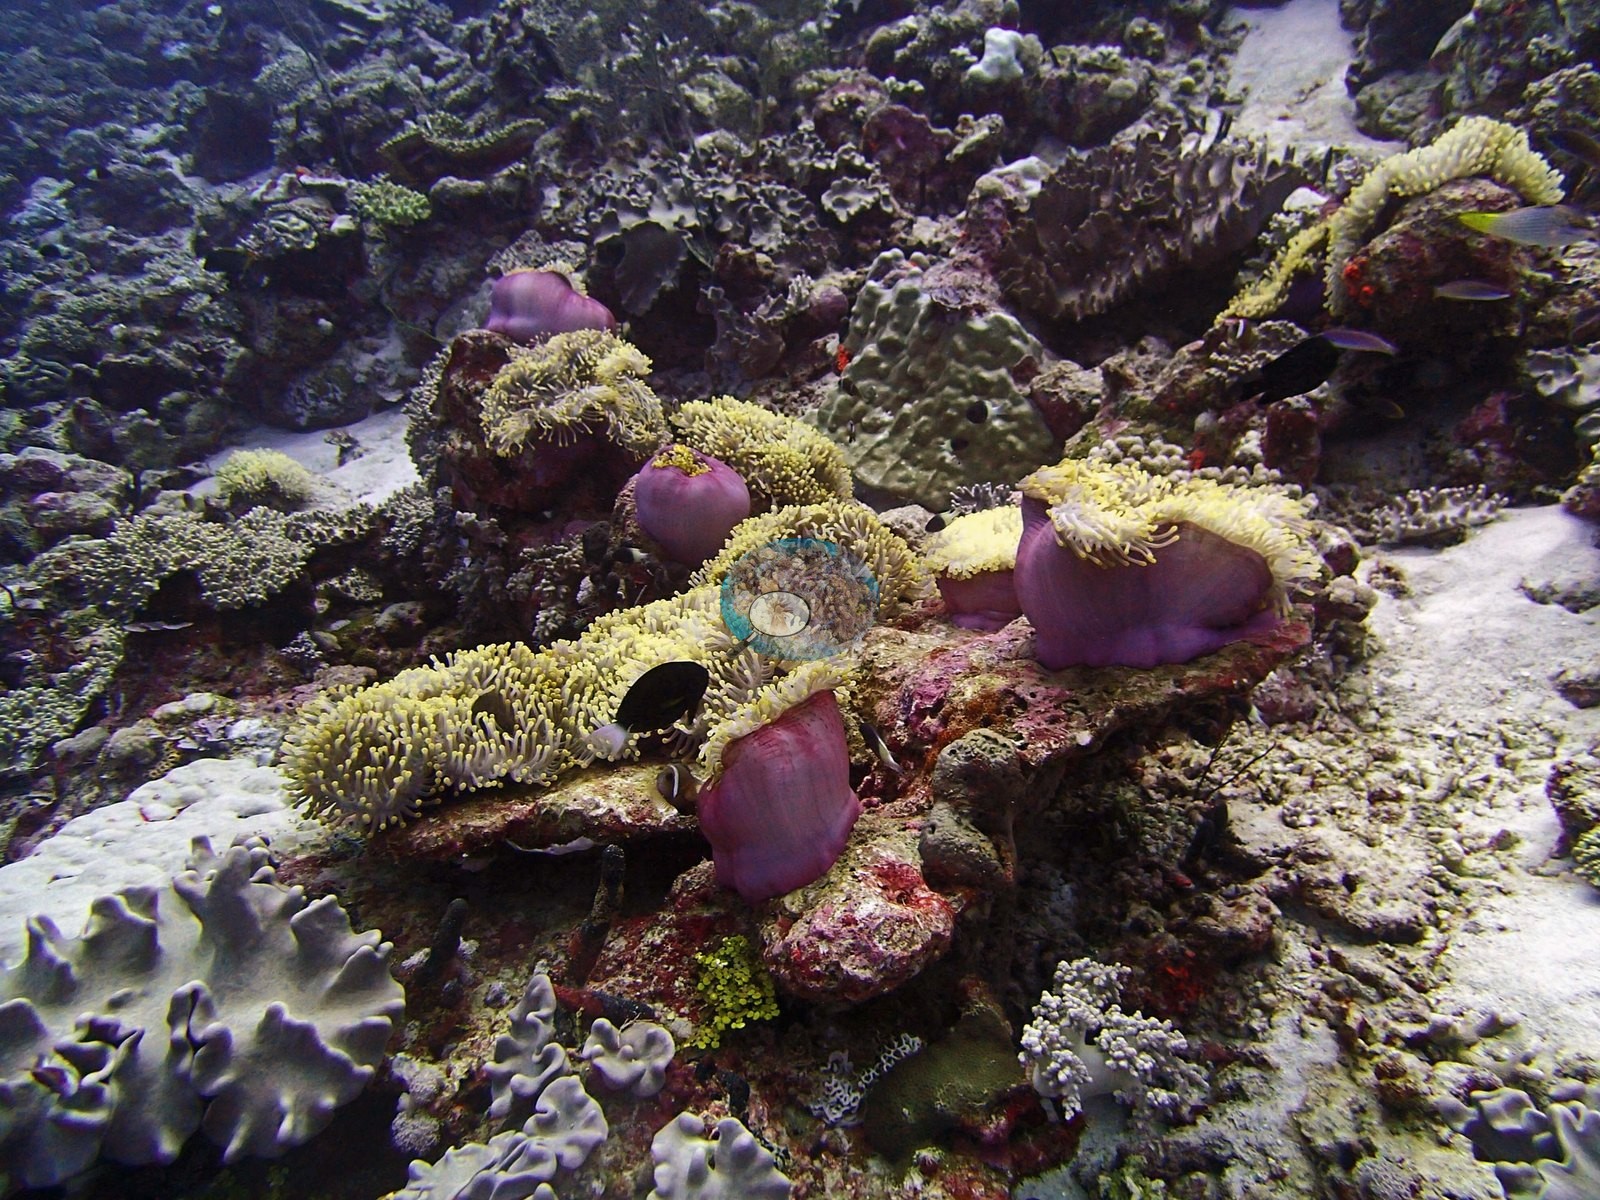
Formal transects recorded 30.9% coral against 30.6% algae — 75th of 109 Chagos sites for cover, 87th for algae — but the number that defines the site is neither: non-coral invertebrate cover is 31.3% of the benthos, slightly more than the coral itself, and the photographs identify it as anemones with resident anemonefish, soft corals, encrusting sponges, gorgonians, and giant clams. Image methods read about 11 points below the transects (CoralNet 20.0%, Coralscapes 20.1%). Coral cover: 31%. Live hard coral measured on the in situ benthic transects of the LOF BIOT-1 expedition (Mayfield & Dempsey 2026, Oceans, supplemental S1), against algal cover of 30.6% of the benthos. The transect figure is this site's authoritative cover value; no image-derived product overrides it. Across methods the same reef reads: transects 30.9% · CoralNet points 20% · Coralscapes masks 20.1% (35 frames). These products have different sampling footprints and denominators and should not be averaged.
Stressors
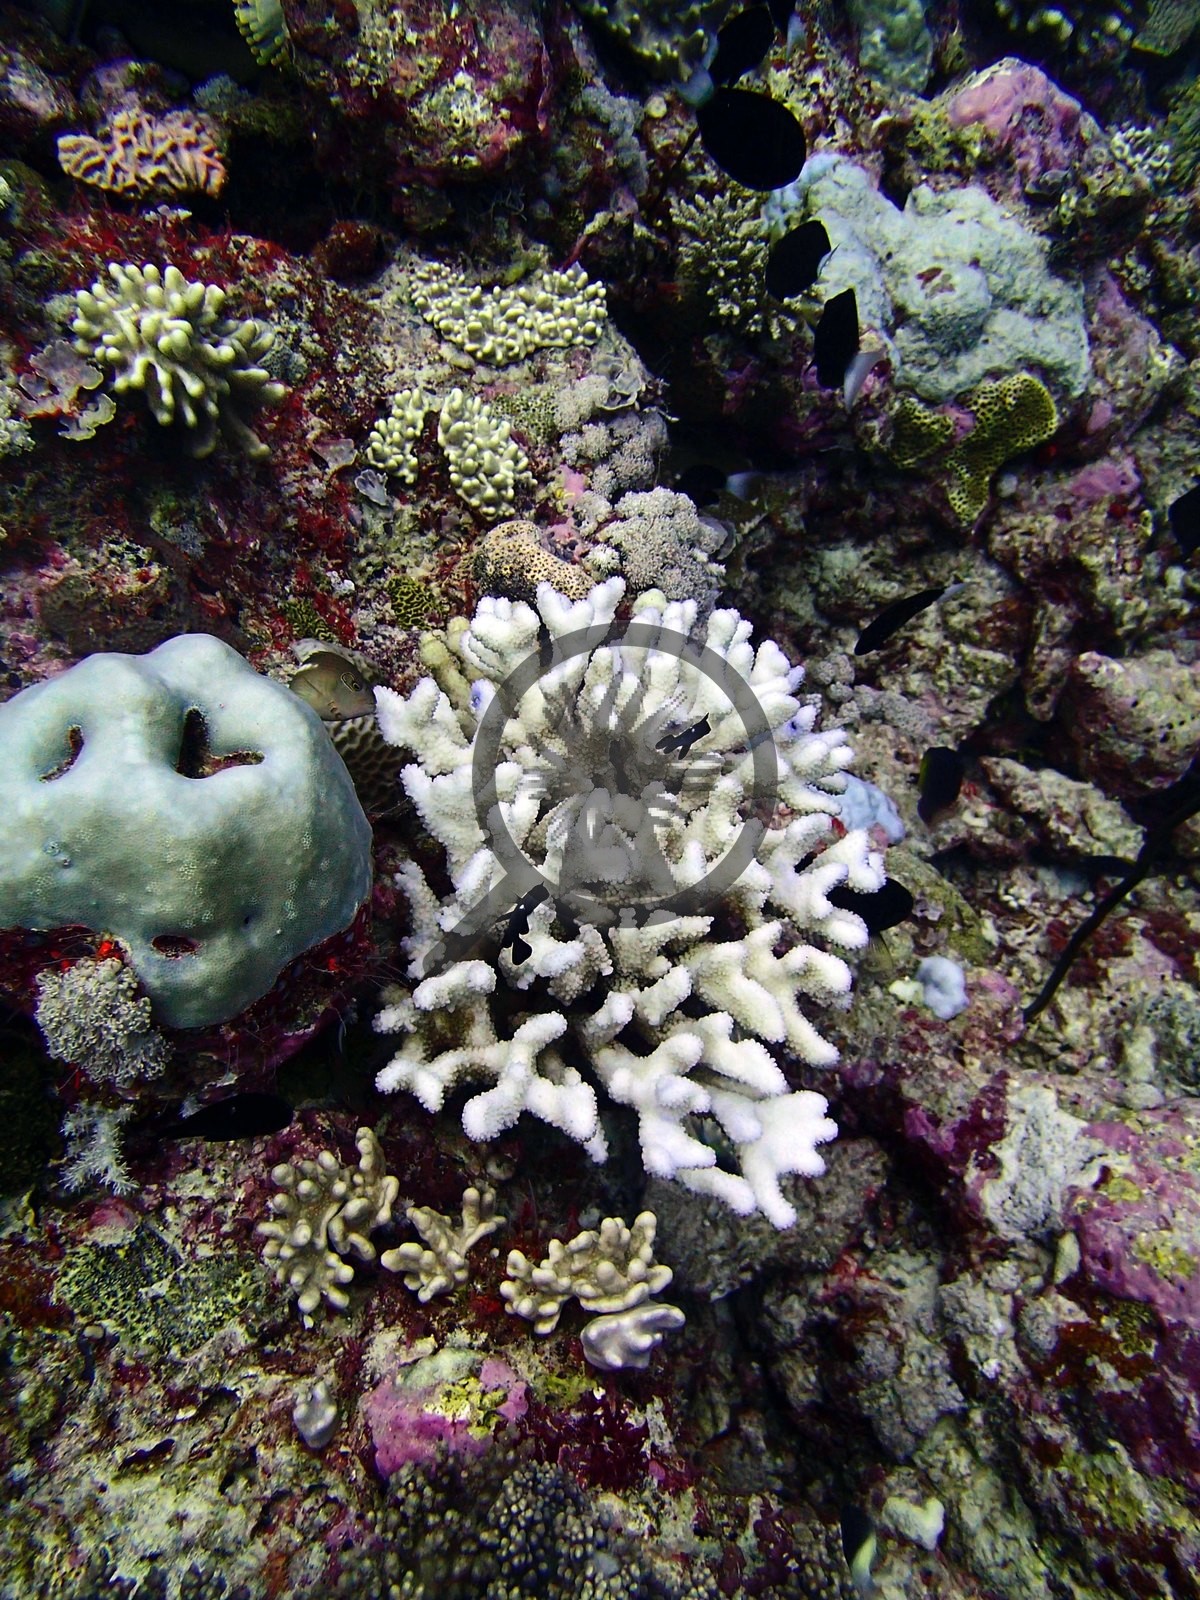
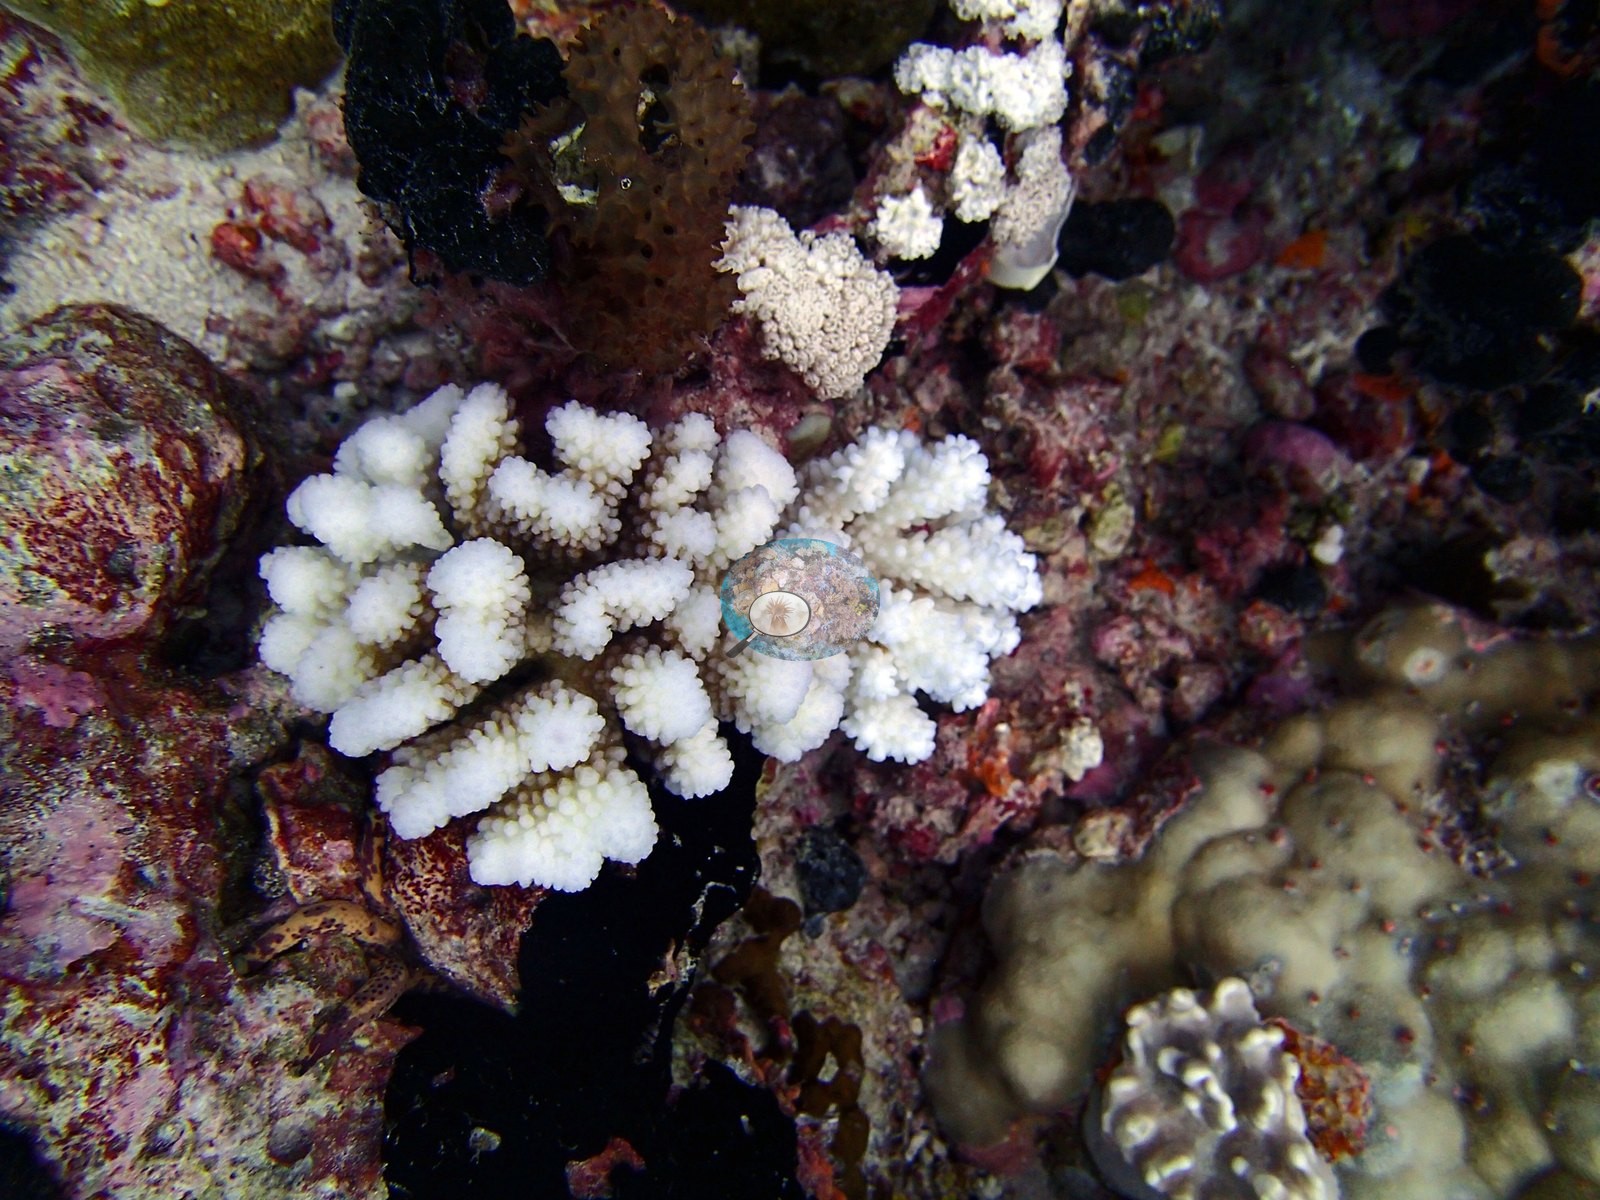
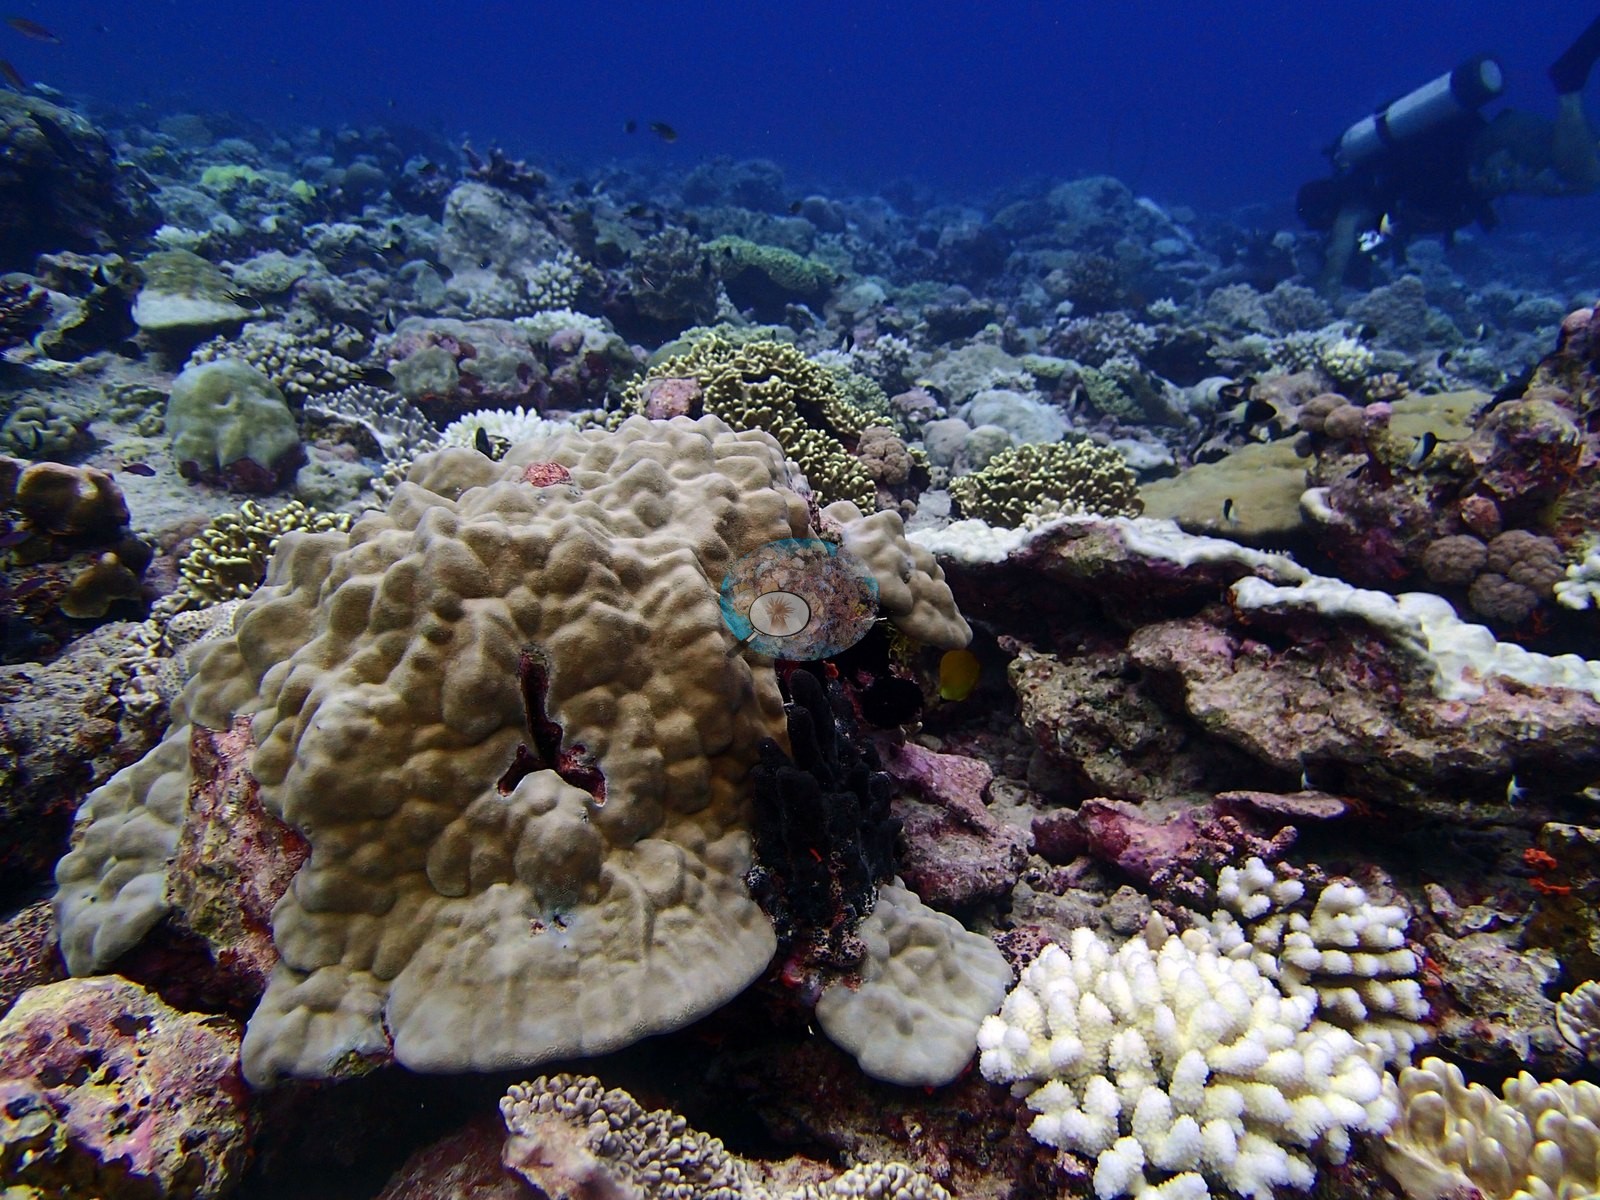
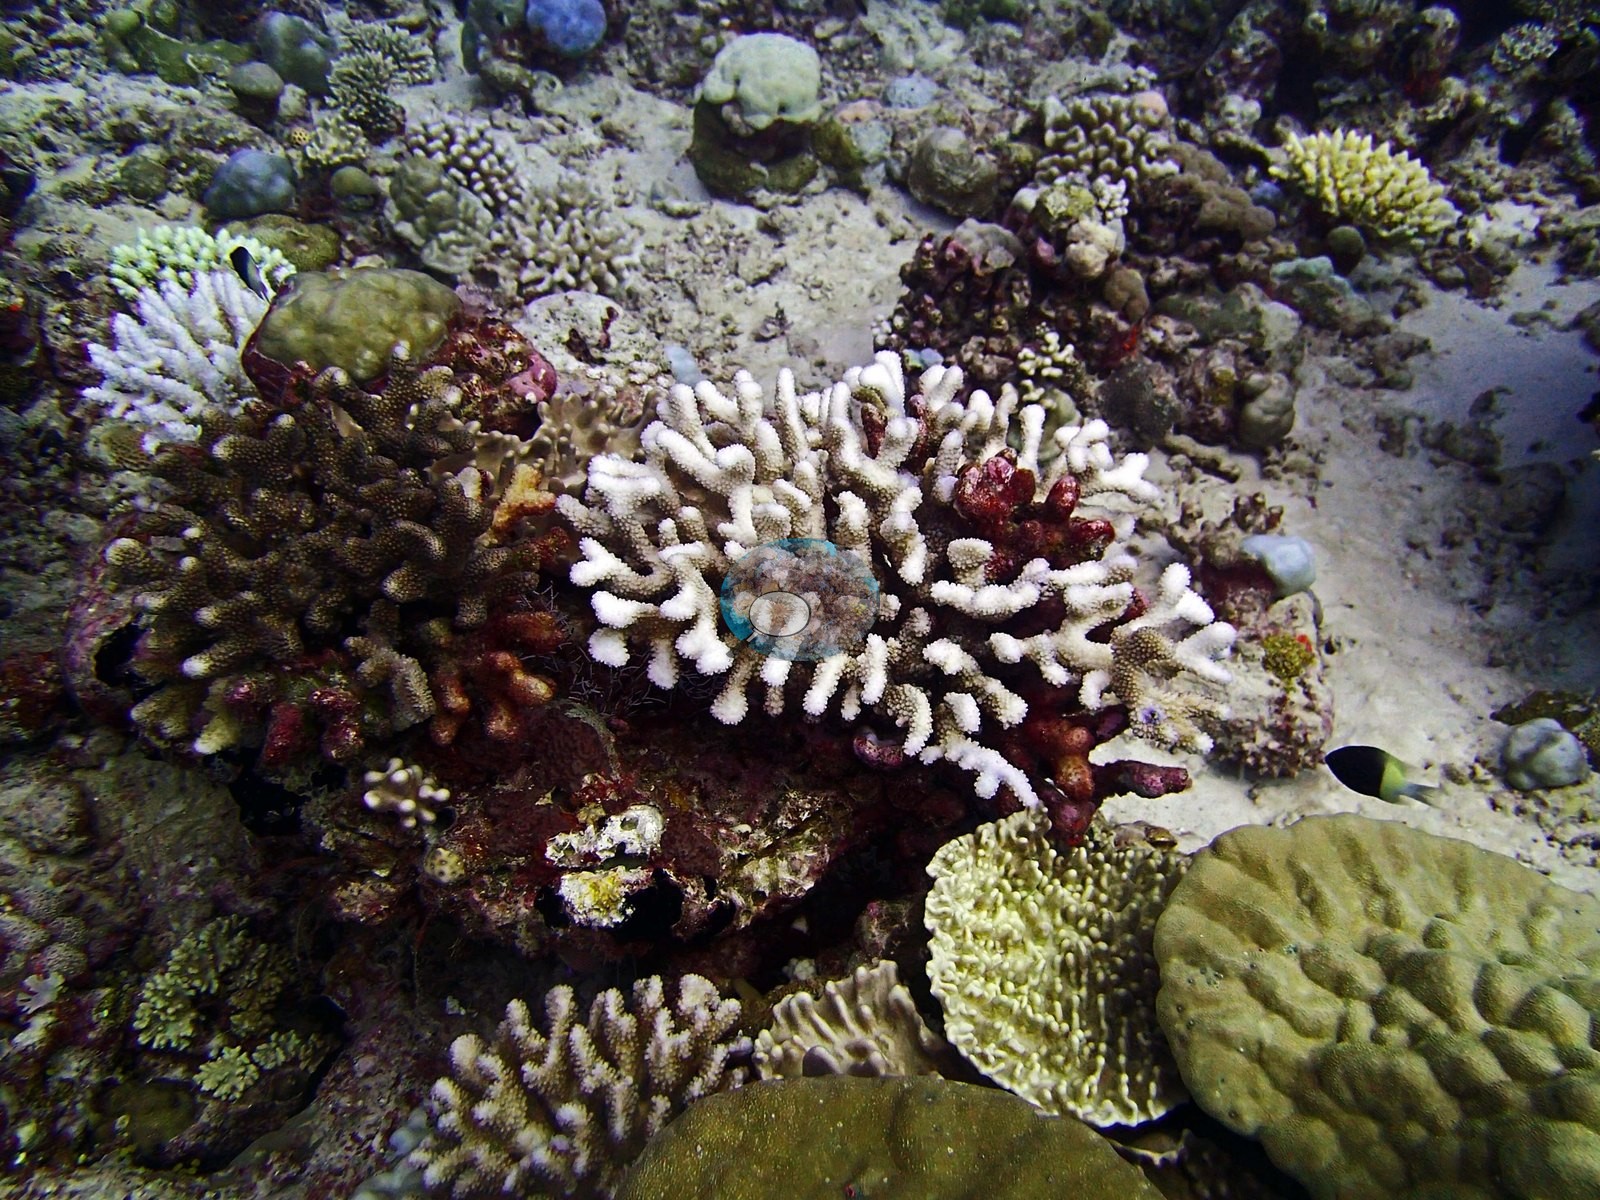
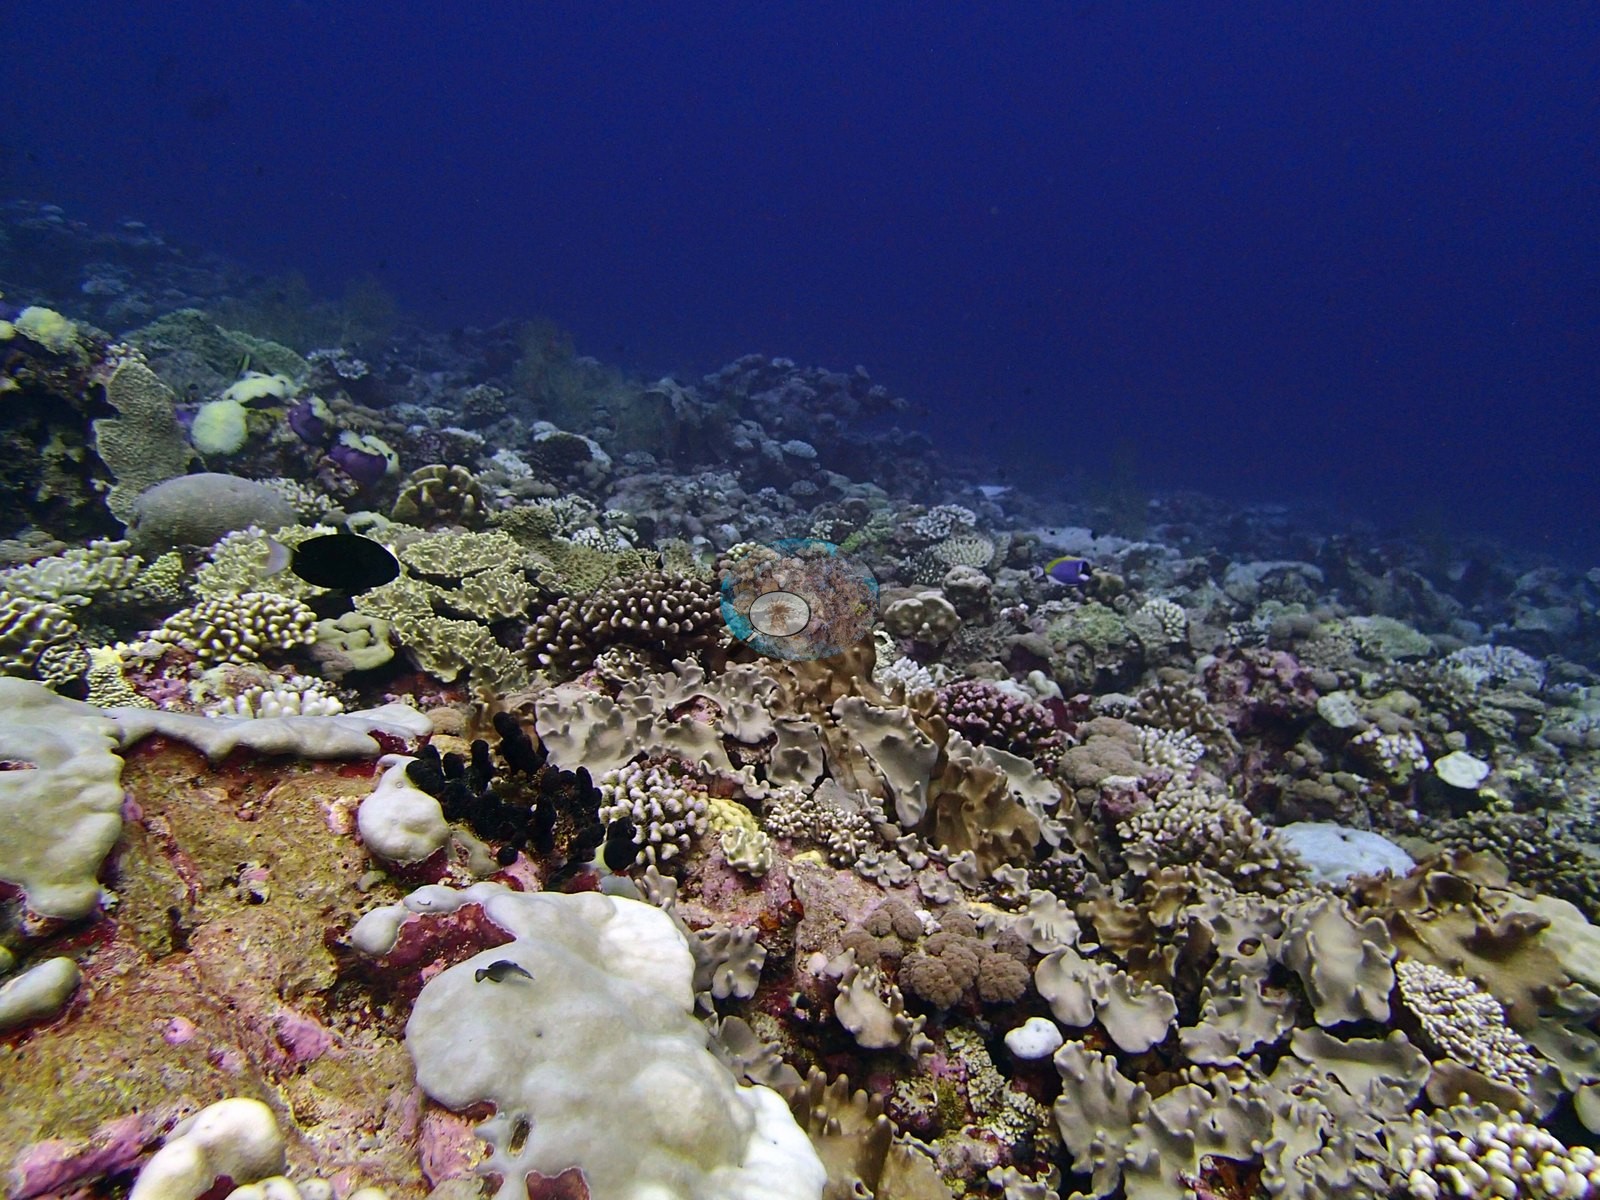
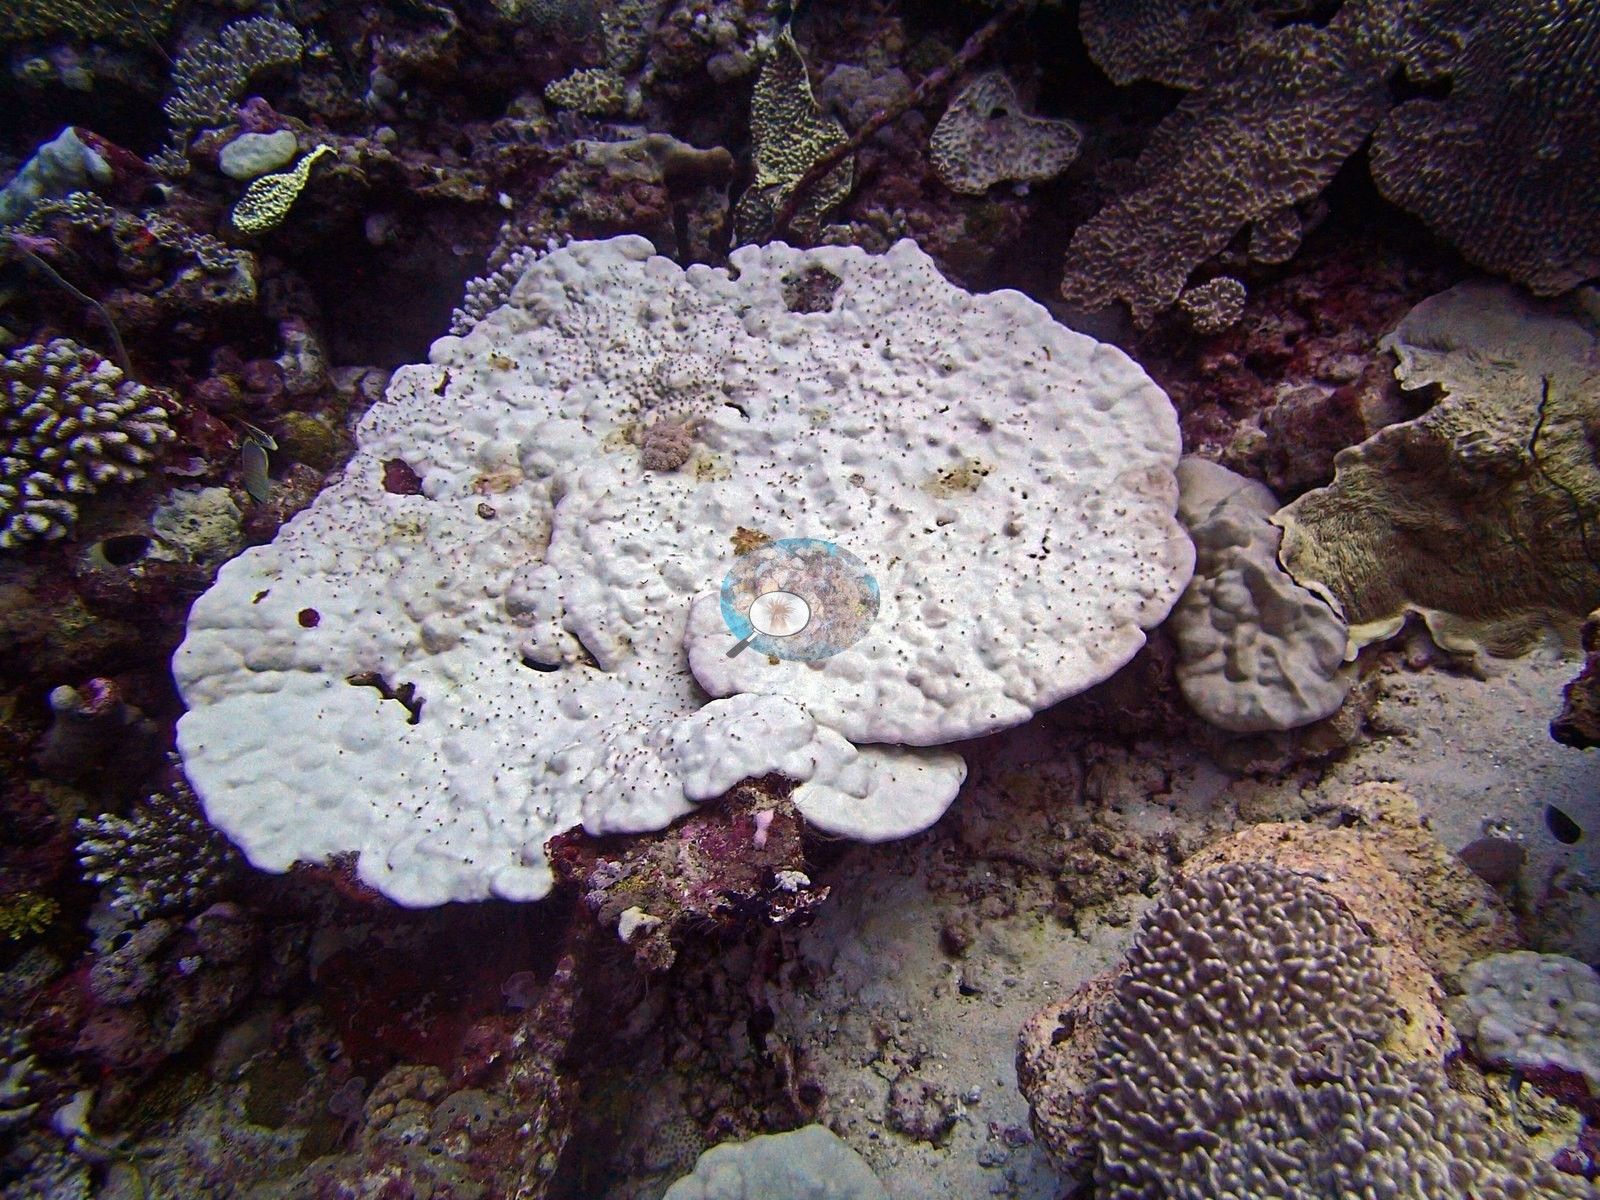
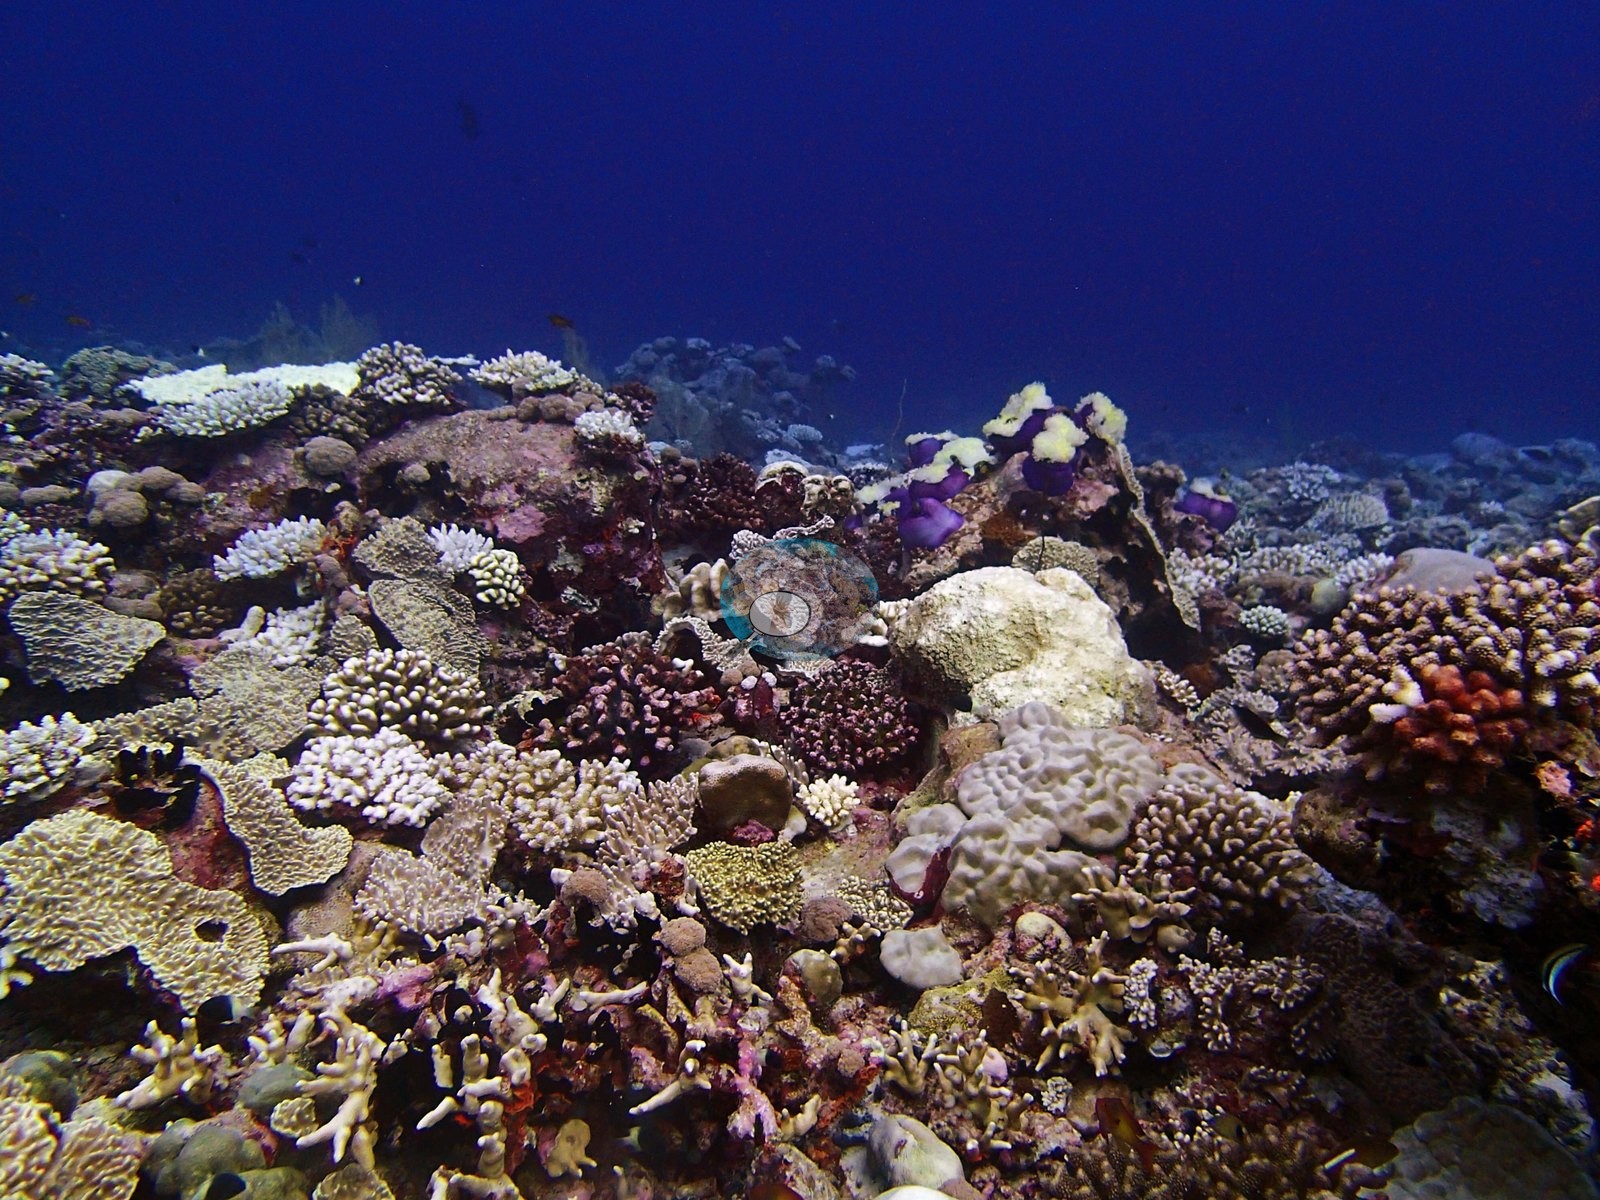
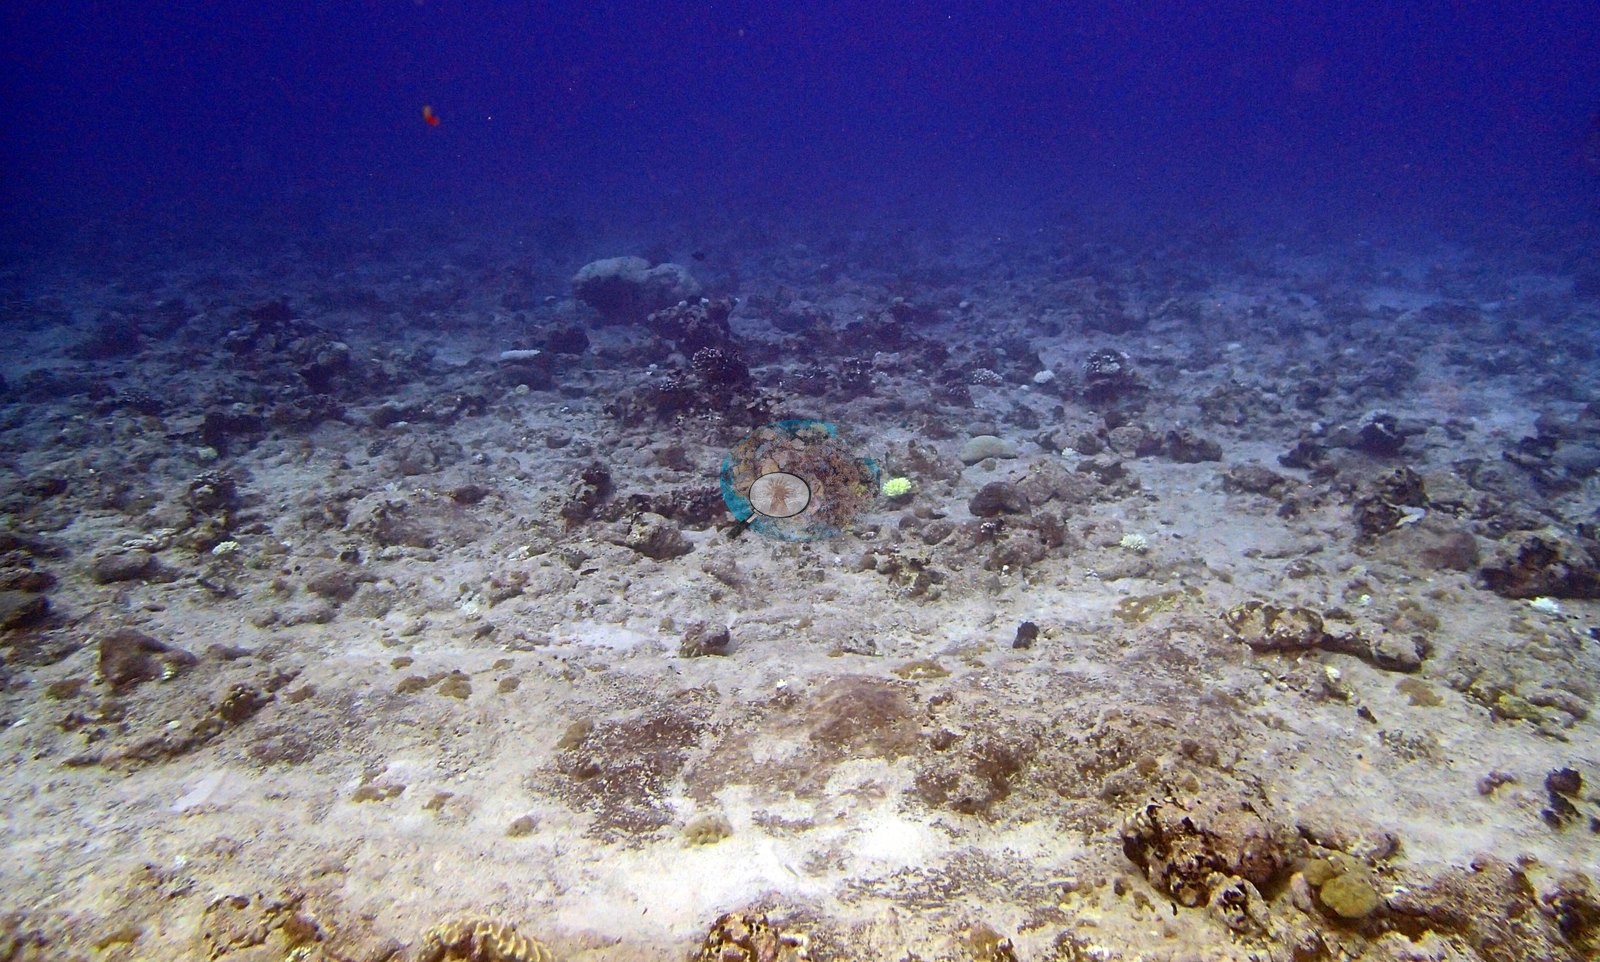
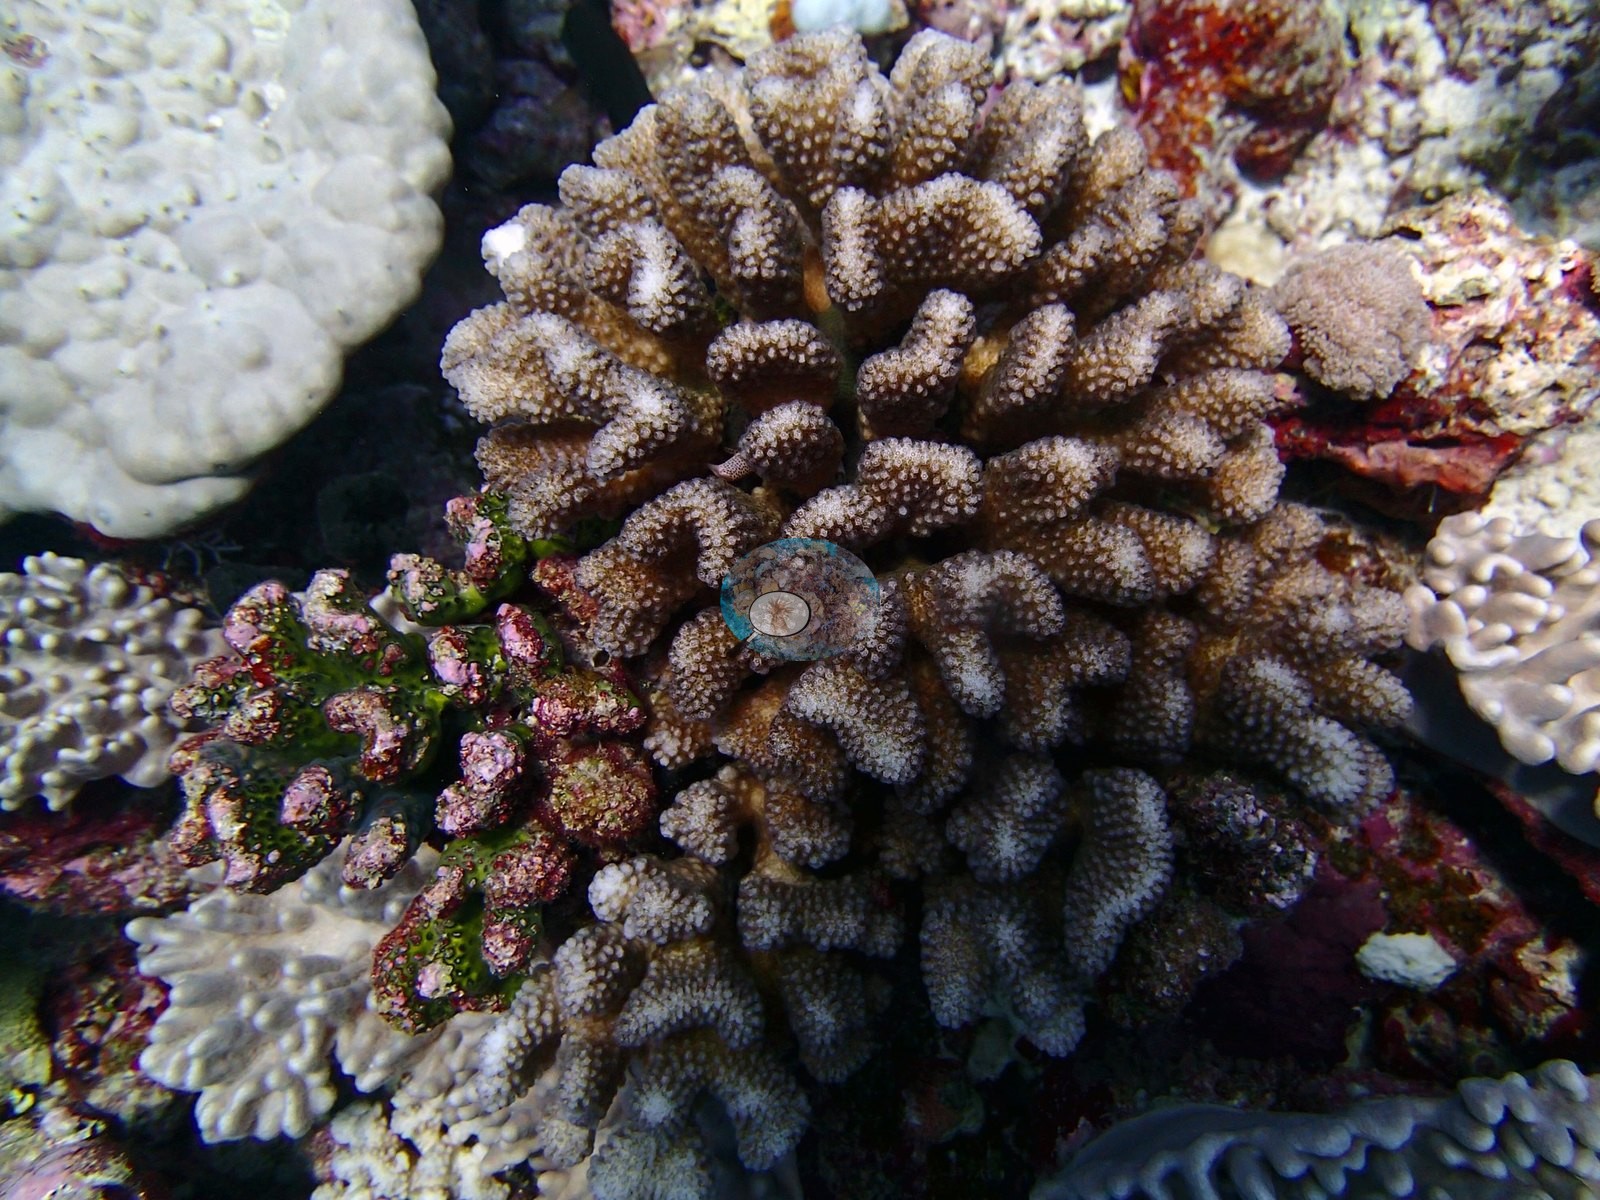
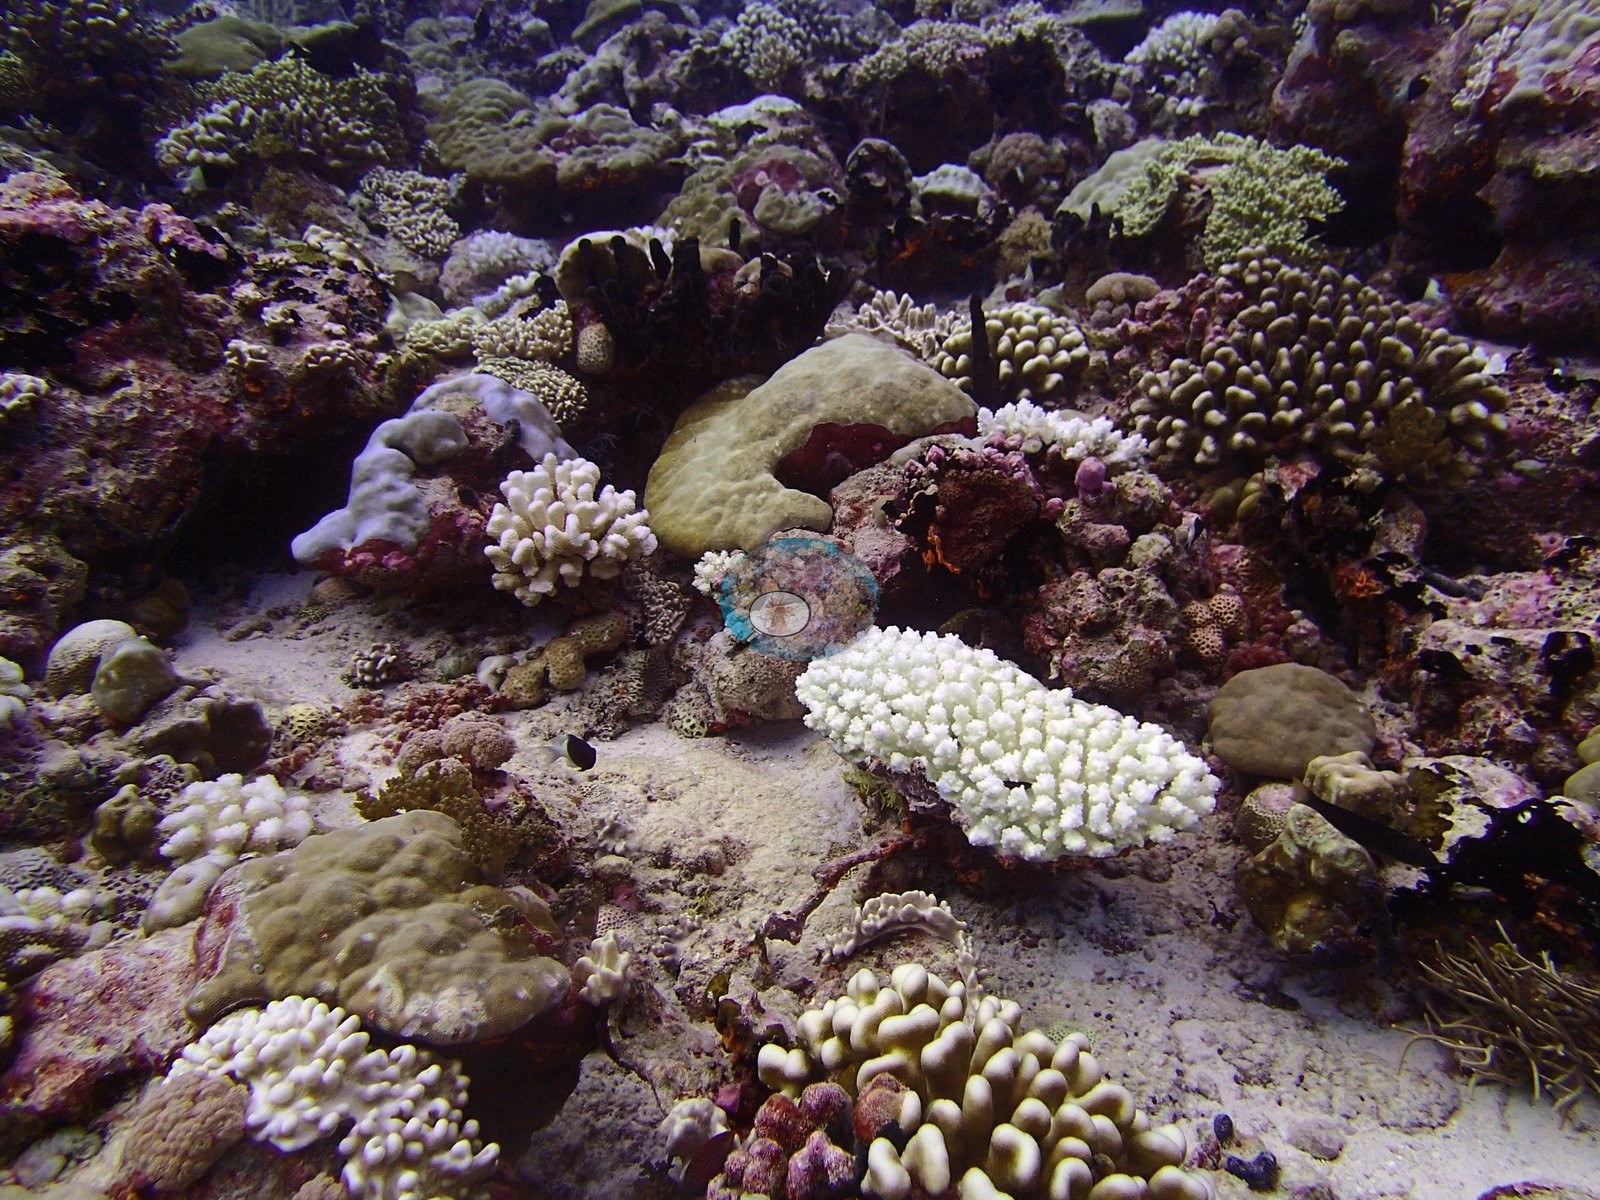
Published bleaching is 19.2%, 8th of 98 on the site table's Mean(%bleaching) column, the first CoralNet training run rather than the canonical % bleaching (2nd training) column, and the imagery agrees: a branching colony stark white across every branch beside pigmented neighbors of the same size, three adjacent white colonies in another frame, a white corymbose colony against a healthy massive Porites (e.g., Image 3).
No crown-of-thorns, disease, or predation was seen.
Fish and other fauna
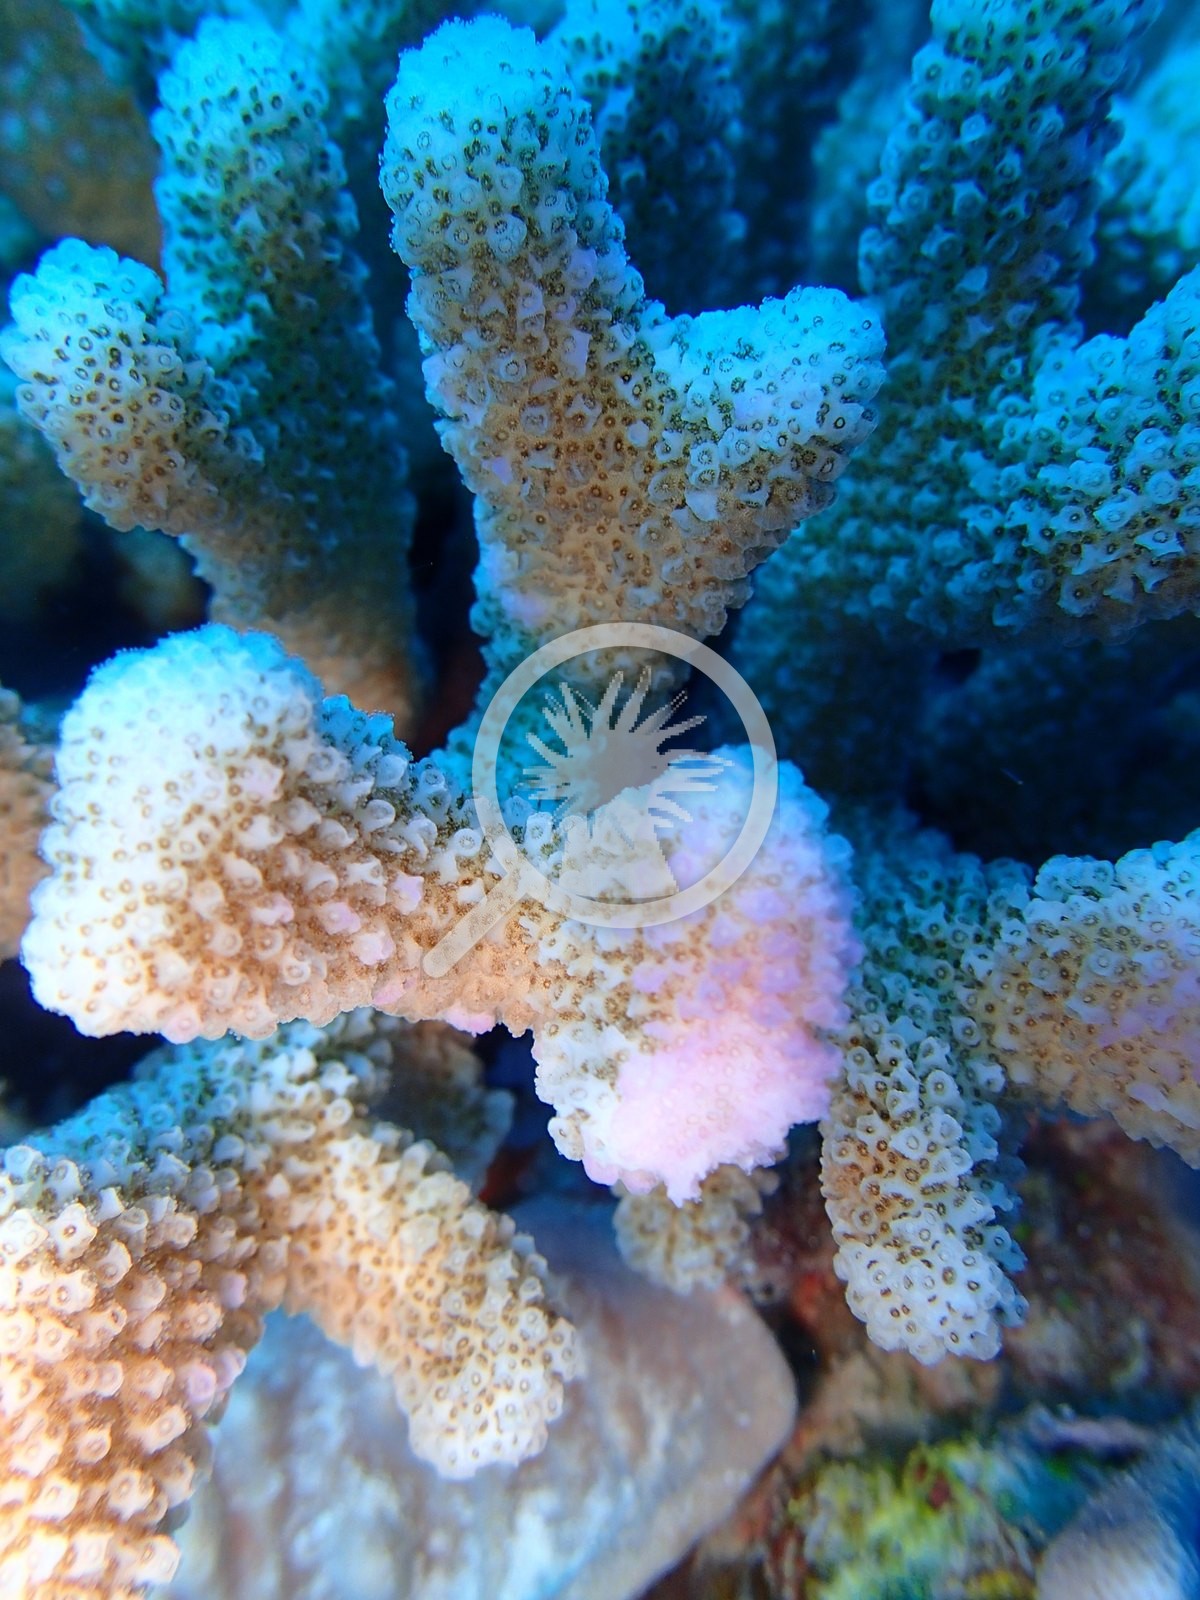
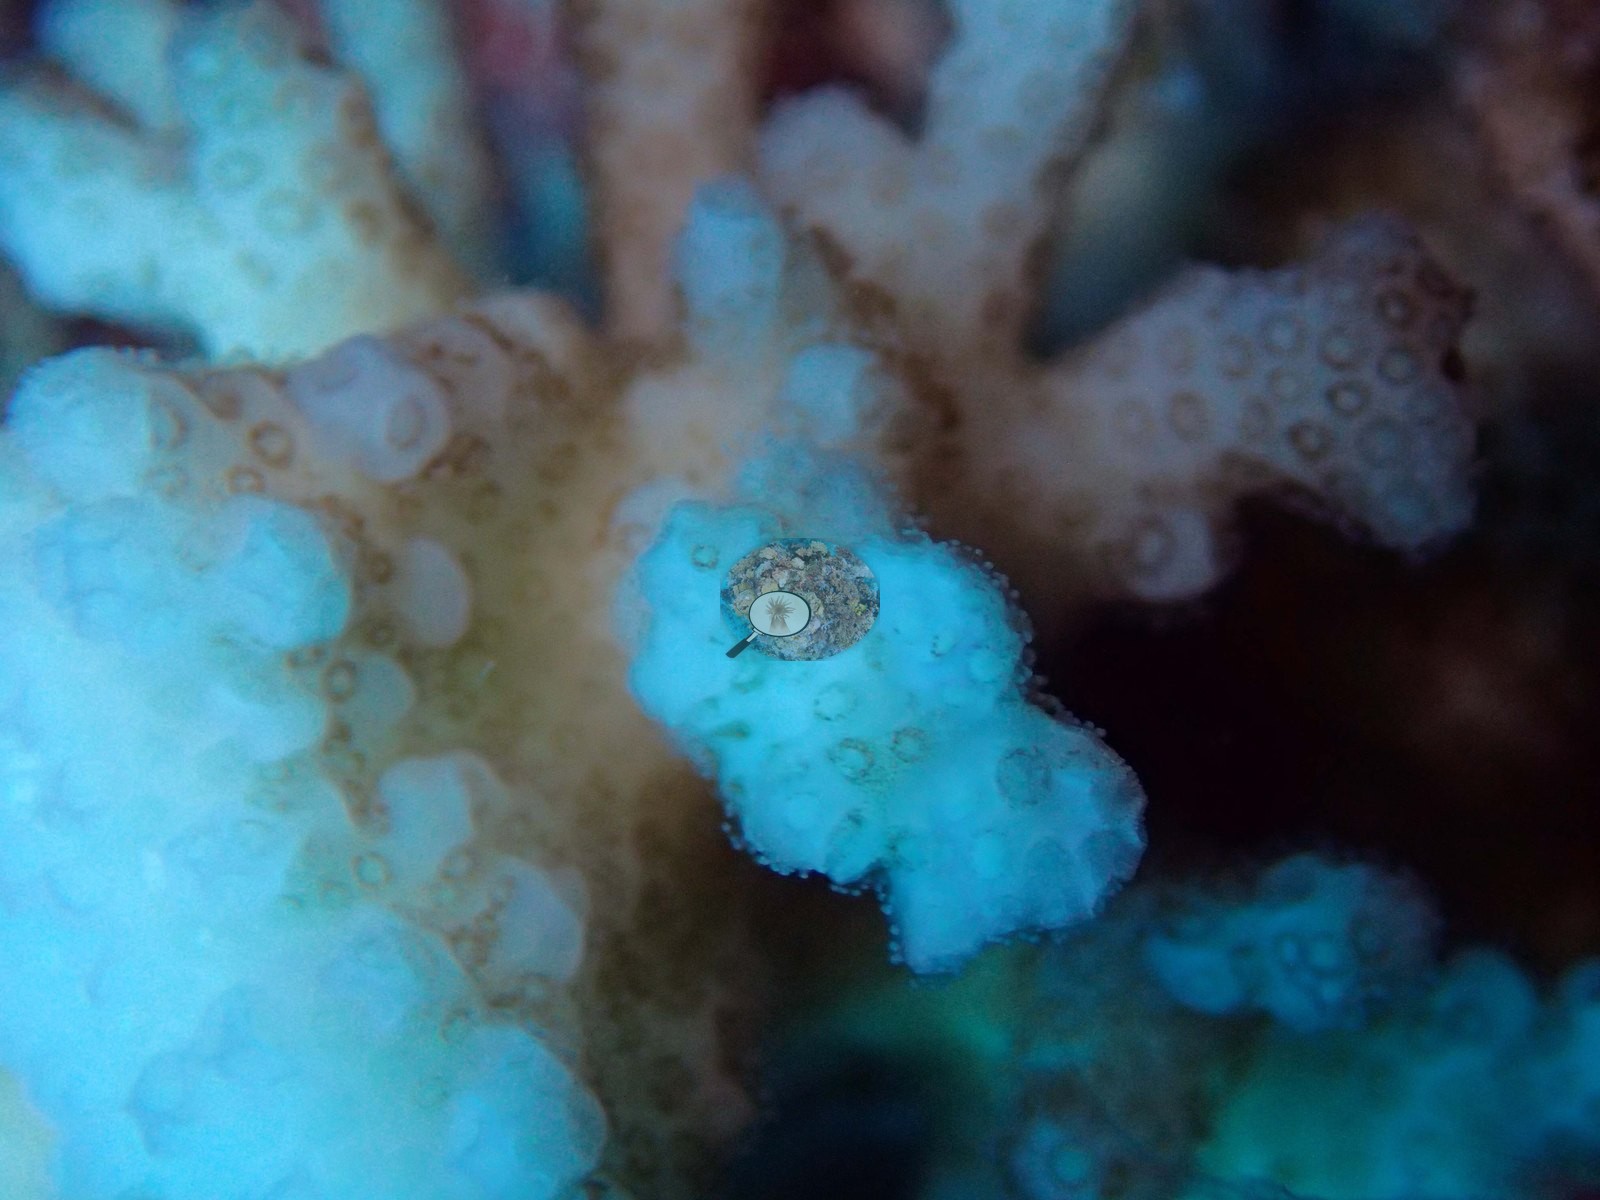
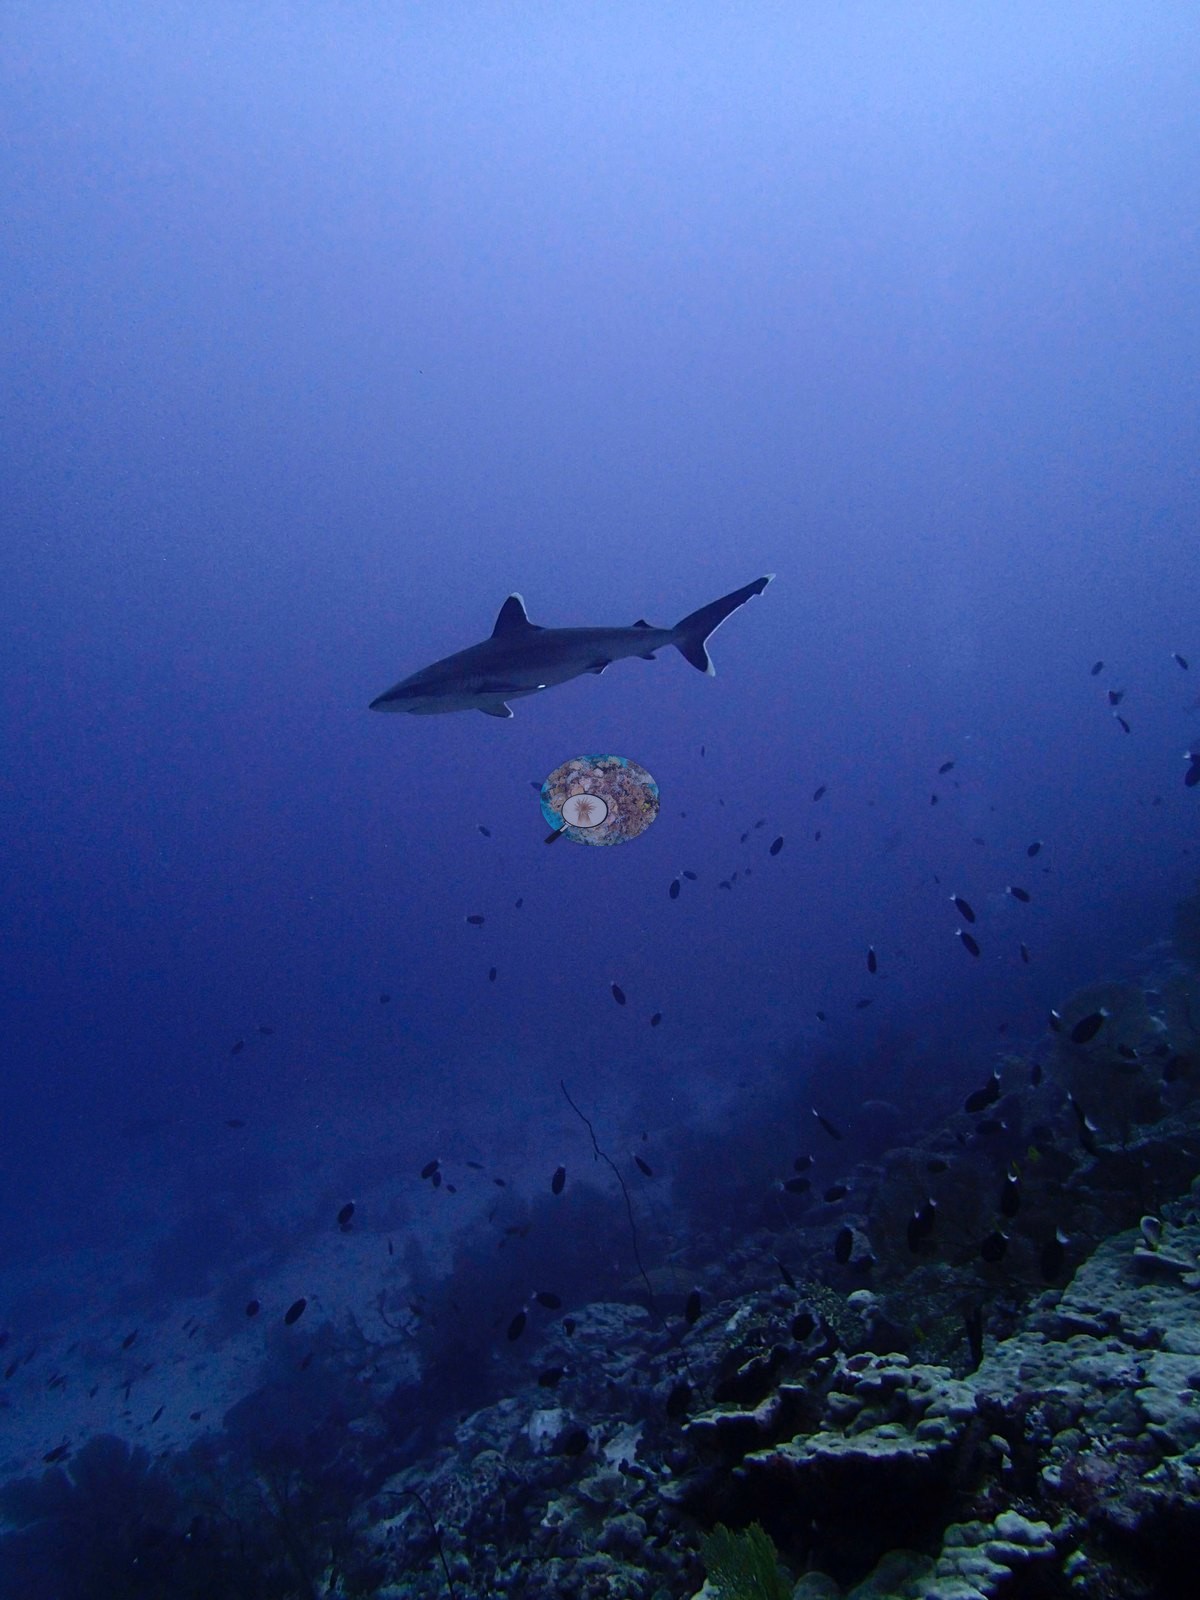
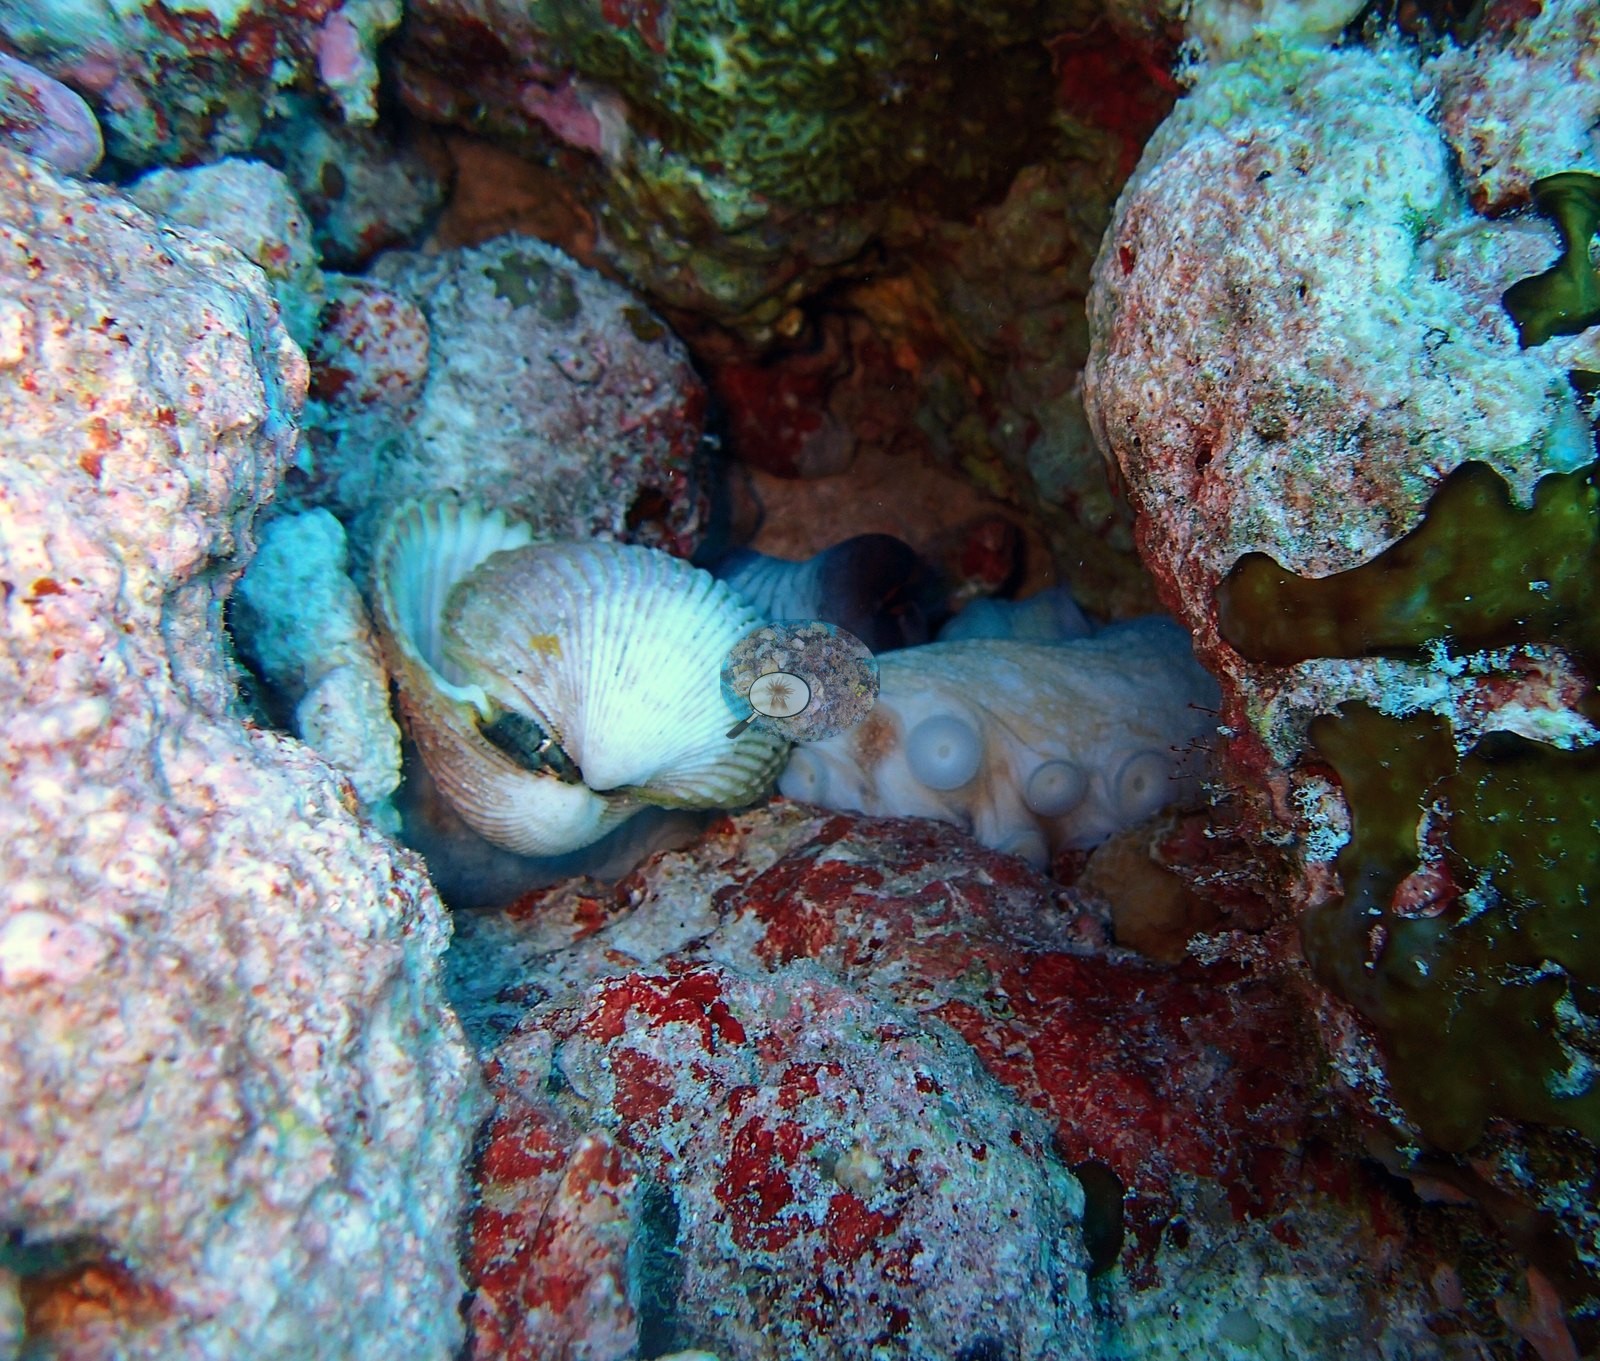
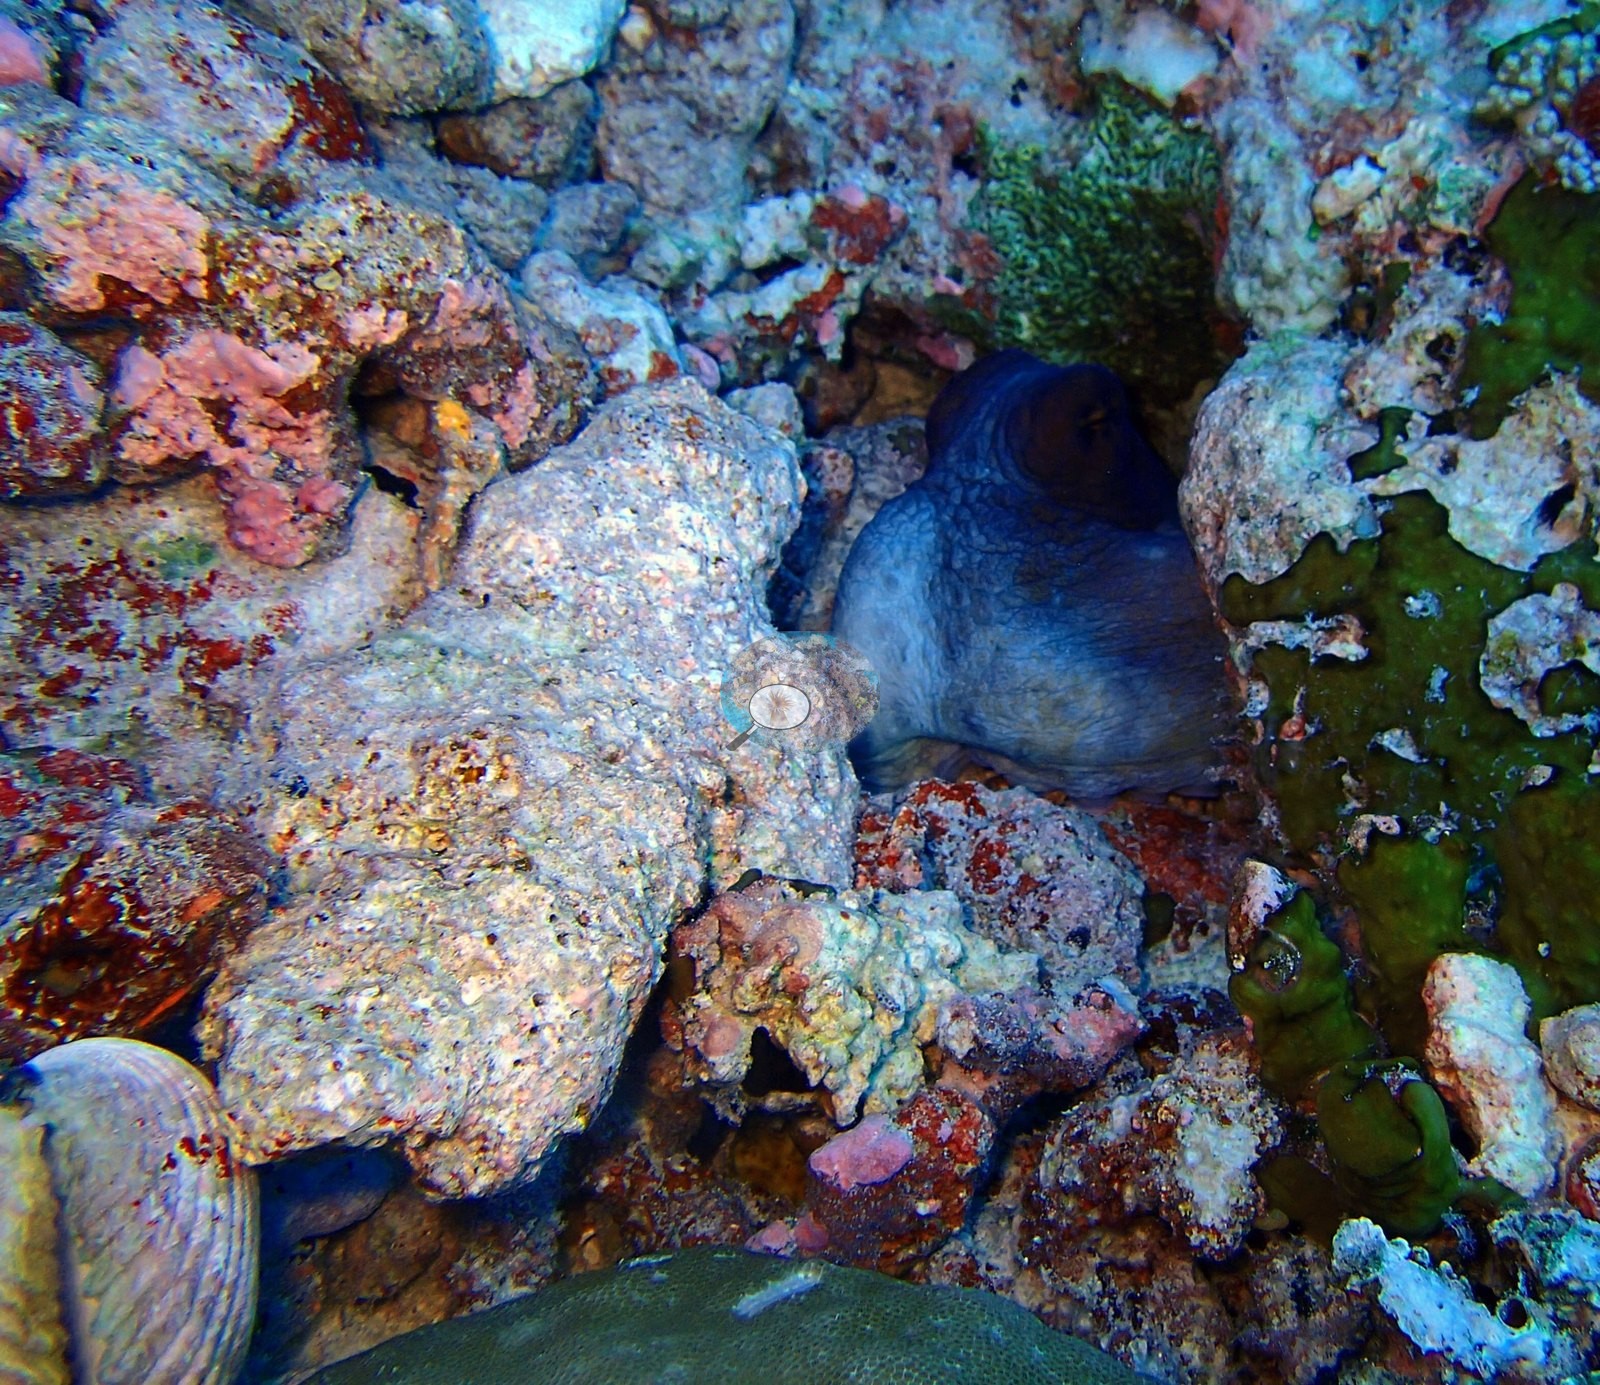
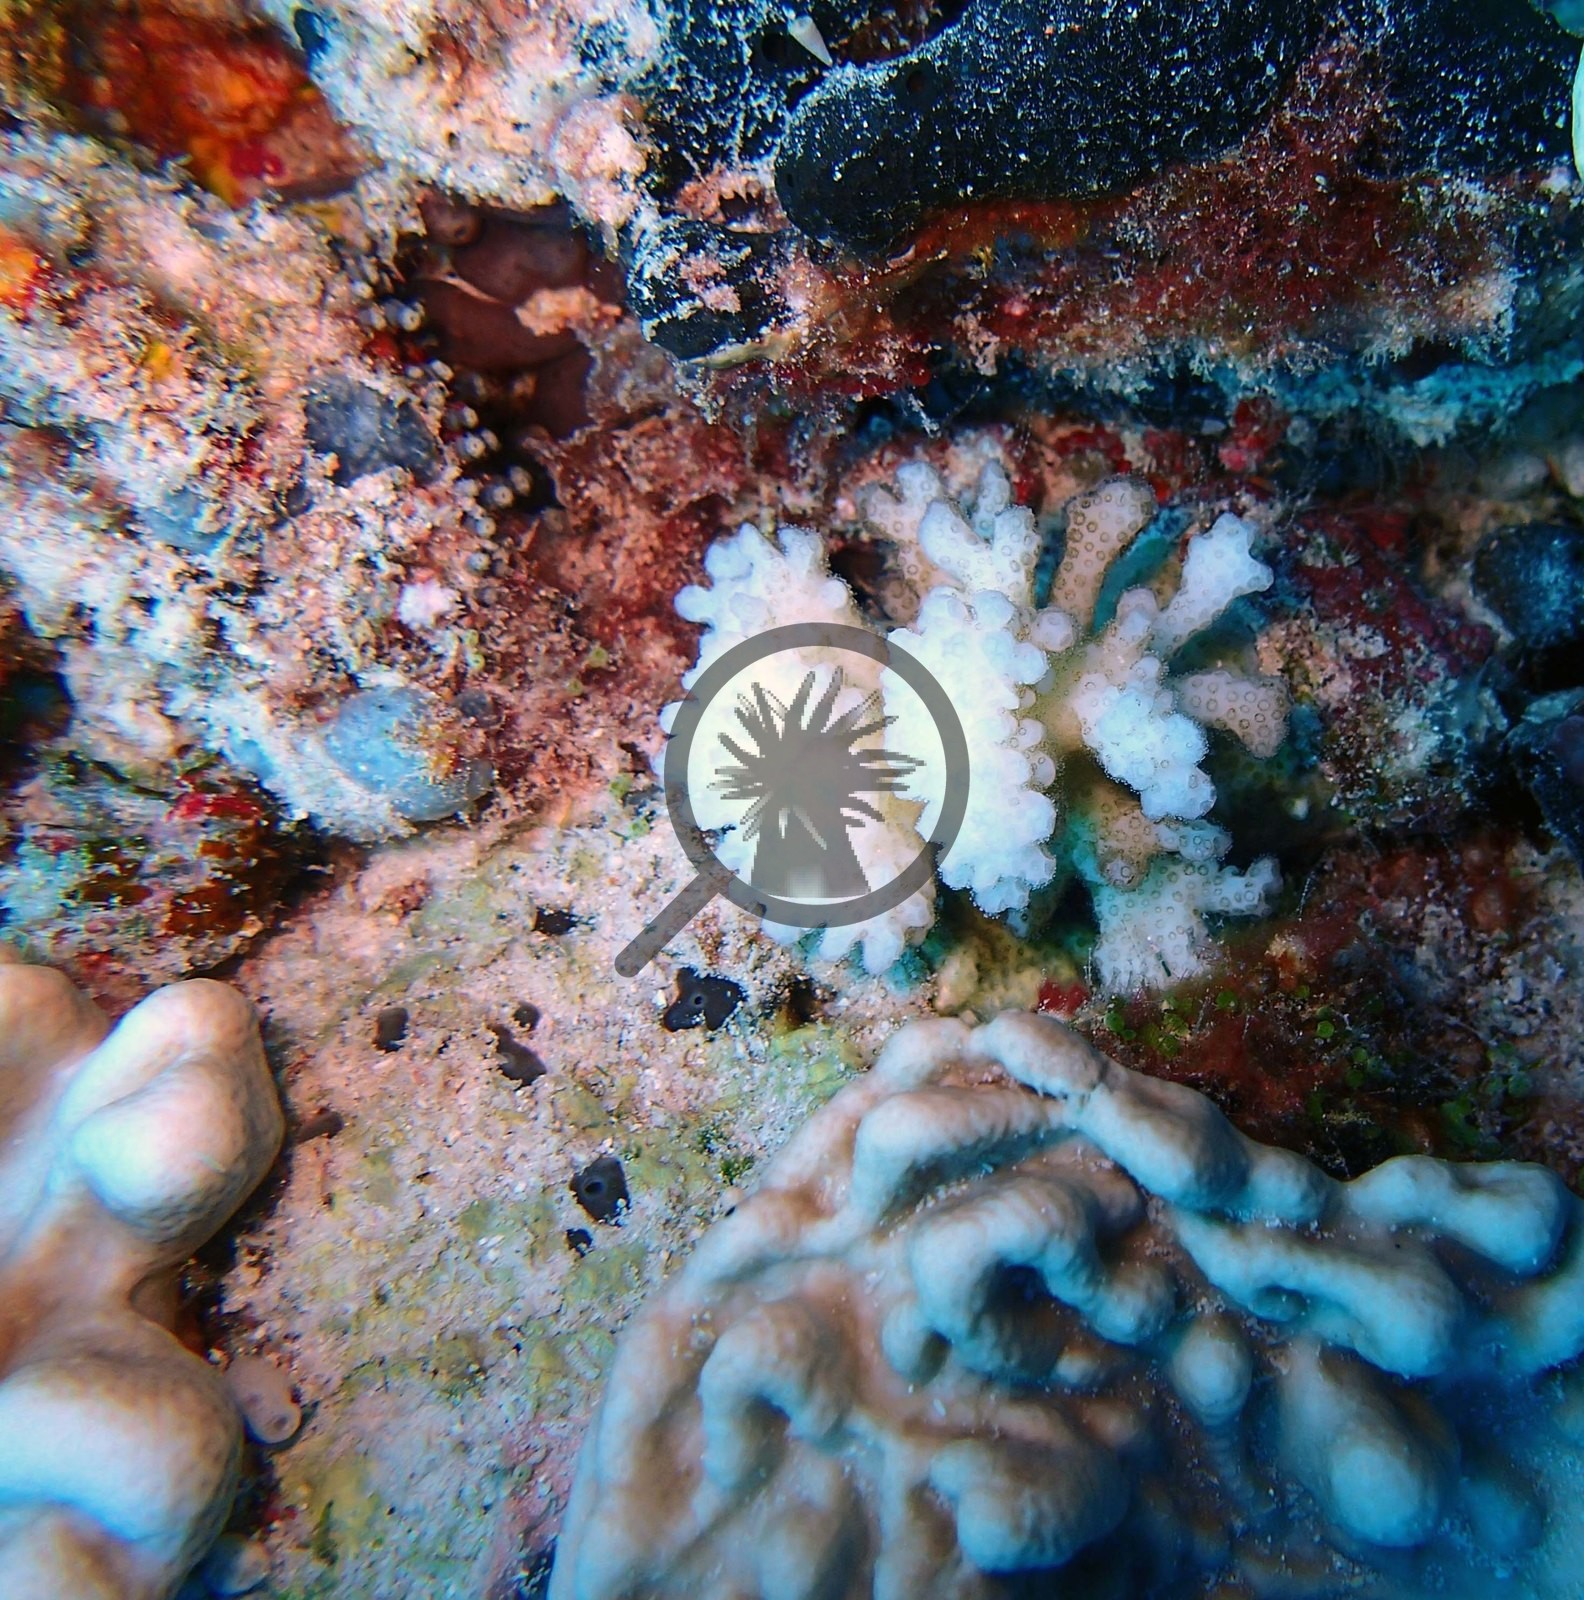
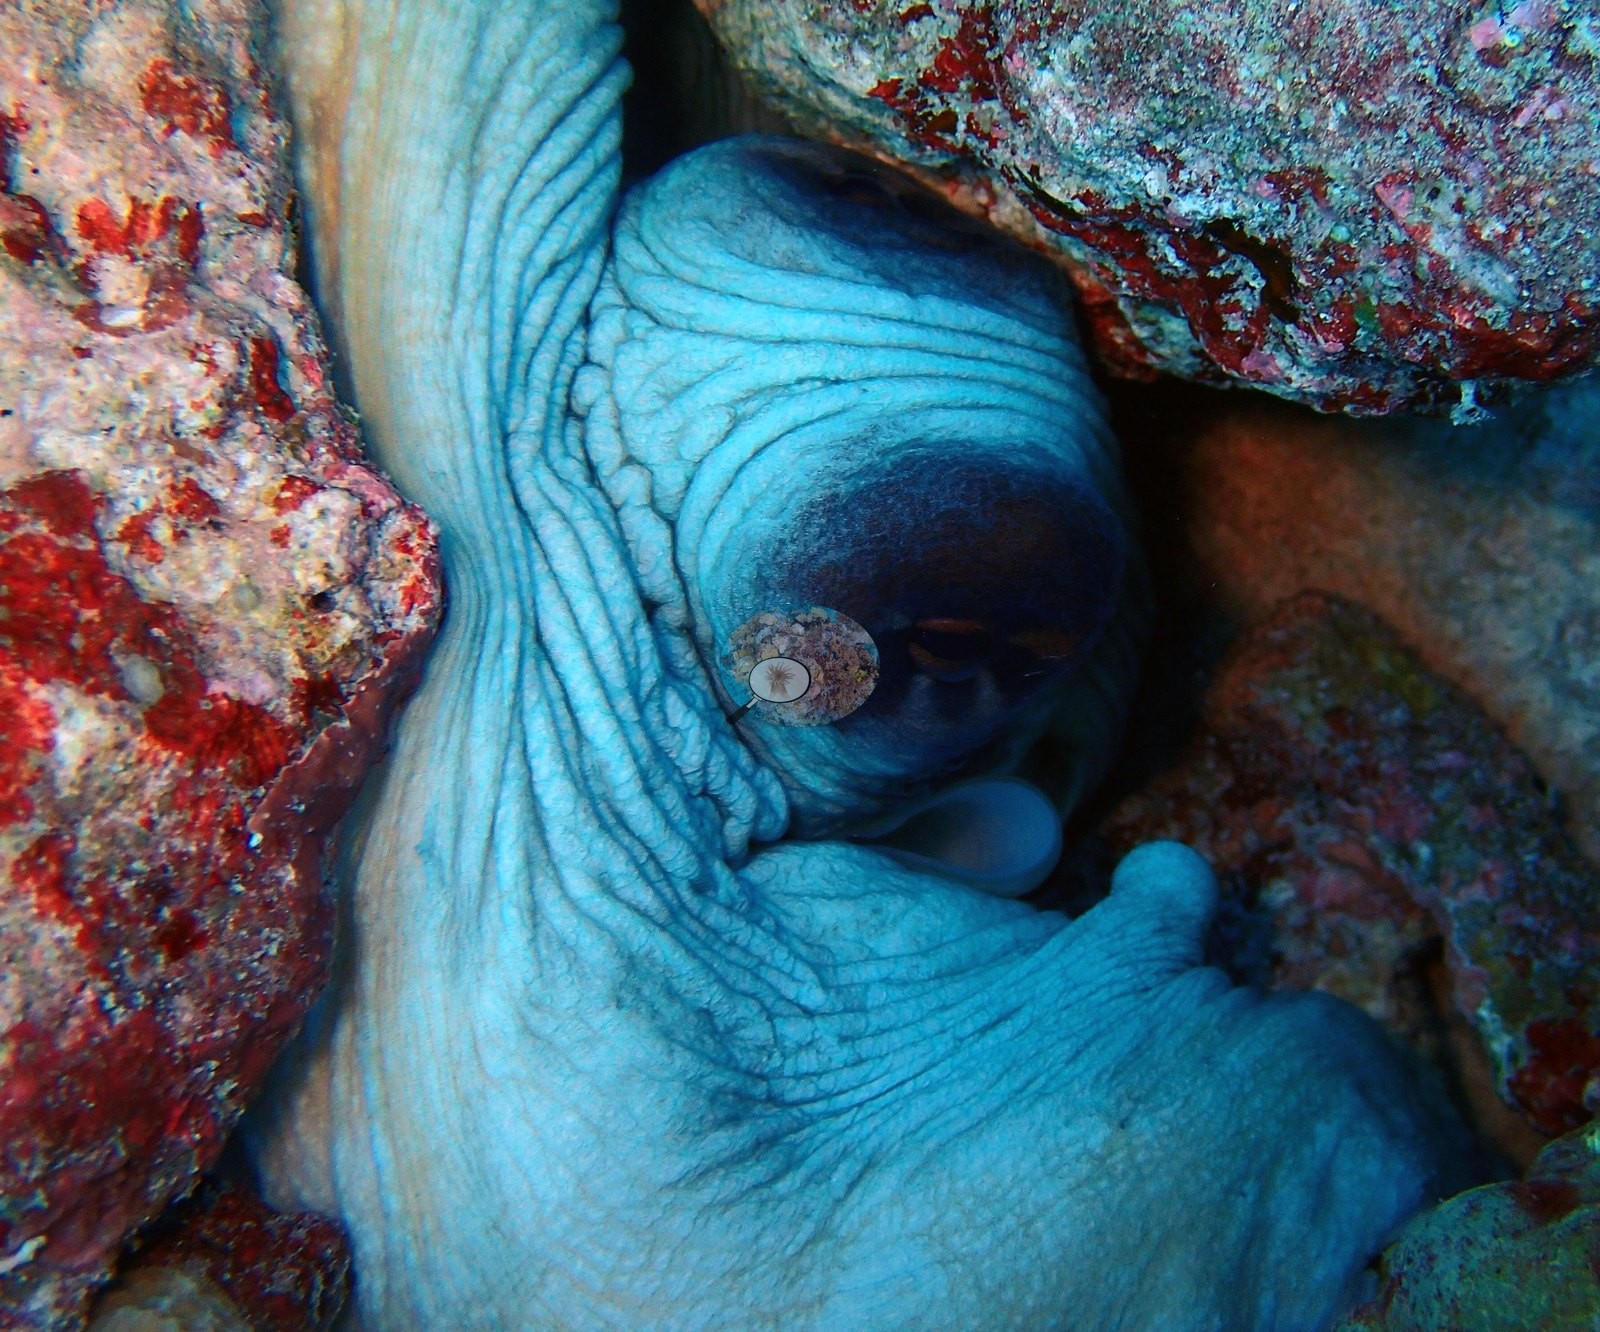
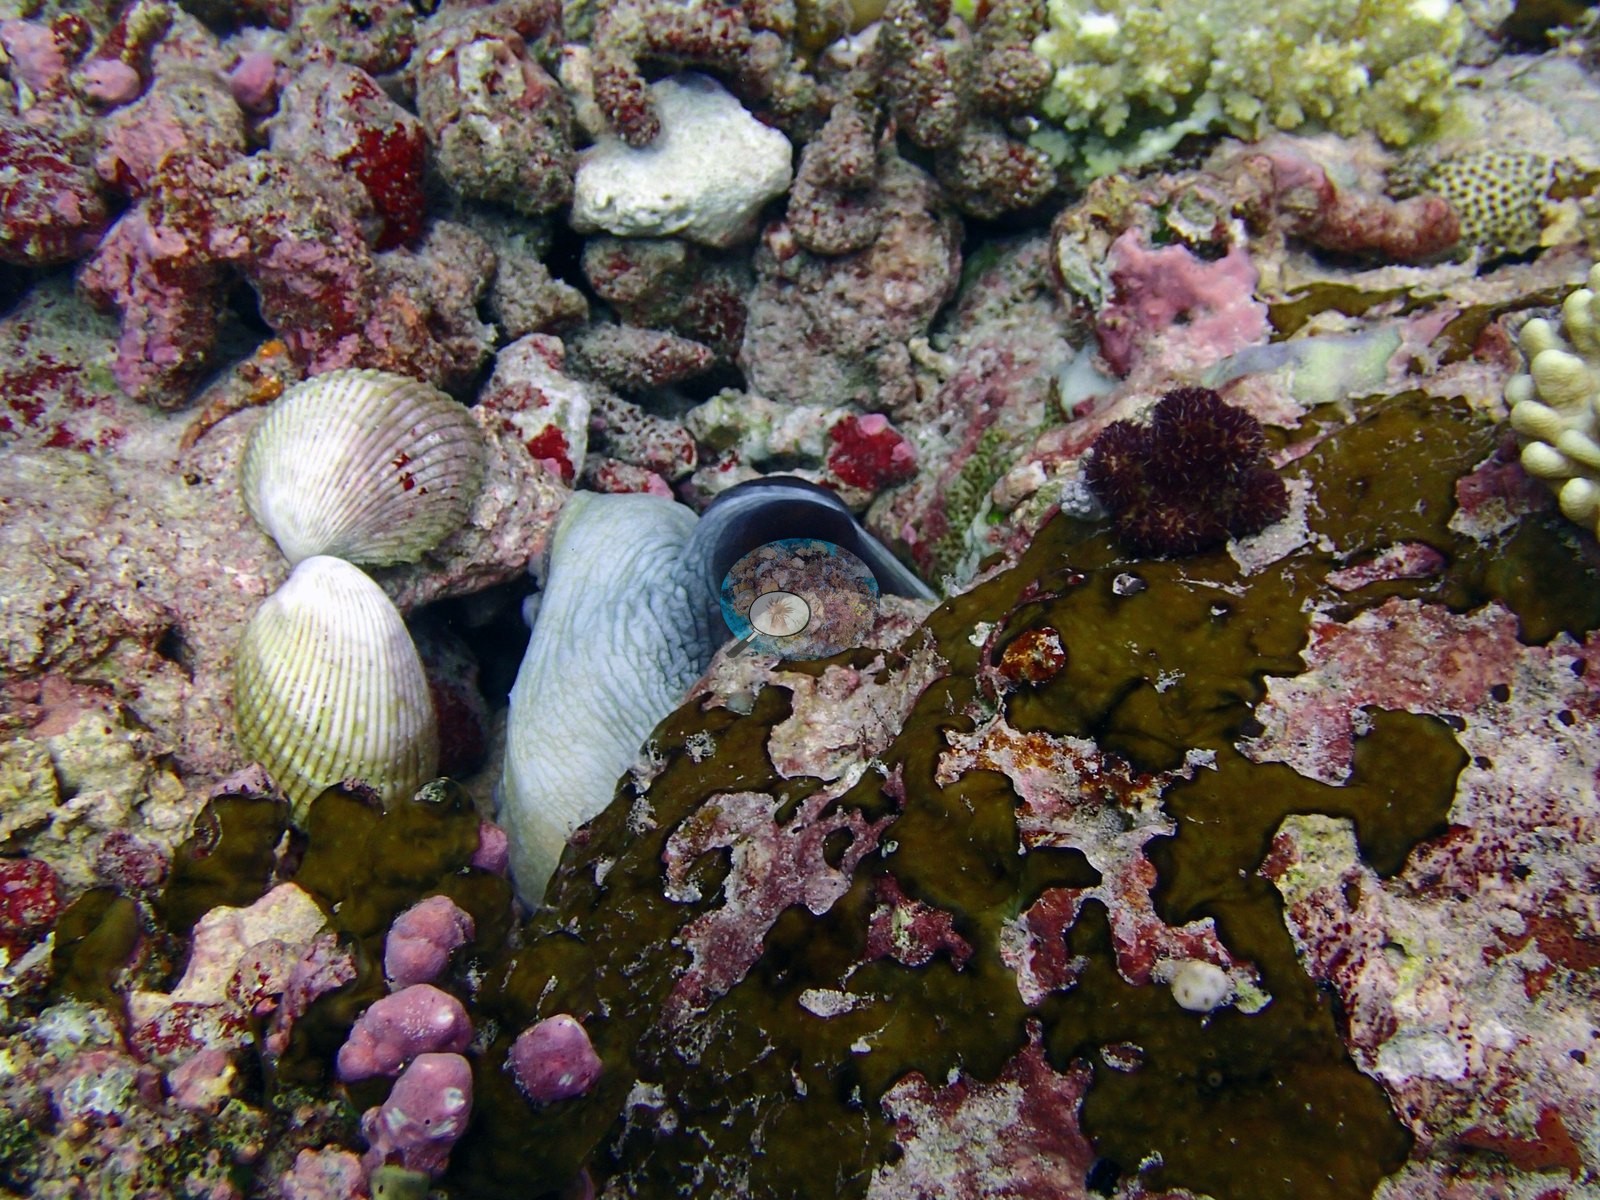
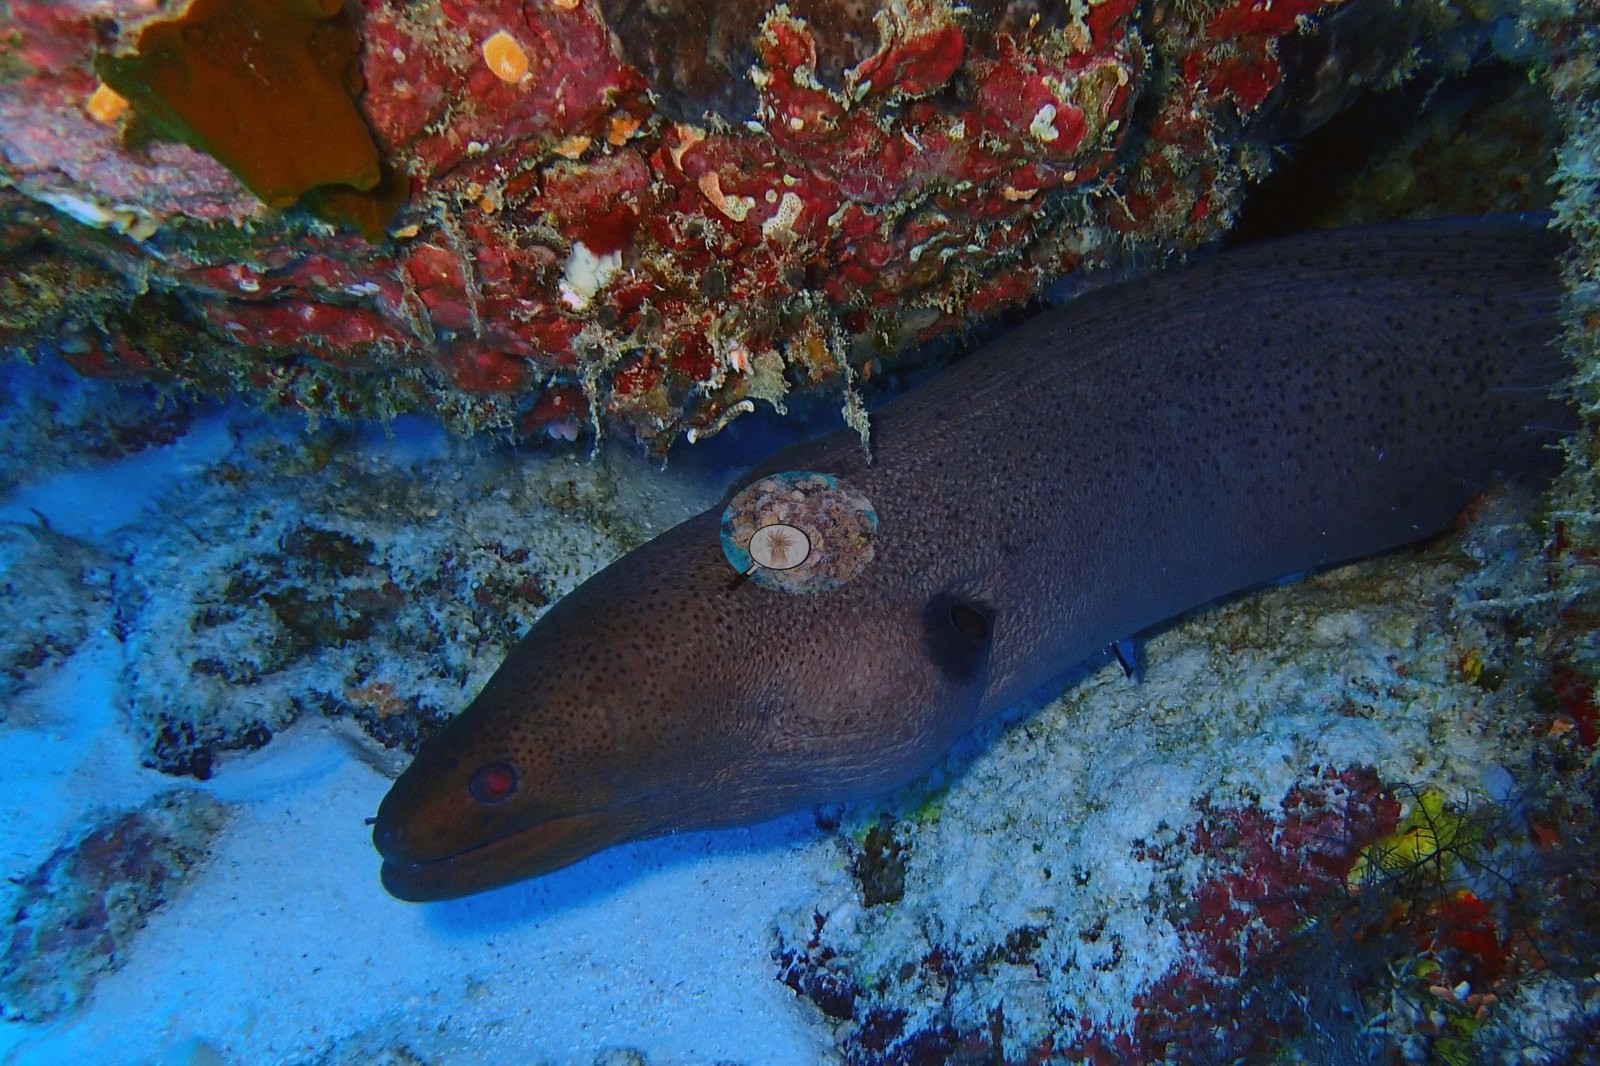
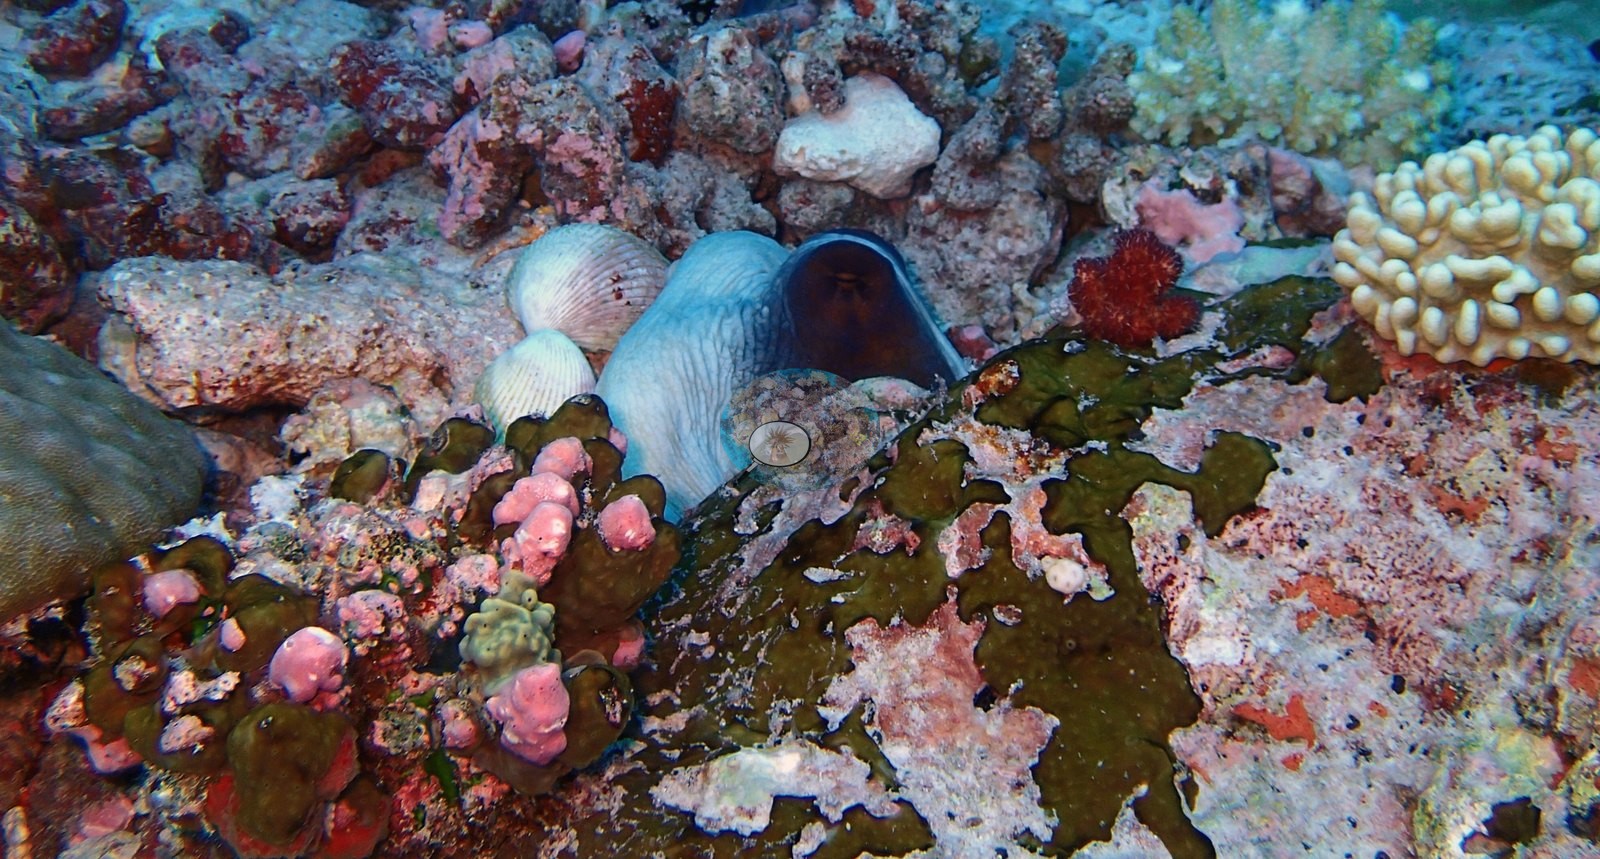
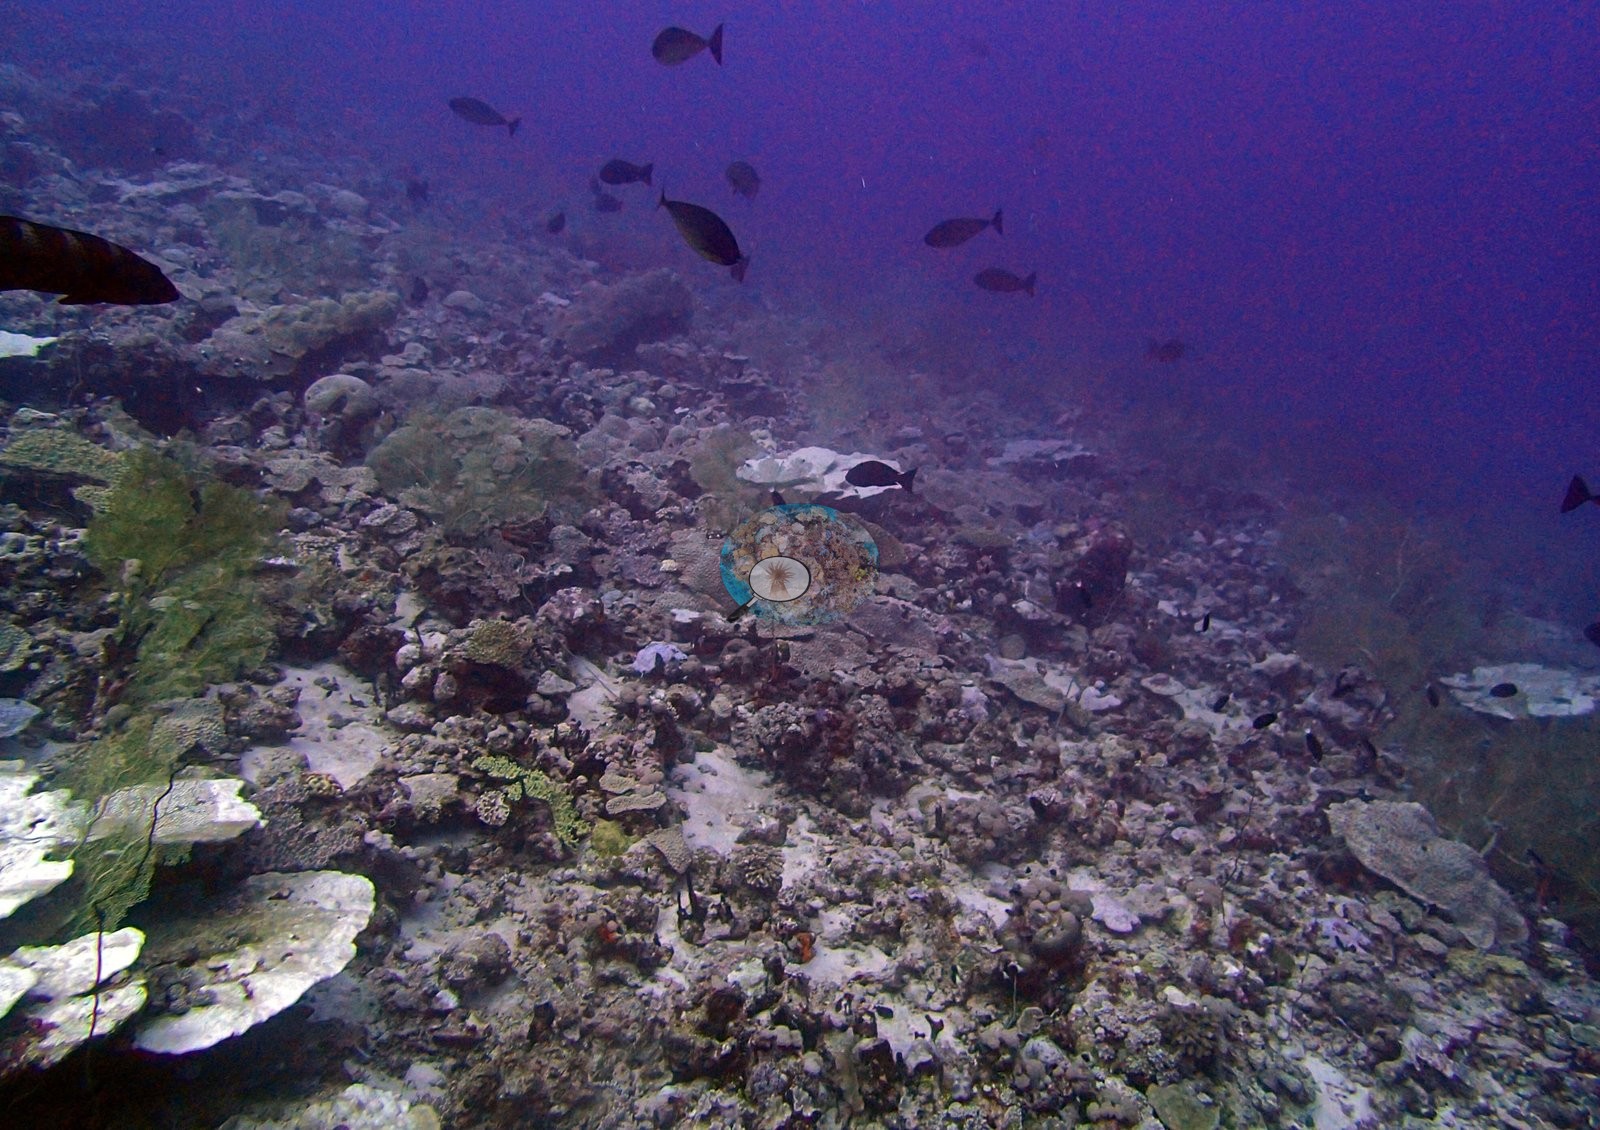
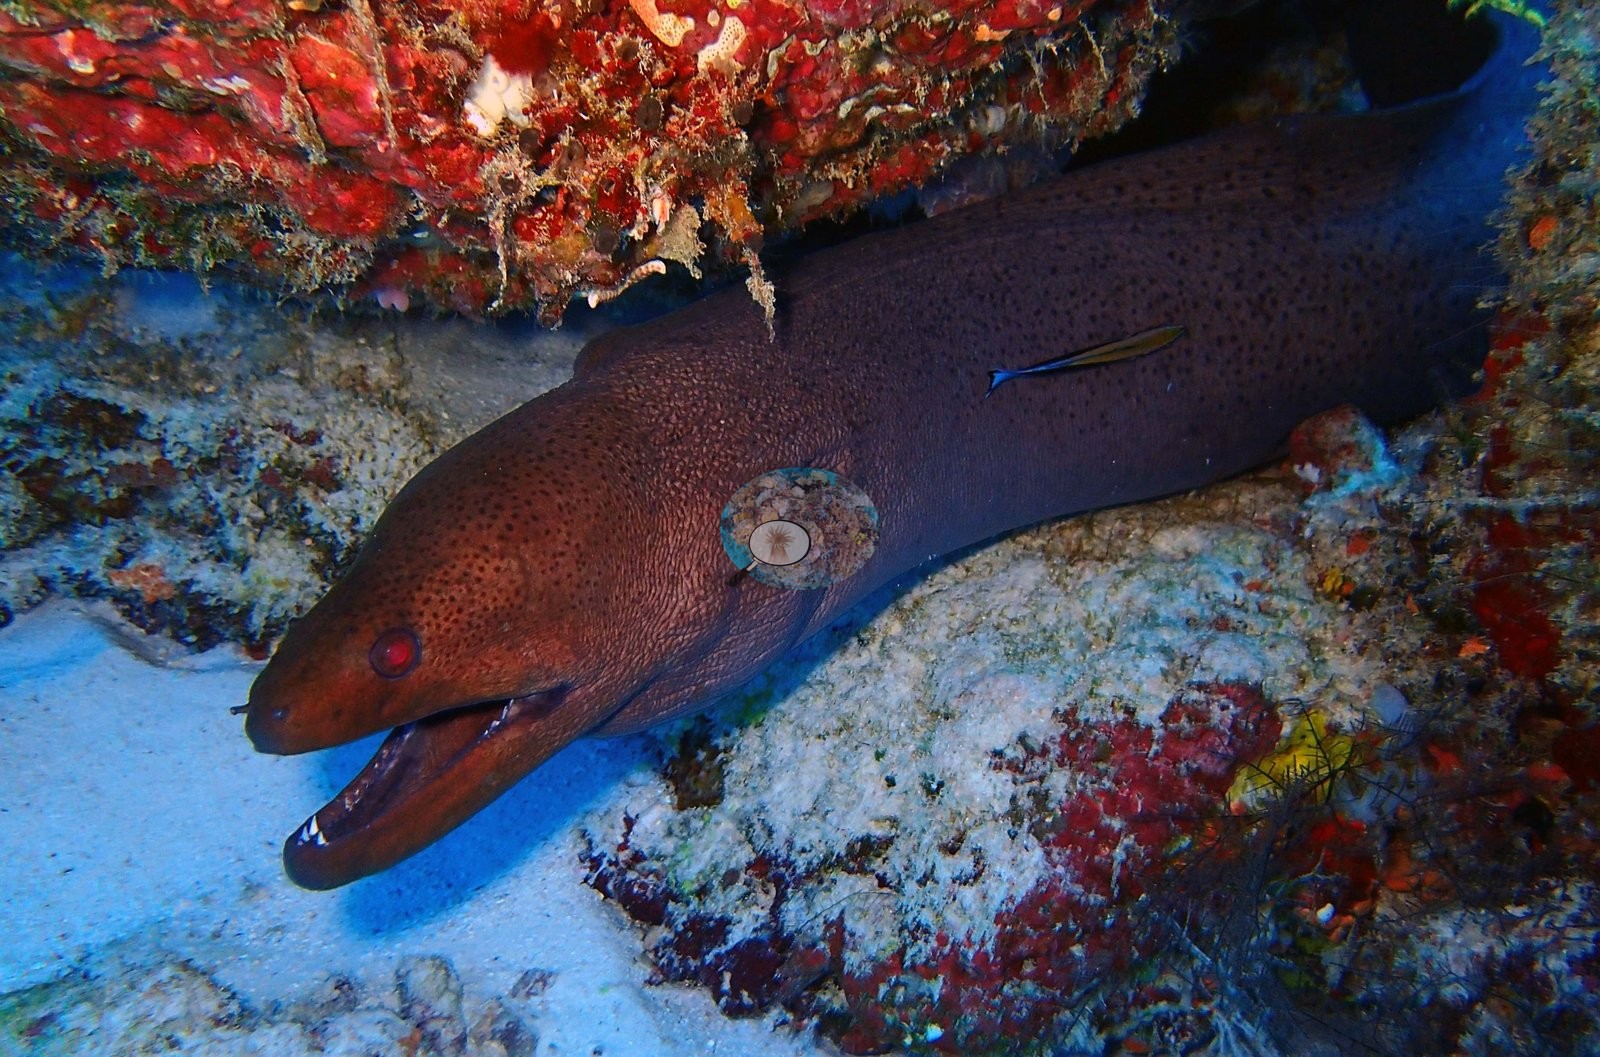
A silvertip-type shark, two giant morays, and an octopus were photographed, and one frame is a blue-light fluorescence shot that must be kept out of any color-based scoring (e.g., Image 2).
Comparisons with other data
No independent survey was made at this exact site; the nearest ones are listed in the table below.
CV model comparison
More info
Those are point counts on the photographs; this is a diver swimming a transect. The models and the reference never saw the same thing. ⚠ SITE-LEVEL ONLY. The 2,500 frames were not associated with any transect taken within 200 m of them, so transect-vs-image comparisons are site means, never frames. The transect value is already in the pin `cover` field (109 of 112 pins, sourced to the paper's suppl. S1) and is read from there, never re-imported. The transect is THE coral-cover value for this site and stands alone. The rows below it are a methods comparison only: no computer-vision value is averaged with it, feeds the headline, or carries over to the site's cover figure (Anderson, 2026-09-22).| Method | Hard-coral cover (%) |
|---|---|
| Transect (published) | 30.9 |
| CoralNet | 31.1 |
| In-house DINOv3 | 30.1 |
| CoralSCOP edited | 34.4 |
| Claude | 21.5 |
Independent surveys nearby
| Agency / program | Year(s) | Stations / distance | Link |
|---|---|---|---|
| Sheppard et al. (2008) | 2006 | 1 station, 3.61 km | Records ↓ |
| Spalding et al. (2024) | 2024 | 1 station, 1.48 km | Records ↓ |
| Spalding et al. 2025 (Chagos 2024 bleaching report) | 2024 | 1 station, 1.48 km | Records ↓ |
| XL Catlin Seaview Survey | 2015 | 3 stations, 0.43–3.82 km | Records ↓ |
 Dr. Coral (CRD)Year-average (no detectable trend)
Within 5 km, 6 independent survey stations recorded hard coral cover in 10 records between 2006 and 2024. Surveys since 2021 average 65% (range 65%, n=2). This site's own estimate (31%) sits 34.1 points below the recent range (65%); the methods differ, so the comparison is context, not a like-for-like test.
Collected by other programs using different methods (the XL Catlin Seaview Survey uses photo-transects with automated image annotation), so these are context for the figures above, not a like-for-like comparison. Where a station was surveyed more than once the range is shown. Station names are not dive-site names.
| Agency | Site / location | Date | Hard coral cover (%) | Distance | Link |
|---|---|---|---|---|---|
| Sheppard et al. (2008) | Salomon | 2006 | 32% (5 surveys) | 3.61 km | HeatCRD database |
| XL Catlin Seaview Survey | transect 36017 | 2015 | 22% | 0.43 km | — |
| XL Catlin Seaview Survey | transect 36015 | 2015 | 28% | 1.63 km | — |
| XL Catlin Seaview Survey | transect 36018 | 2015 | 22% | 3.82 km | — |
| Spalding et al. 2025 (Chagos 2024 bleaching report) | Salomon - Boddam Lagoon (N, 1-4 m) | 2024 | 65% | 1.48 km | — |
| Spalding et al. (2024) | Salomon - Boddam Lagoon (N, 1-4 m) | 2024 | 65% | 1.48 km | — |
Data & links
- Read the full site report ↗
- Download benthic survey data (CSV) ↗
- Download all LOF-GRE data (933 sites) ↗
- CoralNet image repository for this region ↗
- HeatCRD database ↗
- (reference) ↗
- Photo portfolio ↗
- Coral Reef Diagnostics page for this area ↗
All images from Coral Reef Diagnostics. Data are from Coral Reef Diagnostics and the organizations named in the data-sources table above.
 © Coral Reef Diagnostics.
References
- Mayfield AB, Dempsey AC (2026). Using tourist diver images to estimate coral cover and bleaching prevalence in a remote Indian Ocean coral reef system. Oceans 7(1):1. PDF
- Sheppard C, Harris A, Sheppard A (2008). Archipelago-wide coral recovery patterns since 1998 in the Chagos Archipelago, central Indian Ocean. Marine Ecology Progress Series 362:109-117. PDF
- Spalding M, Bourasseau M, et al. (2025). Coral bleaching and mortality in the Chagos Archipelago, 2024. British Indian Ocean Territory Administration report (gray literature). PDF