
Part of the regional summaries: Chagos Archipelago - Peros Banhos and Chagos Archipelago
2015-04-17
2015-05-02
More info
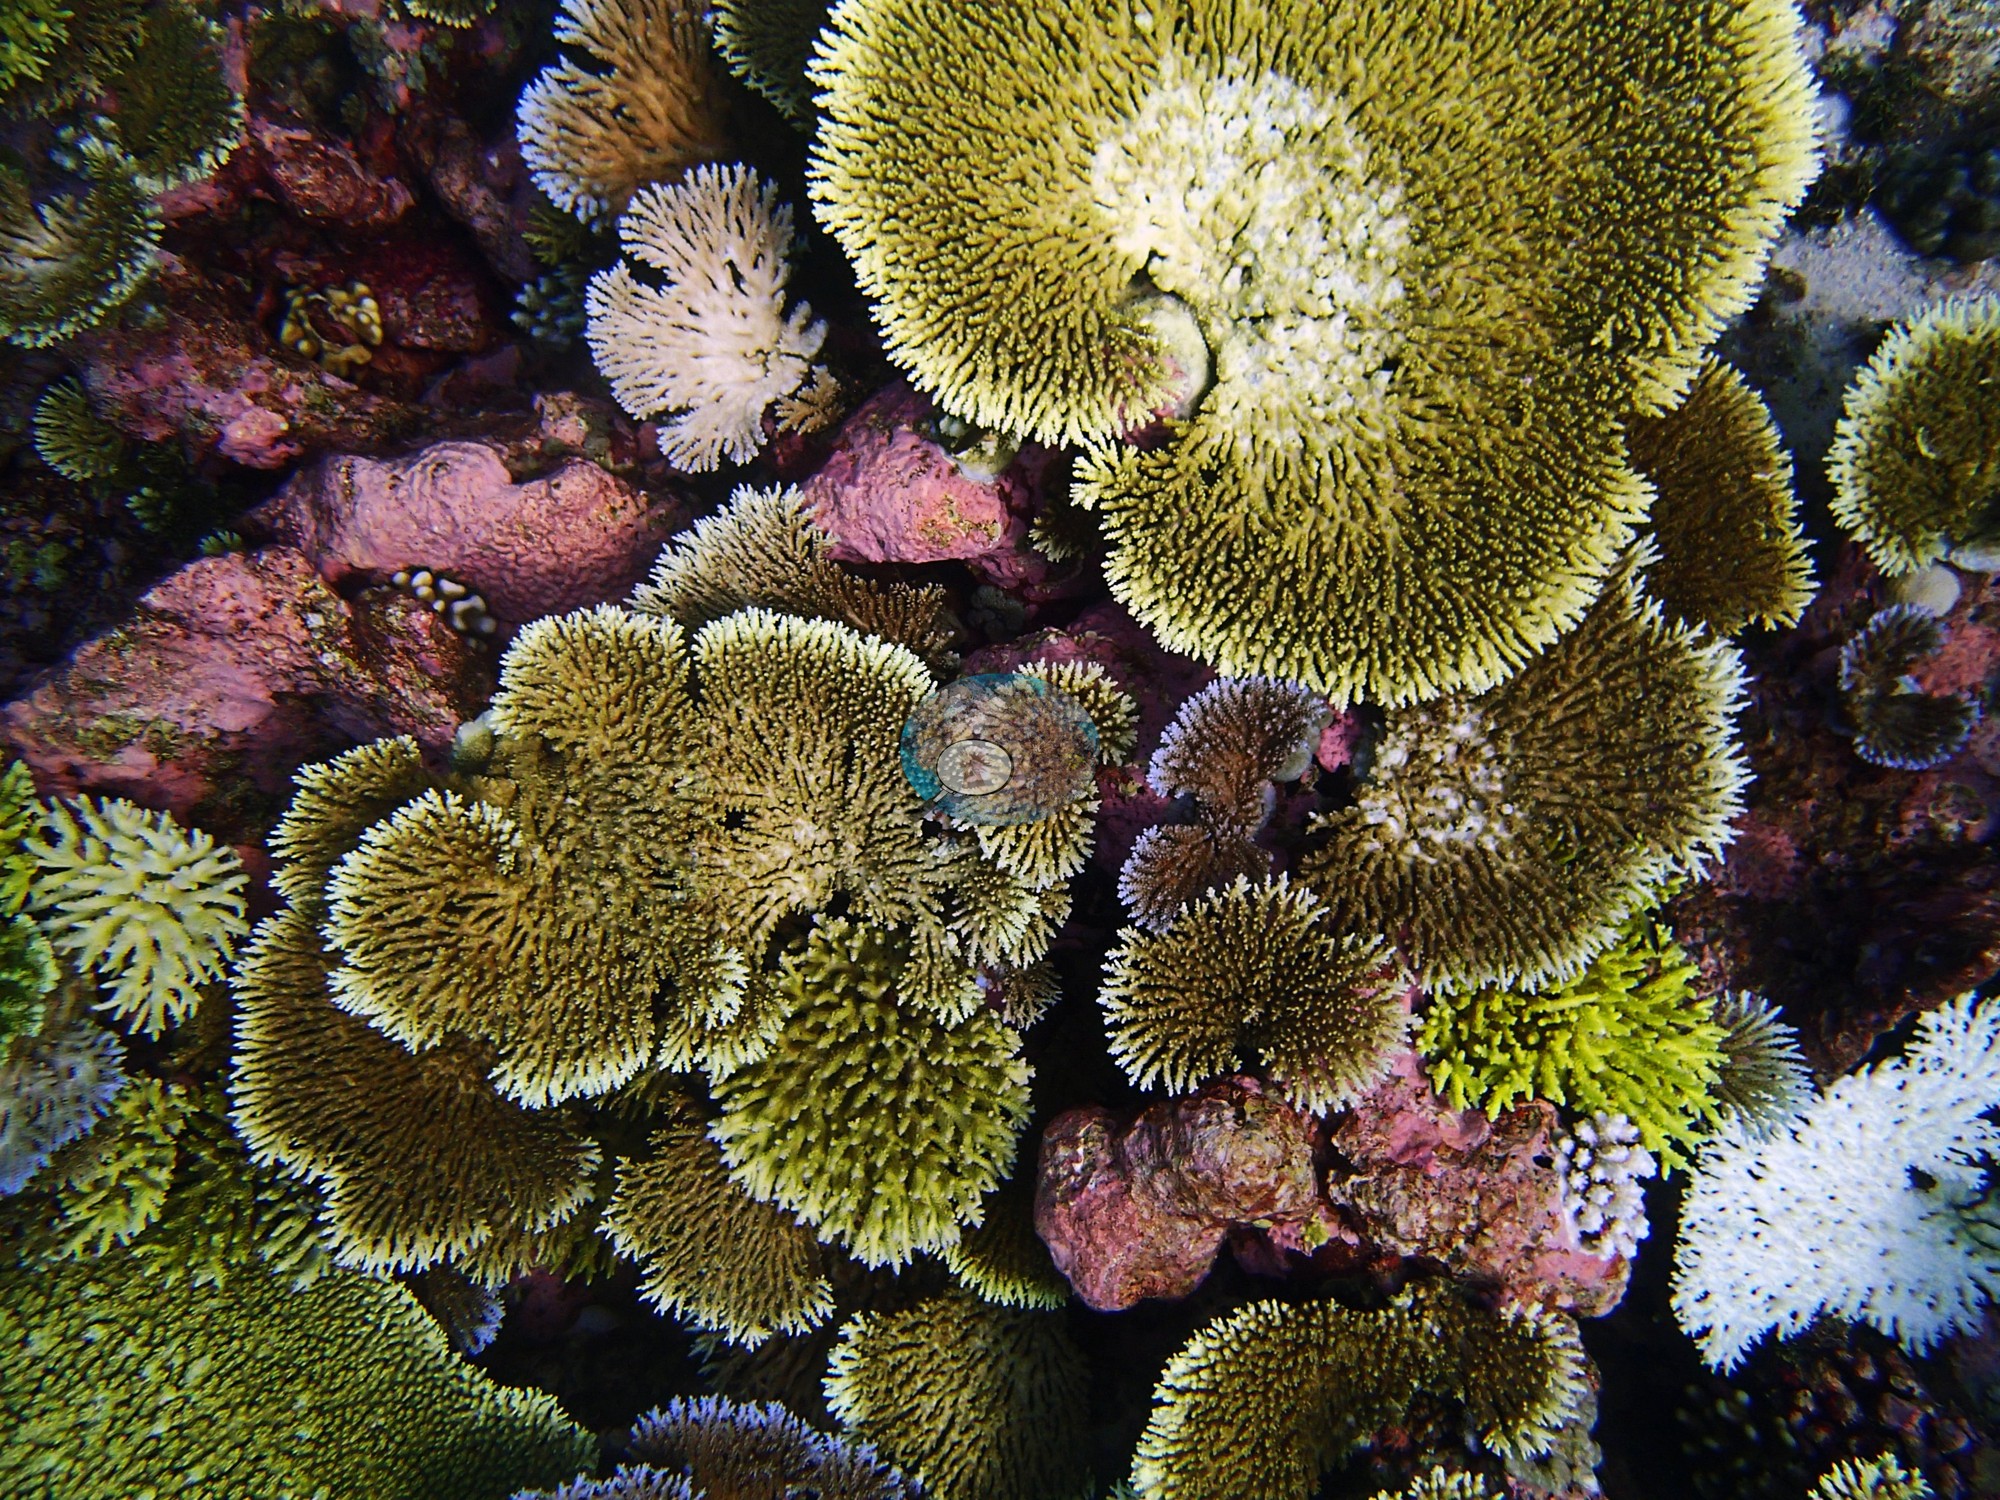
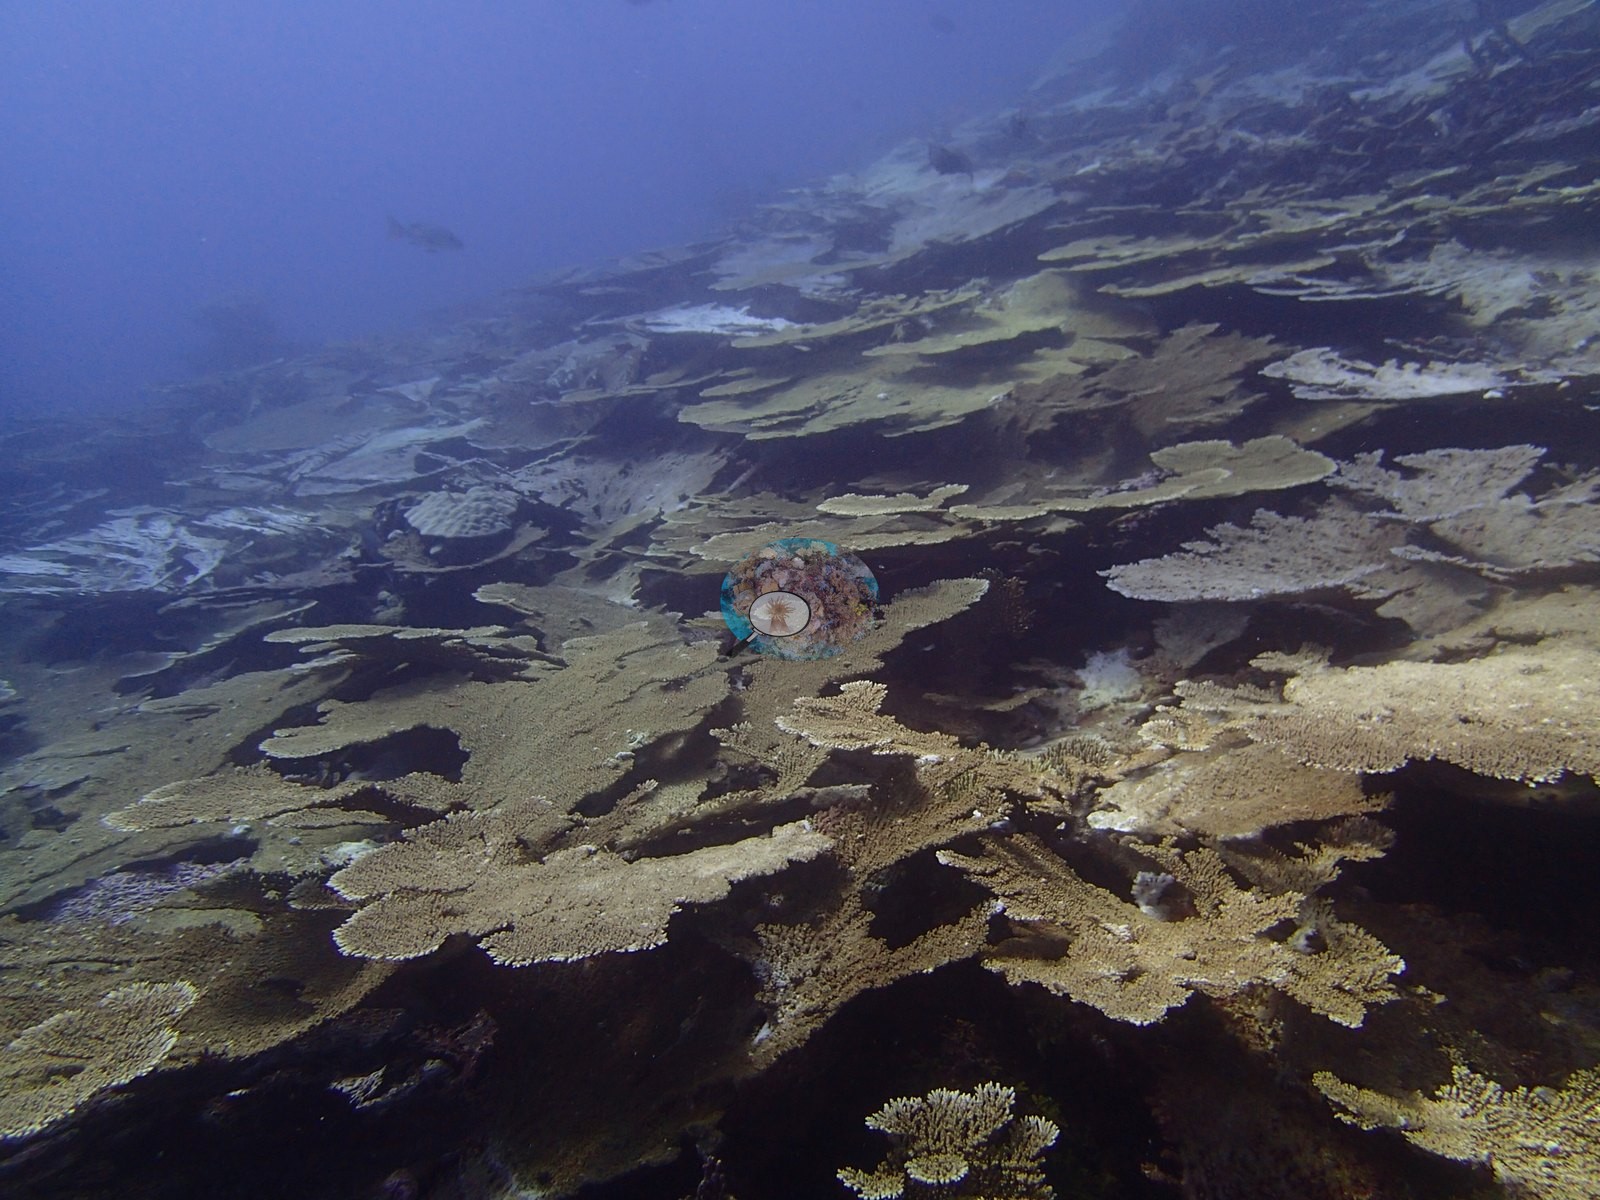
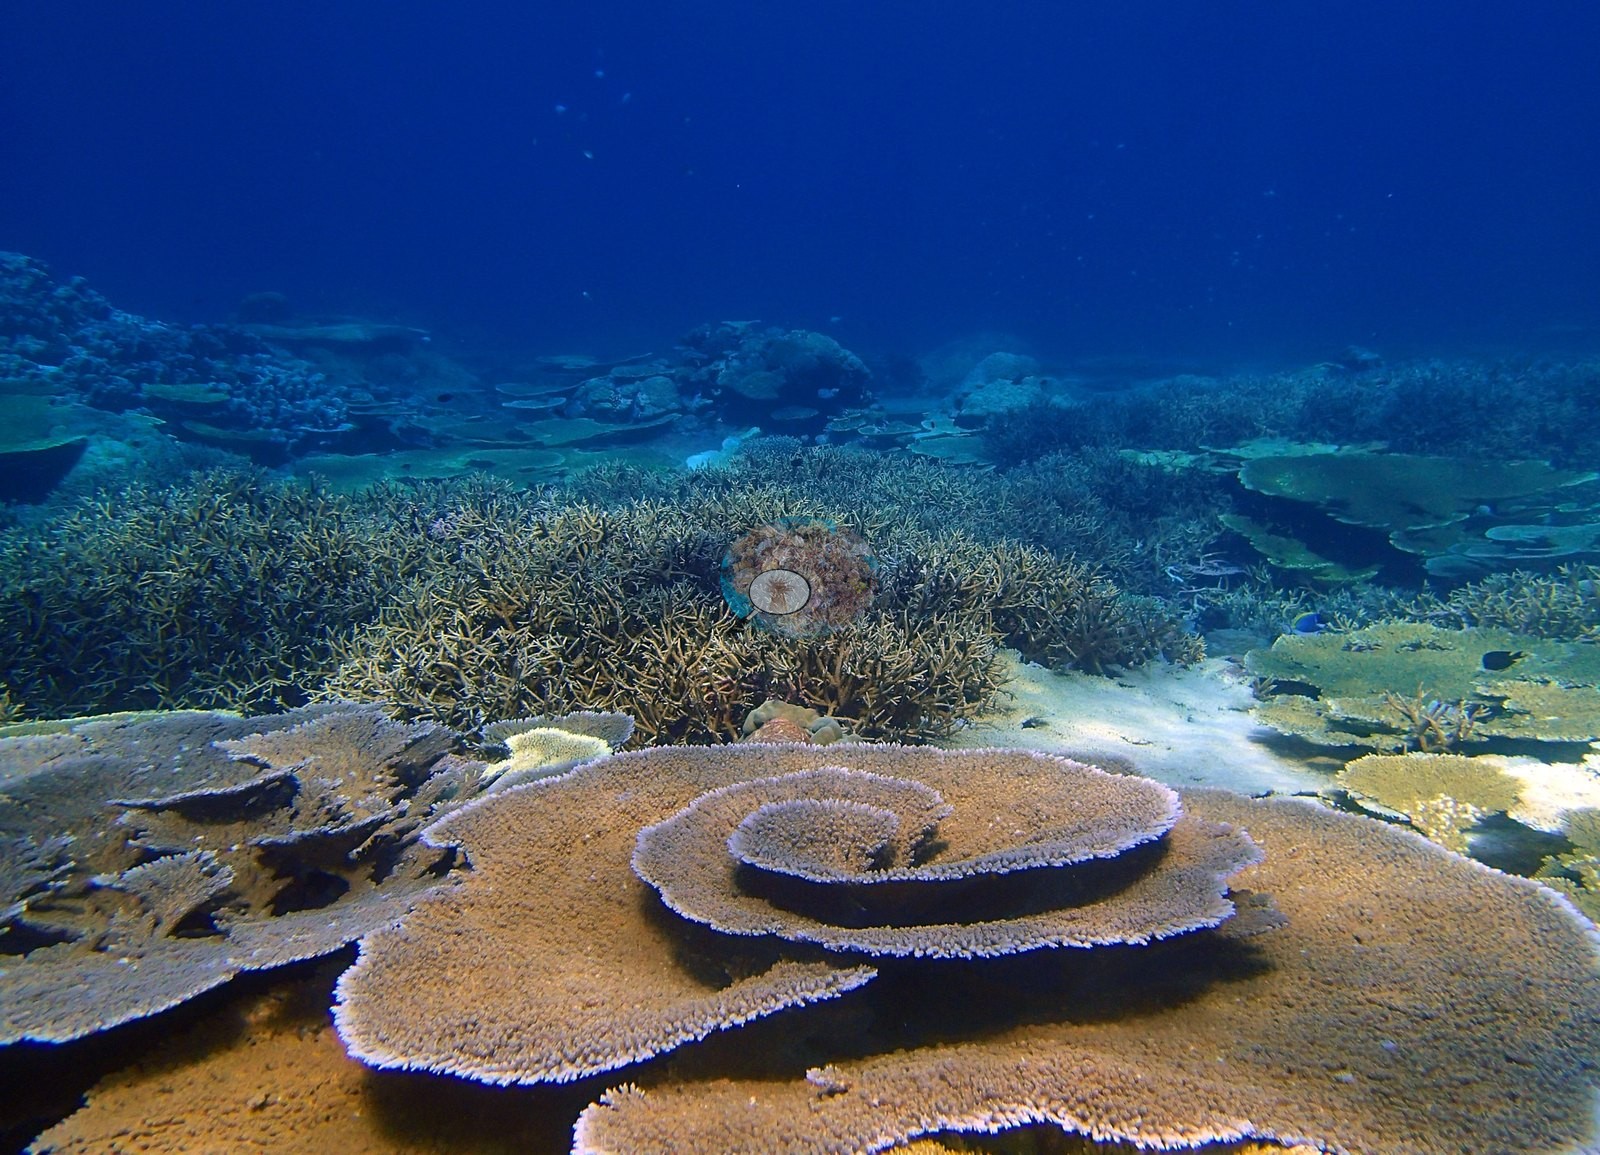
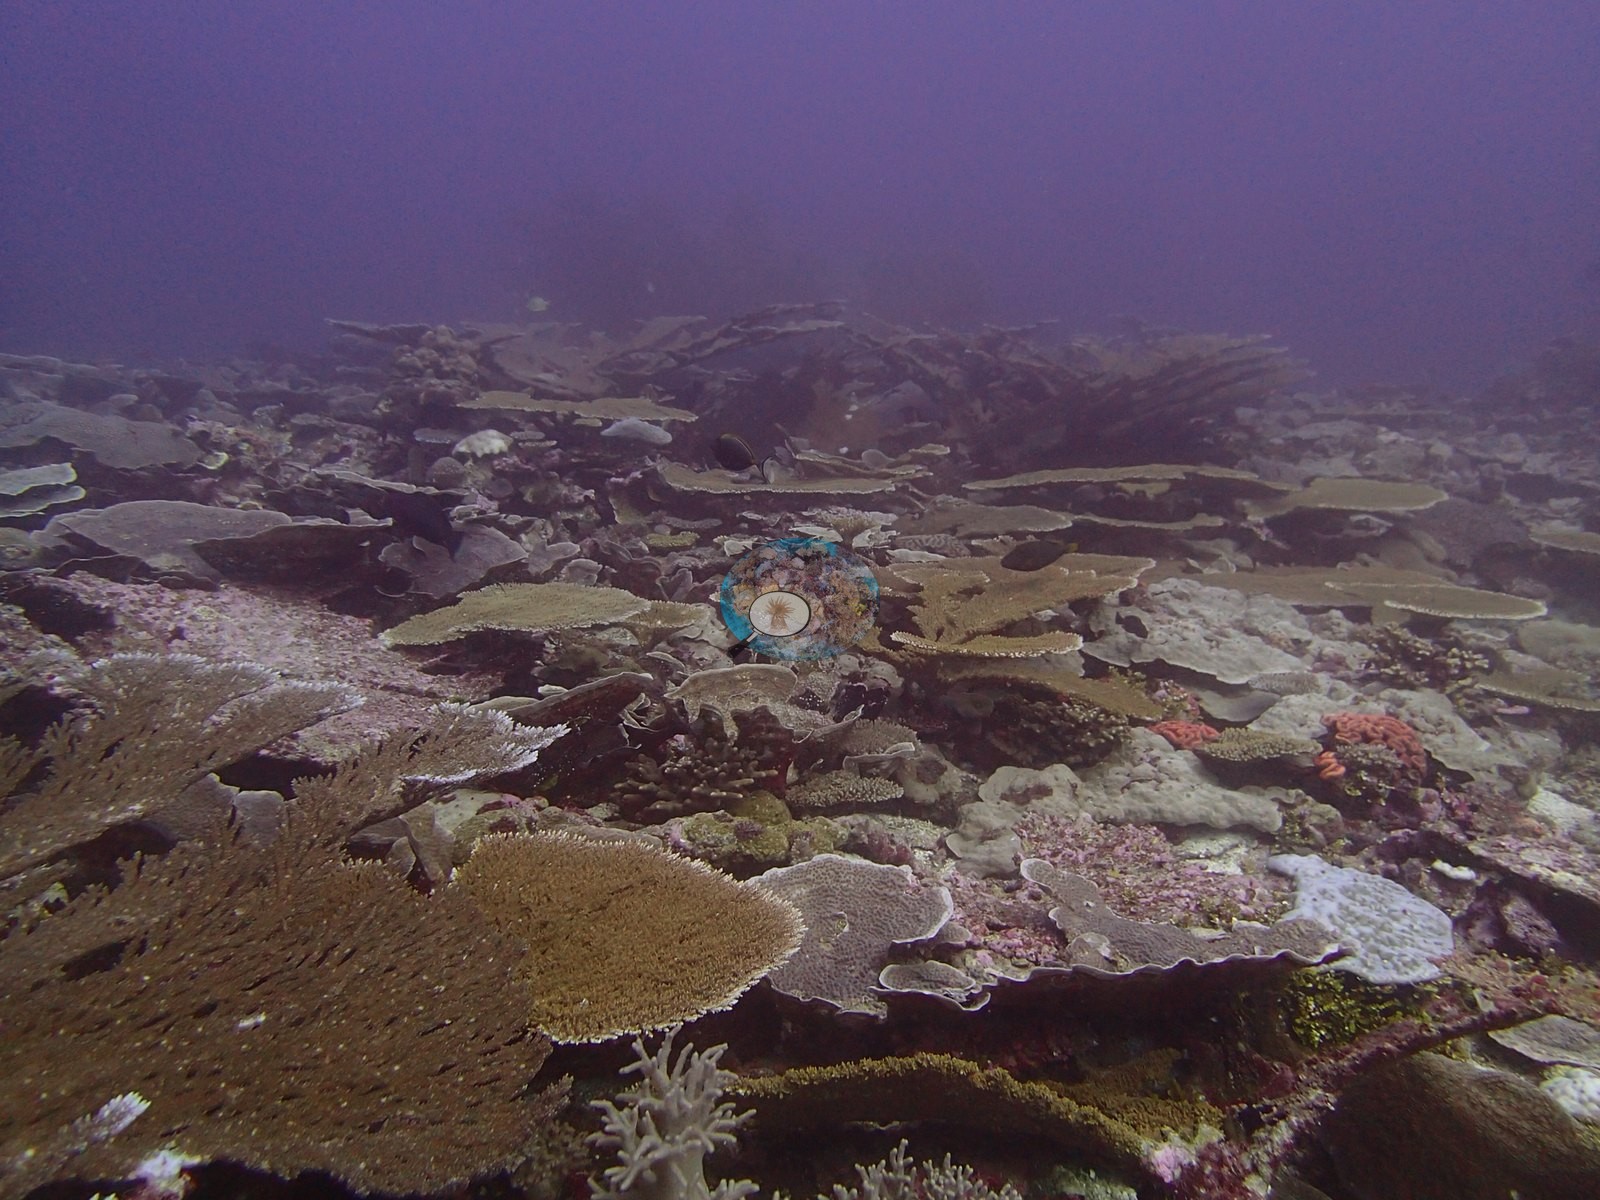
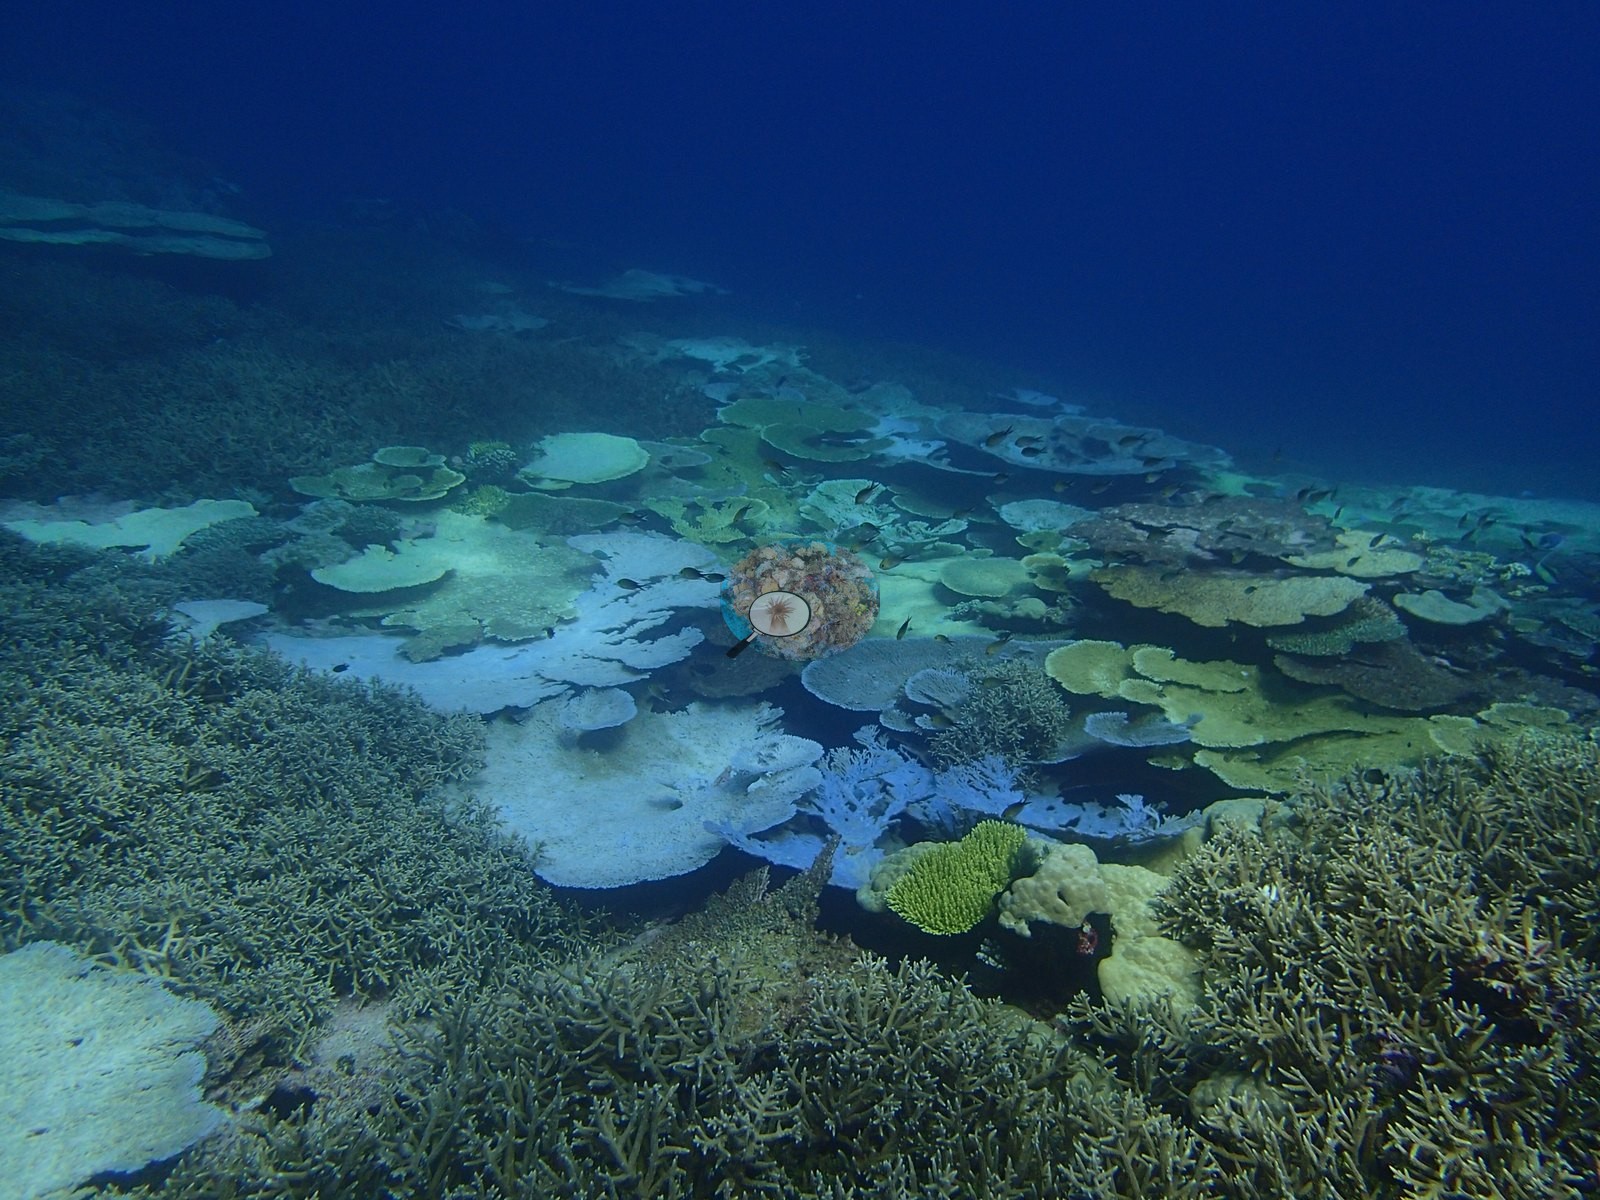
Chagos (NOAA CRW virtual station)One of Chagos's highest-cover reefs (64.7%): a near-pure stand of table Acropora in the shallows giving way to Echinopora at depth. Dived three times, it recorded bleaching as it happened, rising from 0% on 16 April to 12% the next day and 36.5% by 2 May, with fields of white tables beside still-dark branching stands. Surveyed on the Living Oceans Foundation's Global Reef Expedition.
Two other CRD dive sites within 5 km shown in orange — click a marker to open its page.
🗺 Detailed map of the Global Reef Expedition dive sites, Peros Banhos, Chagos (Khaled bin Sultan Living Oceans Foundation; opens in a new window)
8 of these 33 photographs are shown beside the text that discusses them under "Site description" below.
Site description
Setting
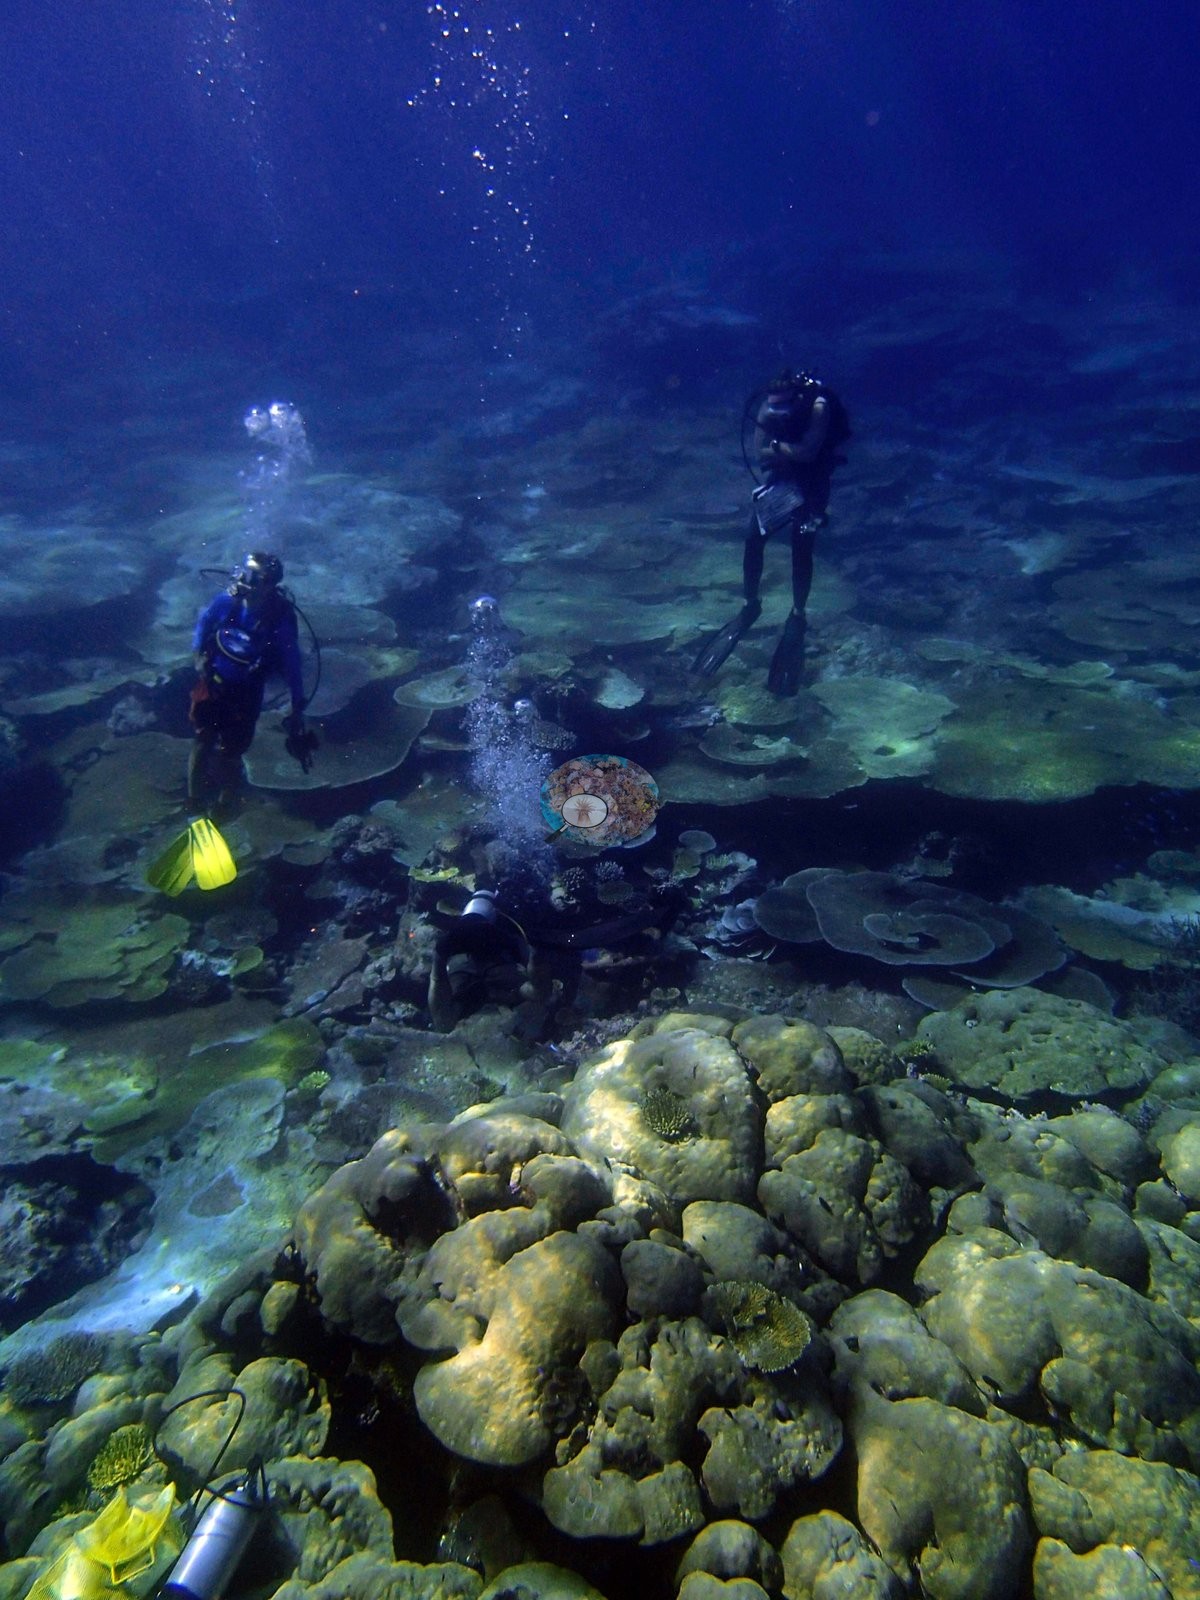
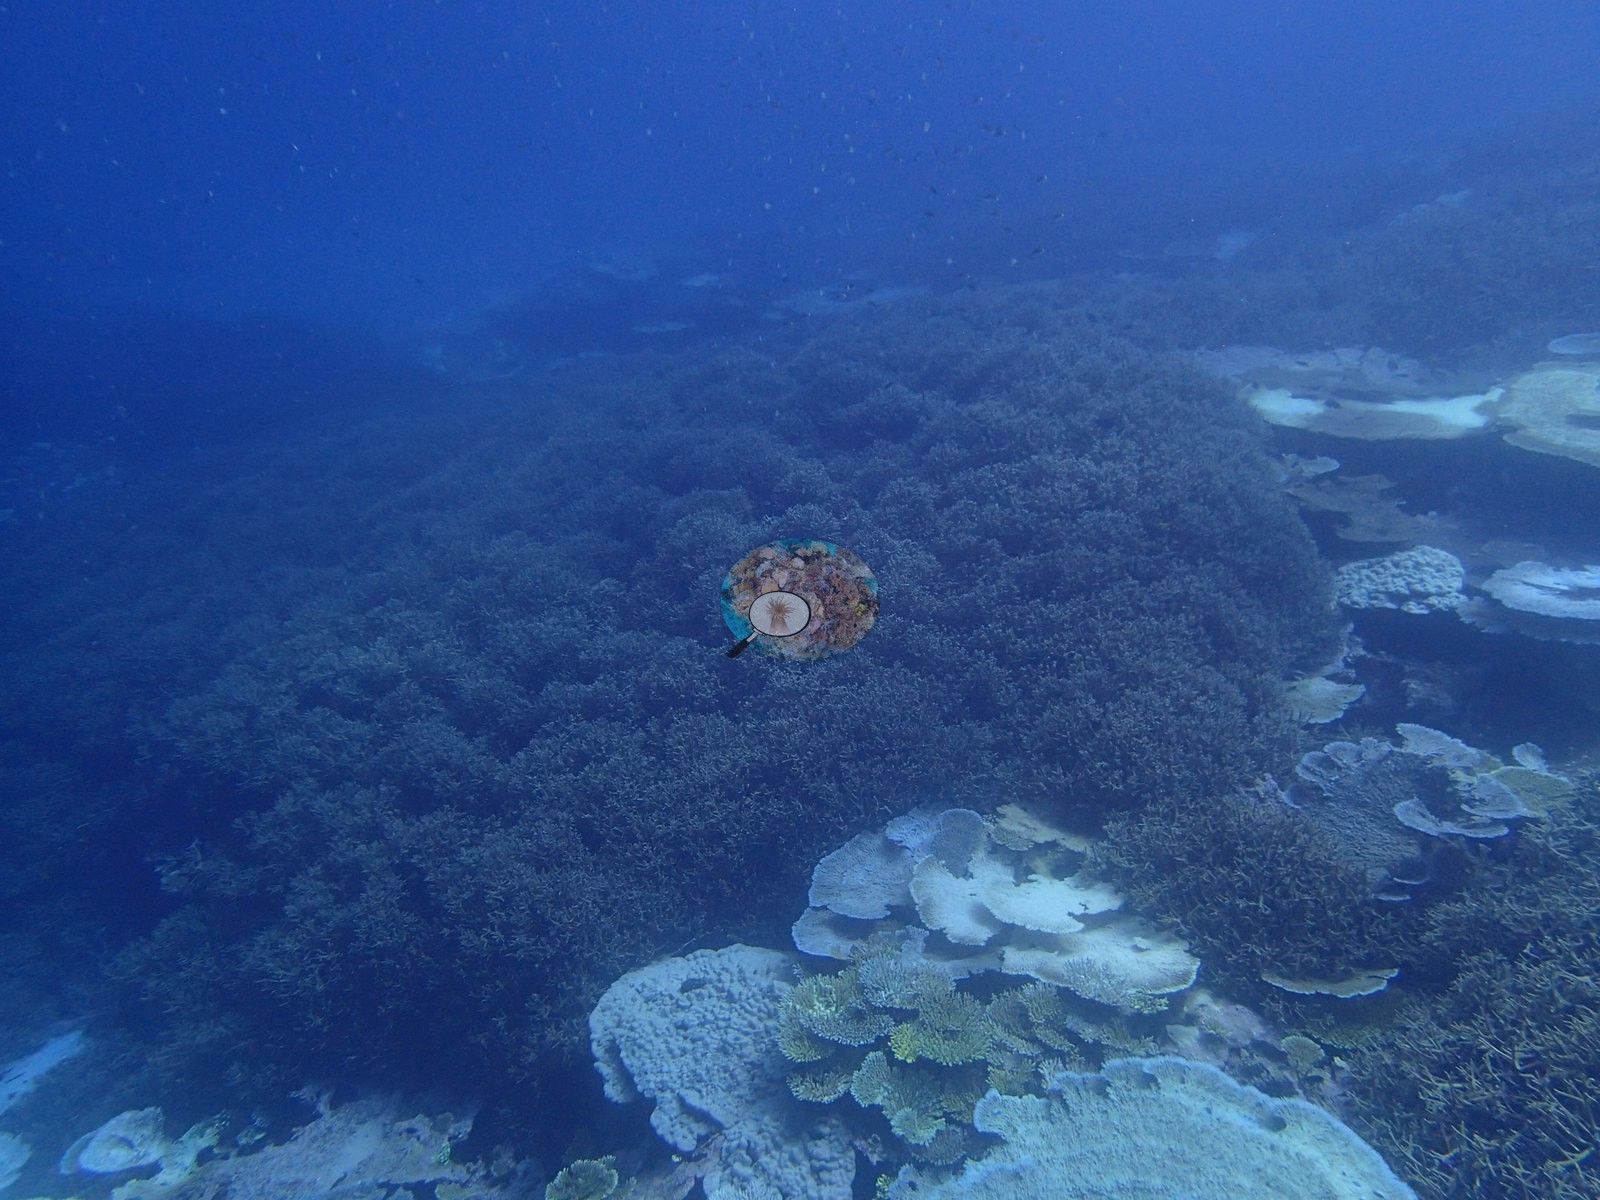
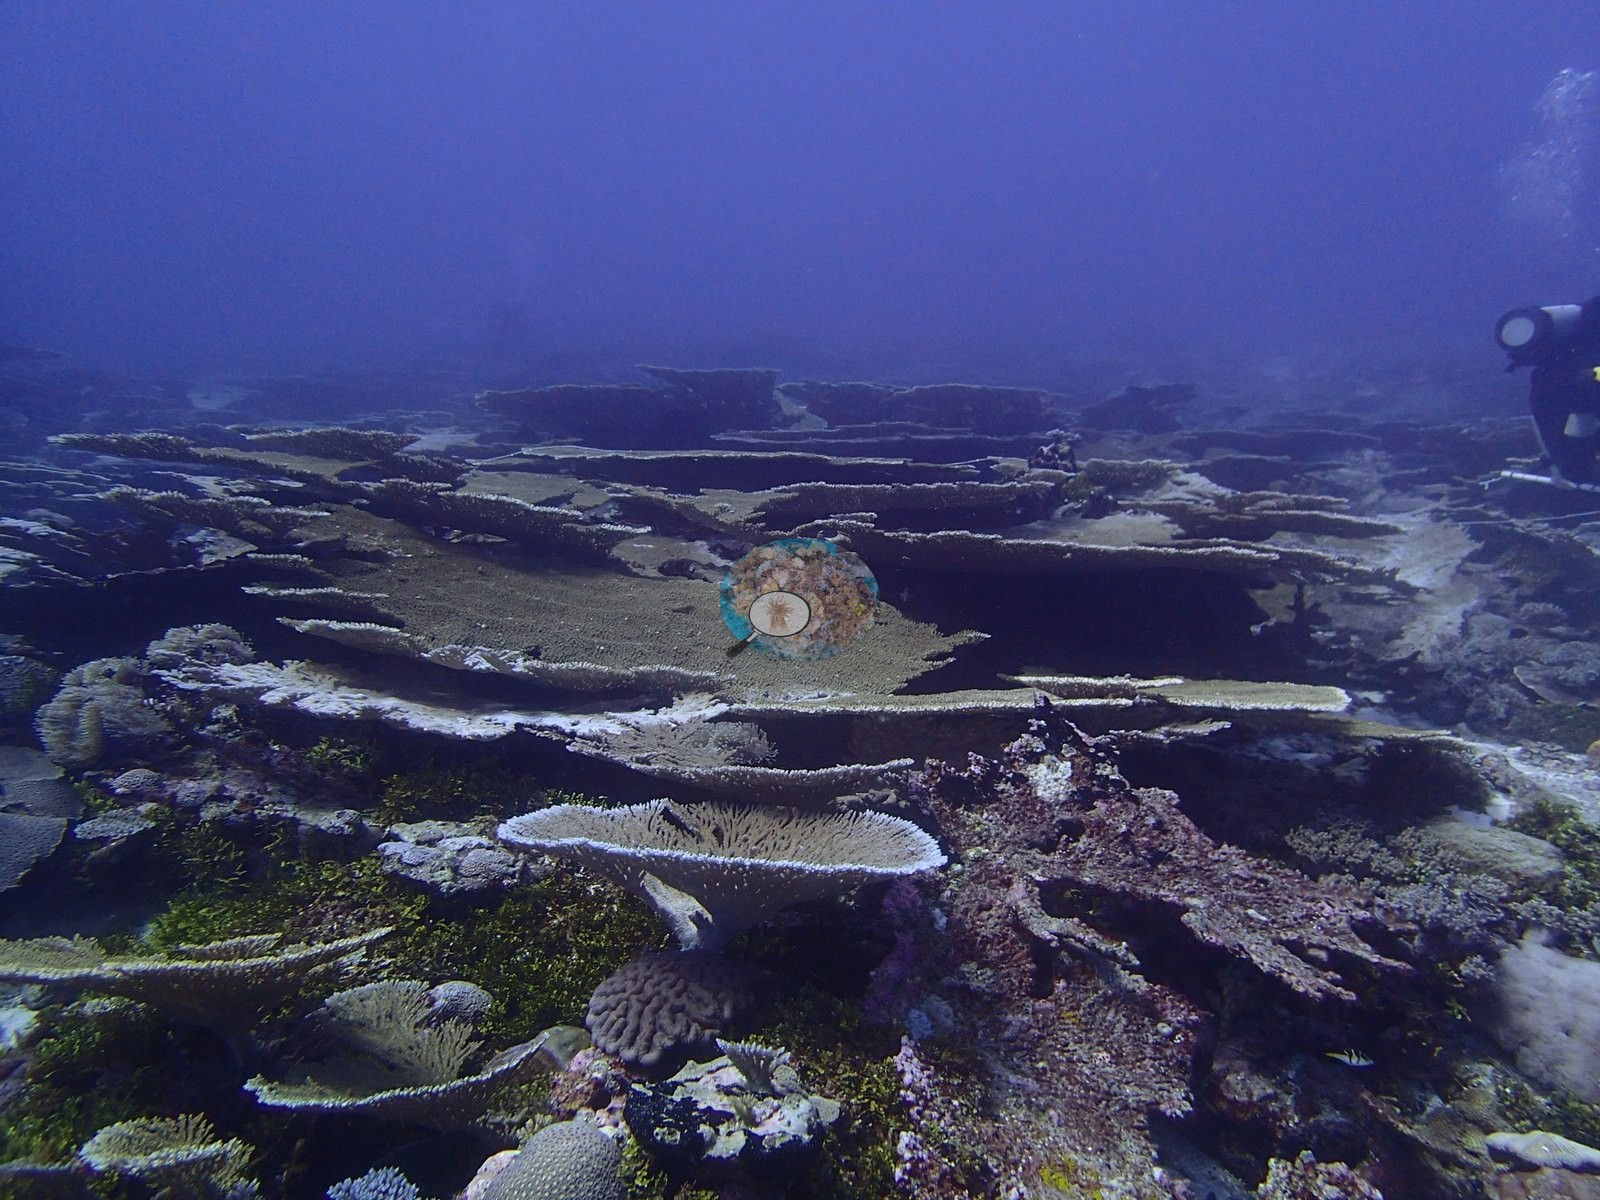
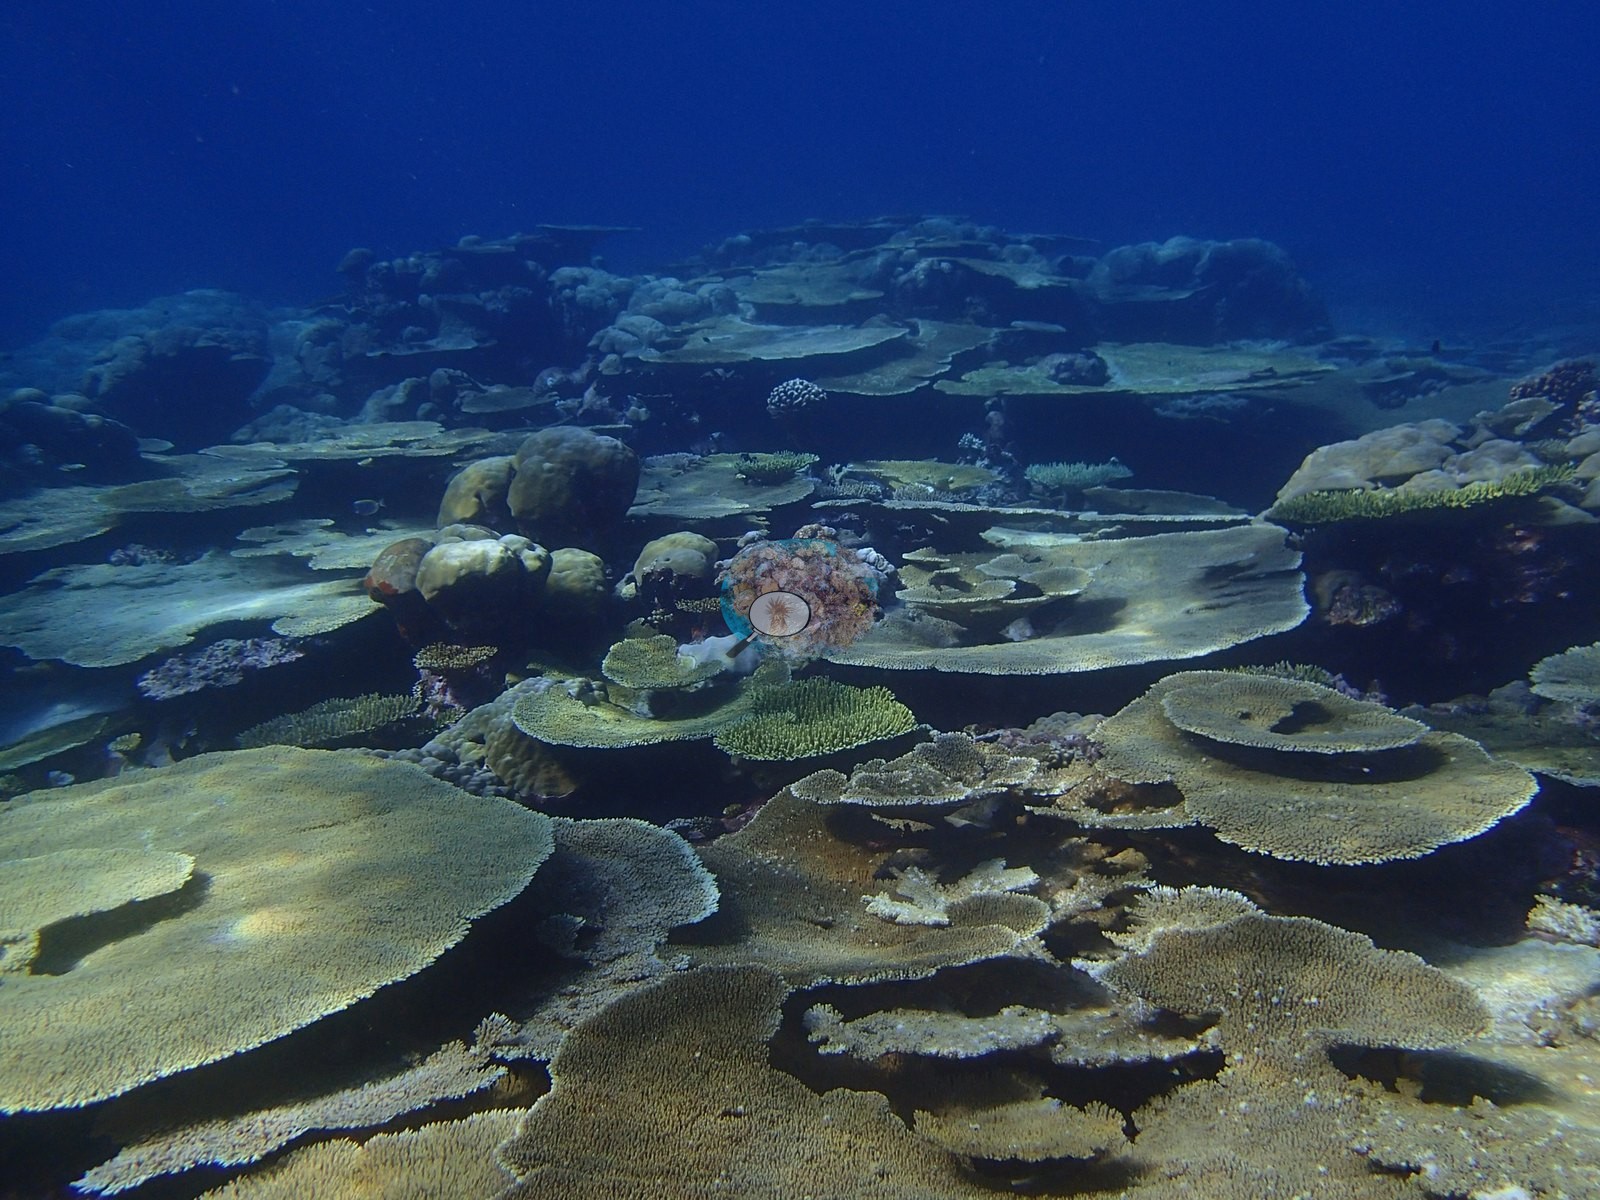
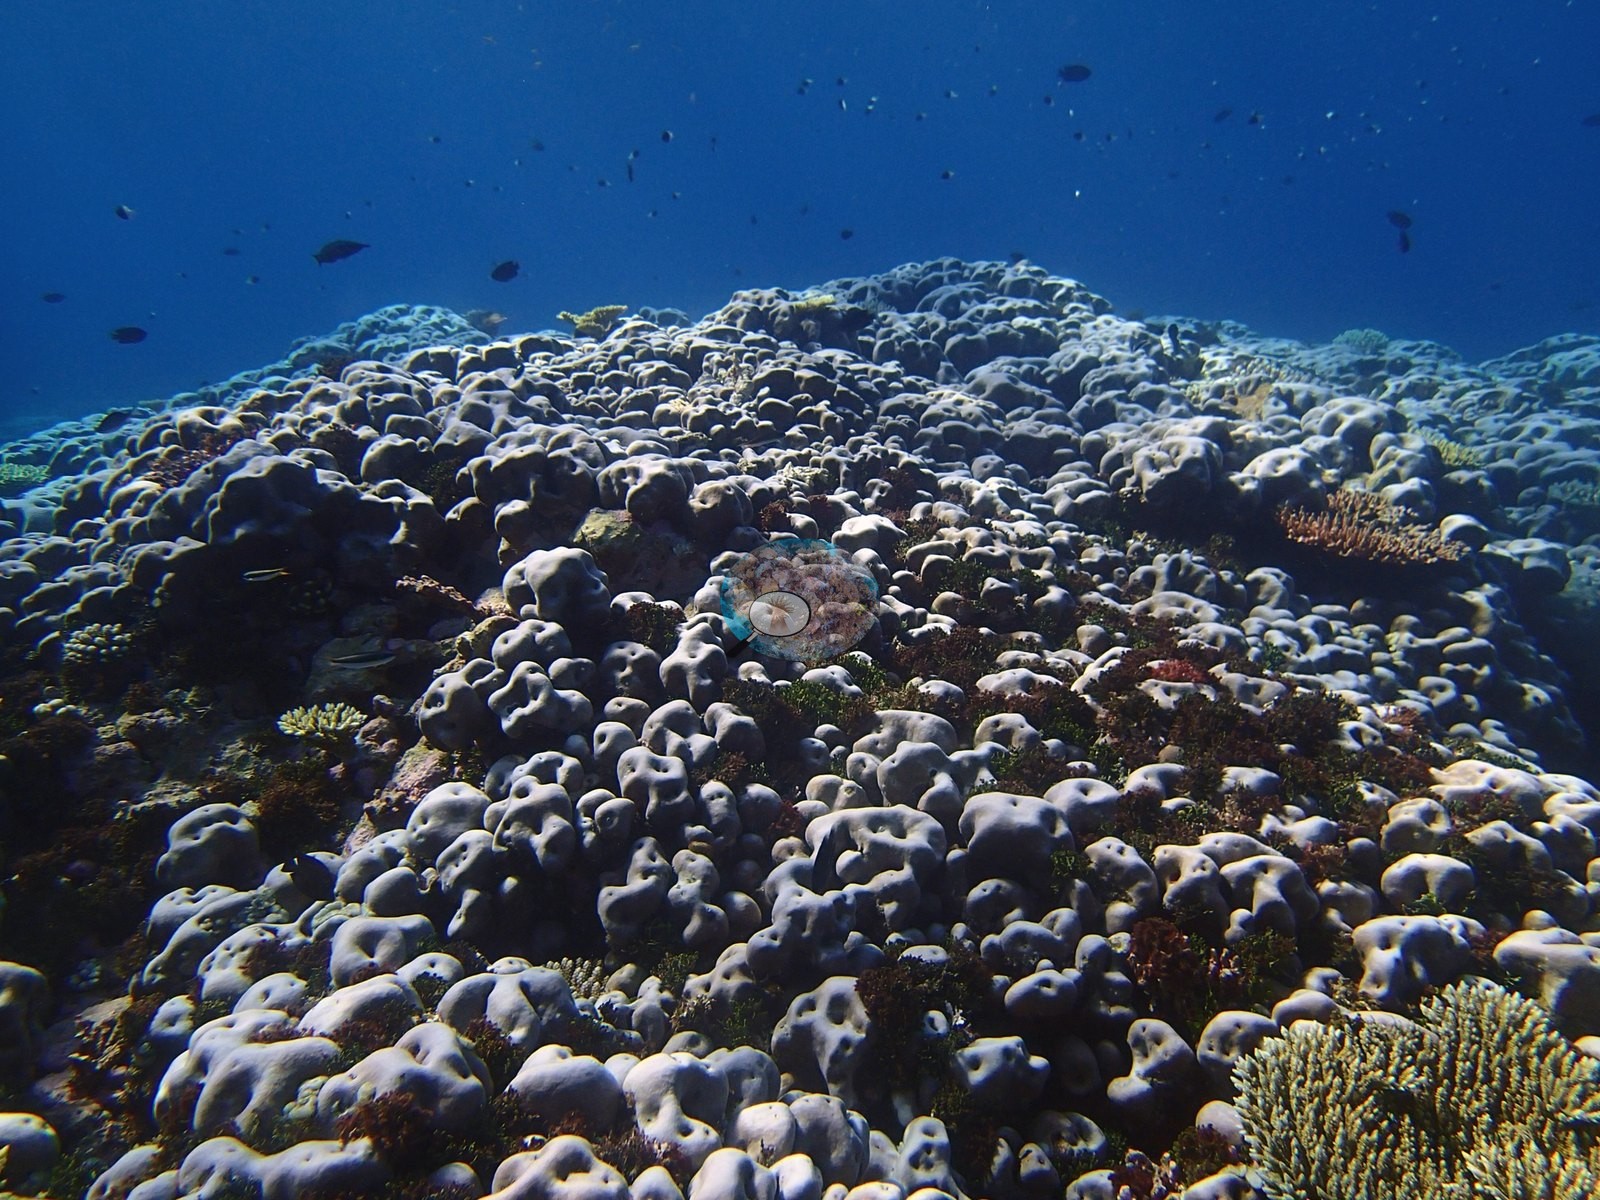
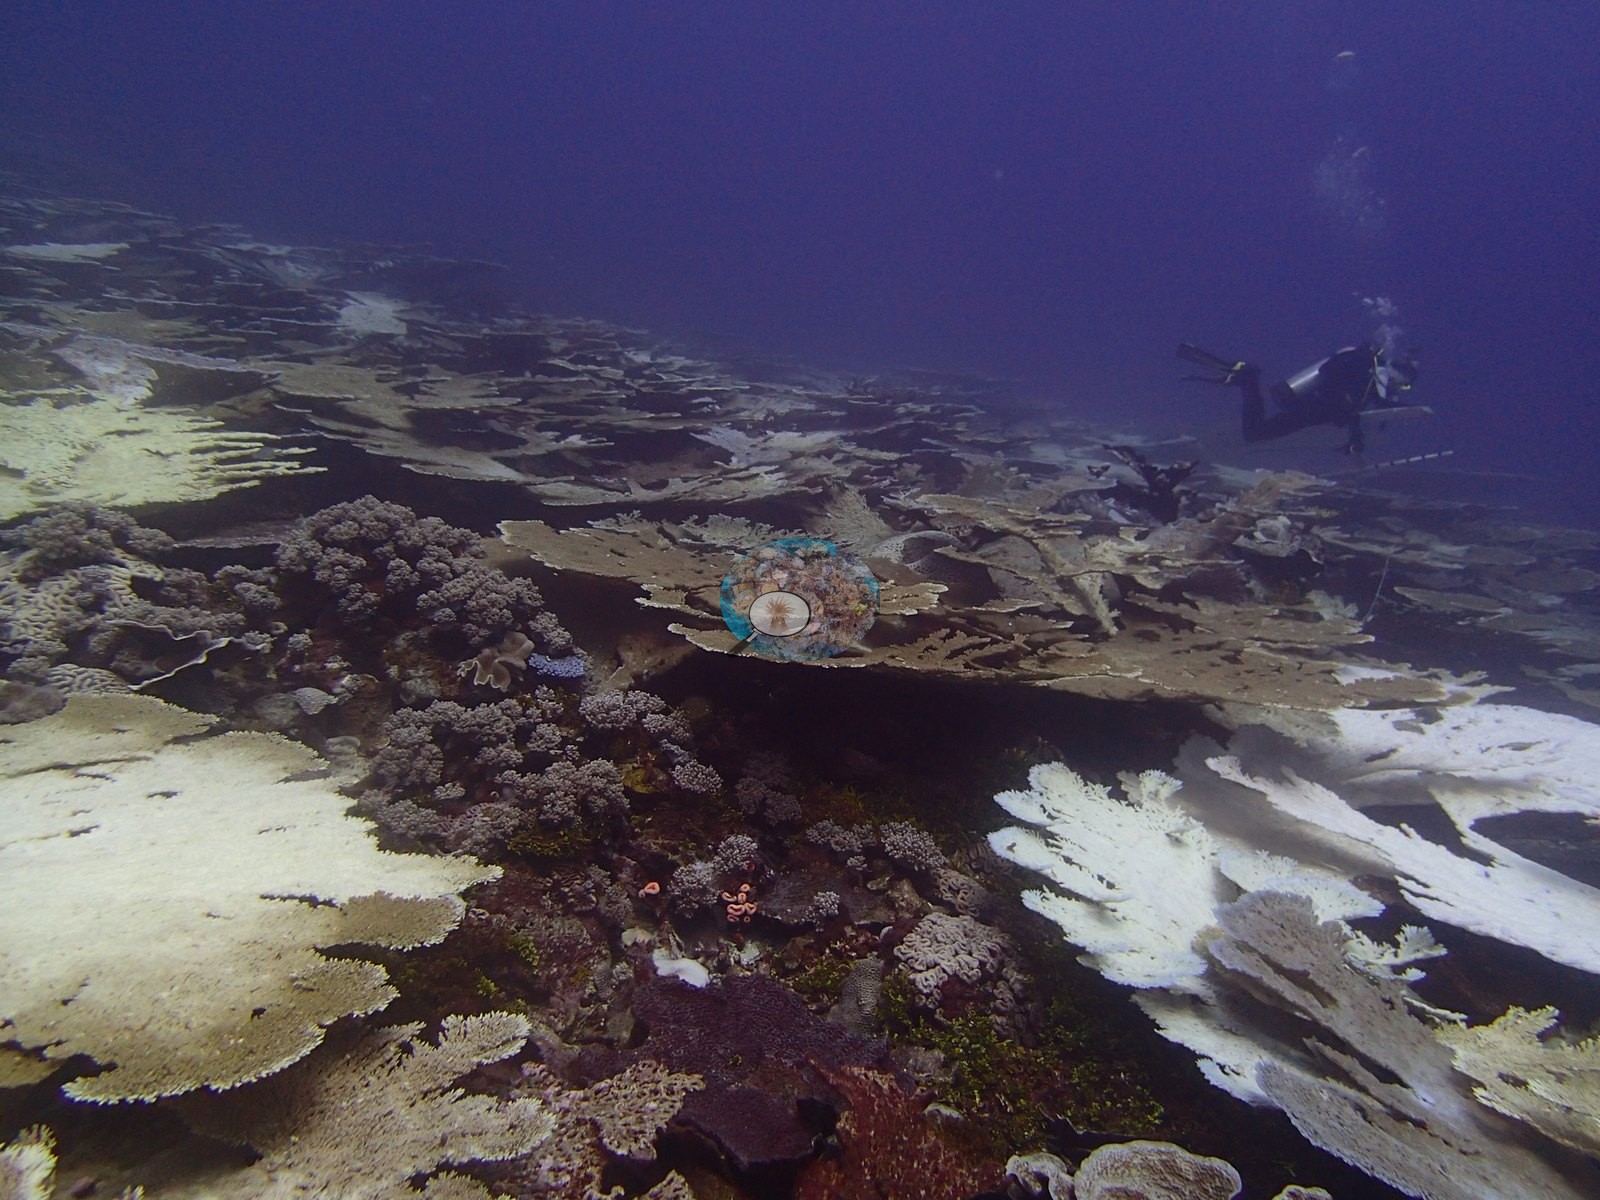
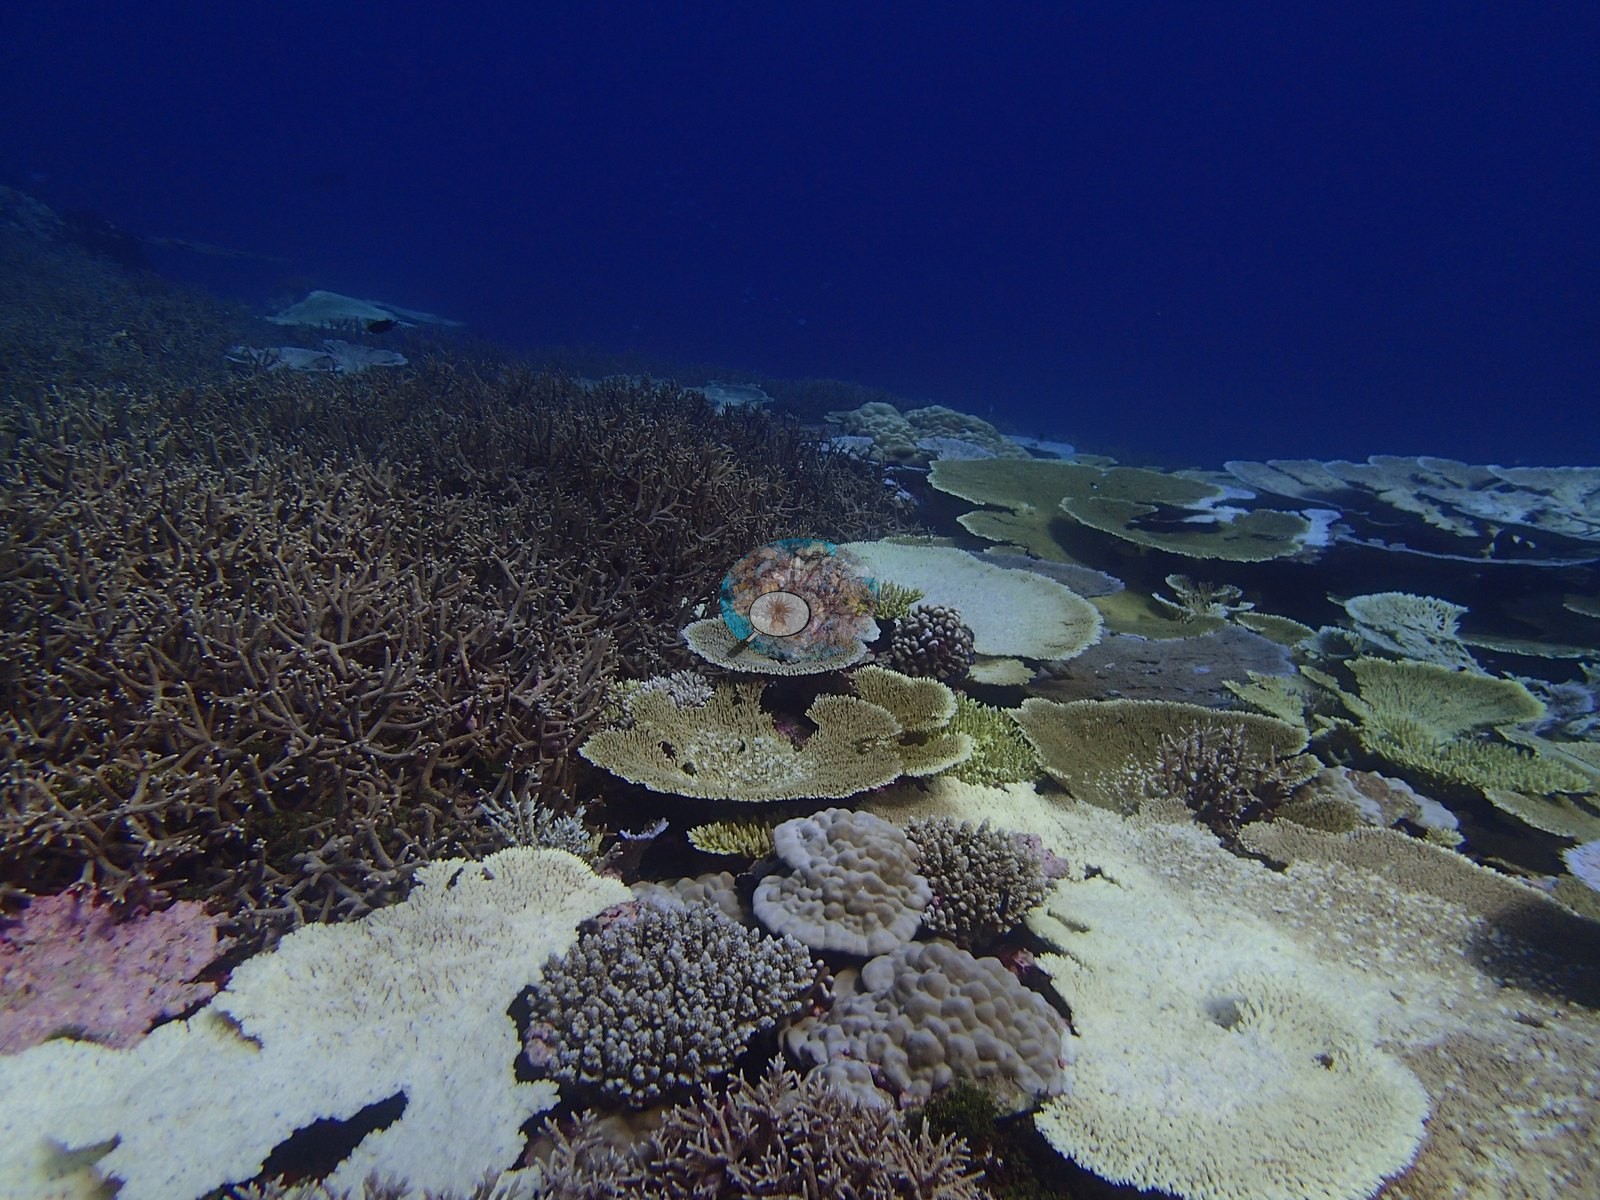
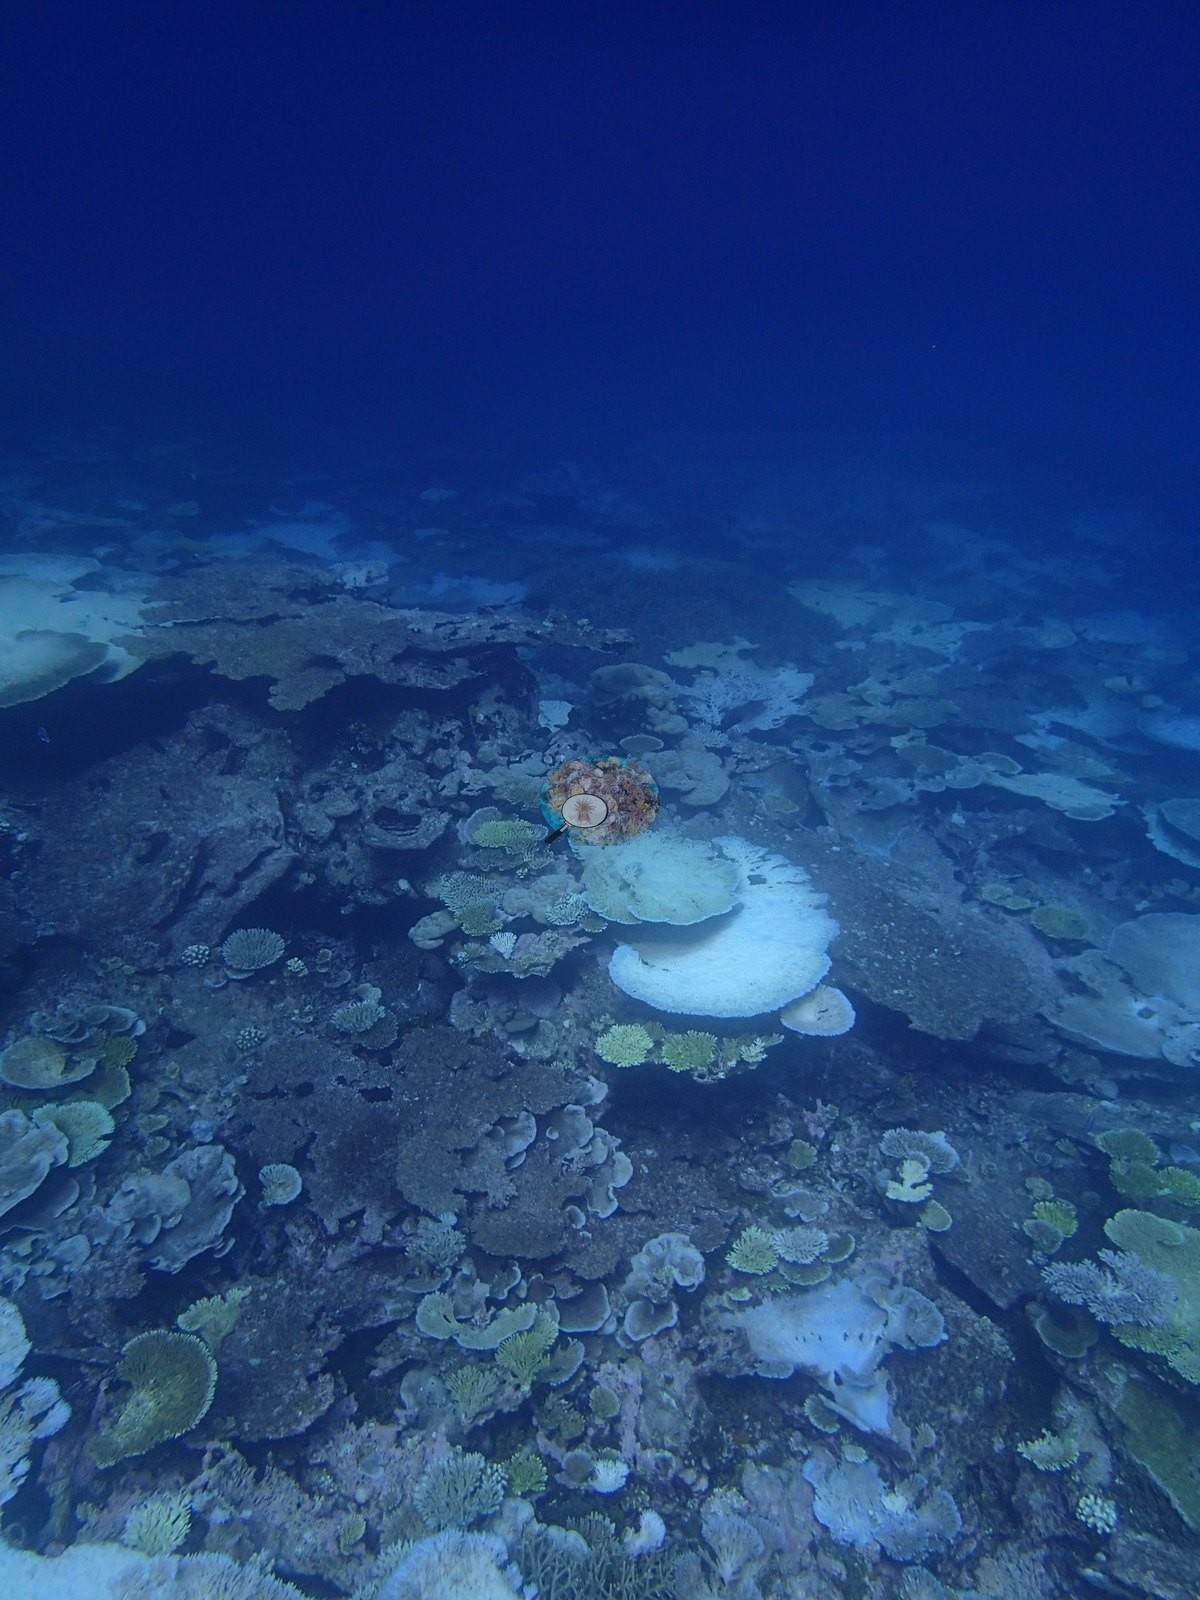
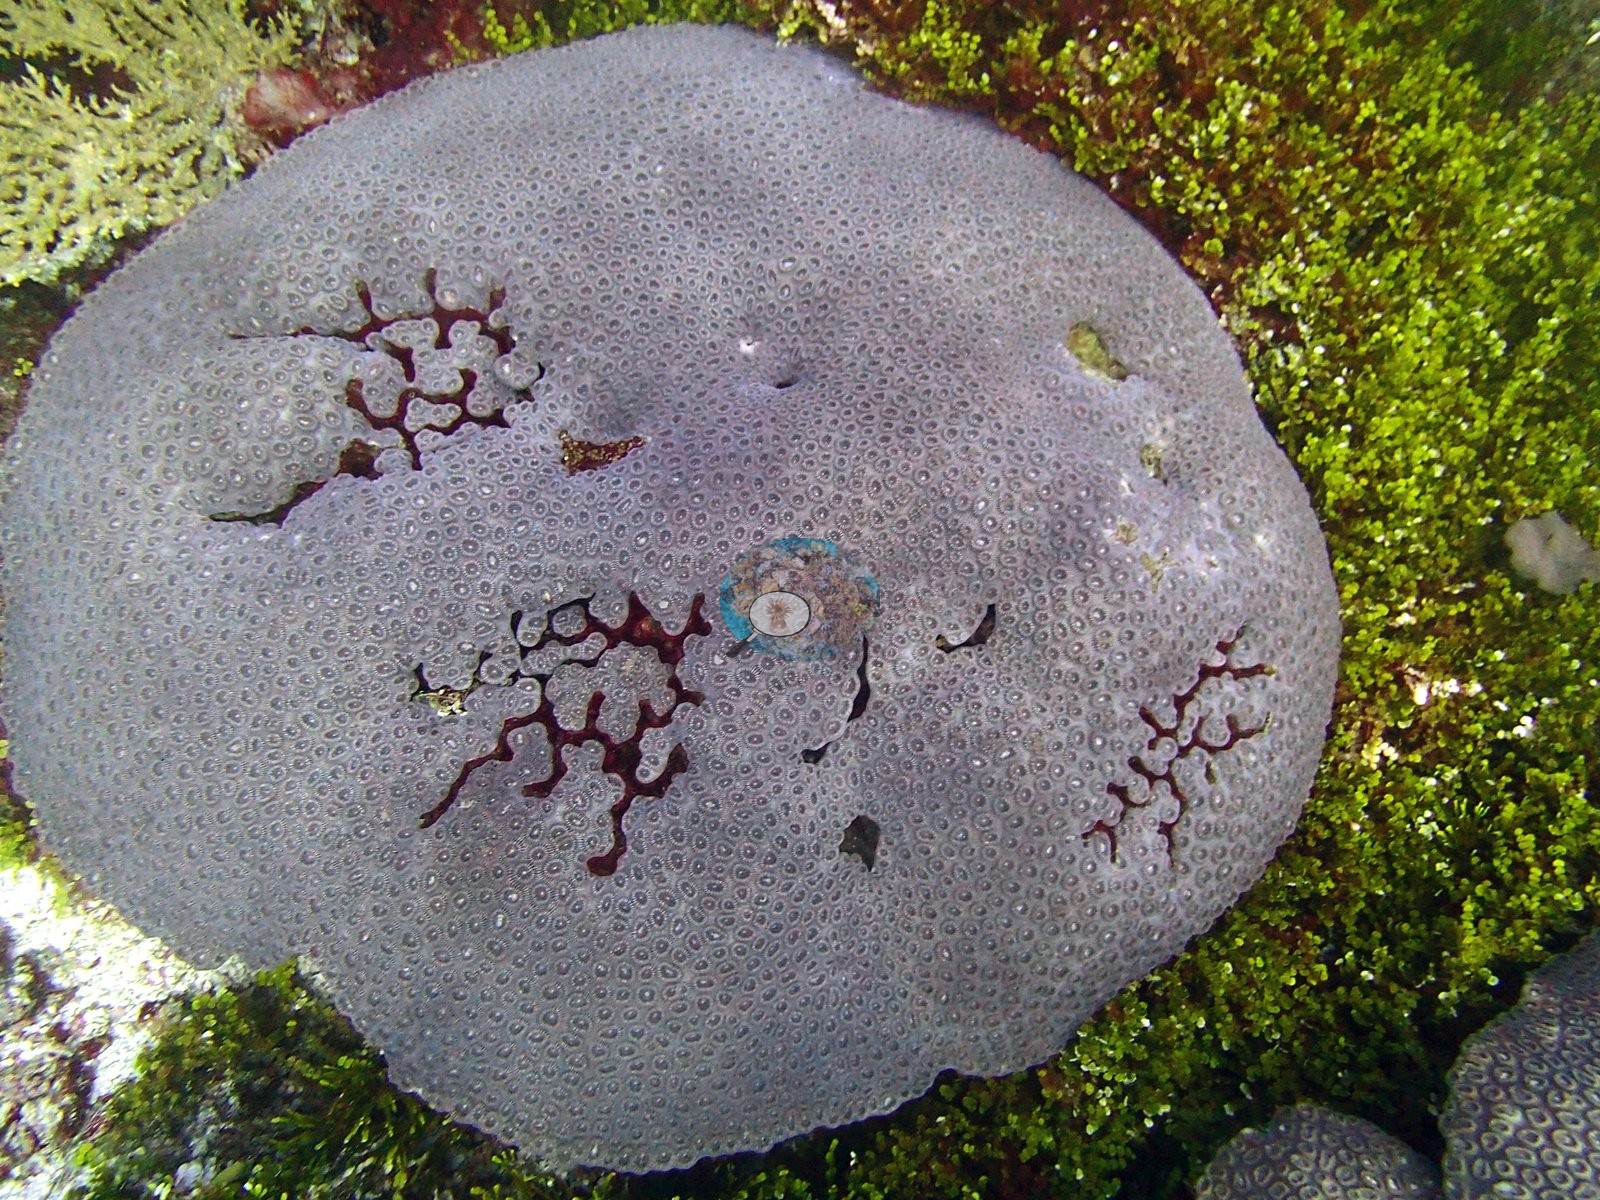
BIPB69 is a protected submerged lagoonal patch reef inside Peros Banhos; the published site-depth cell is blank, so the reef has no depth on record (e.g., Image 1, Image 4).
General benthic features
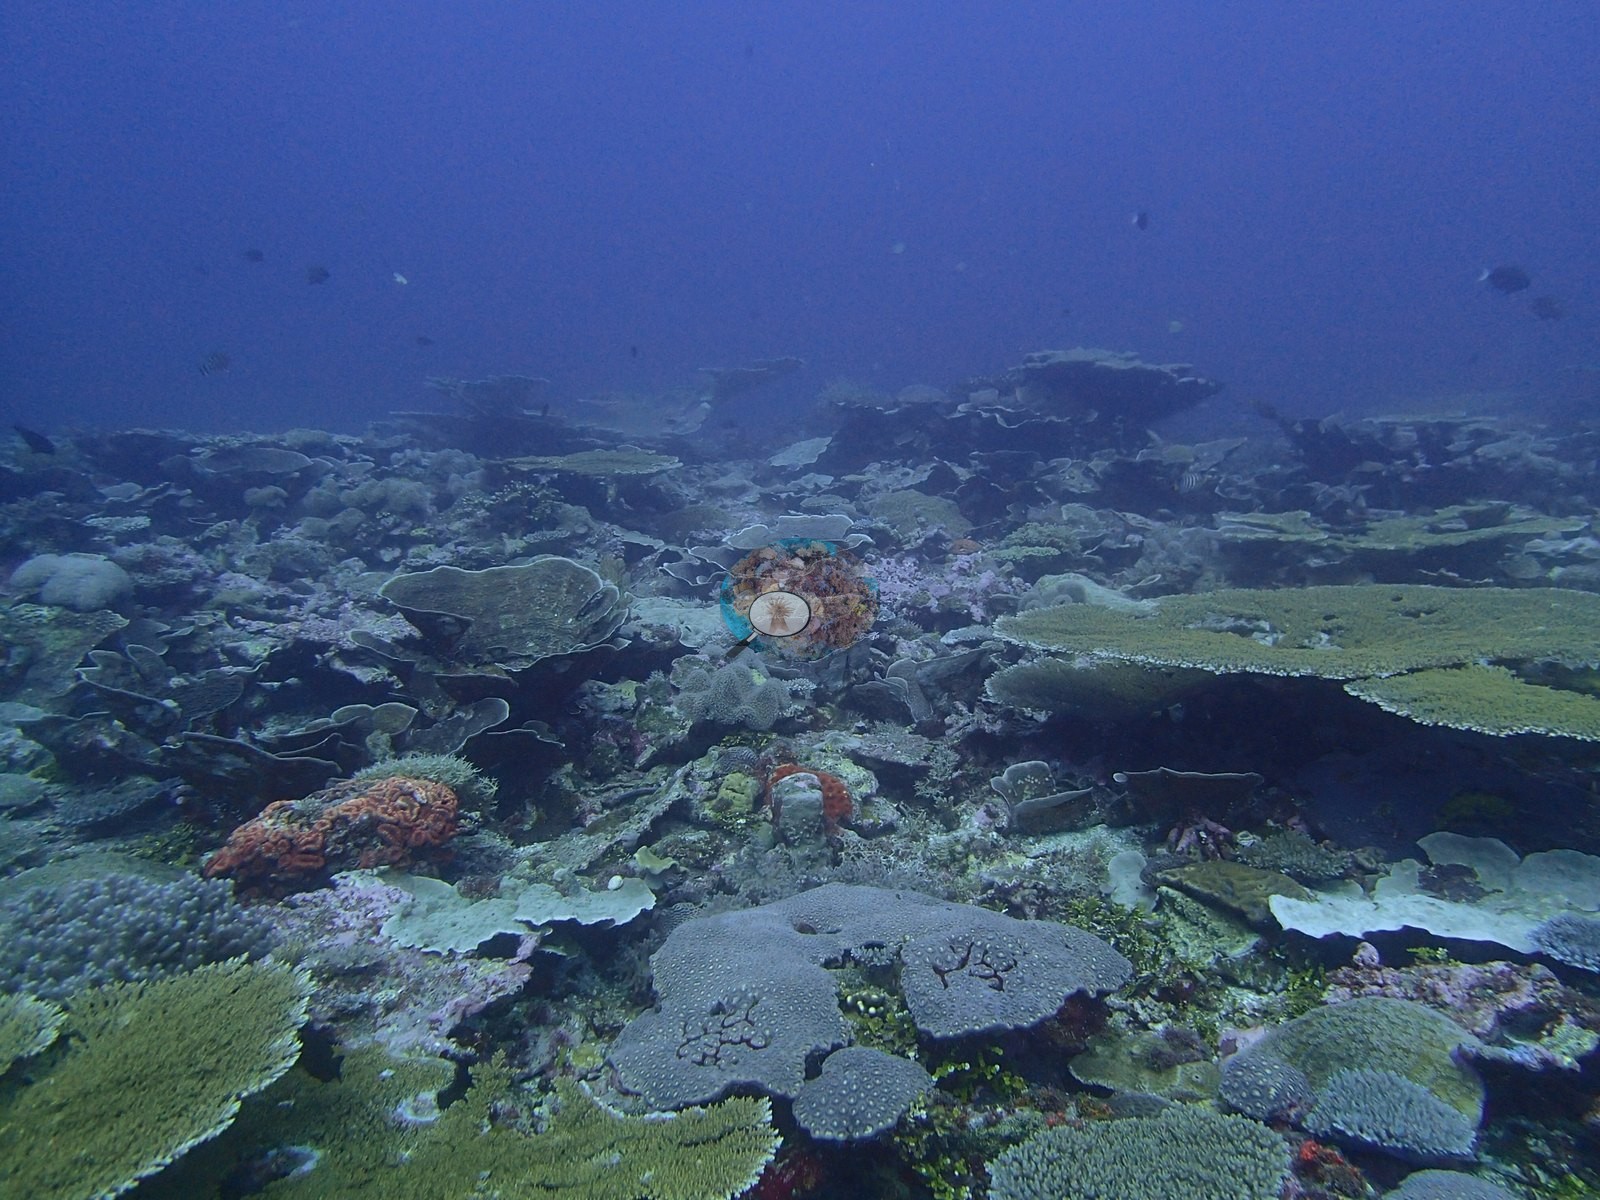
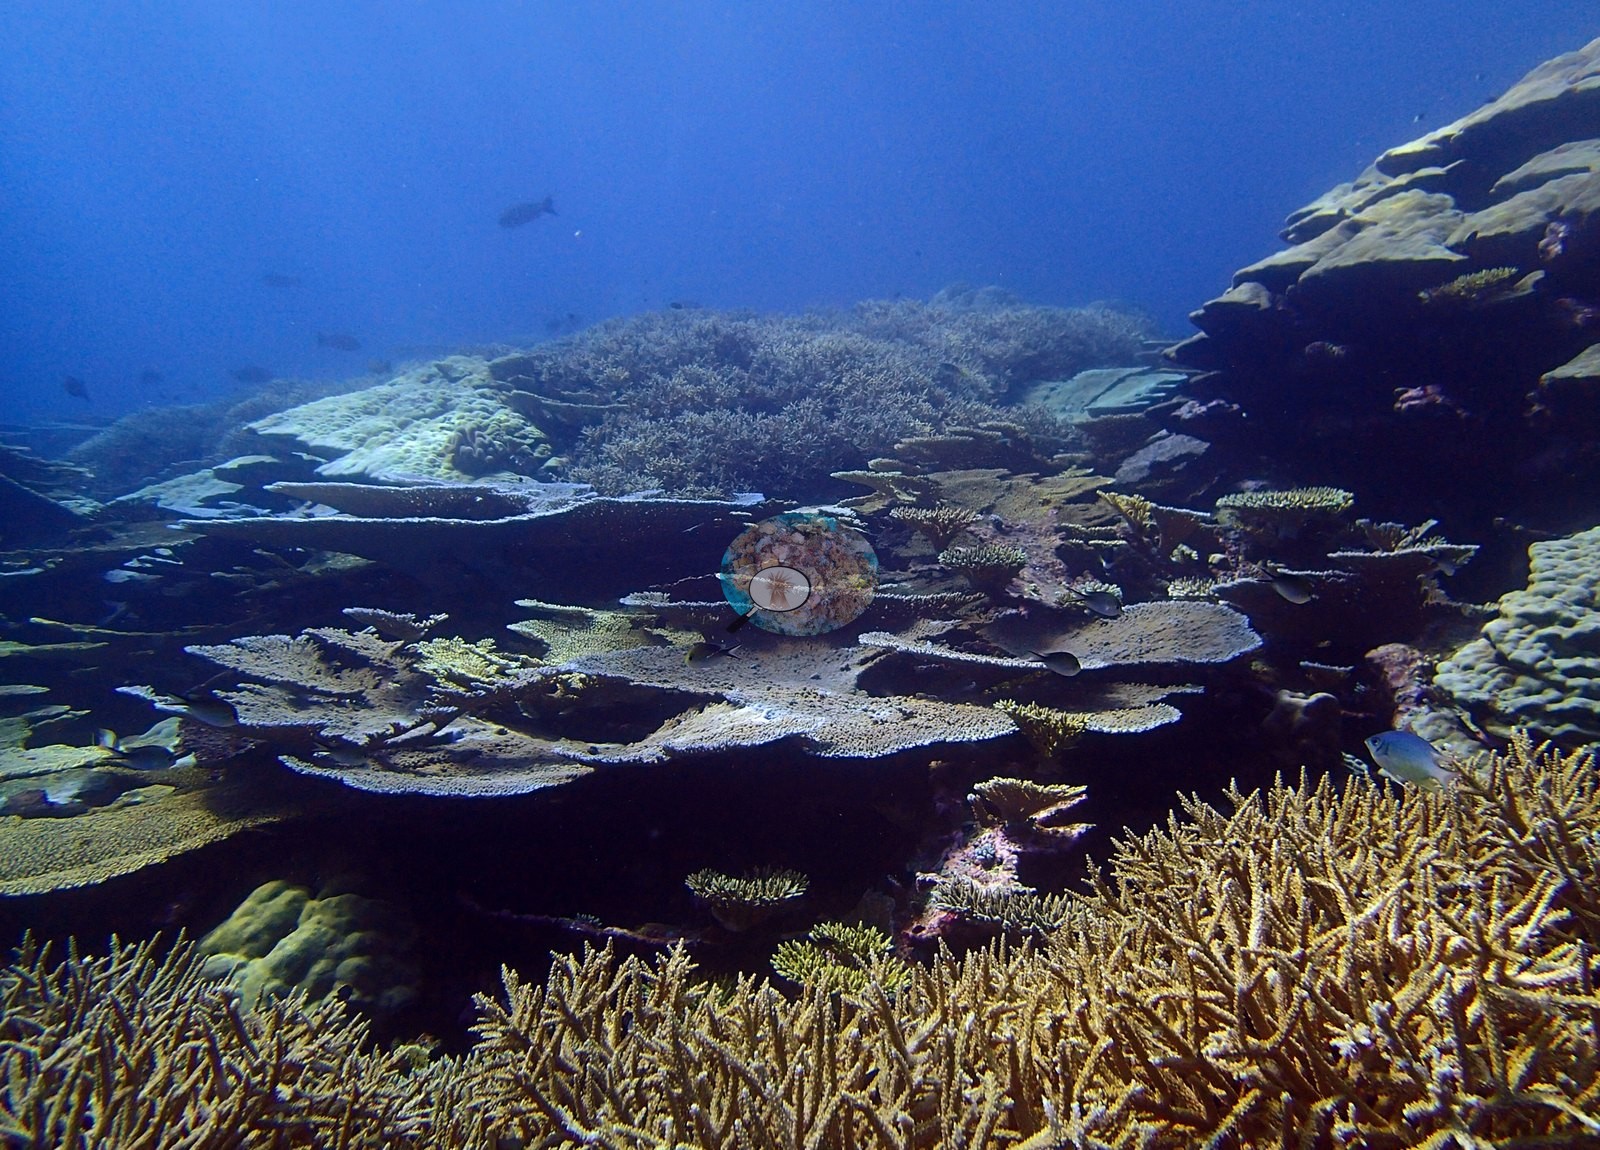
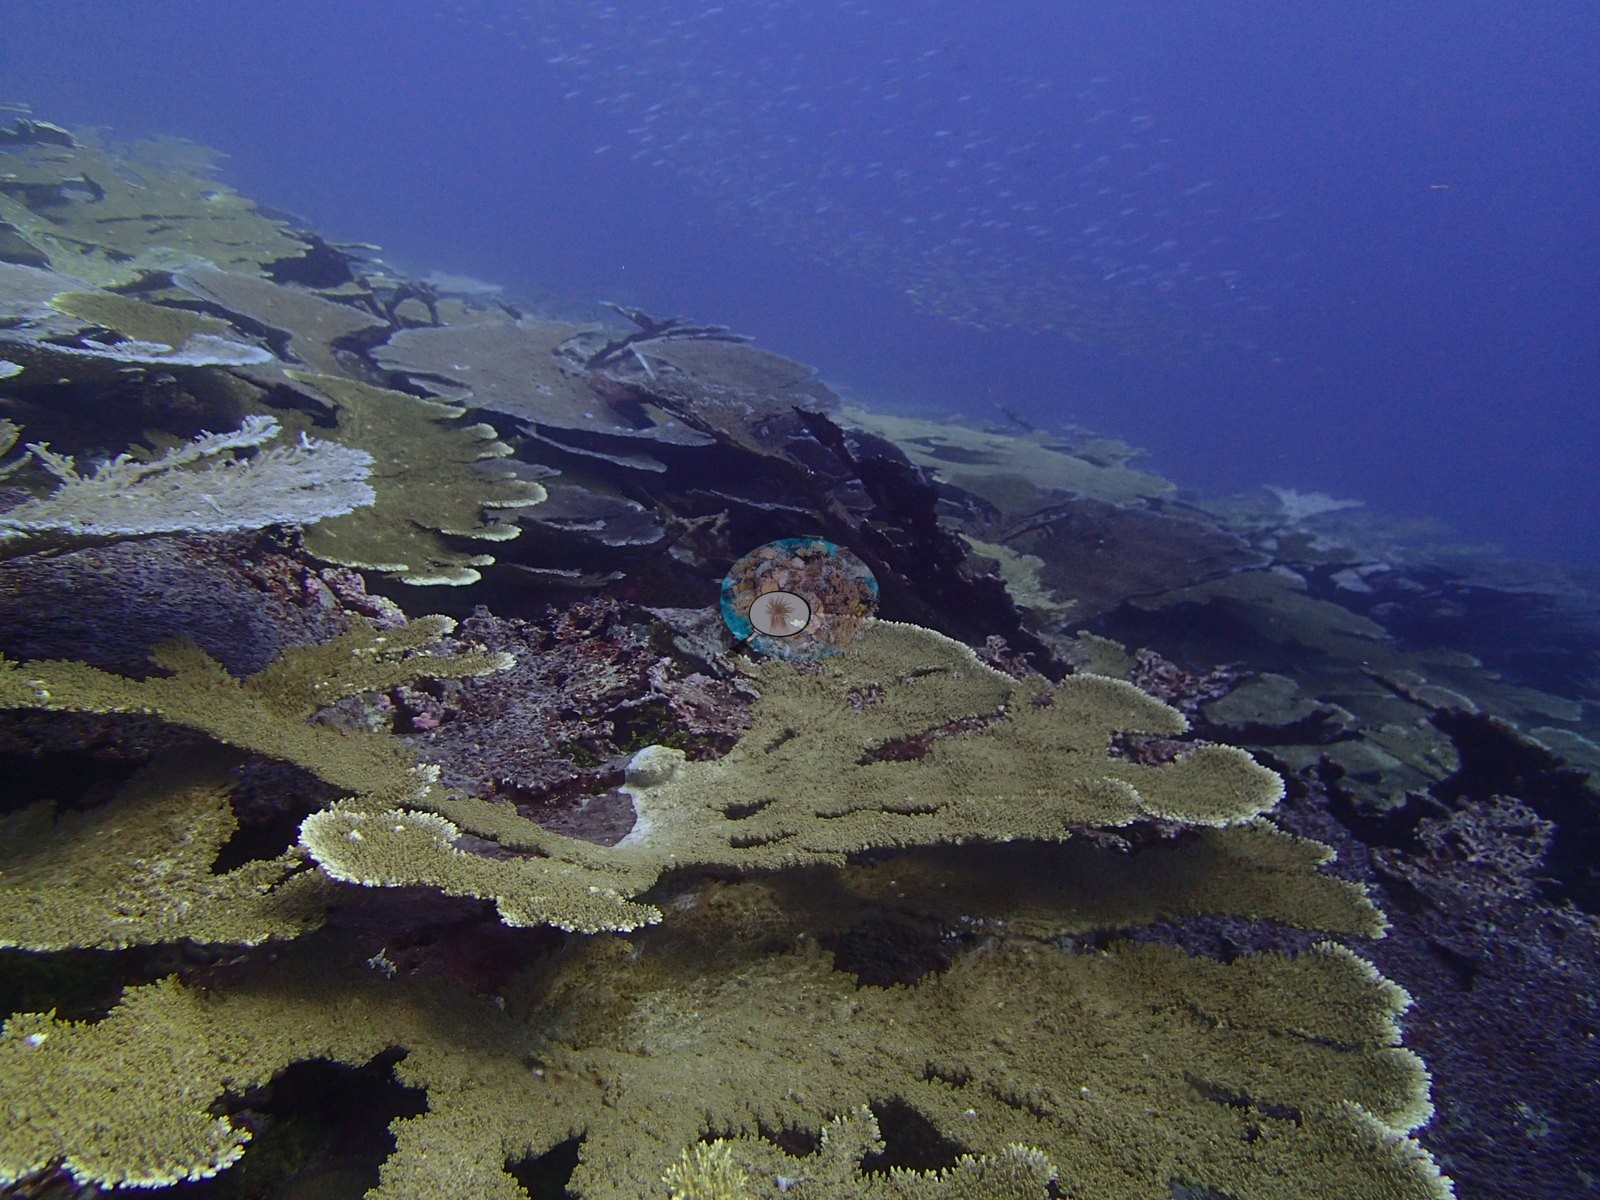
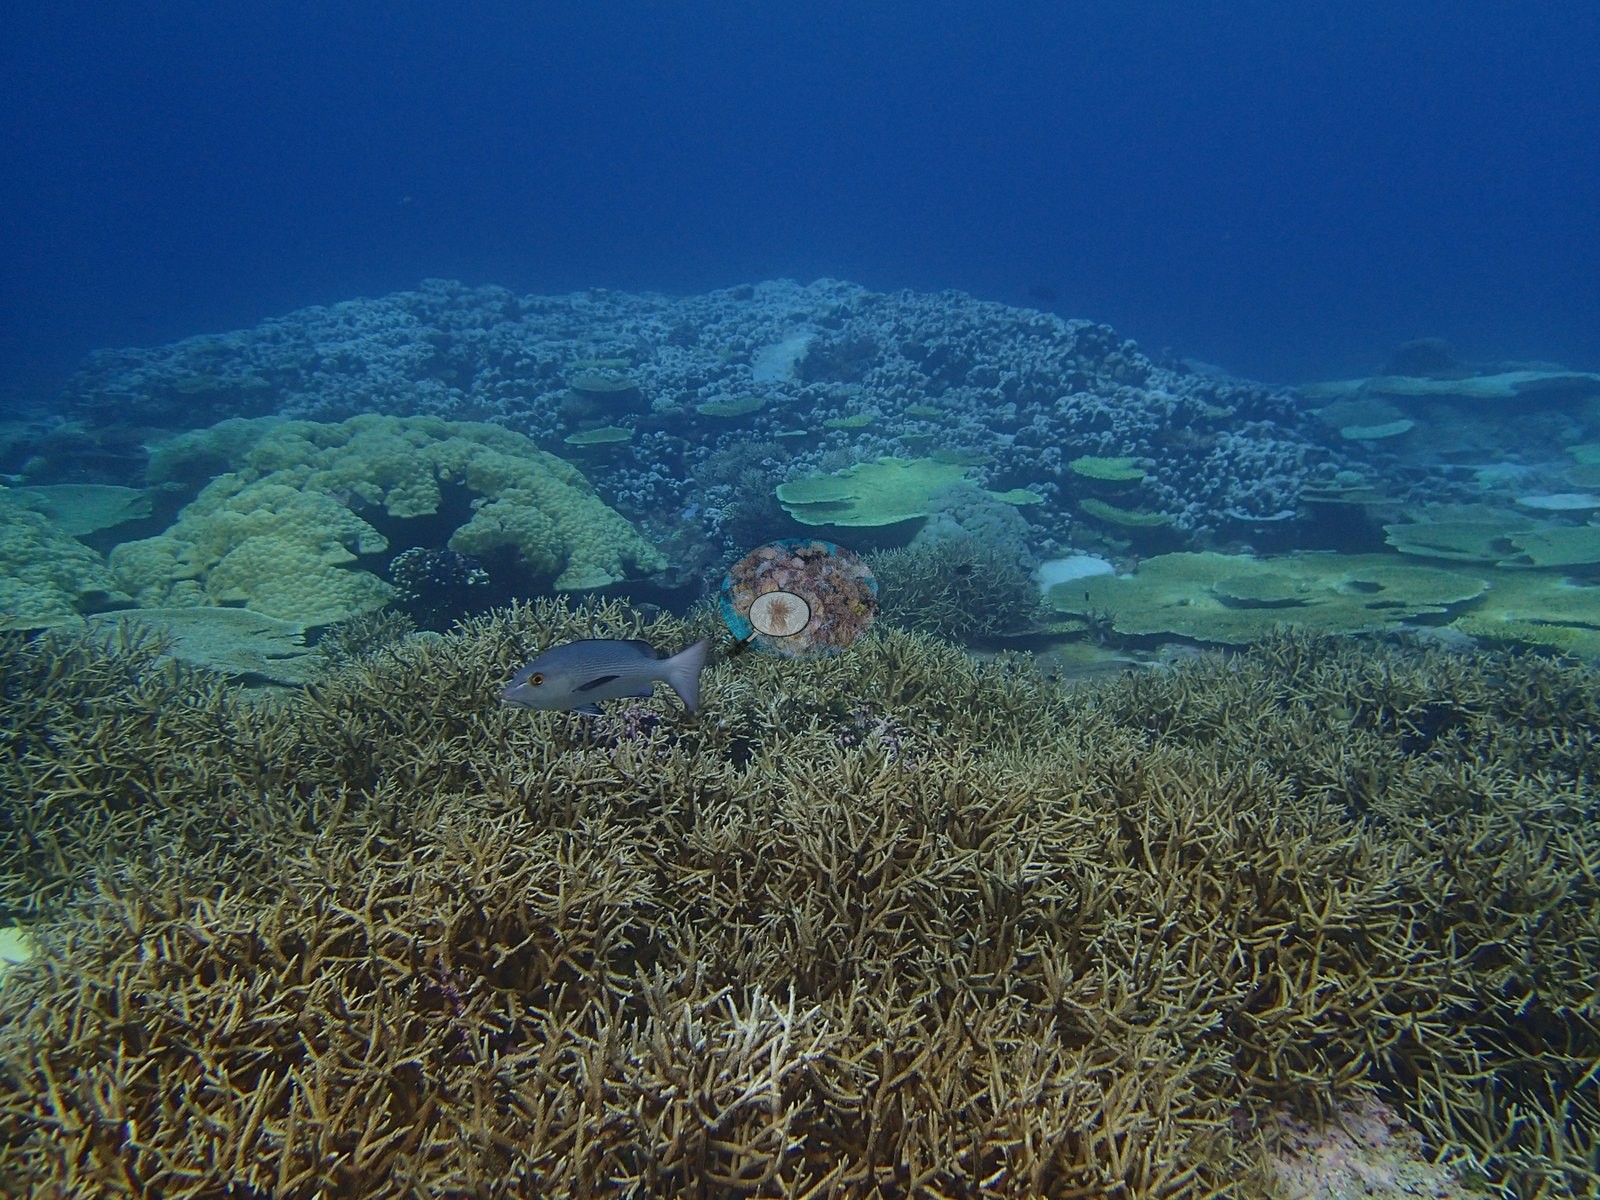
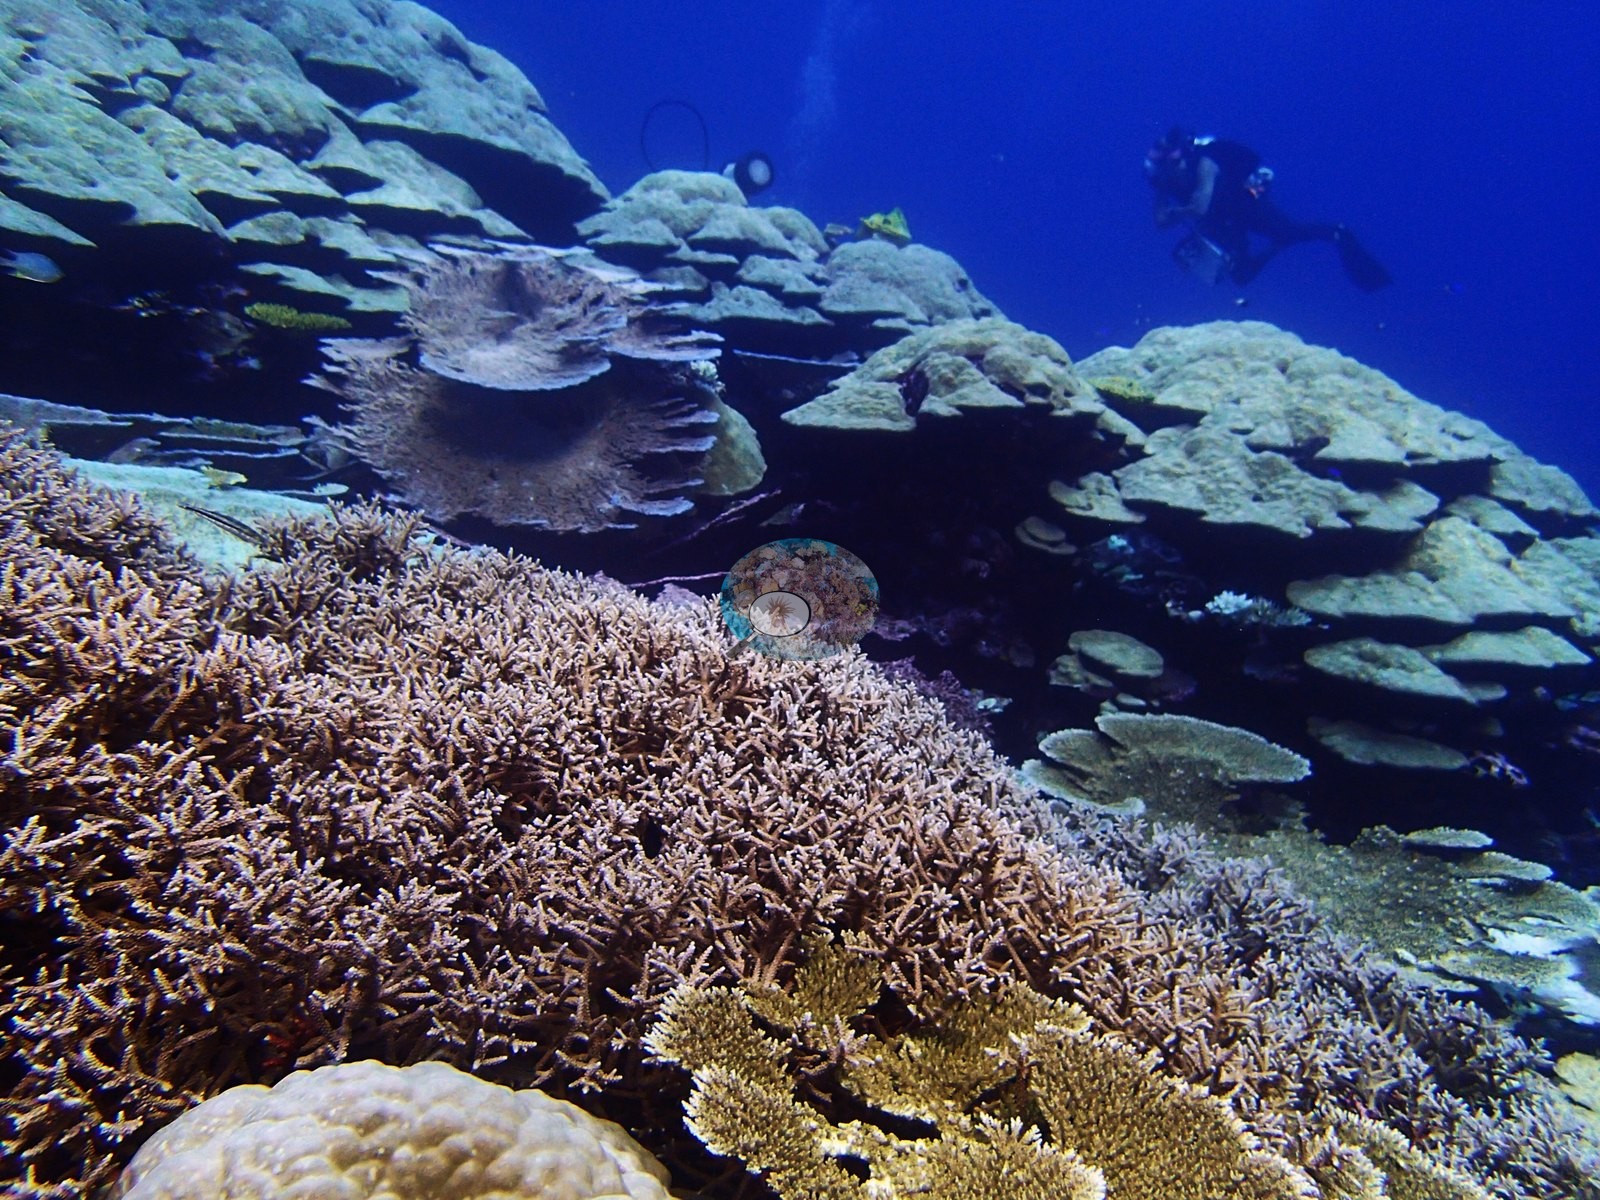
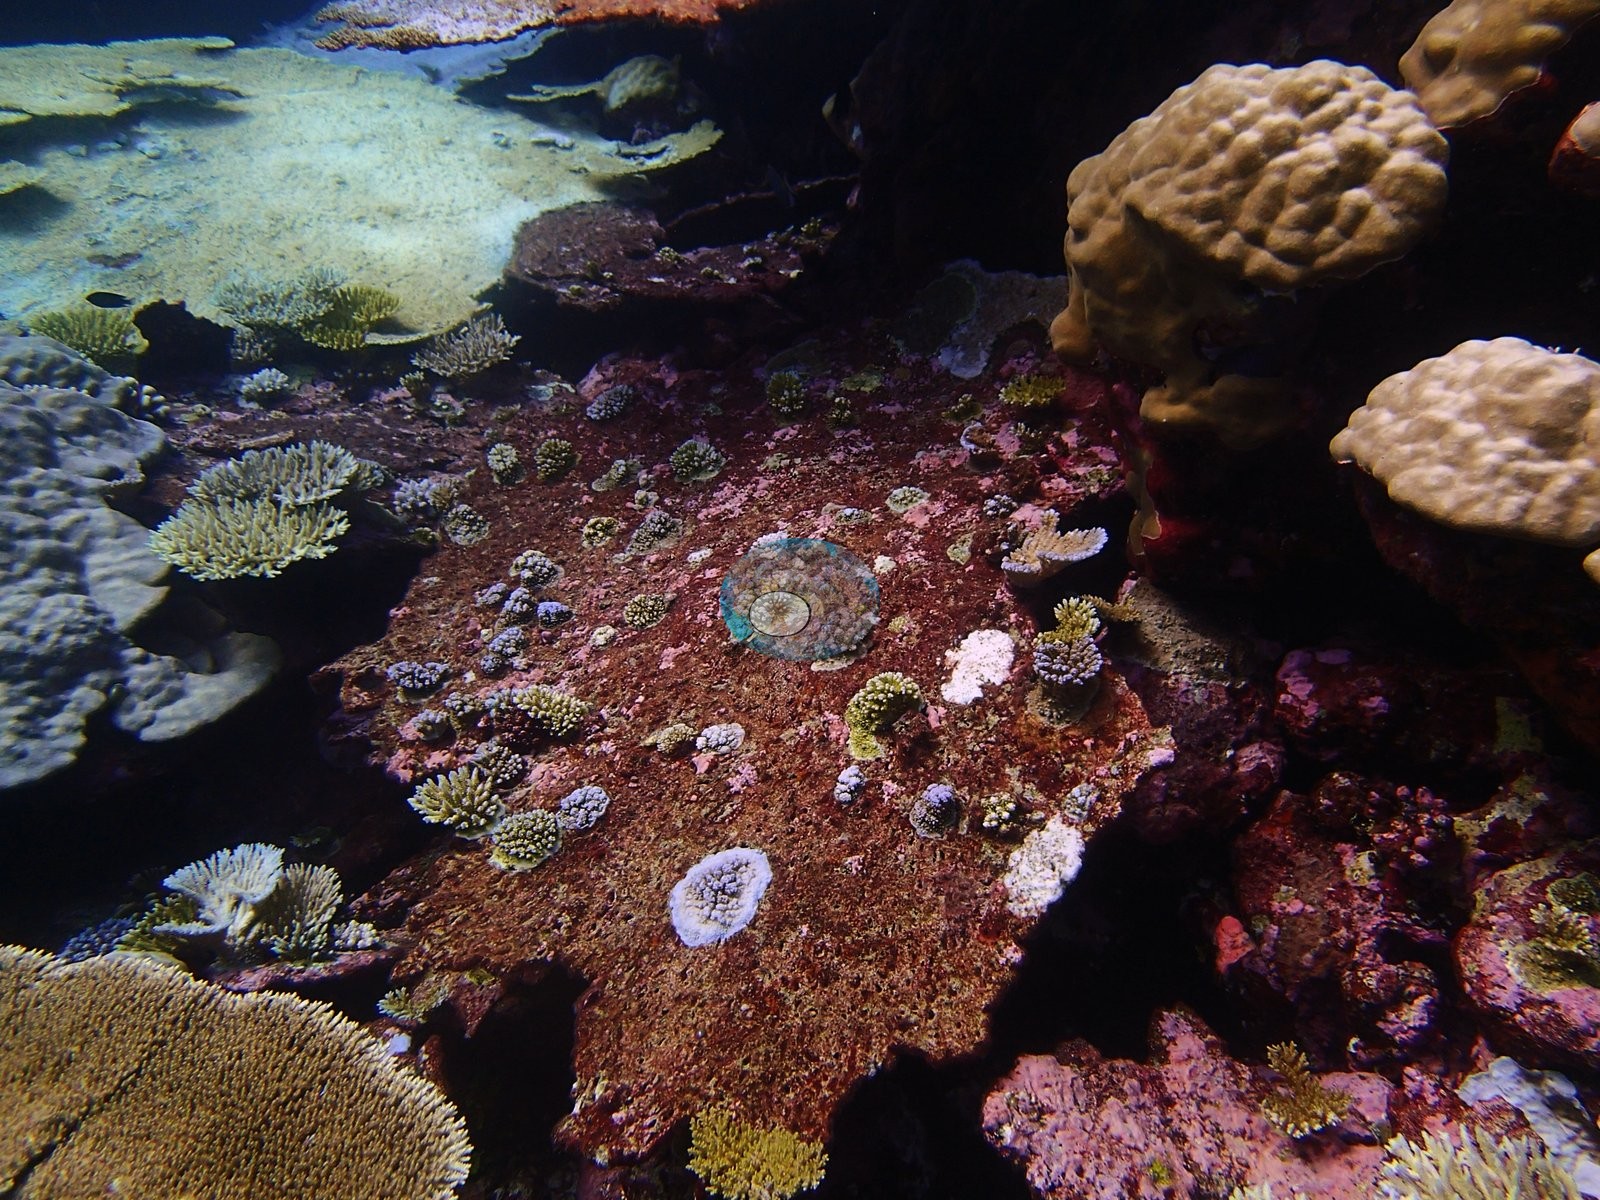
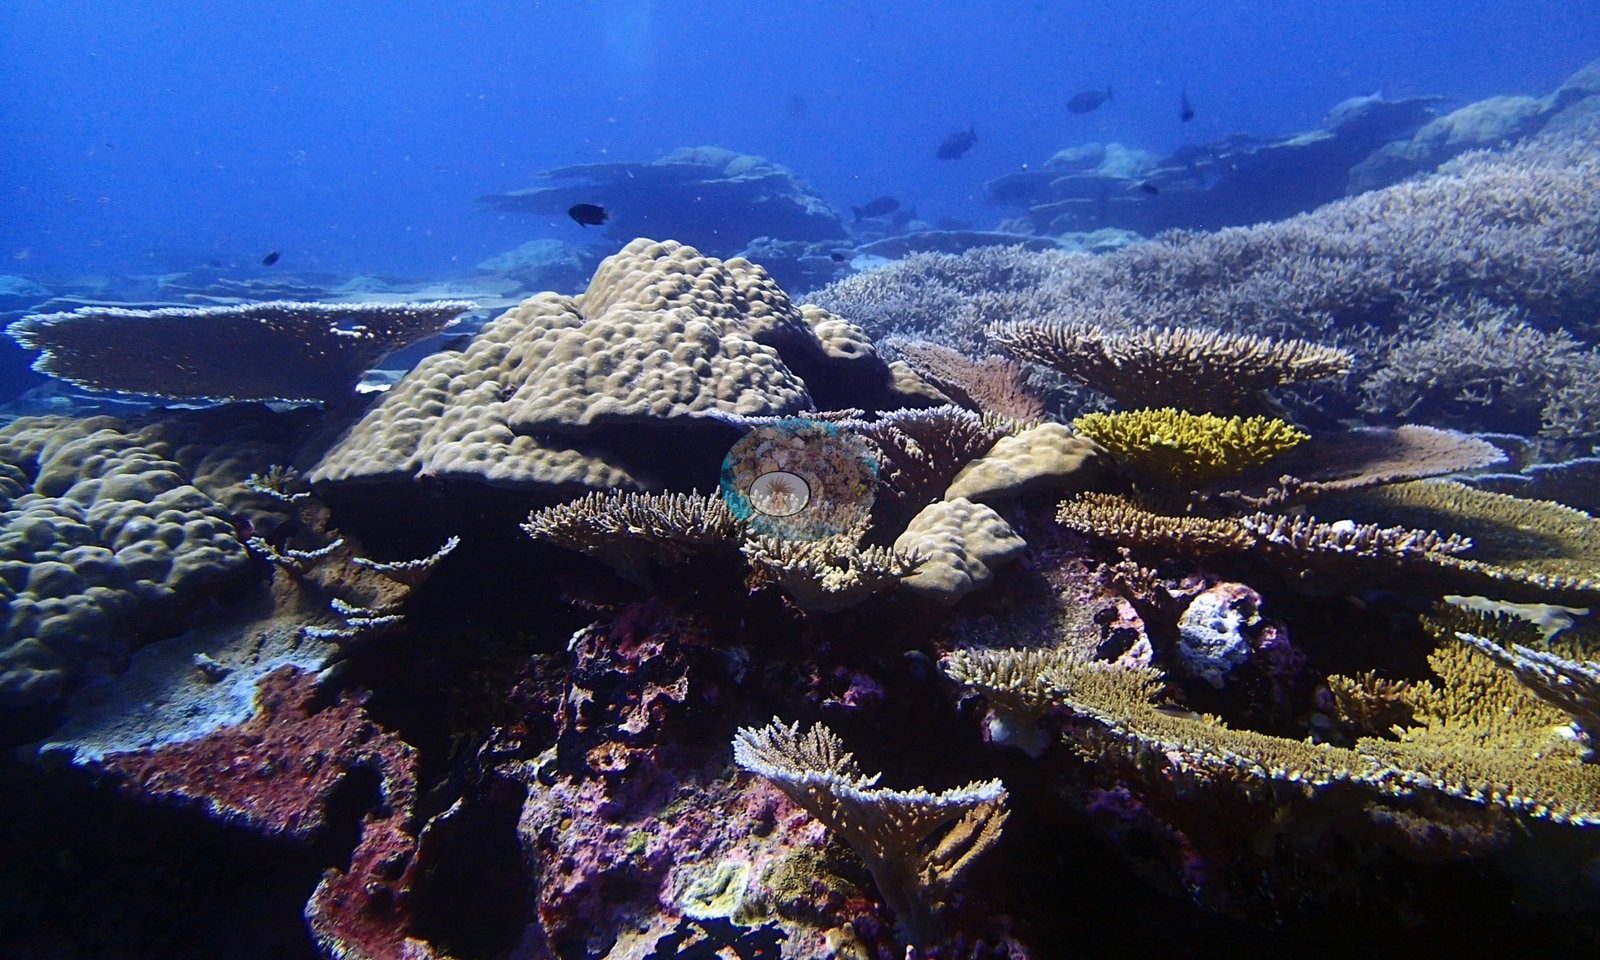
Across 25 genera, Acropora holds 70% of all coral and Echinopora is a distant second at 14% (e.g., Image 2, Image 8).
Coral cover
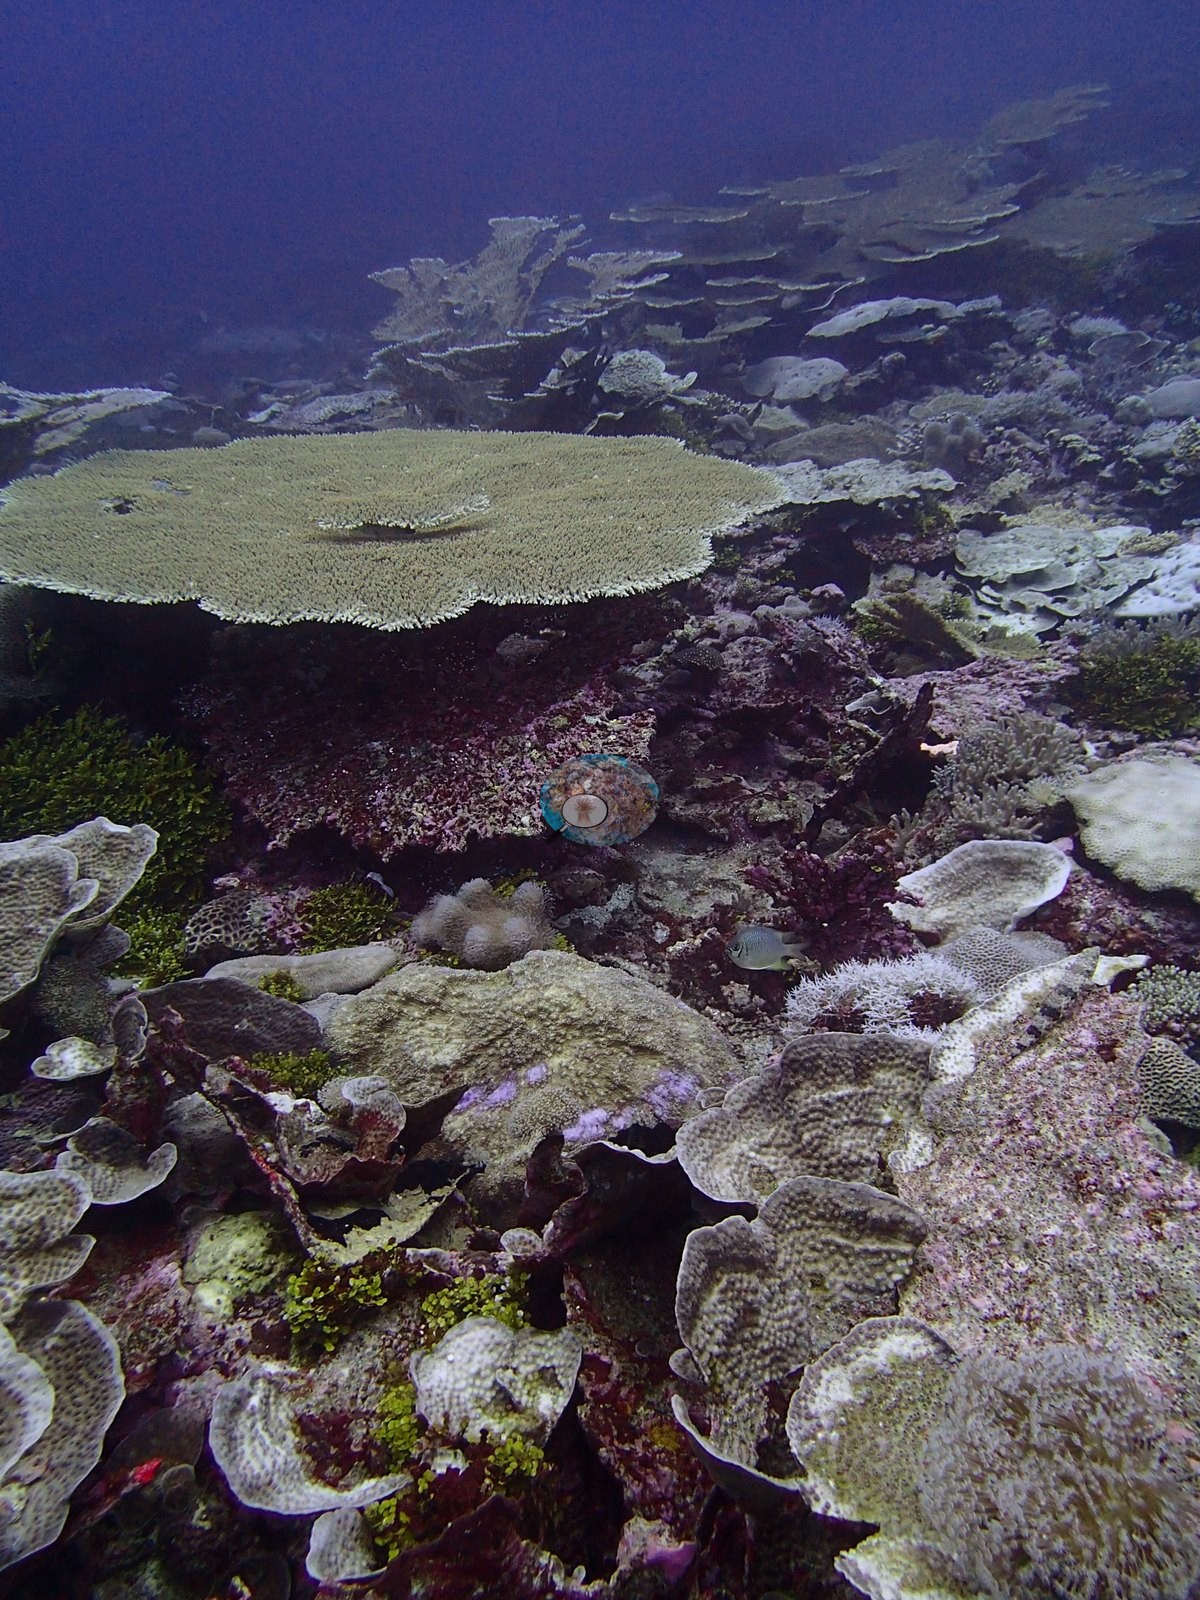
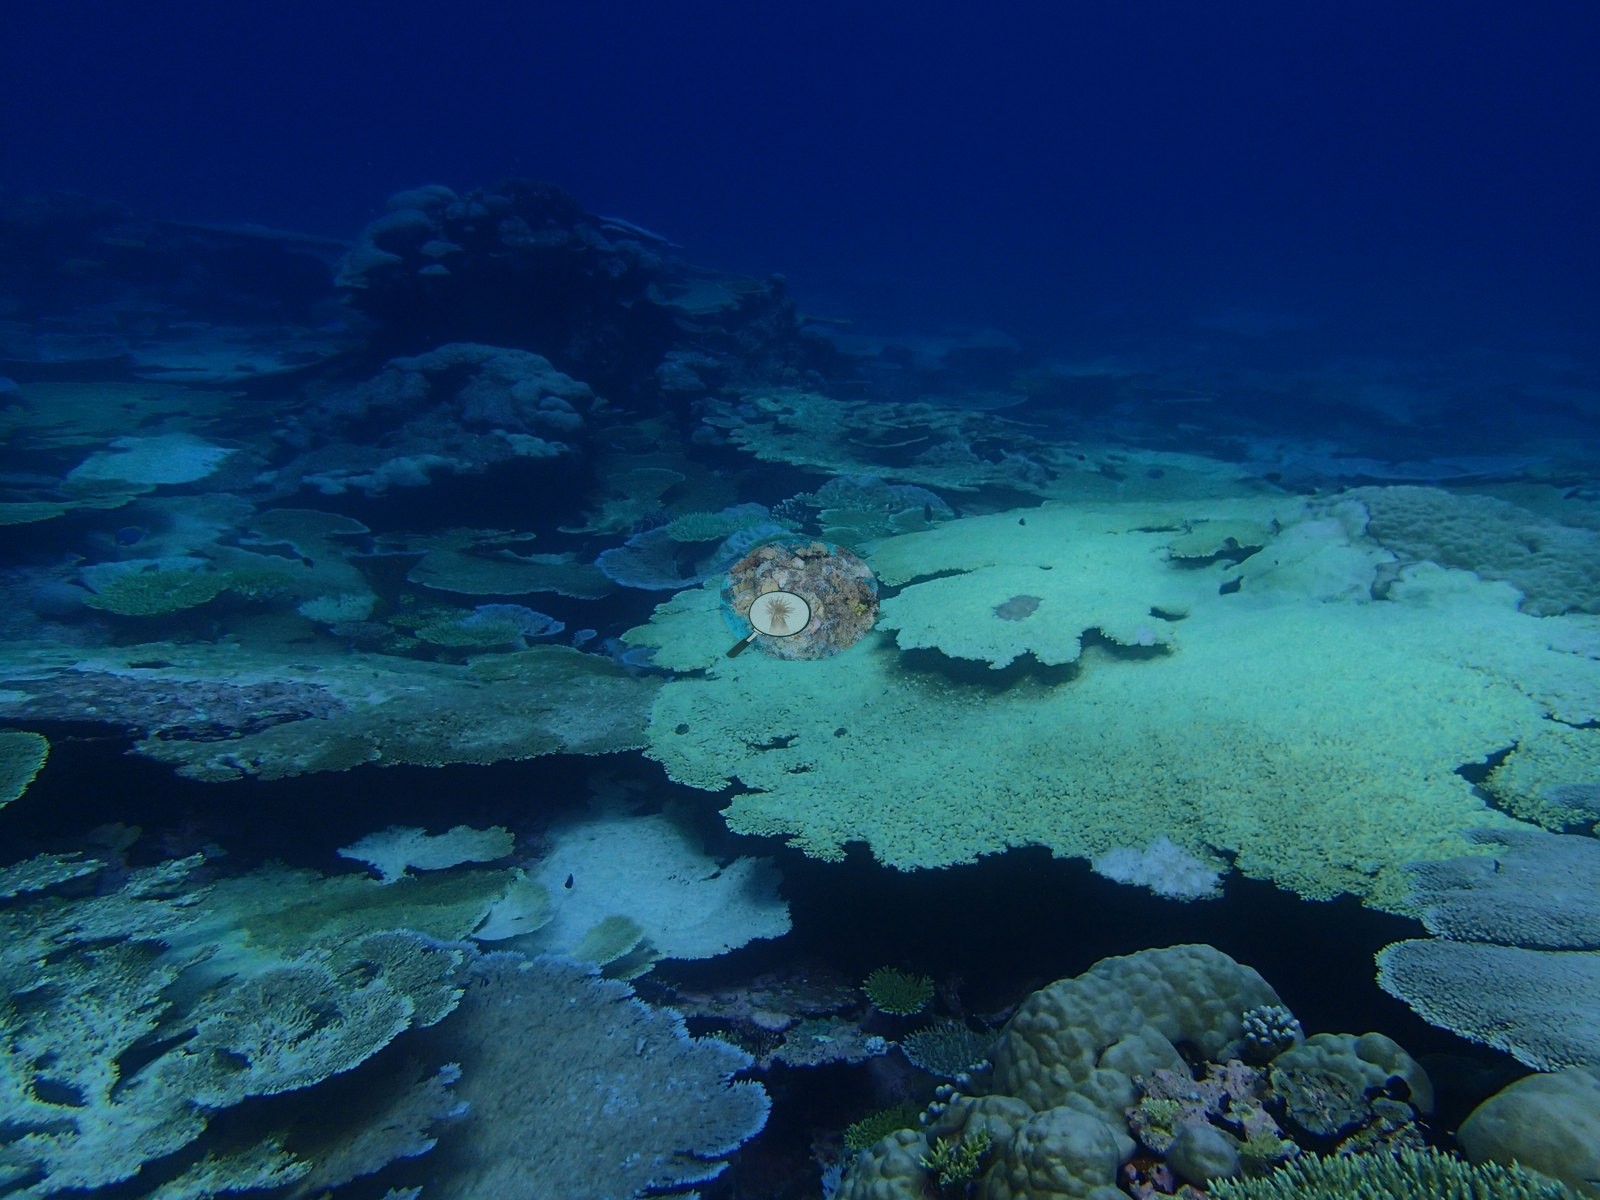
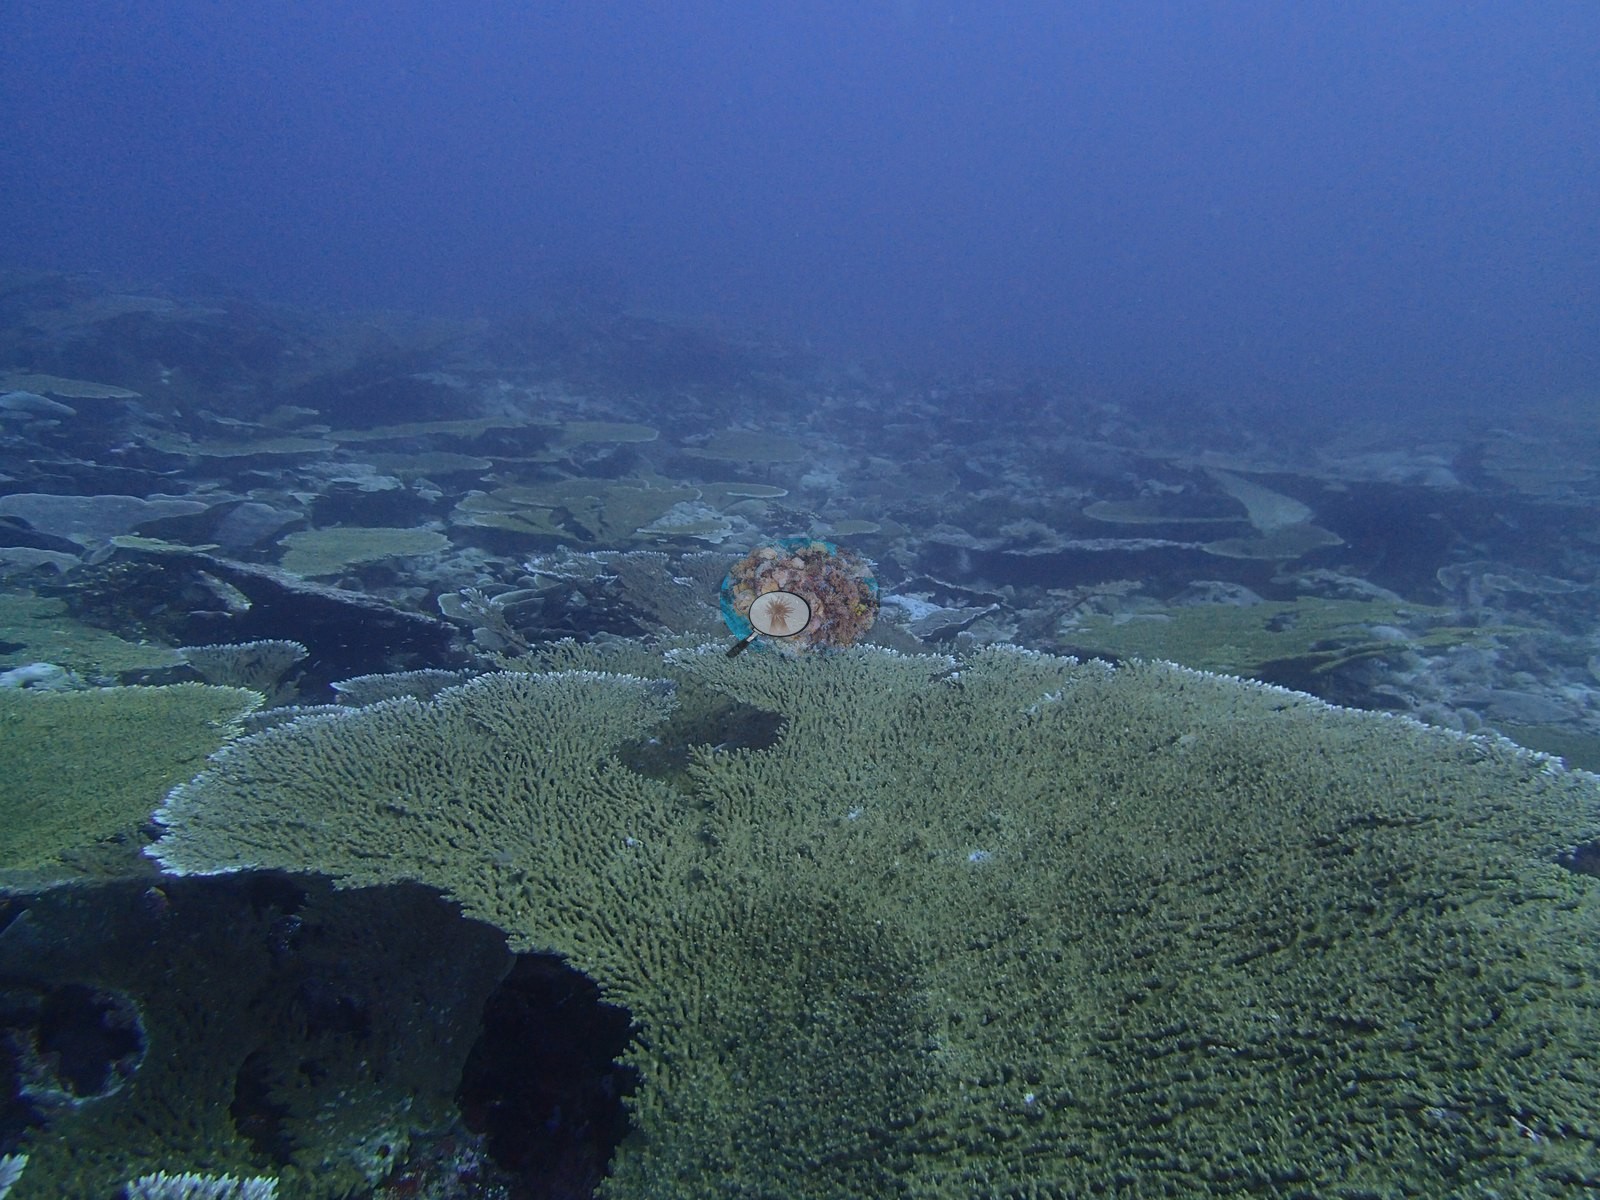
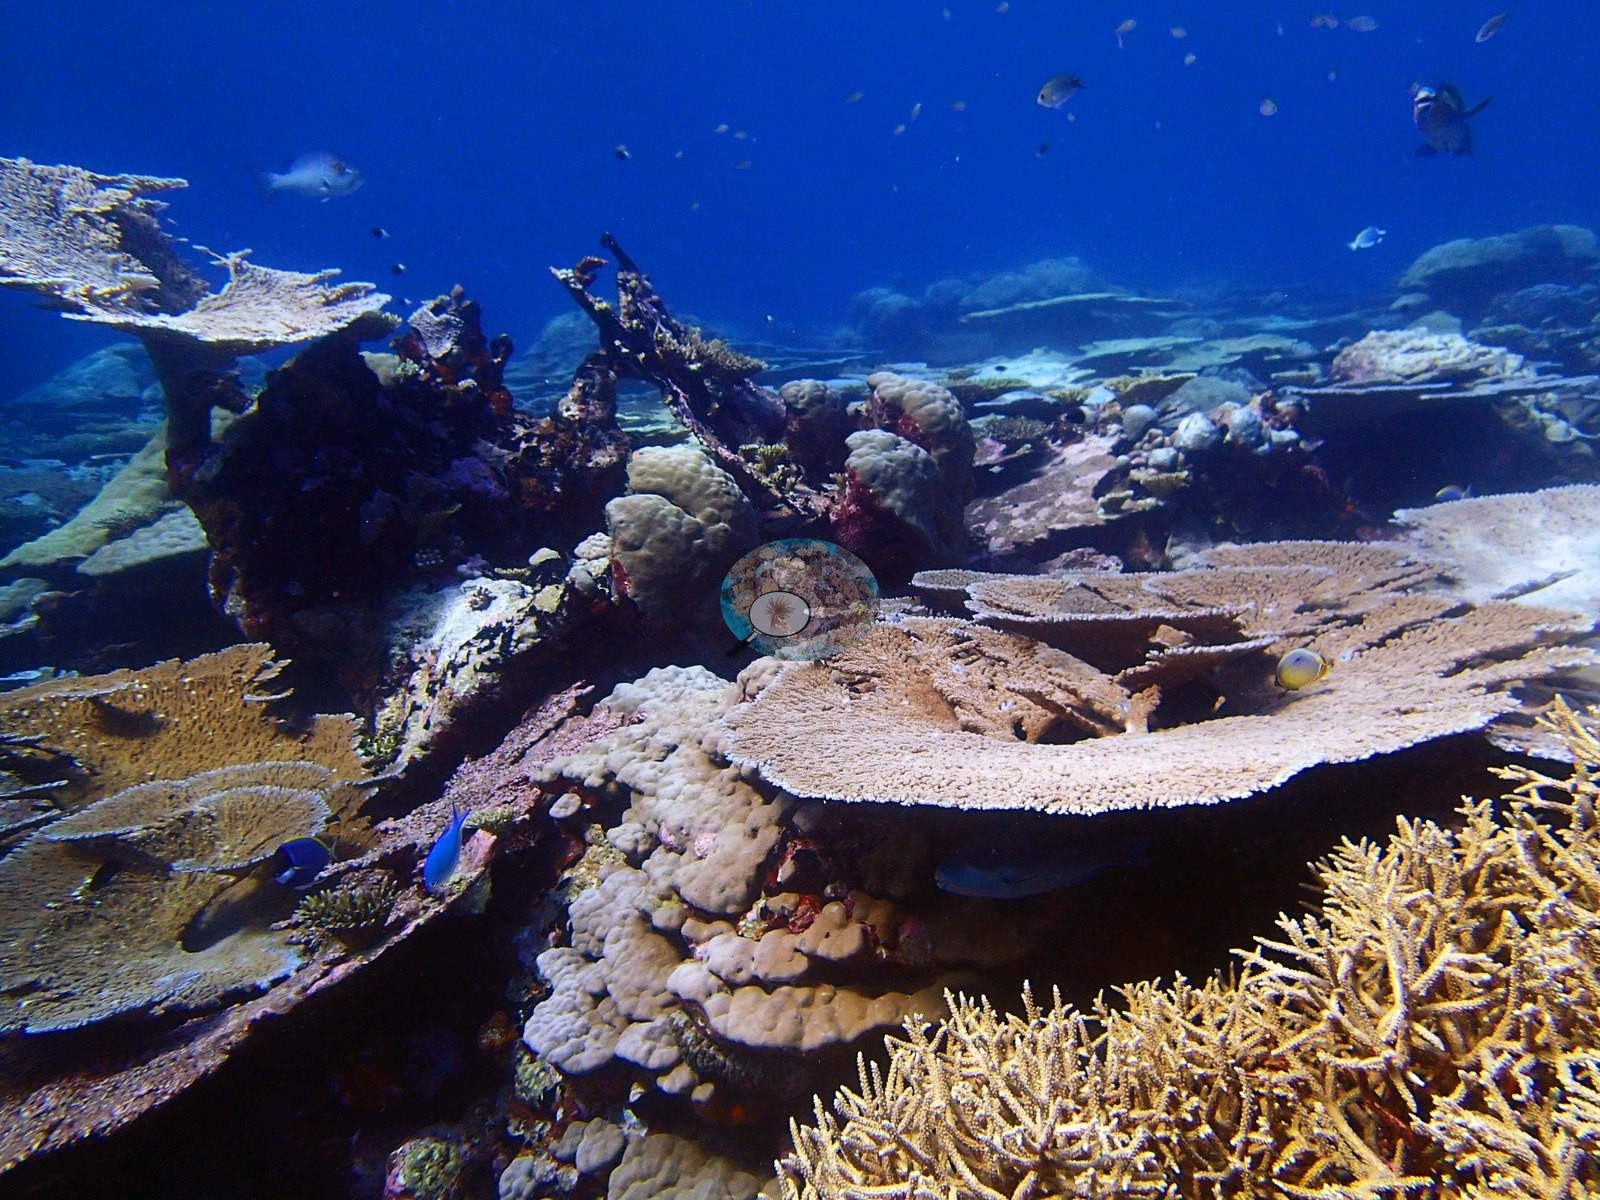
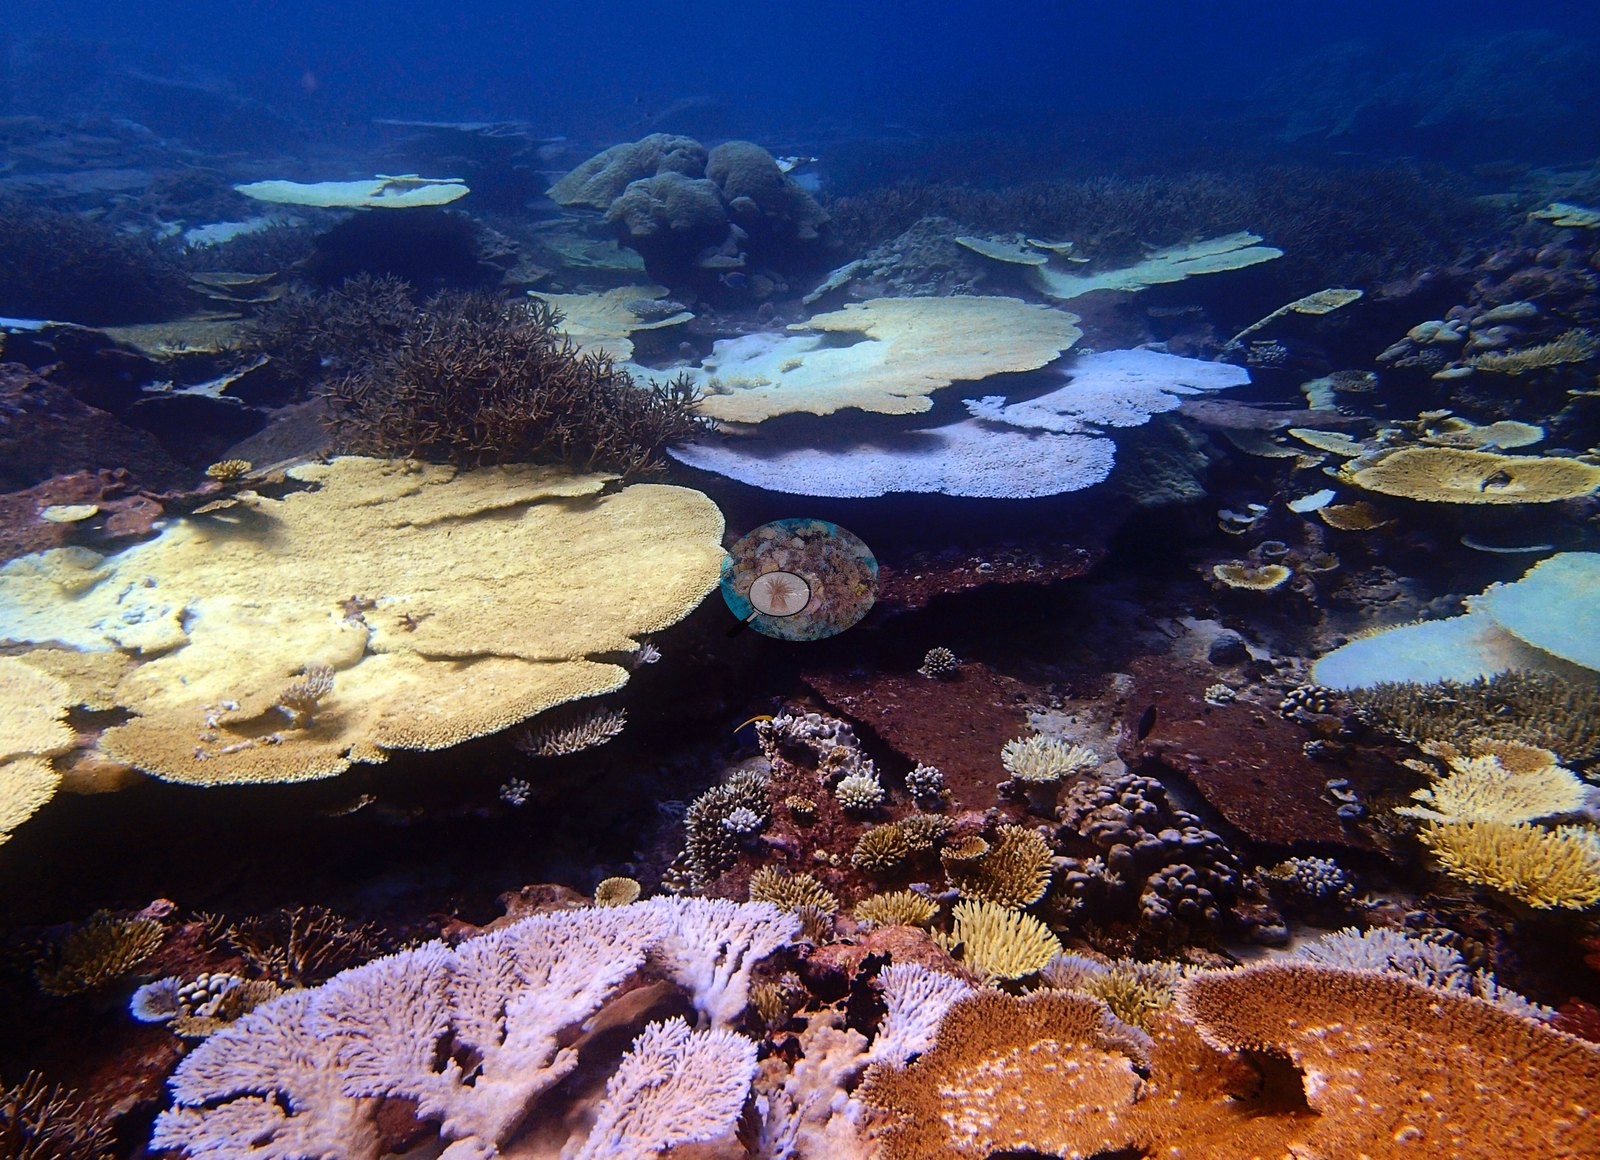
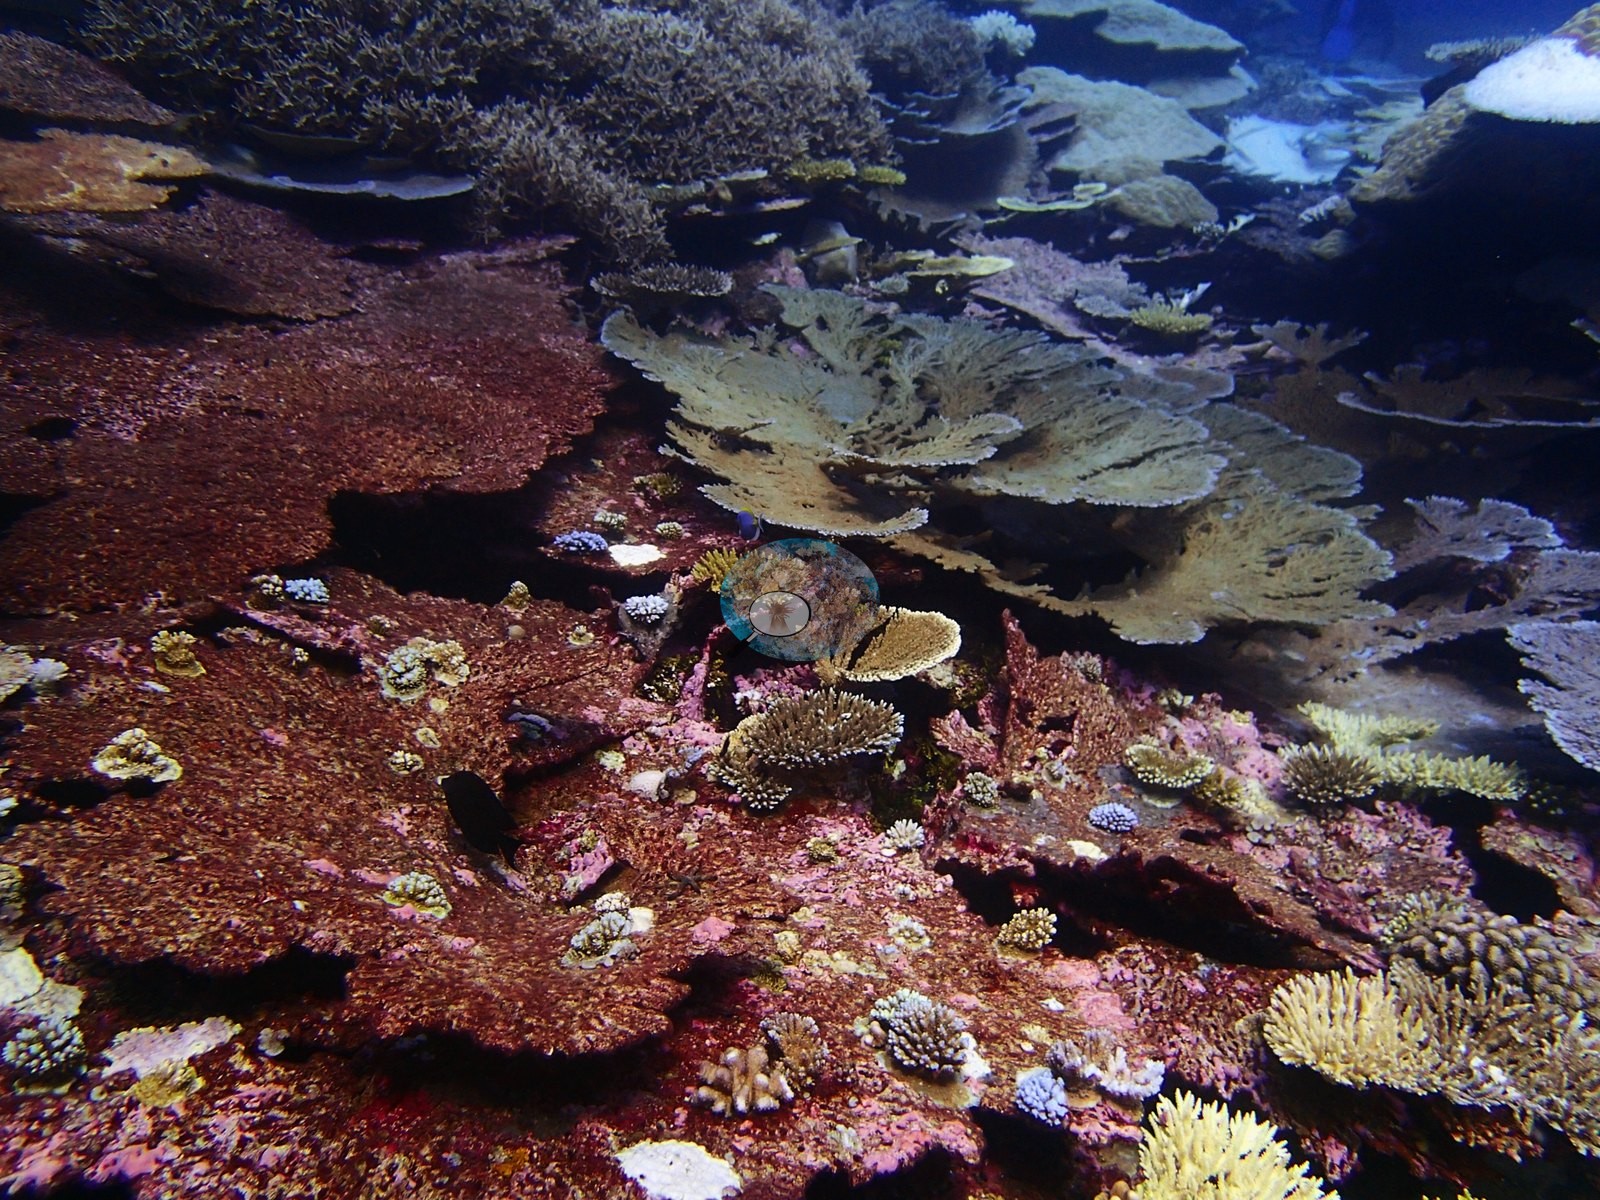
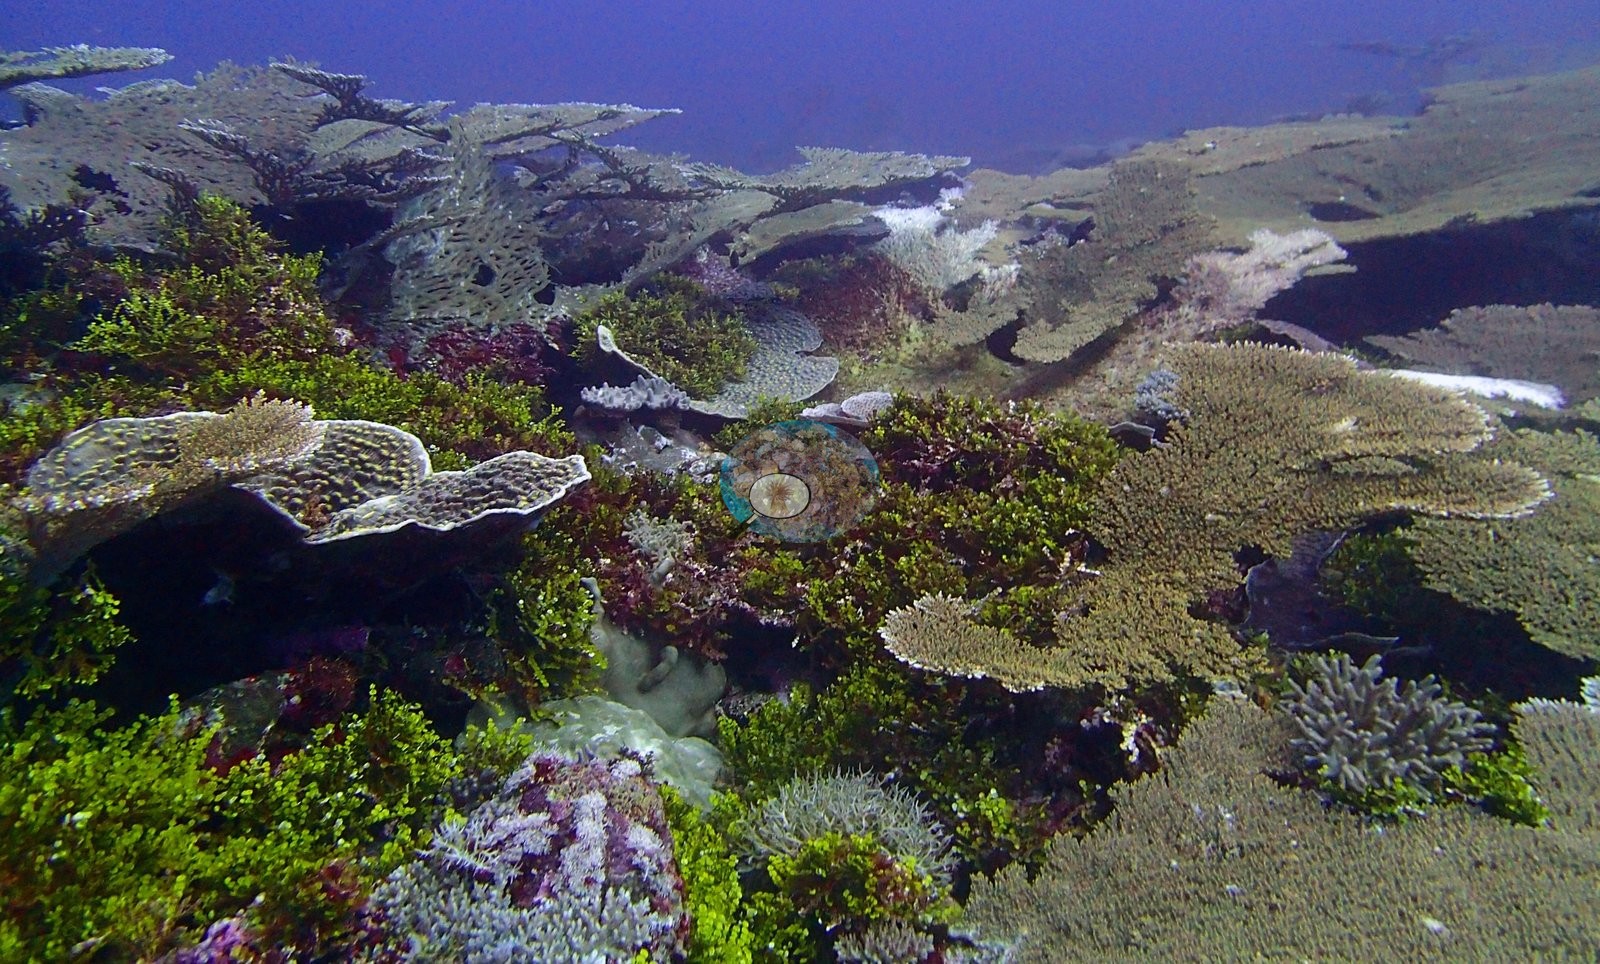
It is one of the highest-cover reefs in the archipelago: 64.7% living coral against 26.0% algae, 5th of 109 Chagos sites for cover and 98th of 109 for algae, among the ten lowest algal covers recorded (e.g., Image 3).
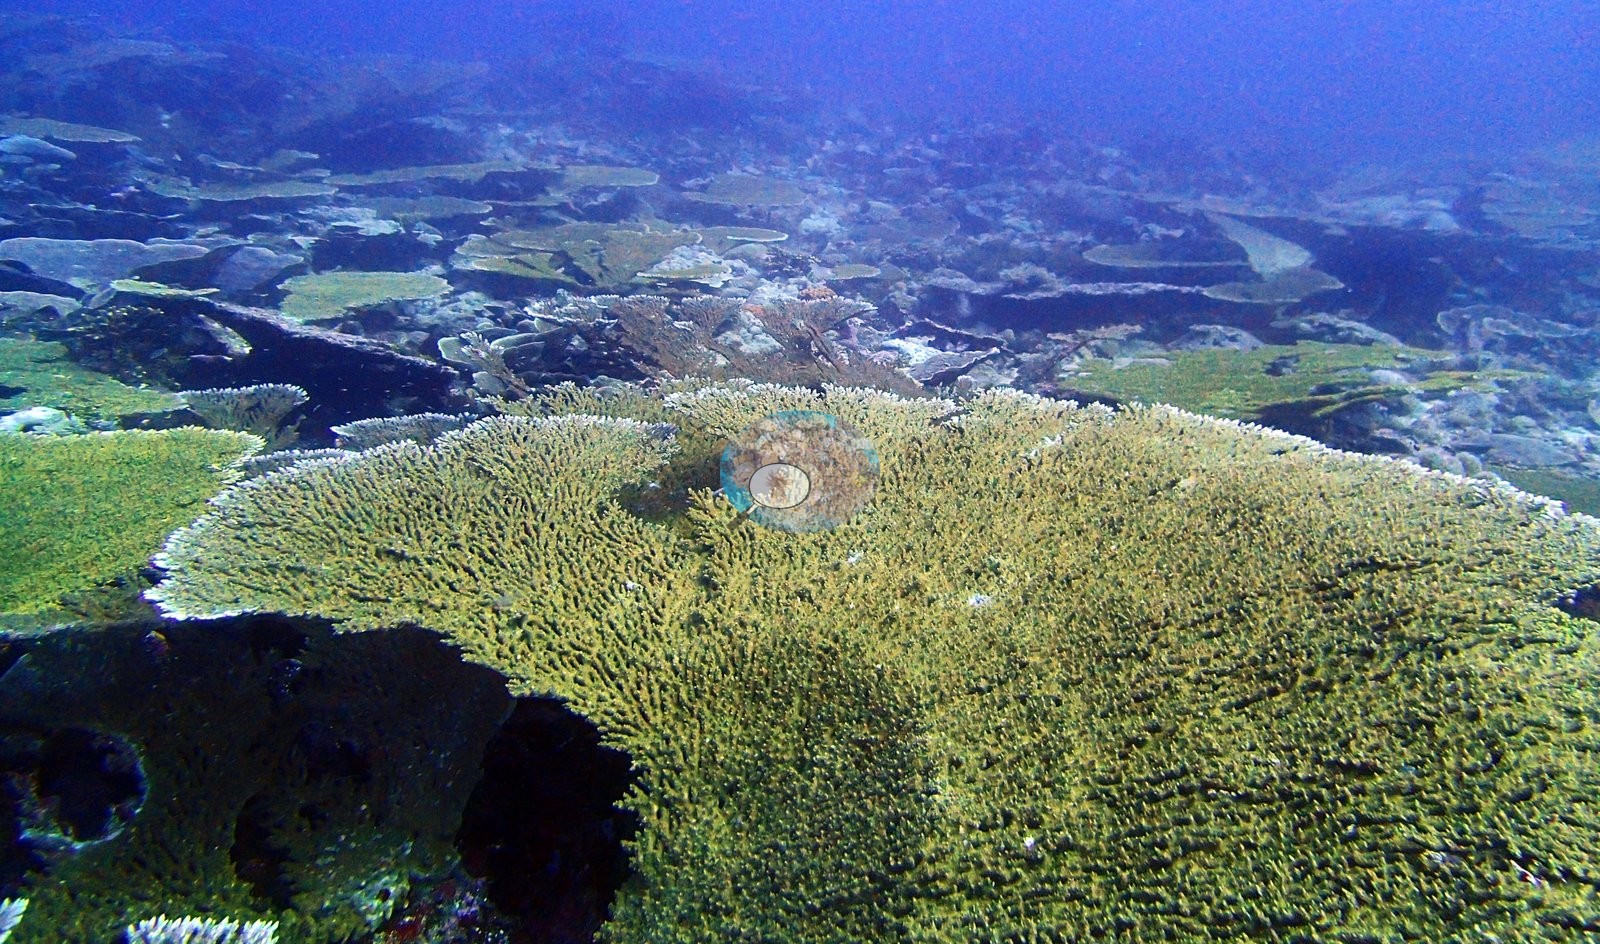
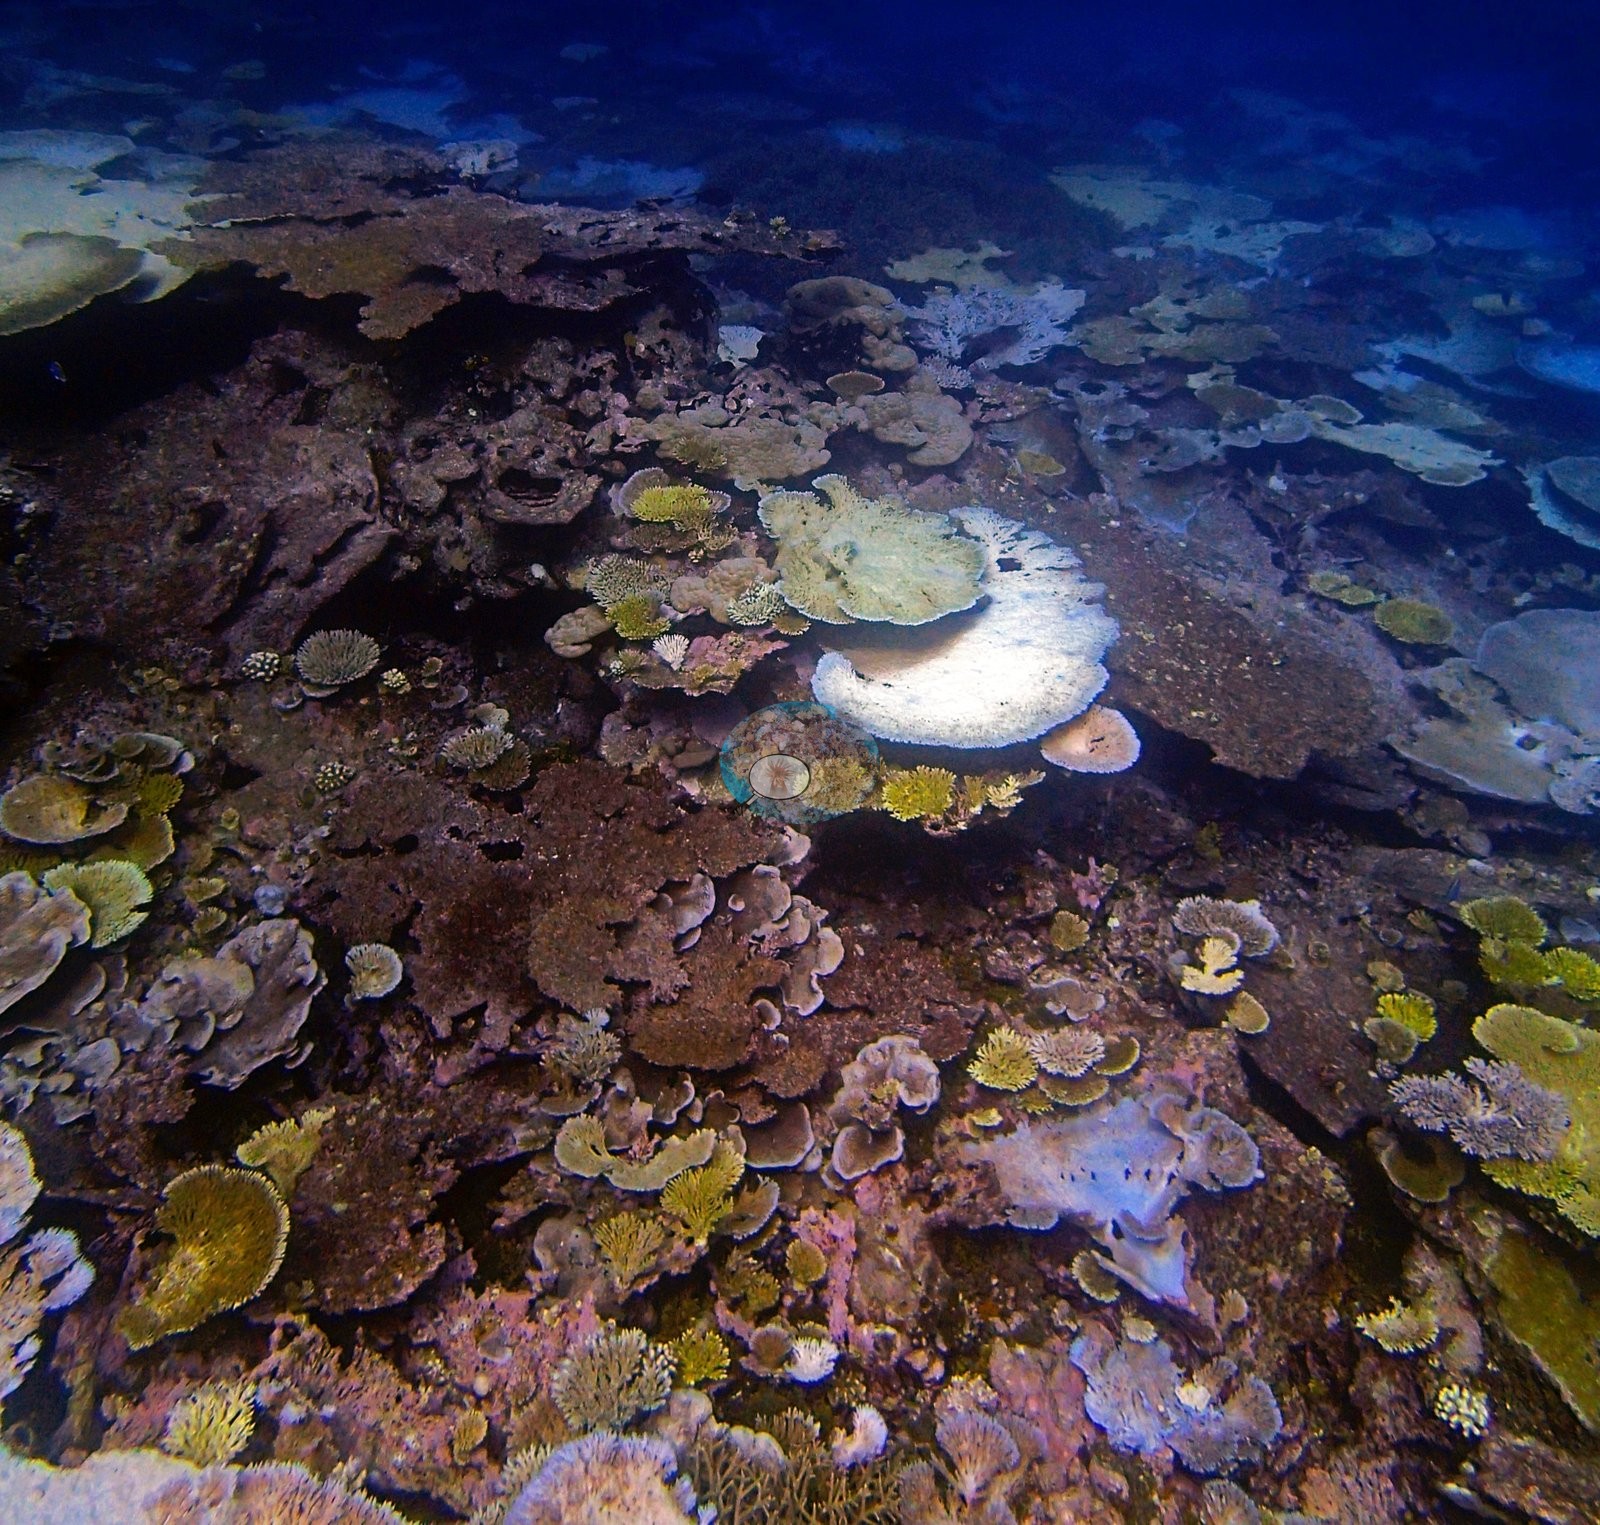
The depth profile is the cleanest handover in the dataset: a near-monospecific tabular Acropora stand at the two shallow strata, 74.5% and 78% cover with Acropora at 96% and 86% of their coral, giving way to a deepest stratum at 45% cover where Echinopora takes over outright at 60% of the coral and Acropora falls to 10.00% of the benthos — though that stratum rests on a single transect (e.g., Image 7, Image 9).
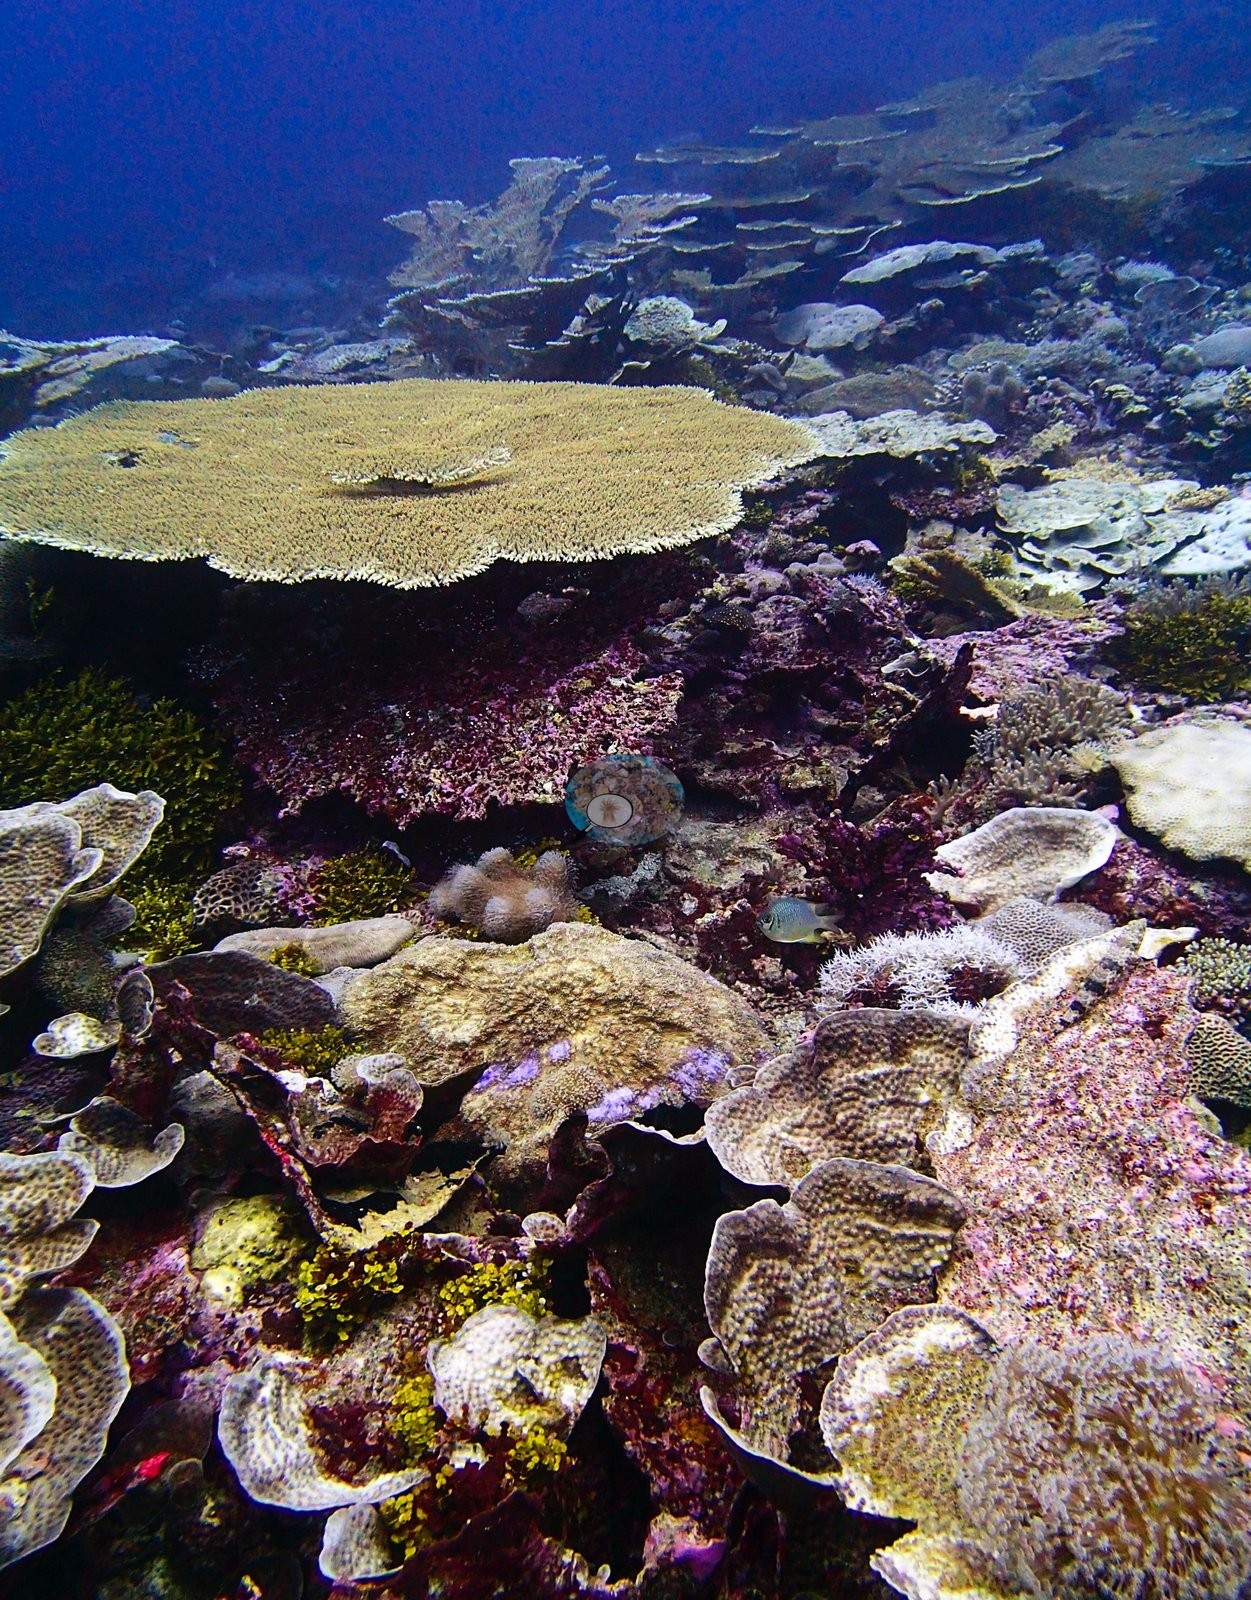
The image cover figures (CoralNet 36.7%, Coralscapes 37.3%) pool April and May frames and so describe neither dive.
Stressors
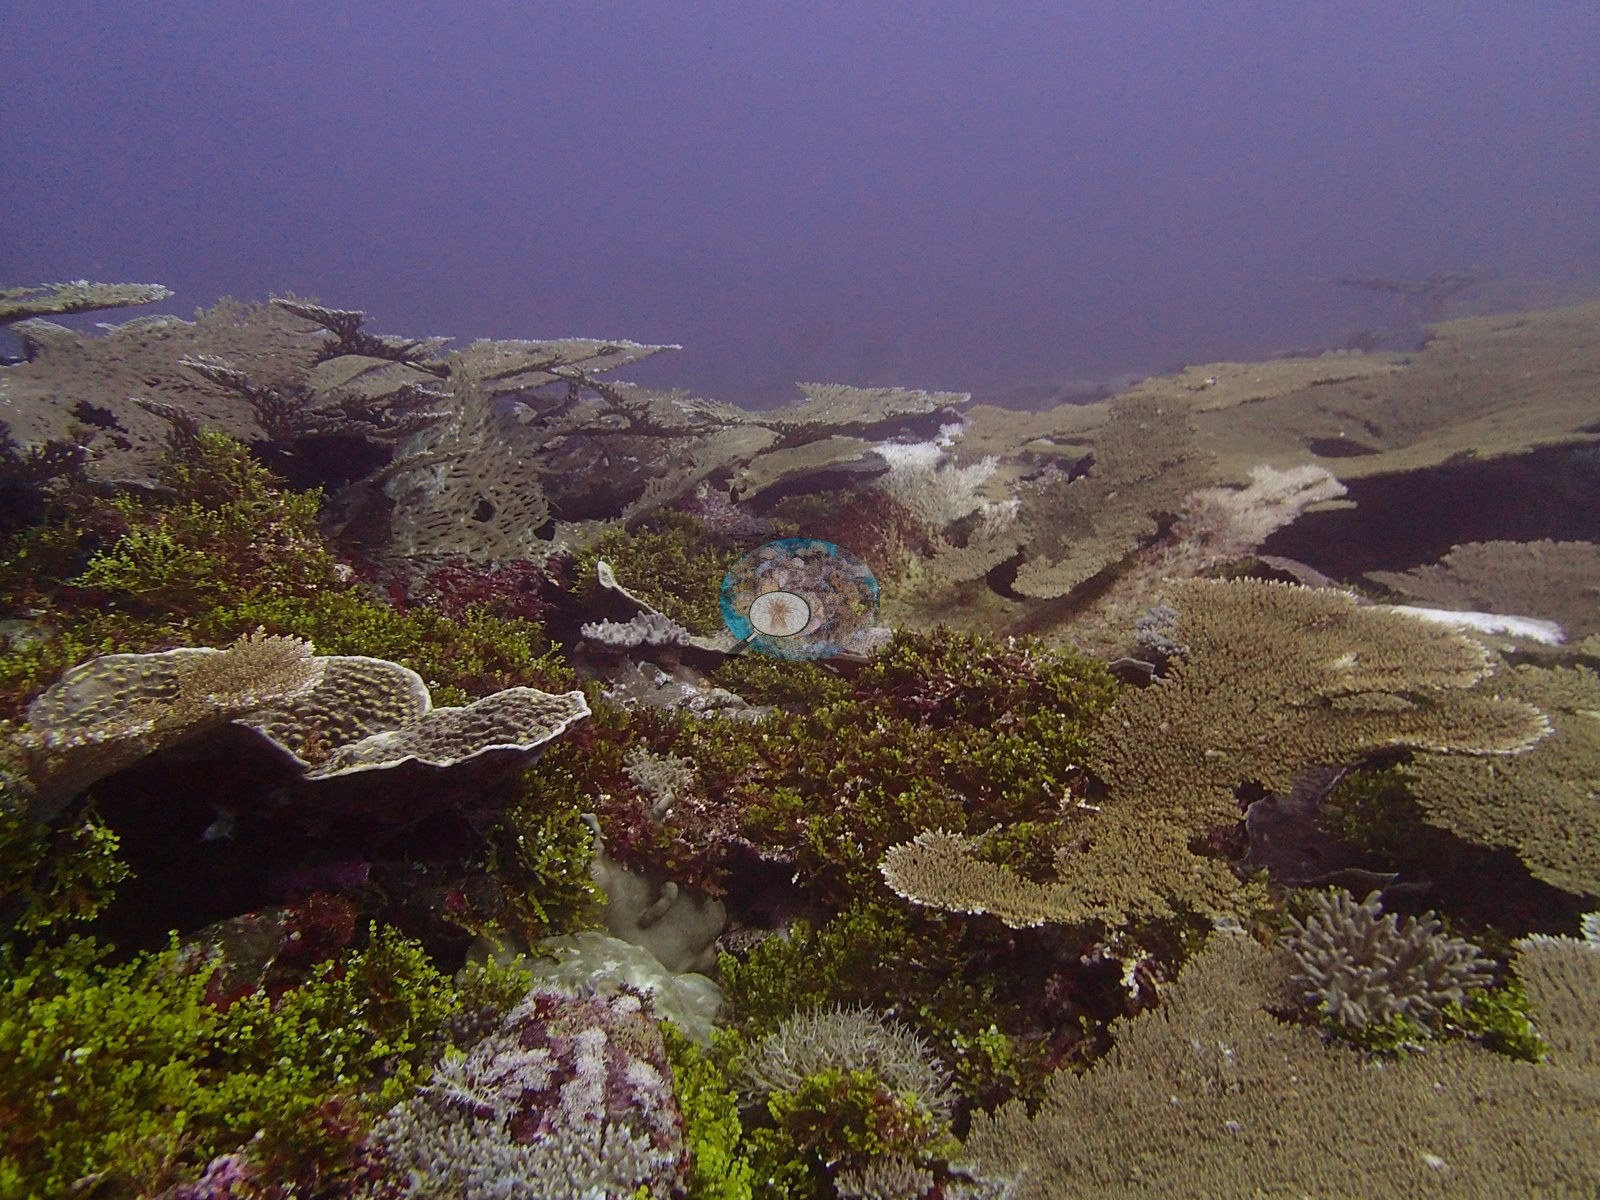
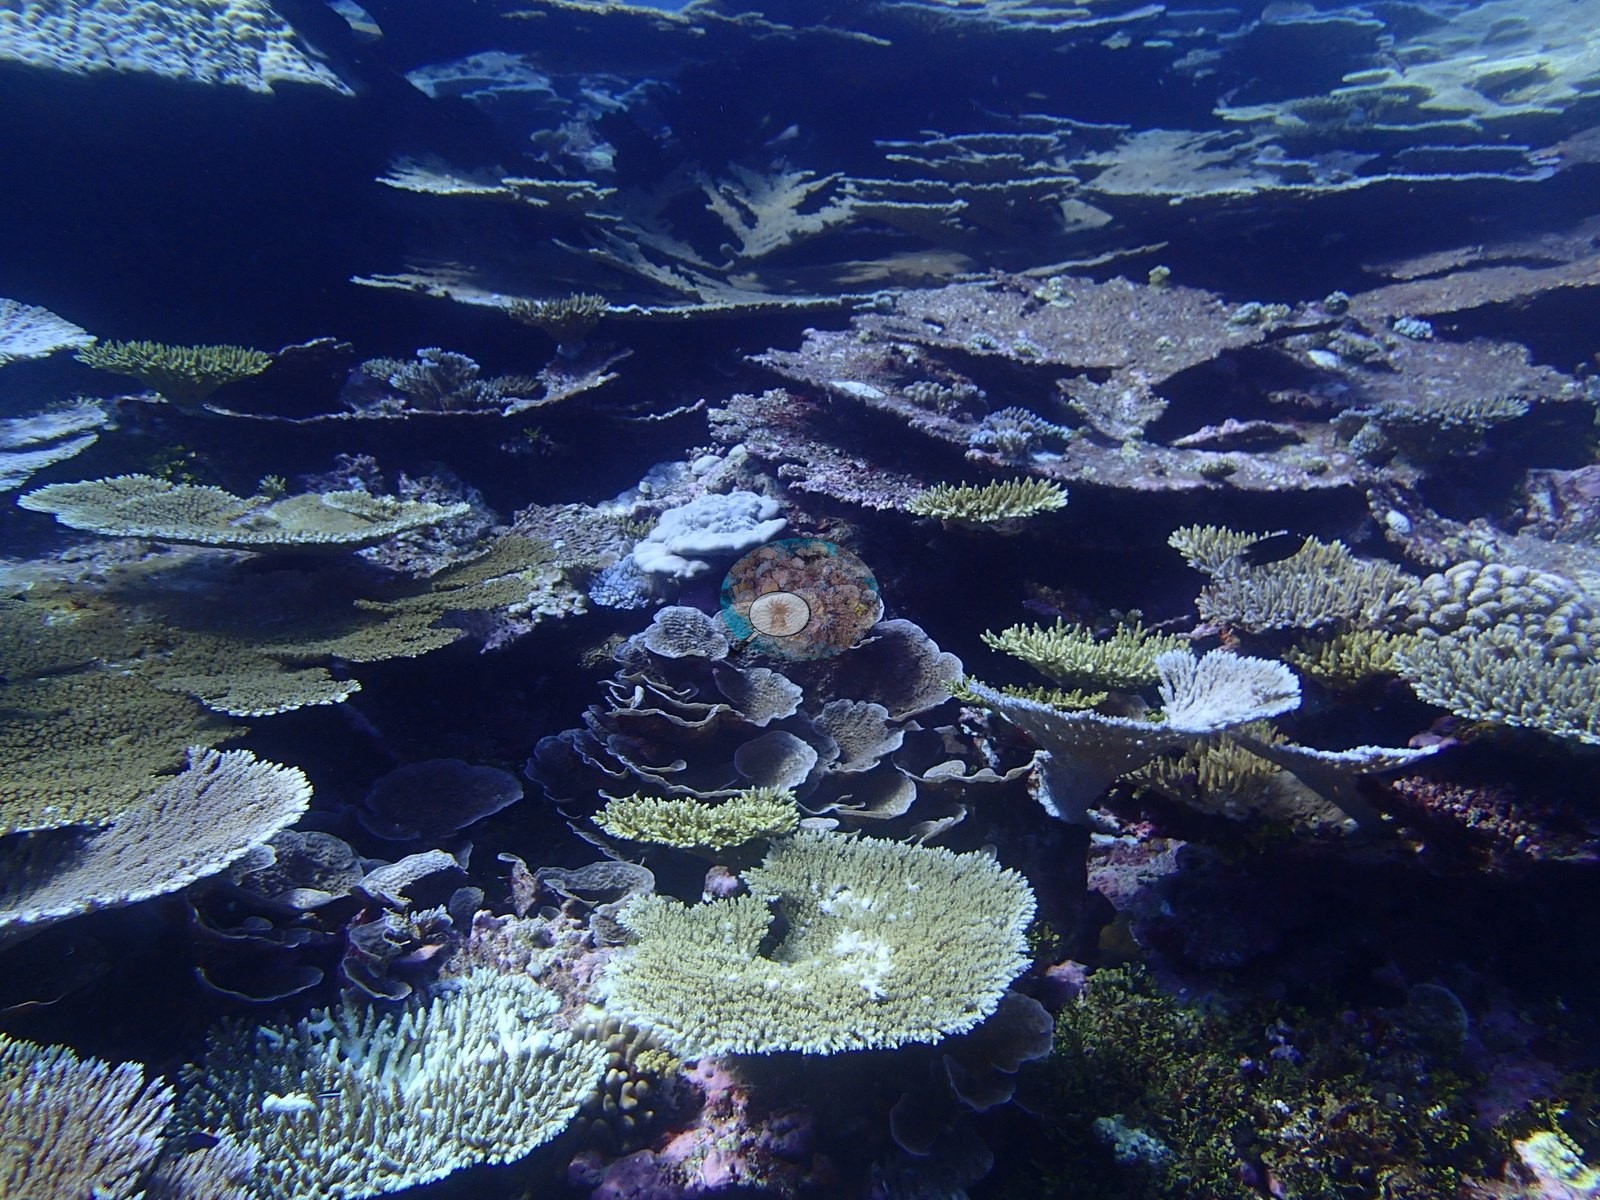
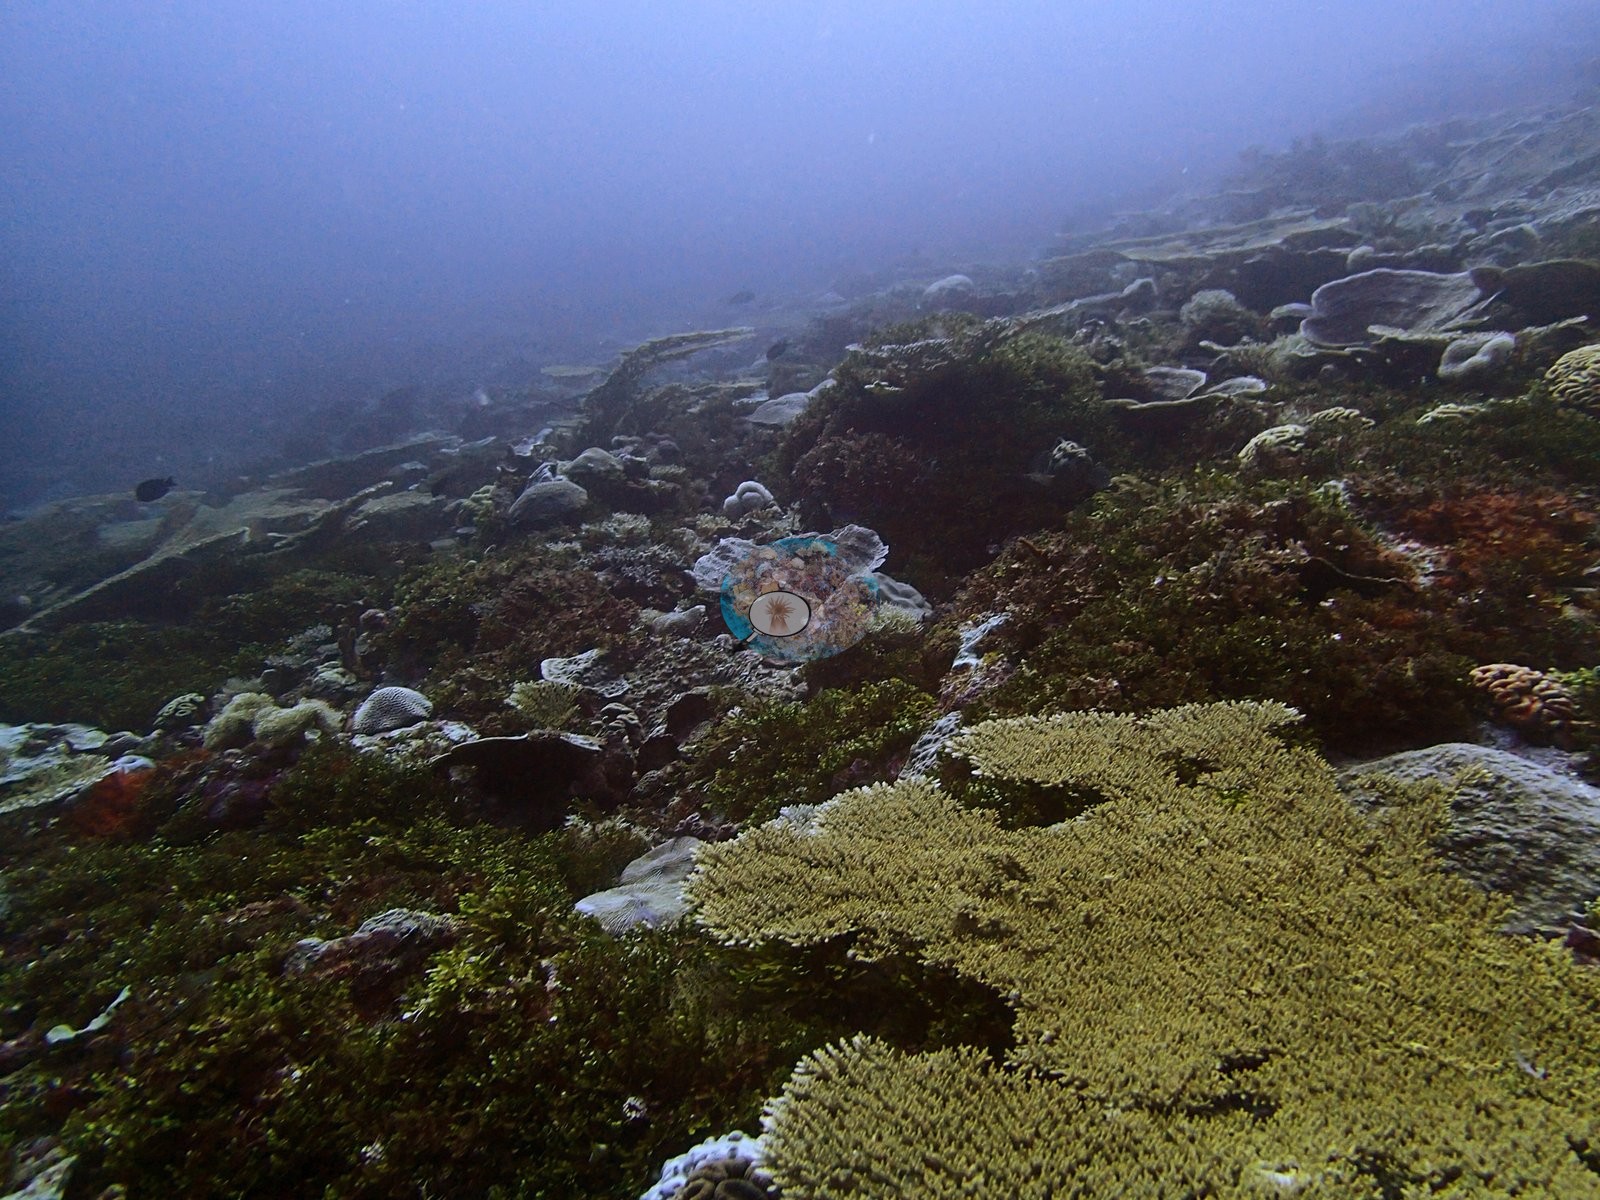
The site was dived three times, and the canonical % bleaching (2nd training) column tracks the event: 0% on 16 April, 12.05% on 17 April, 36.47% on 2 May, within two points of the highest value anywhere in the dataset. The site-level Mean(%bleaching) cell is blank, so no site rank exists. The May photographs show a mosaic sorted by growth form rather than a uniform whitening — near-continuous fields of white tables, and beside them vast branching stands still in full dark pigment (e.g., Image 5).
No crown-of-thorns, disease, or predation was seen.
Comparisons with other data
No prior survey data from this site. If you would like to share yours, please email us.
Survey summary
BIPB69 (Peros Banhos): surveyed 3 times, Apr–May 2015; bleaching rose from 0.0% (mid-April) to 36.5% of coral (early May) as the 2015 bleaching event set in (CoralNet analysis of informal survey images; Mayfield & Dempsey 2026, Oceans). Surveyed during the Khaled bin Sultan Living Oceans Foundation Global Reef Expedition.
CV model comparison
More info
Those are point counts on the photographs; this is a diver swimming a transect. The models and the reference never saw the same thing. ⚠ SITE-LEVEL ONLY. The 2,500 frames were not associated with any transect taken within 200 m of them, so transect-vs-image comparisons are site means, never frames. The transect value is already in the pin `cover` field (109 of 112 pins, sourced to the paper's suppl. S1) and is read from there, never re-imported. The transect is THE coral-cover value for this site and stands alone. The rows below it are a methods comparison only: no computer-vision value is averaged with it, feeds the headline, or carries over to the site's cover figure (Anderson, 2026-09-22).| Method | Hard-coral cover (%) |
|---|---|
| Transect (published) | 64.7 |
| CoralNet | 56.1 |
| In-house DINOv3 | 47.4 |
| CoralSCOP edited | 42.6 |
| Claude | 39.1 |
Dive history
Coral bleached: computer-vision (CoralNet) estimate from the survey images, per dive, as published in Mayfield & Dempsey (2026), supplemental file S1.
| Date | Time in | Max depth (m) | Bottom time (min) | Coral bleached (%) |
|---|---|---|---|---|
| 2015-04-16 | — | — | — | 0.0 |
| 2015-04-17 | — | — | — | 12.1 |
| 2015-05-02 | — | — | — | 36.5 |
Data & links
- Read the full site report ↗
- Download benthic survey data (CSV) ↗
- Download all LOF-GRE data (933 sites) ↗
- CoralNet image repository for this region ↗
- Photo portfolio ↗
- Coral Reef Diagnostics page for this area ↗
All images from Coral Reef Diagnostics. Data are from Coral Reef Diagnostics.
 © Coral Reef Diagnostics.