
Part of the regional summaries: Chagos Archipelago - Peros Banhos and Chagos Archipelago

More info
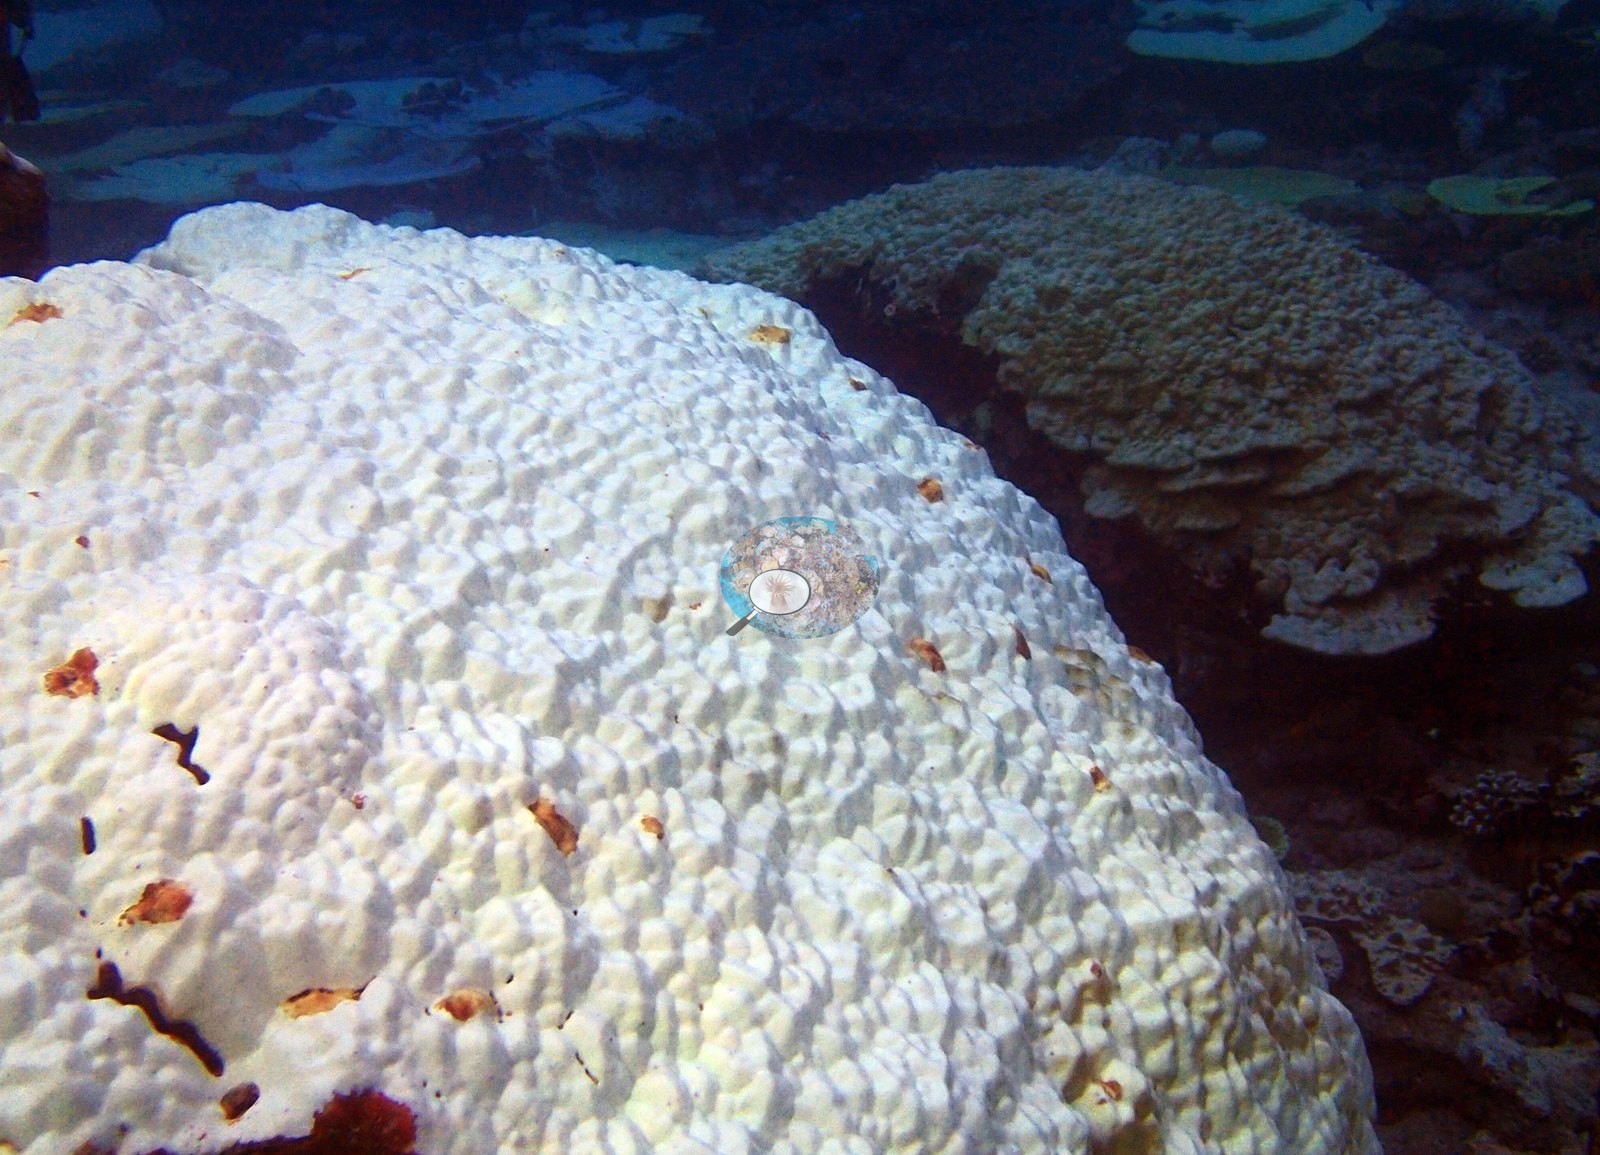
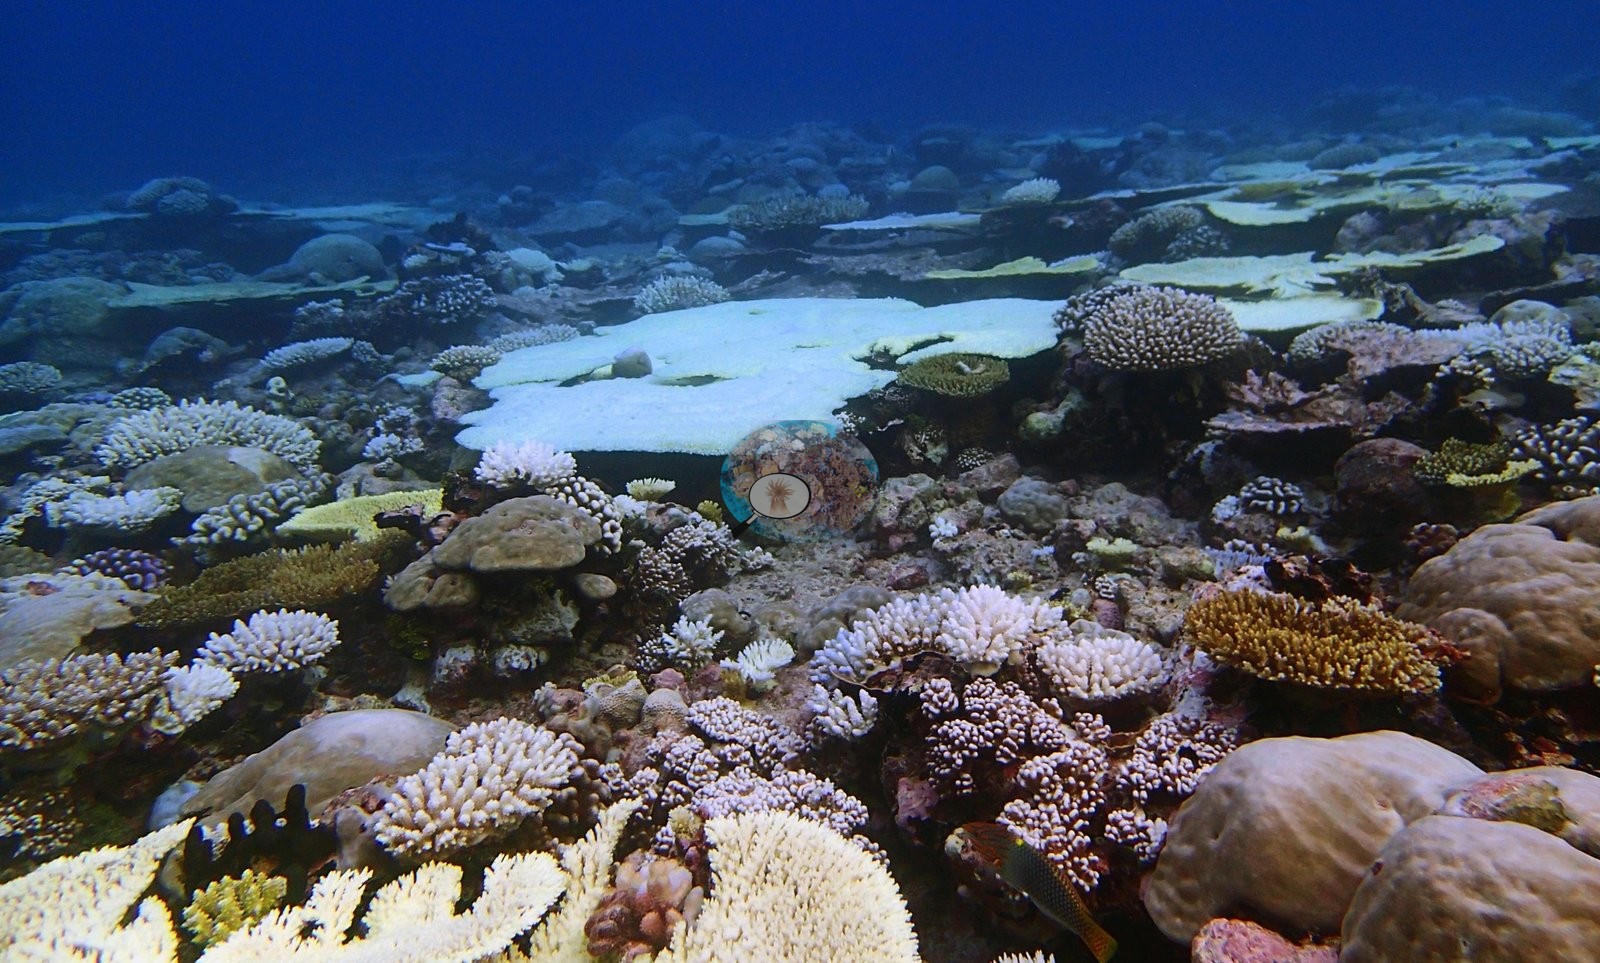
Chagos (NOAA CRW virtual station)A structurally complex lagoon channel reef with 23 coral genera, where tiers of overlapping table corals give way at depth to brain-type and Echinopora corals, at 39% cover. Bleaching is unmistakable across several growth forms, including an enormous massive colony with extensive white tissue. Surveyed on the Living Oceans Foundation's Global Reef Expedition.
🗺 Detailed map of the Global Reef Expedition dive sites, Peros Banhos, Chagos (Khaled bin Sultan Living Oceans Foundation; opens in a new window)
35 of these 45 photographs are shown beside the text that discusses them under "Site description" below.
Site description
Setting
The reef's three-dimensional structure is unusually conspicuous.
General benthic features
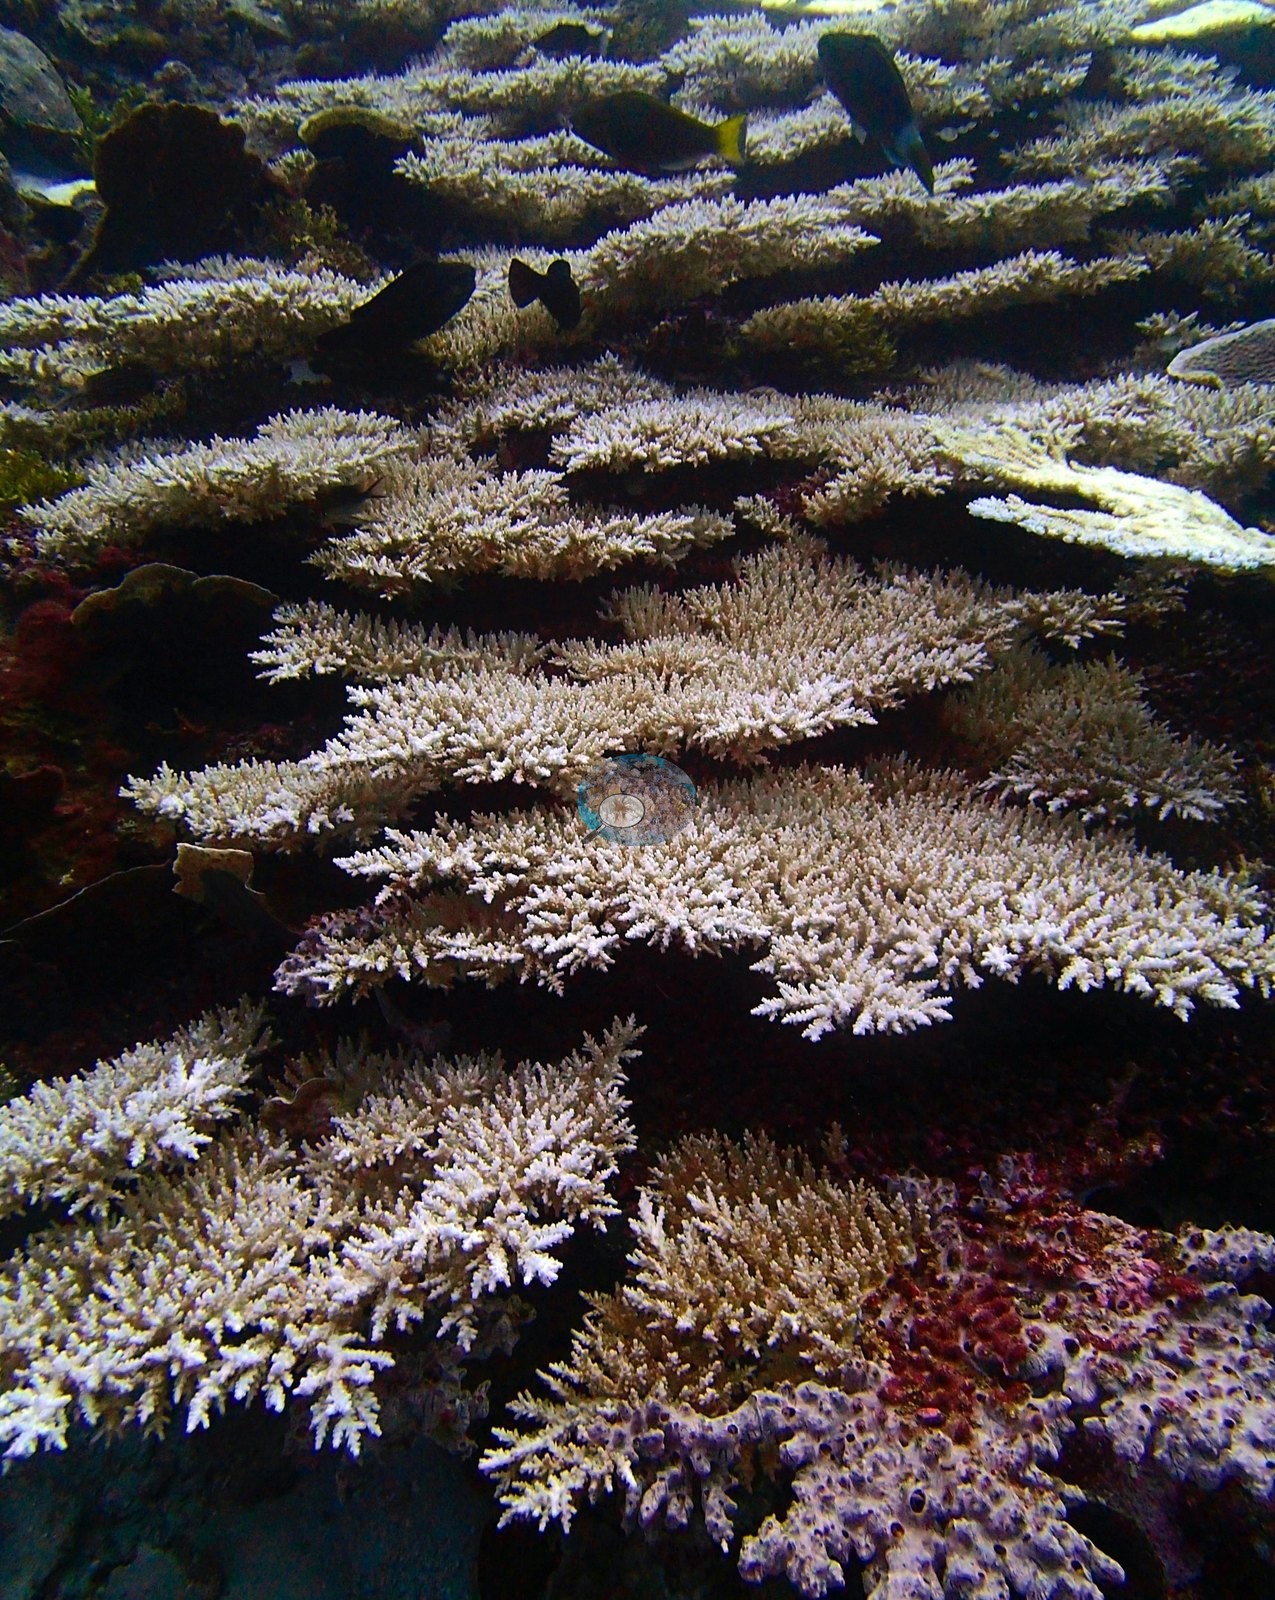
It is an Acropora reef first and foremost. Acropora holds 16.35% of the benthos — 42% of all coral recorded (e.g., Image 21) — with Porites second at 6.64% (e.g., Image 46), then Favia and Symphyllia both at 2.50%, Echinopora 2.45%, Pocillopora 2.00%, Pavona 1.33%, and Montipora 0.91%.
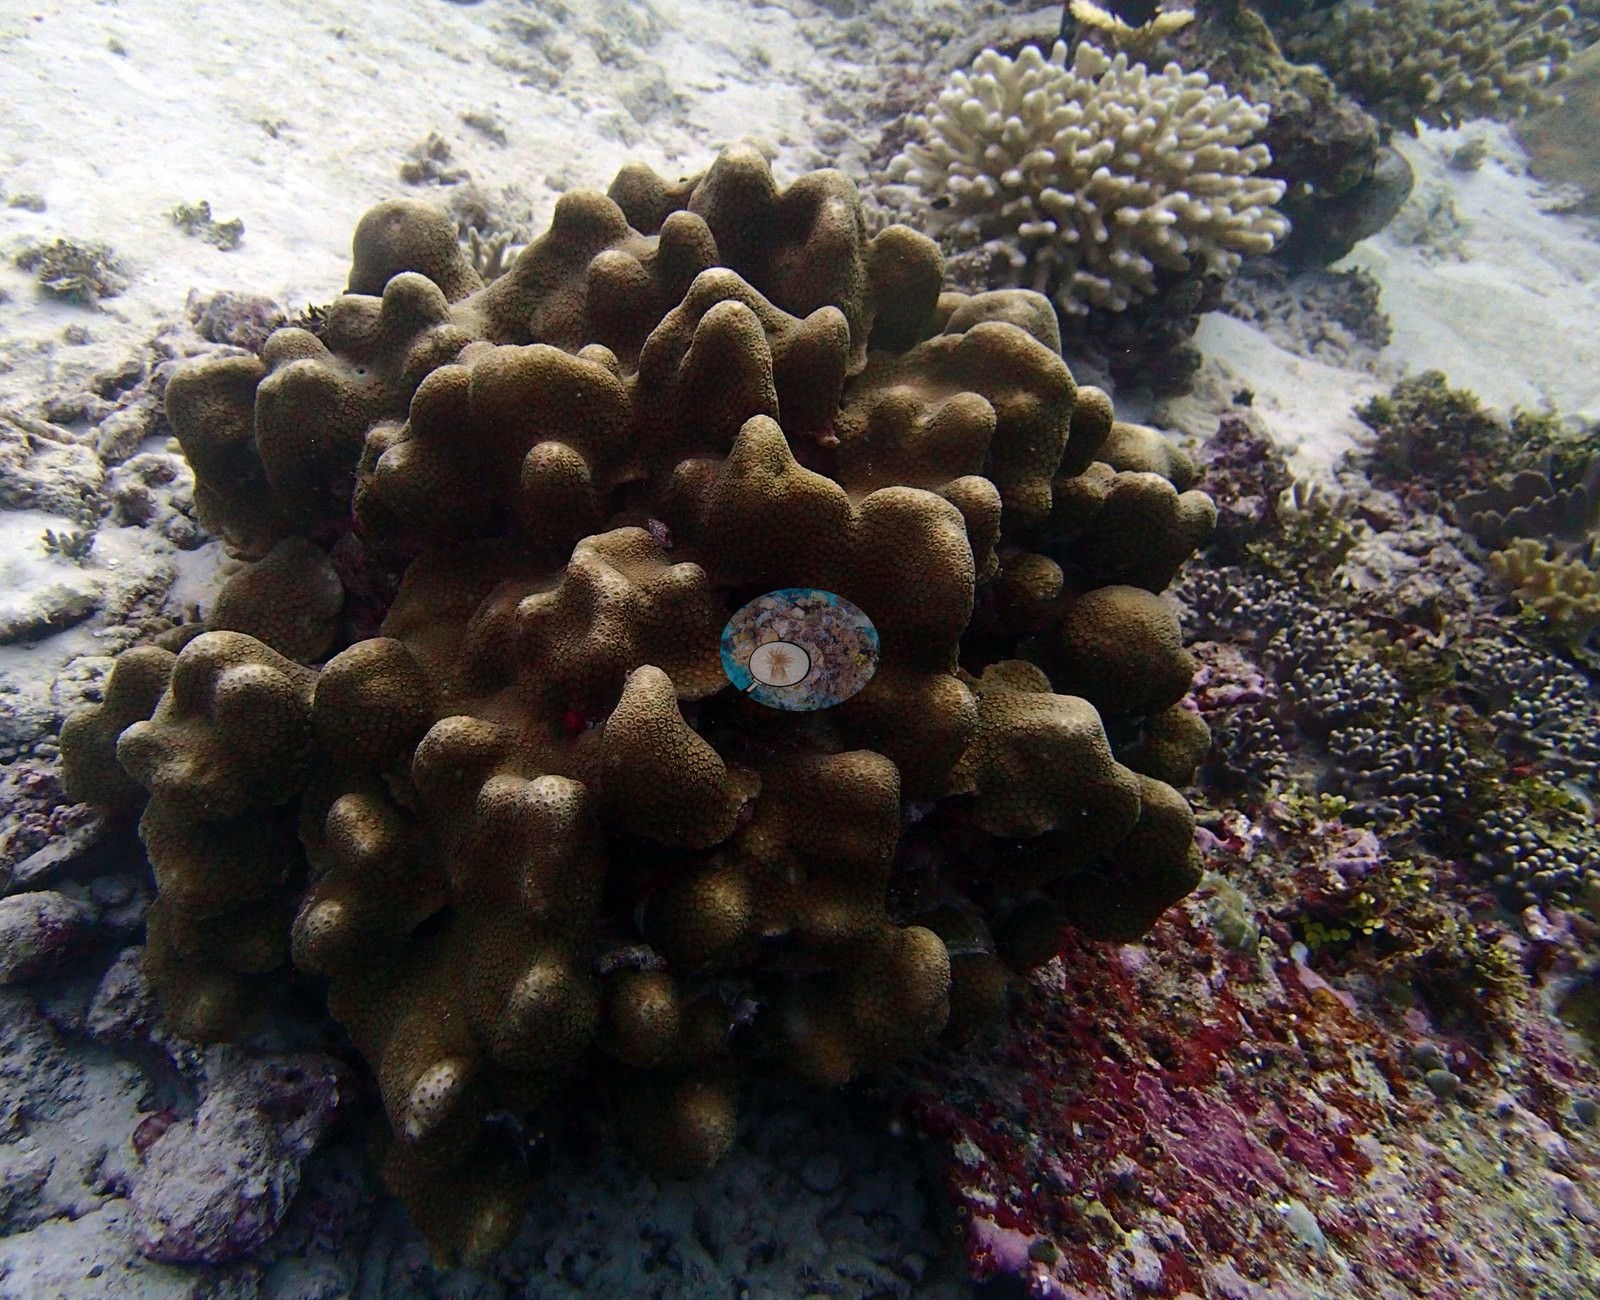
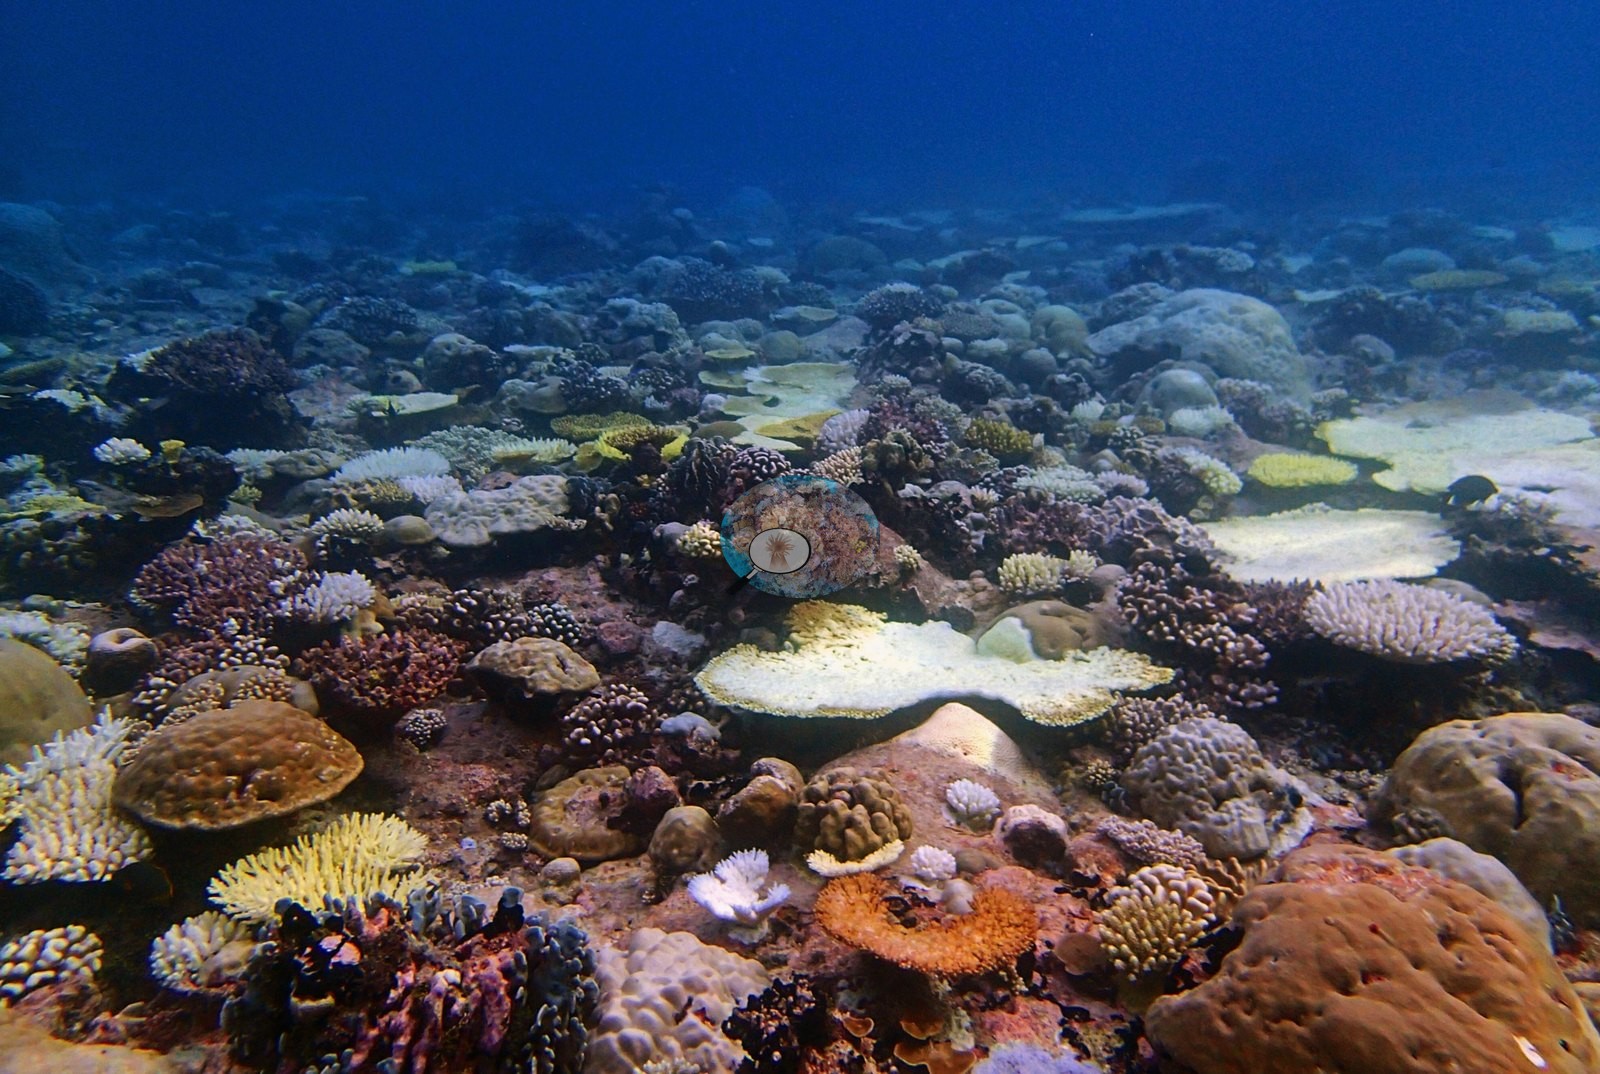
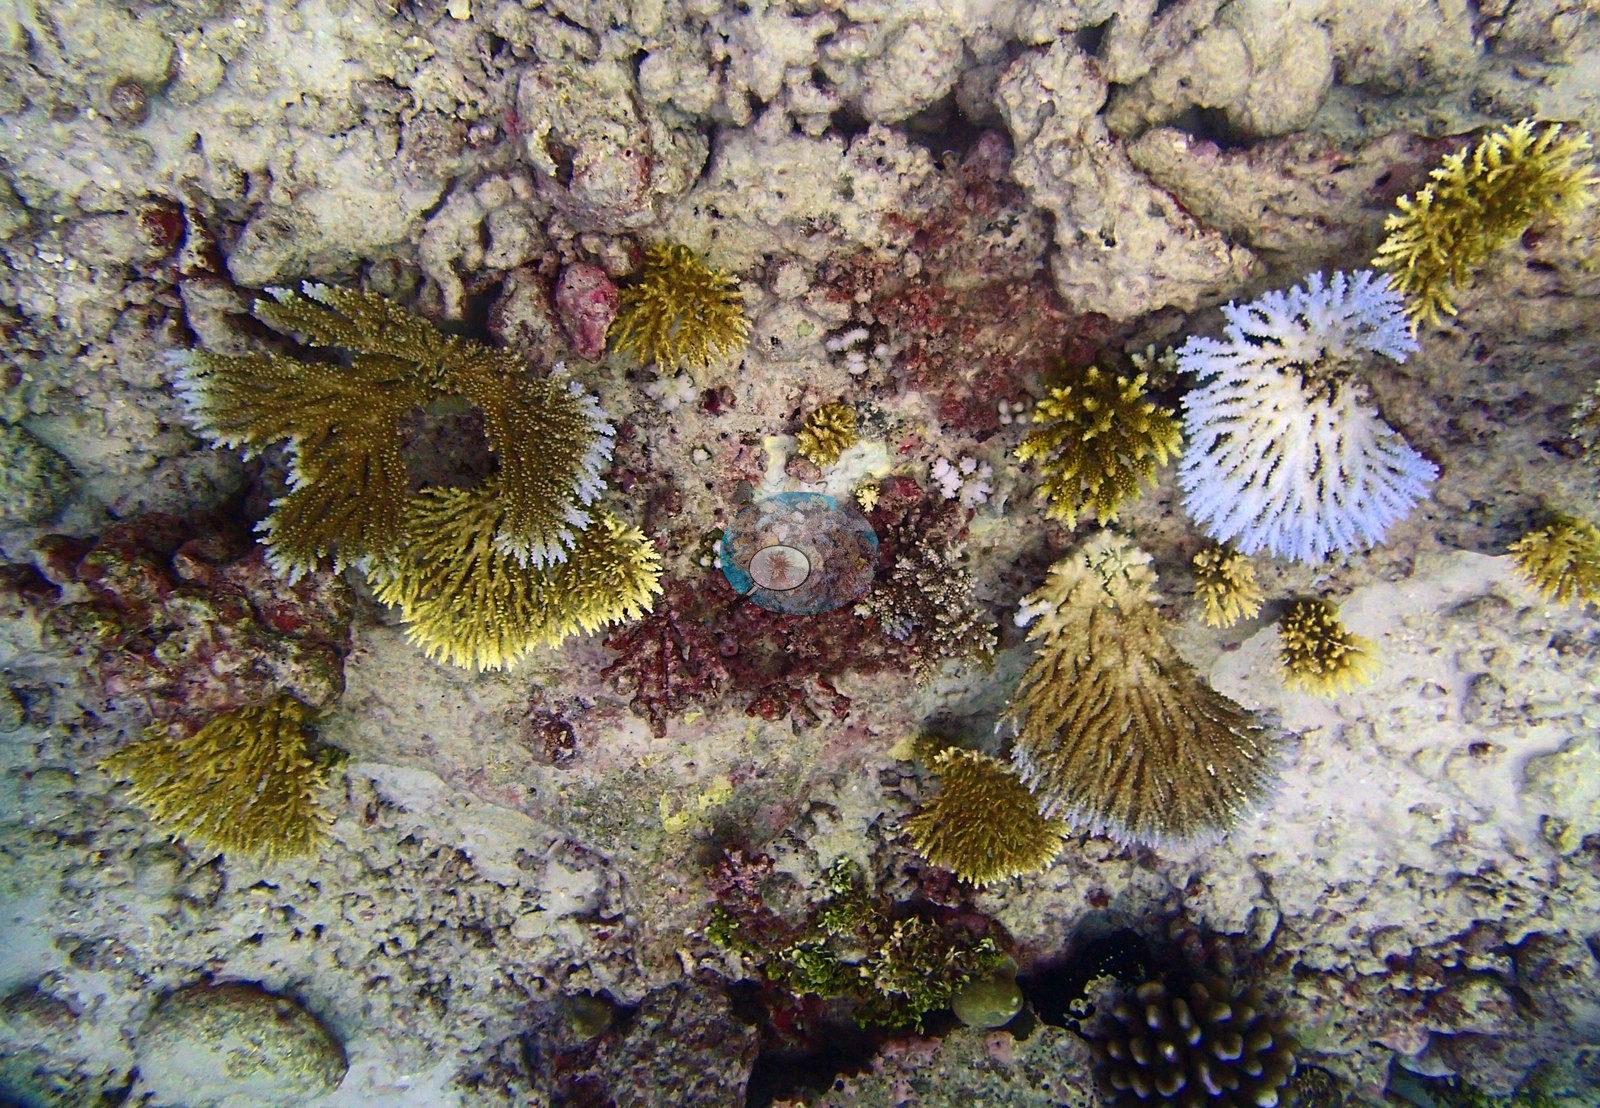
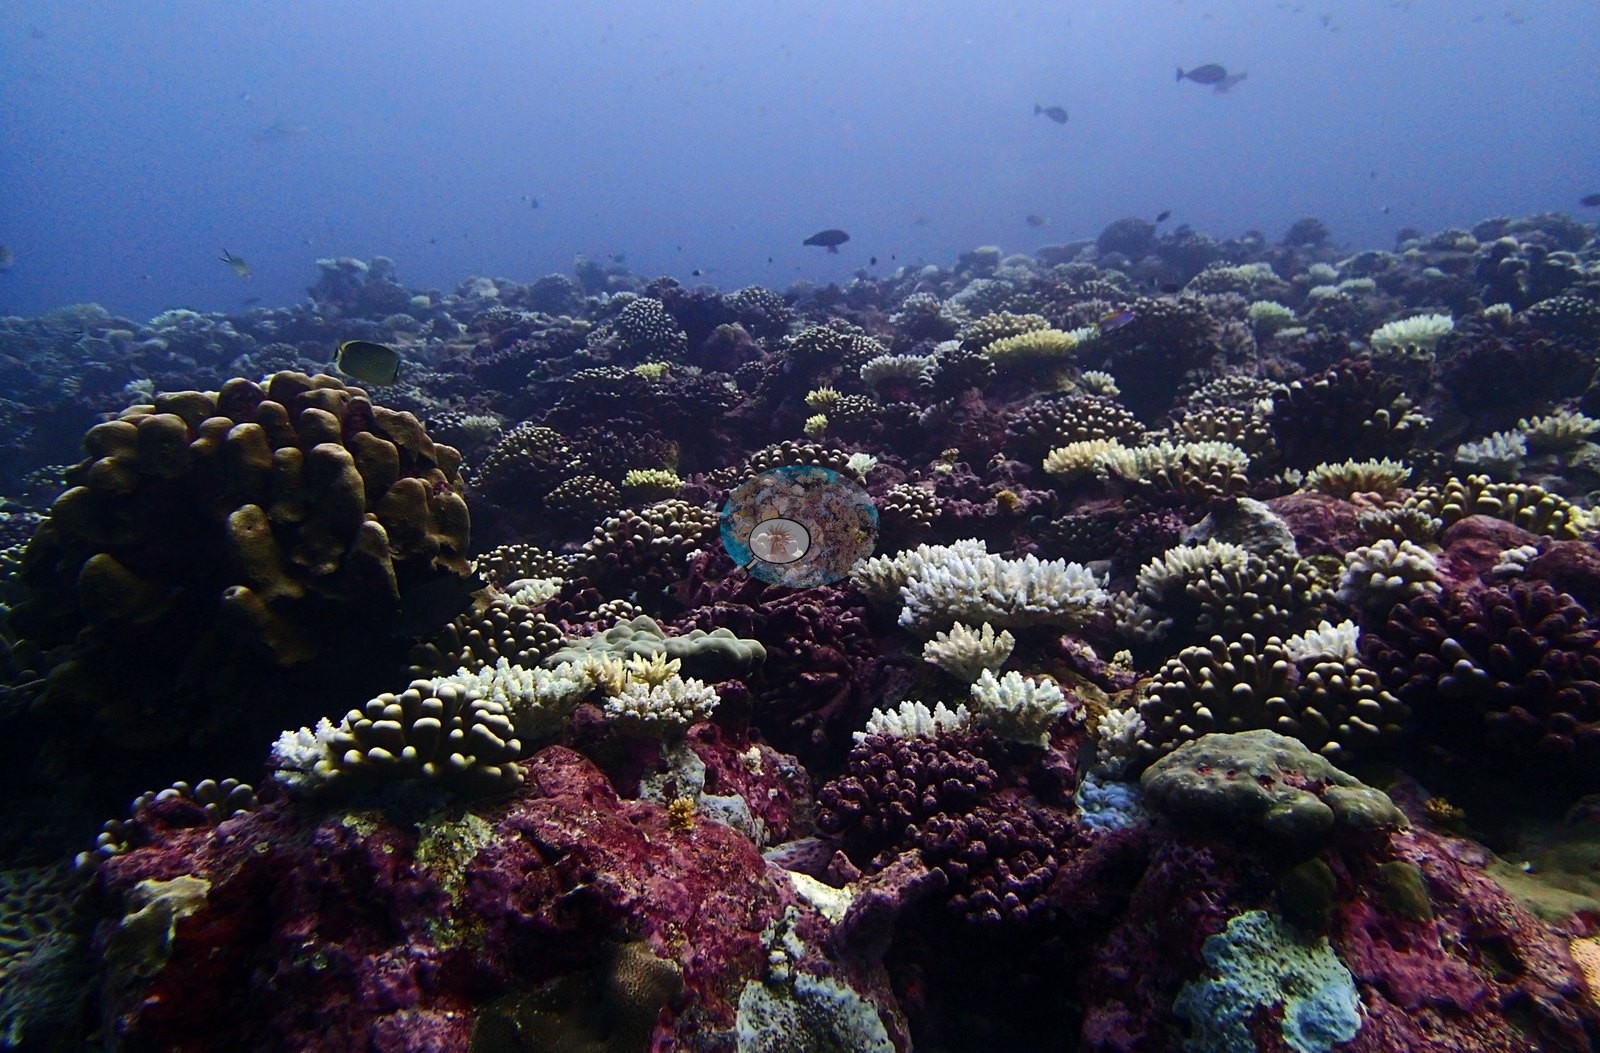
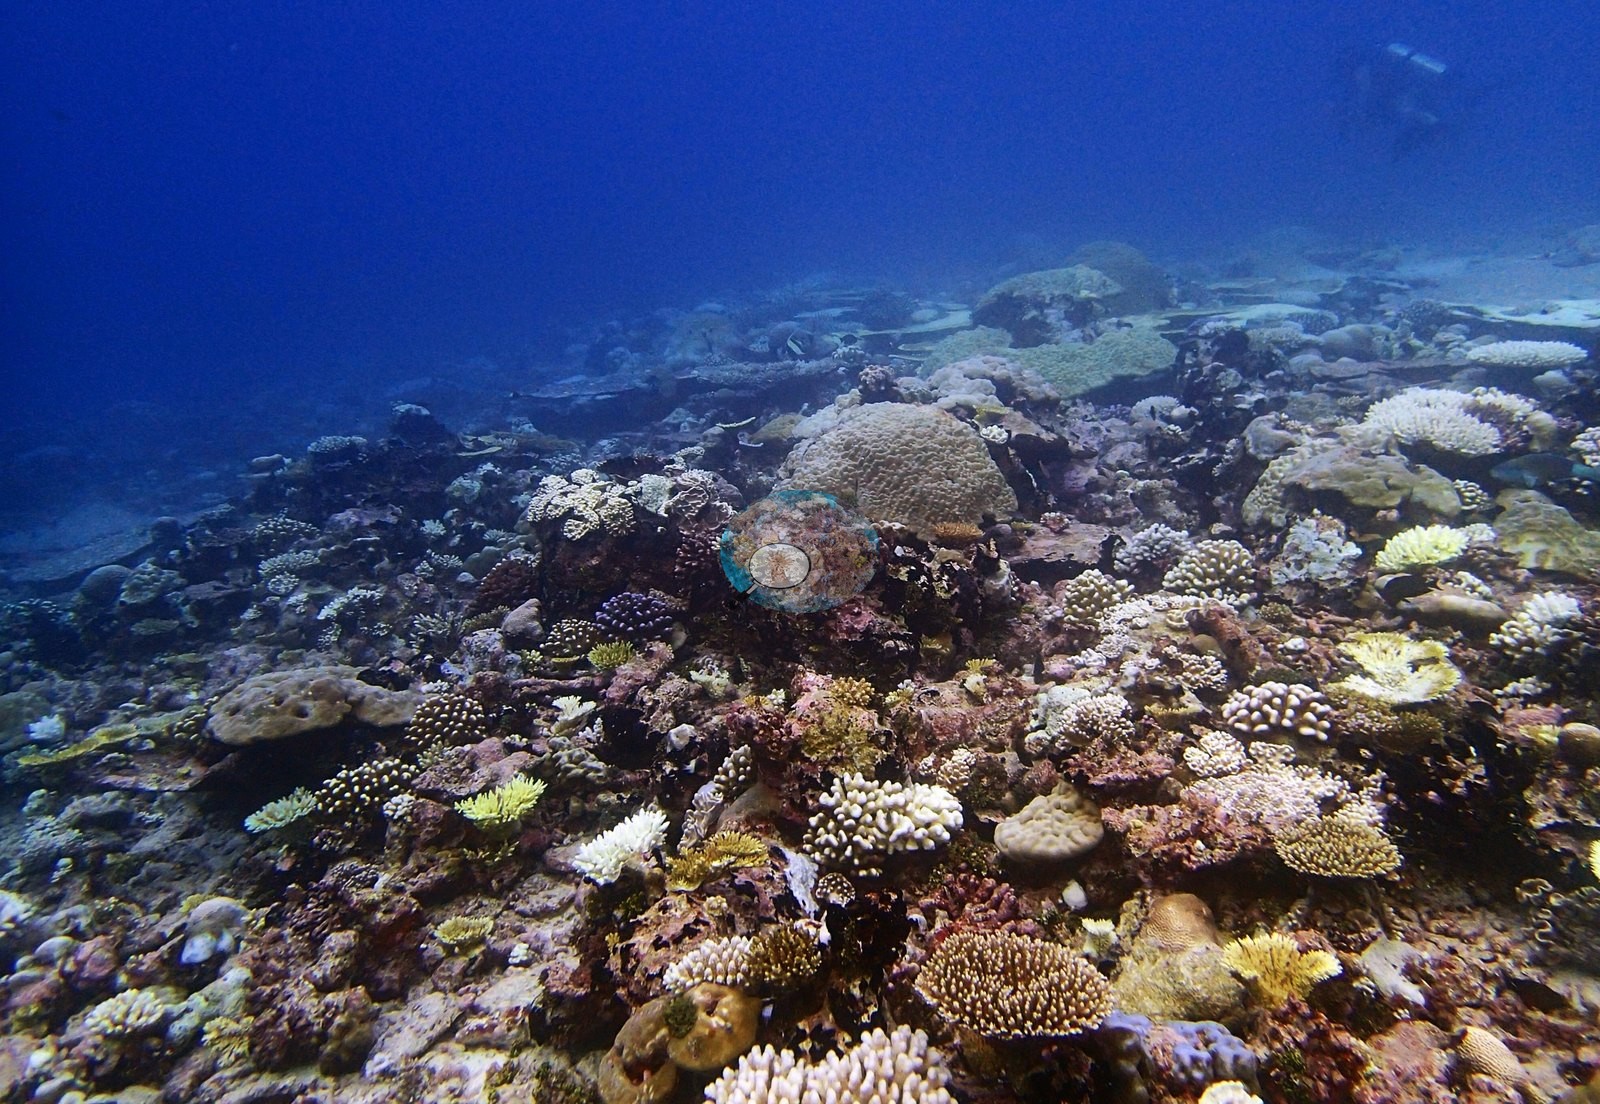
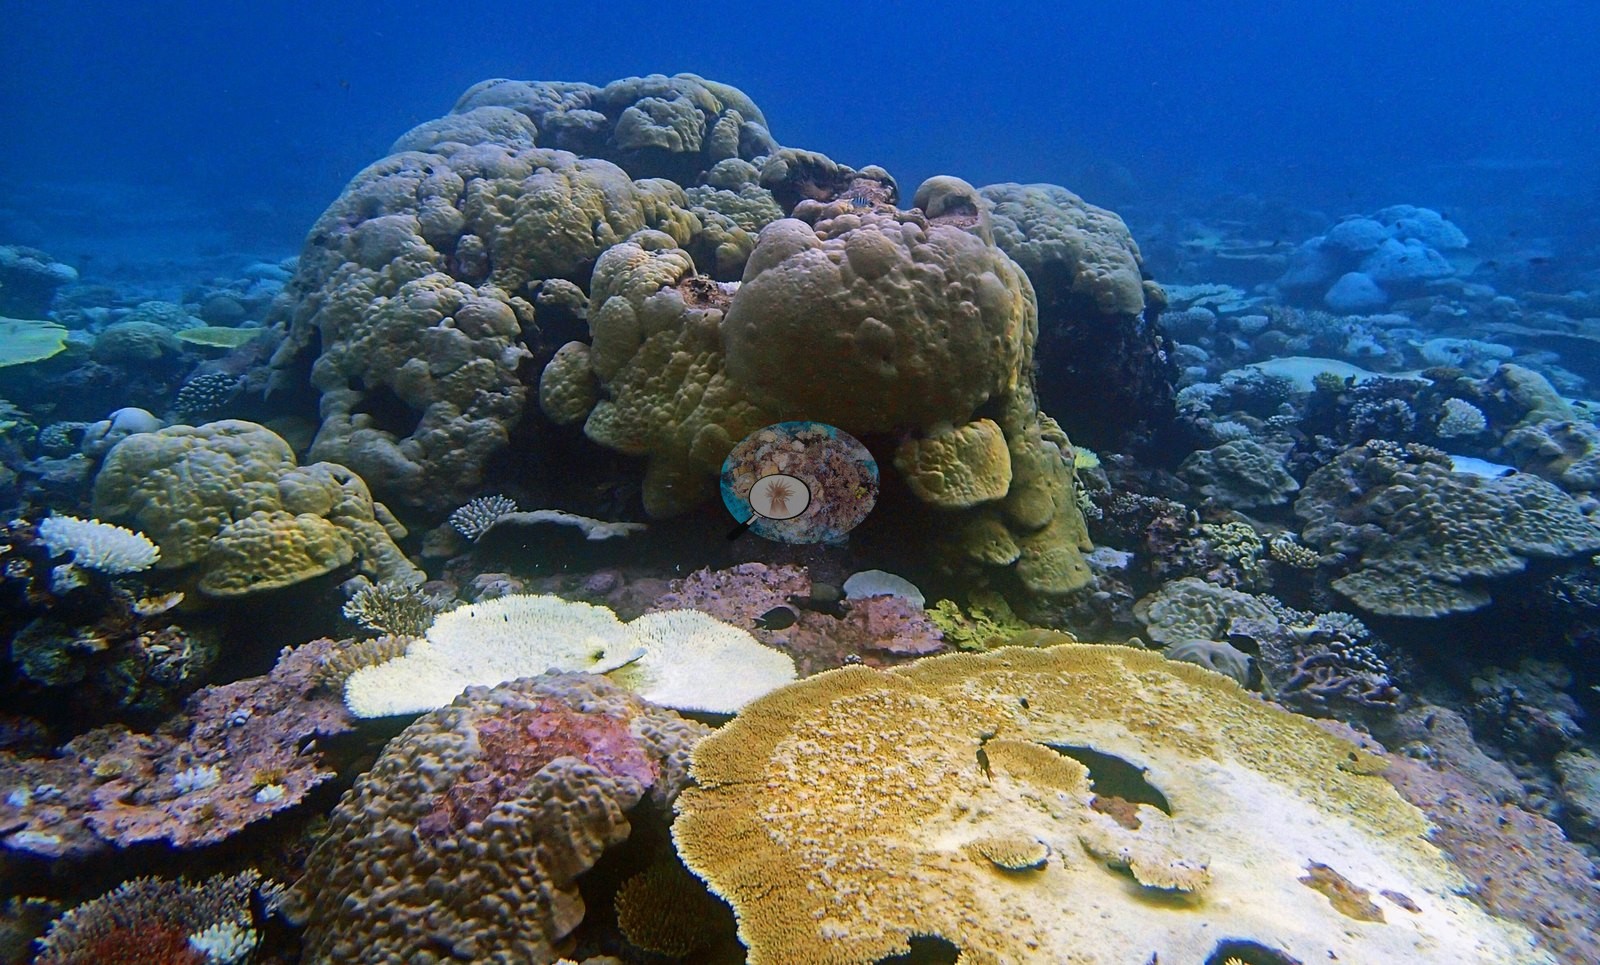
Below that sits an eleven-genus tail under 0.5%: Stylophora, Leptastrea, Goniastrea, Astreopora, Cyphastrea, Goniopora, Favites, Millepora, Platygyra, Psammocora, and Montastrea. Turf holds 16.1% of the benthos, bare substrate 13.3%, non-coral invertebrates 5.8%, crustose coralline algae 5.5%, erect algae 5.0%, and macroalgae 2.2%. Coral cover declines steadily with depth while the assemblage reorganizes completely. D2 carries 50.0% coral led by Acropora at 25.00% with Porites at 16.75%; D3 holds 38.2% with Acropora still dominant at 18.40%; D4 falls to 37.0% and Symphyllia rises to 9.00% behind Acropora's 16.00%; and D5 drops to 32.0% and Acropora is displaced entirely — Favia leads at 9.00%, then Echinopora 8.00%, Acropora 6.00%, and Herpolitha 3.00%, with algal cover jumping to 60.0%. Genus richness peaks in the middle at 17 codes on D3 against six on both D4 and D5. The site-level figures therefore average a shallow Acropora reef onto a deep faviid-and-Echinopora one and should not be quoted without the depth breakdown. Broad plates project over lower colonies, corymbose and branching forms fill intervening spaces, and massive colonies form large rounded buttresses (e.g., Image 10, Image 15, Image 16, Image 19, Image 42, Image 48).
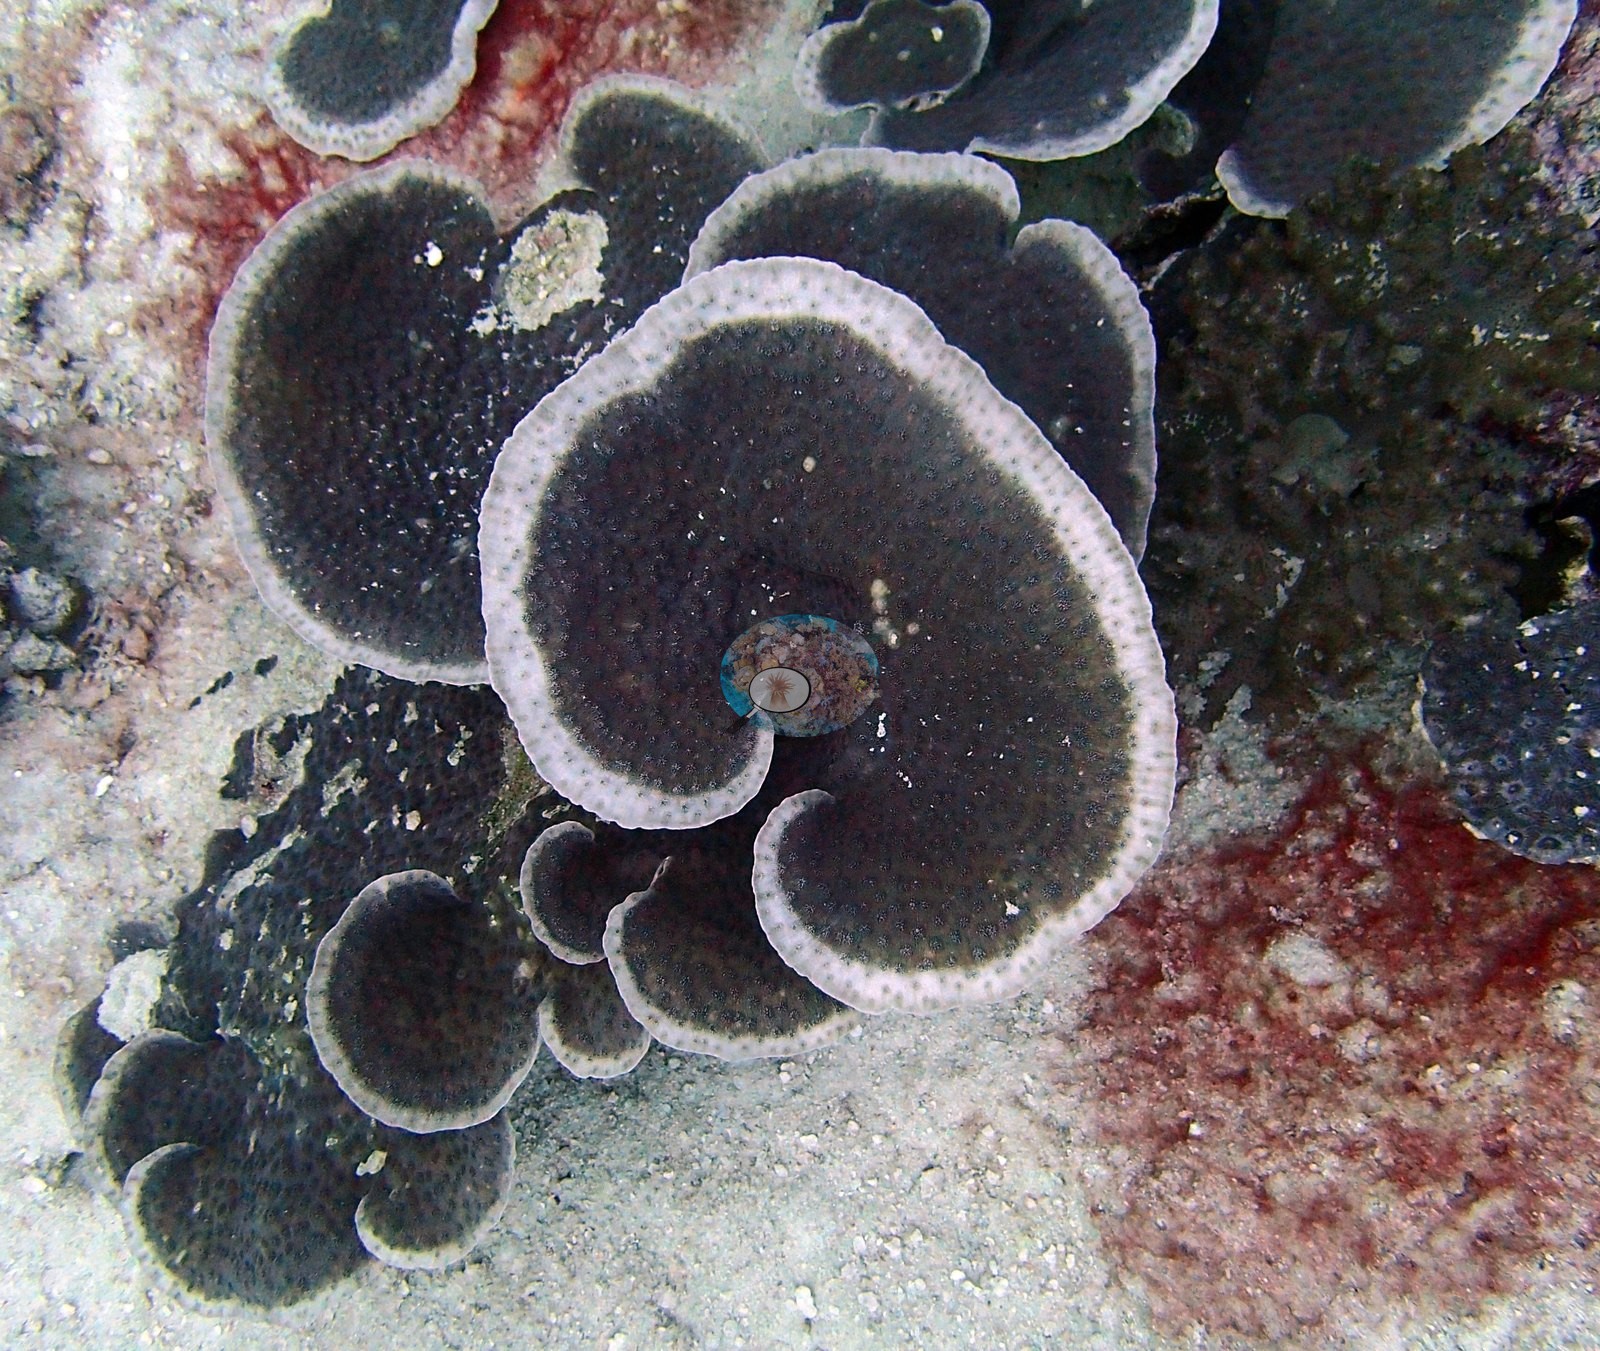
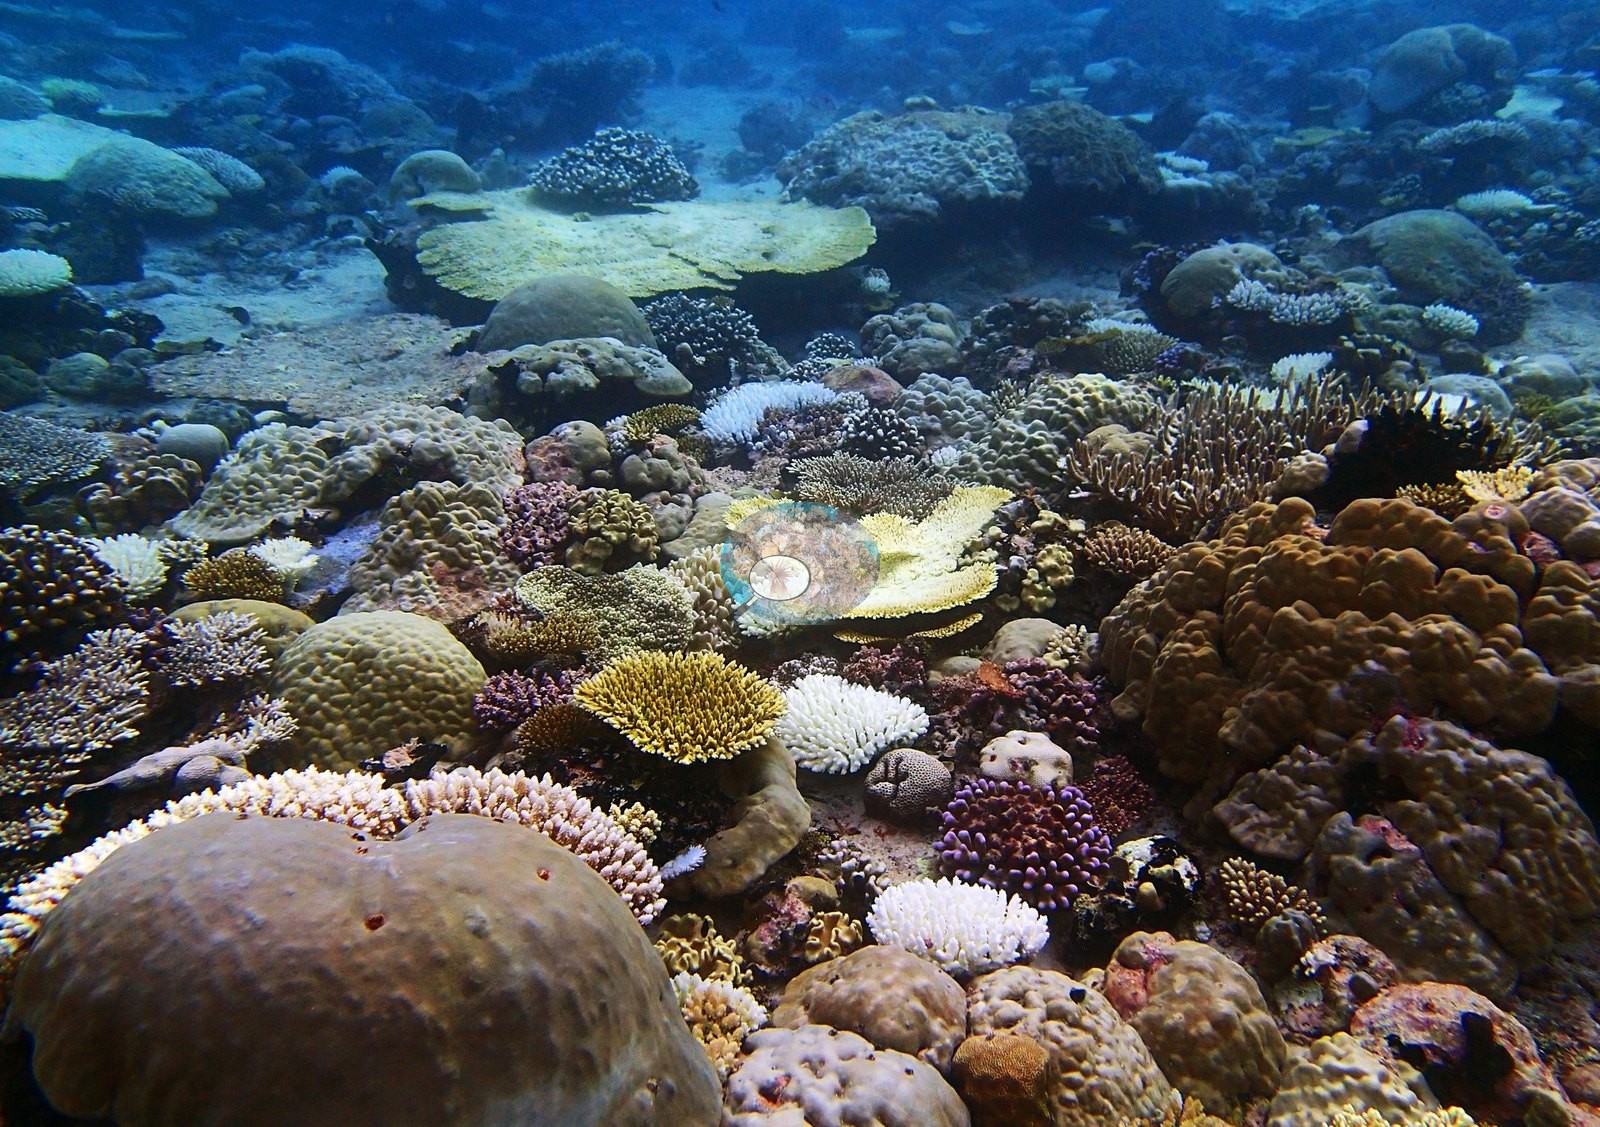
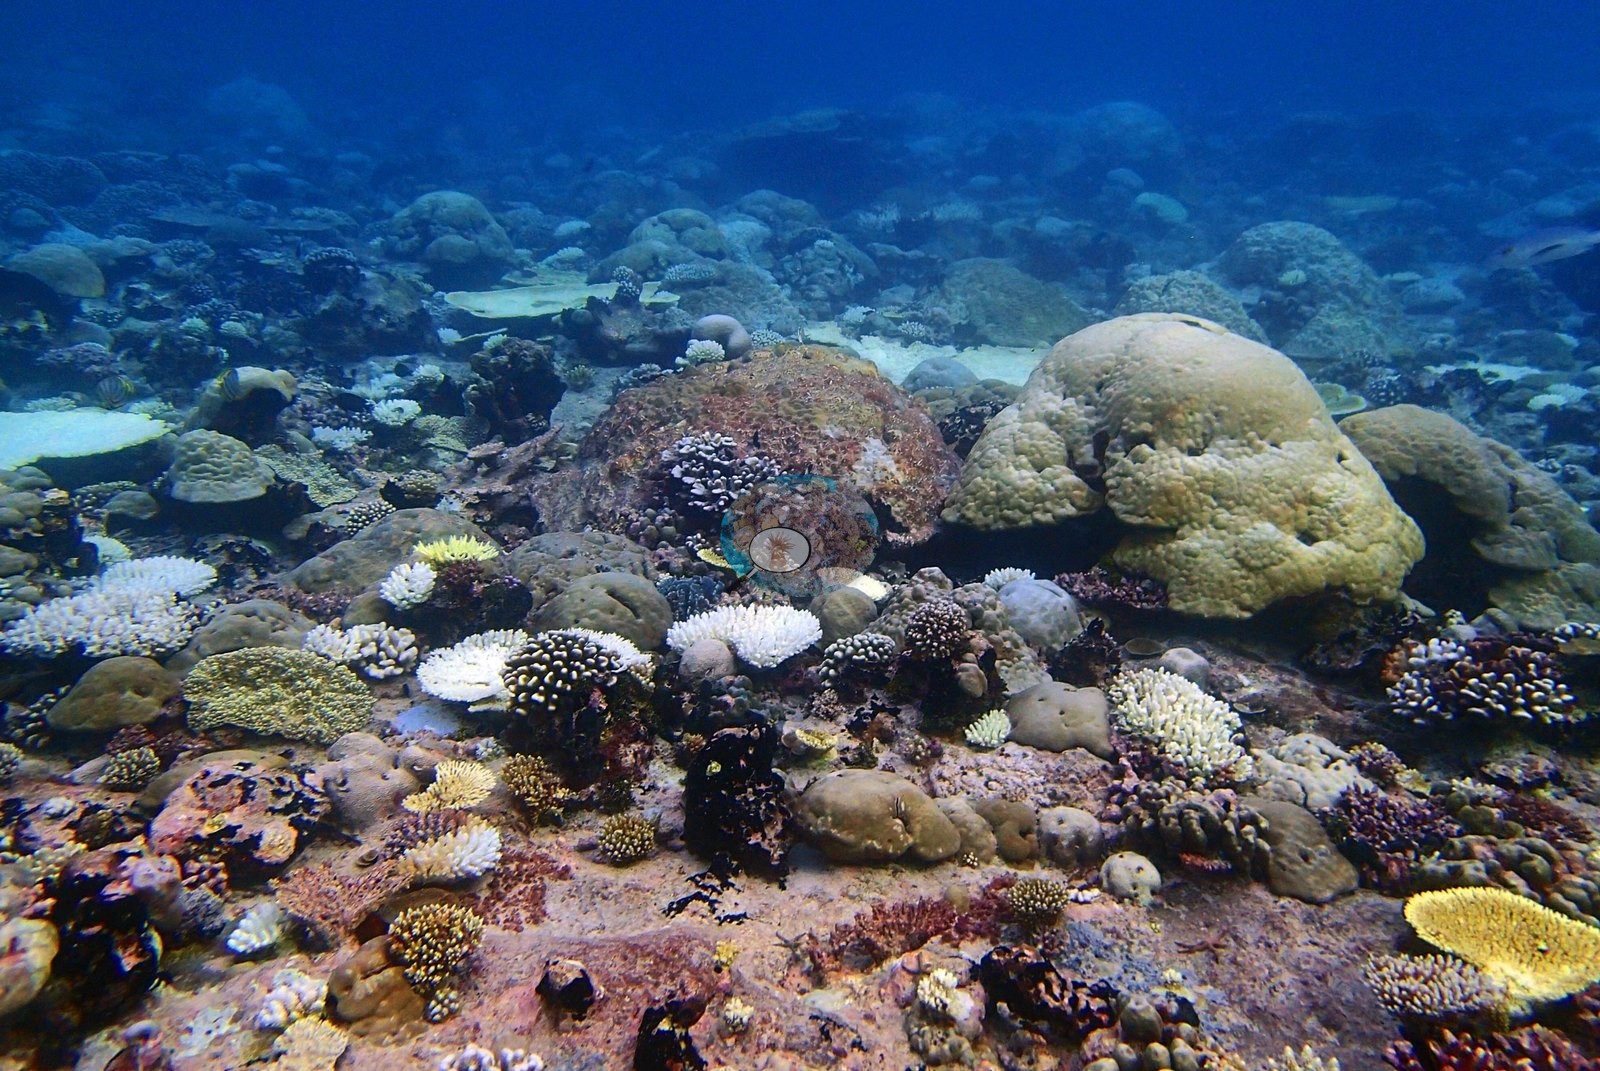
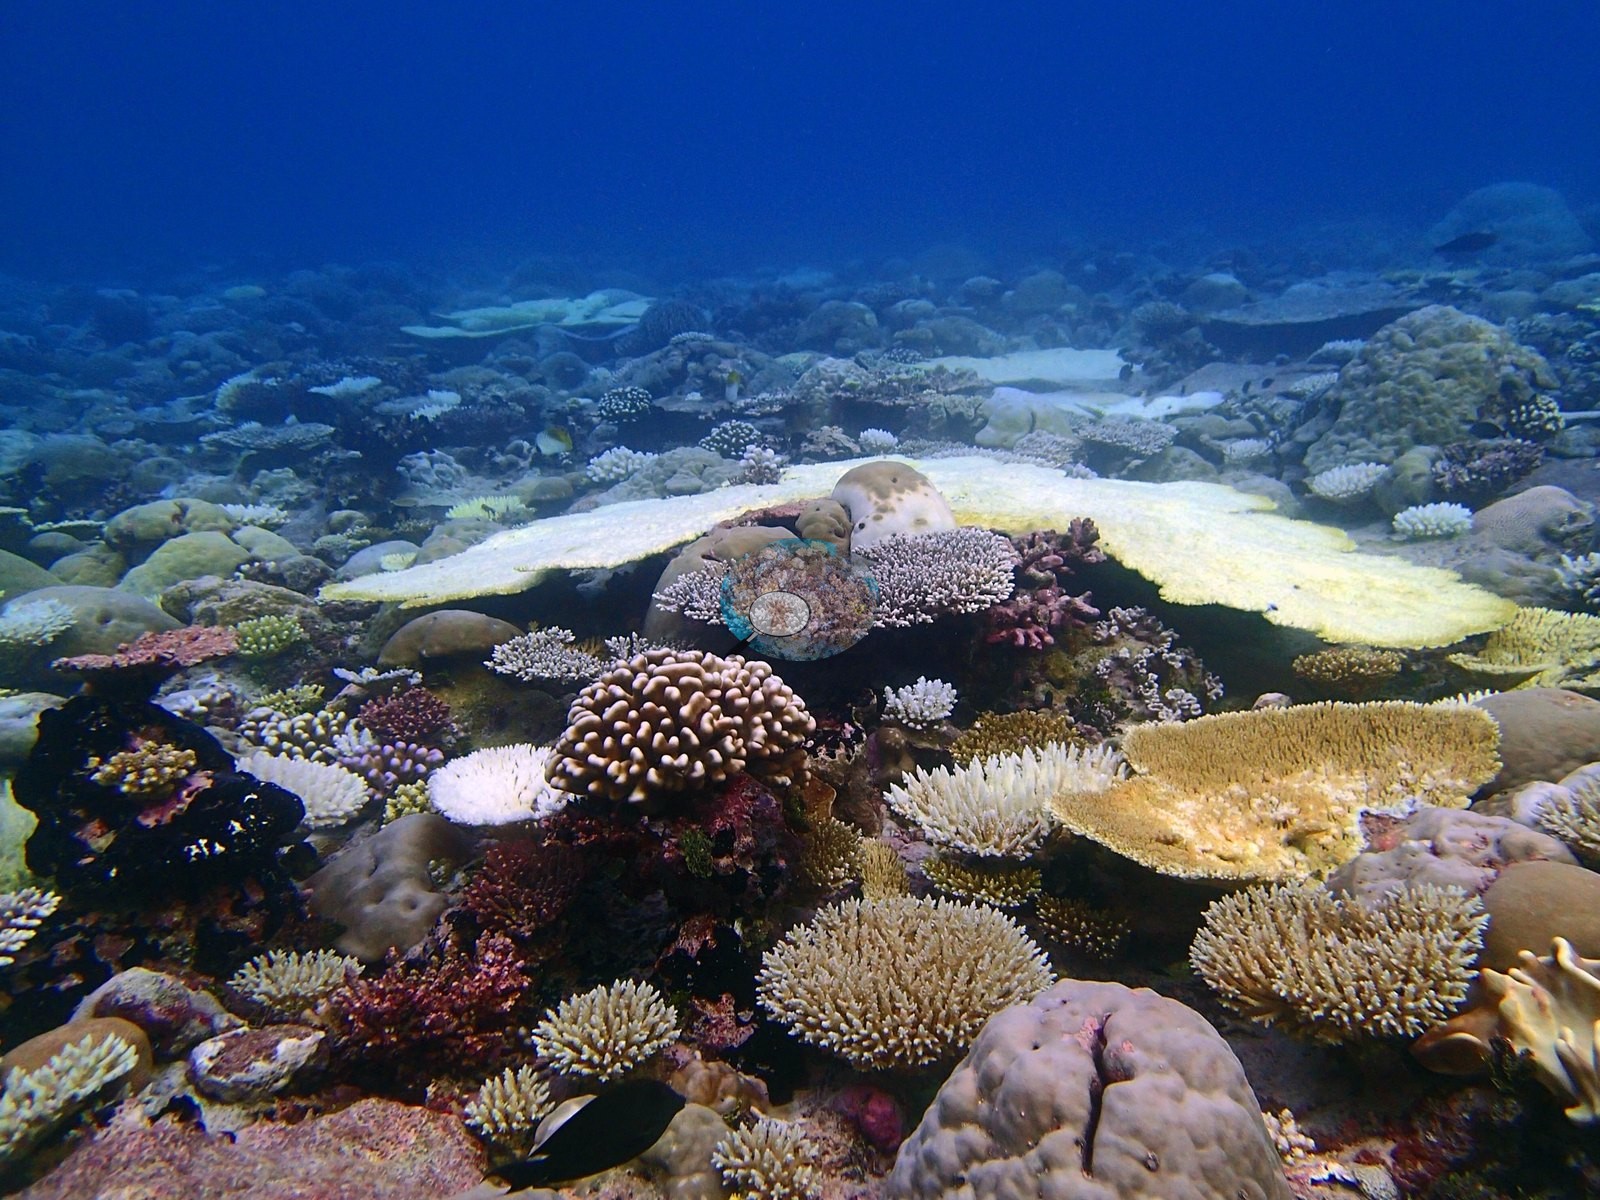
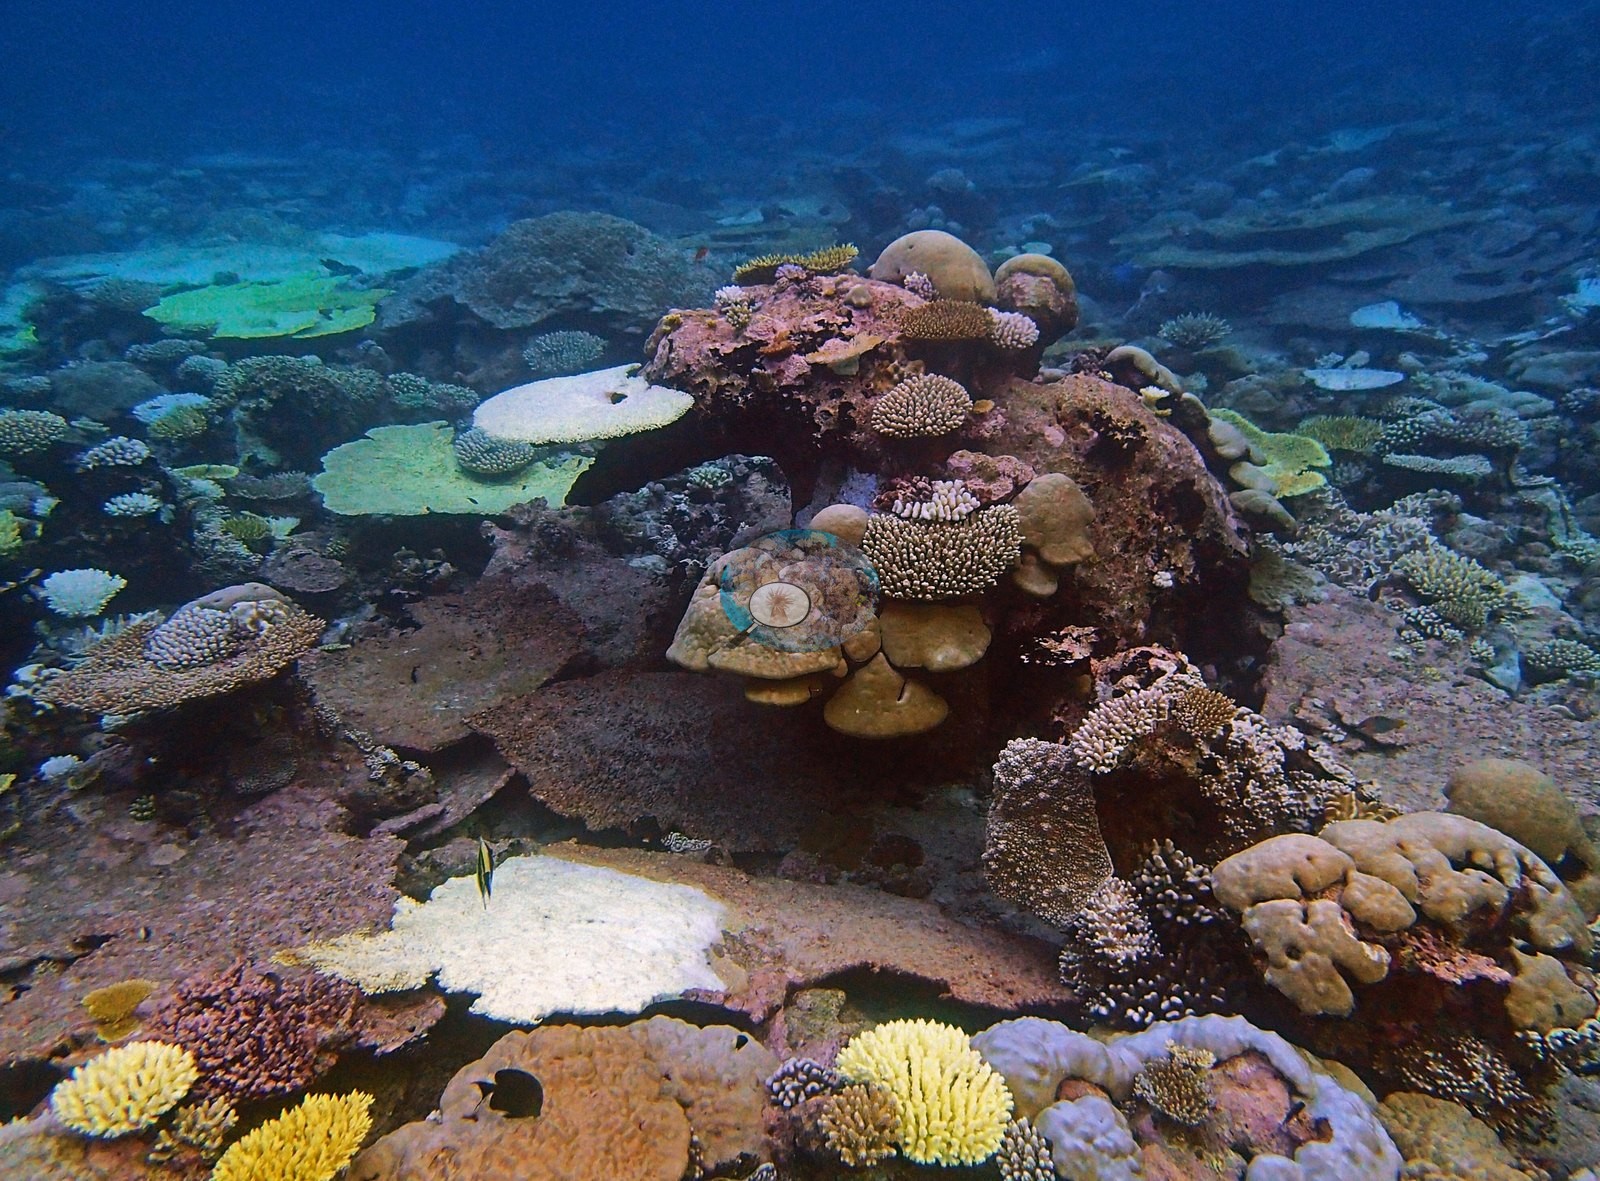
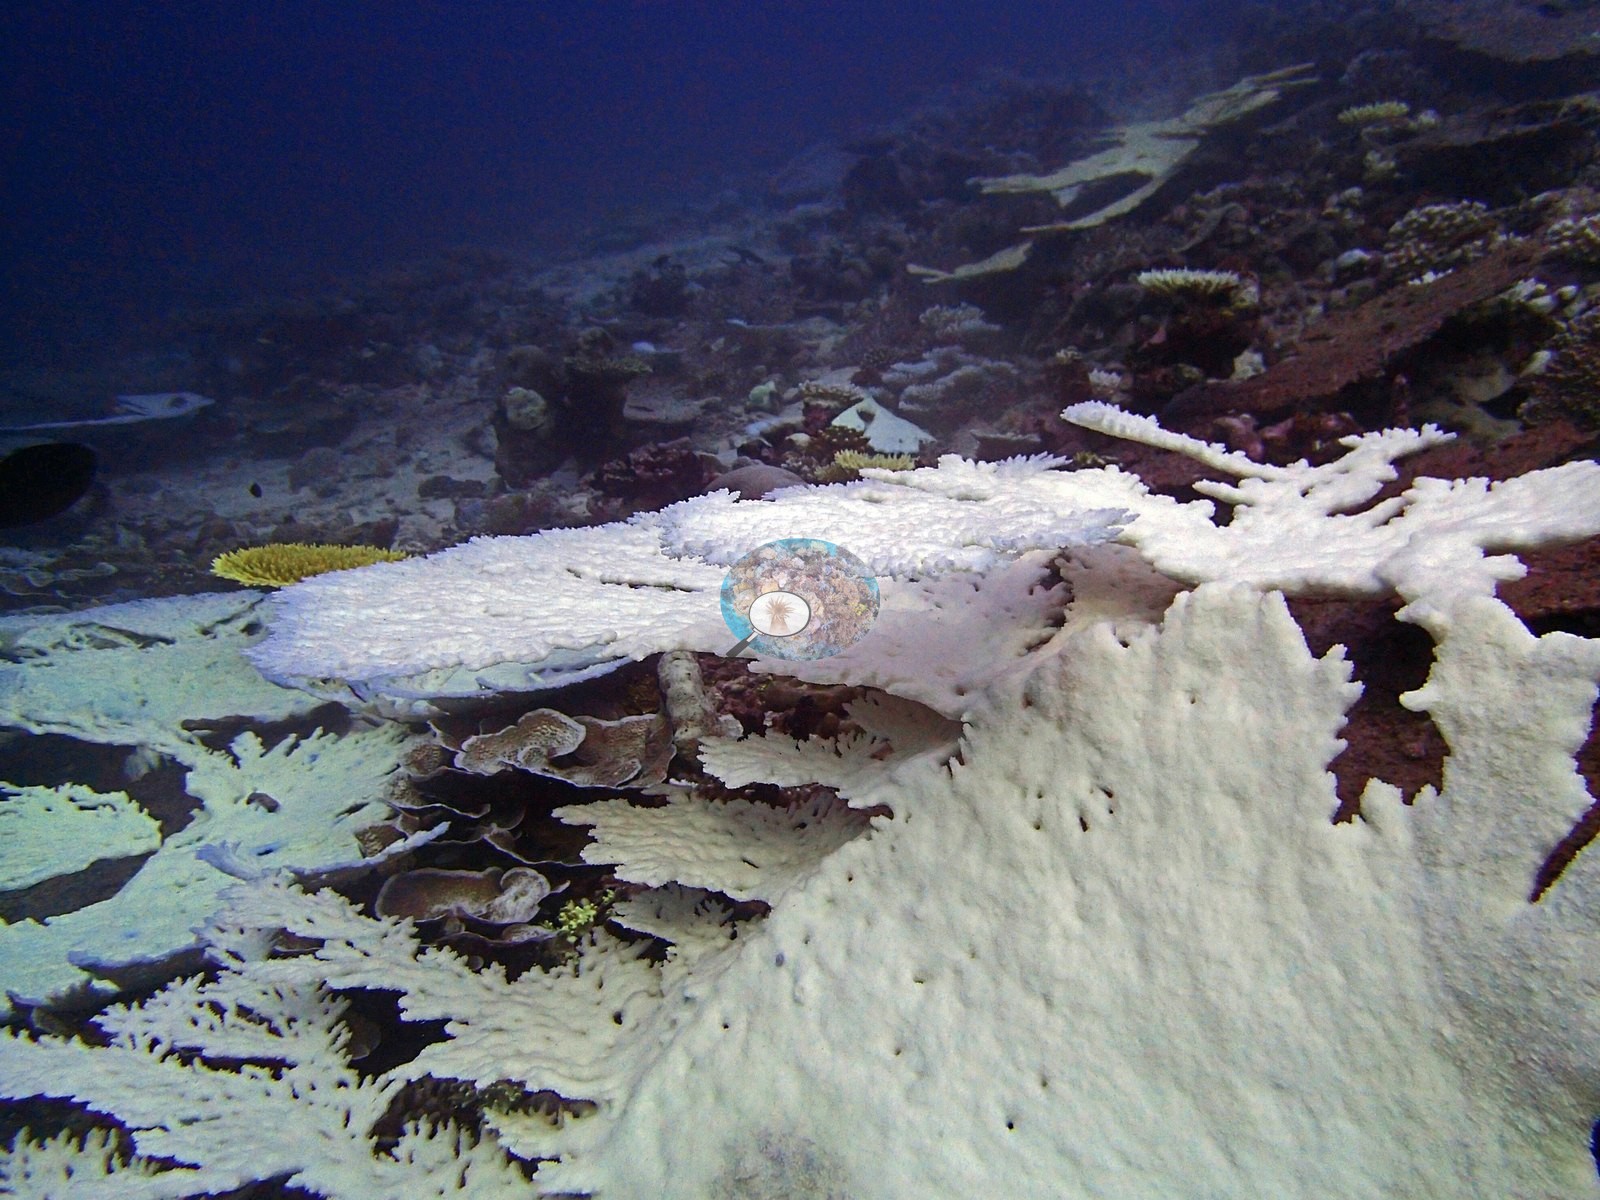
One frame is especially informative: several pale tables overlap like shelves above darker plates and encrusted framework (e.g., Image 5).
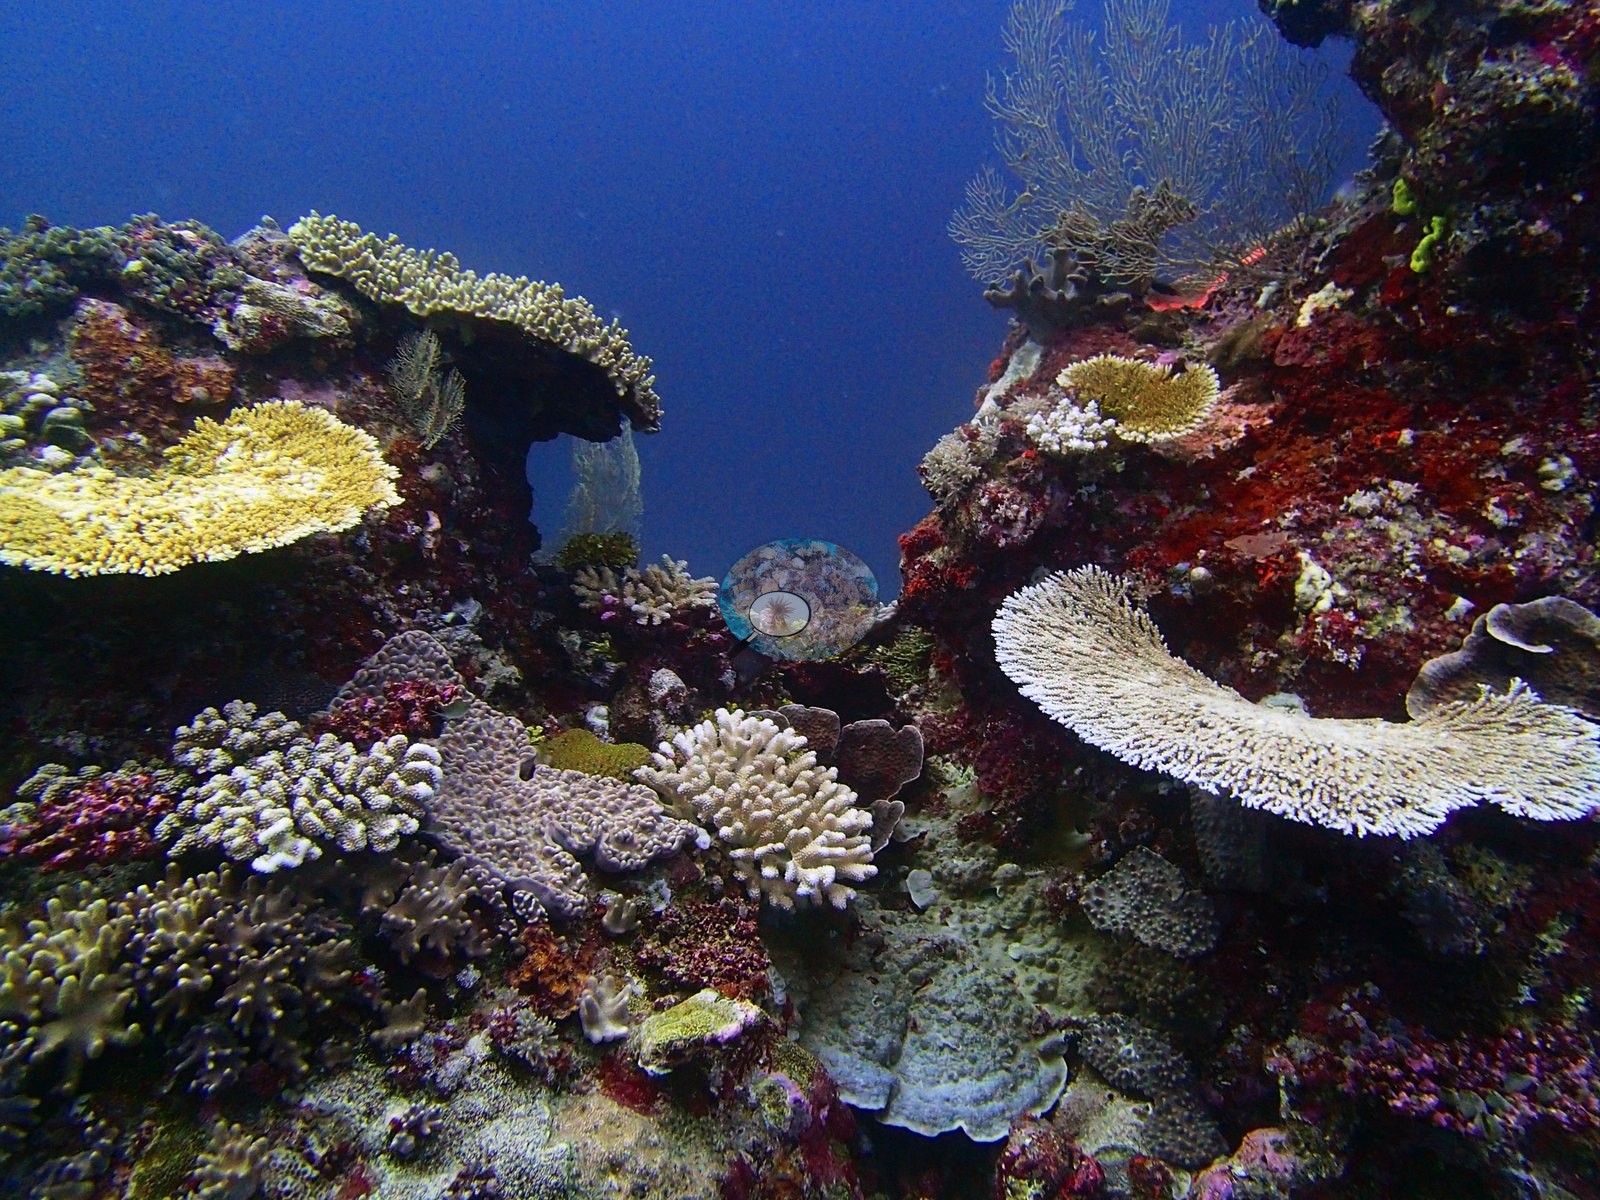
Two more frames show the same multi-tiered architecture at wider scale, with live colonies distributed across an irregular surface rather than concentrated in one isolated patch (e.g., Image 8, Image 17, Image 31, Image 32, Image 39).
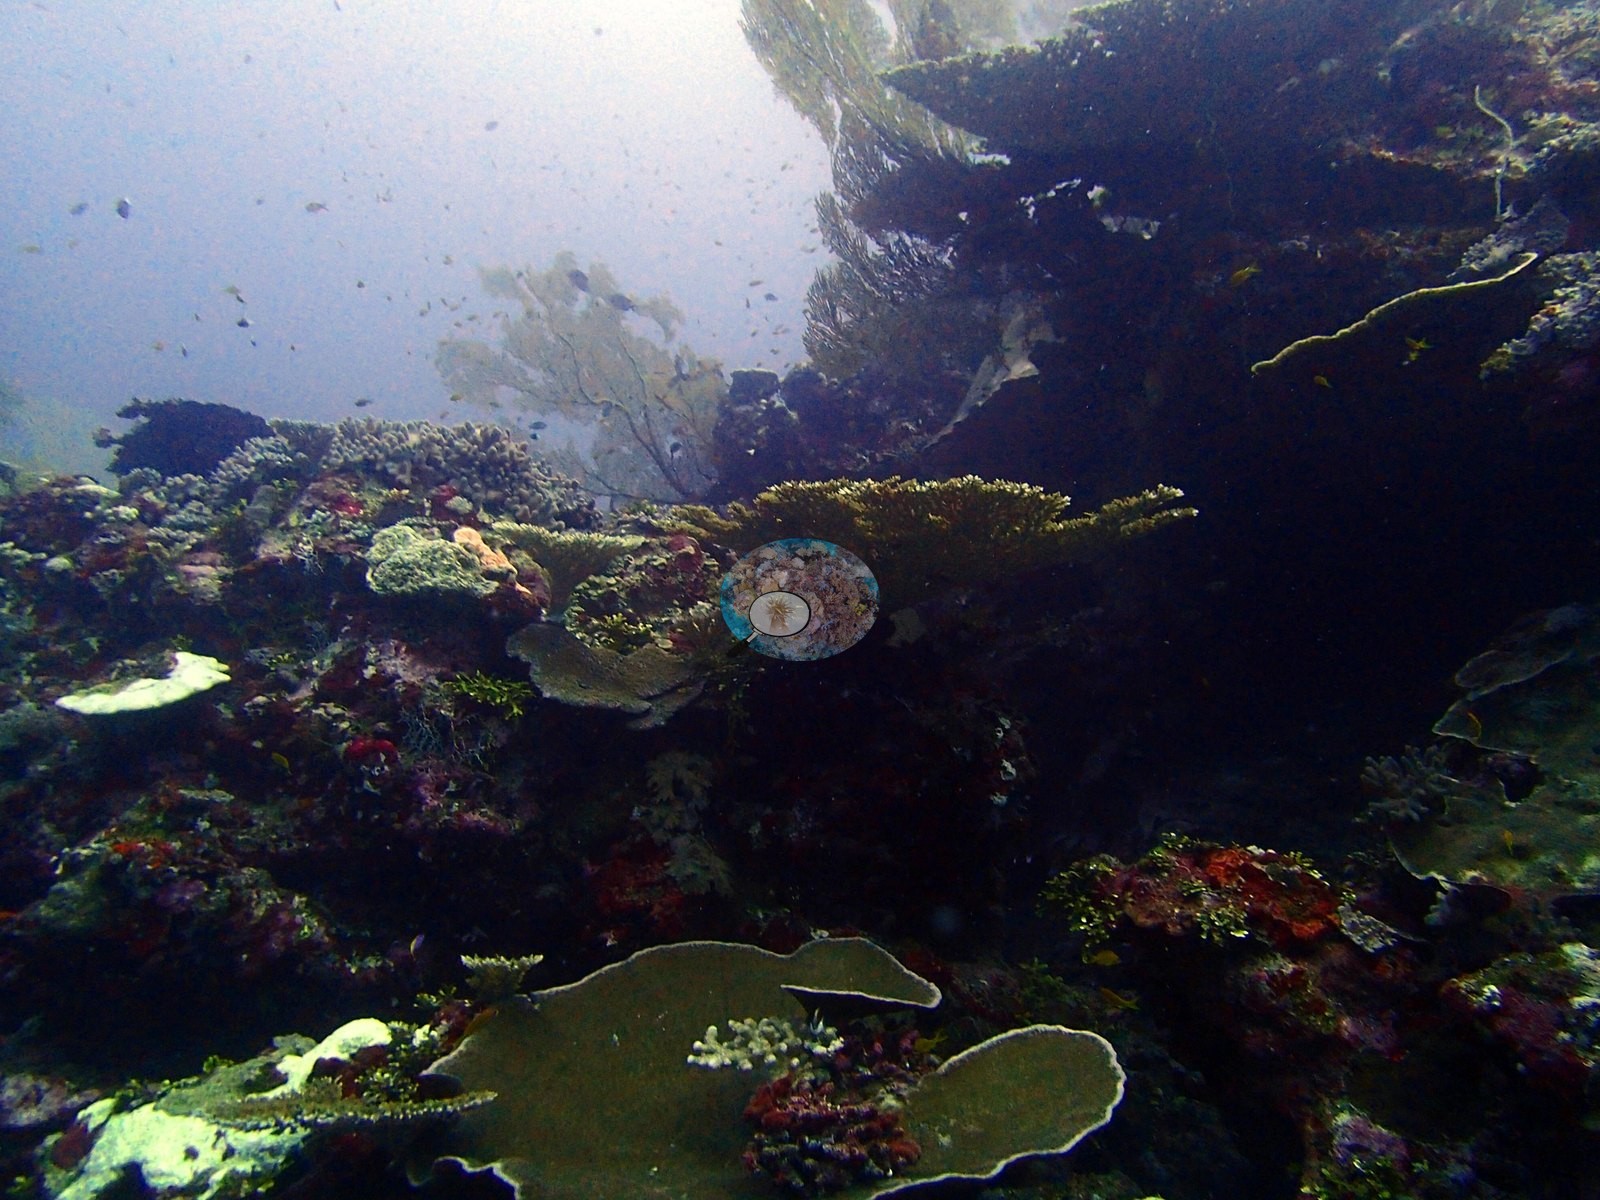
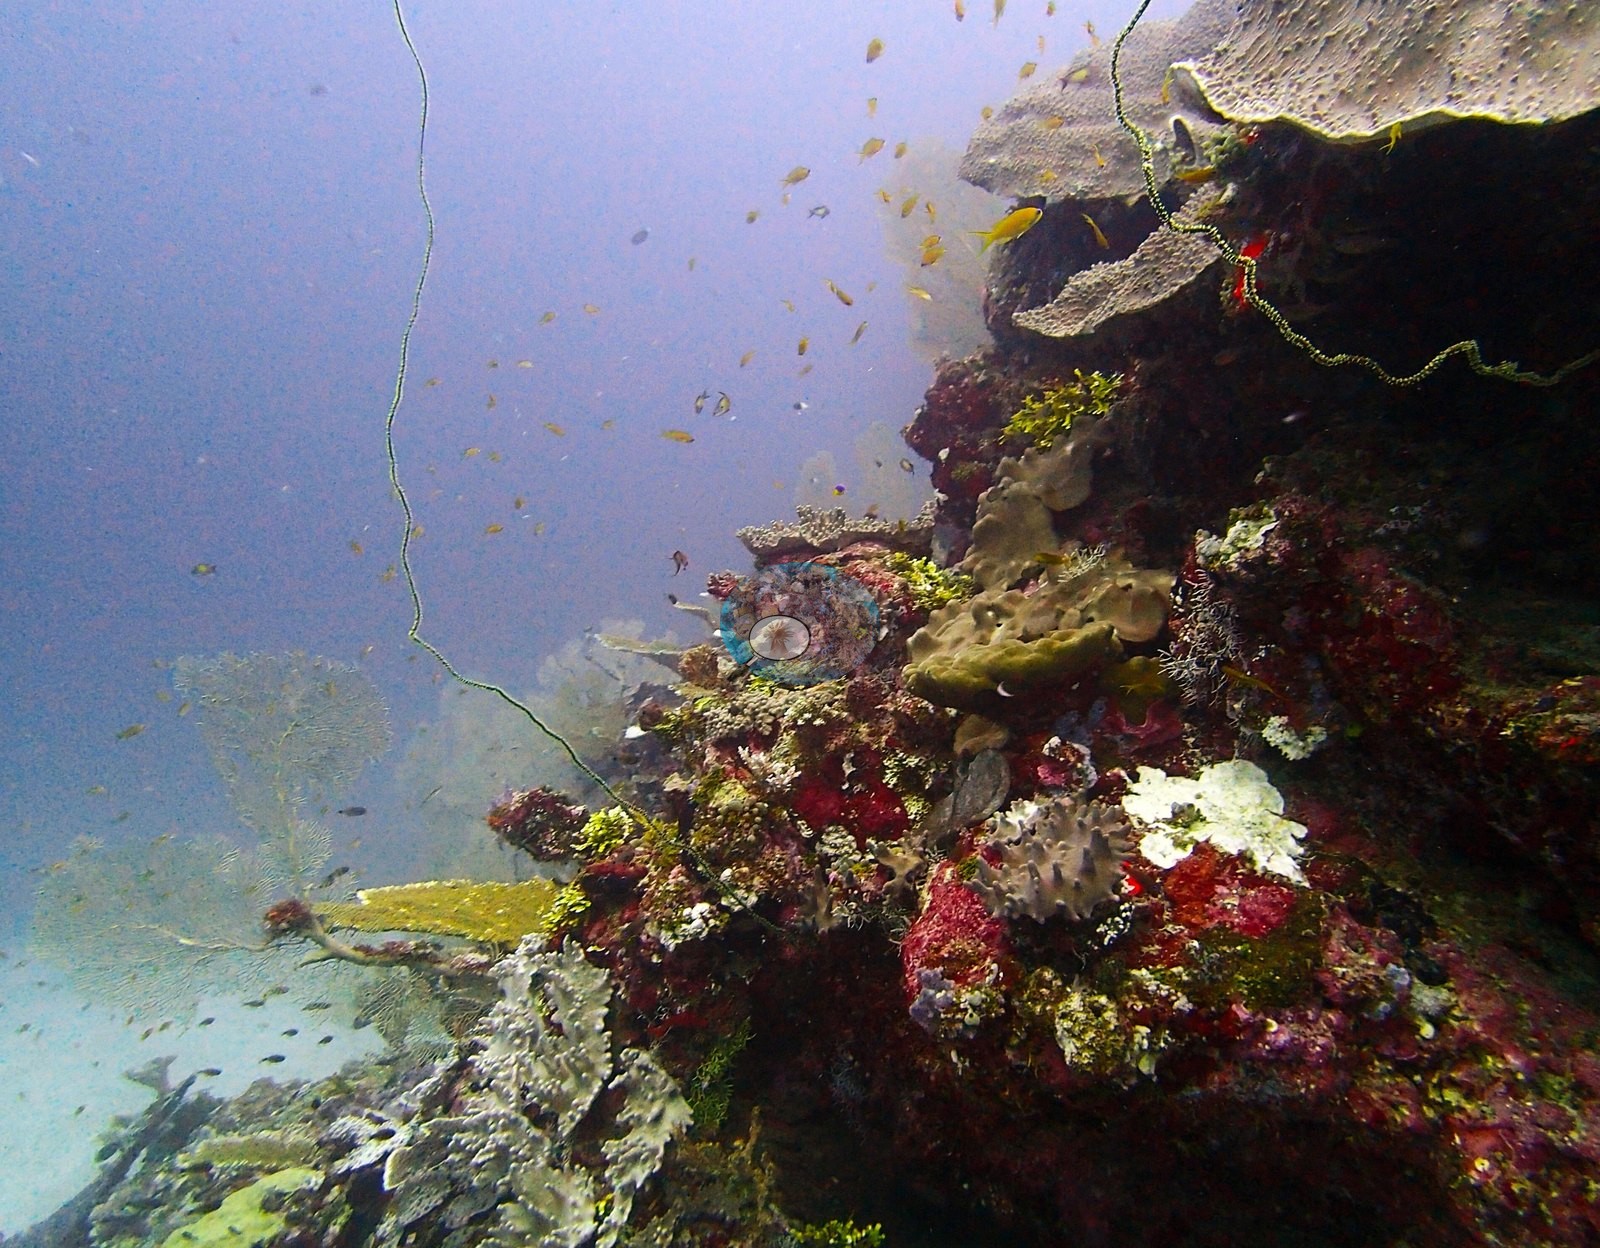
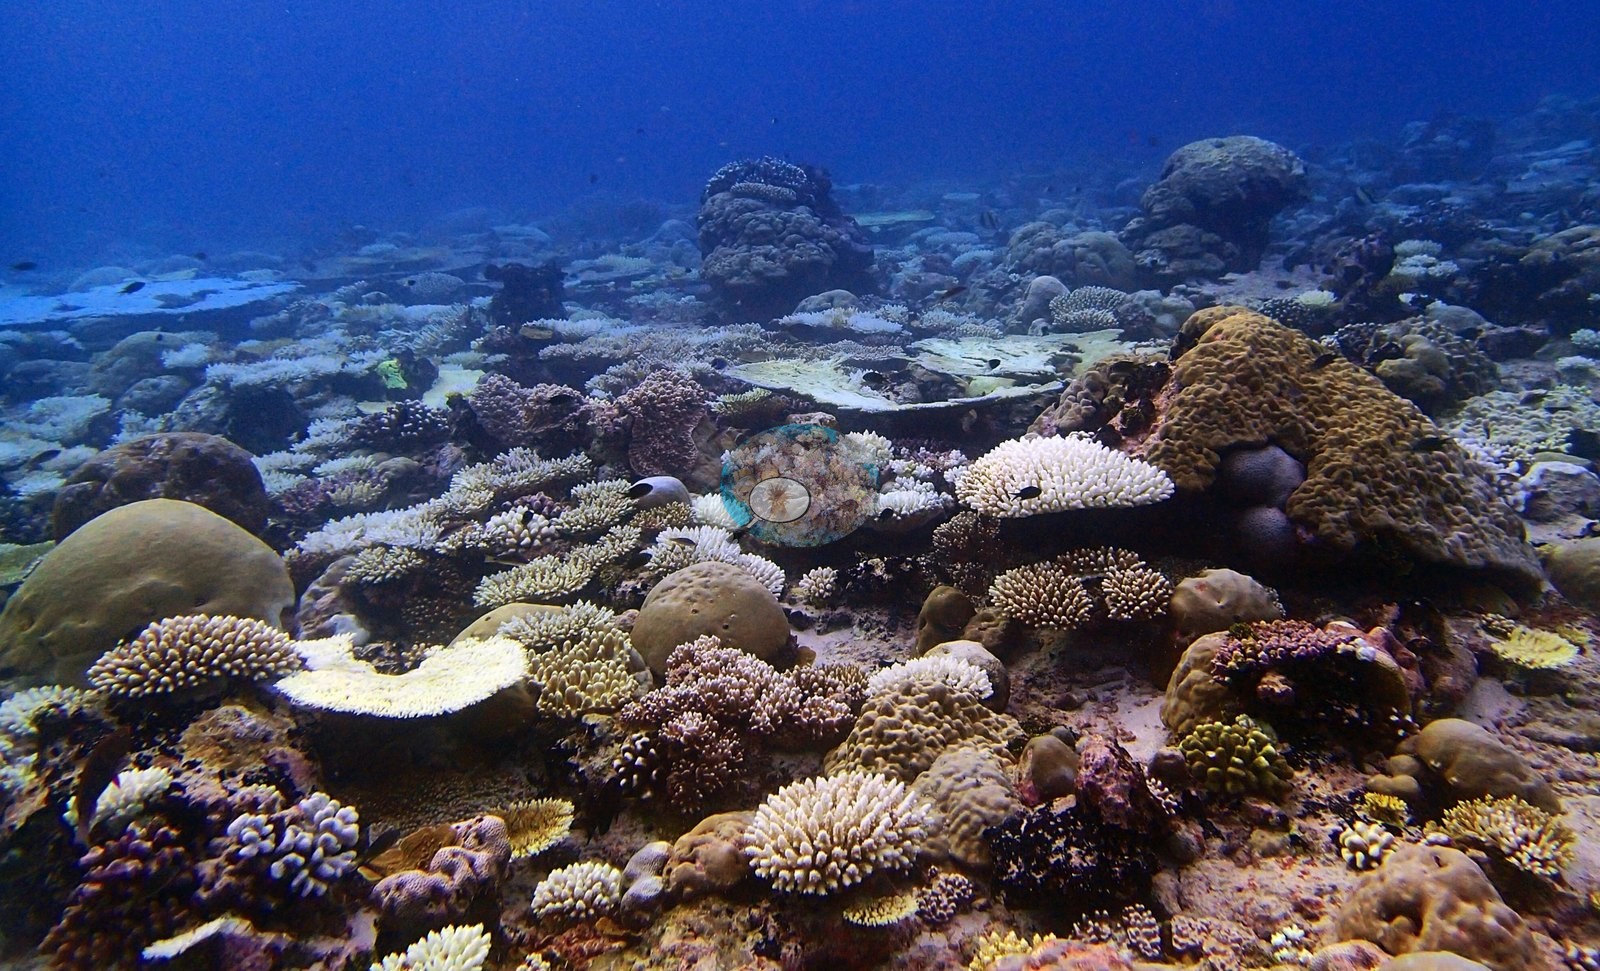
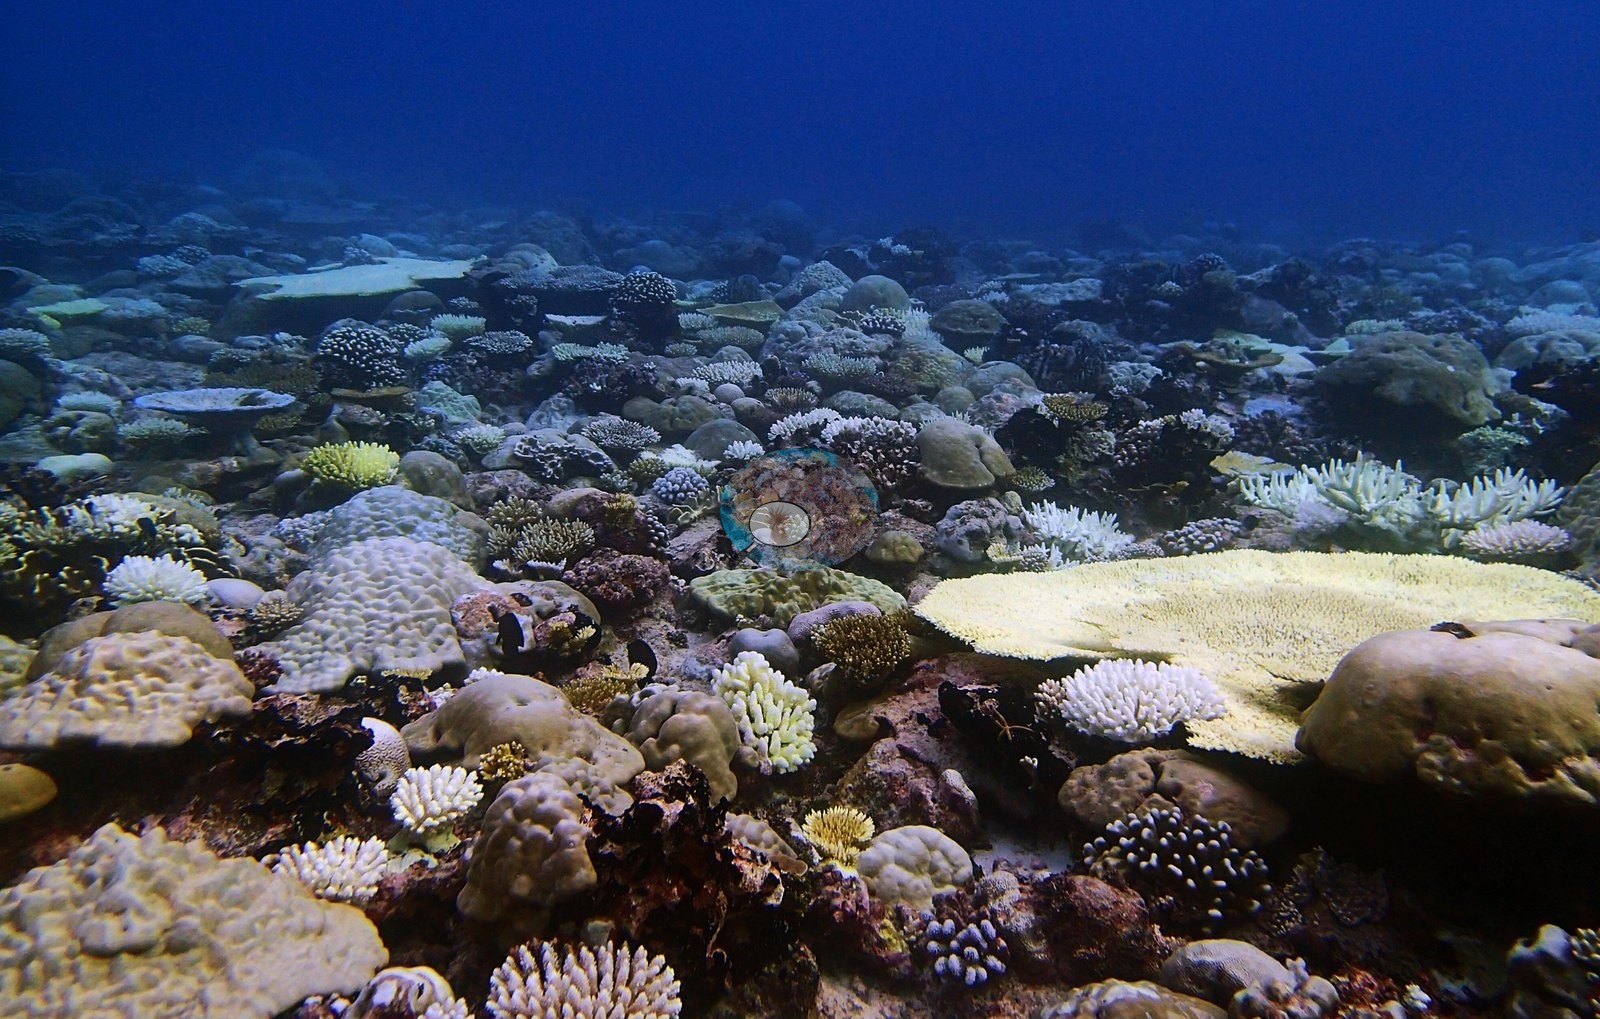
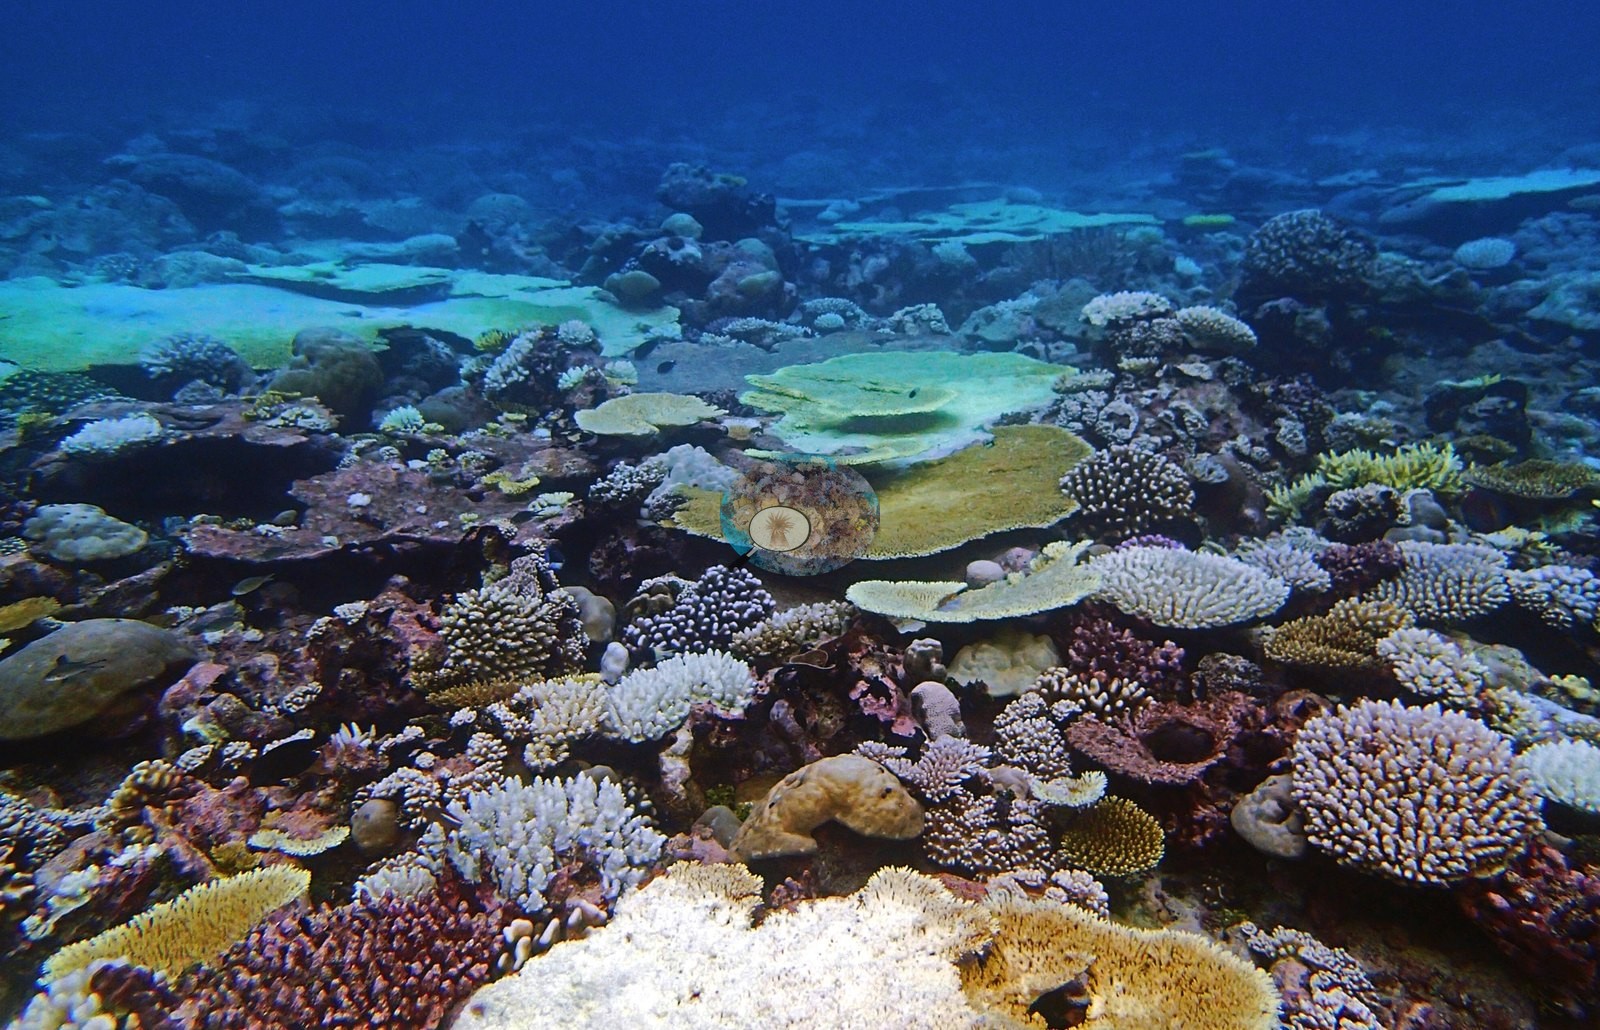
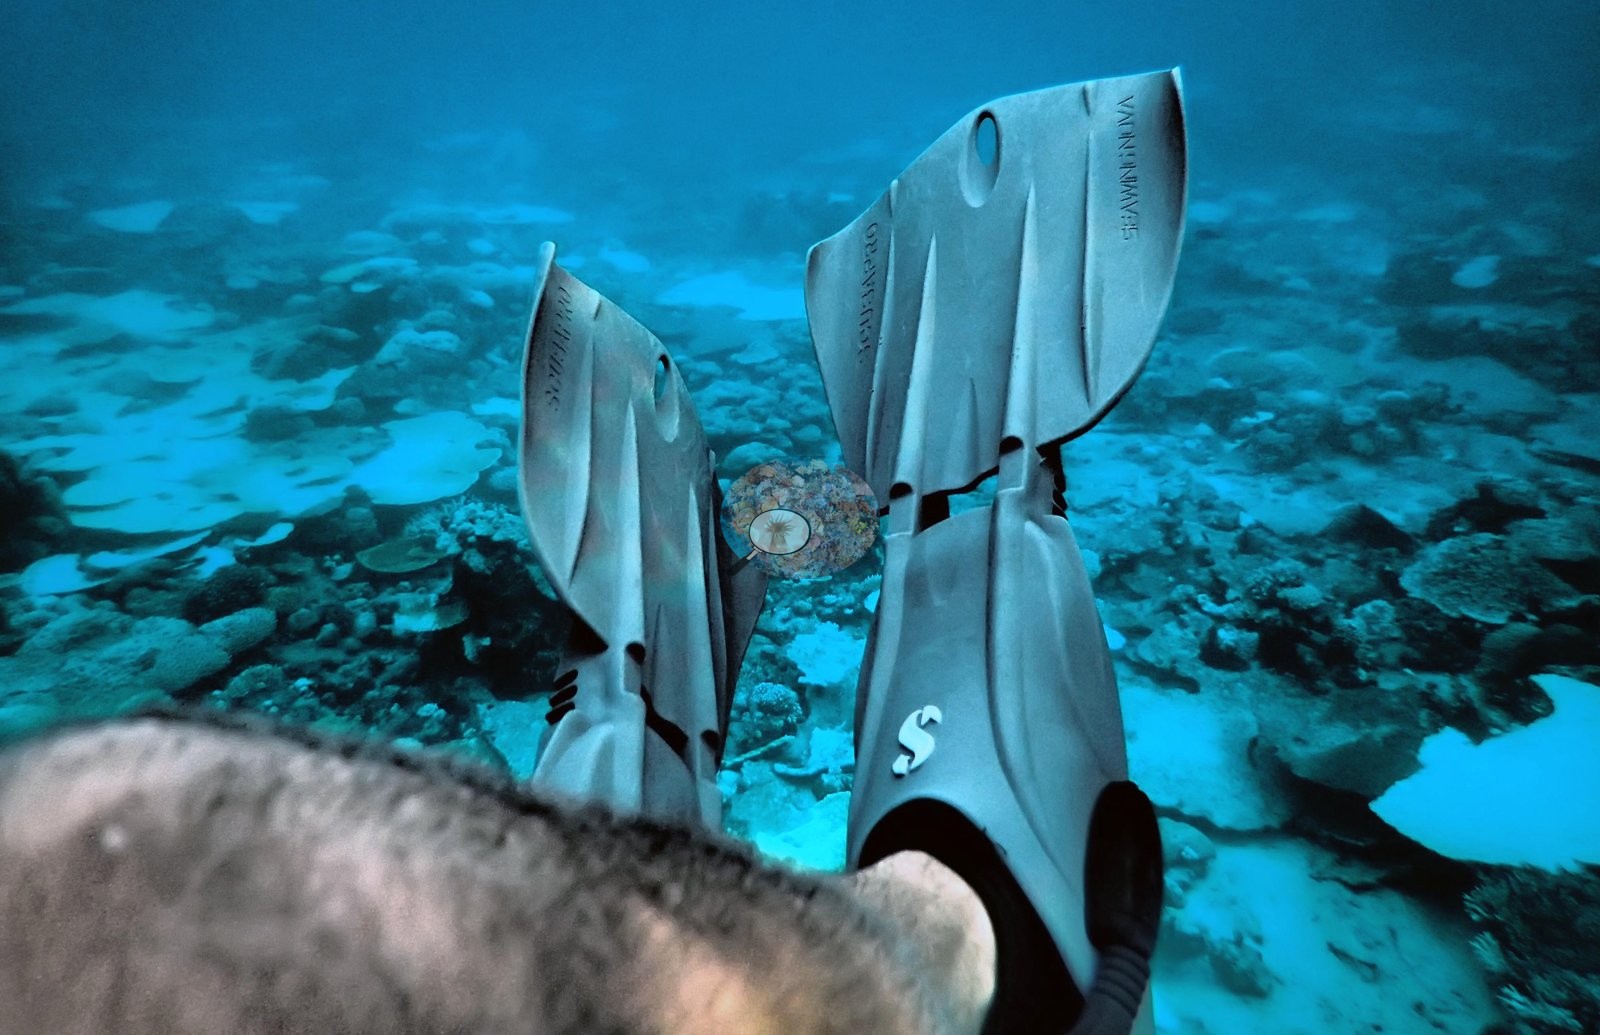
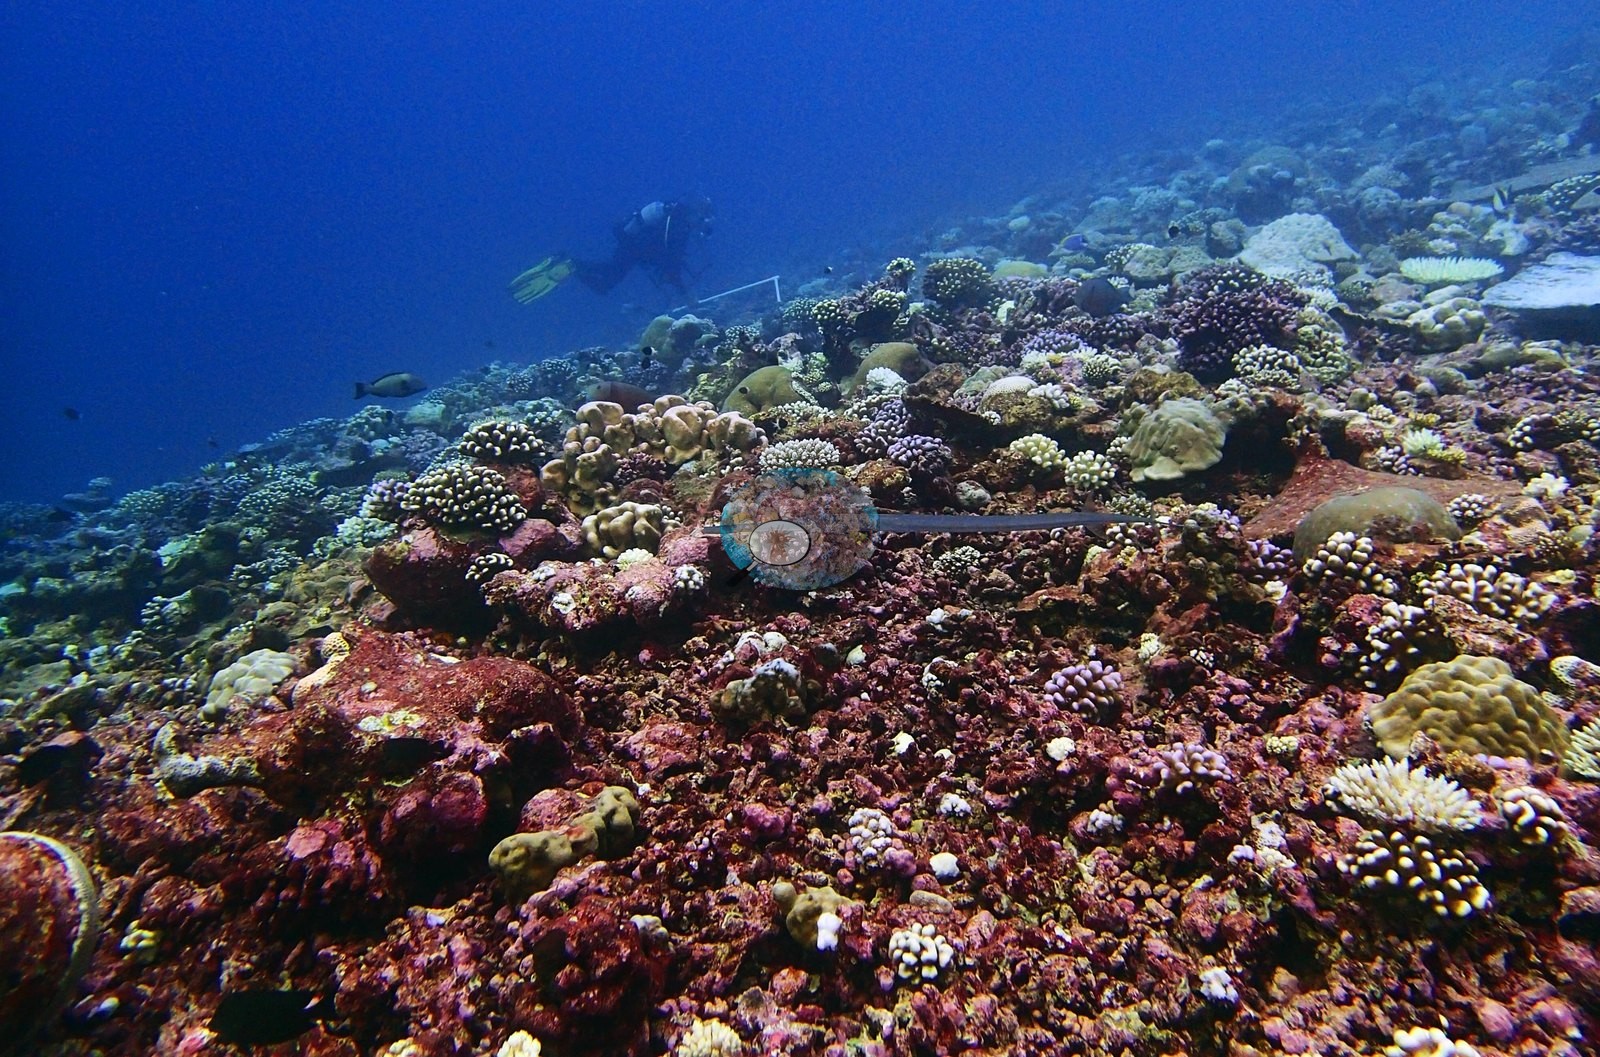
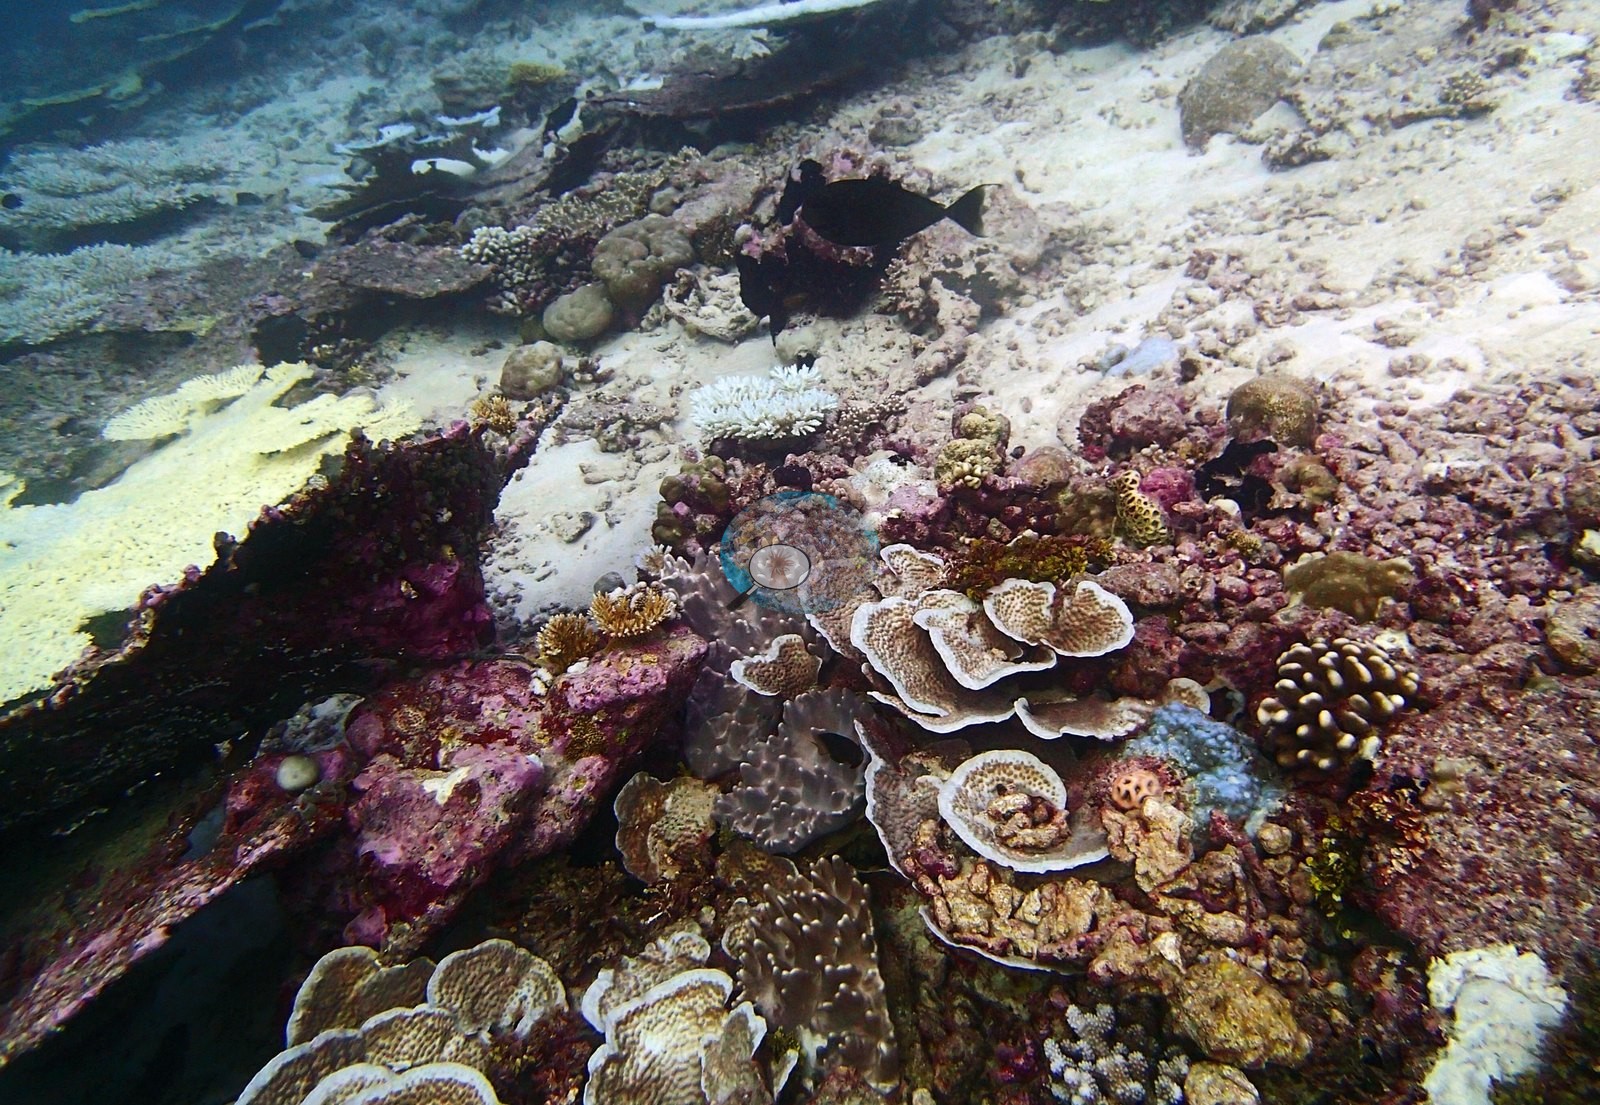
One frame establishes a mixed hard-bottom mosaic with sand-filled gaps (e.g., Image 2, Image 12) and another records the broader broken relief (e.g., Image 49).
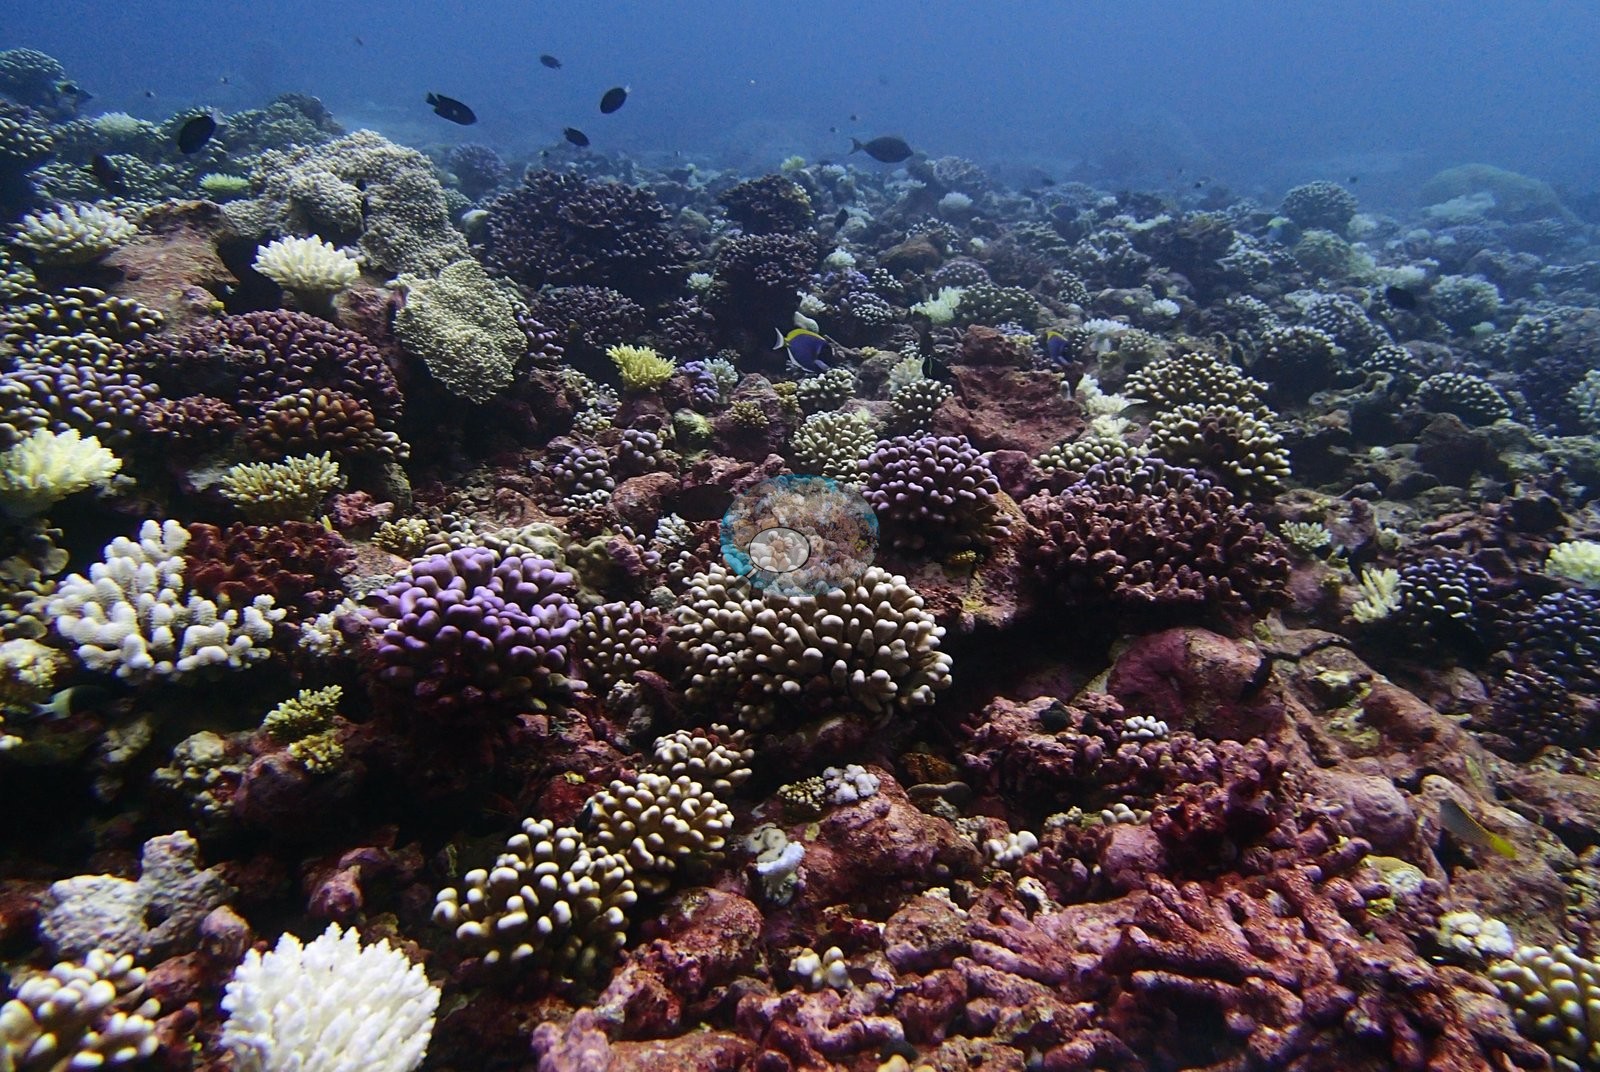
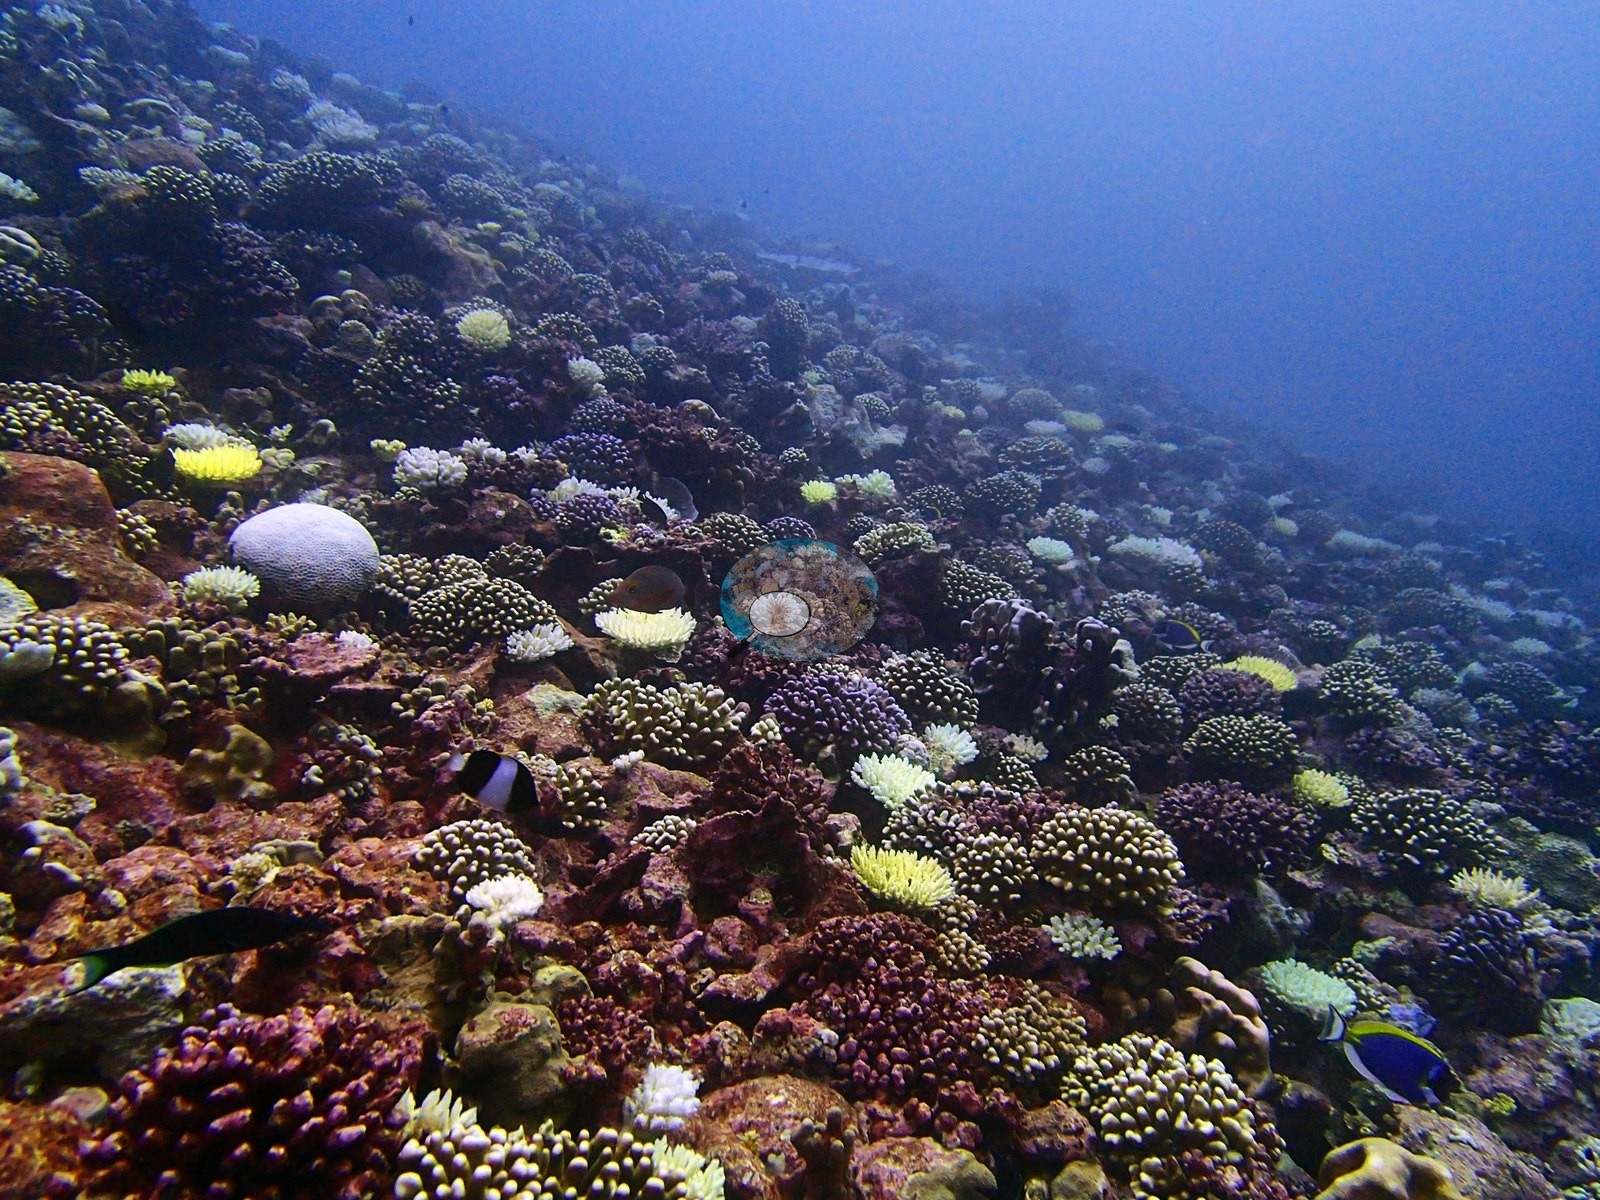
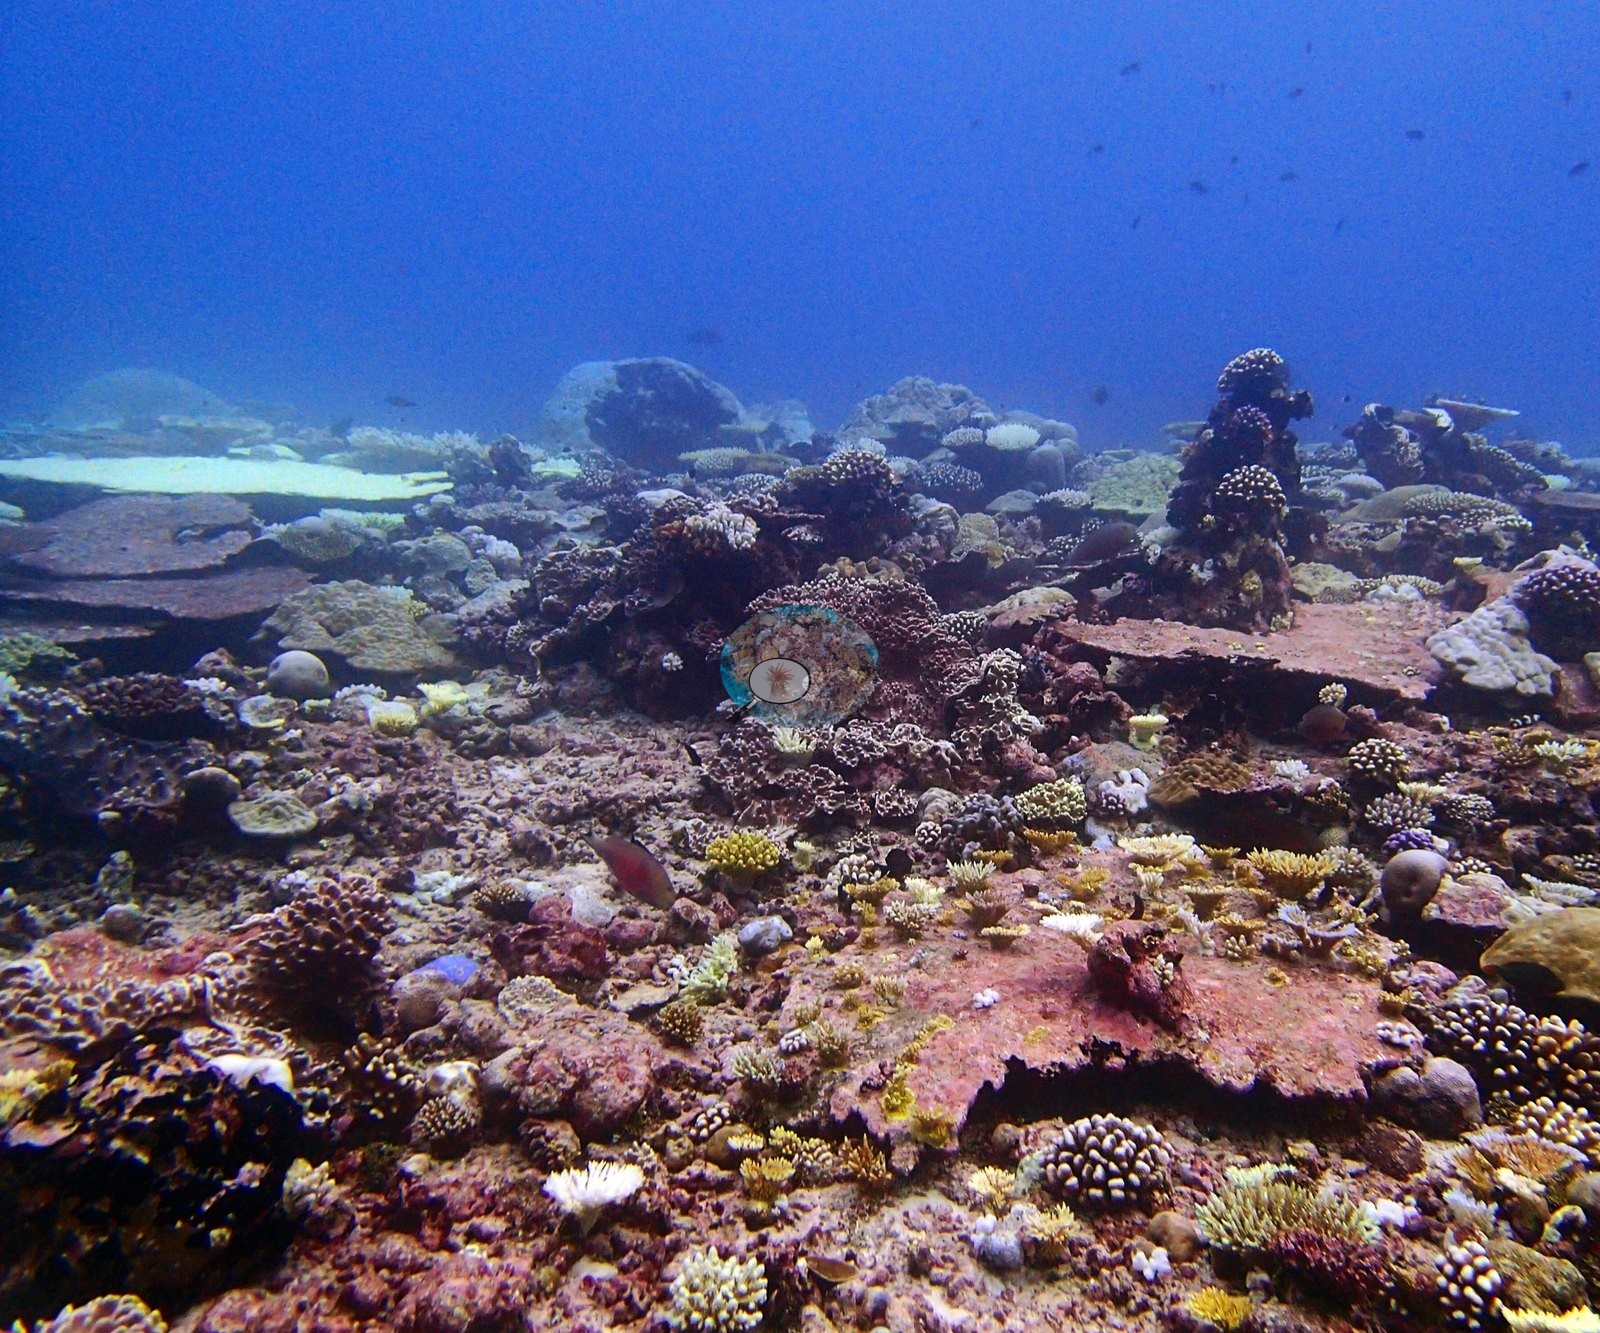
Sand occupies channels and pockets but does not break the continuity of coral habitat along much of the photographed route (e.g., Image 3).
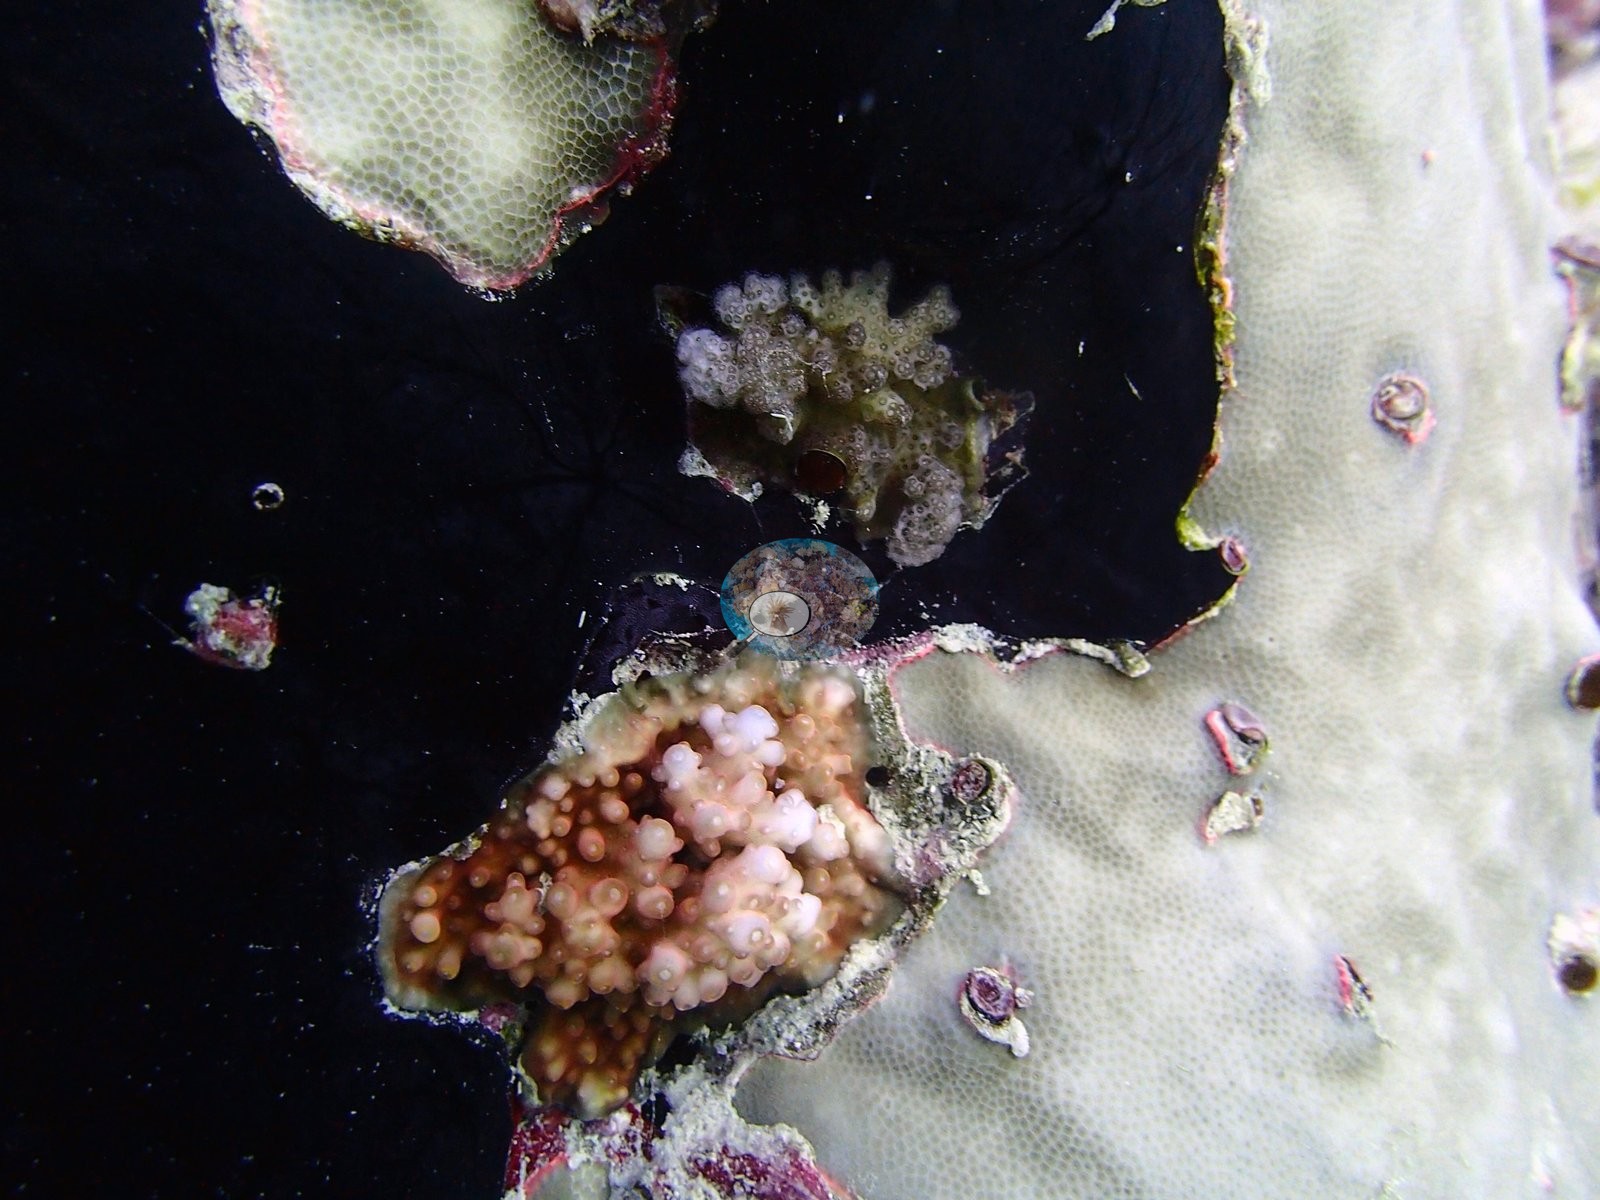
Encrusting red and purple surfaces are common on exposed framework (e.g., Image 7, Image 11), small rounded and meandroid colonies occur beside the larger tables (e.g., Image 29), and reef fishes occupy both the water column and crevices.
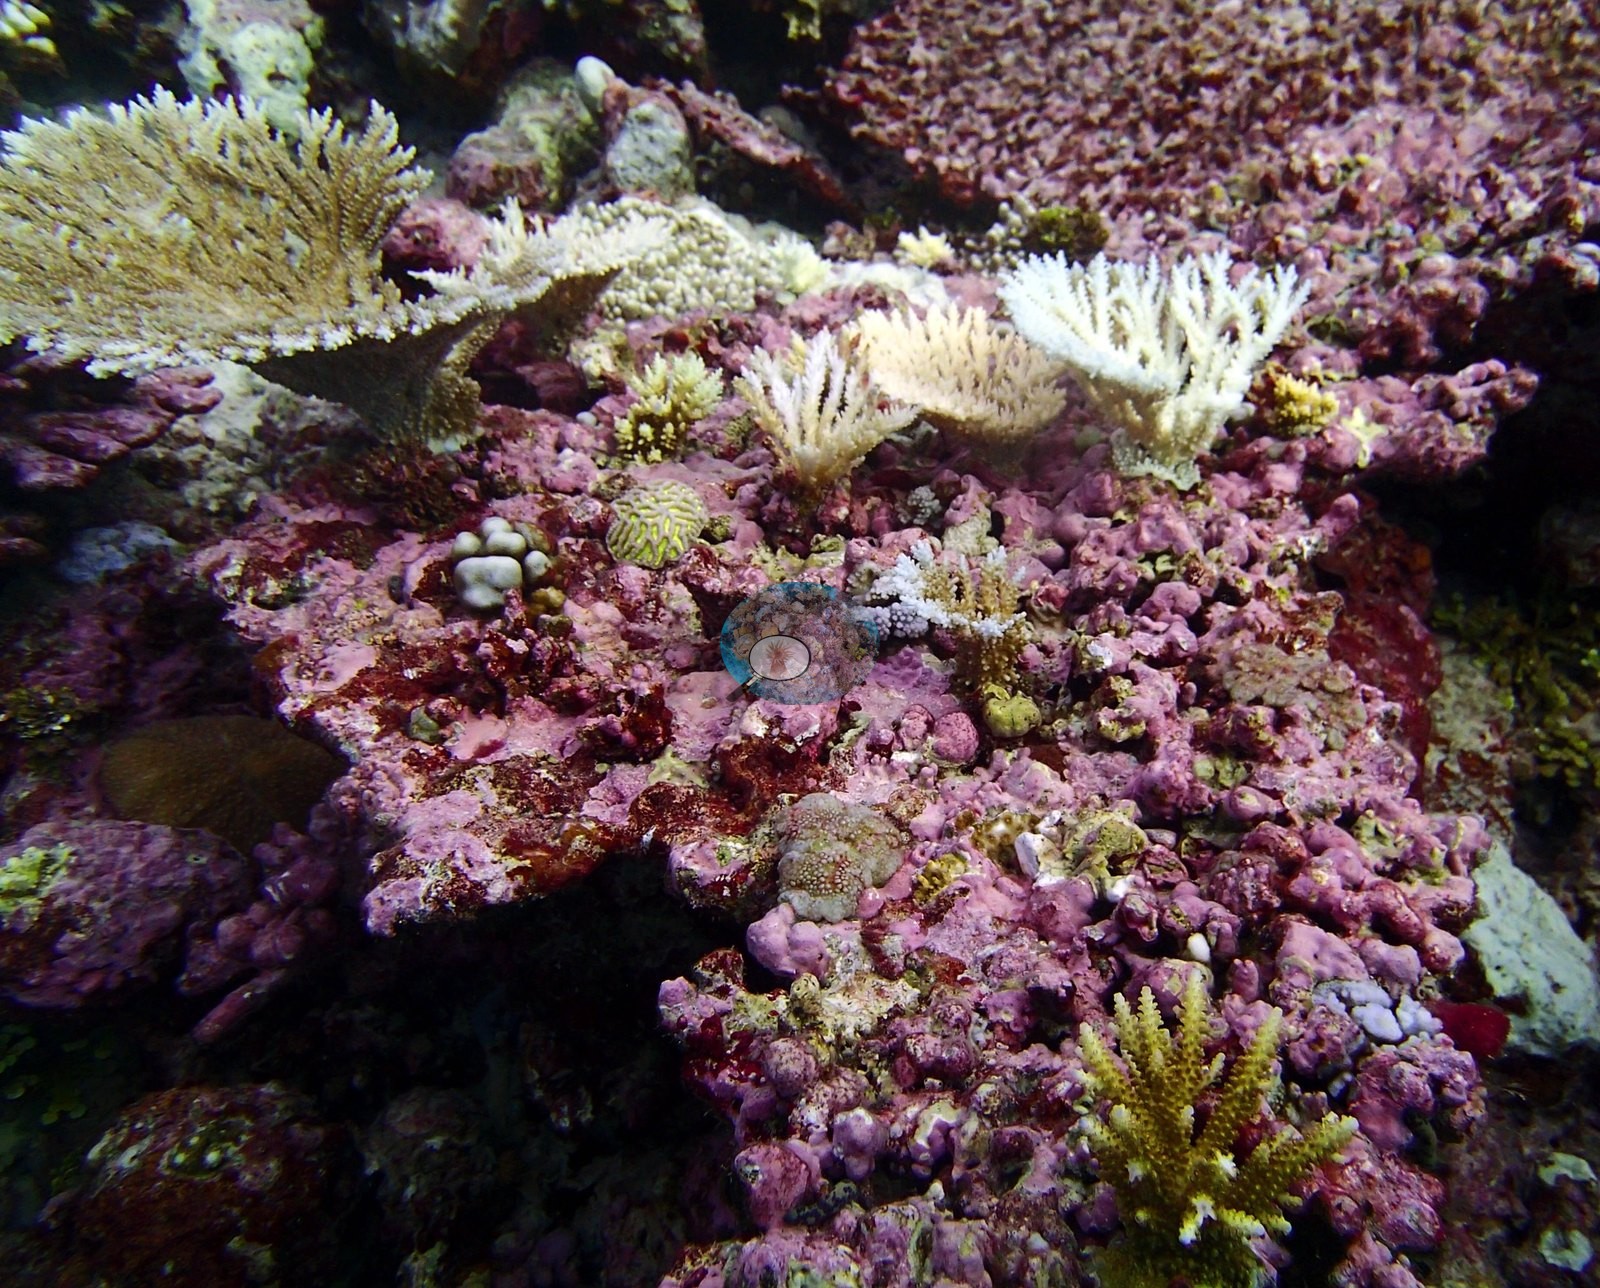
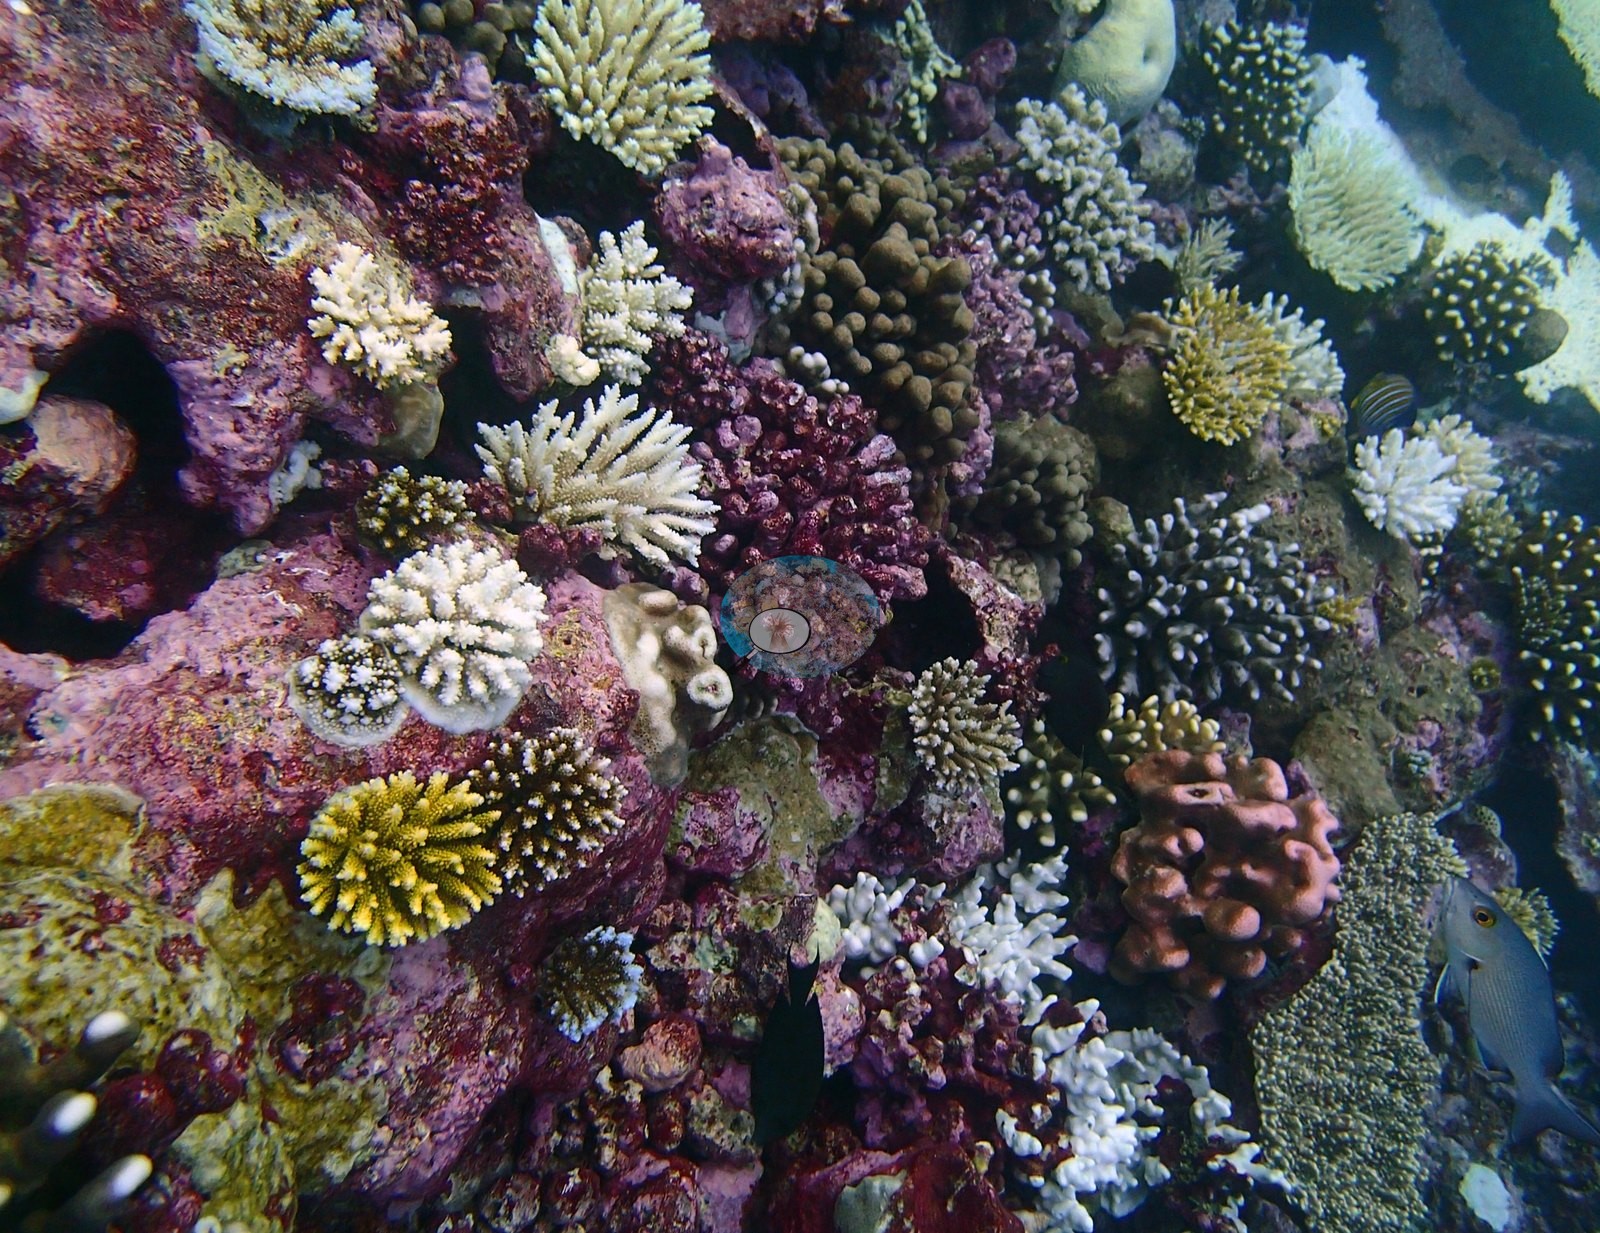
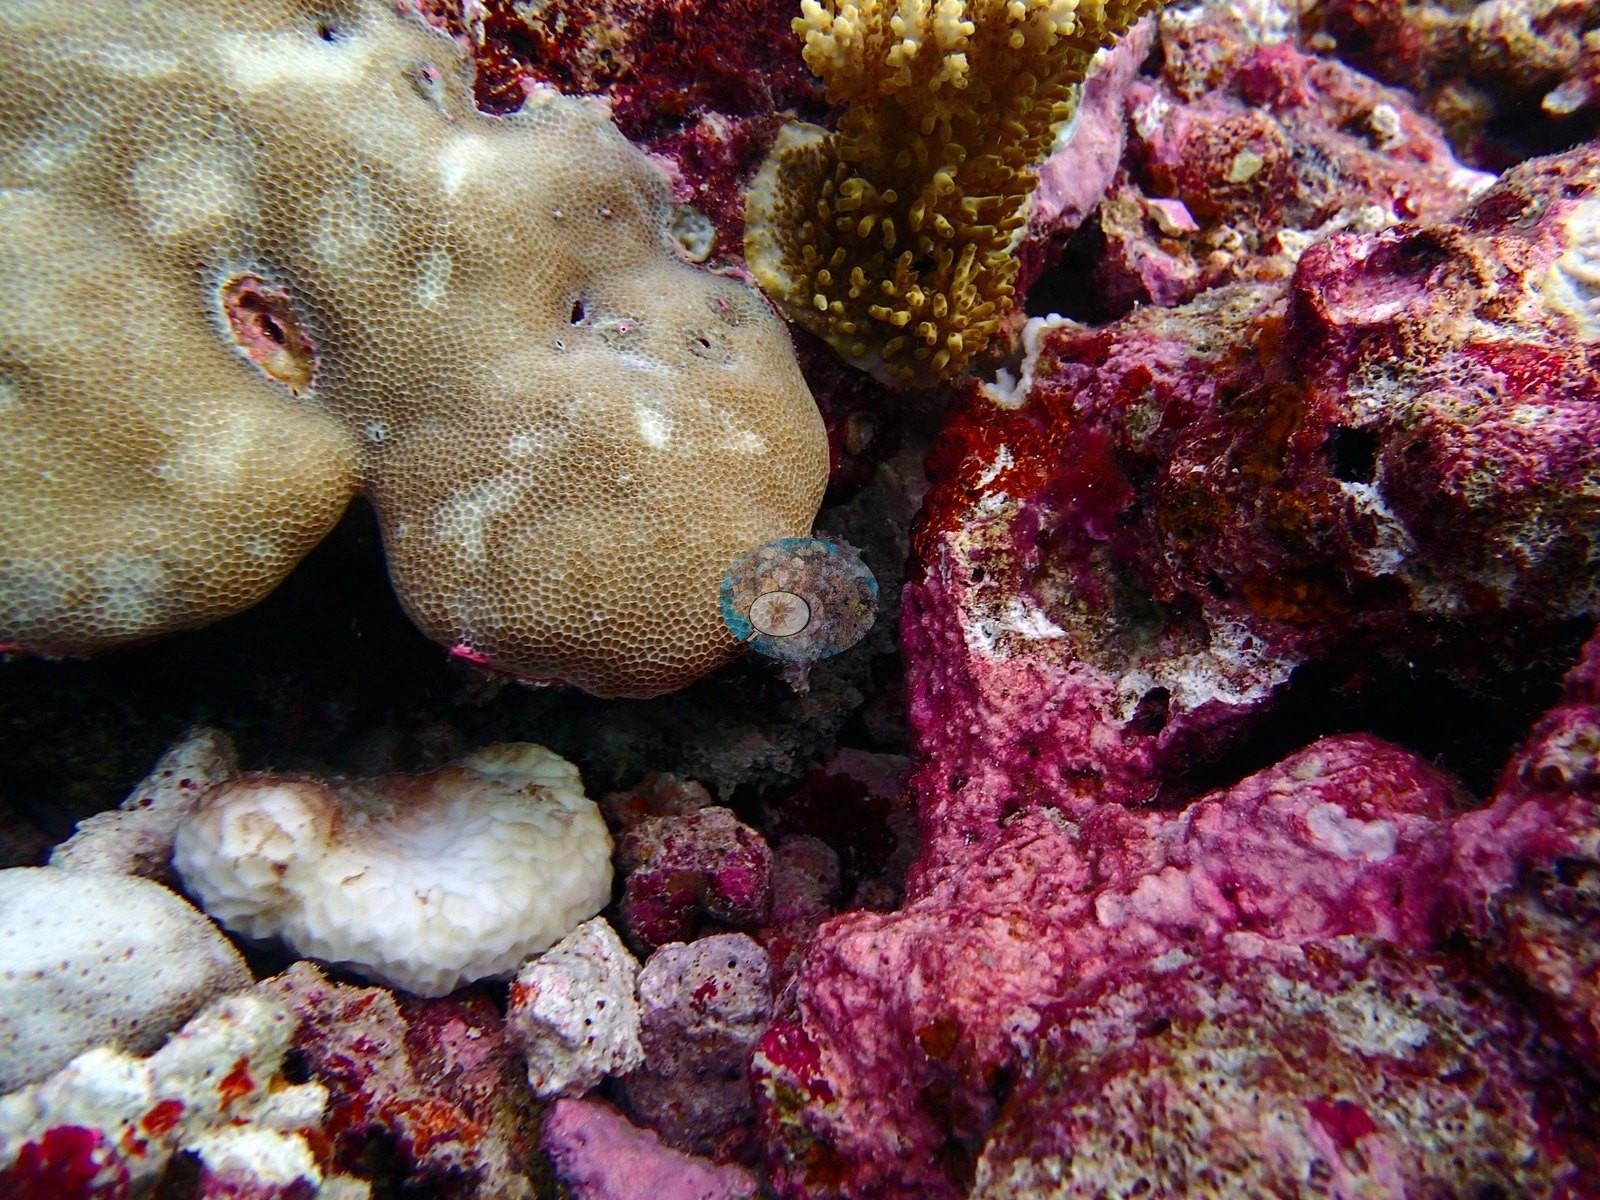
The photographs corroborate the mixture and add what the transects cannot: colony size, vertical layering, bleaching expression across growth forms, and the use of coral ledges by reef sharks.
Coral cover
BIPB110 is a coral-abundant, architecturally complex lagoonal channel reef, and among the most compositionally diverse sites in the Chagos set: 23 non-zero coral genera at 39.3% transect coral cover, which ranks 55th of the 109 sites. Assemblage composition. Formal surveys give 39.3% coral, 41.6% algae, and 5.8% non-coral invertebrates, the coral 42% Acropora in the shallows and led by Favia and Echinopora at D5.
Stressors
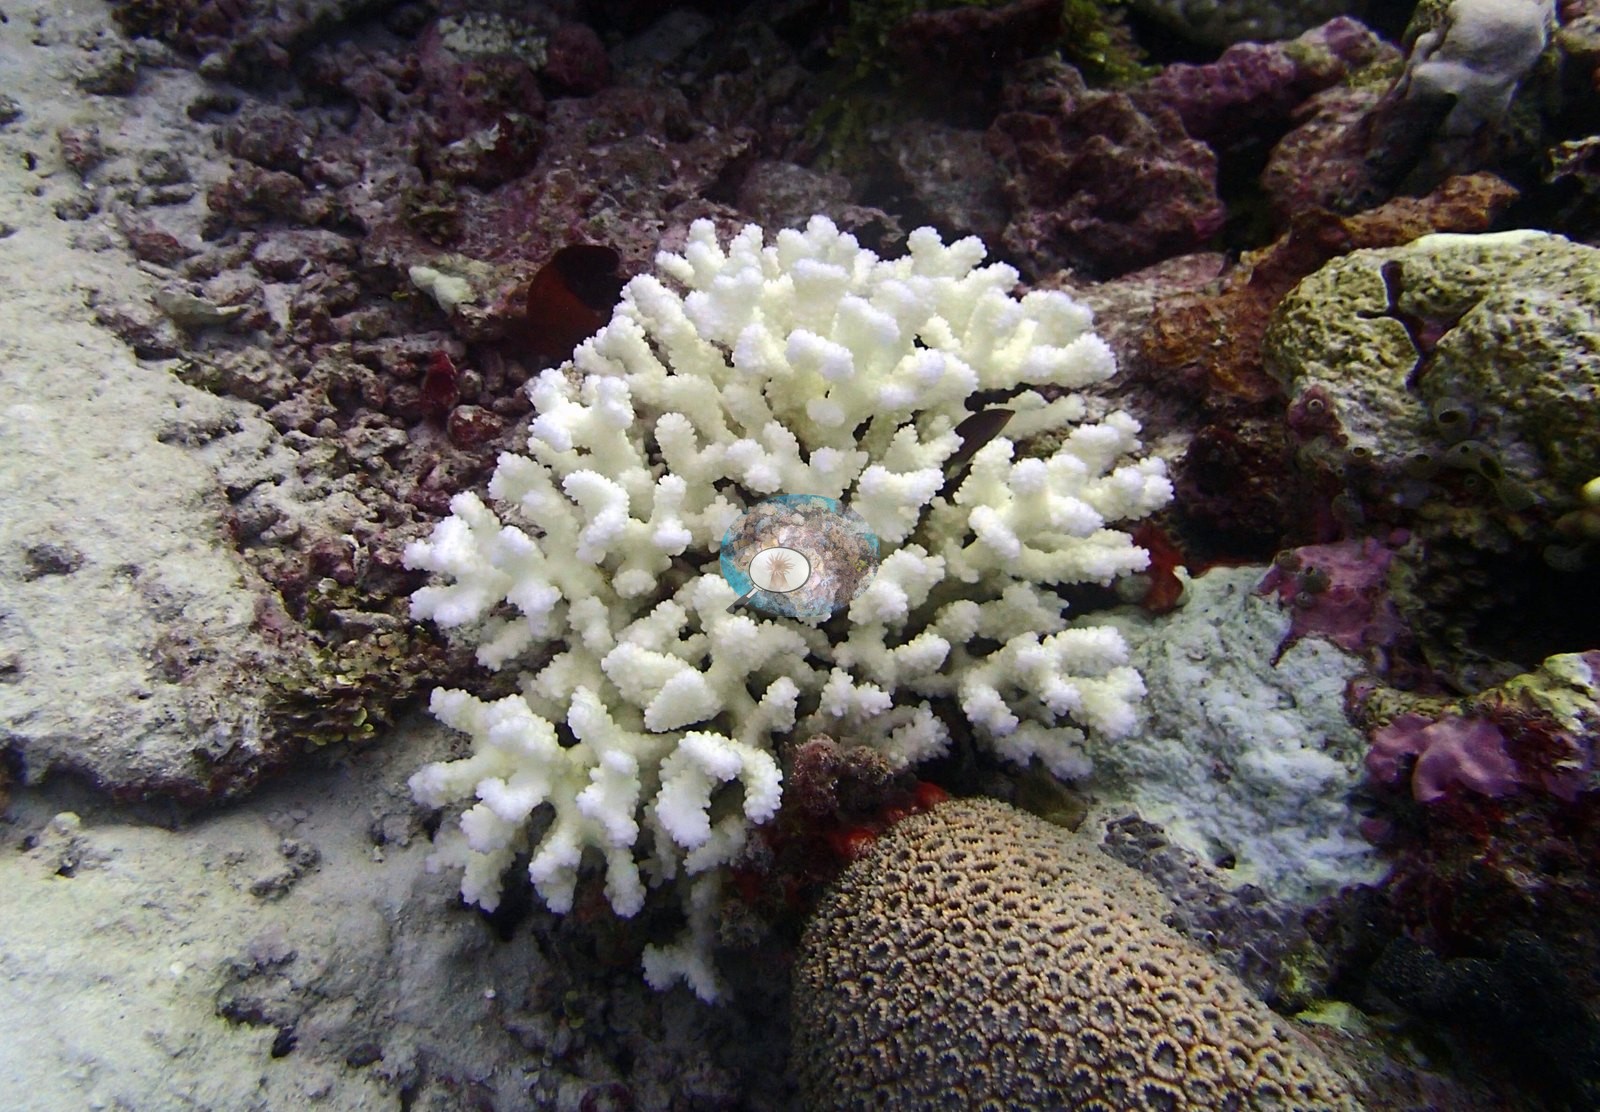
Bleaching is unmistakable and affects more than one growth form. One frame shows a compact branching colony almost uniformly white while retaining intact fine branch structure (e.g., Image 25).
Another frame contains large table-like colonies with equally stark loss of pigmentation (e.g., Image 40, Image 47), and additional pale branches and plates recur across the middle of the sequence (e.g., Image 28, Image 44).
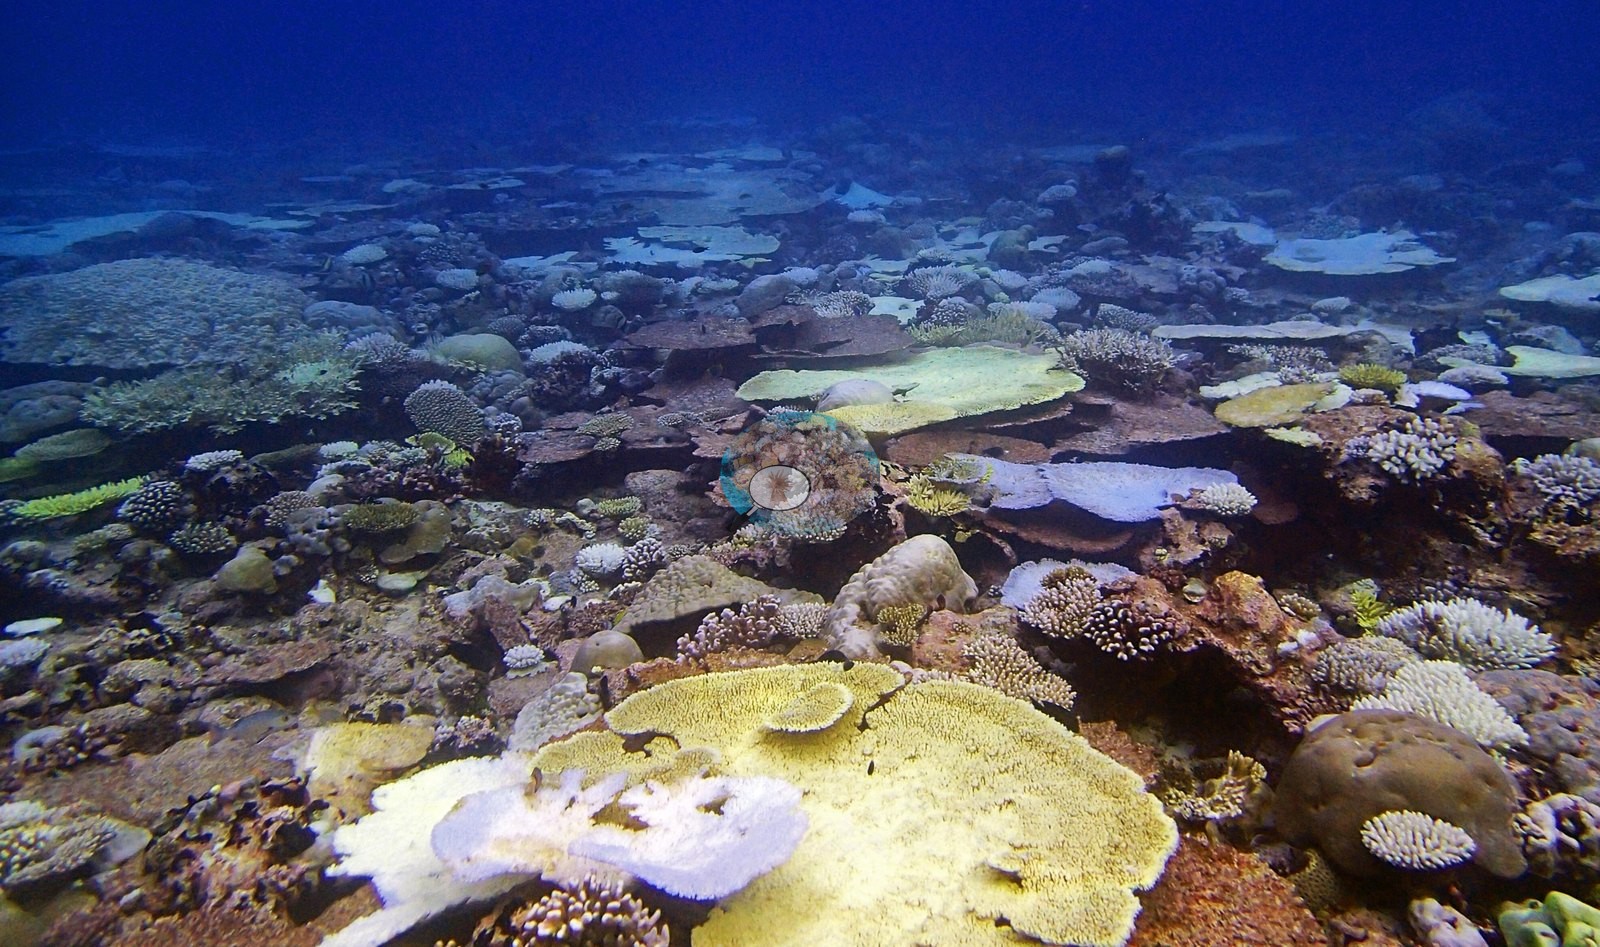
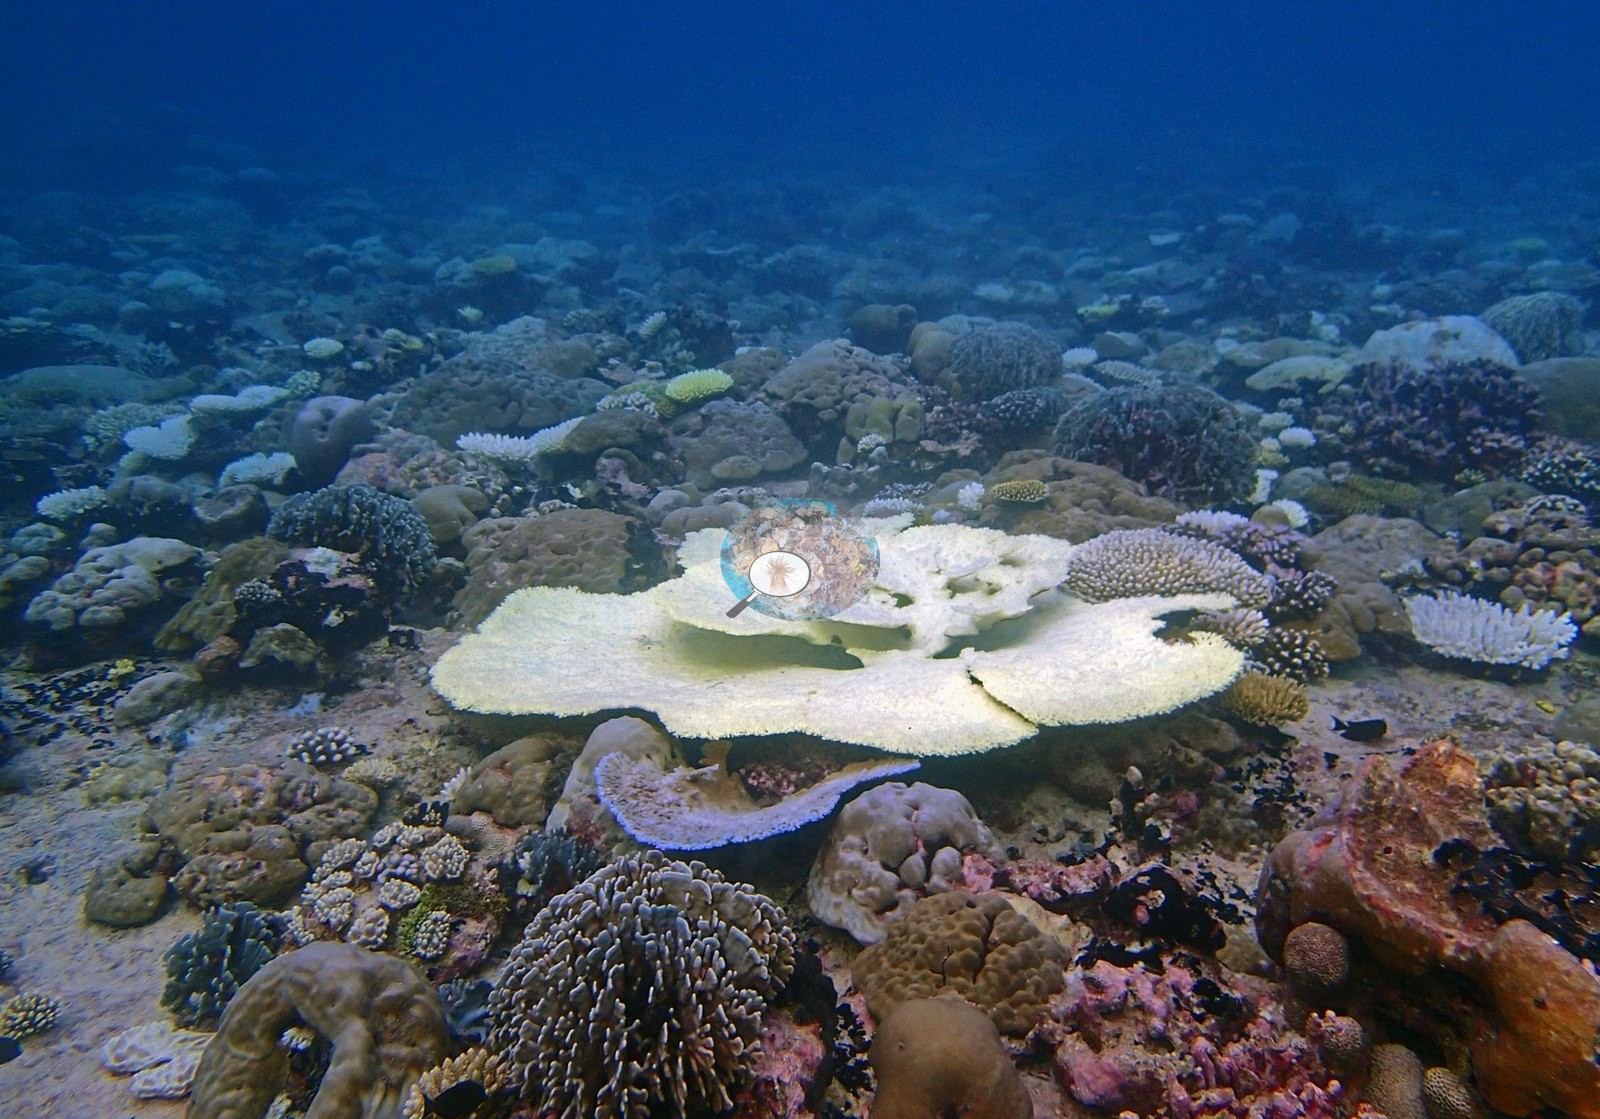
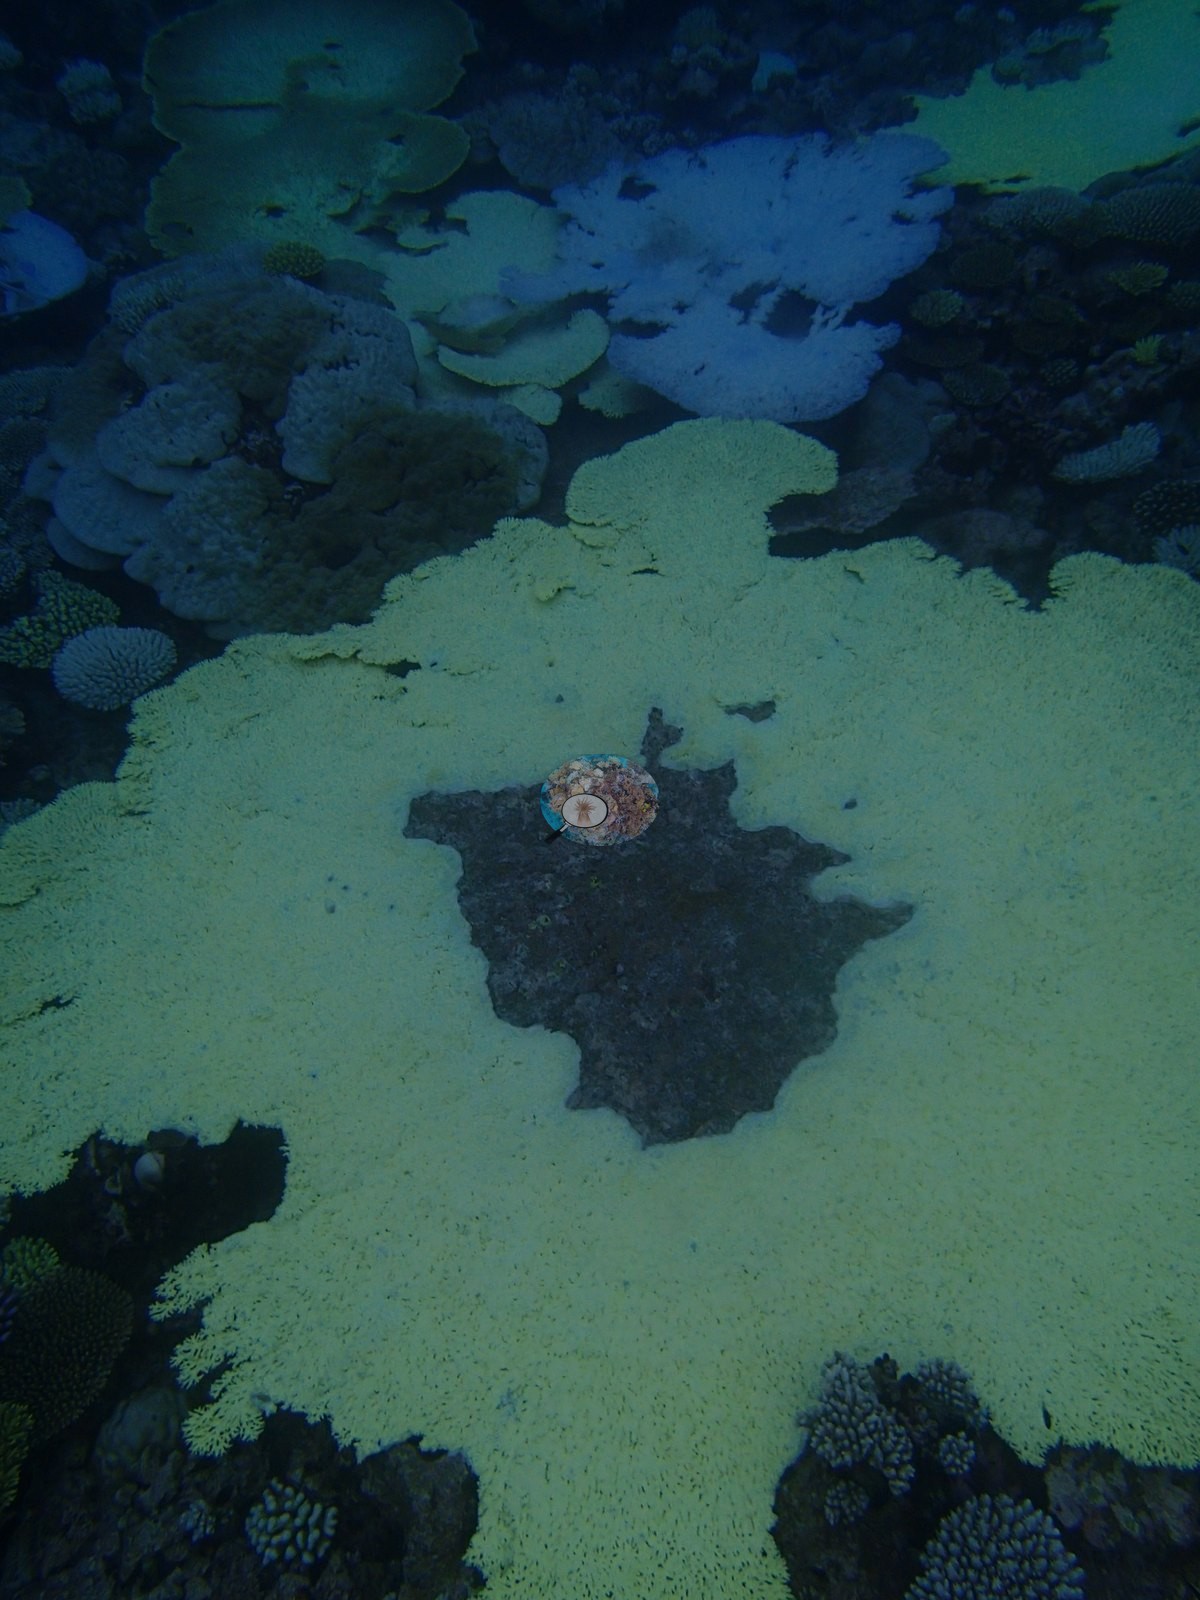
Some pale rims on otherwise pigmented plates could be normal growth margins or photographic highlights; only colonies with broad, coherent pallor are treated as convincing. The most dramatic condition feature is the enormous massive colony followed across a run of consecutive frames (e.g., Image 13, Image 24).
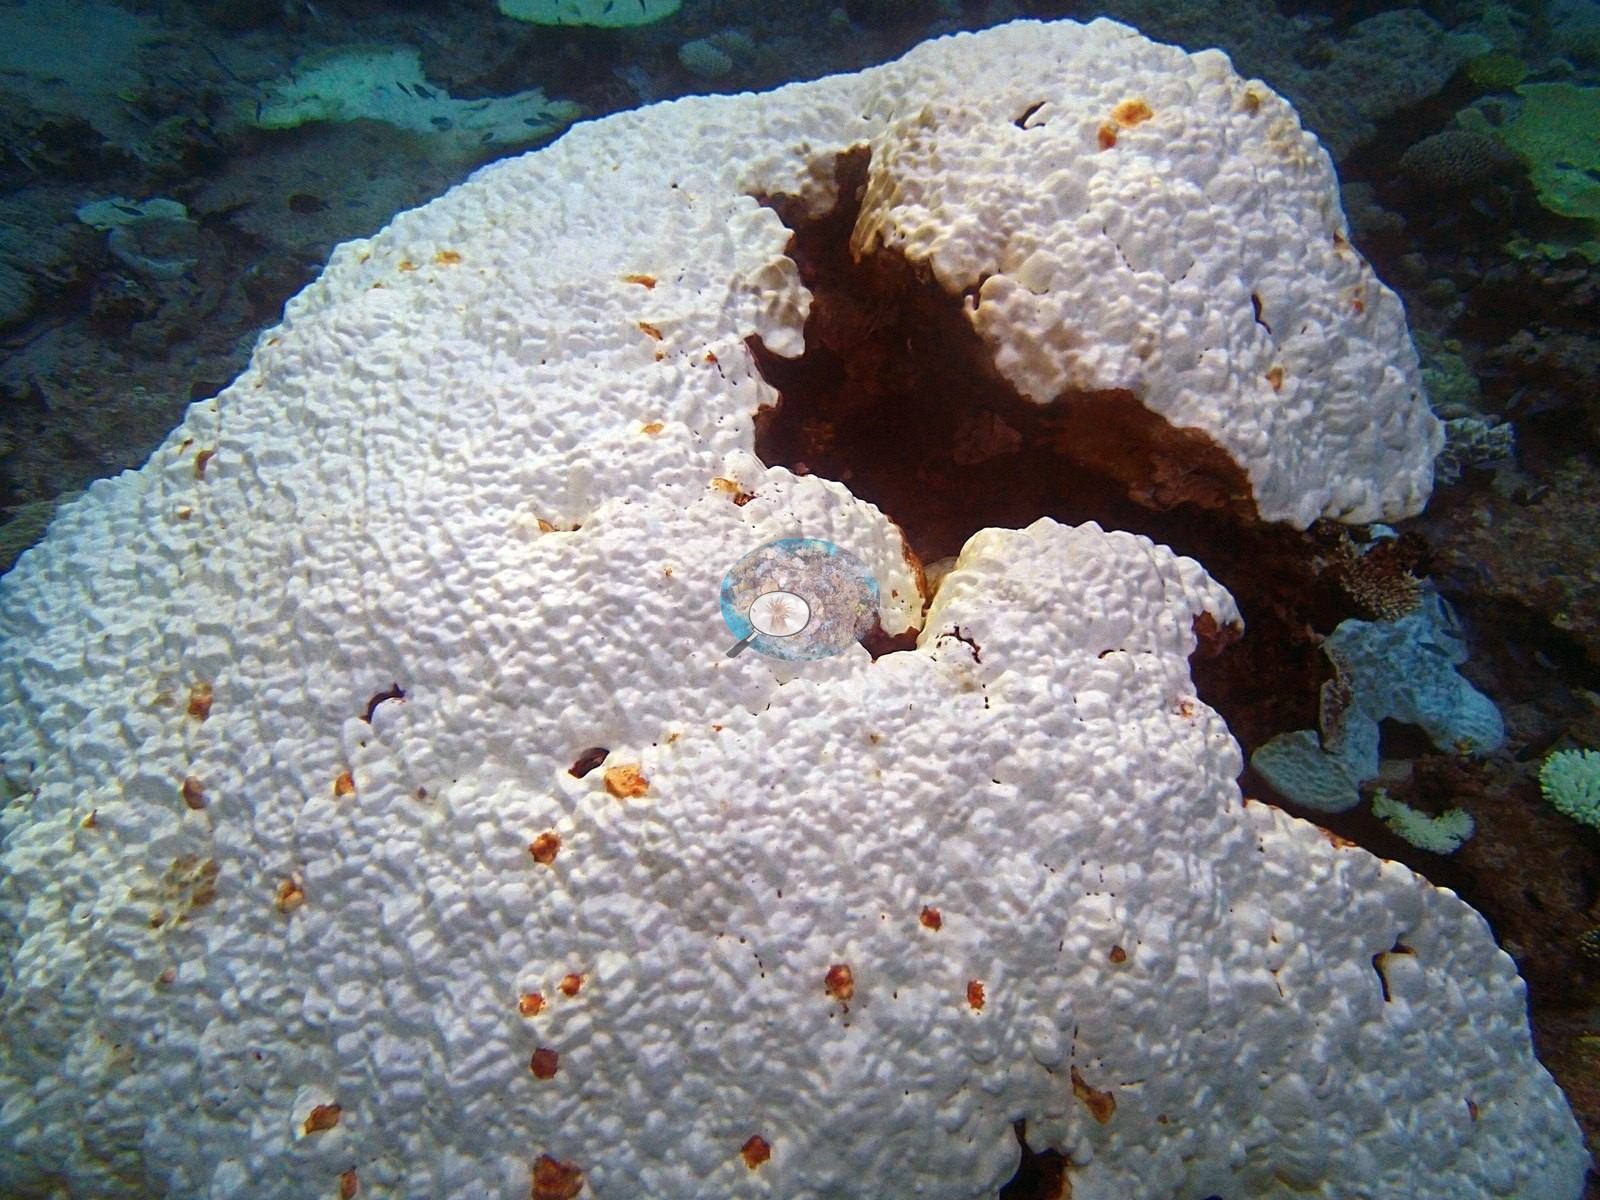
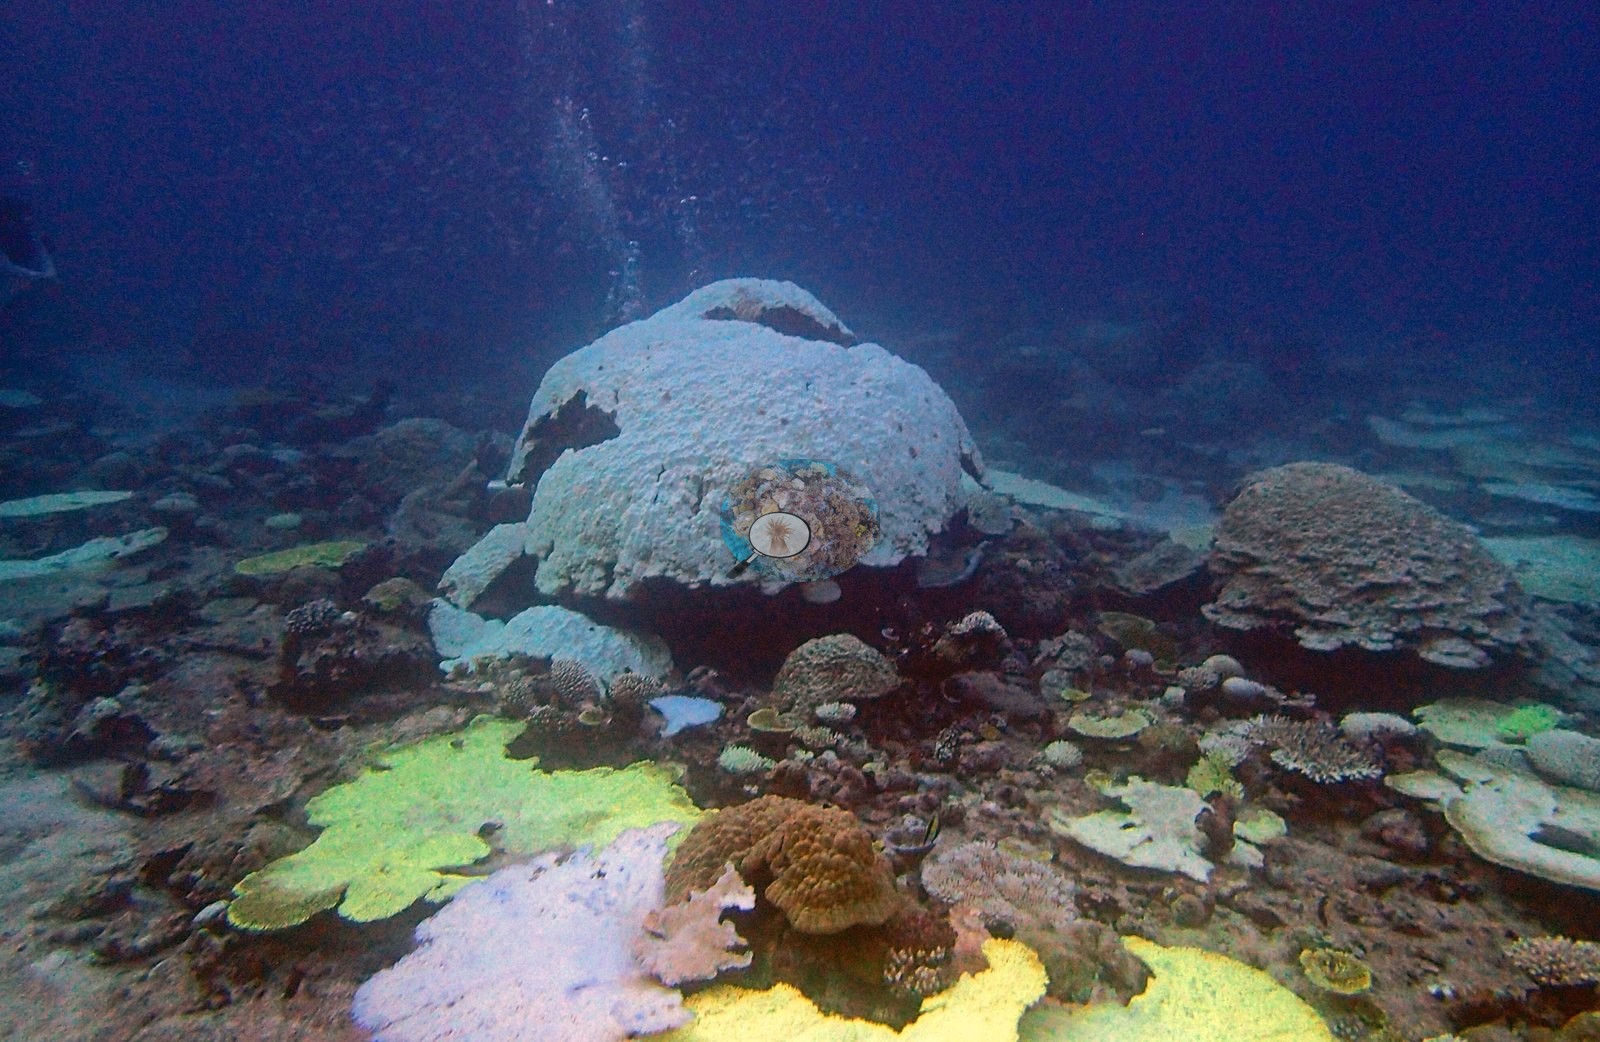
One view shows a partly pigmented tan surface (e.g., Image 9), whereas two others show extensive white tissue interspersed with broad dark red-brown areas (e.g., Image 20, Image 30).
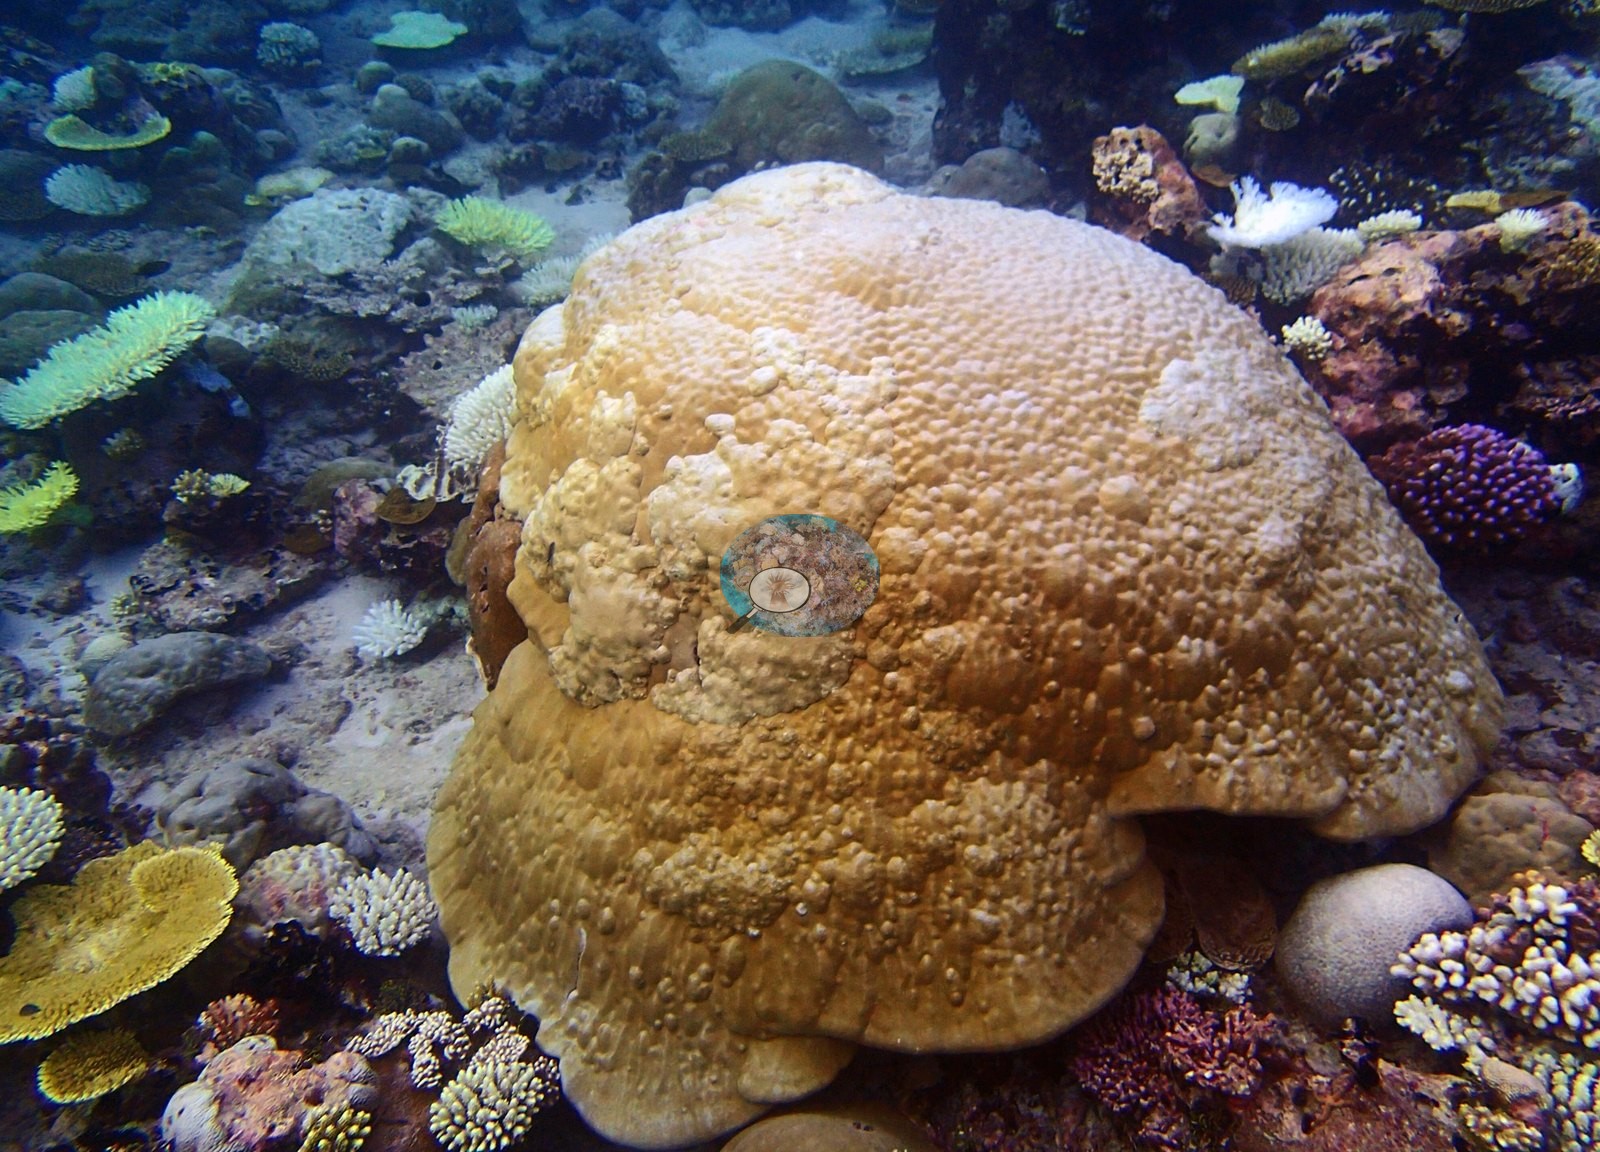
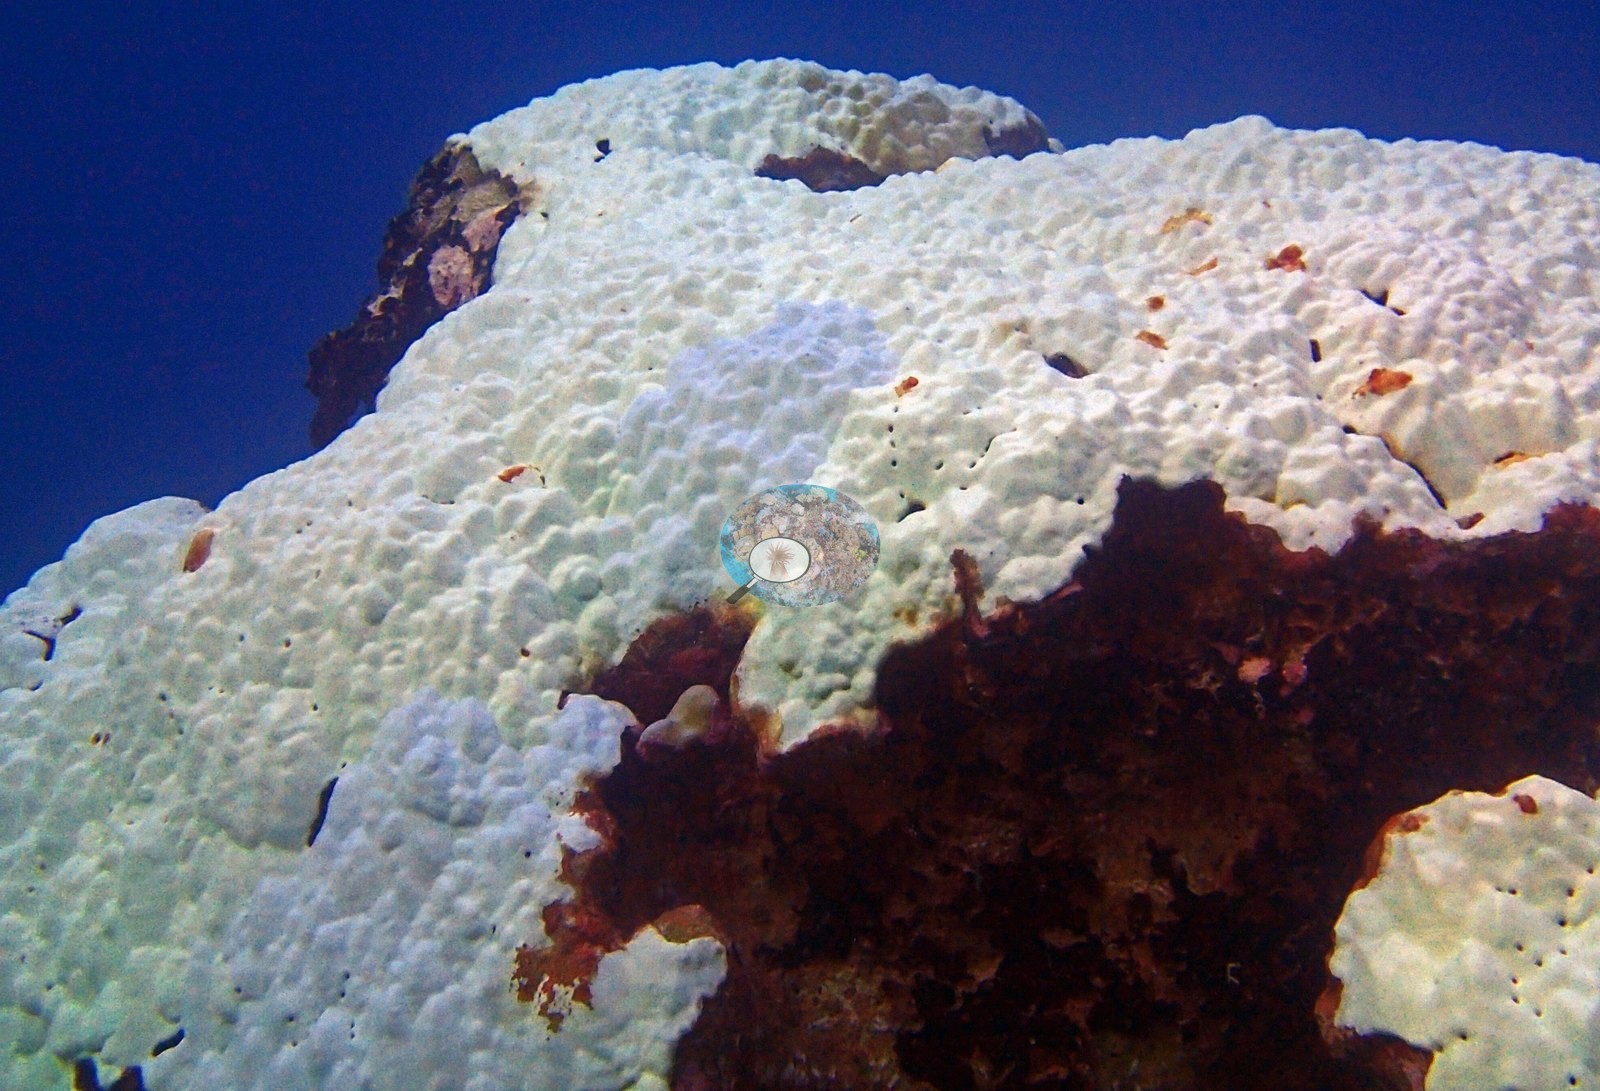
Another view demonstrates the colony's exceptional size and the spatial separation between the pale upper surface and the darker areas (e.g., Image 41).
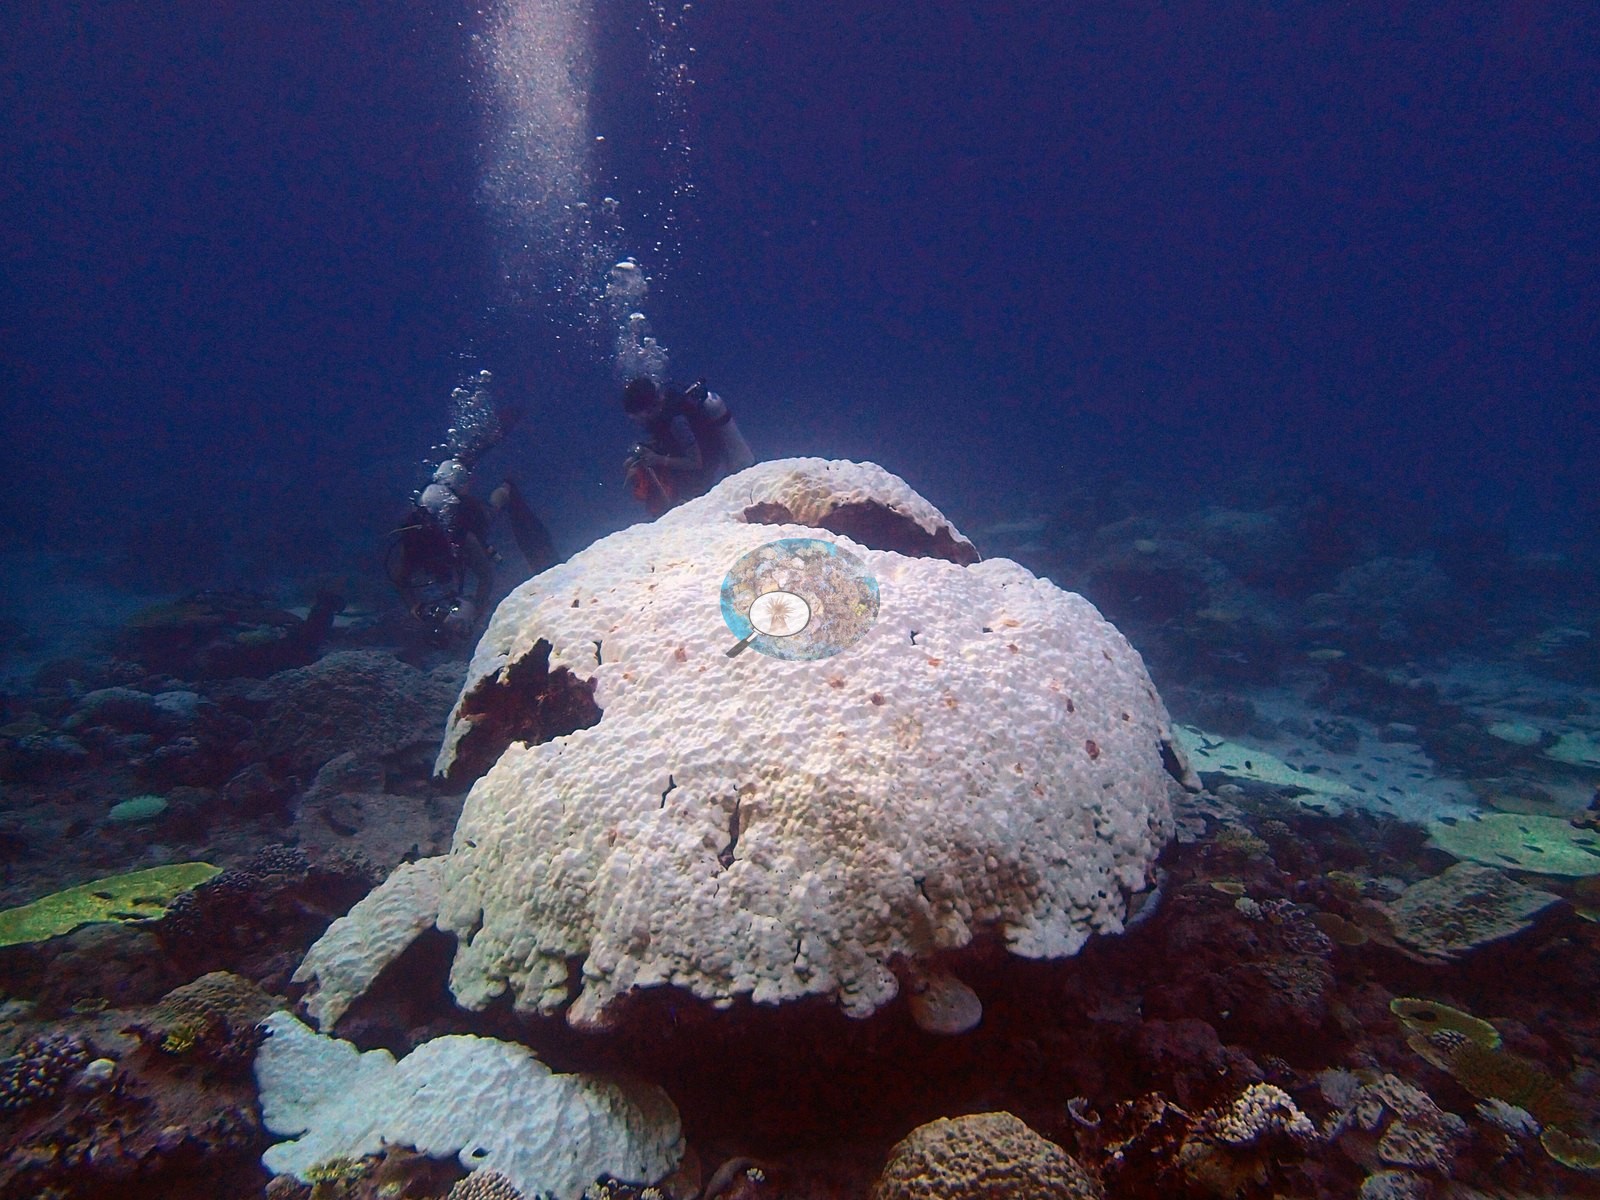
The white areas are consistent with severe bleaching. The dark areas appear established and algal or microbial overgrowth is plausible, but the stills do not show an advancing lesion margin, so they are described as areas of apparent prior tissue loss rather than assigned a disease diagnosis. No crown-of-thorns starfish (COTS) or other corallivores evident.
Fish and other fauna
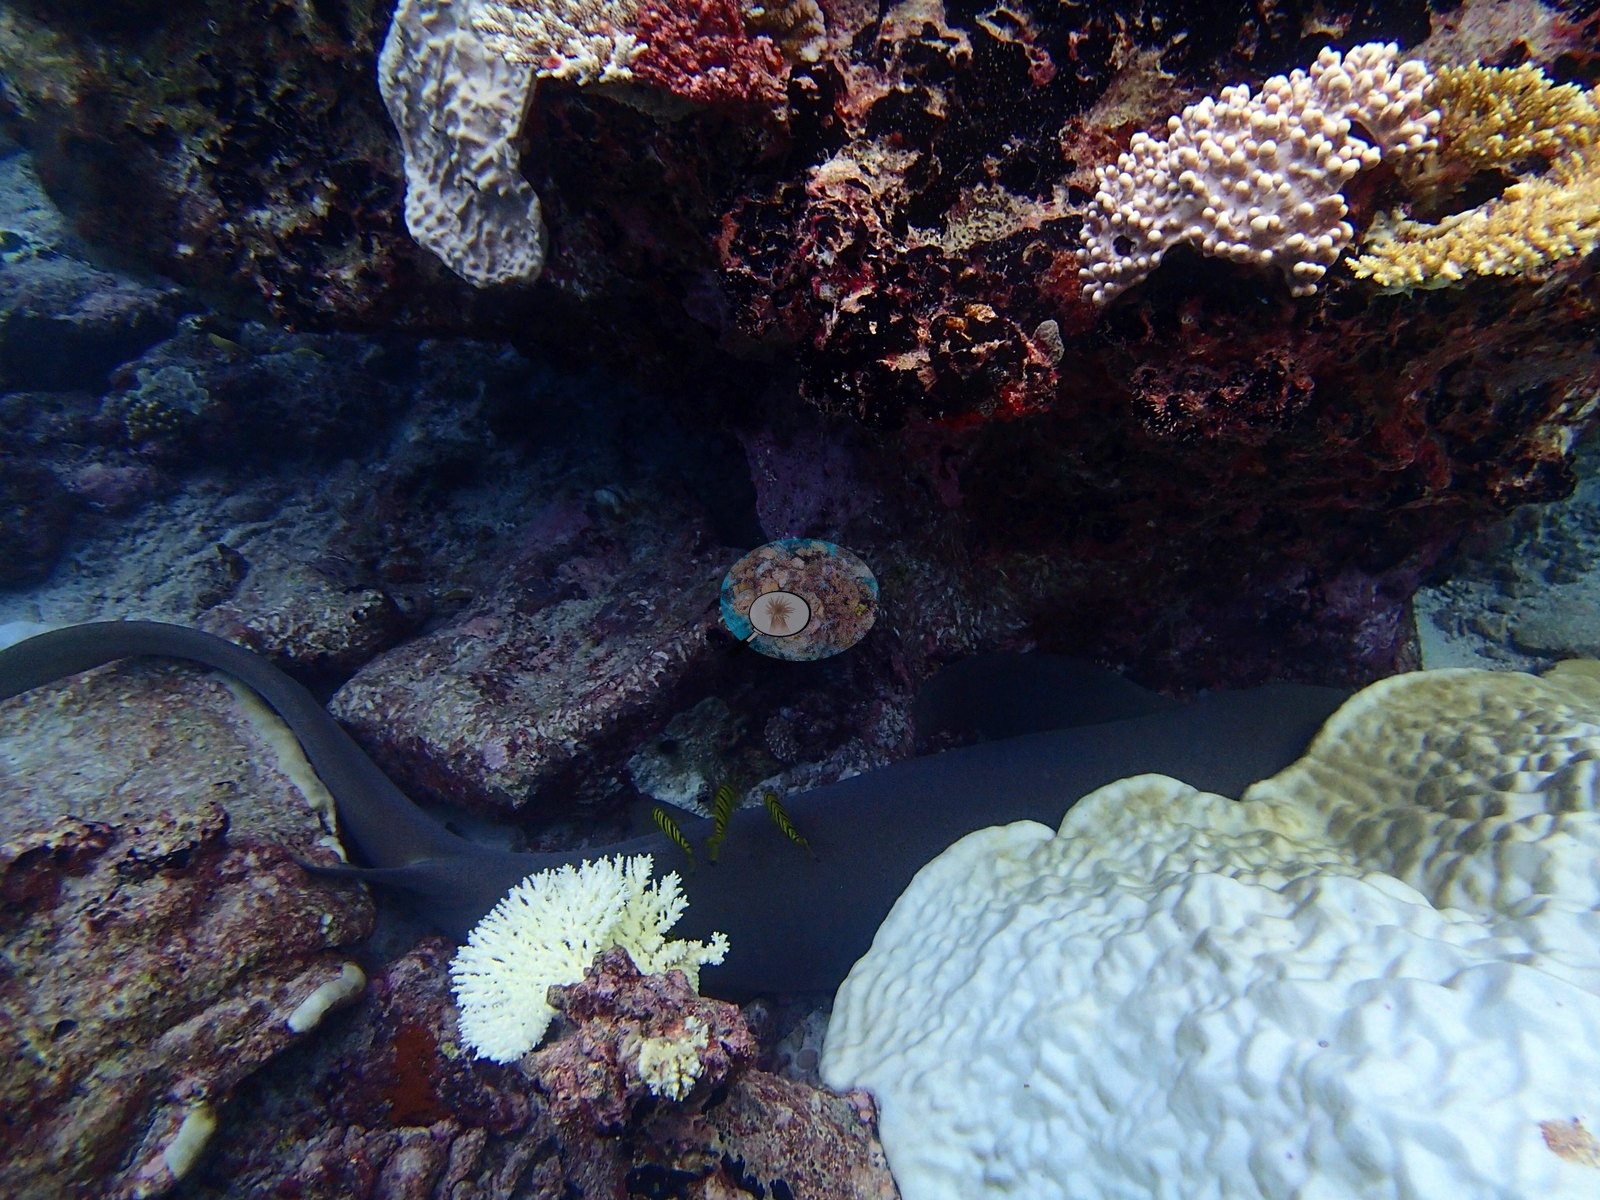
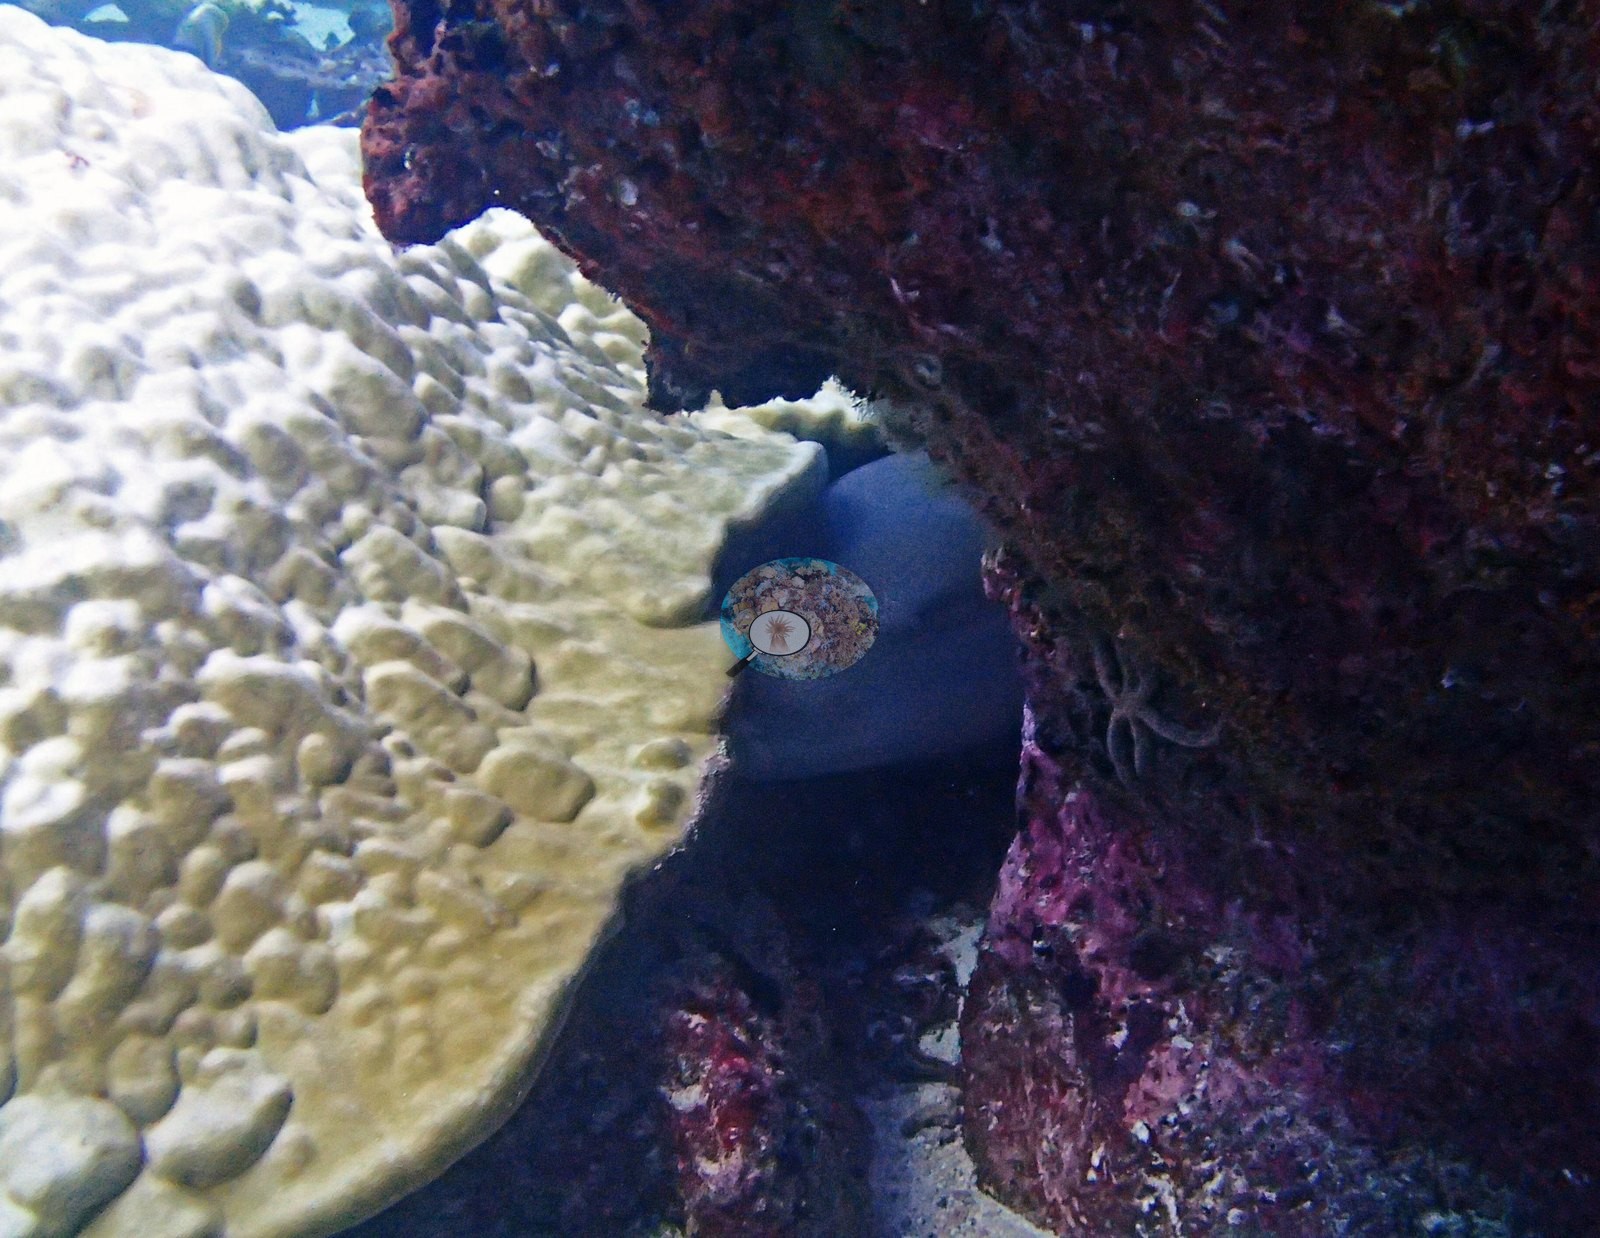
Mobile fauna add ecological context. One frame clearly shows at least two gray reef-shark-type animals resting beneath an overhang, accompanied by small yellow-and-black fishes (e.g., Image 37); adjacent frames give other angles on the same shelter (e.g., Image 18, Image 43).
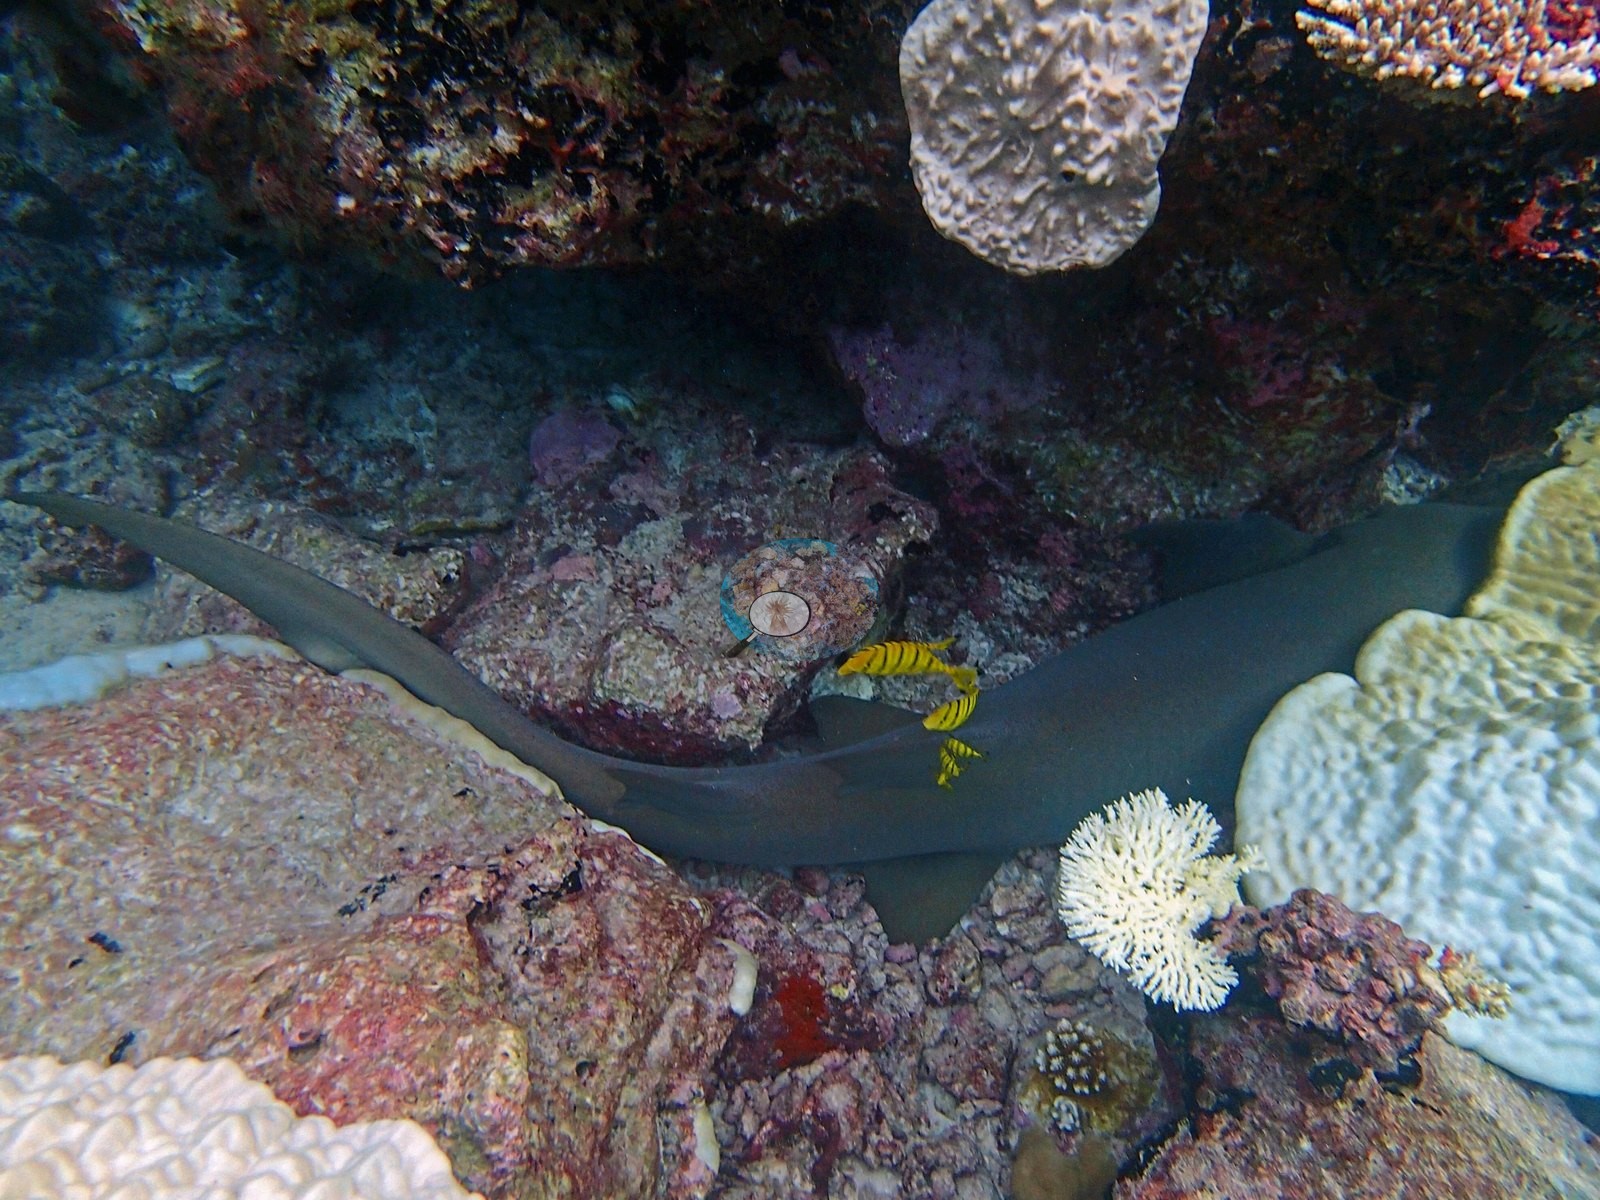
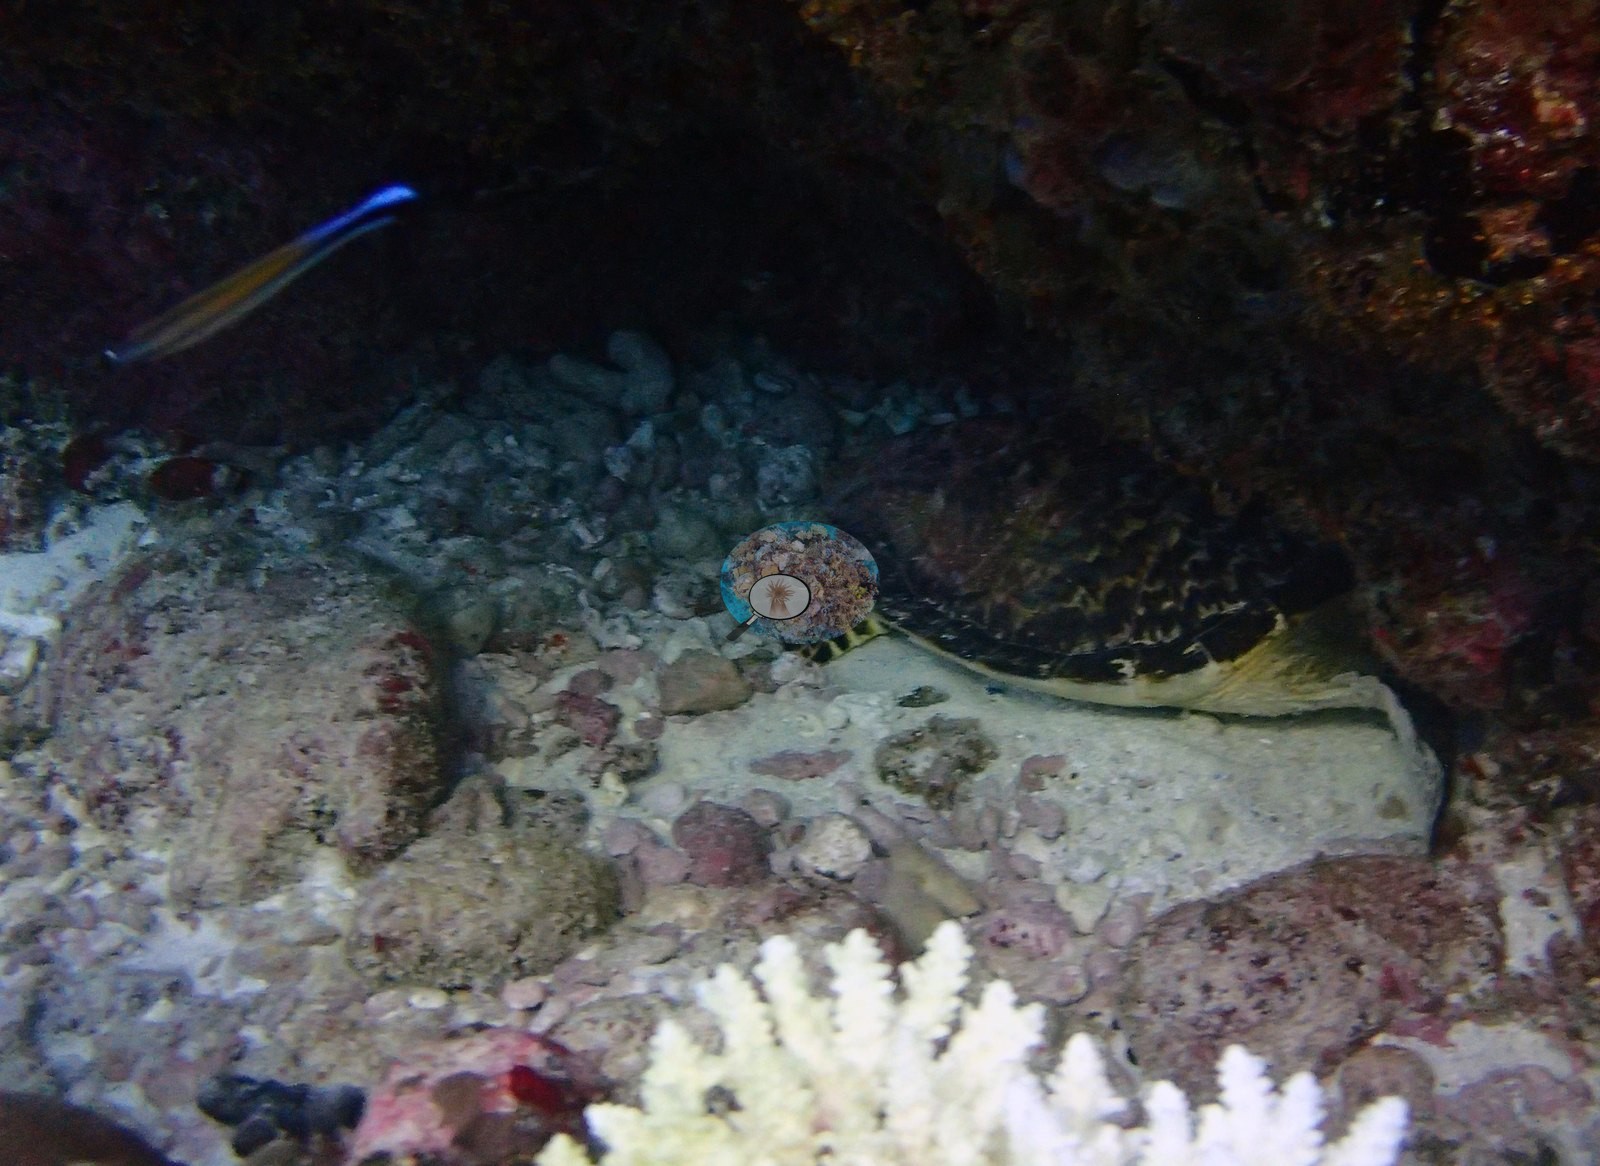
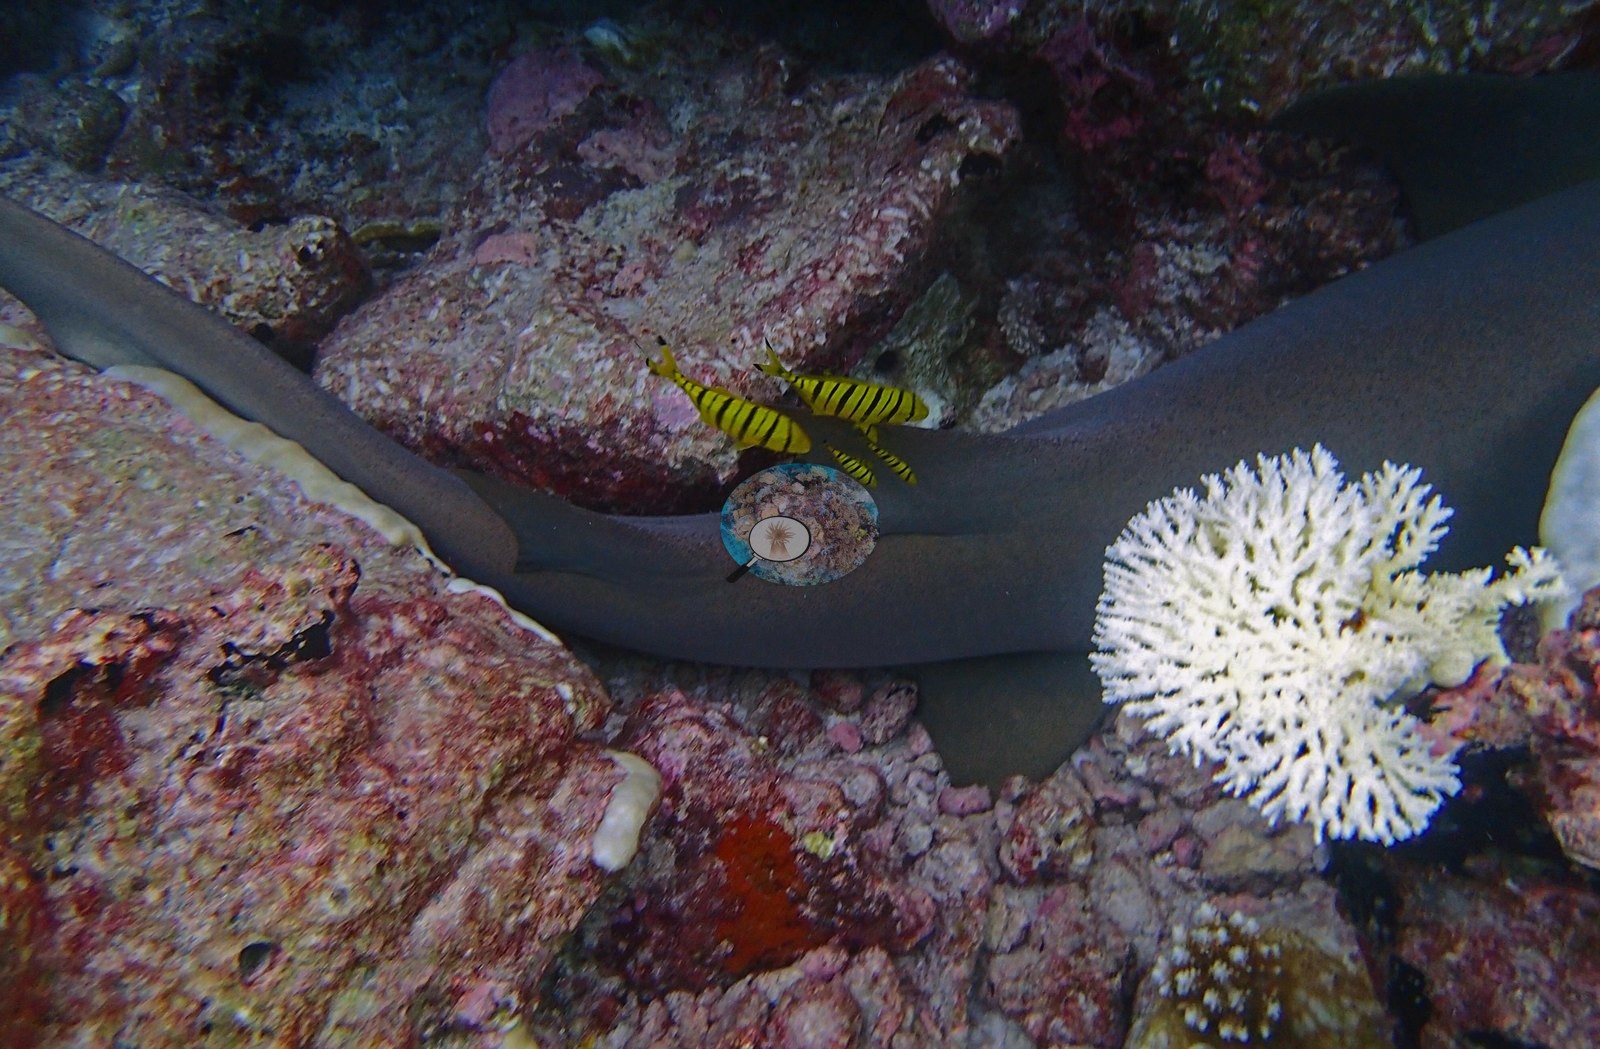
Their shape and resting posture are compatible with whitetip reef sharks, but the decisive fin-tip and head characters are not equally clear in every image. This is a qualitative occurrence record, not a count of individuals. A cucumber-like echinoderm may be present in one frame, but the angle does not warrant a call.
Comparisons with other data
No prior survey data from this site. If you would like to share yours, please email us.
CV model comparison
More info
Those are point counts on the photographs; this is a diver swimming a transect. The models and the reference never saw the same thing. ⚠ SITE-LEVEL ONLY. The 2,500 frames were not associated with any transect taken within 200 m of them, so transect-vs-image comparisons are site means, never frames. The transect value is already in the pin `cover` field (109 of 112 pins, sourced to the paper's suppl. S1) and is read from there, never re-imported. The transect is THE coral-cover value for this site and stands alone. The rows below it are a methods comparison only: no computer-vision value is averaged with it, feeds the headline, or carries over to the site's cover figure (Anderson, 2026-09-22).| Method | Hard-coral cover (%) |
|---|---|
| Transect (published) | 39.3 |
| CoralNet | 36.6 |
| In-house DINOv3 | 36.6 |
| CoralSCOP edited | 36.7 |
| Claude | 29.5 |
Data & links
- Read the full site report ↗
- Download benthic survey data (CSV) ↗
- Download all LOF-GRE data (933 sites) ↗
- CoralNet image repository for this region ↗
- Photo portfolio ↗
- Coral Reef Diagnostics page for this area ↗
All images from Coral Reef Diagnostics. Data are from Coral Reef Diagnostics.
© Coral Reef Diagnostics.