
Part of the regional summaries: Chagos Archipelago - Victory Bank / Great Chagos Bank North and Chagos Archipelago
More info
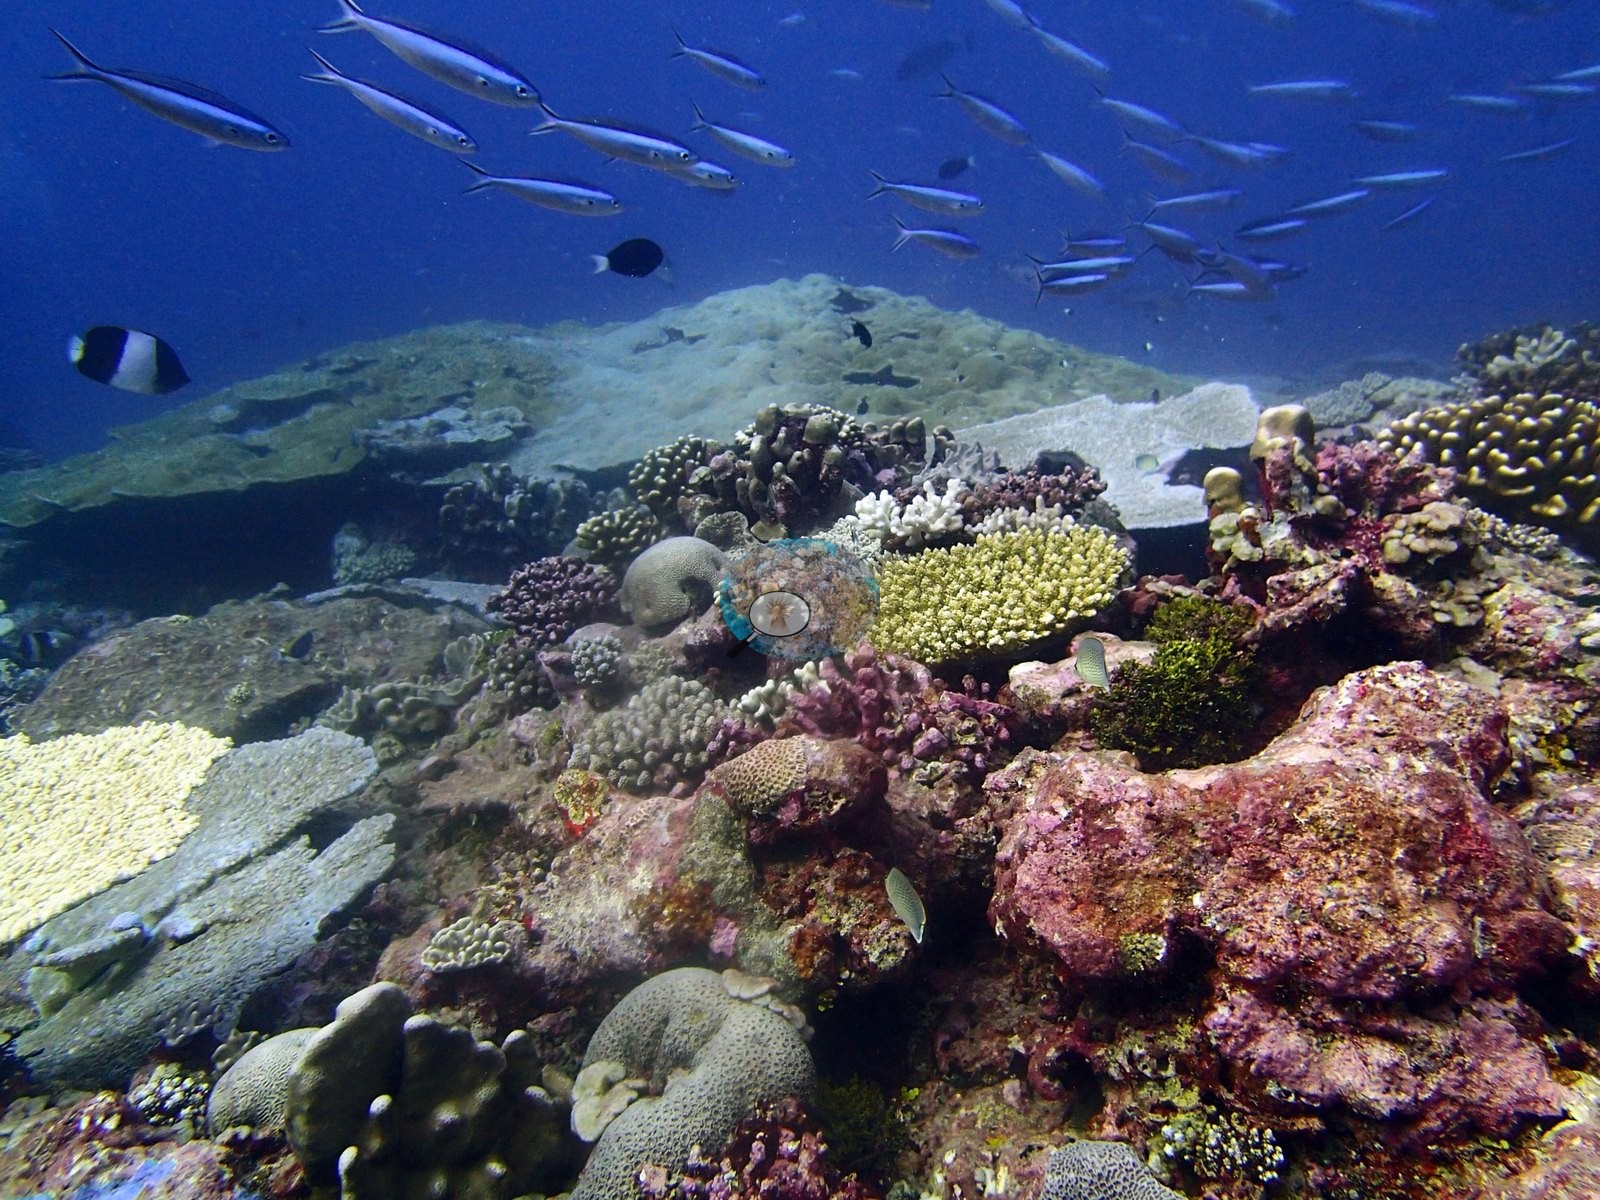
Chagos (NOAA CRW virtual station)A sheltered patch reef about 22 m down inside Nelson Island's lagoon, where 43% coral cover shifts from Acropora in the shallows to Porites at depth over clean, coralline-crusted rock rather than silt. Stark white tables and branching colonies back up a published 16% bleaching figure, and much of the table-coral framework appears to be standing dead. Surveyed on the Living Oceans Foundation's Global Reef Expedition.
Three independent survey stations shown with the program’s logo — click one to see how far it is from this site.
One other CRD dive site within 5 km shown in orange — click a marker to open its page.
🗺 Detailed map of the Global Reef Expedition dive sites, Nelson Island, Chagos (Khaled bin Sultan Living Oceans Foundation; opens in a new window)
7 of these 11 photographs are shown beside the text that discusses them under "Site description" below.
Site description
Setting
BINI77 is a protected, submerged patch reef inside Nelson Island's lagoon at 21.8 m, surveyed 20 April 2015.
General benthic features
Across 22 genera, Porites leads with 39% of all coral, then Acropora at 20%.
Coral cover
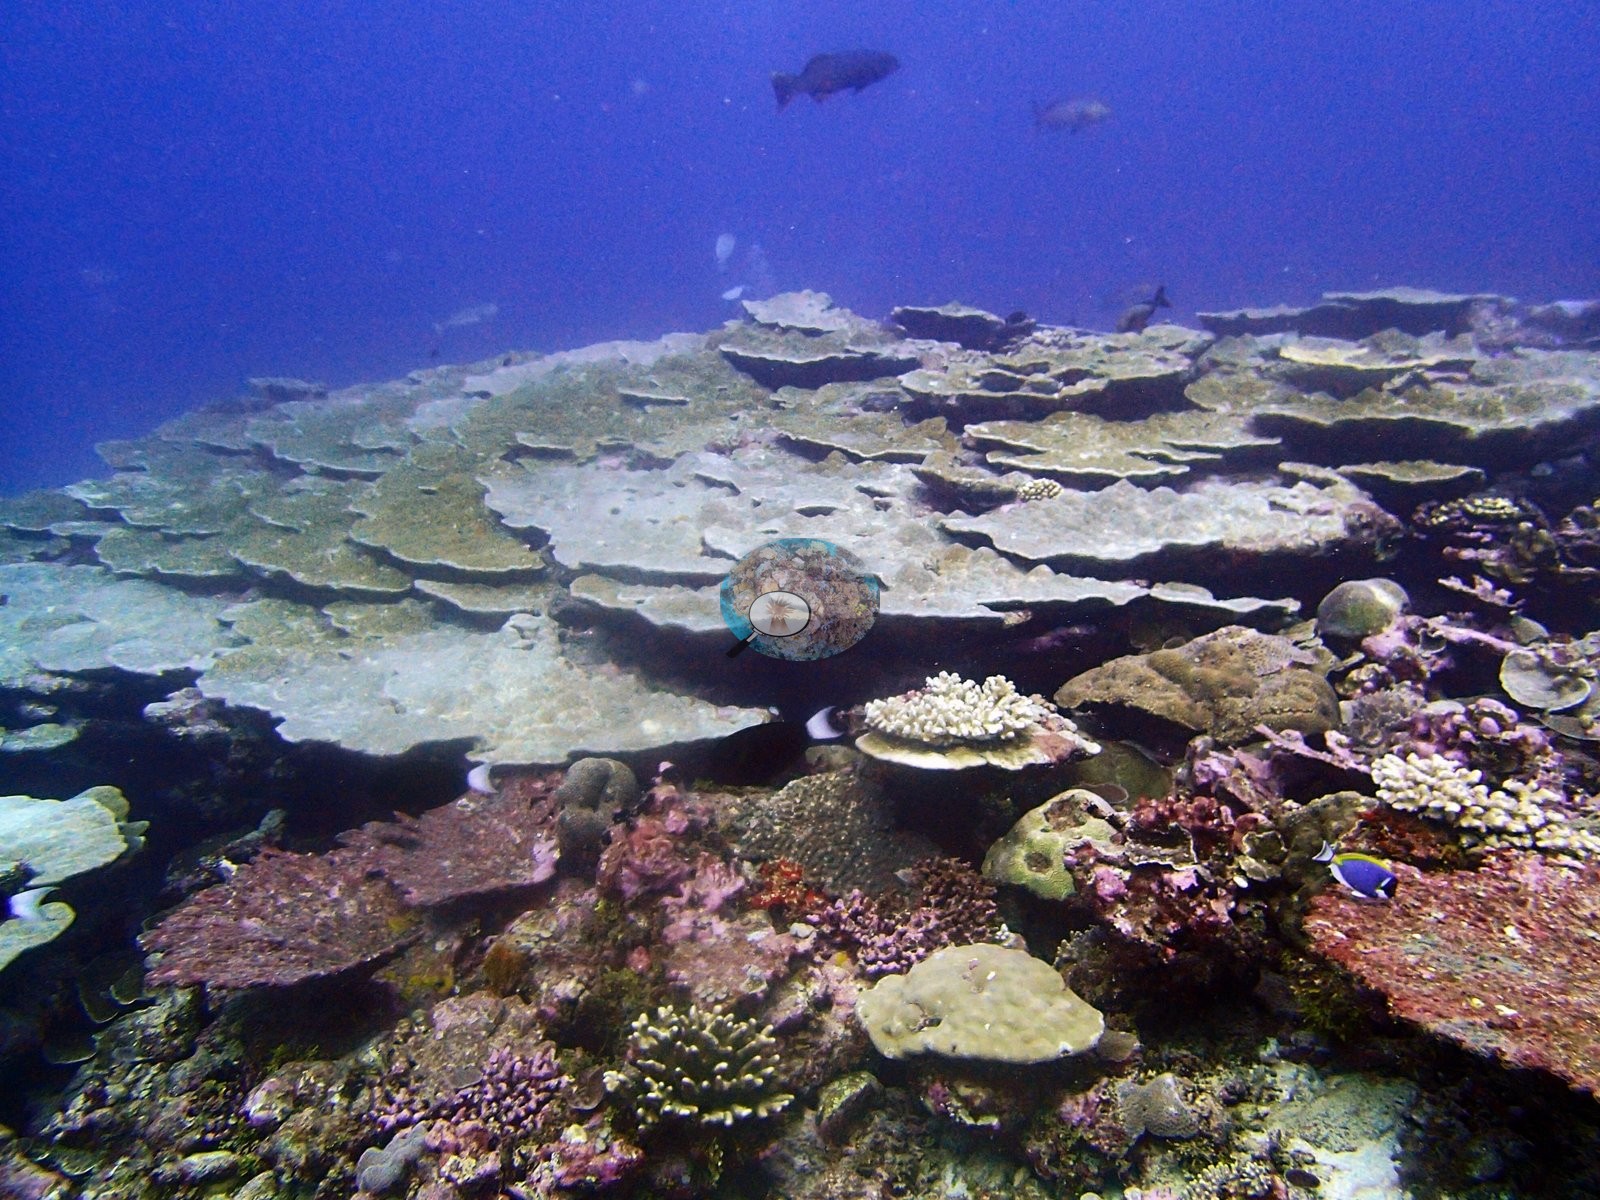
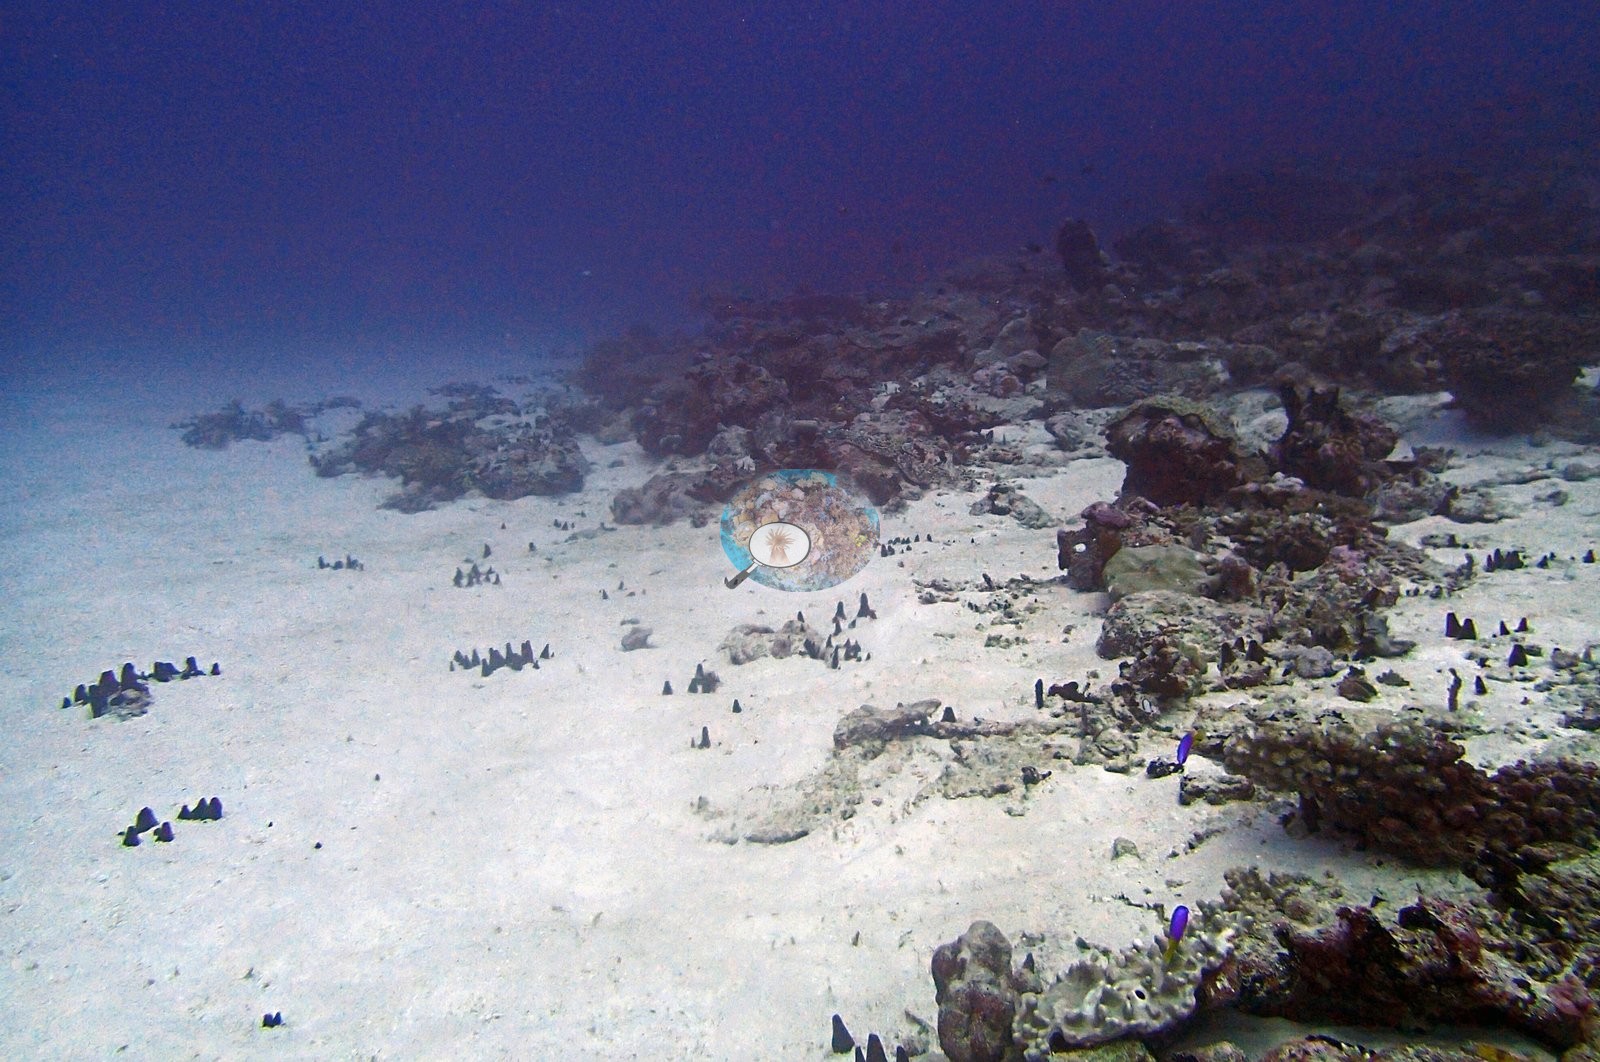
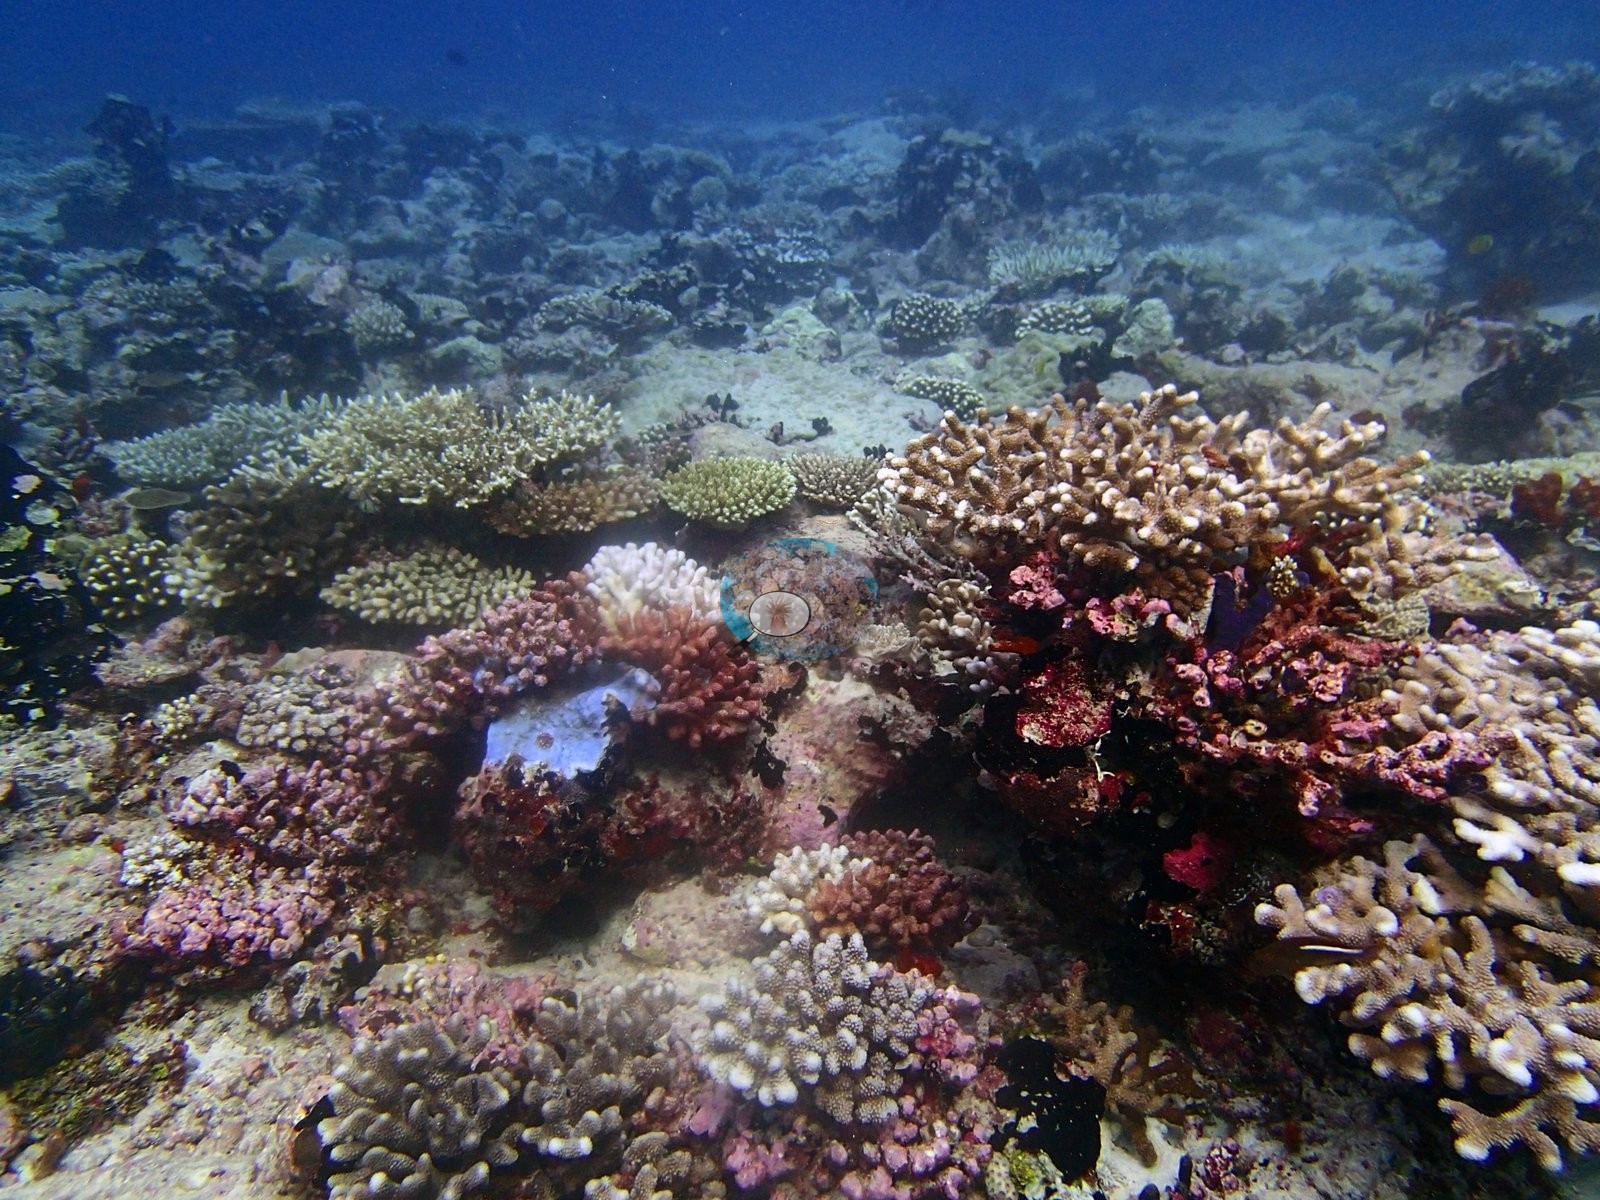
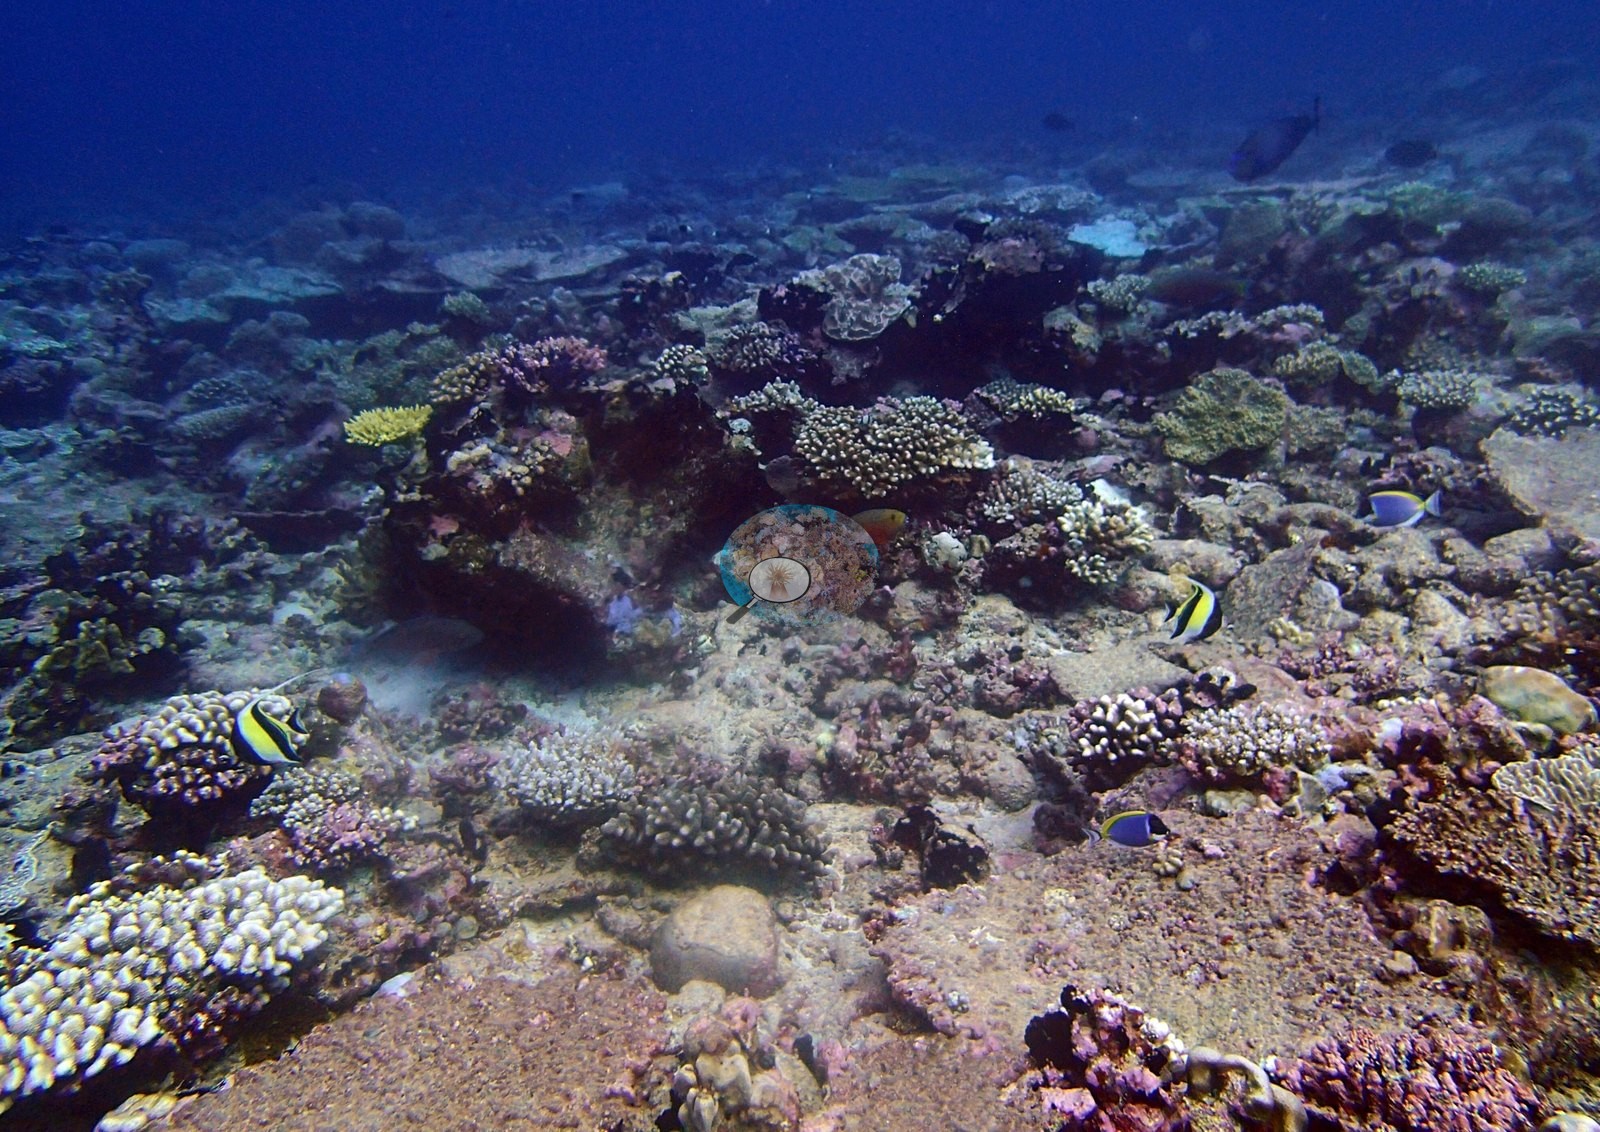
Formal transects recorded 43.0% coral against 36.0% algae — 40th of 109 Chagos sites for cover — and unusually for a lagoonal site the algae is hard encrusting growth rather than sediment: coralline algae takes 18.2% of the benthos and clean turf 11.8%, while sediment-laden turf is almost nothing at 0.9% (e.g., Image 3, Image 6).
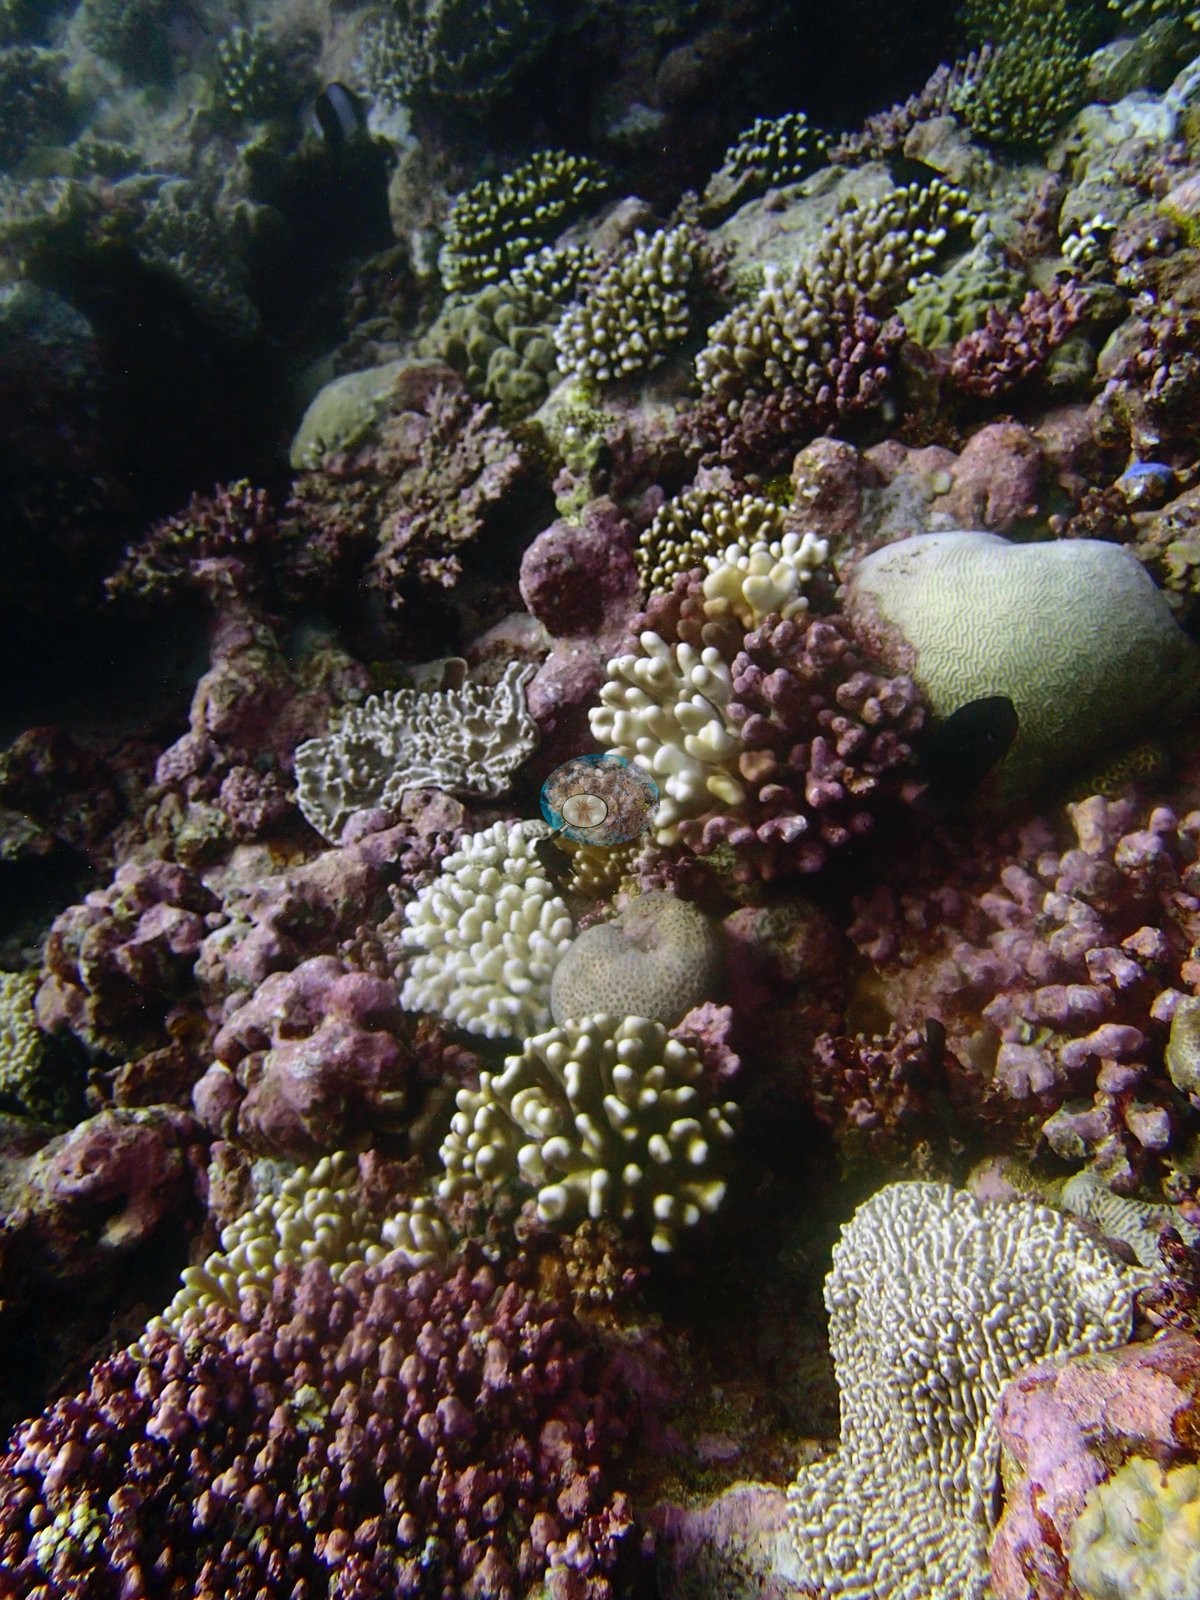
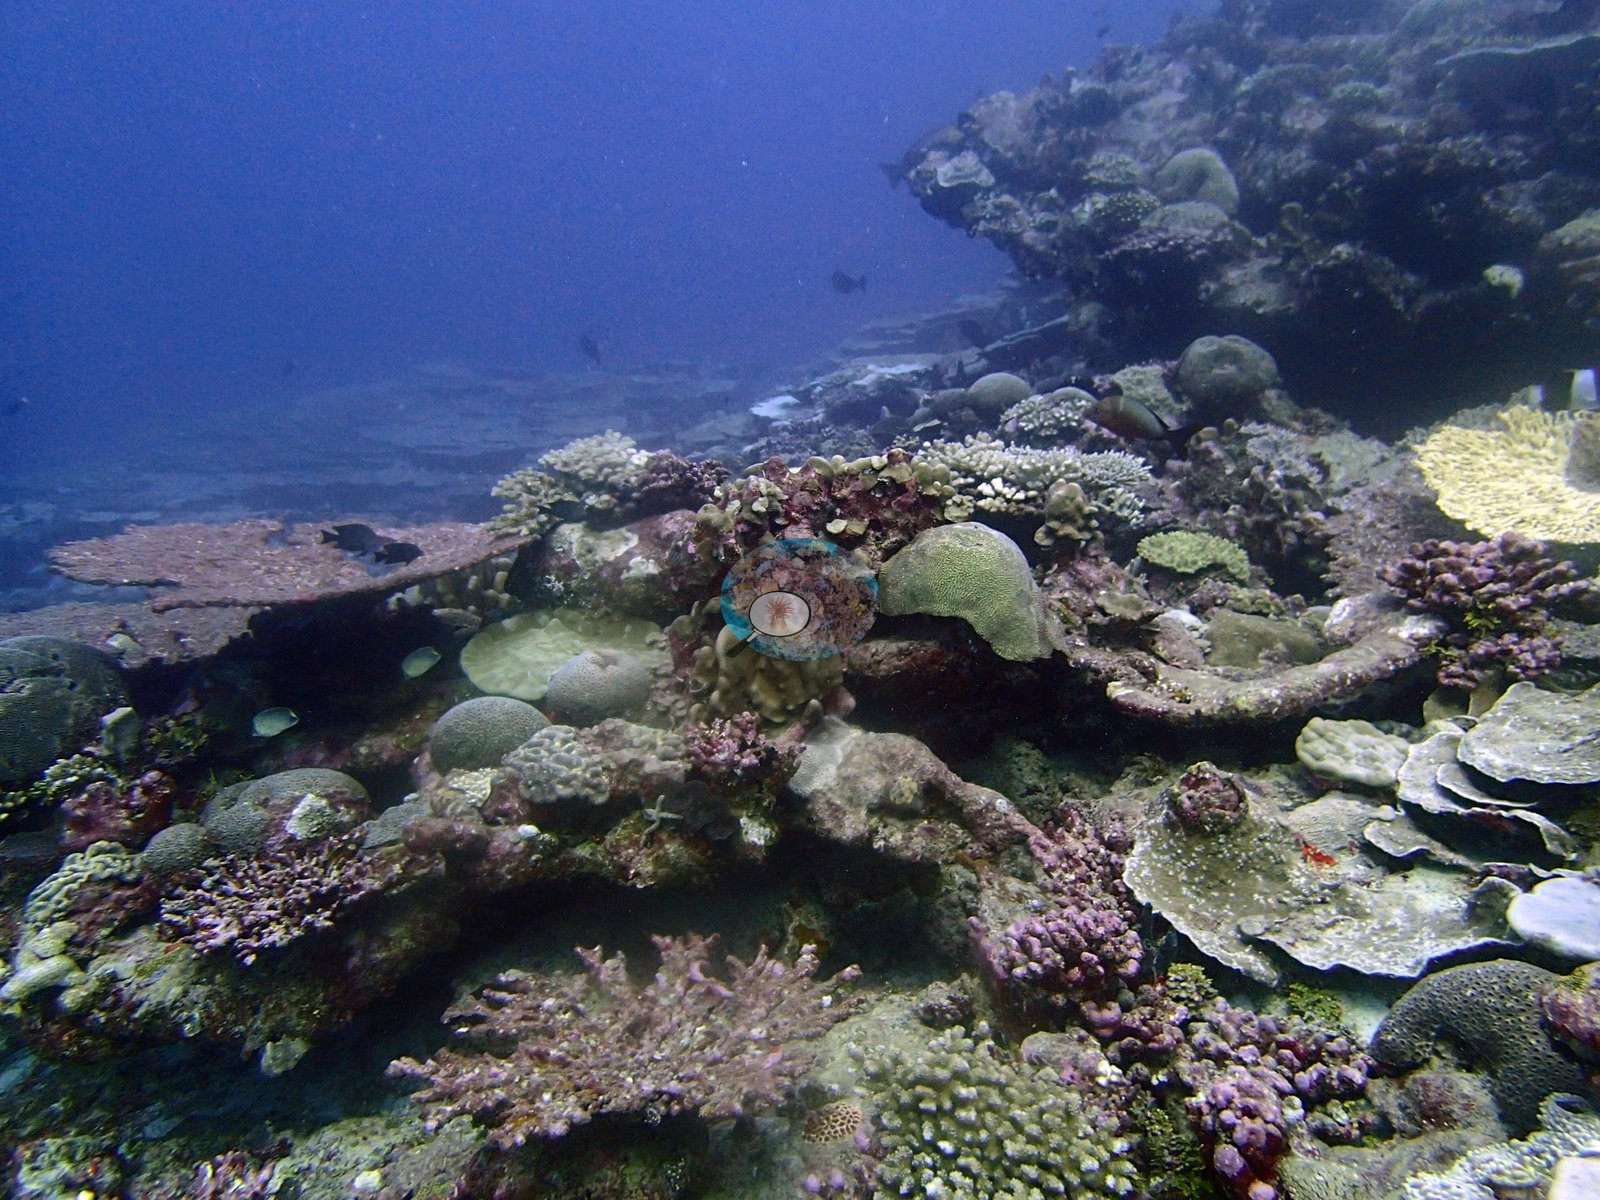
The depth profile is the finding: cover climbs gently from 40.88% to 45.50% while the leading genus changes at every station — Acropora is 41% of the coral at the shallowest transect, no genus dominates at mid-depth, and Porites takes 68% at the deepest, the two crossing over in between. The image methods read 25 points below the transects — CoralNet 17.6%, Coralscapes 18.0%. Coral cover: 43%. Live hard coral measured on the in situ benthic transects of the LOF BIOT-1 expedition (Mayfield & Dempsey 2026, Oceans, supplemental S1), against algal cover of 36% of the benthos. The transect figure is this site's authoritative cover value; no image-derived product overrides it. Across methods the same reef reads: transects 43% · CoralNet points 17.6% · Coralscapes masks 18% (11 frames). These products have different sampling footprints and denominators and should not be averaged.
Stressors
Published bleaching is 16.1%, ranked 11th of 98 on the site table's Mean(%bleaching) column, the first CoralNet training run rather than the canonical % bleaching (2nd training) column, and the photographs support it unambiguously: a single stark-white table alone in one frame, clustered white plates in another, cream-white branching colonies beside pigmented neighbors (e.g., Image 14, Image 8, Image 15).
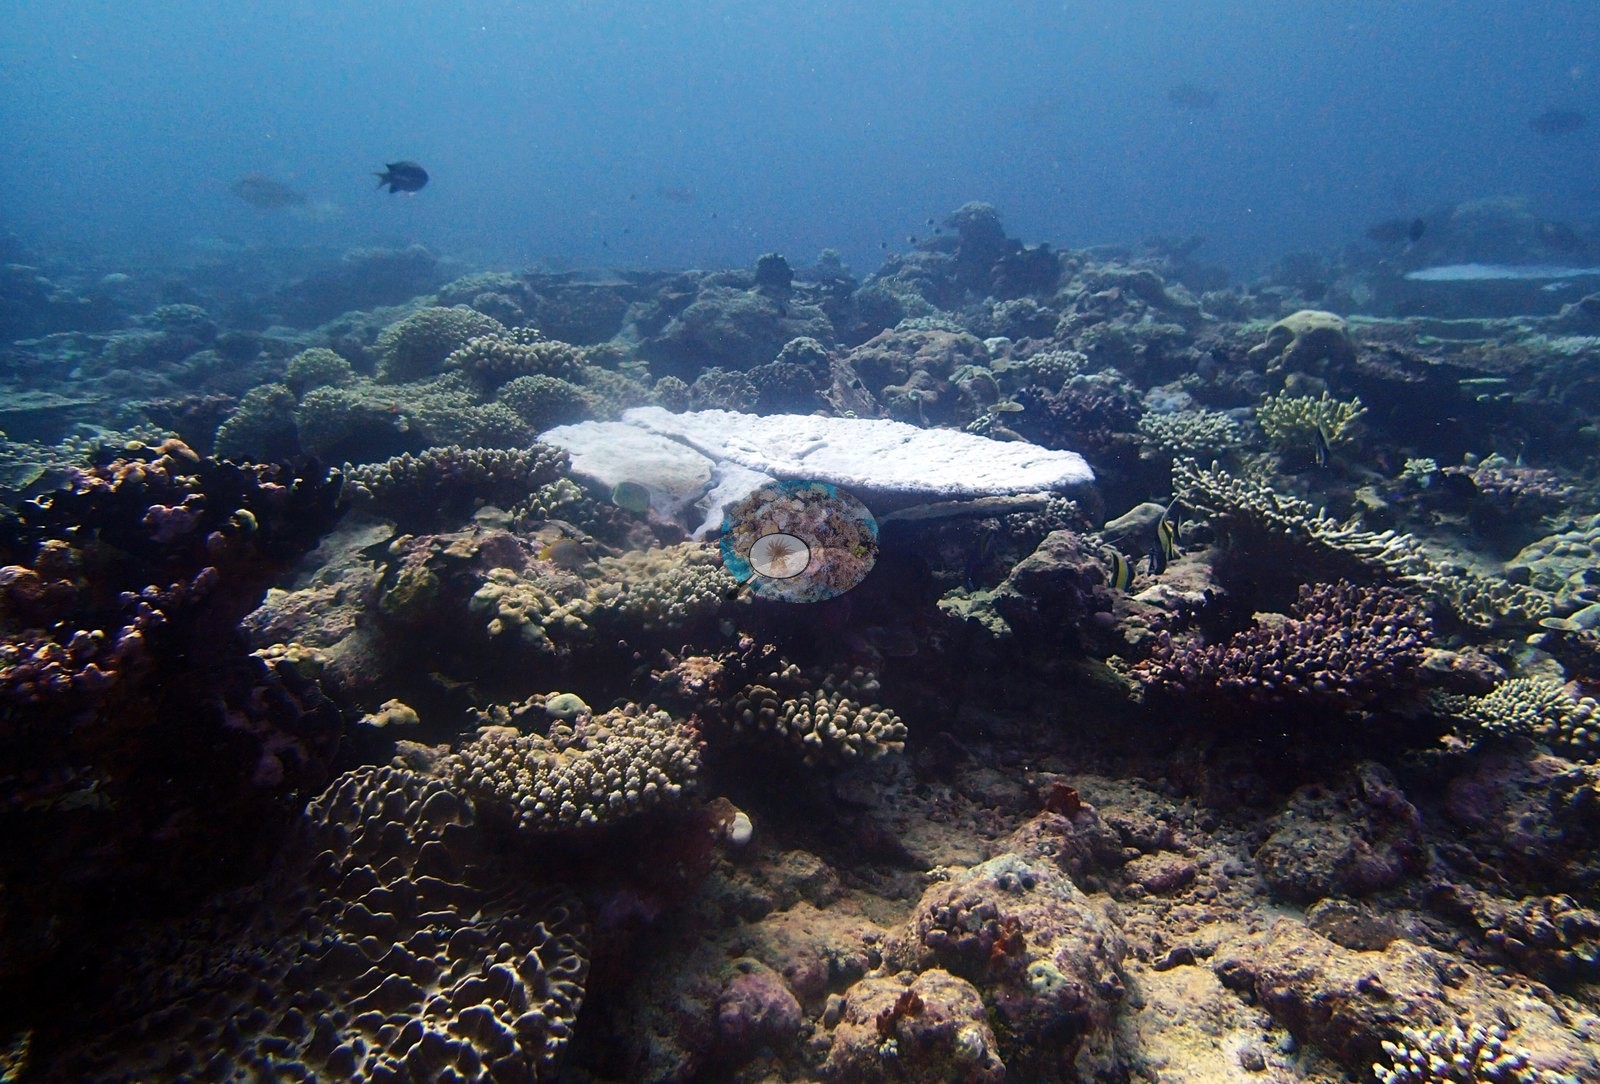
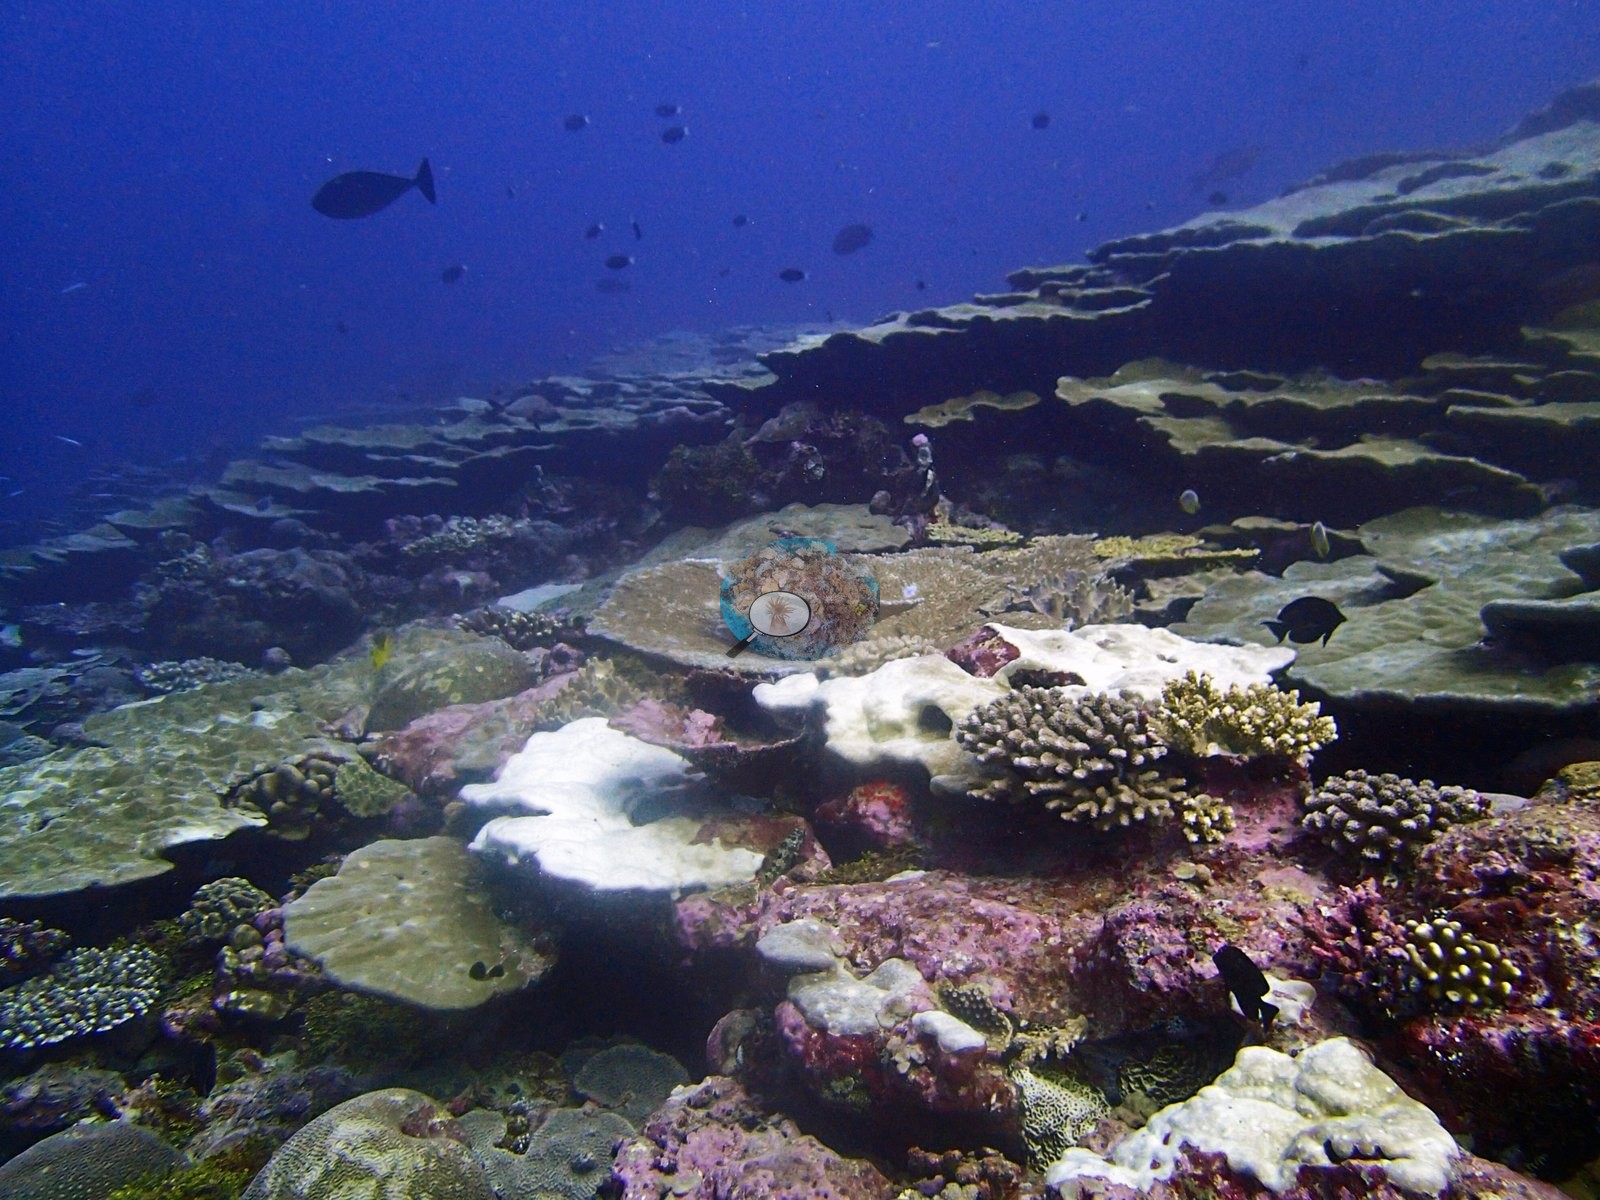
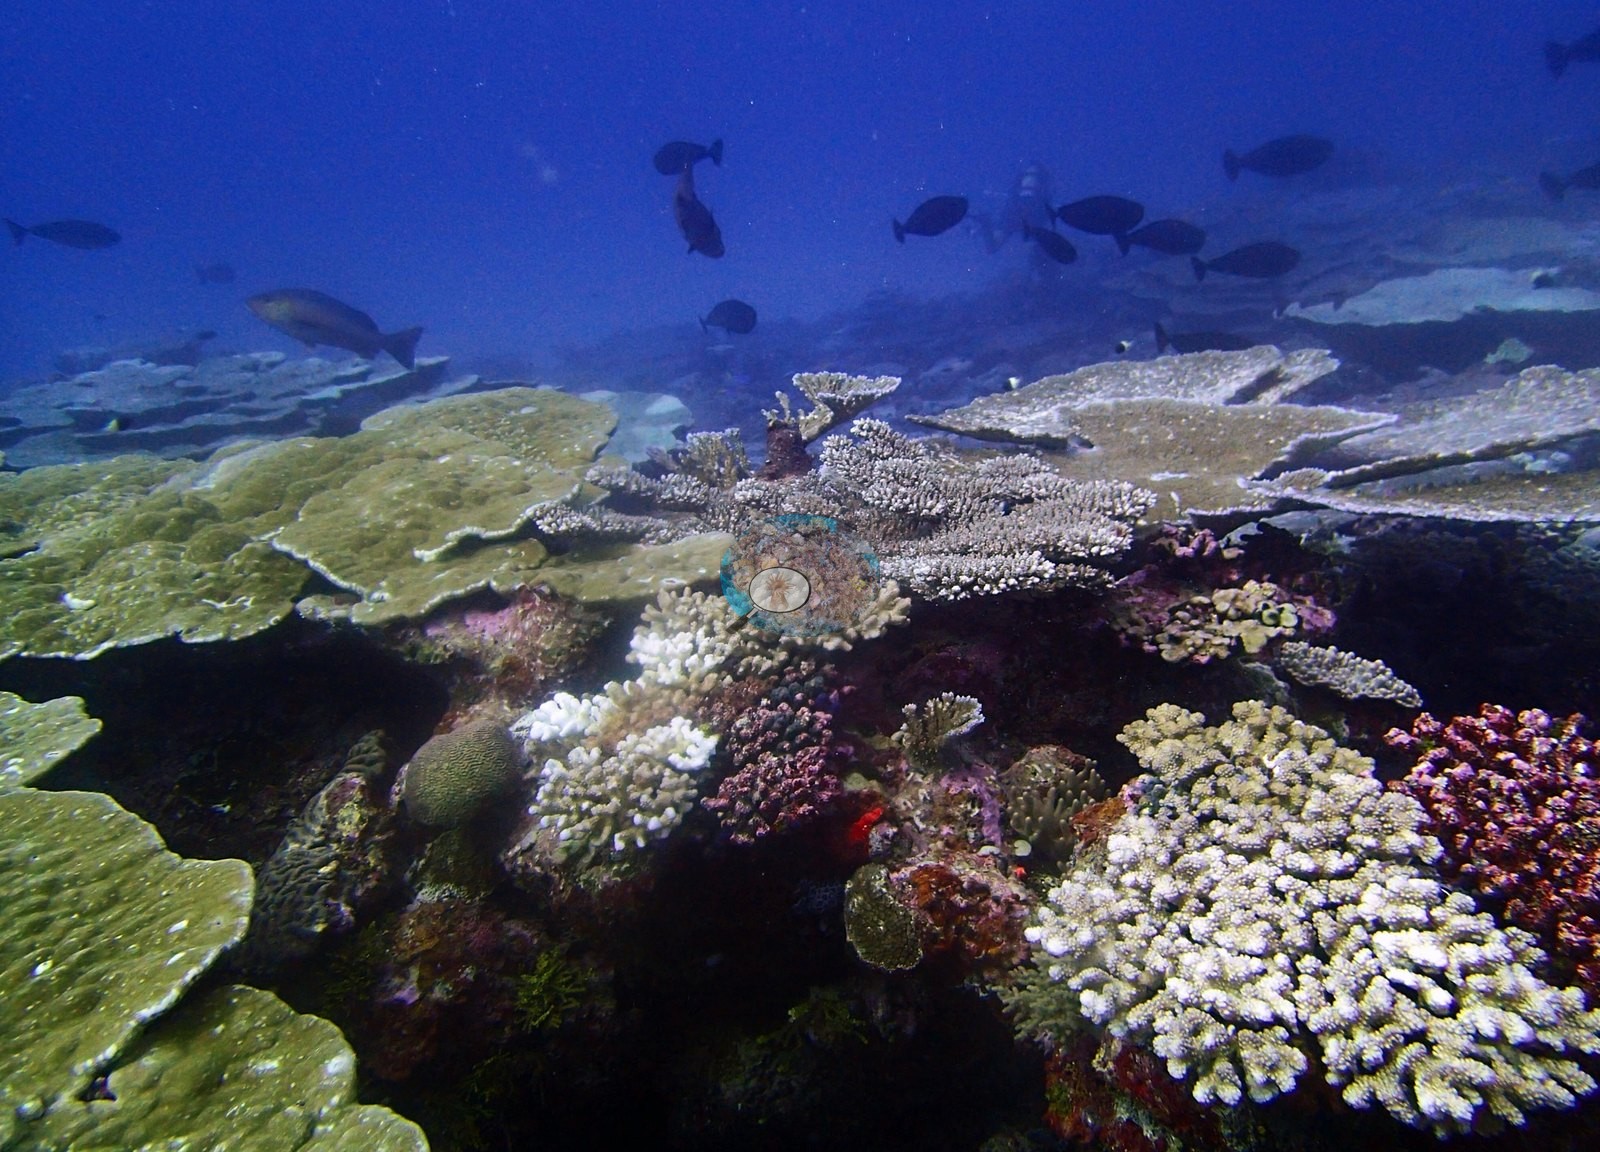
Much of the extensive tabular framework appears to be standing dead and coralline-veneered, which would reconcile a photograph full of tables with a Porites-led transect (e.g., Image 2, Image 13).
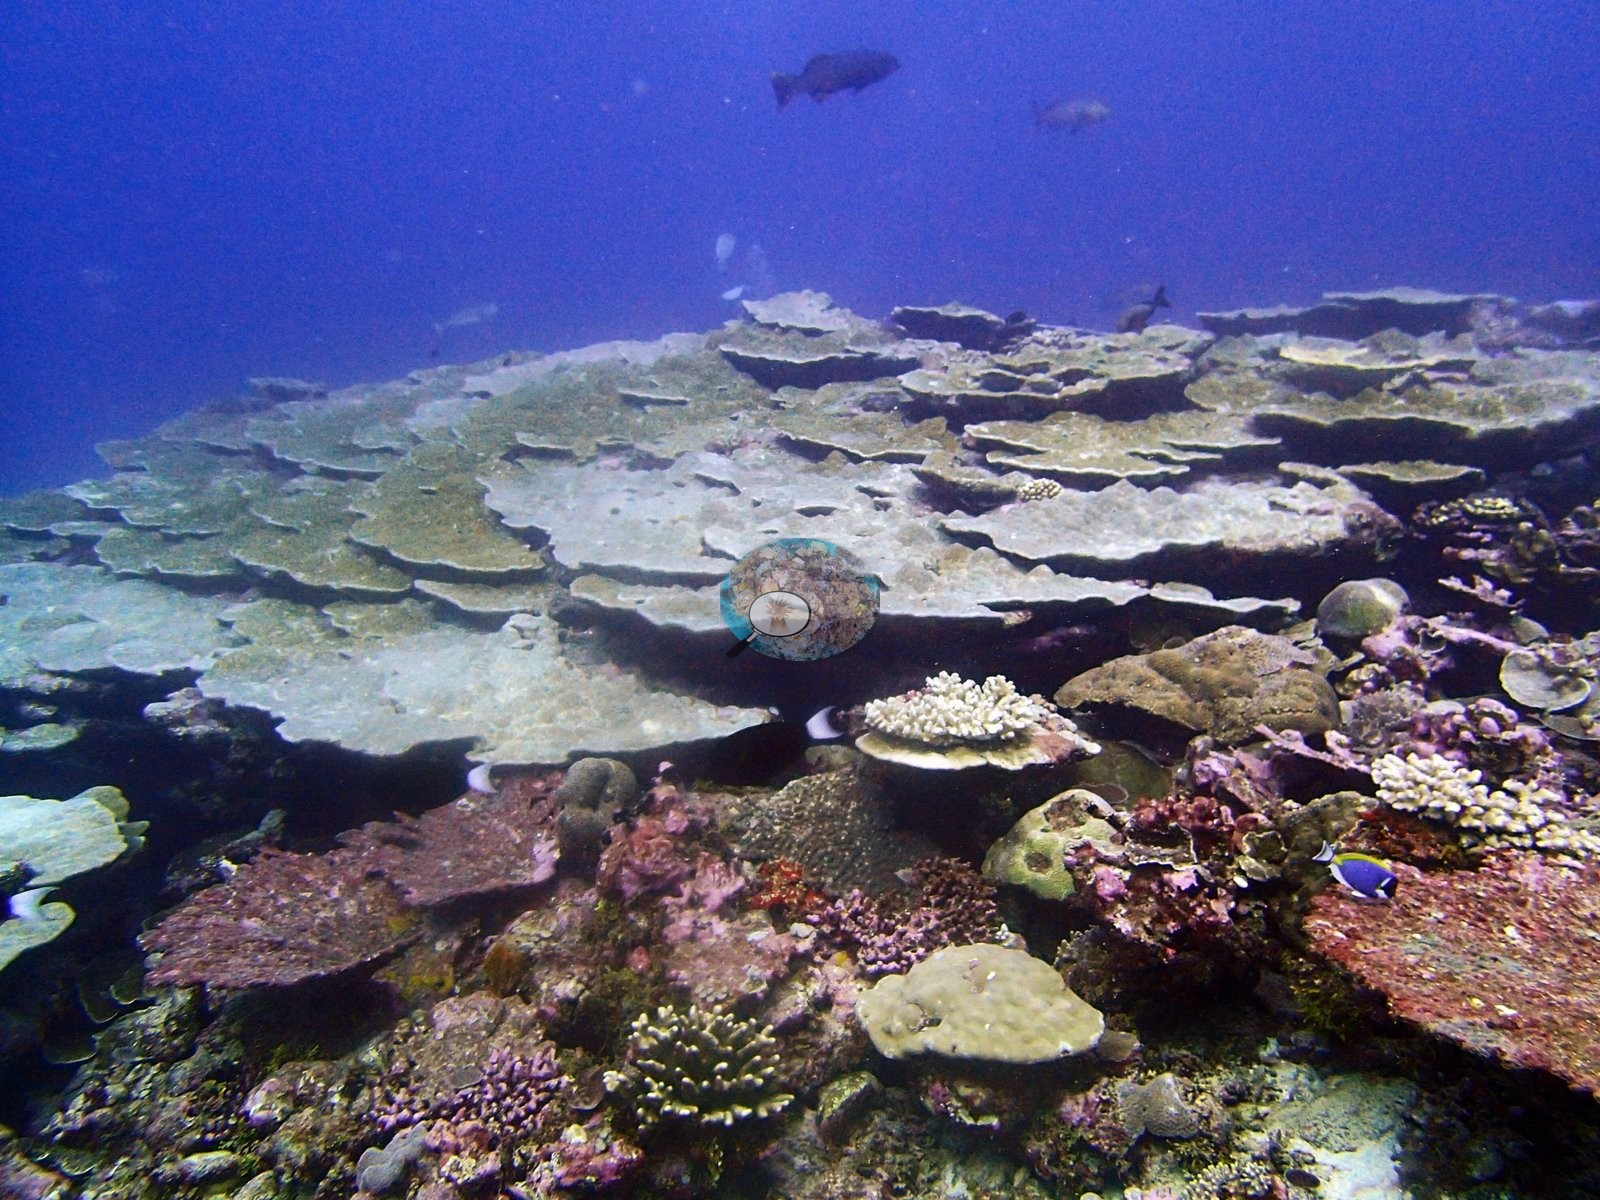
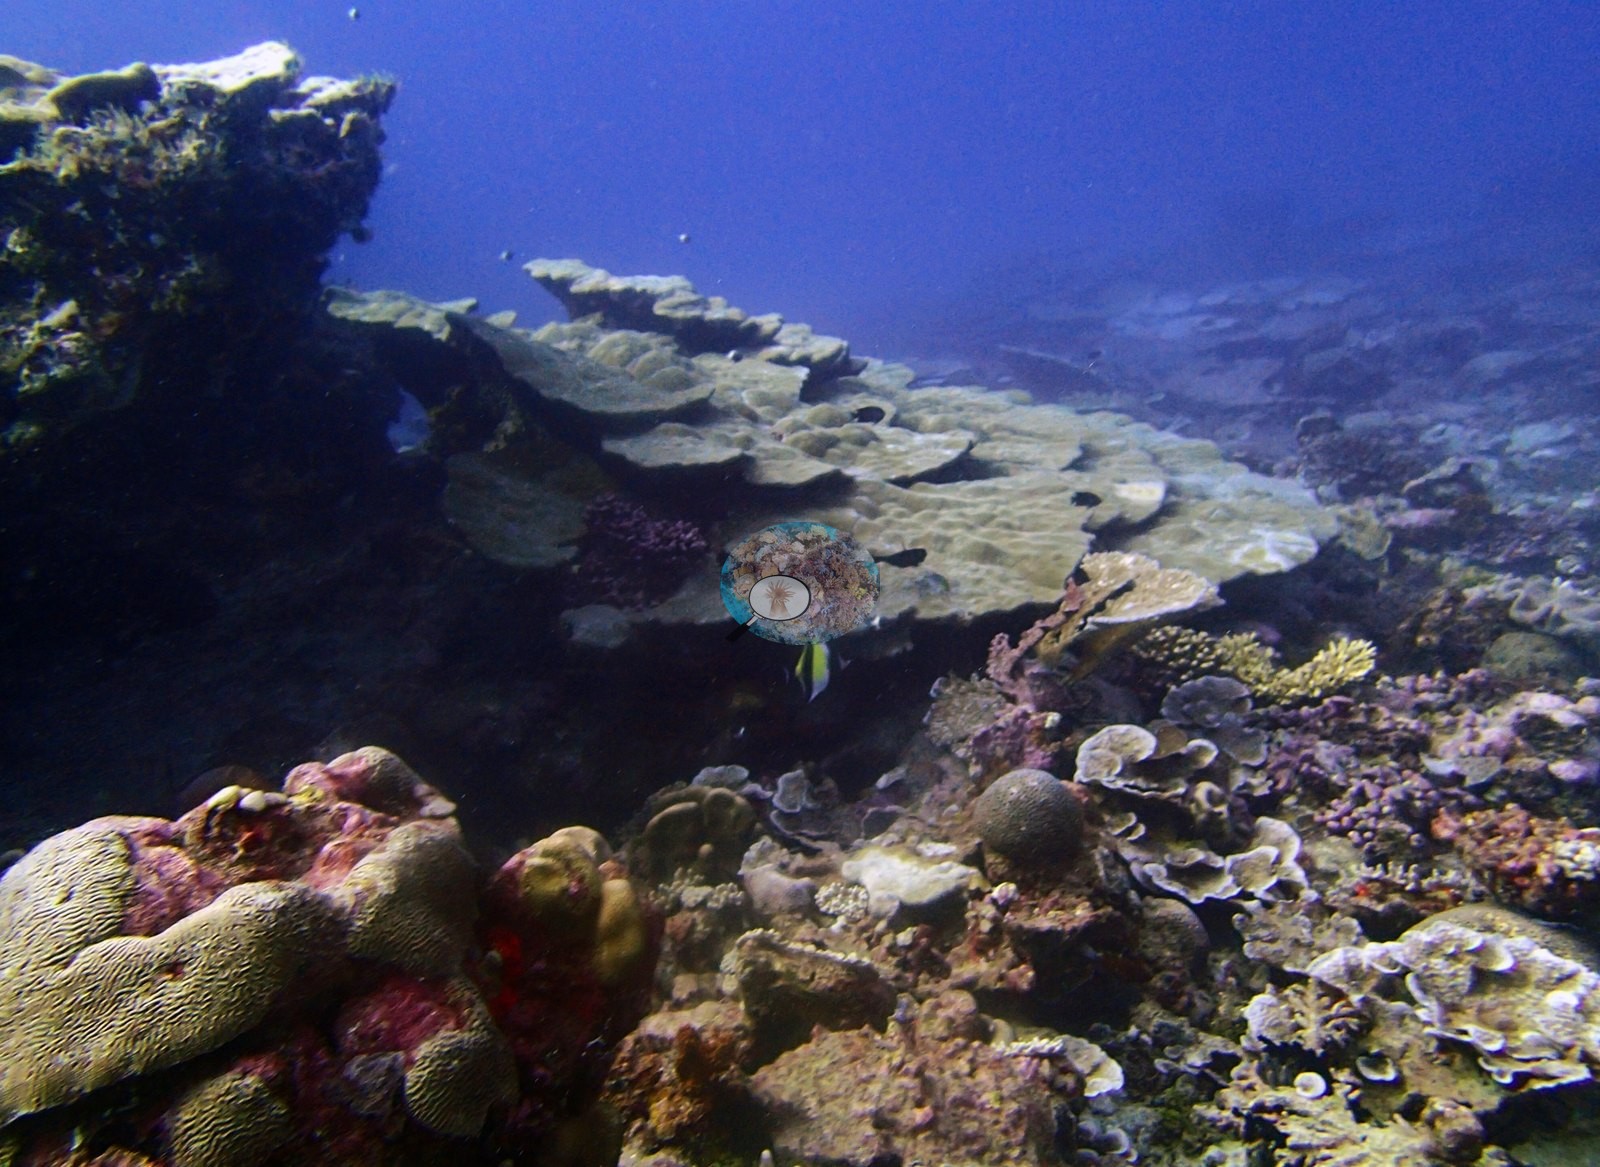
No disease or crown-of-thorns was seen.
Comparisons with other data
No independent survey was made at this exact site; the nearest ones are listed in the table below.
CV model comparison
More info
Those are point counts on the photographs; this is a diver swimming a transect. The models and the reference never saw the same thing. ⚠ SITE-LEVEL ONLY. The 2,500 frames were not associated with any transect taken within 200 m of them, so transect-vs-image comparisons are site means, never frames. The transect value is already in the pin `cover` field (109 of 112 pins, sourced to the paper's suppl. S1) and is read from there, never re-imported. The transect is THE coral-cover value for this site and stands alone. The rows below it are a methods comparison only: no computer-vision value is averaged with it, feeds the headline, or carries over to the site's cover figure (Anderson, 2026-09-22).| Method | Hard-coral cover (%) |
|---|---|
| Transect (published) | 43.0 |
| CoralNet | 29.8 |
| In-house DINOv3 | 26.1 |
| CoralSCOP edited | 33.5 |
| Claude | 25.7 |
Independent surveys nearby
Within 5 km, 3 independent survey stations recorded hard coral cover in 2015. The most recent nearby survey is from 2015, so these values predate recent heat stress. This site's own estimate (43%) sits 25.8 points above the range of these surveys (3.4–17%); the methods differ, so the comparison is context, not a like-for-like test.
Collected by other programs using different methods (the XL Catlin Seaview Survey uses photo-transects with automated image annotation), so these are context for the figures above, not a like-for-like comparison. Where a station was surveyed more than once the range is shown. Station names are not dive-site names.
| Agency | Site / location | Date | Hard coral cover (%) | Distance | Link |
|---|---|---|---|---|---|
| XL Catlin Seaview Survey | transect 36026 | 2015 | 12% | 2.20 km | — |
| XL Catlin Seaview Survey | transect 36024 | 2015 | 17% | 2.66 km | — |
| XL Catlin Seaview Survey | transect 36025 | 2015 | 3.4% | 3.35 km | — |
Data & links
- Read the full site report ↗
- Download benthic survey data (CSV) ↗
- Download all LOF-GRE data (933 sites) ↗
- CoralNet image repository for this region ↗
- Photo portfolio ↗
- Coral Reef Diagnostics page for this area ↗
All images from Coral Reef Diagnostics. Data are from Coral Reef Diagnostics and the organizations named in the data-sources table above.
 © Coral Reef Diagnostics.