
Part of the regional summaries: Chagos Archipelago - Salomon / Blenheim / Speakers Bank and Chagos Archipelago
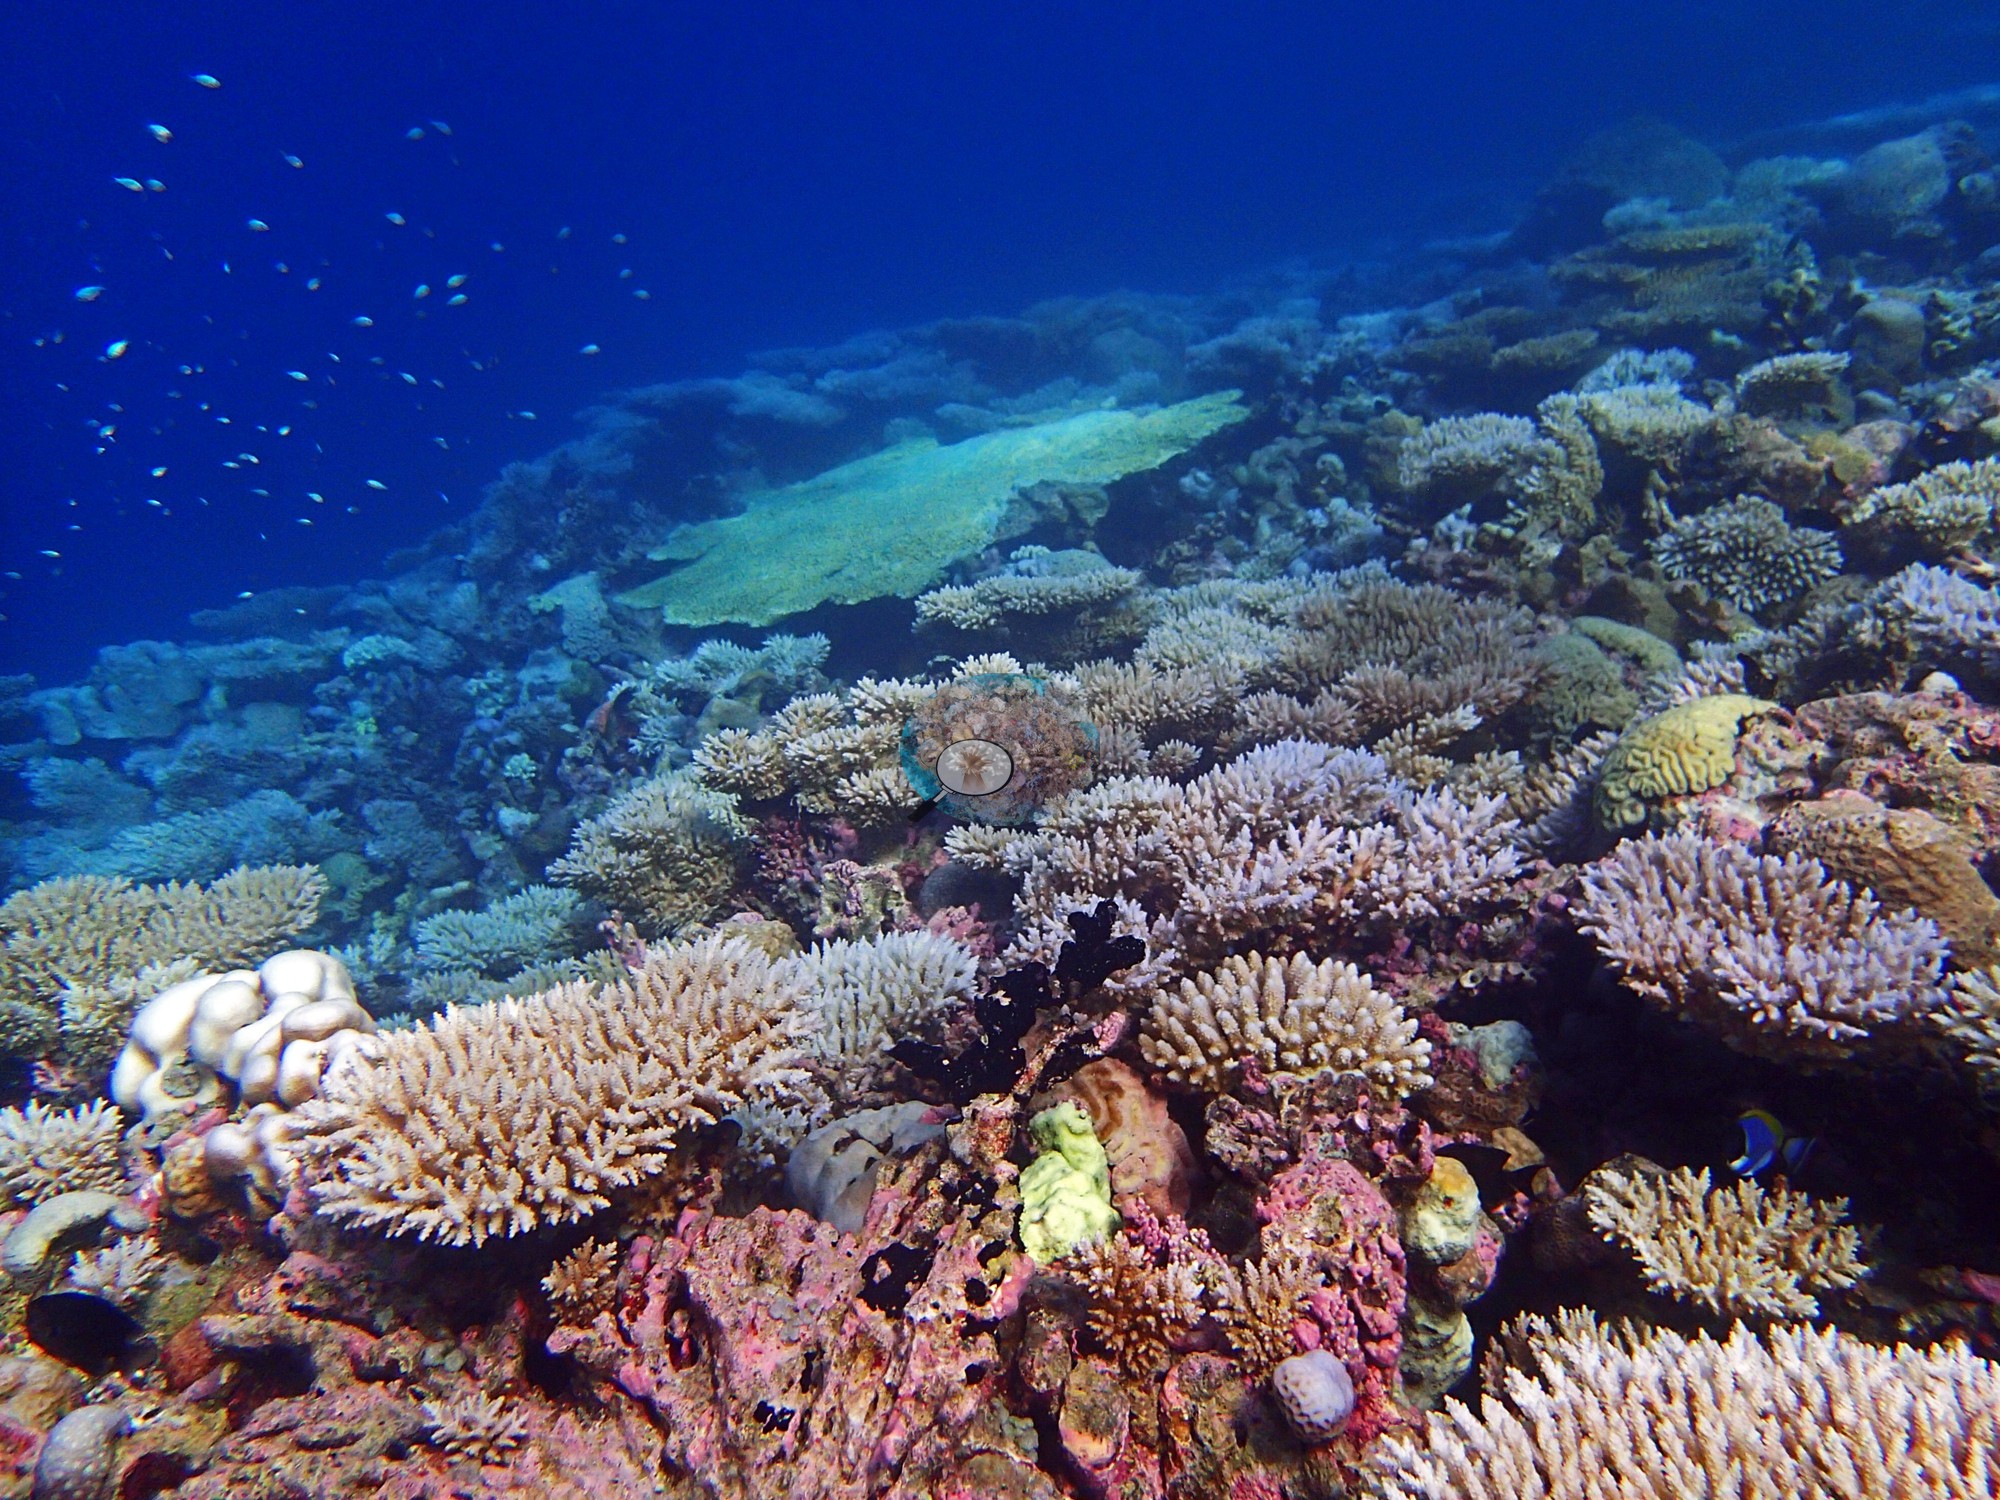
More info
Chagos (NOAA CRW virtual station)BIBL87 has the highest coral genus diversity of all 109 Chagos sites surveyed (36 genera), with no single taxon dominating - Acropora leads at just 20%. Cover measured 41% with about 10% of coral bleached, and the reef alternates between open pavement and denser branching-and-table habitat. Surveyed on the Living Oceans Foundation's Global Reef Expedition.
One independent survey station shown with the program’s logo — click one to see how far it is from this site.
One other CRD dive site within 5 km shown in orange — click a marker to open its page.
🗺 Detailed map of the Global Reef Expedition dive sites, Blenheim Reef, Chagos (Khaled bin Sultan Living Oceans Foundation; opens in a new window)
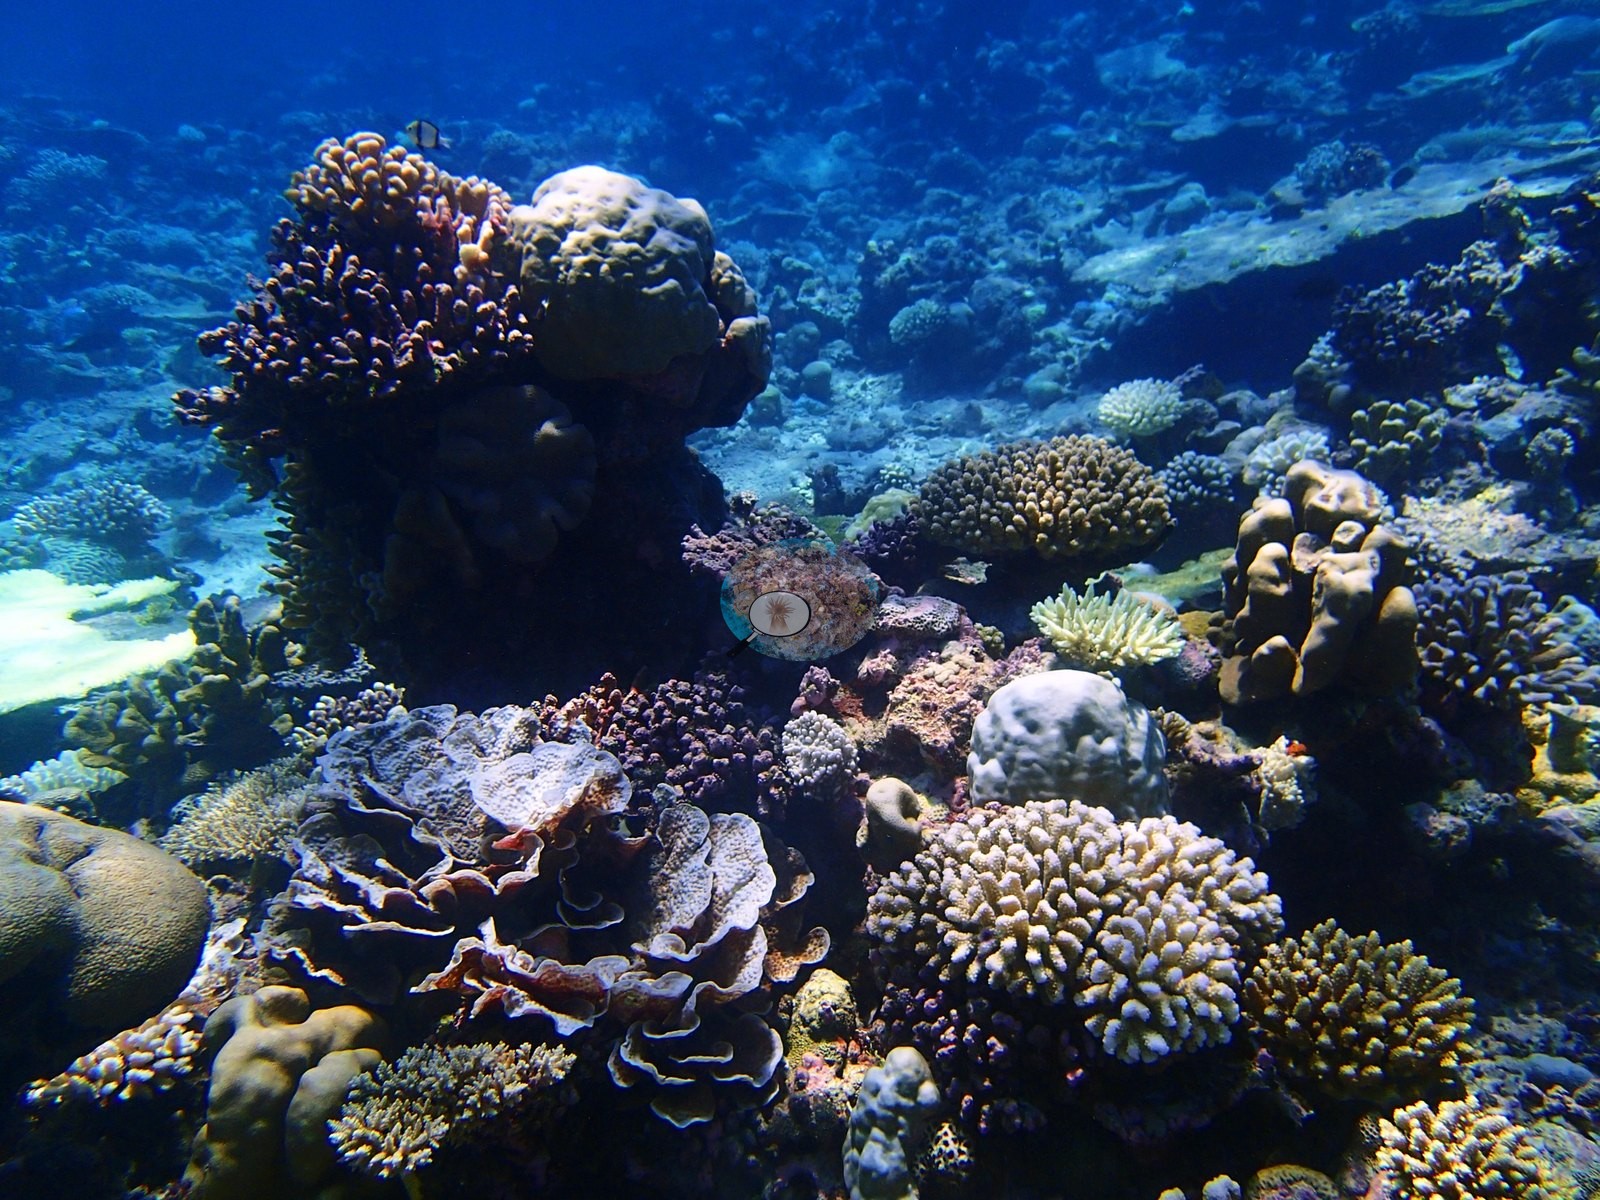
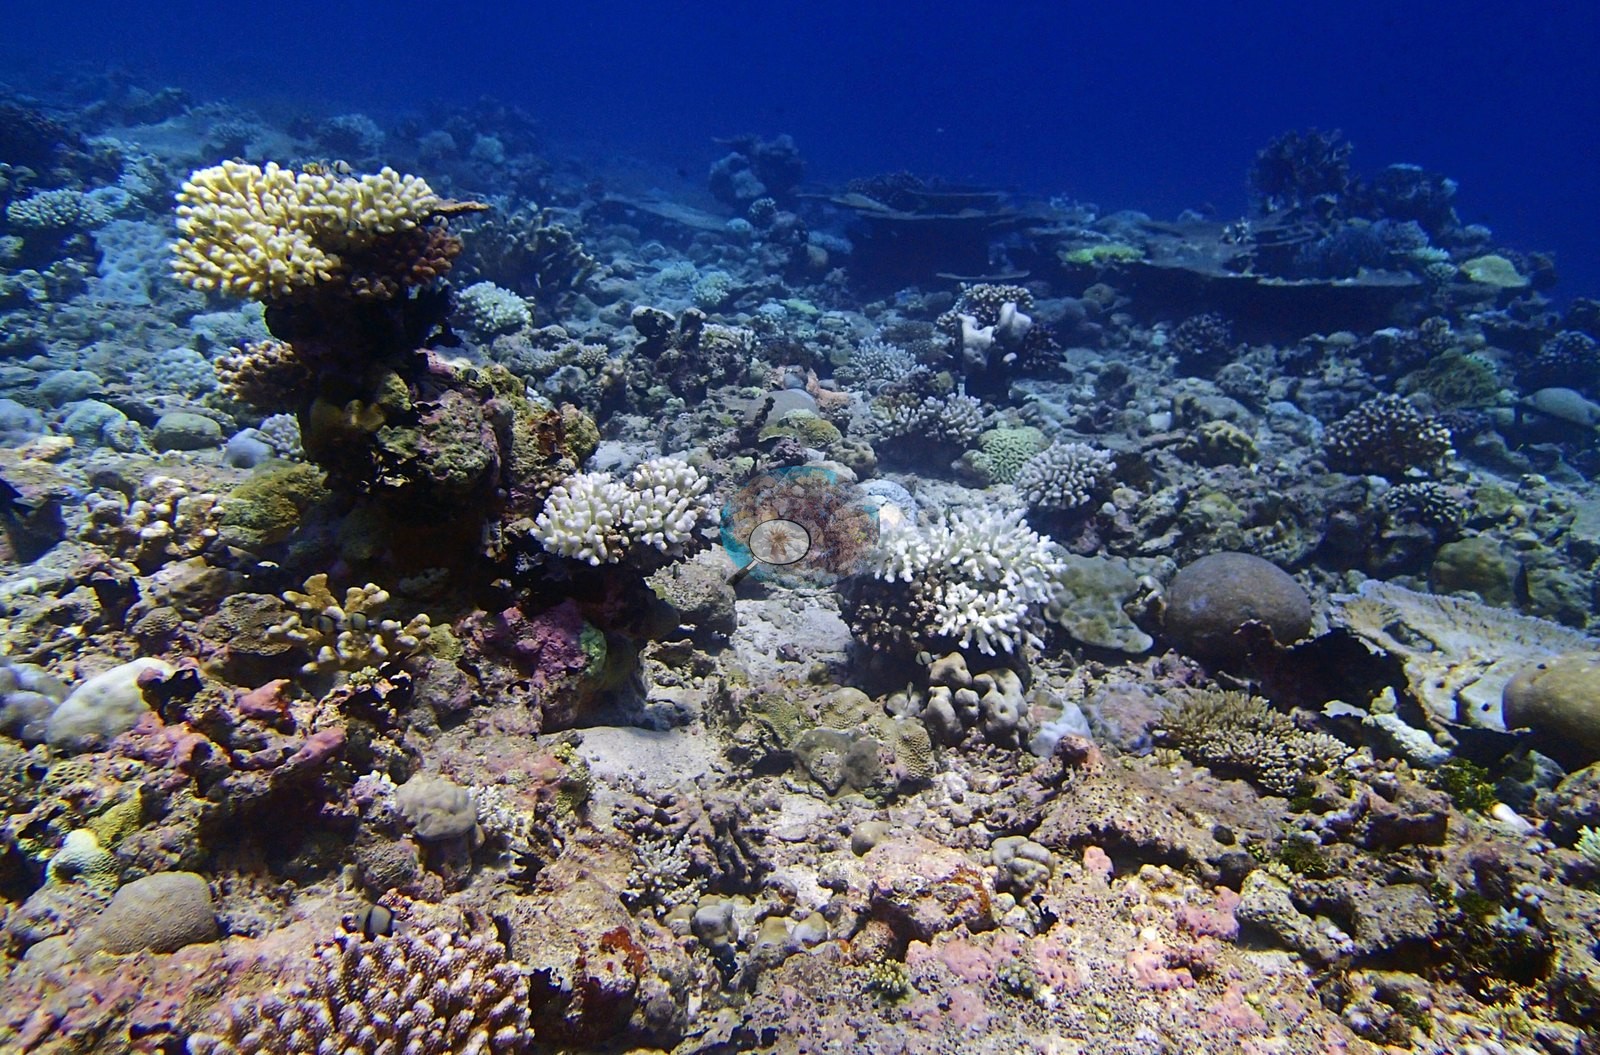
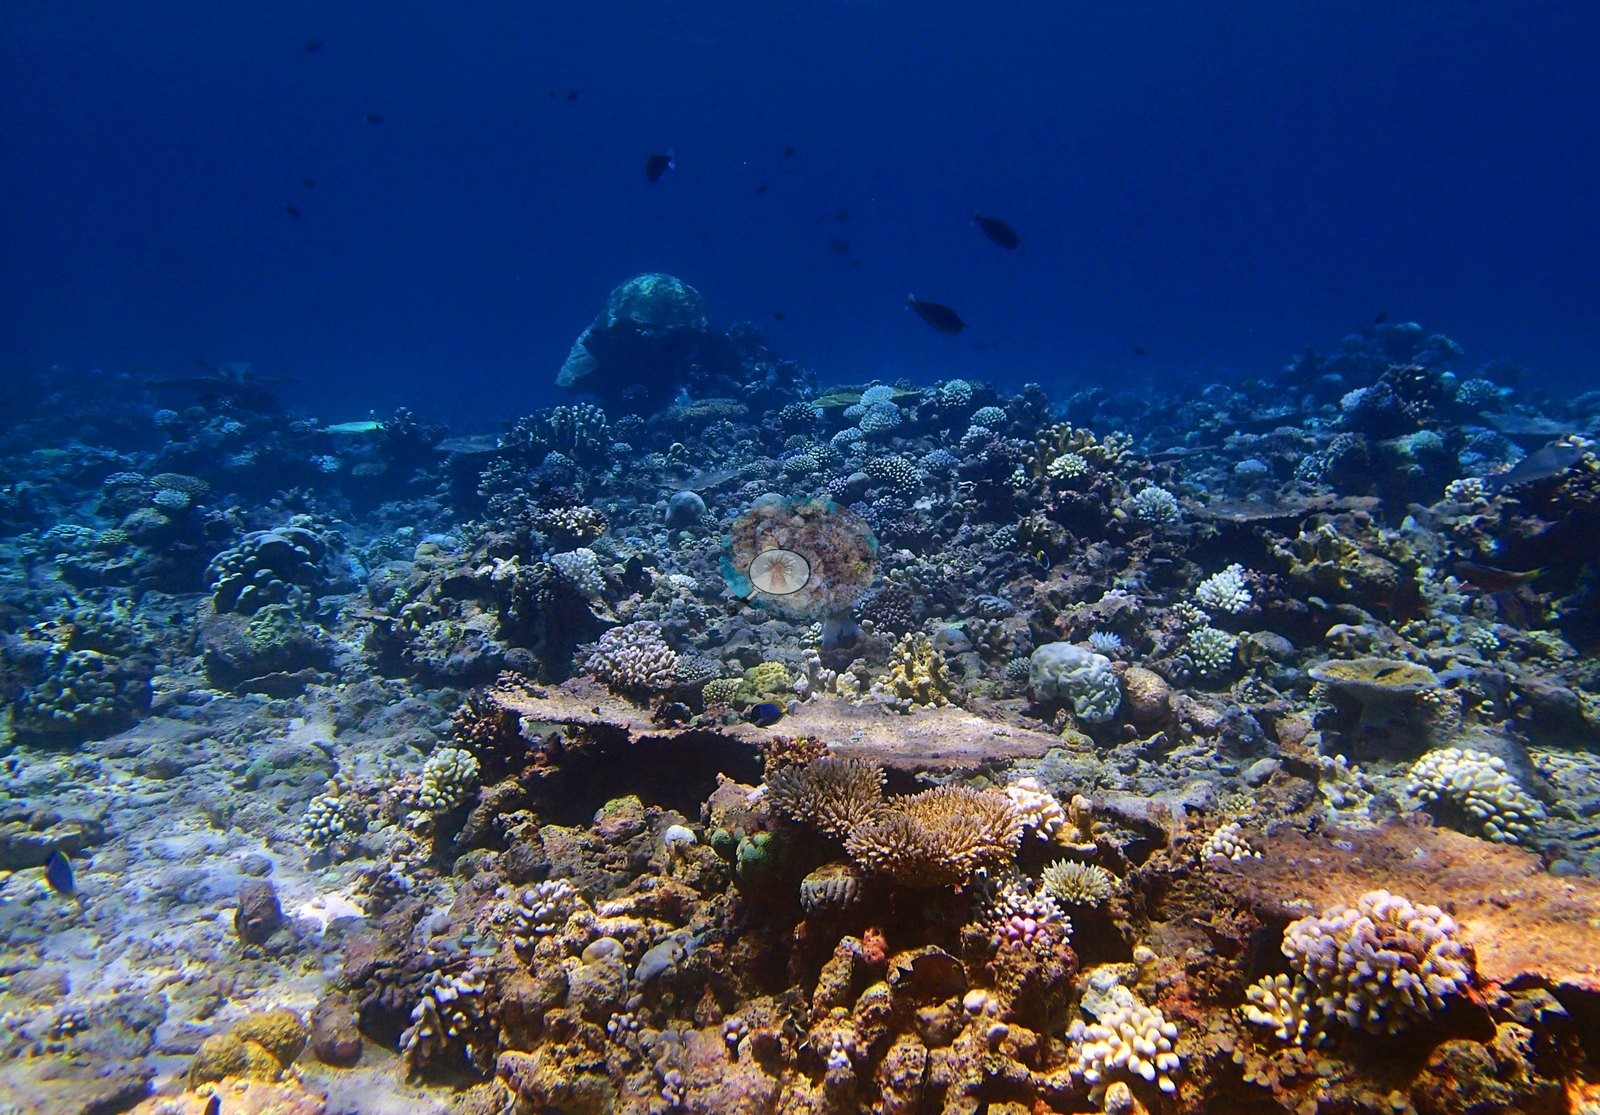
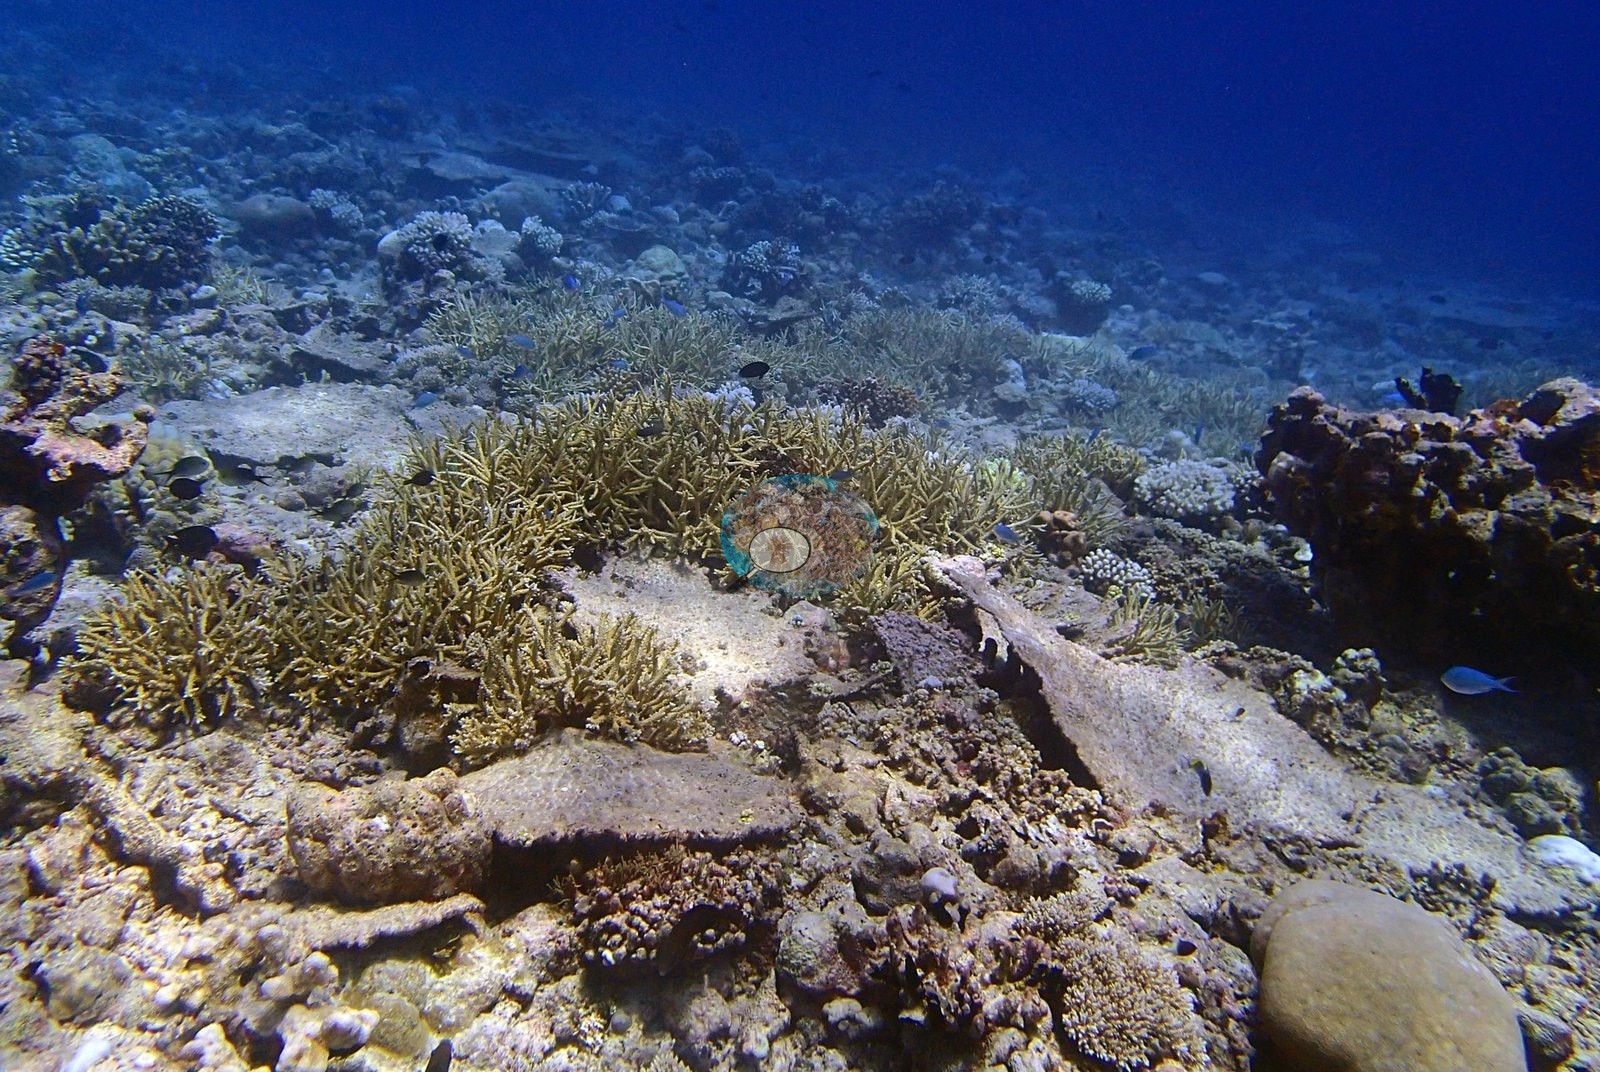
25 of these 35 photographs are shown beside the text that discusses them under "Site description" below.
Site description
Setting
BIBL87 is a submerged forereef at Blenheim under intermediate exposure, surveyed 23 April 2015 at 27.4 m.
General benthic features
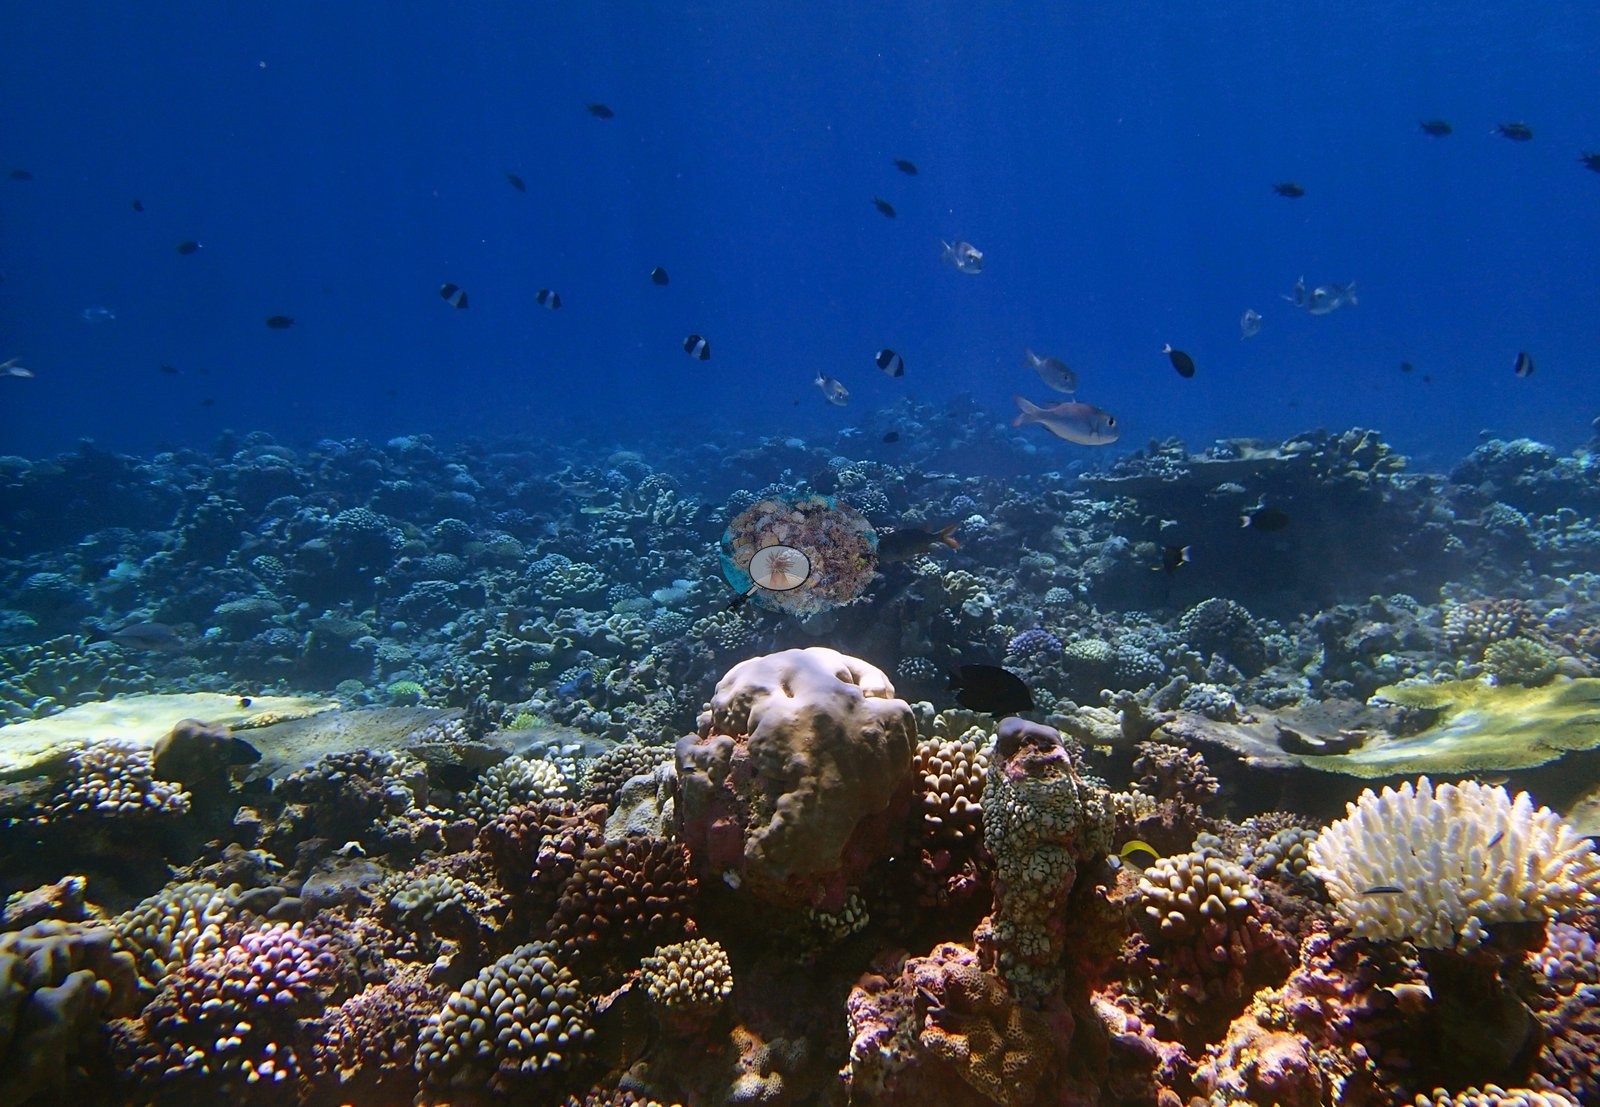
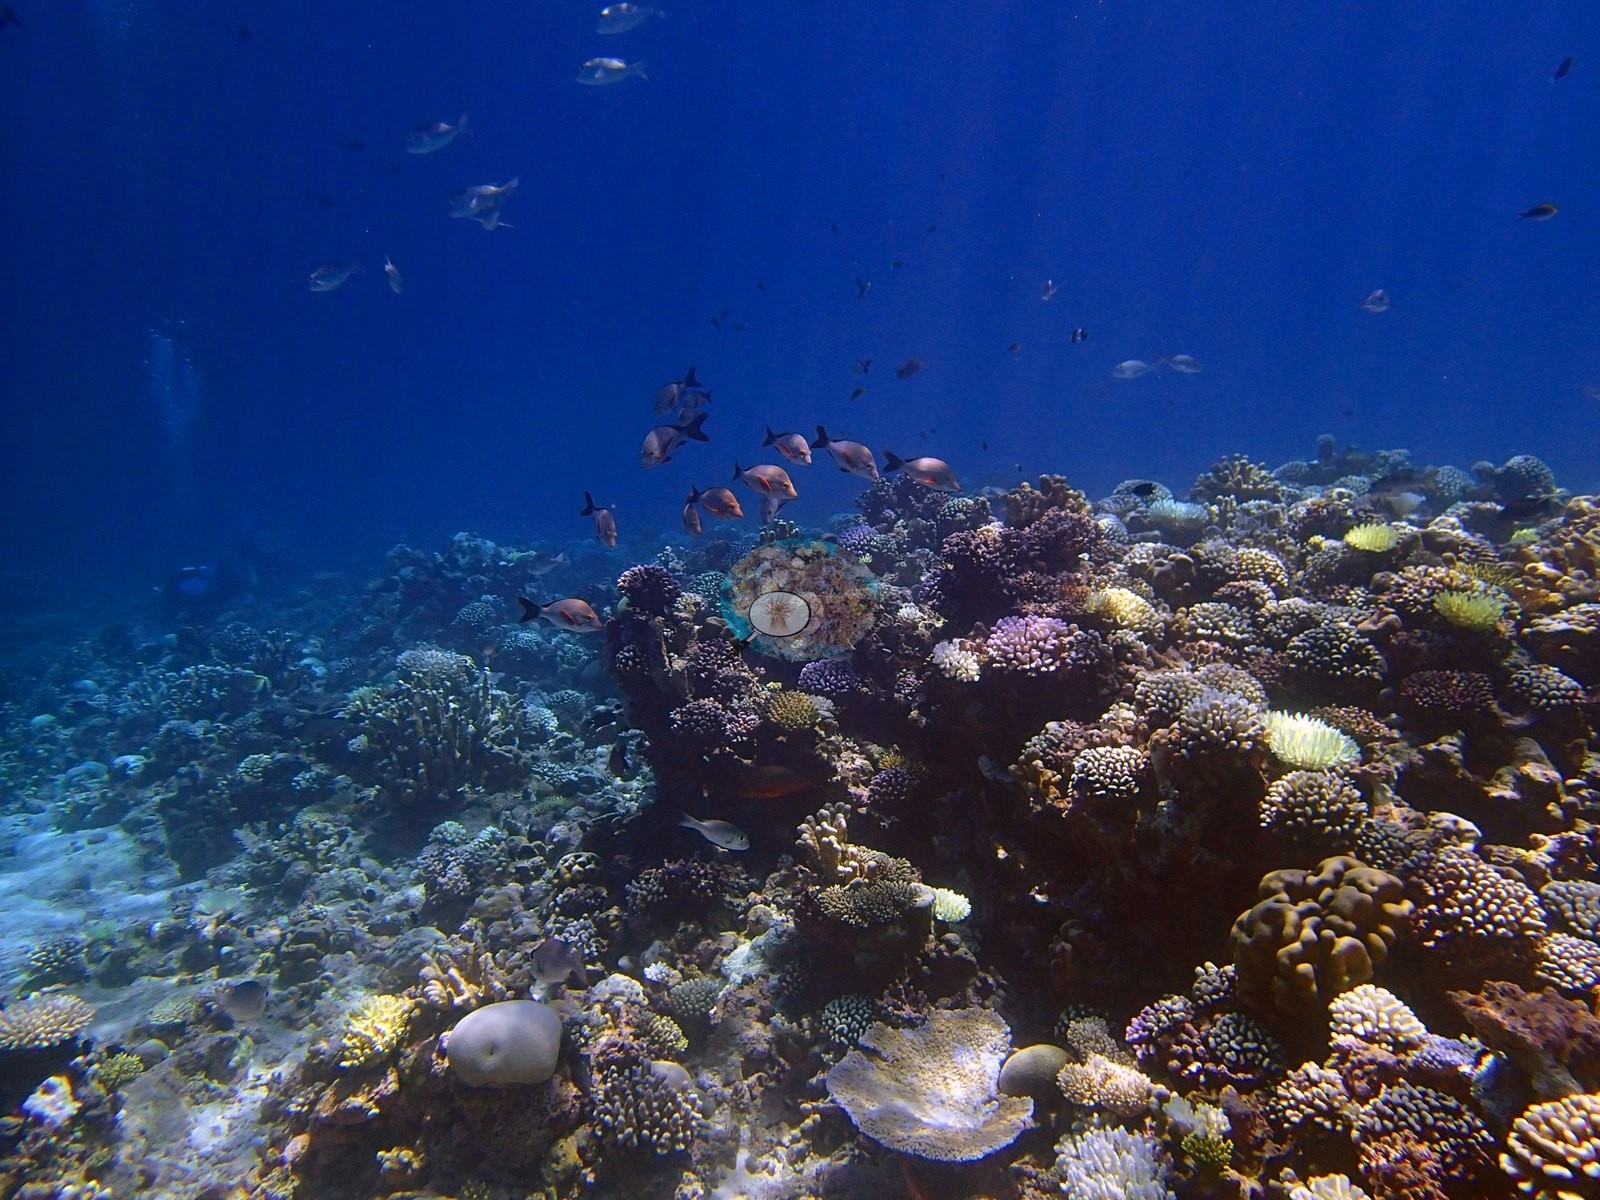
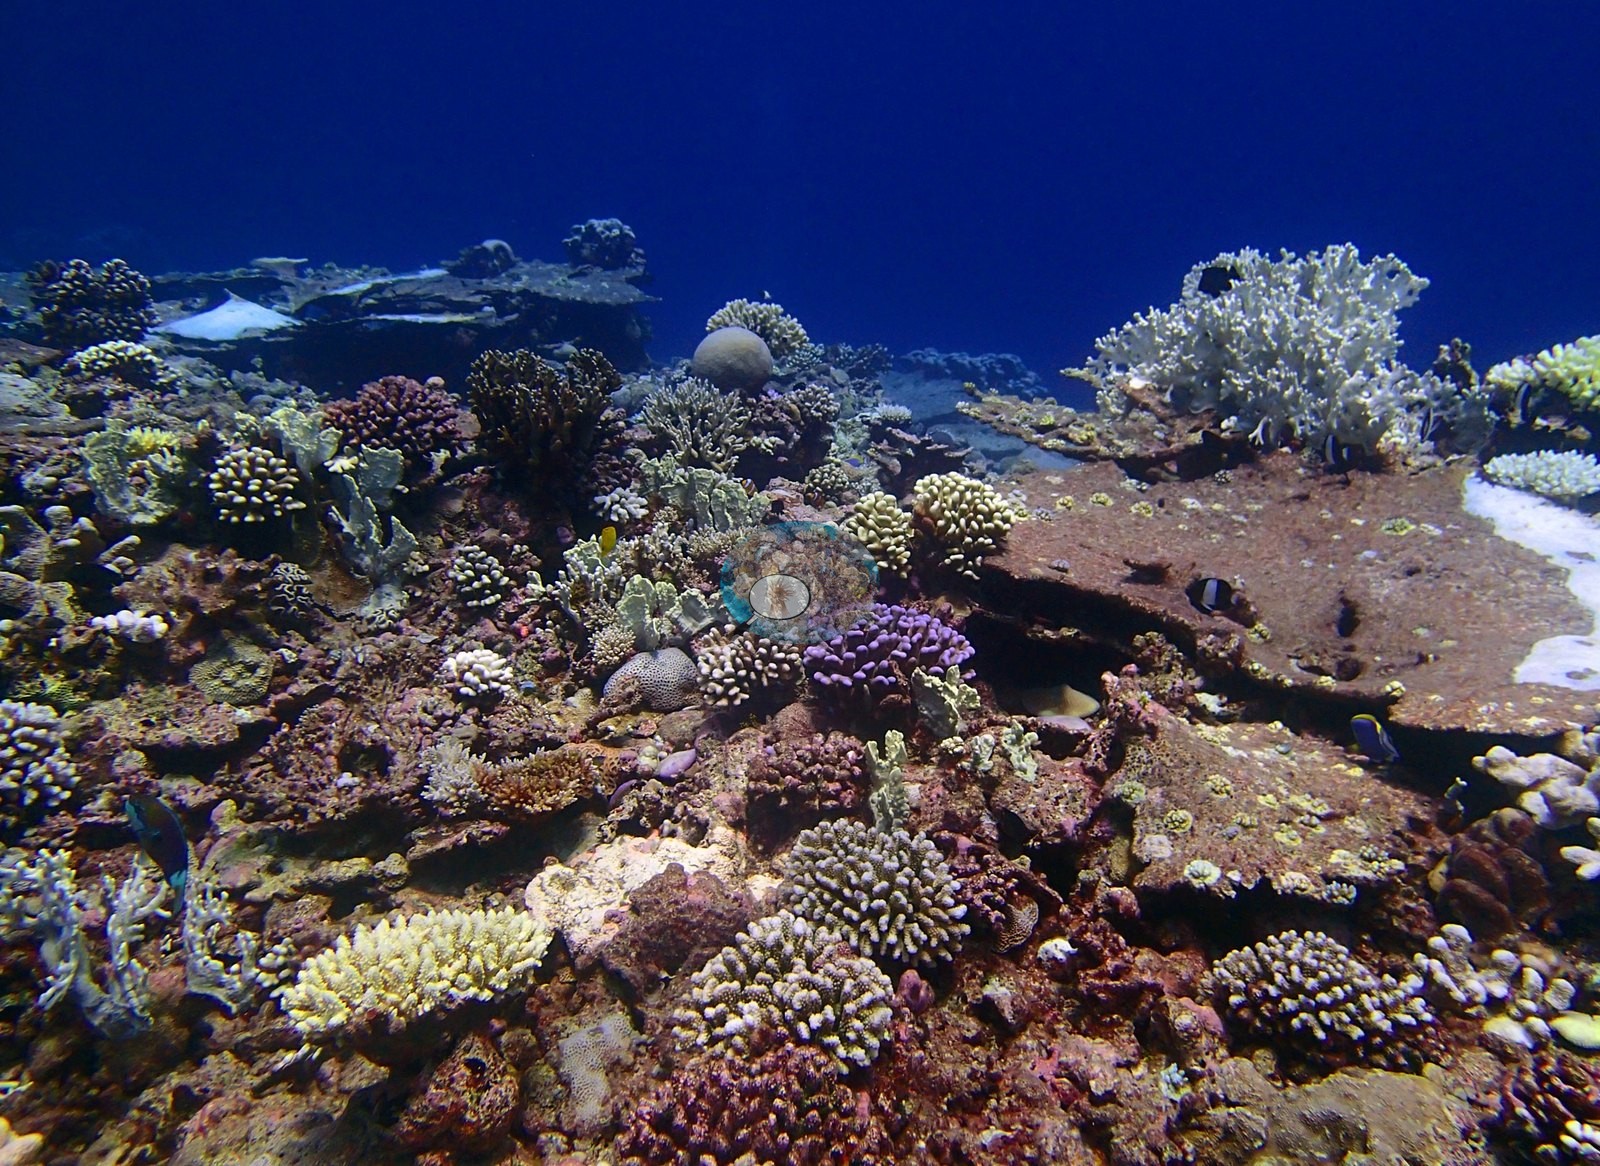
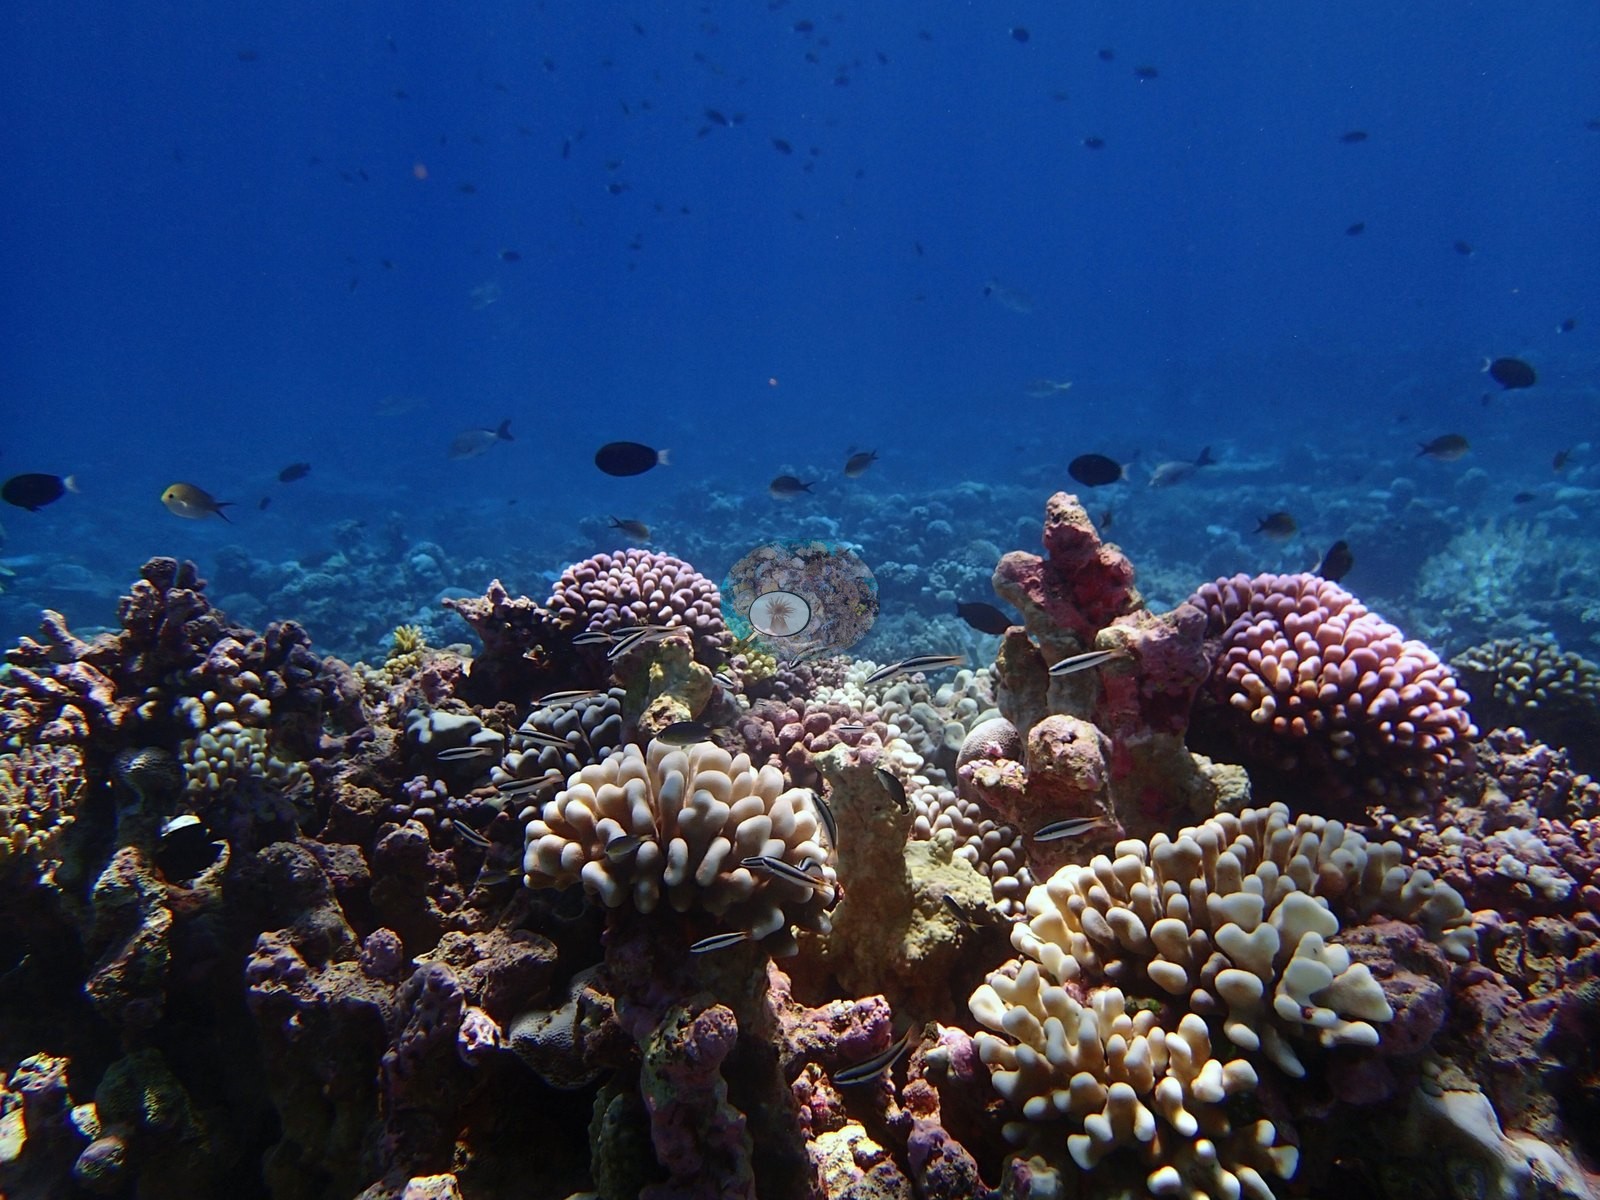
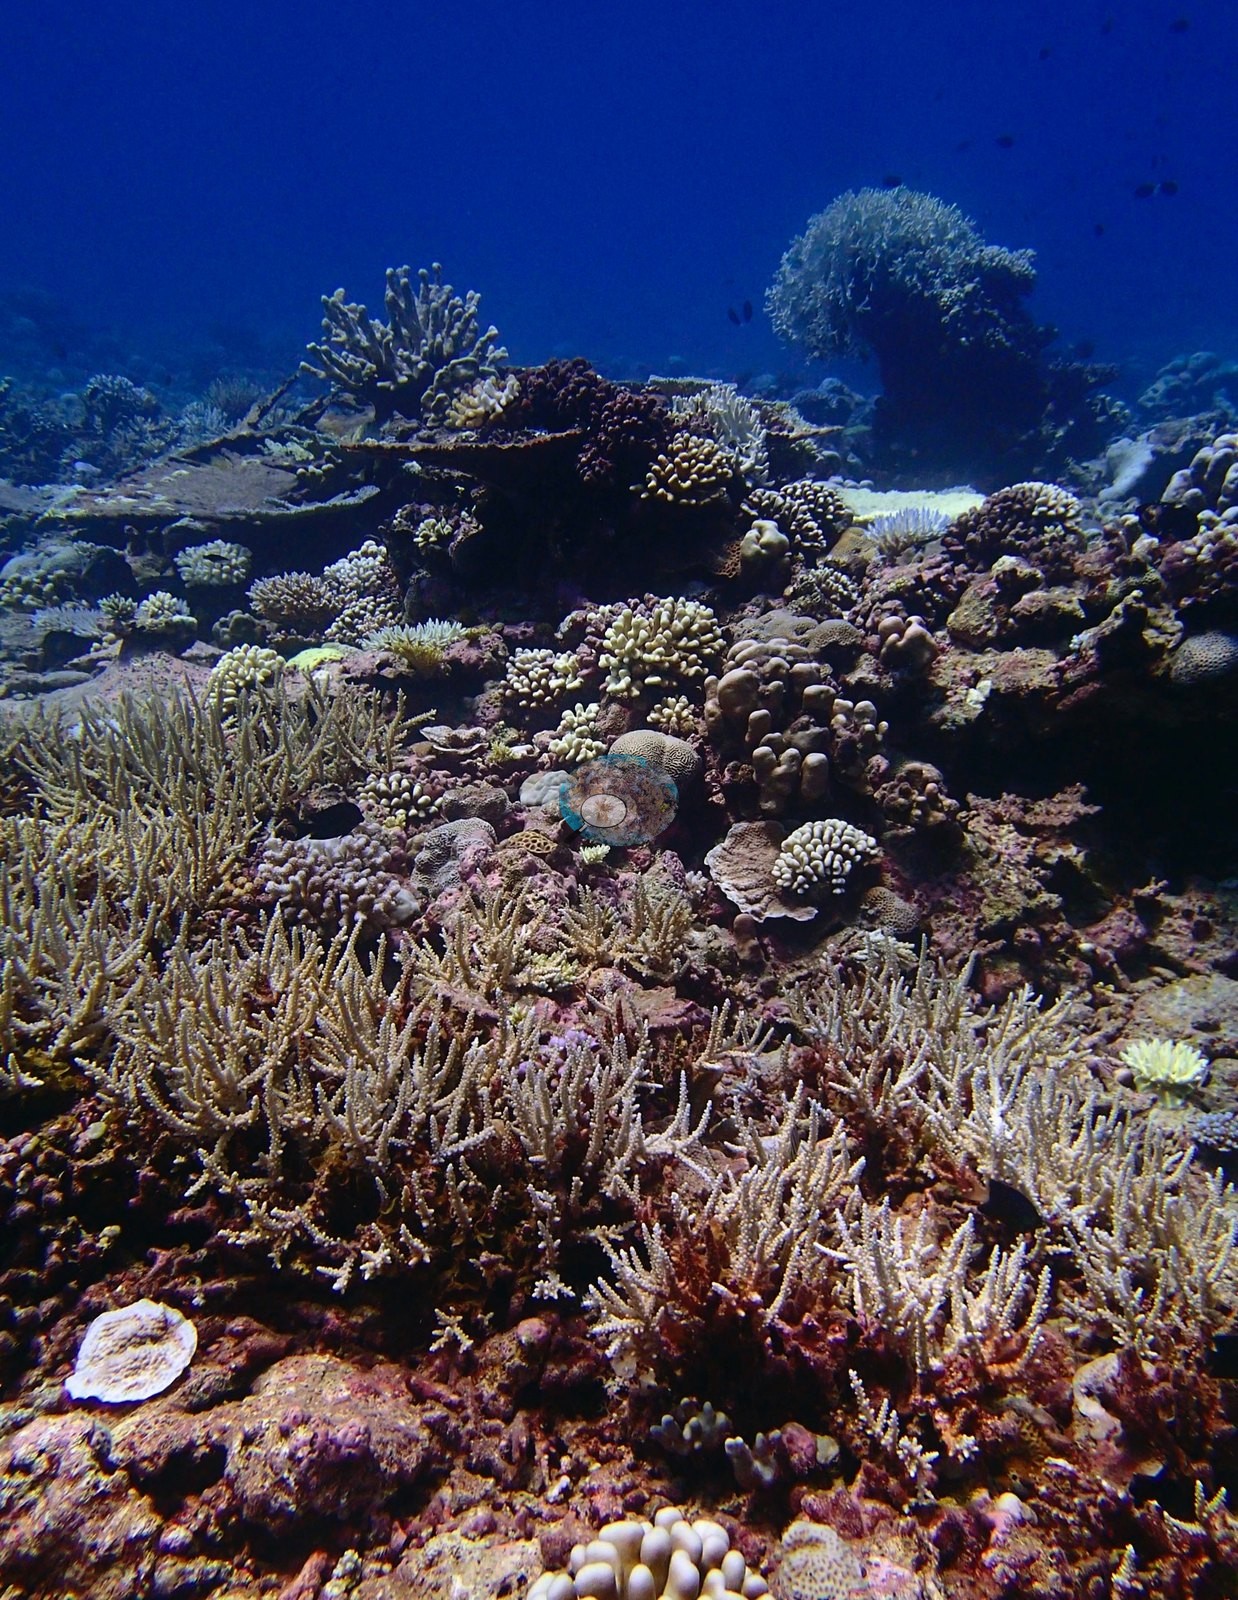
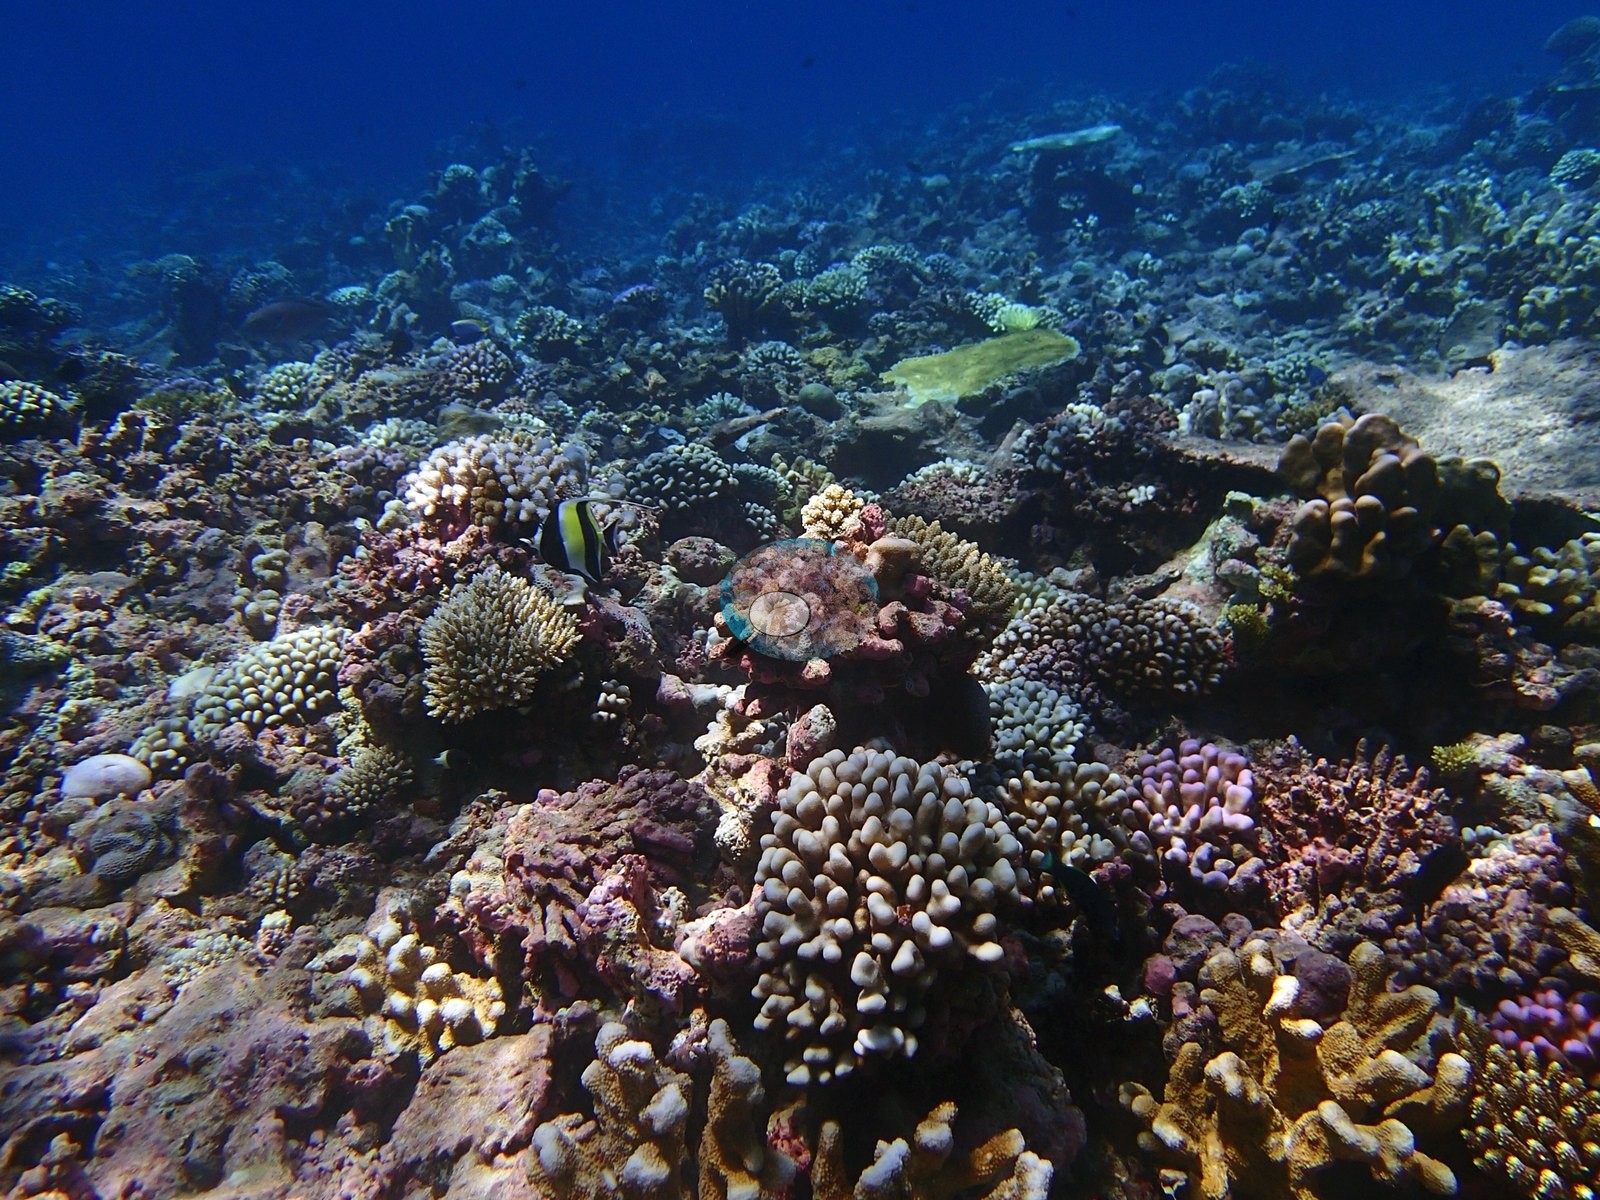
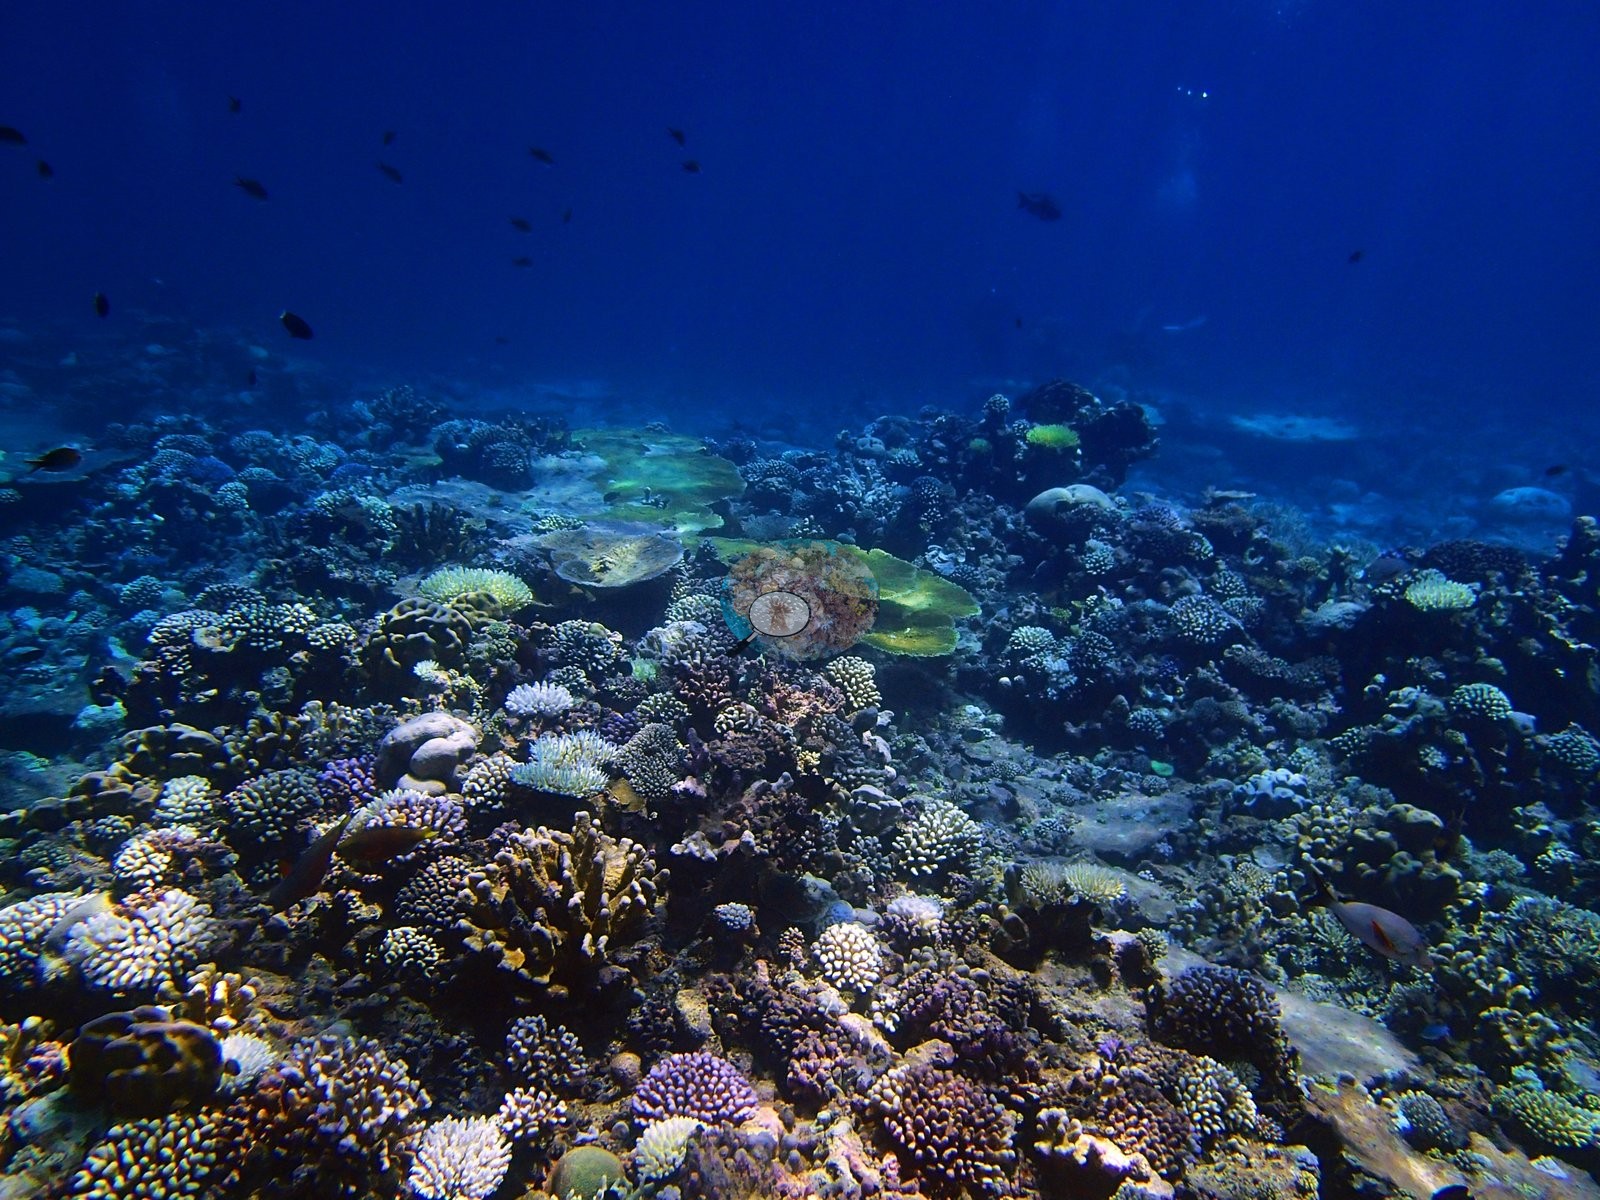
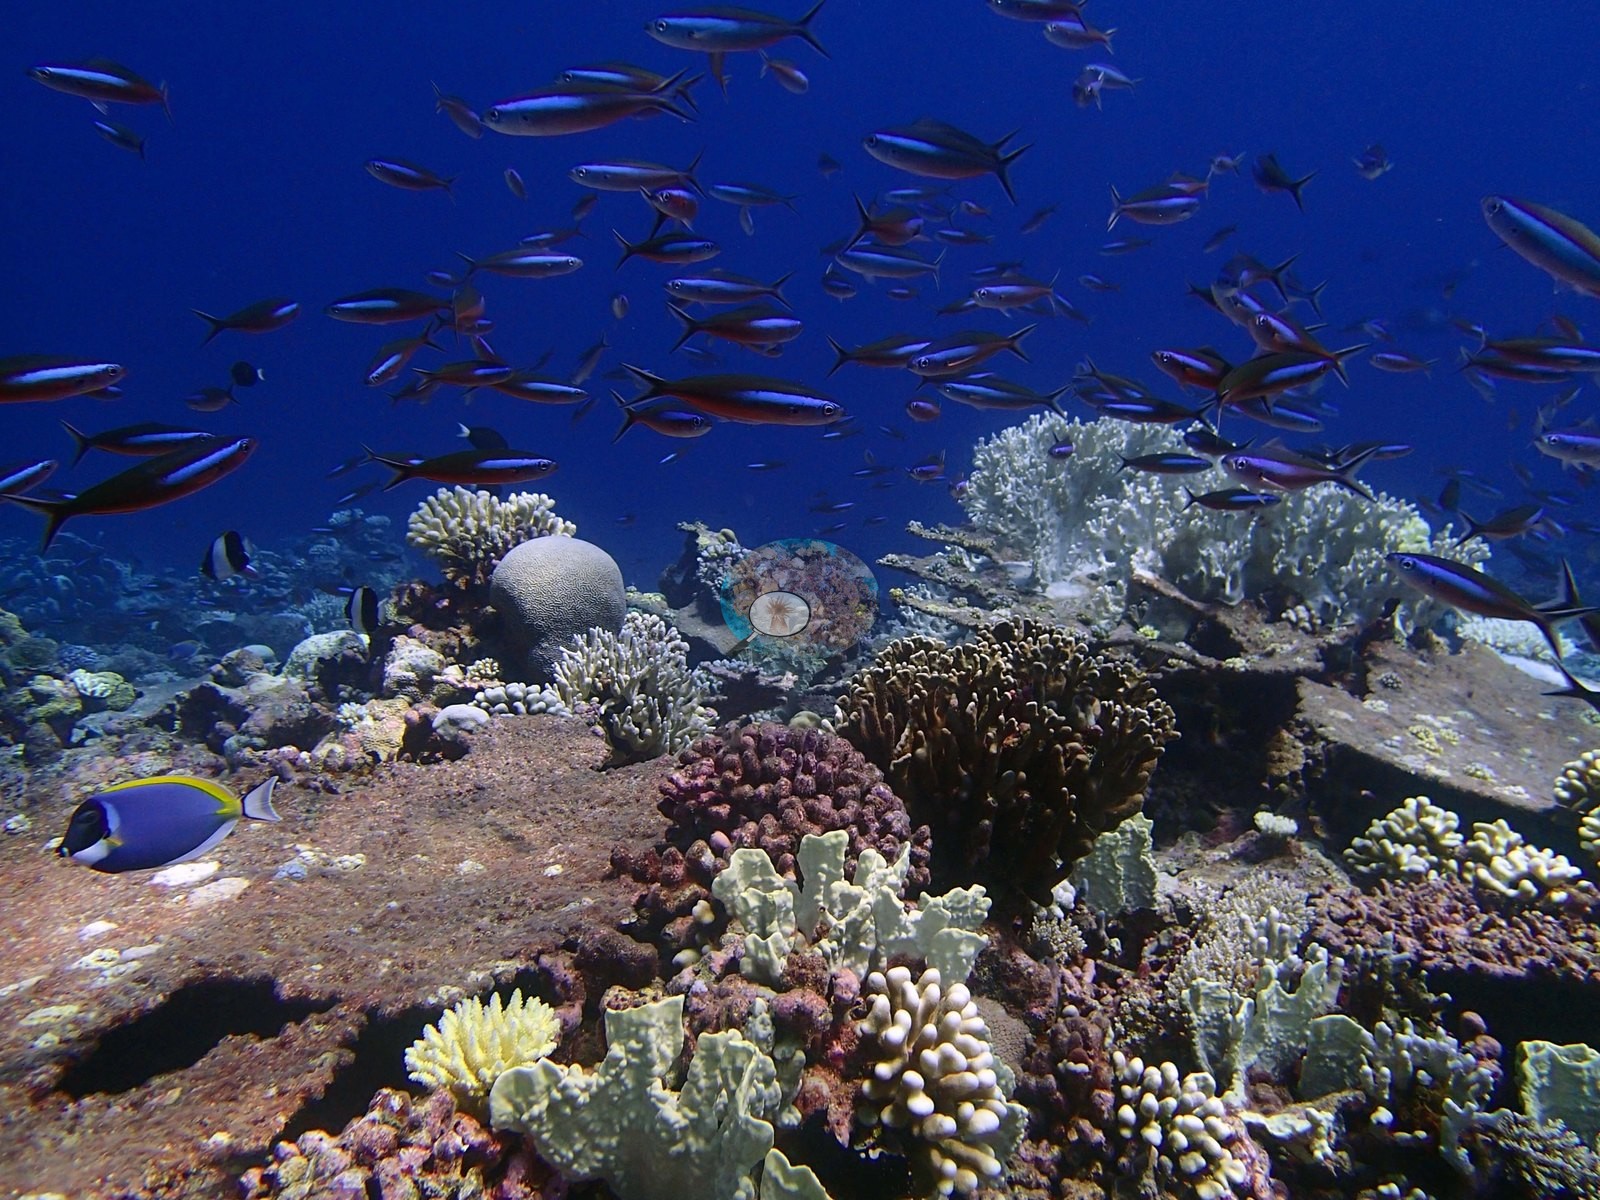
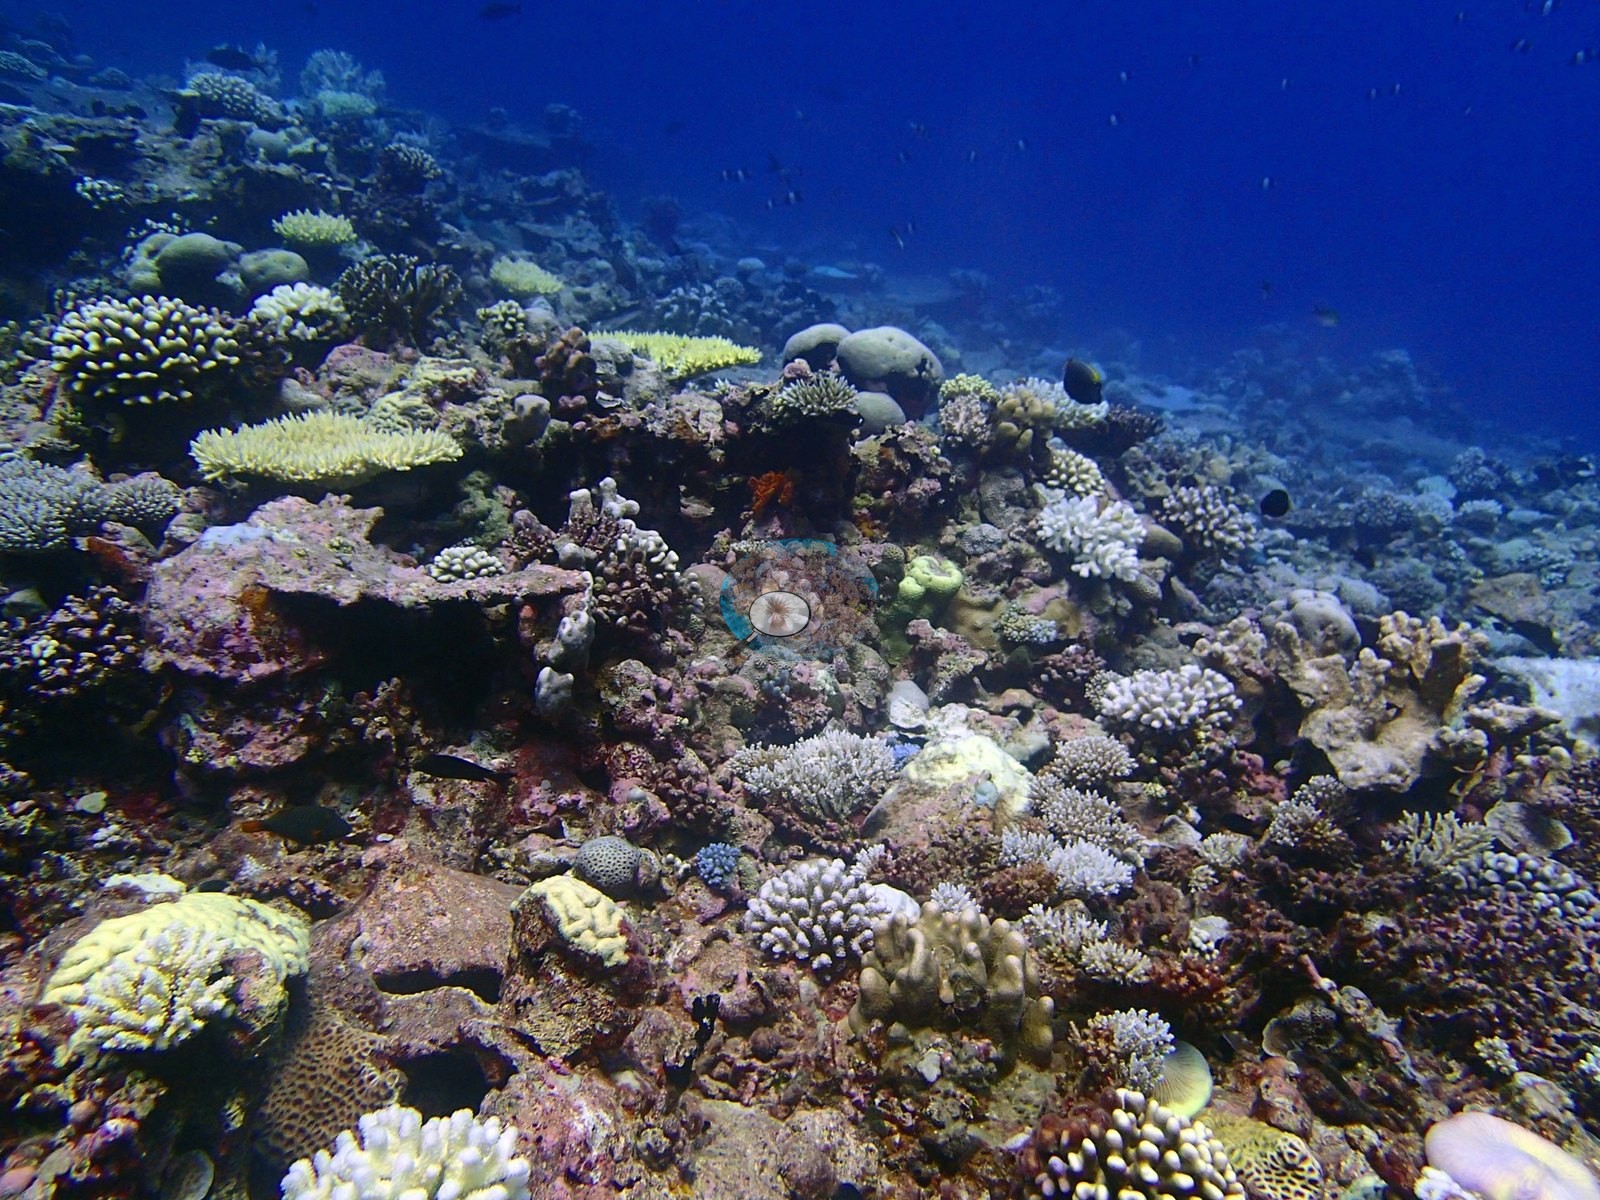
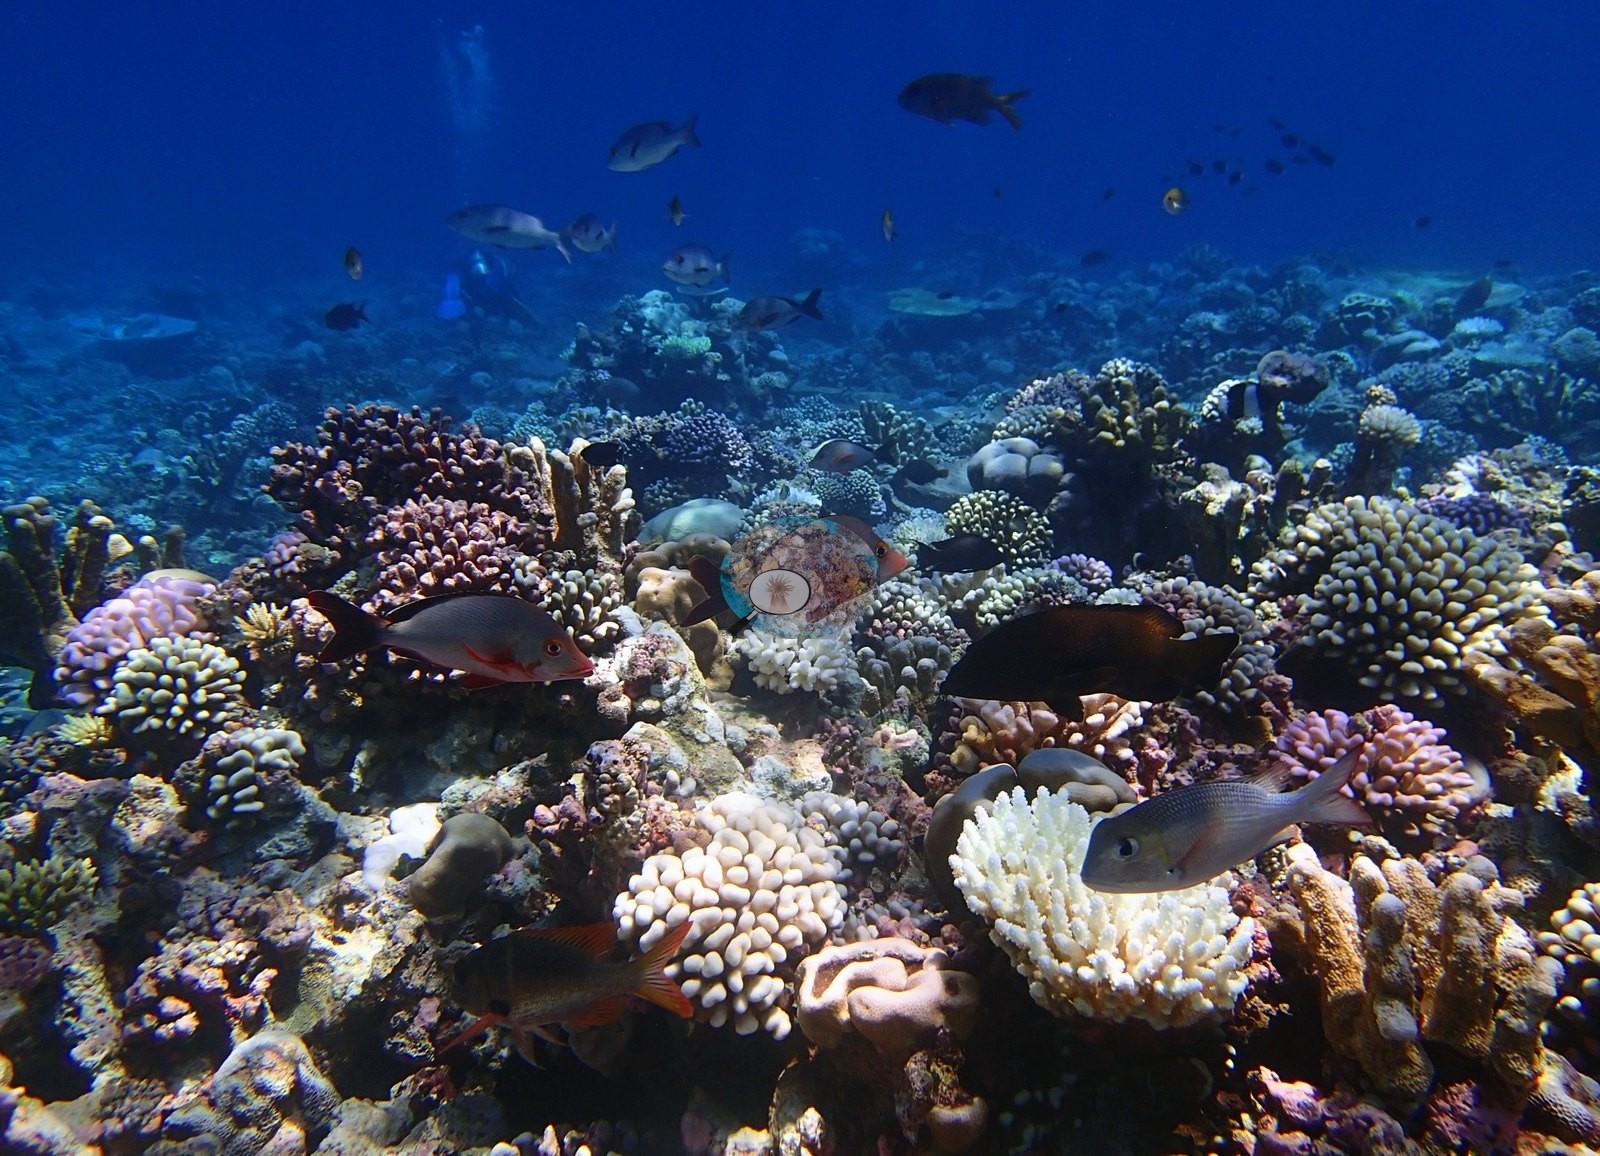
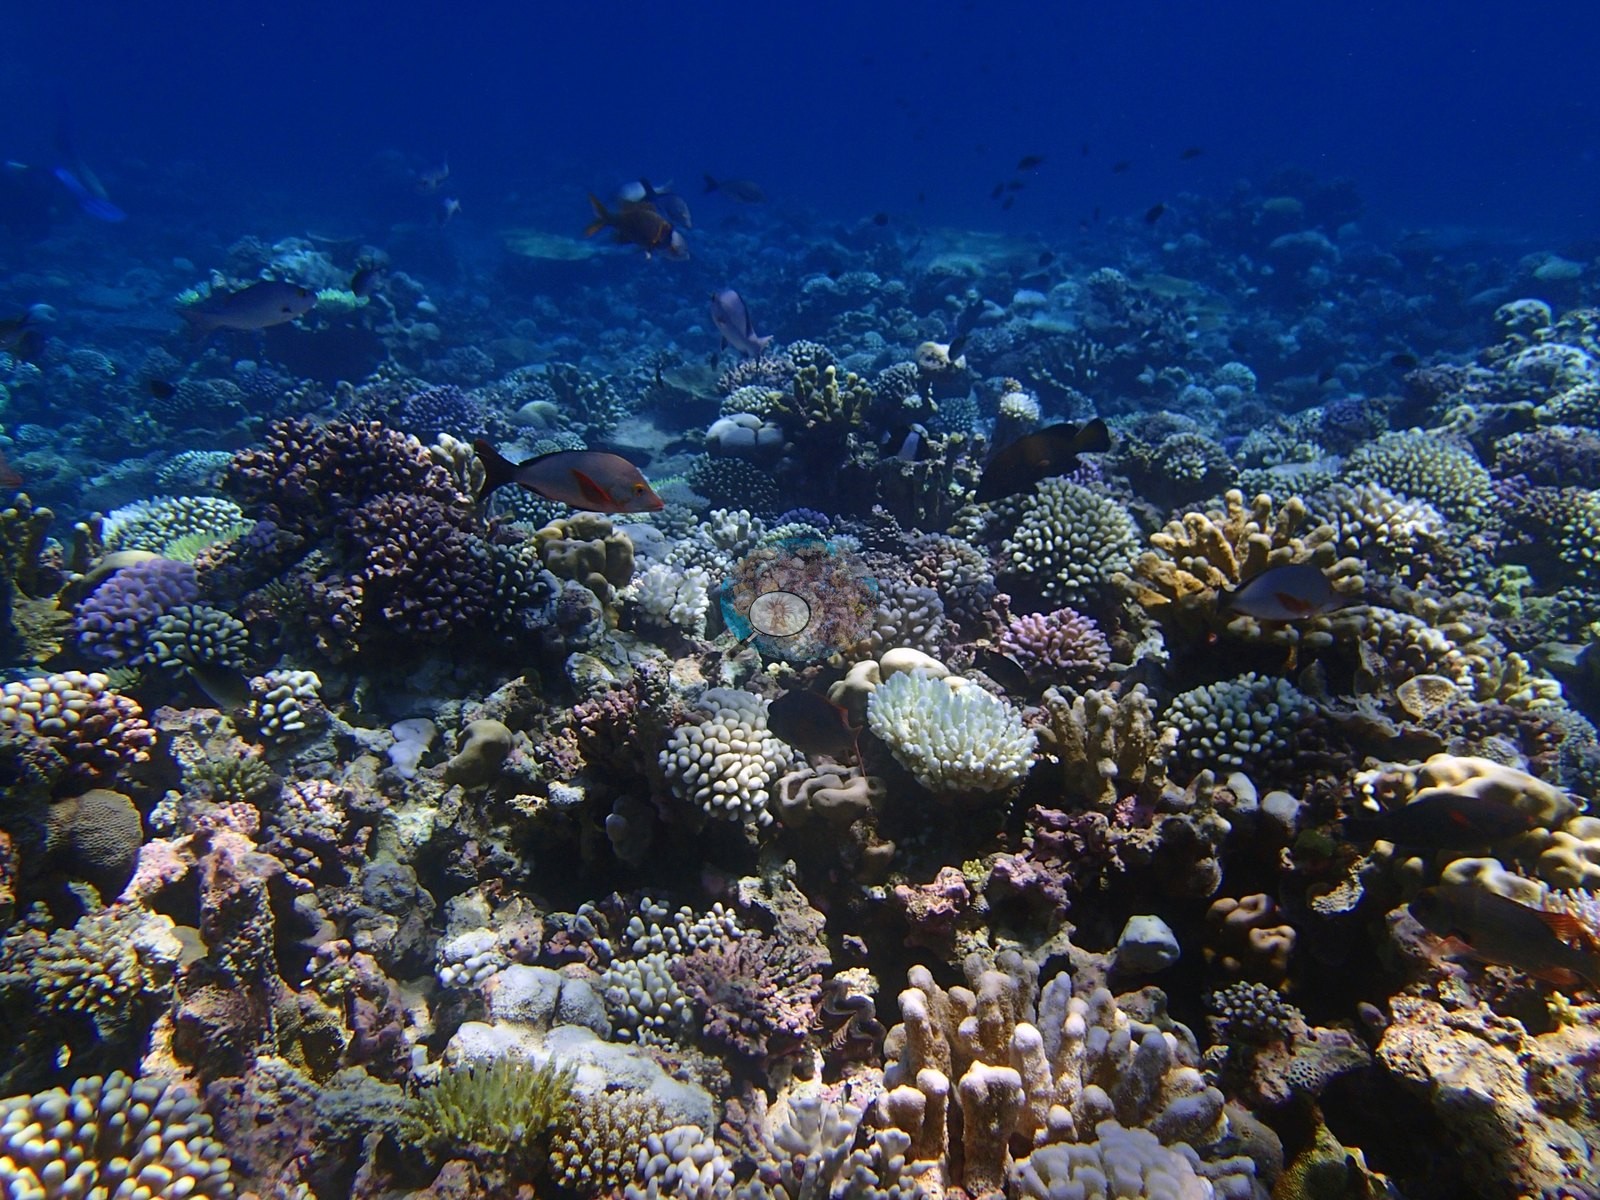
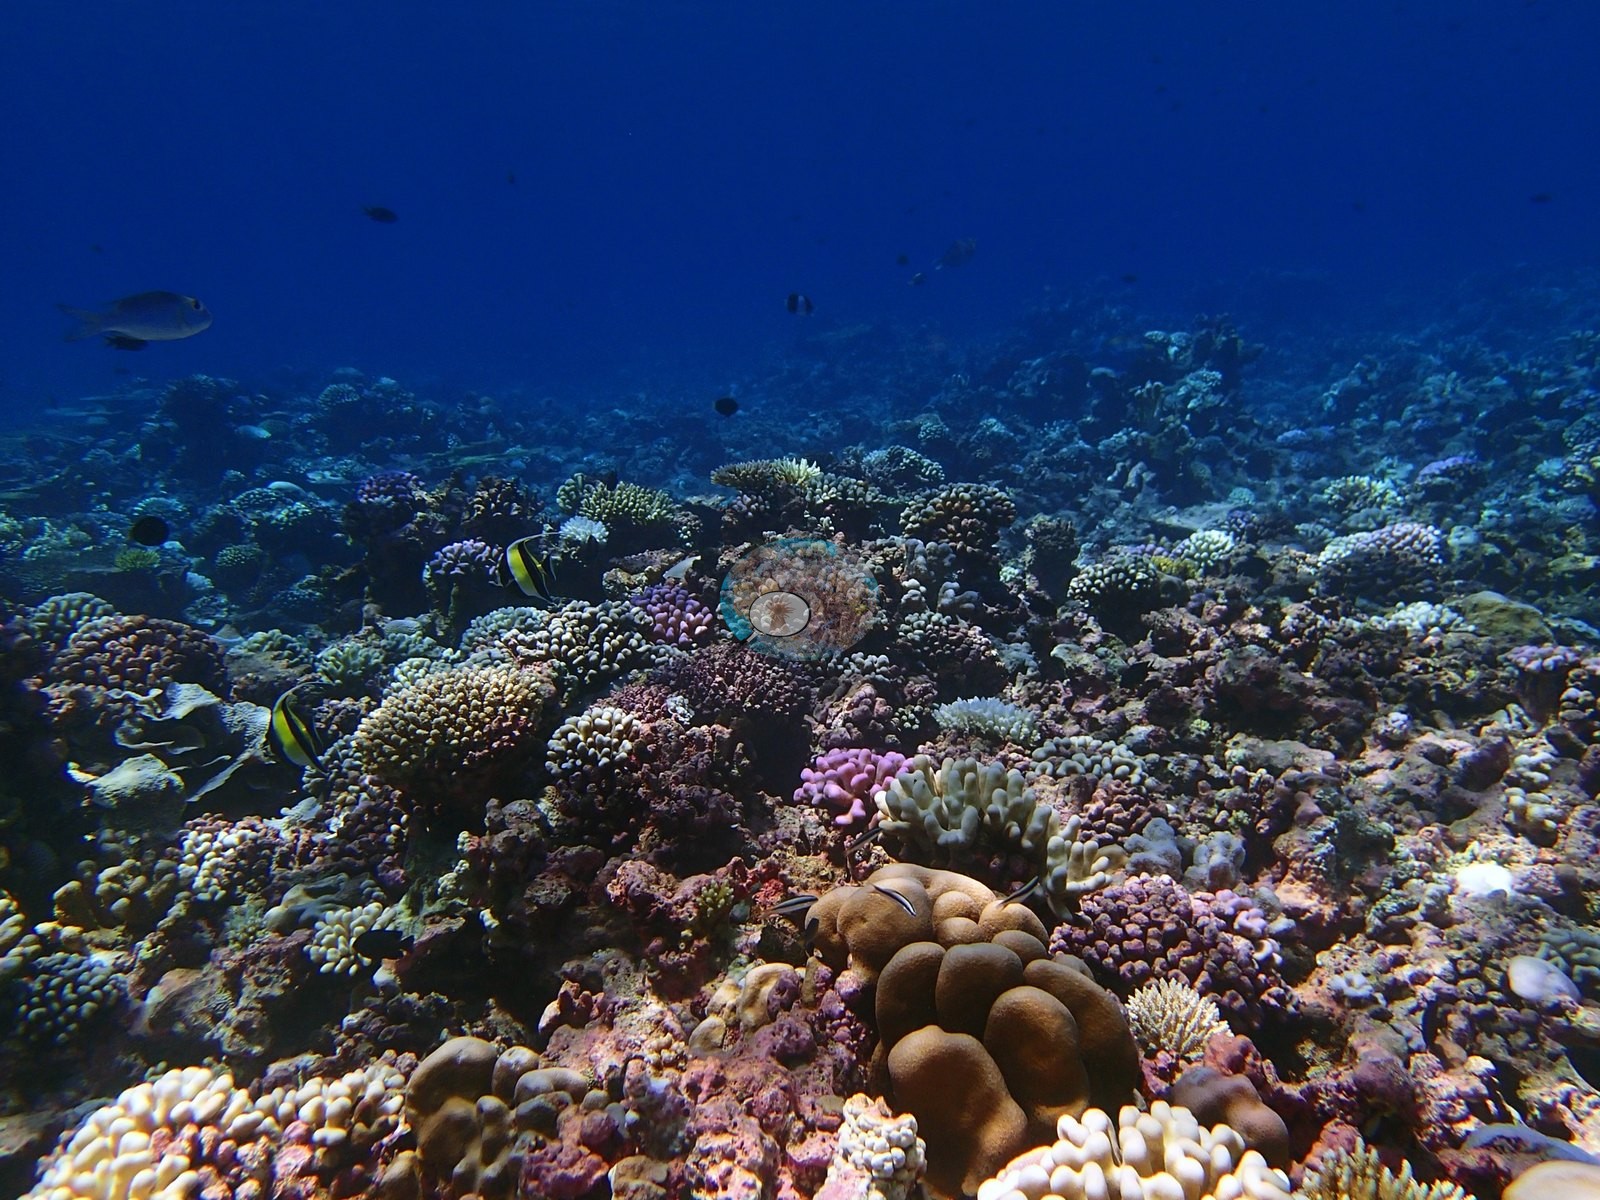
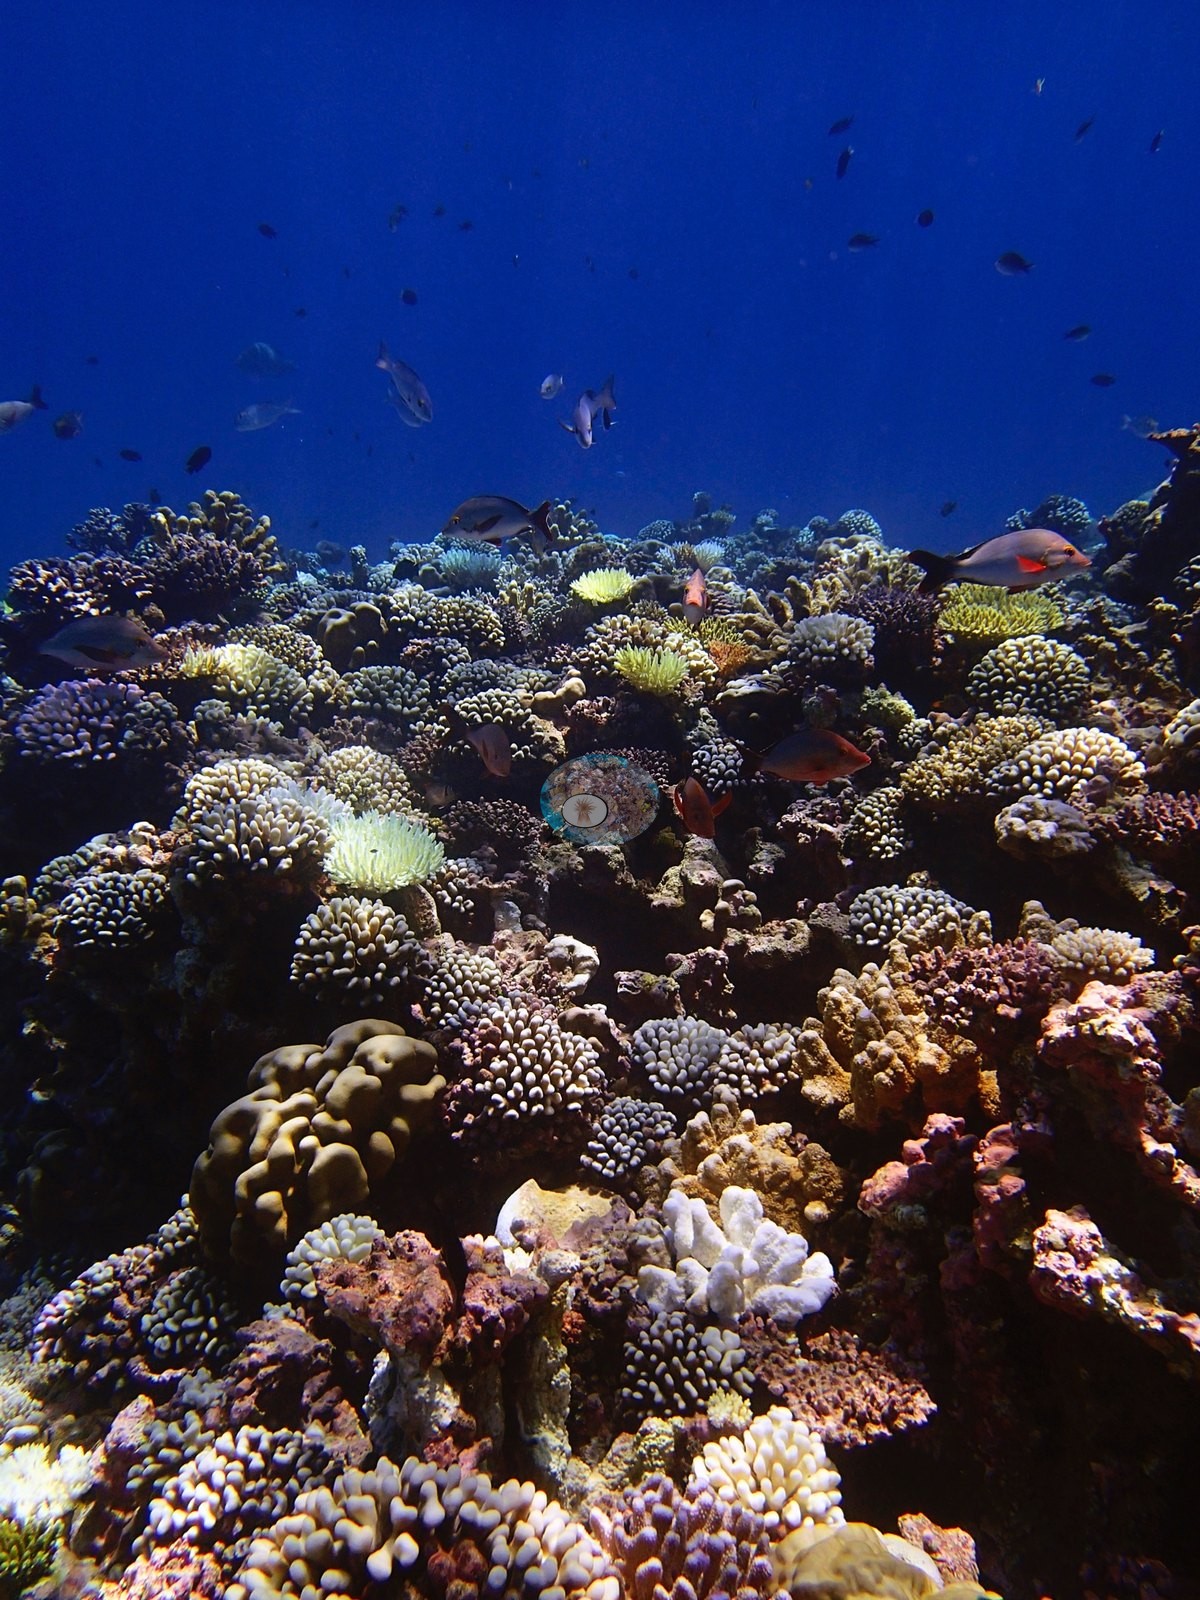
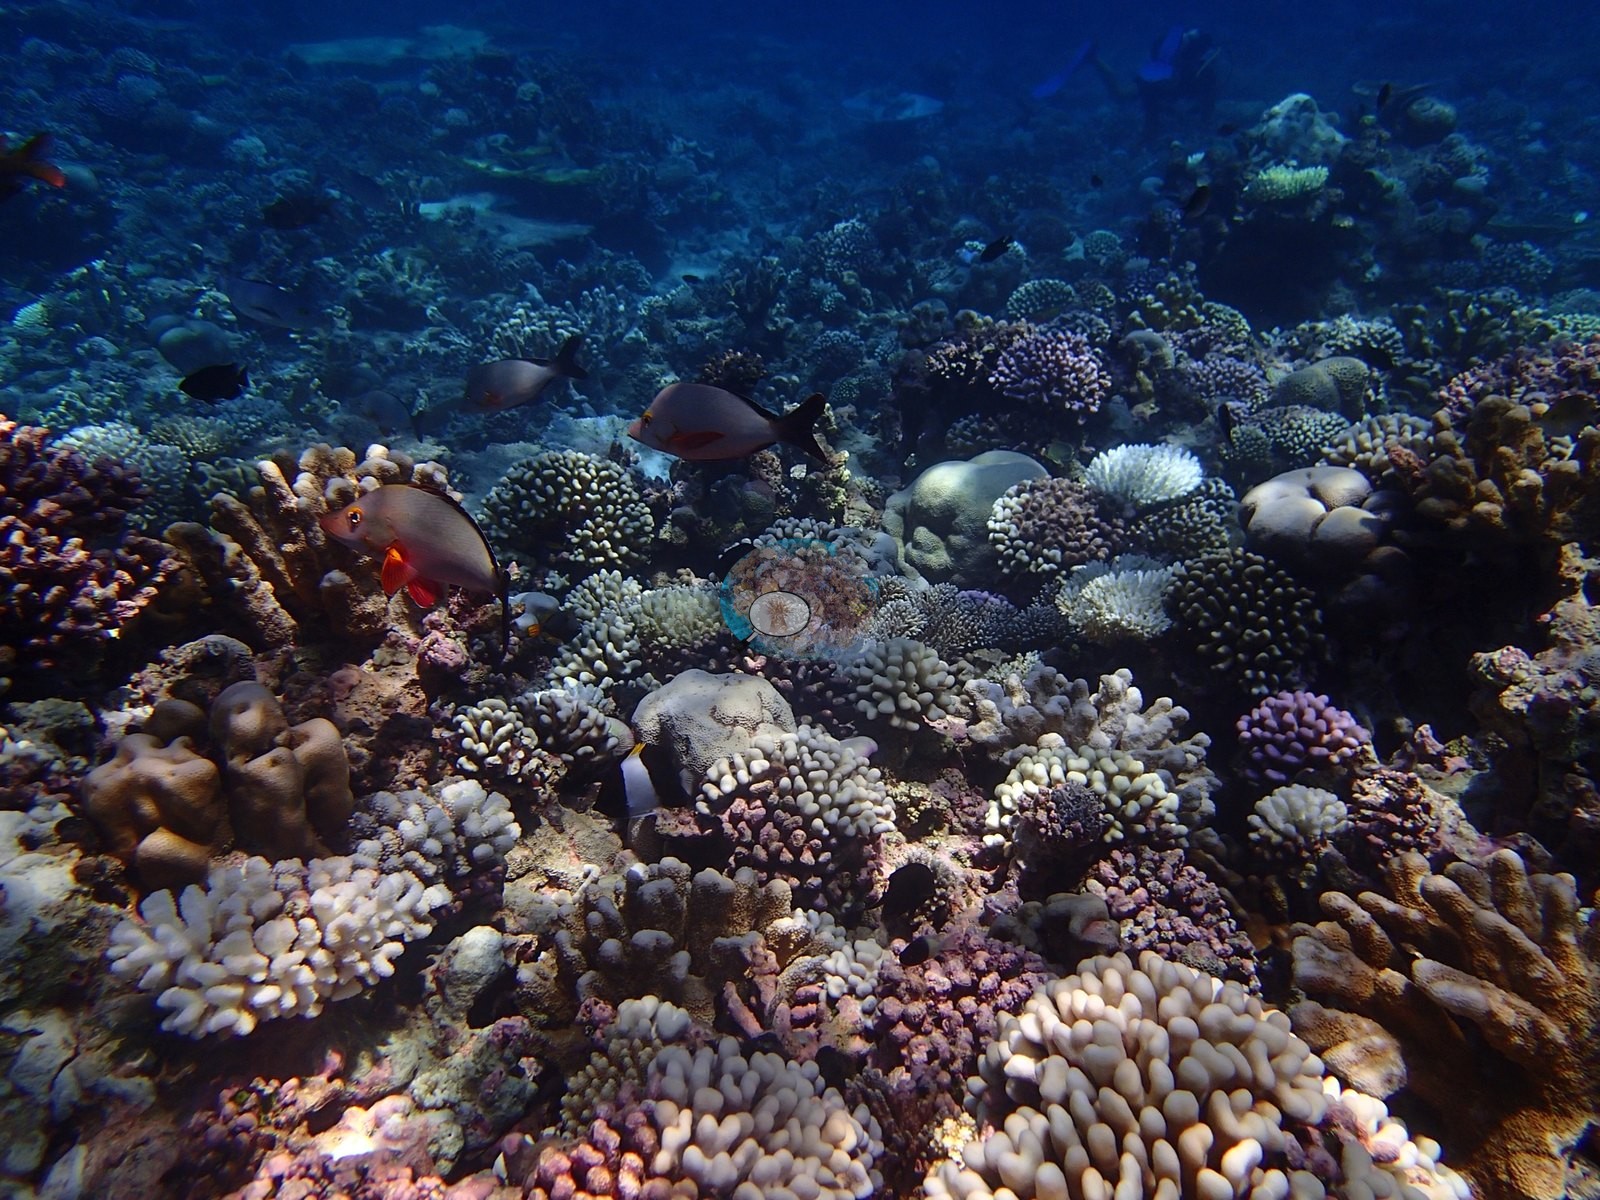
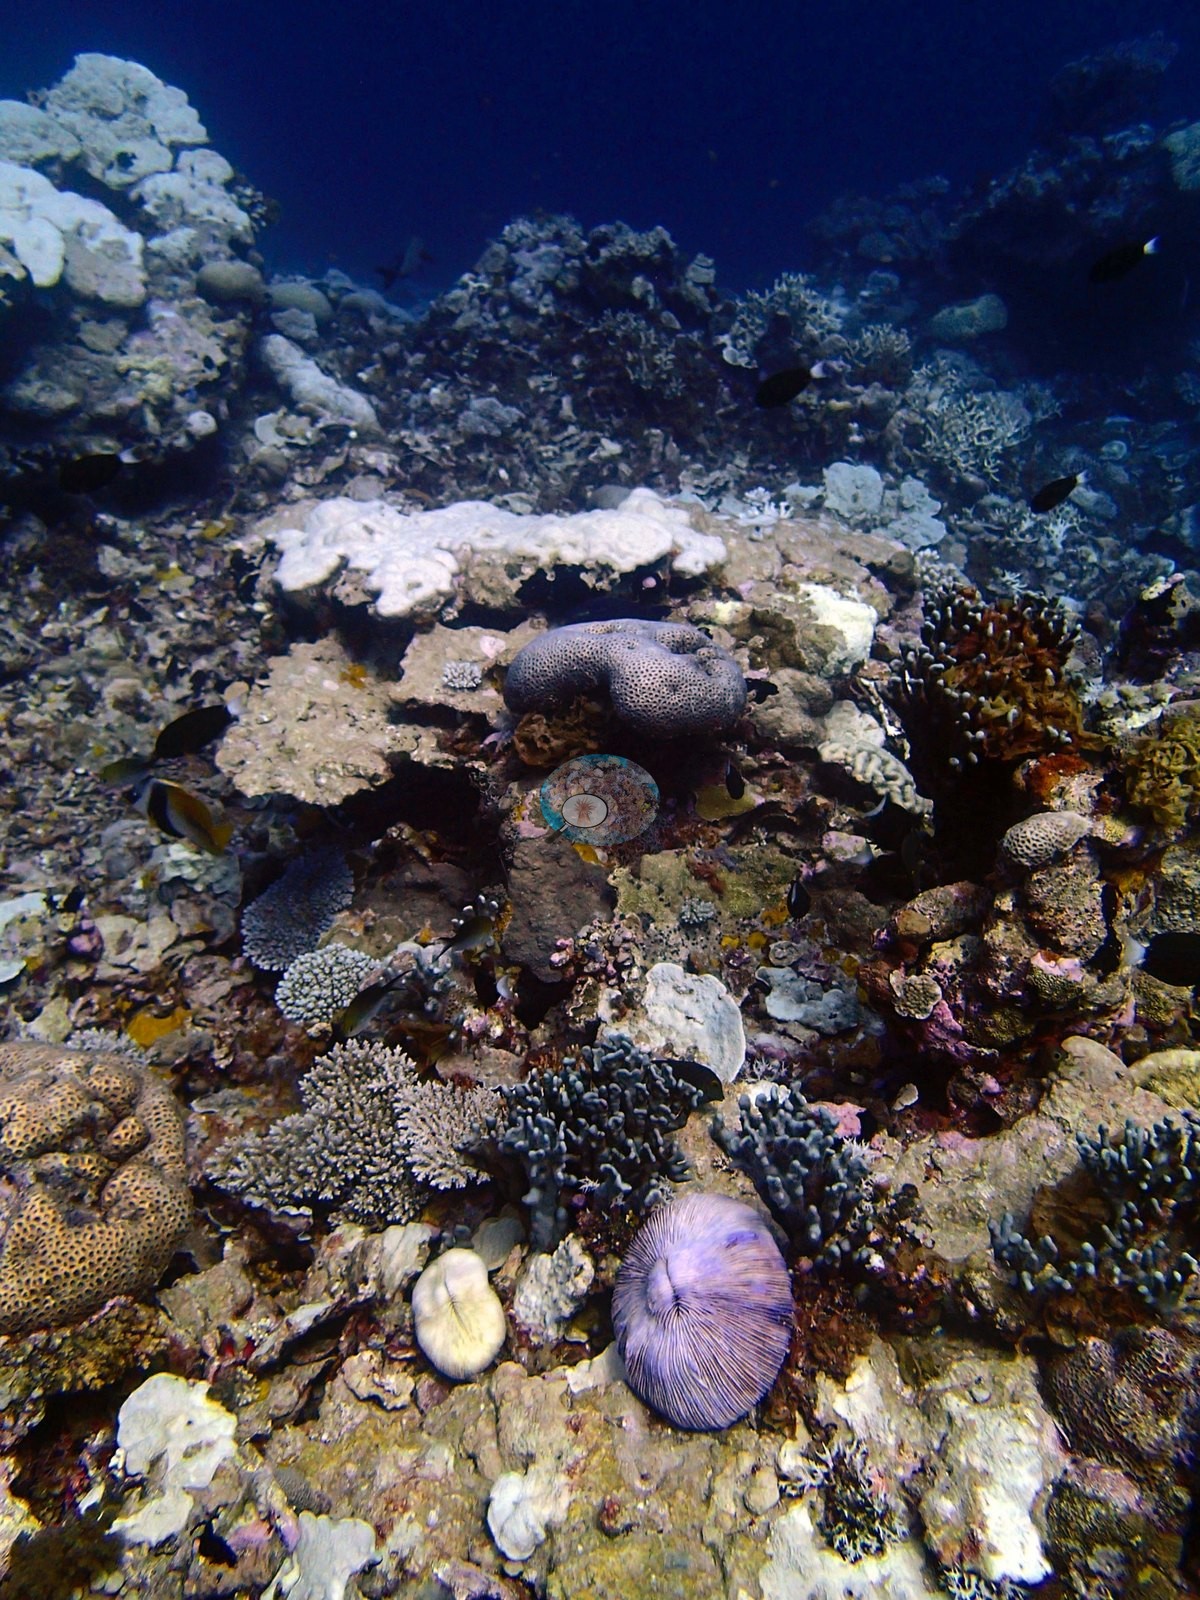
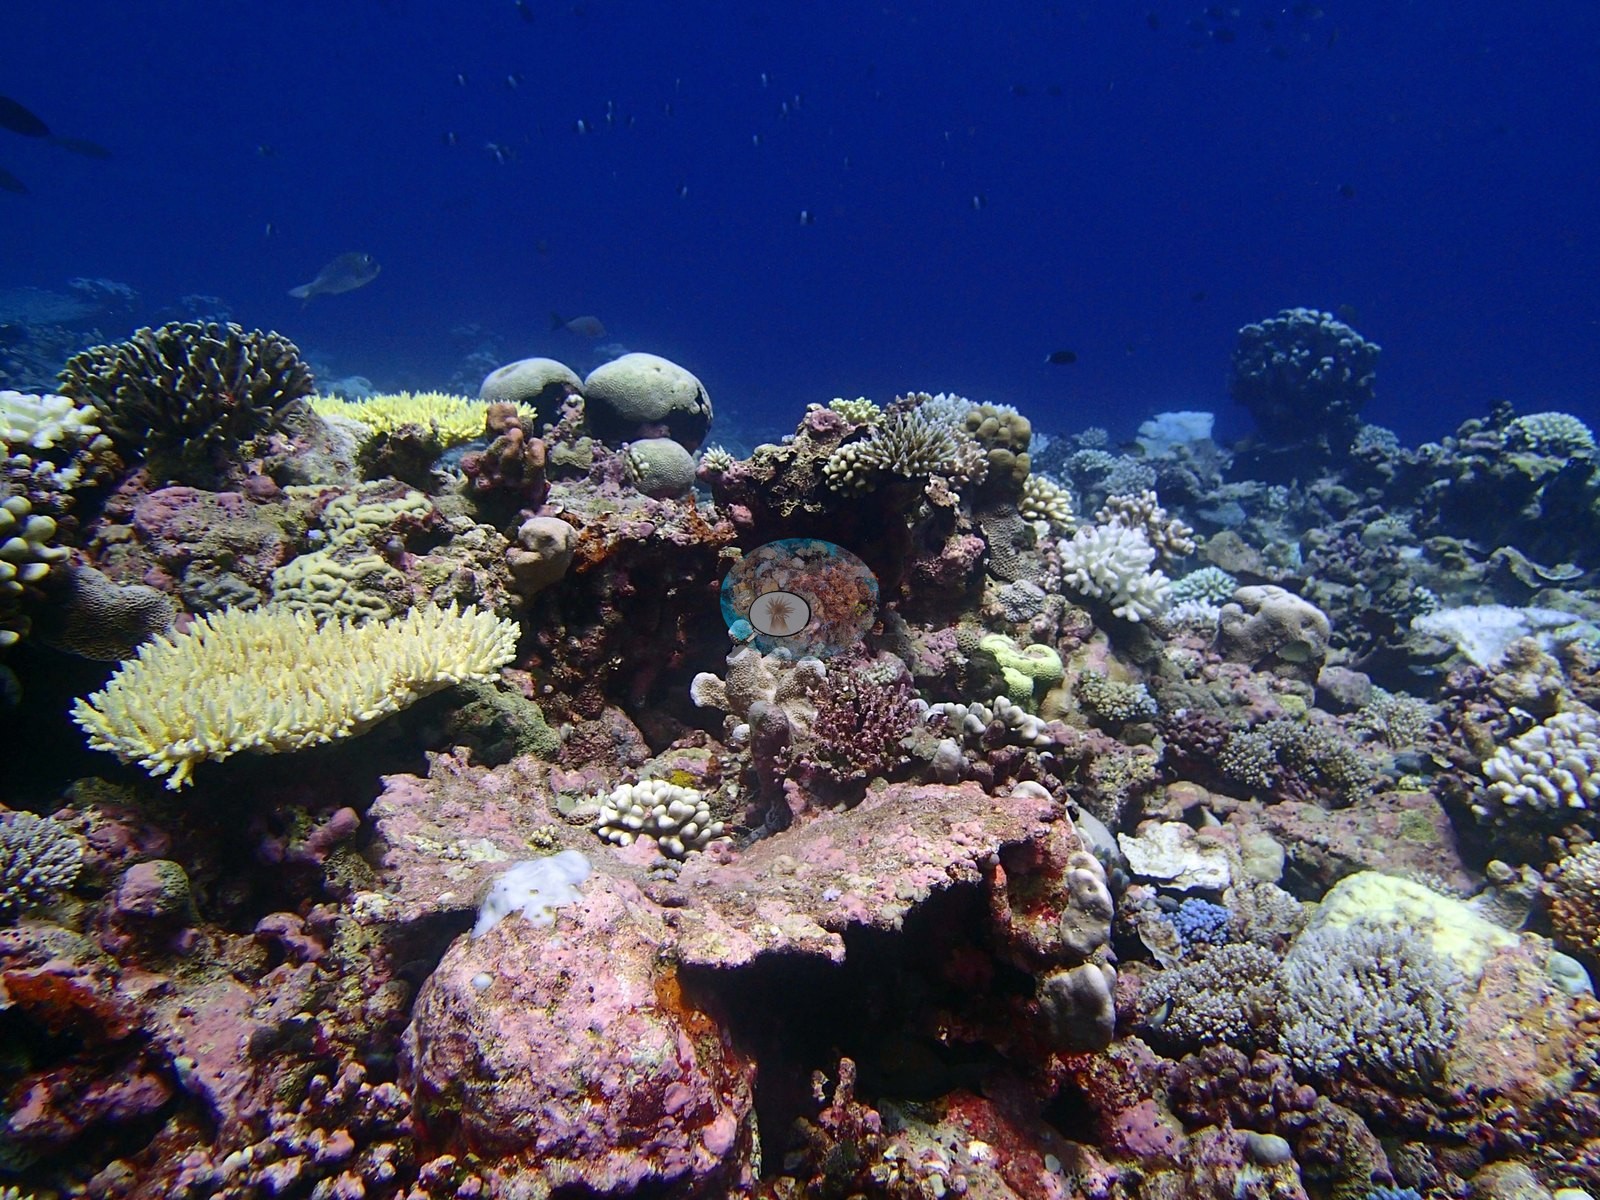
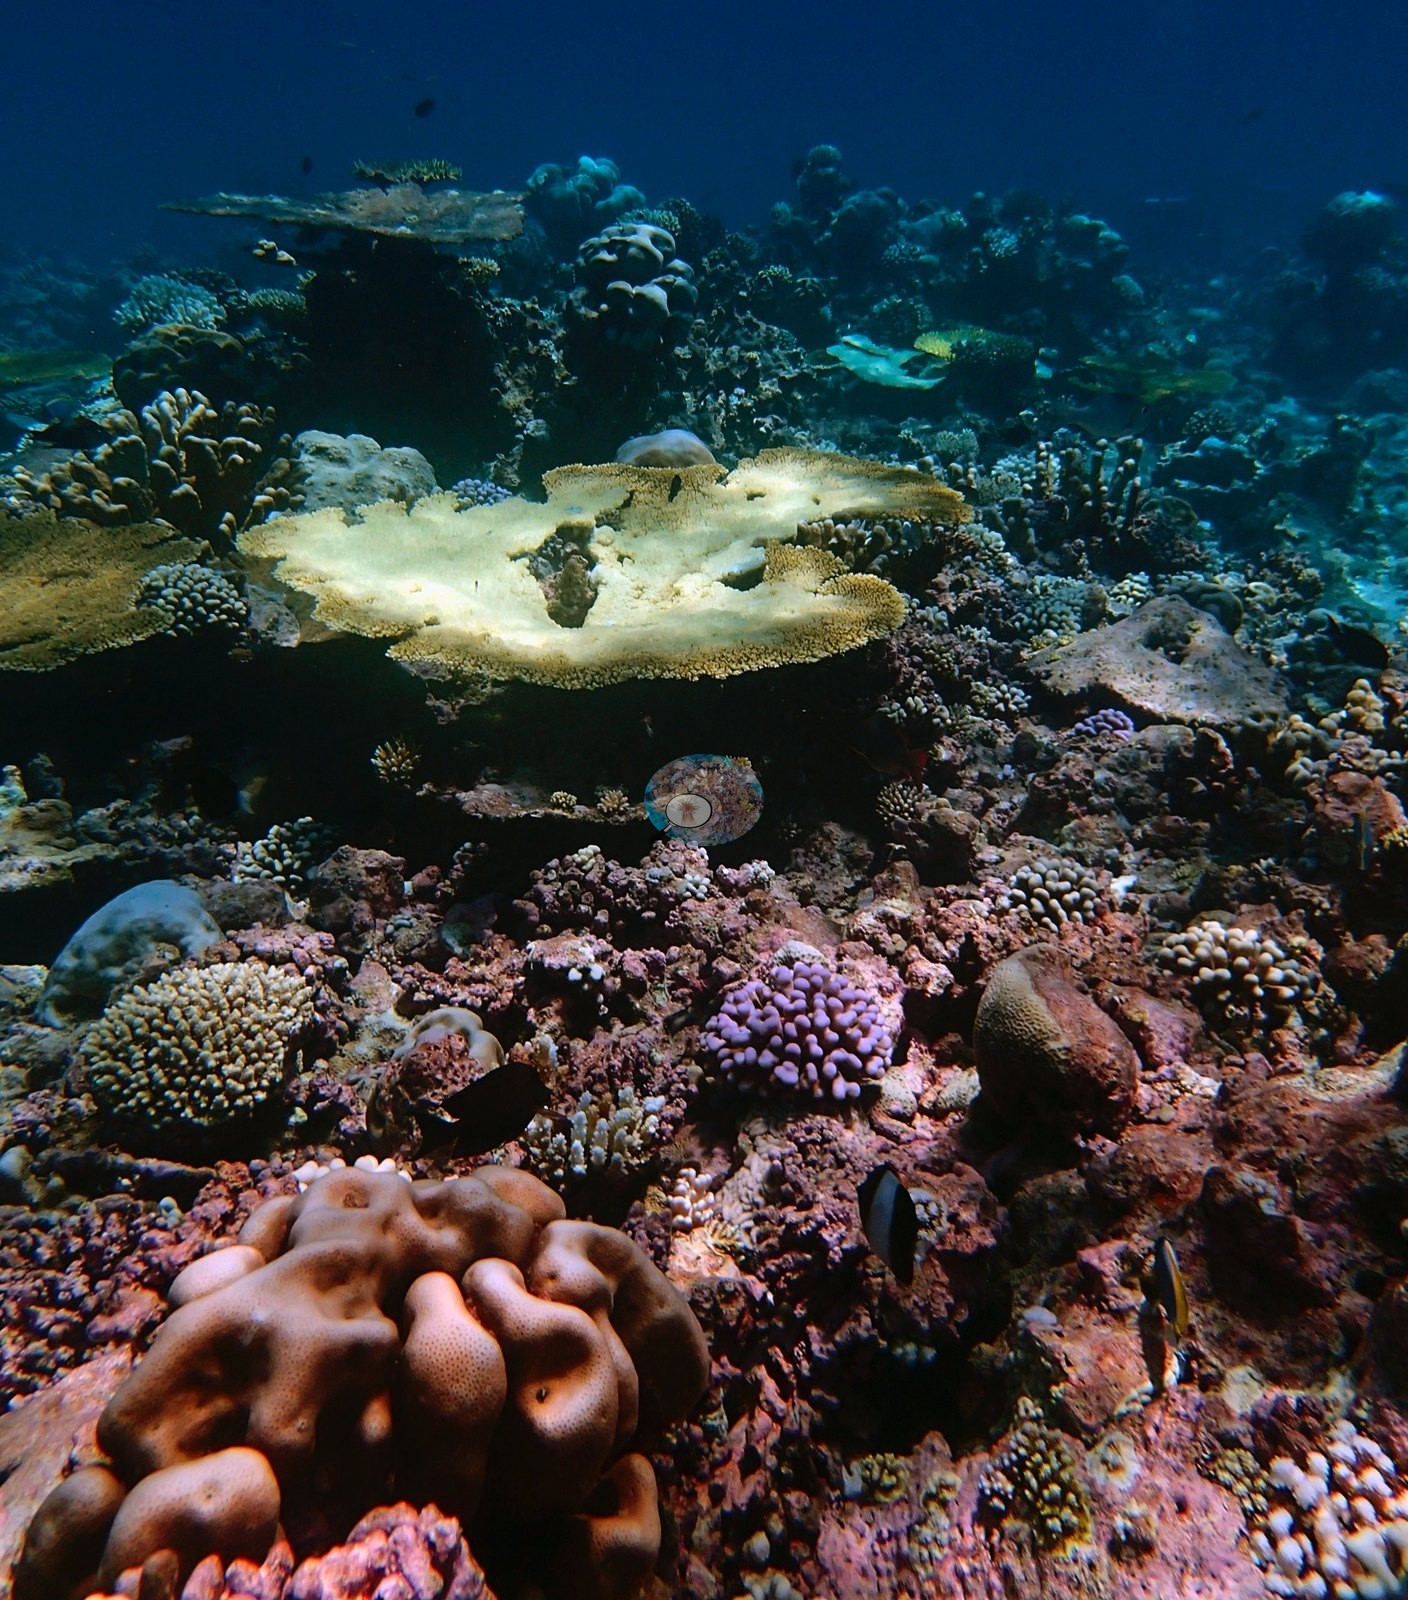
Its distinction is diversity rather than cover: 36 coral genera, the highest genus richness of all 109 Chagos sites, and no dominant taxon — Acropora leads at just 20% of the coral present, with Porites, Pocillopora, Pavona, and Montipora close behind (e.g., Image 4, Image 6, Image 10, Image 18, Image 20, Image 21, Image 23, Image 25, Image 30, Image 31).
Coral cover
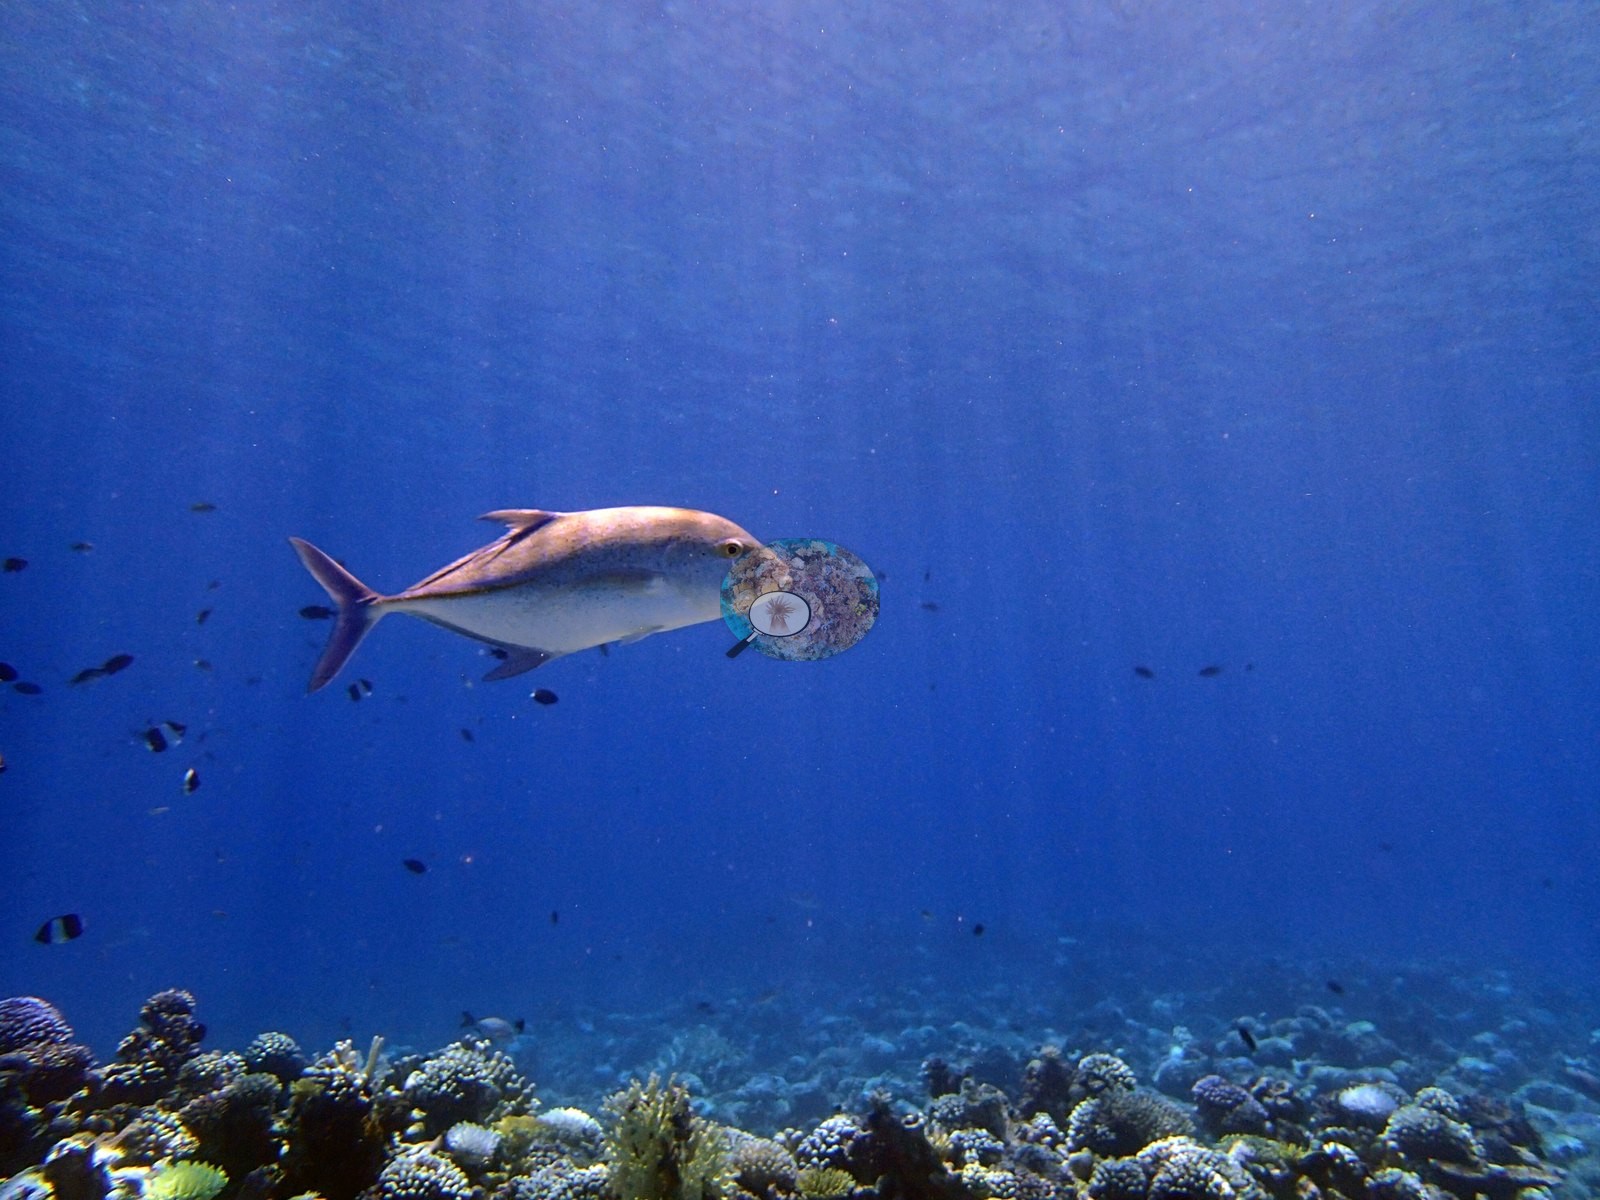
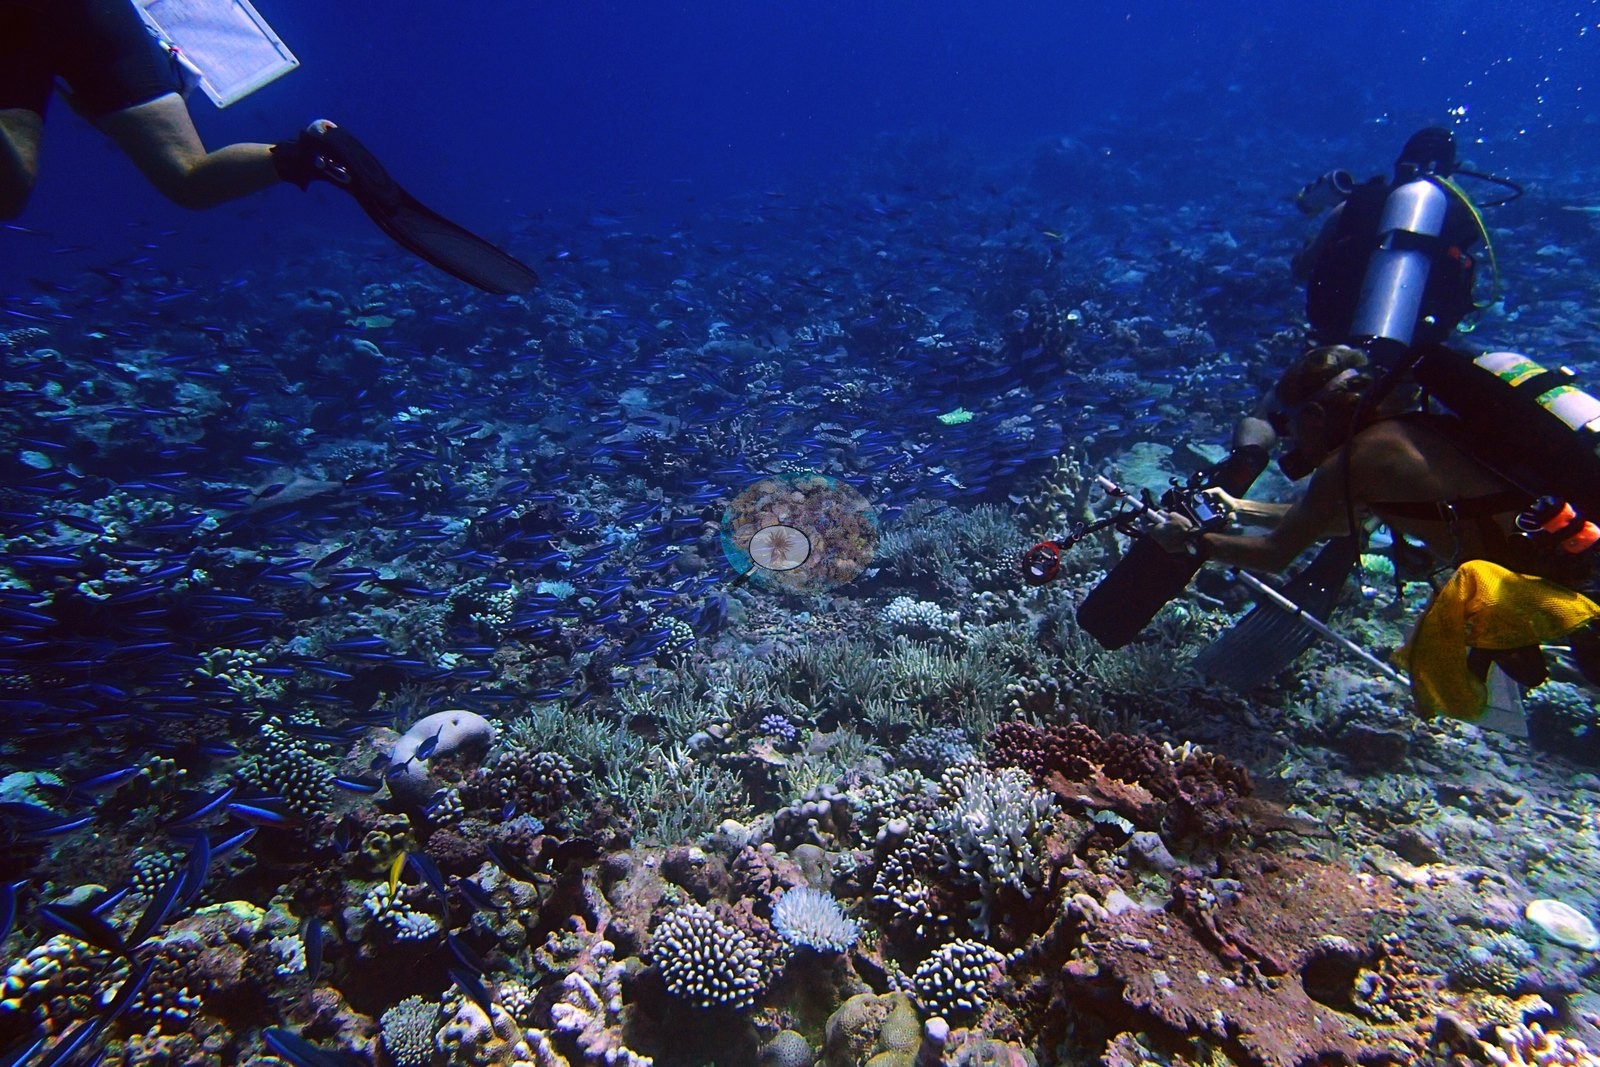
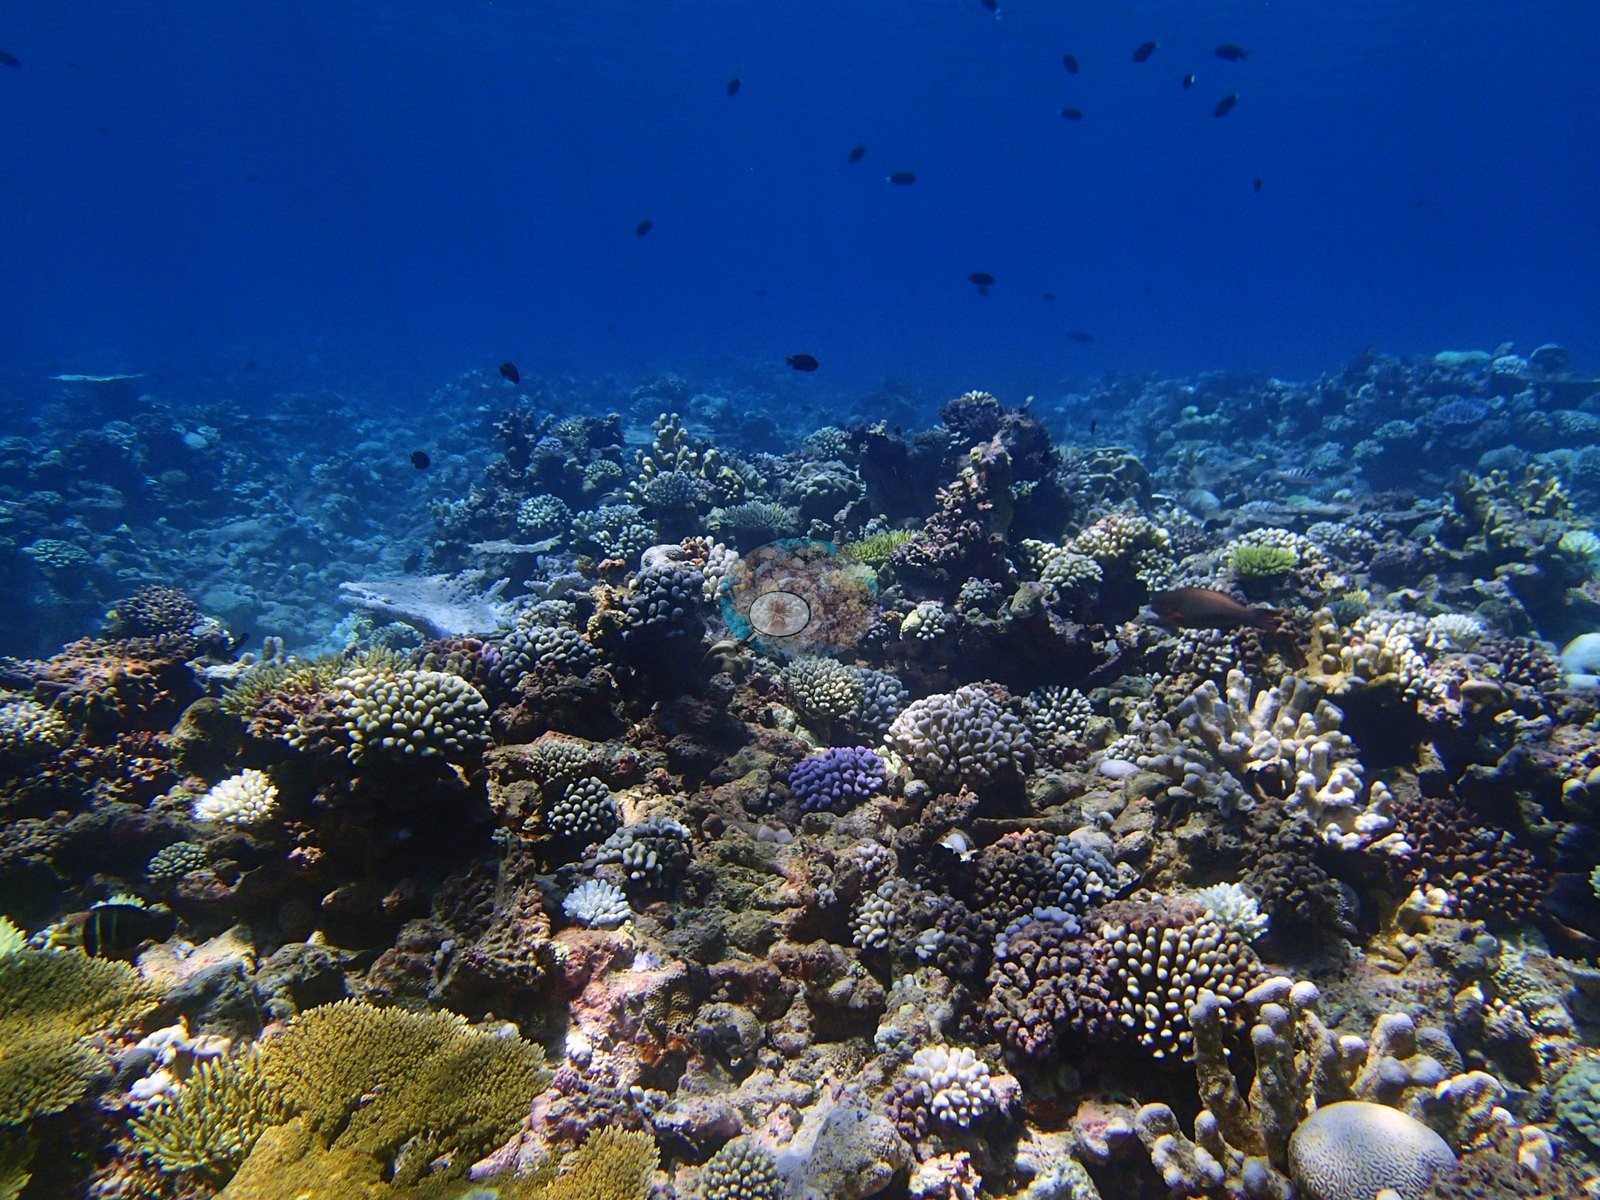
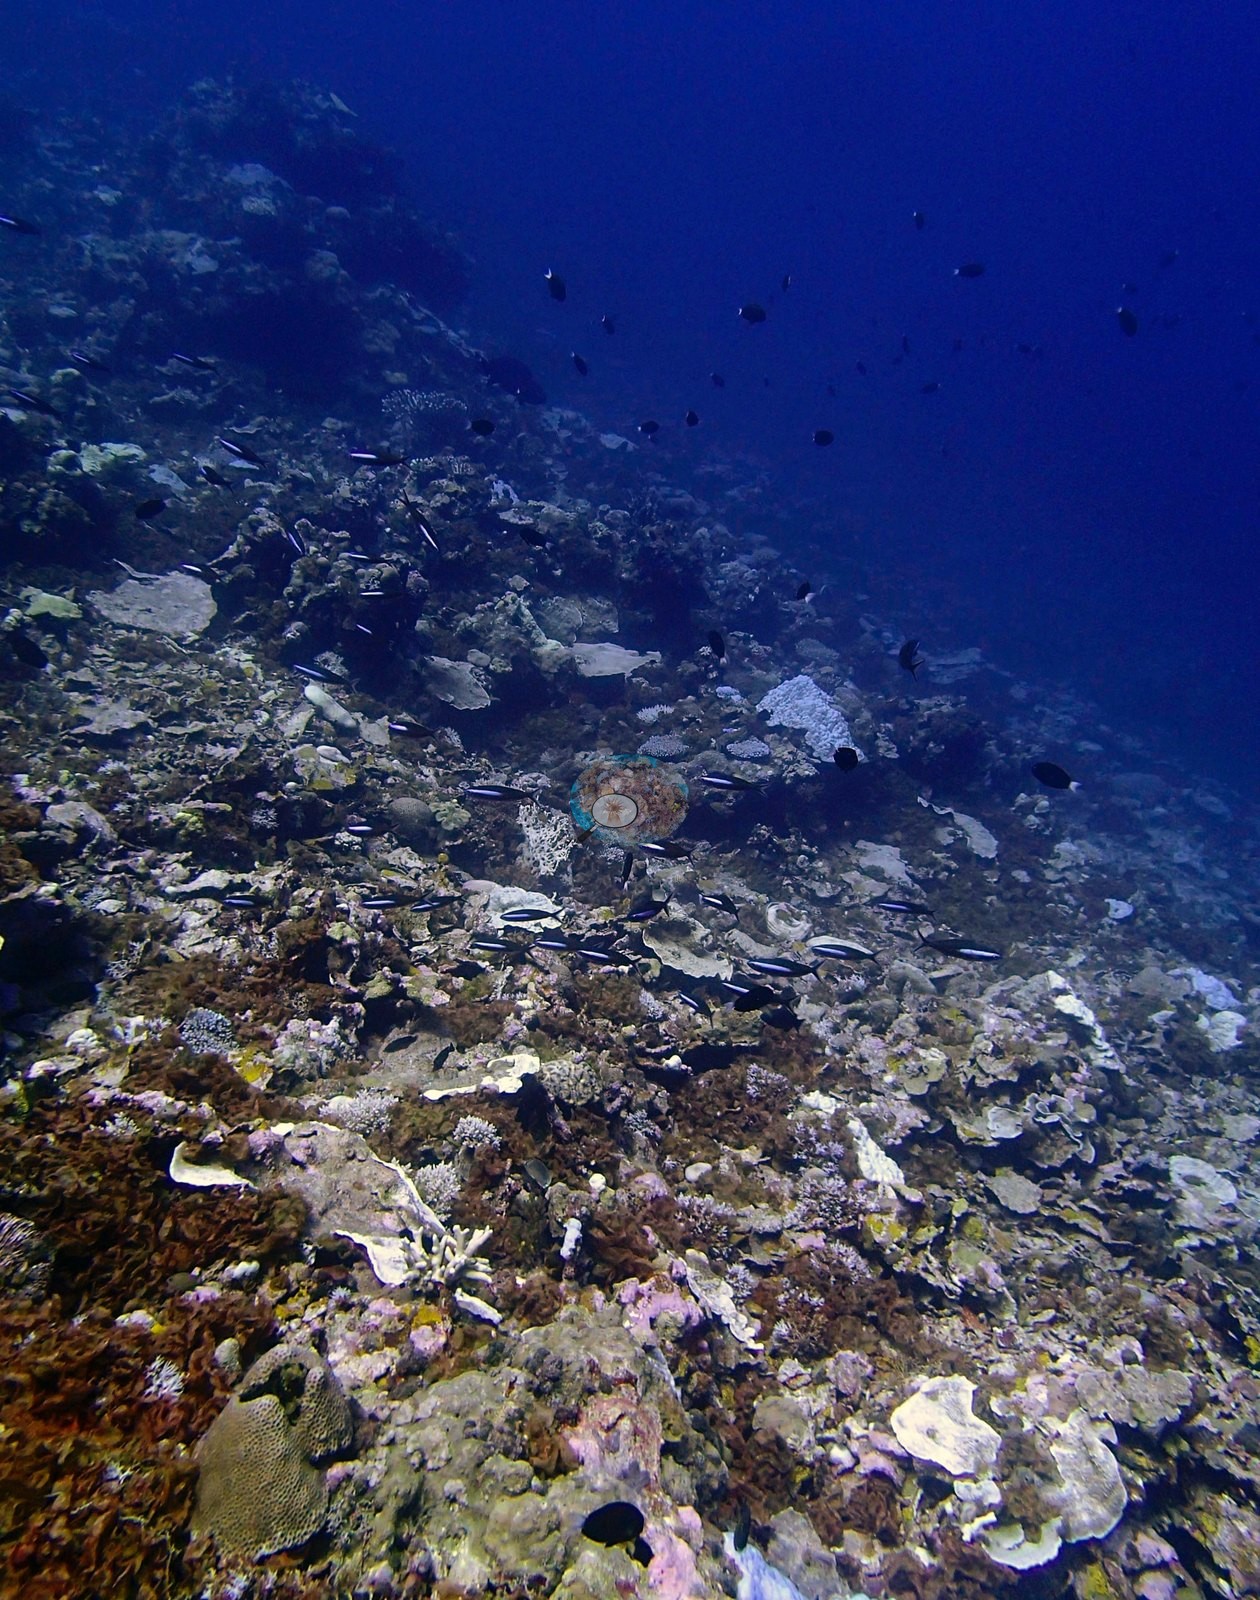
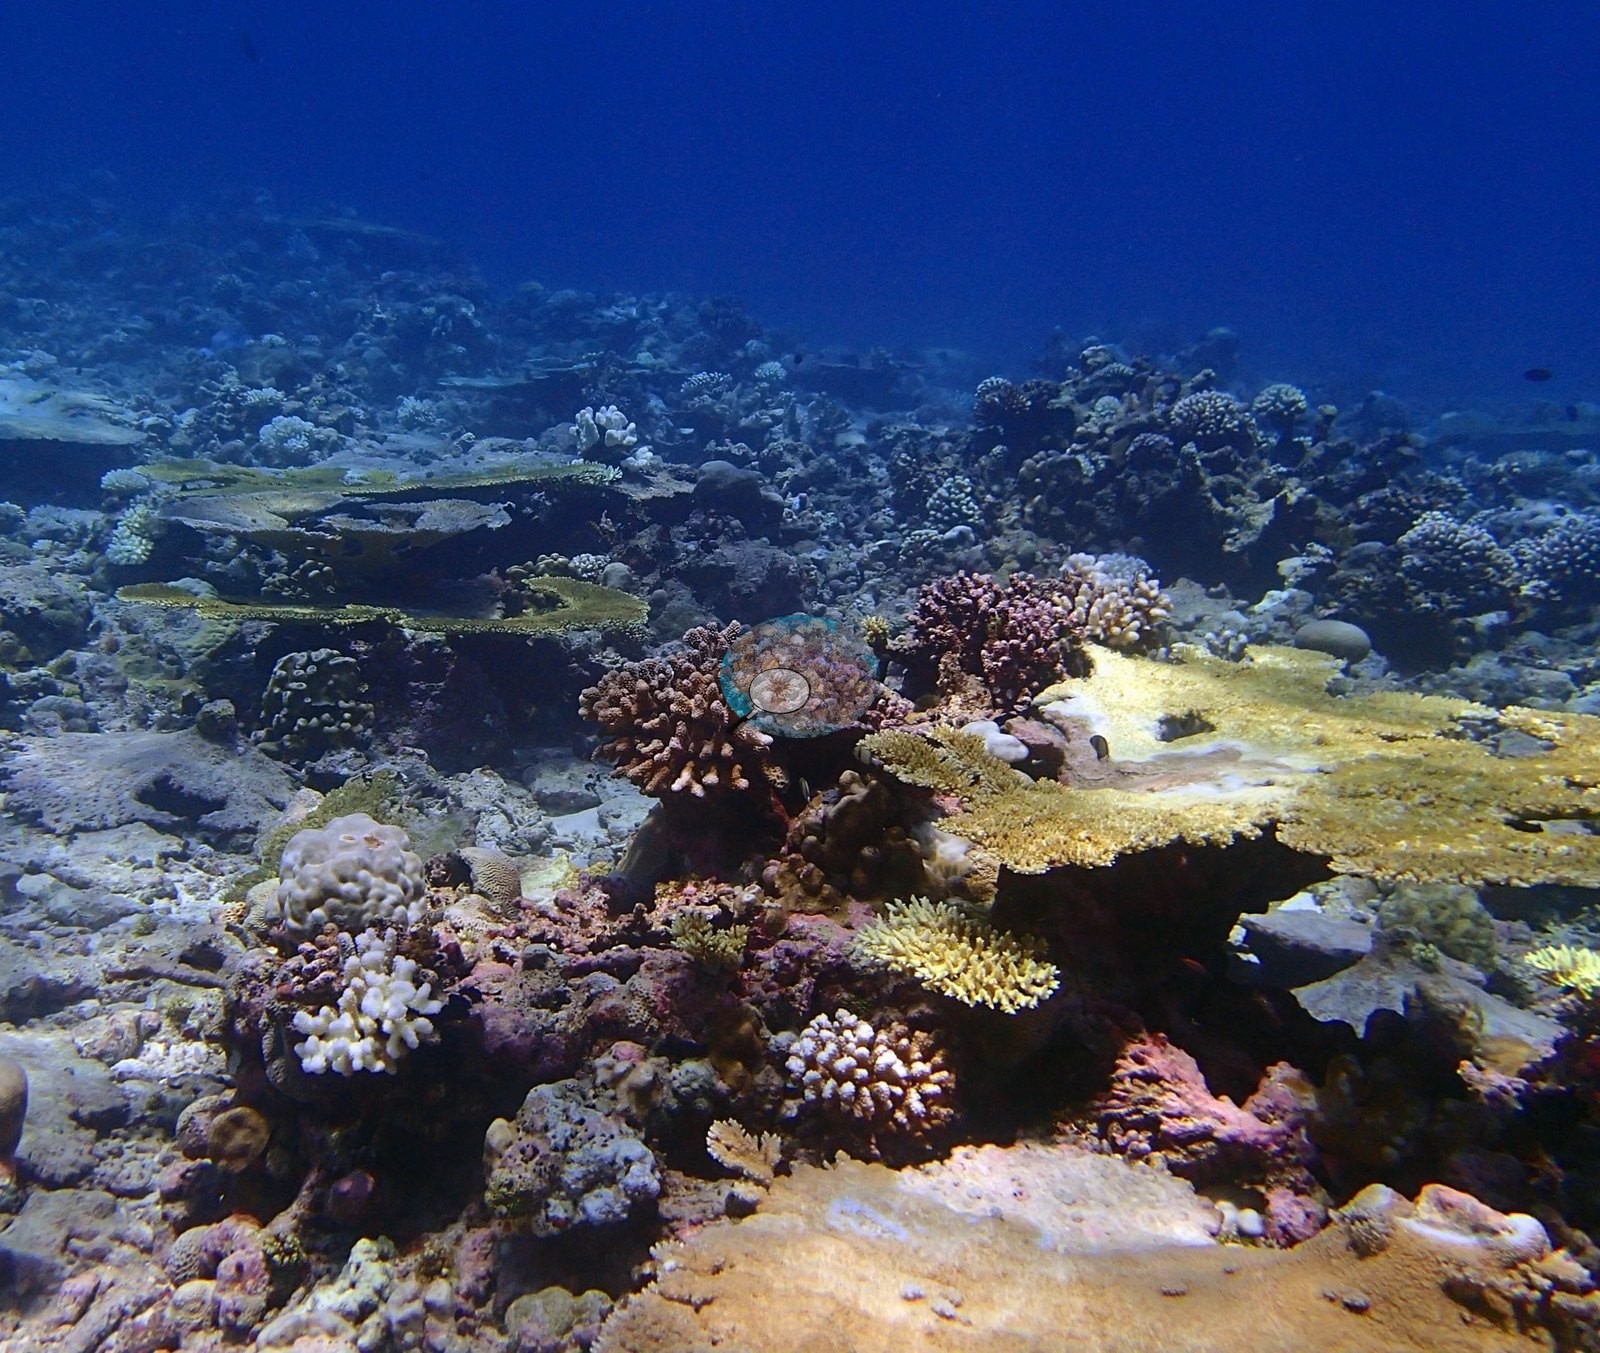
Formal transects recorded 41% coral cover against 47.1% algae, with noticeably more open and sediment-covered ground than its neighbor BIBL86 (e.g., Image 8, Image 14, Image 17, Image 22, Image 36, Image 39).
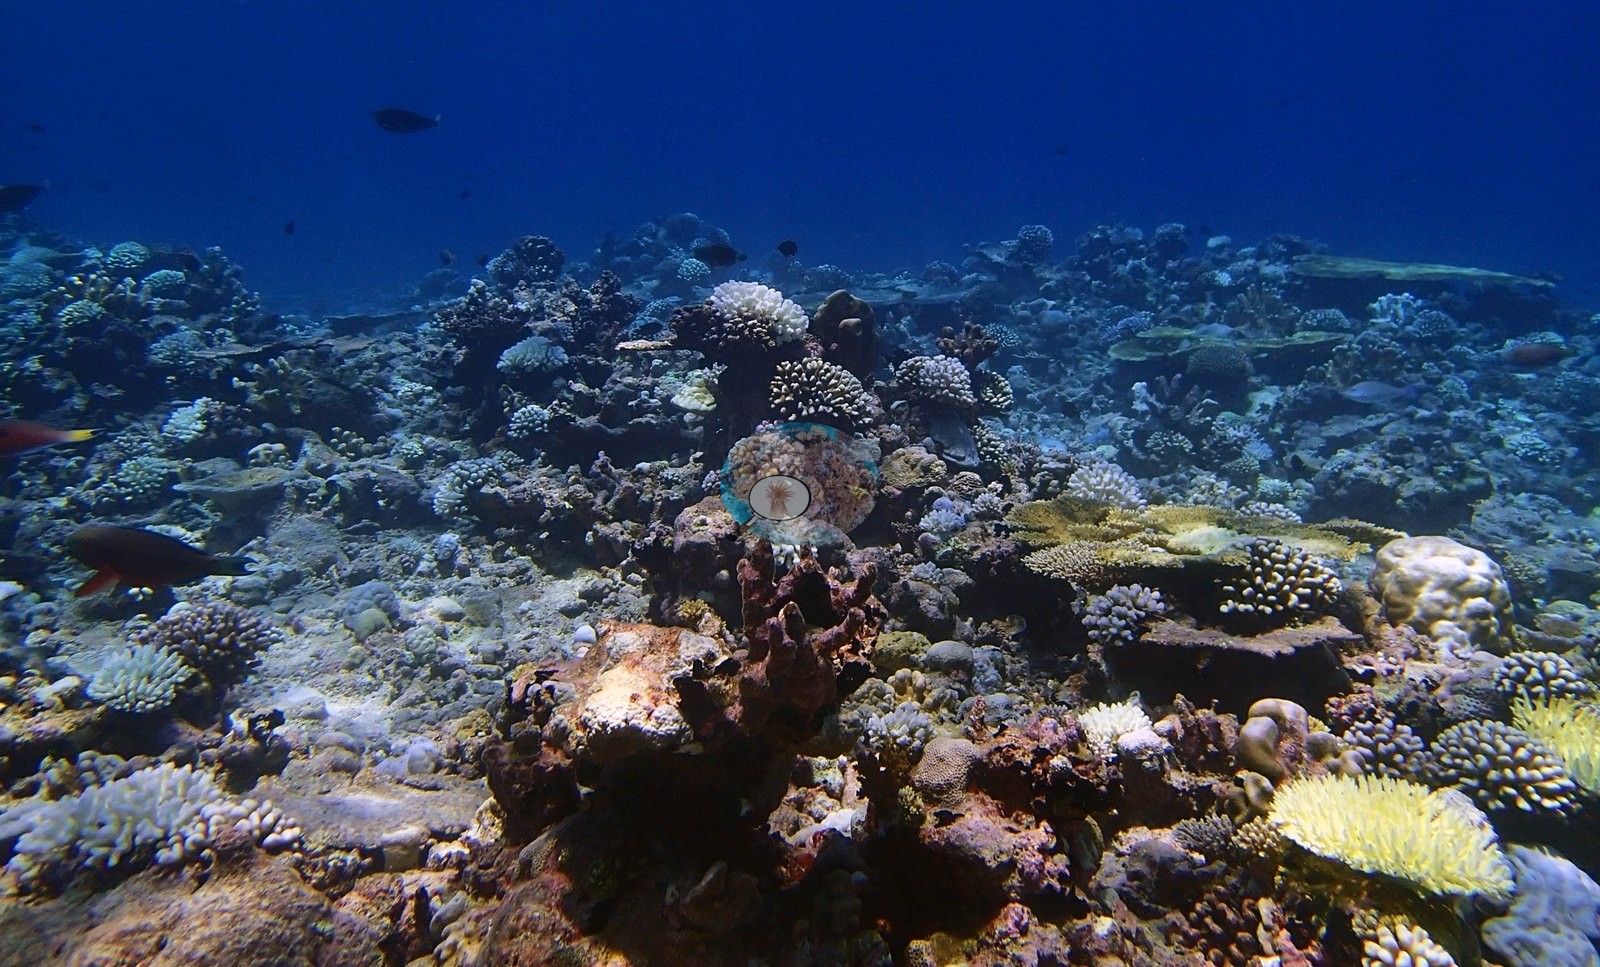
The three depth transects peak at 53% cover at mid-depth, precisely where the assemblage is most even, between an Acropora-dominated shallow station and a Porites-led deep one under the highest algal cover of the profile. Image-based methods read this reef 22–25 points lower than the transects (CoralNet 18.6%, Coralscapes 16.0%); the three are not interchangeable and should not be averaged (see the full report).
Stressors
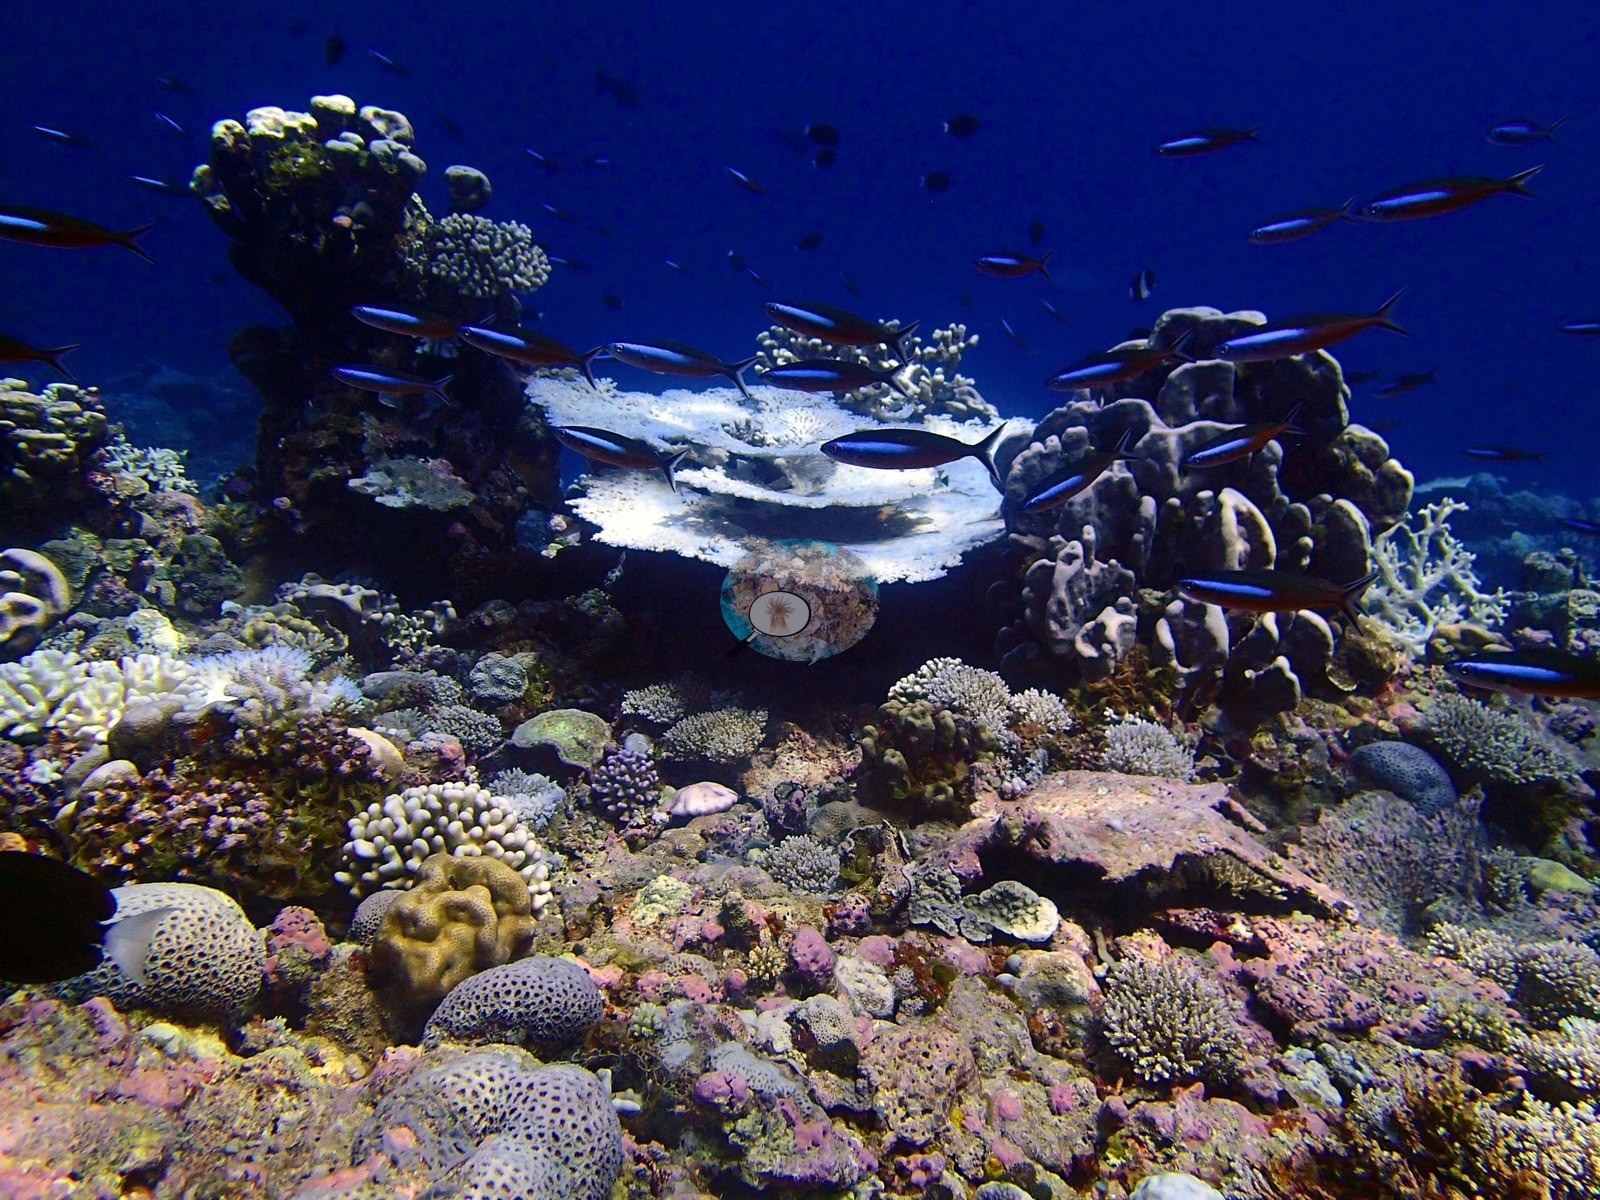
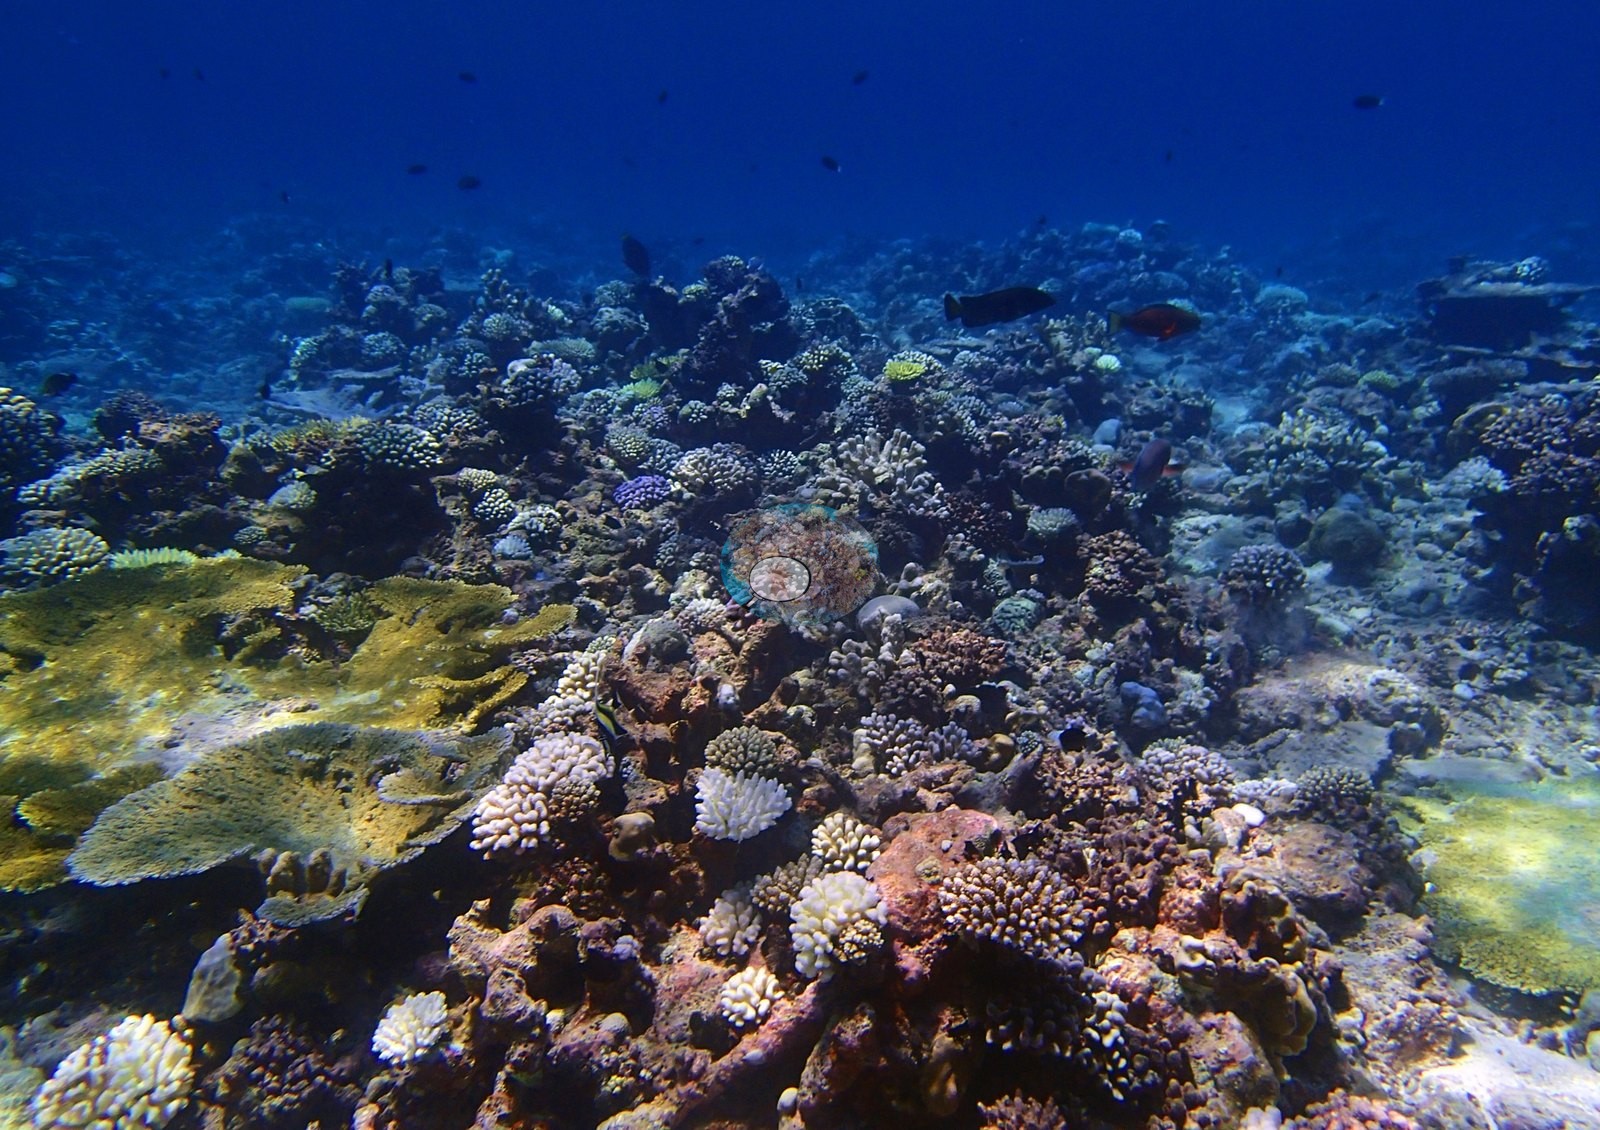
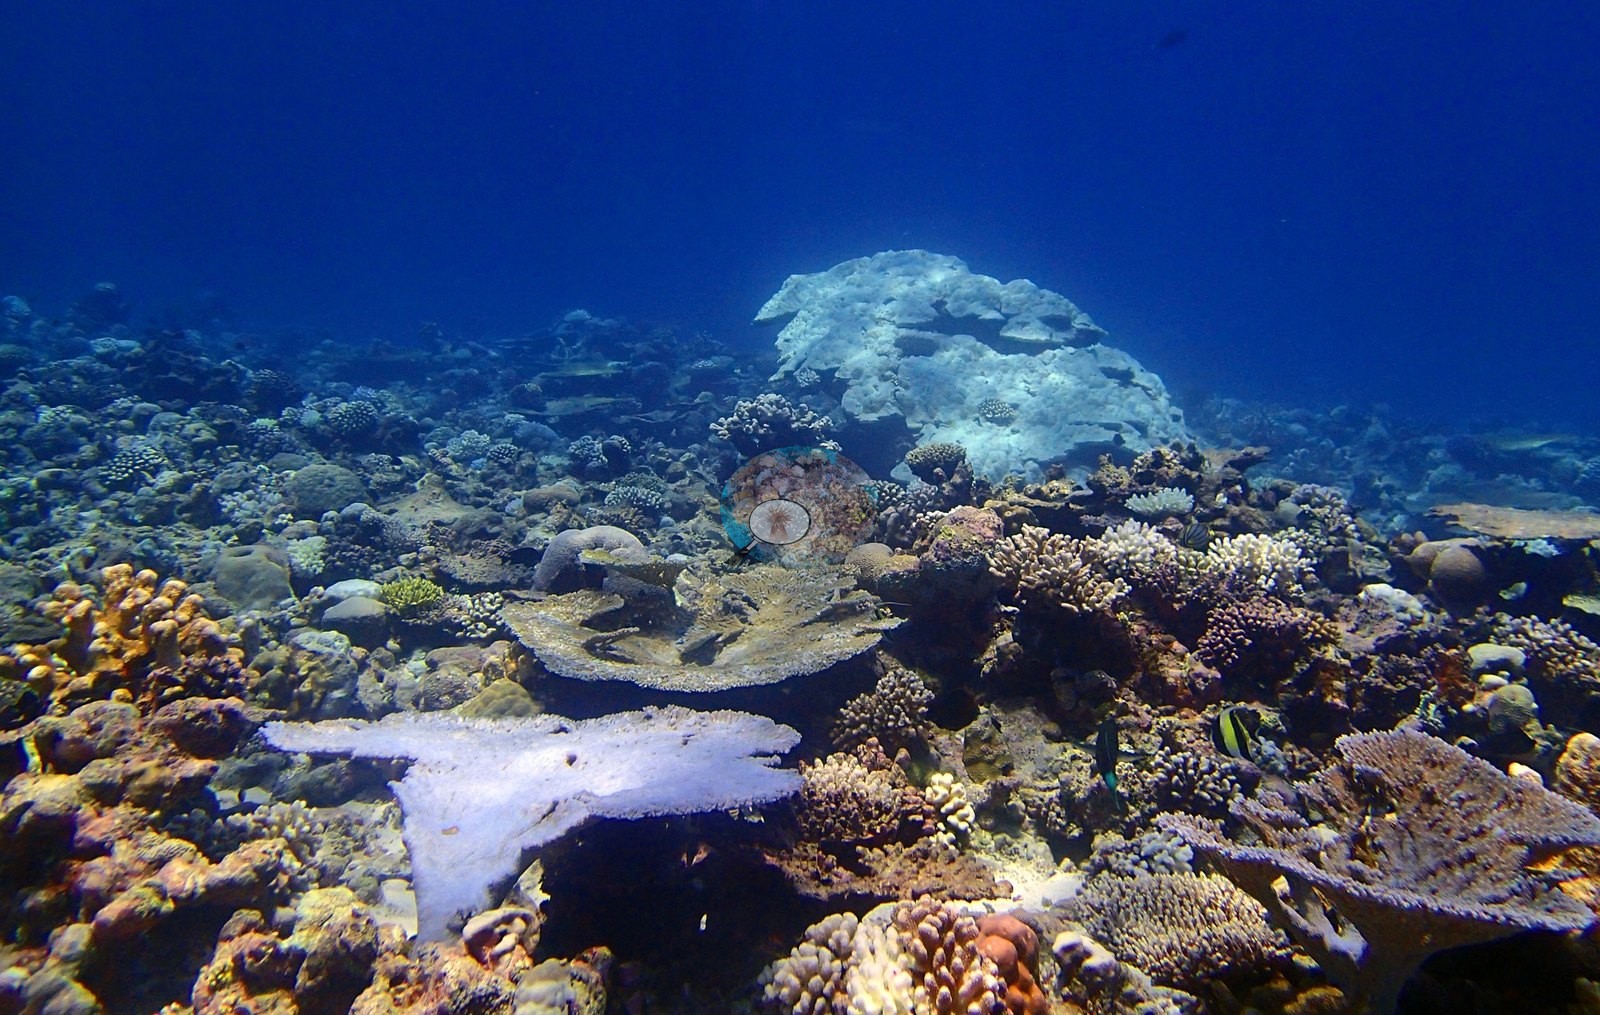
Published bleaching is 9.6%, and the photographs record pale-to-white table colonies at close range over a reef alternating between open crusted pavement and branching-and-table habitat (e.g., Image 1, Image 2, Image 7, Image 13, Image 15, Image 19, Image 27, Image 29, Image 35).
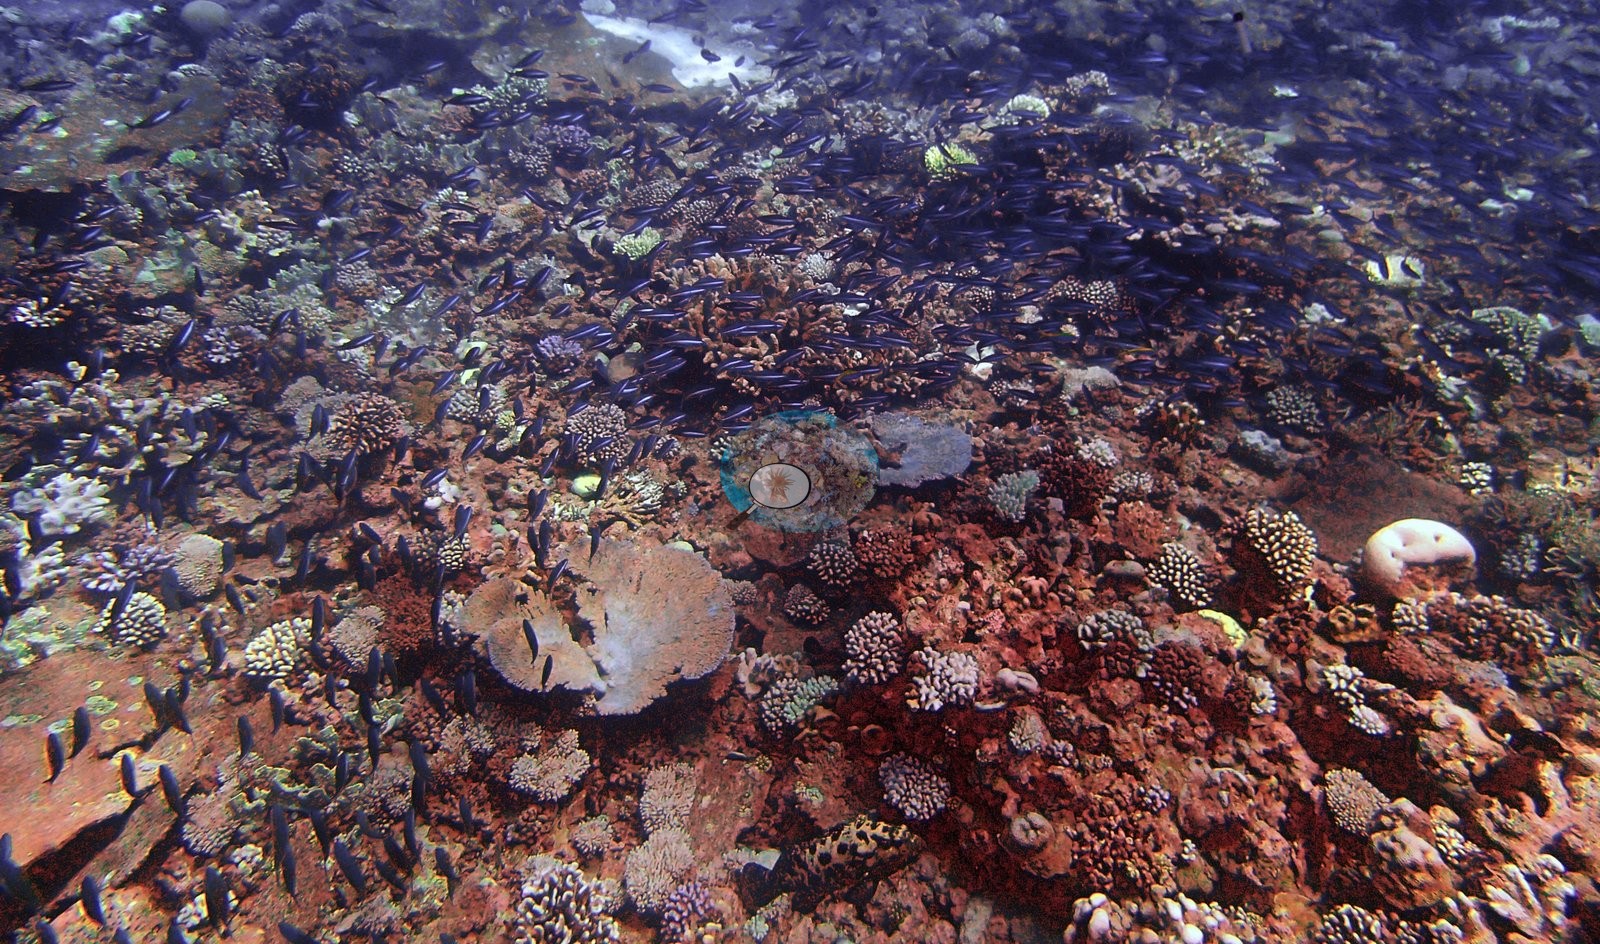
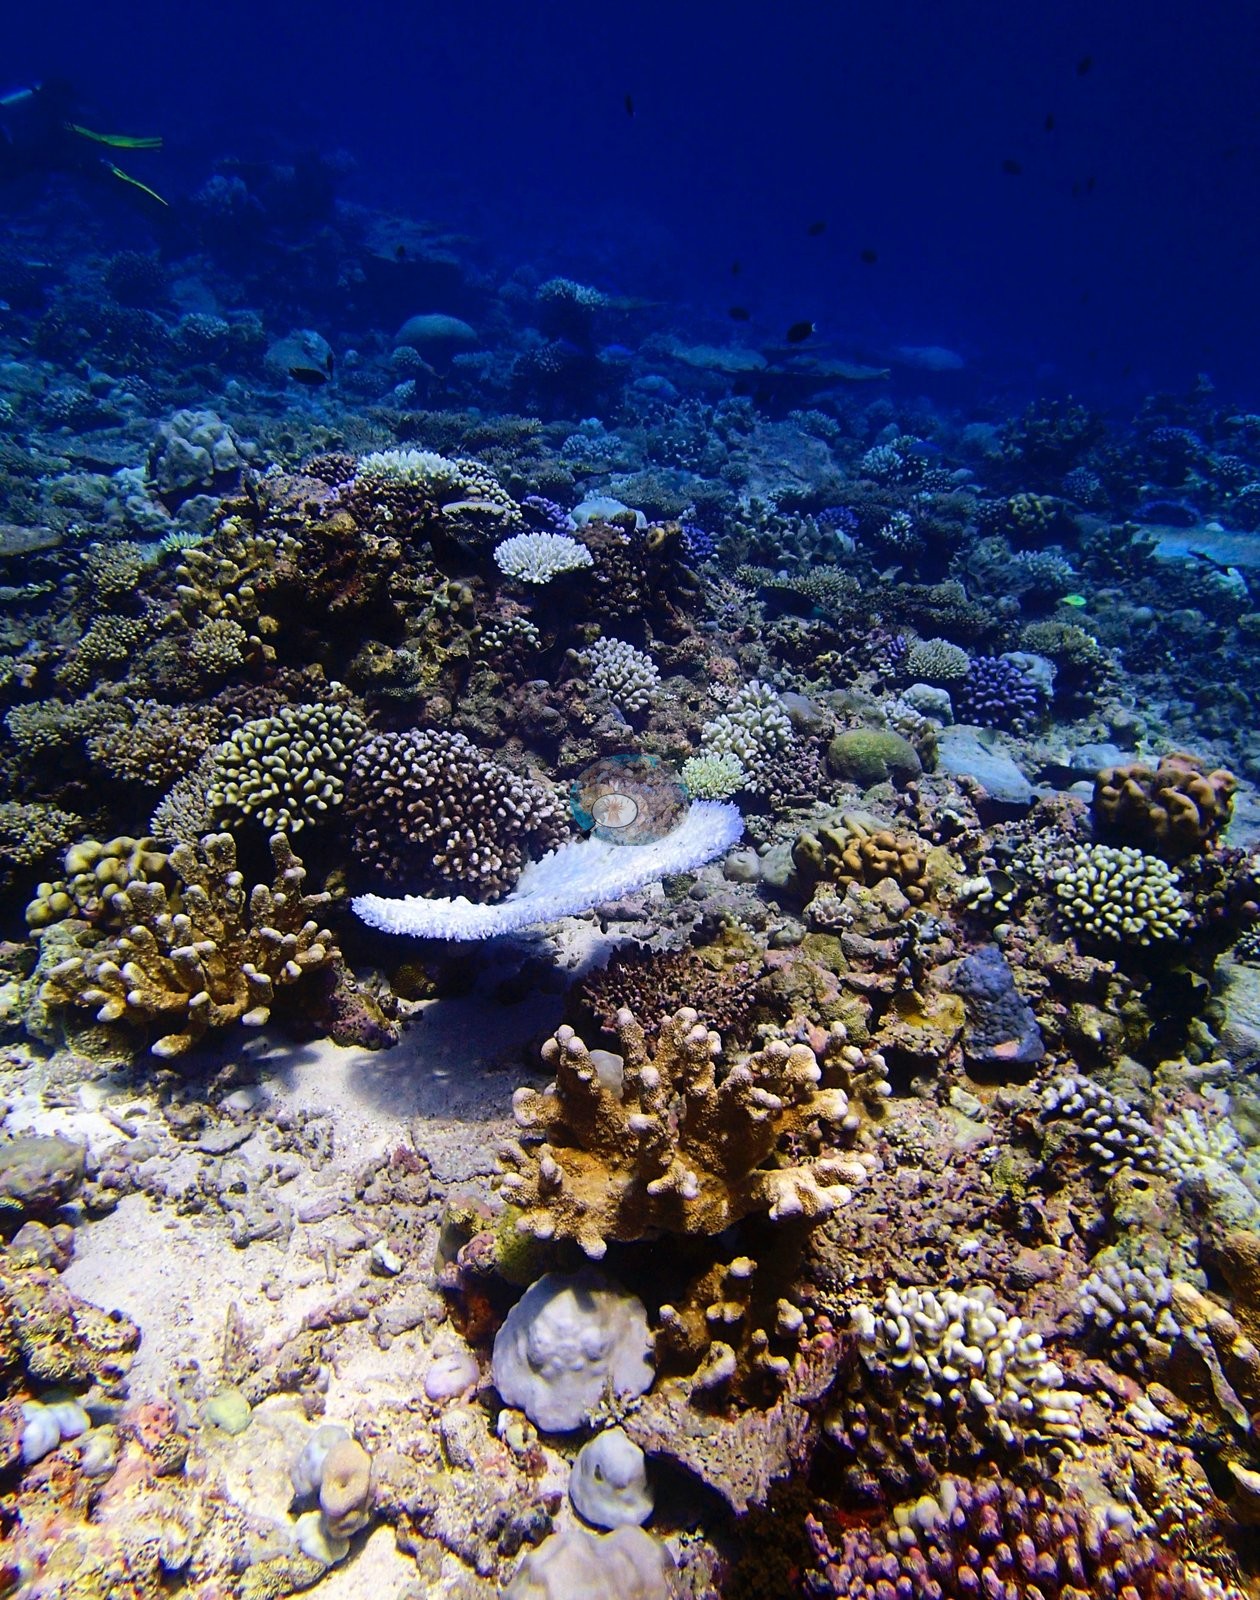
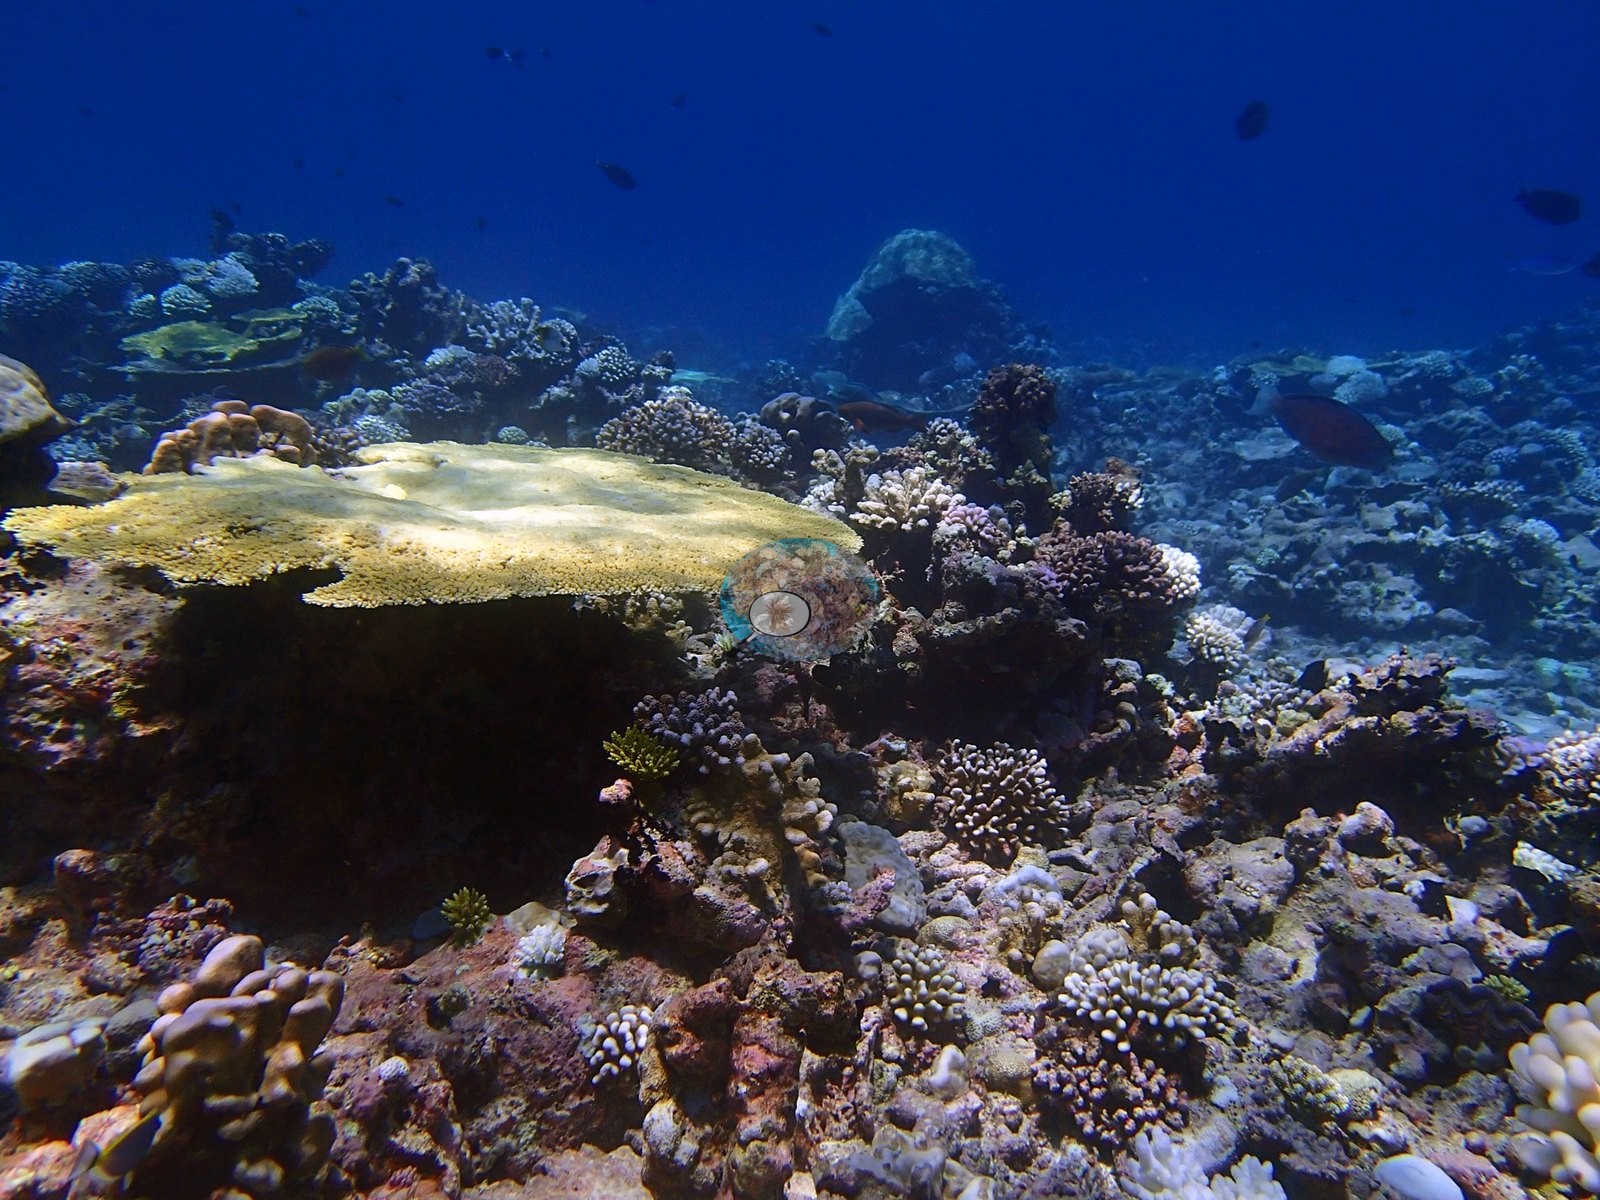
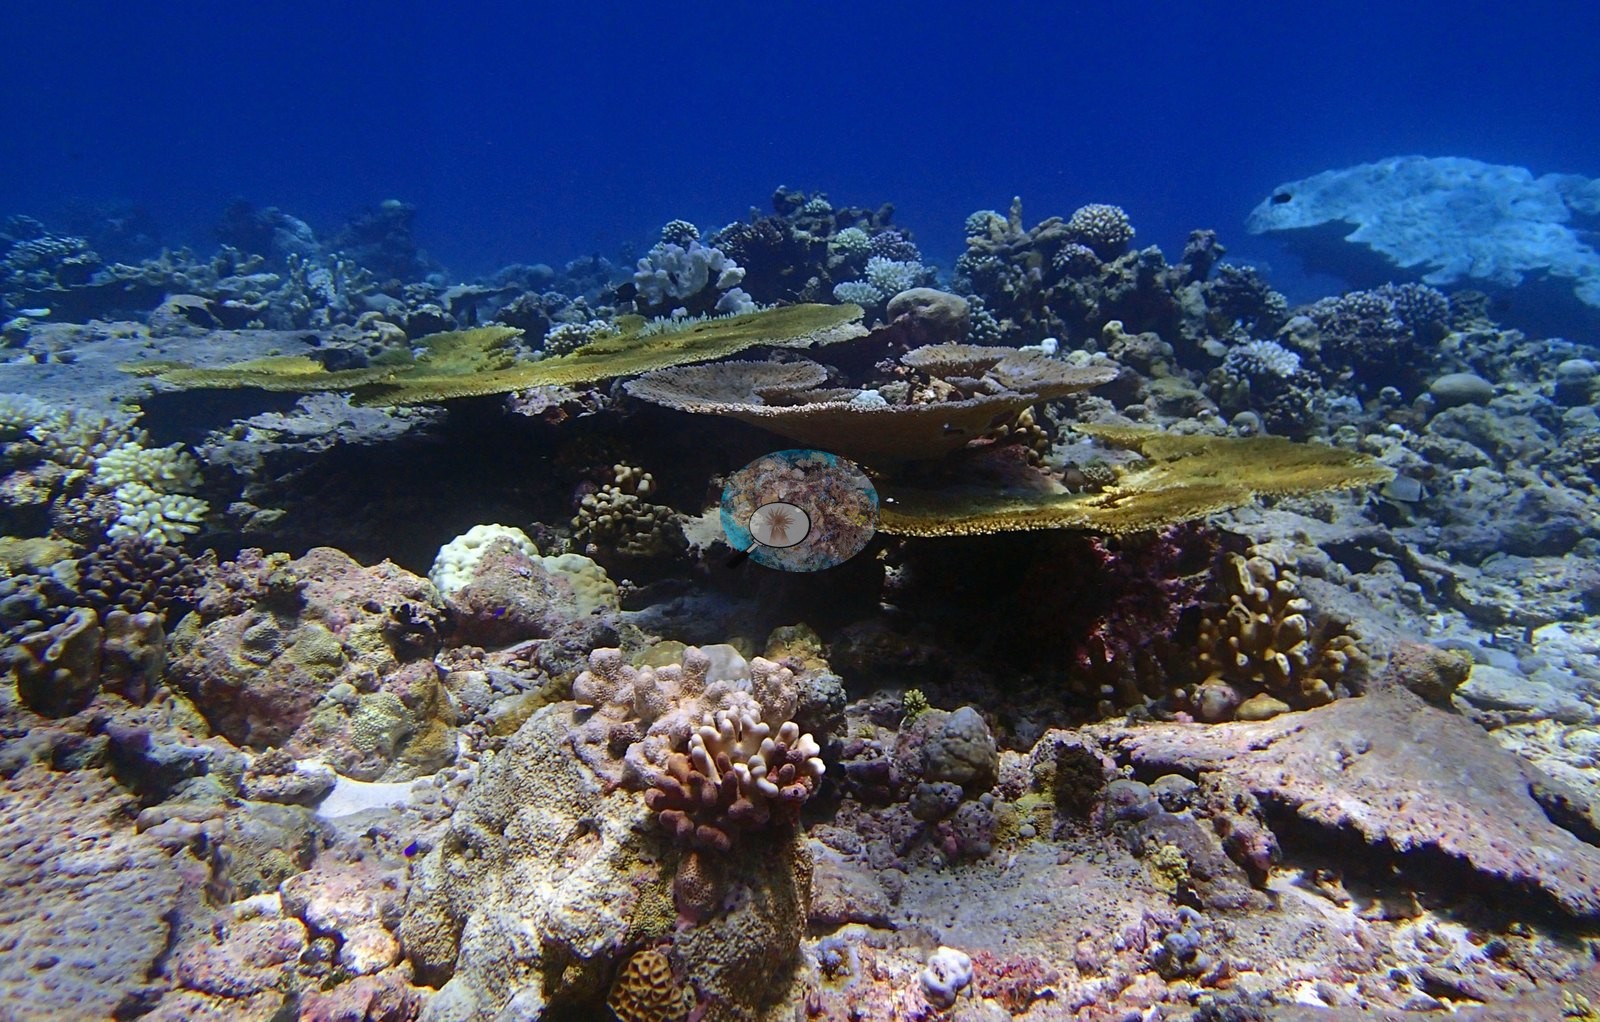
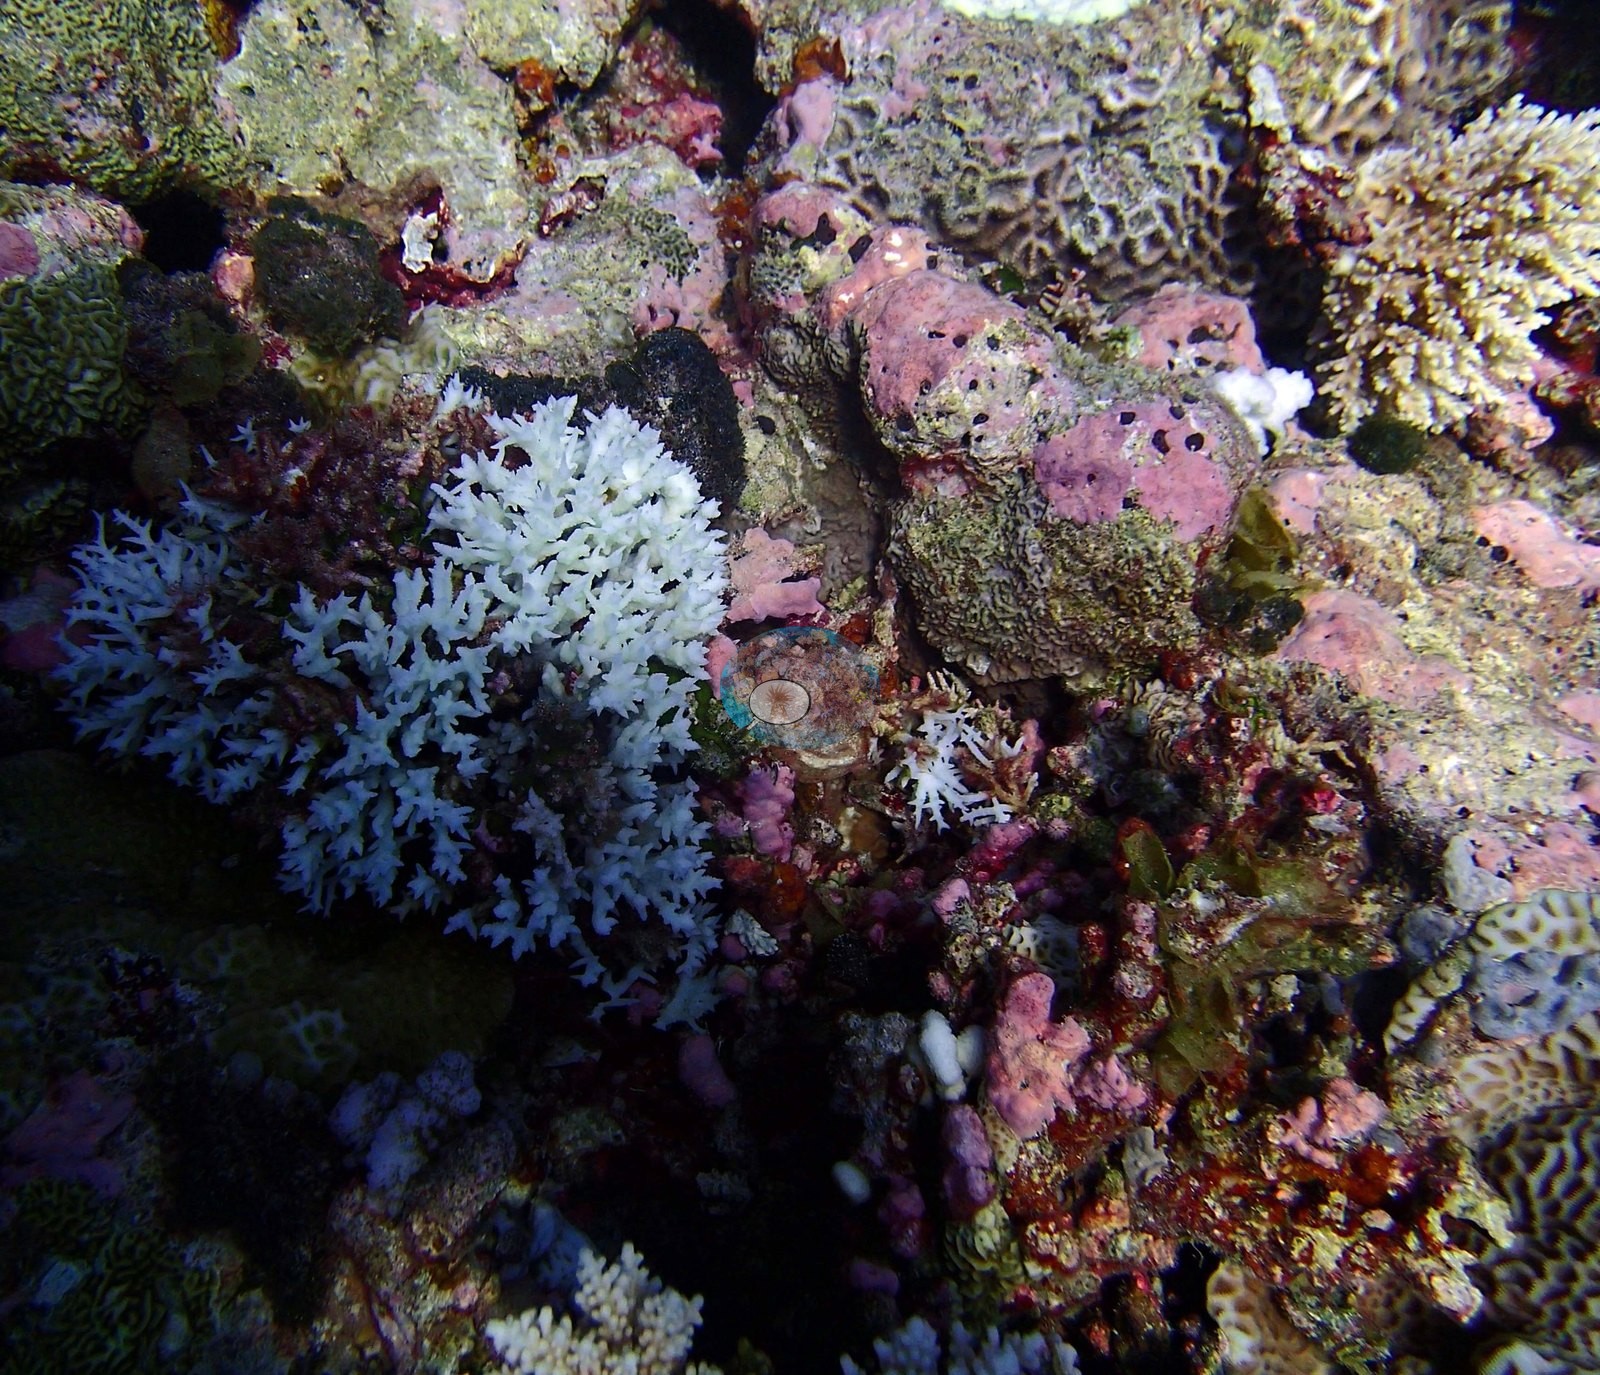
No crown-of-thorns or disease signs were identified in the 35 stills reviewed. The bleaching percentage is a computer vision figure — CoralNet annotation of the informal survey images, not a diver's field estimate — and human-vs-model agreement is weaker for bleaching (r = 0.40) than for coral cover (r = 0.72).
Comparisons with other data
No independent survey was made at this exact site; the nearest ones are listed in the table below.
CV model comparison
More info
Those are point counts on the photographs; this is a diver swimming a transect. The models and the reference never saw the same thing. ⚠ SITE-LEVEL ONLY. The 2,500 frames were not associated with any transect taken within 200 m of them, so transect-vs-image comparisons are site means, never frames. The transect value is already in the pin `cover` field (109 of 112 pins, sourced to the paper's suppl. S1) and is read from there, never re-imported. The transect is THE coral-cover value for this site and stands alone. The rows below it are a methods comparison only: no computer-vision value is averaged with it, feeds the headline, or carries over to the site's cover figure (Anderson, 2026-09-22).| Method | Hard-coral cover (%) |
|---|---|
| Transect (published) | 40.6 |
| CoralNet | 27.9 |
| In-house DINOv3 | 34.0 |
| CoralSCOP edited | 29.5 |
| Claude | 30.3 |
Independent surveys nearby
Within 5 km, 1 independent survey station recorded hard coral cover in 2015. The most recent nearby survey is from 2015, so these values predate recent heat stress. This site's own estimate (41%) sits 11.4 points above the range of these surveys (29%); the methods differ, so the comparison is context, not a like-for-like test.
Collected by other programs using different methods (the XL Catlin Seaview Survey uses photo-transects with automated image annotation), so these are context for the figures above, not a like-for-like comparison. Where a station was surveyed more than once the range is shown. Station names are not dive-site names.
| Agency | Site / location | Date | Hard coral cover (%) | Distance | Link |
|---|---|---|---|---|---|
| XL Catlin Seaview Survey | transect 36019 | 2015 | 29% | 3.05 km | — |
Data & links
- Read the full site report ↗
- Download benthic survey data (CSV) ↗
- Download all LOF-GRE data (933 sites) ↗
- CoralNet image repository for this region ↗
- Photo portfolio ↗
- Coral Reef Diagnostics page for this area ↗
All images from Coral Reef Diagnostics. Data are from Coral Reef Diagnostics and the organizations named in the data-sources table above.
 © Coral Reef Diagnostics.