
Turks and Caicos - Thunderdome

Part of the regional summary: Turks and Caicos Islands
More info
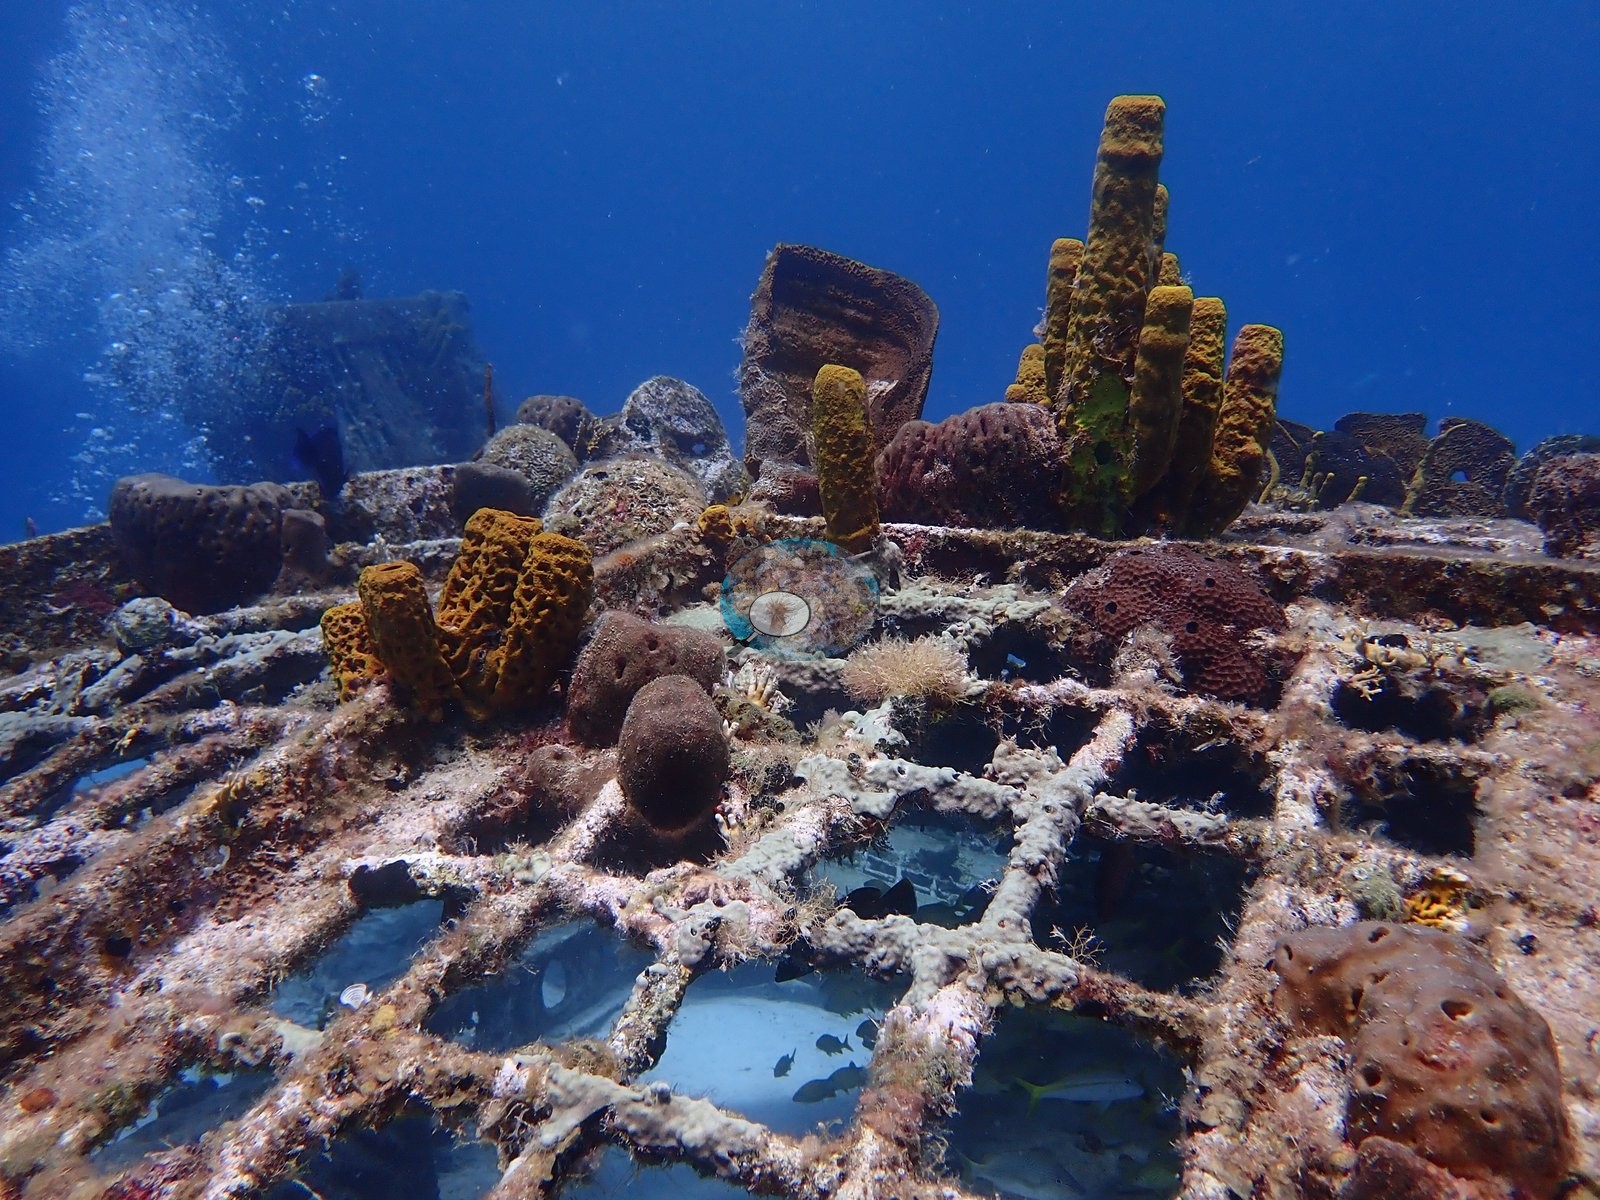
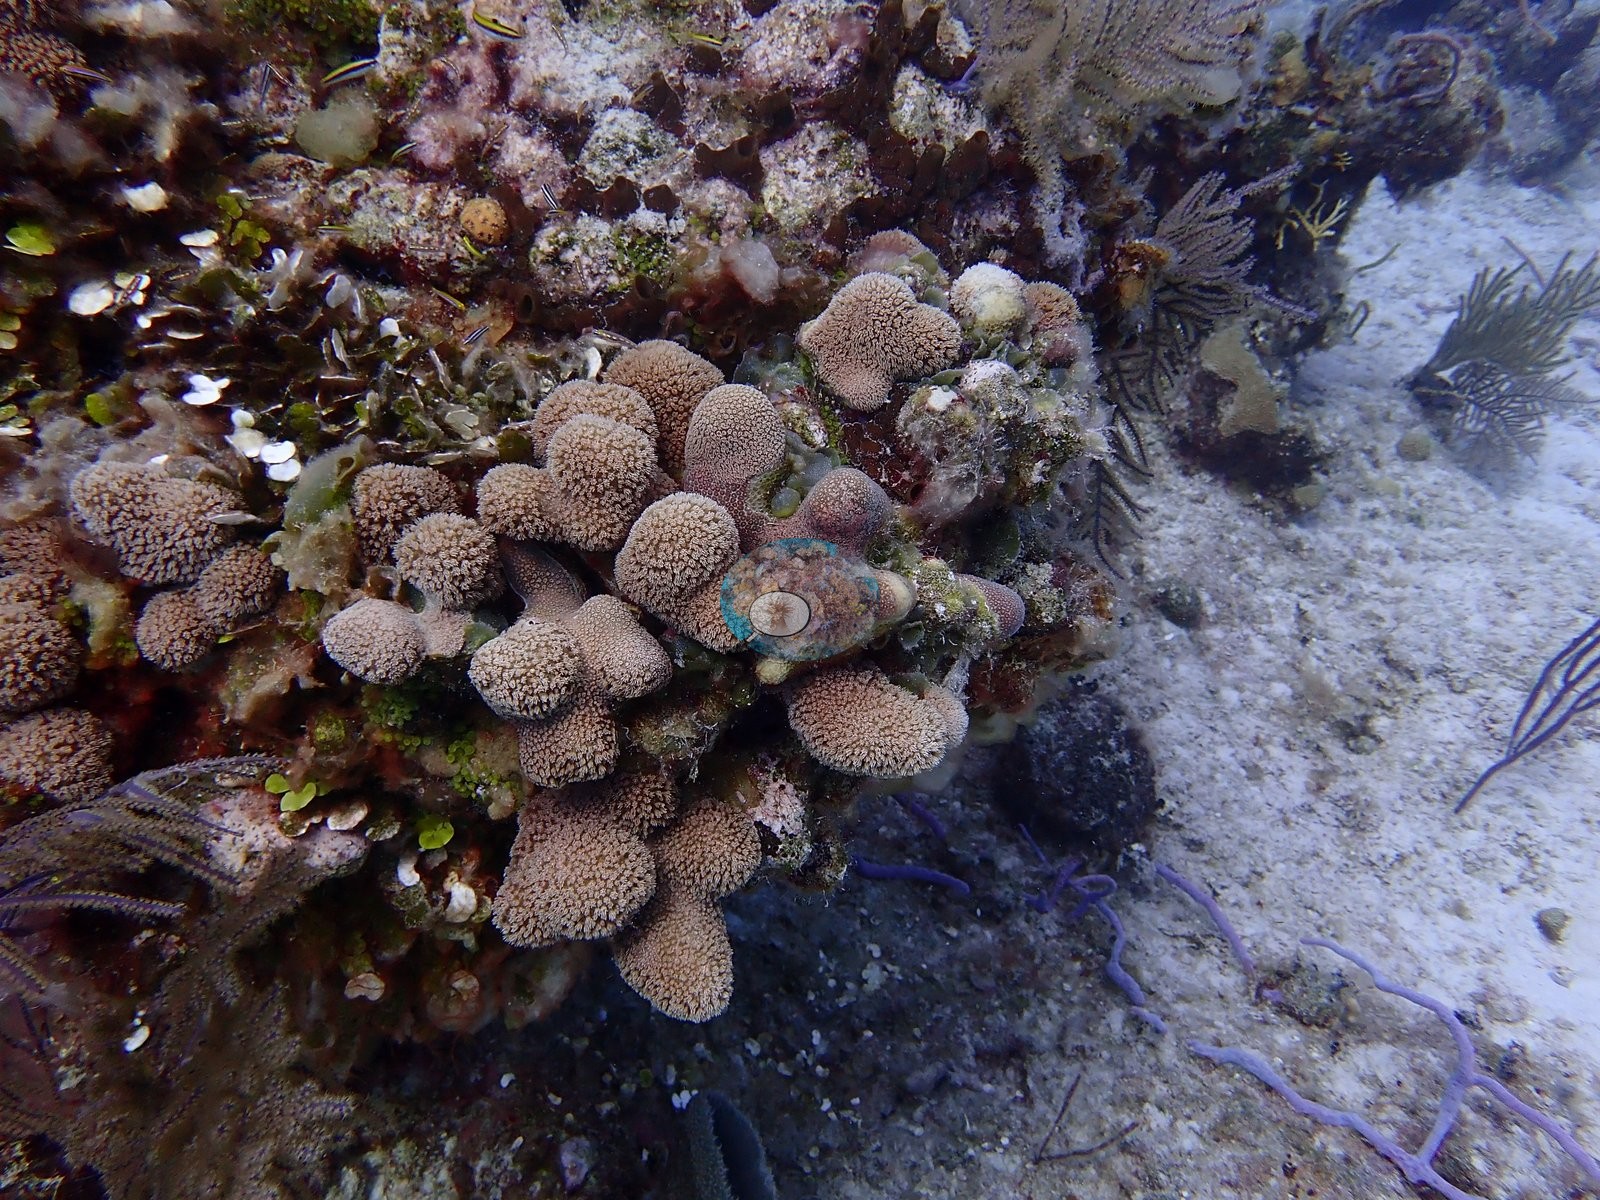
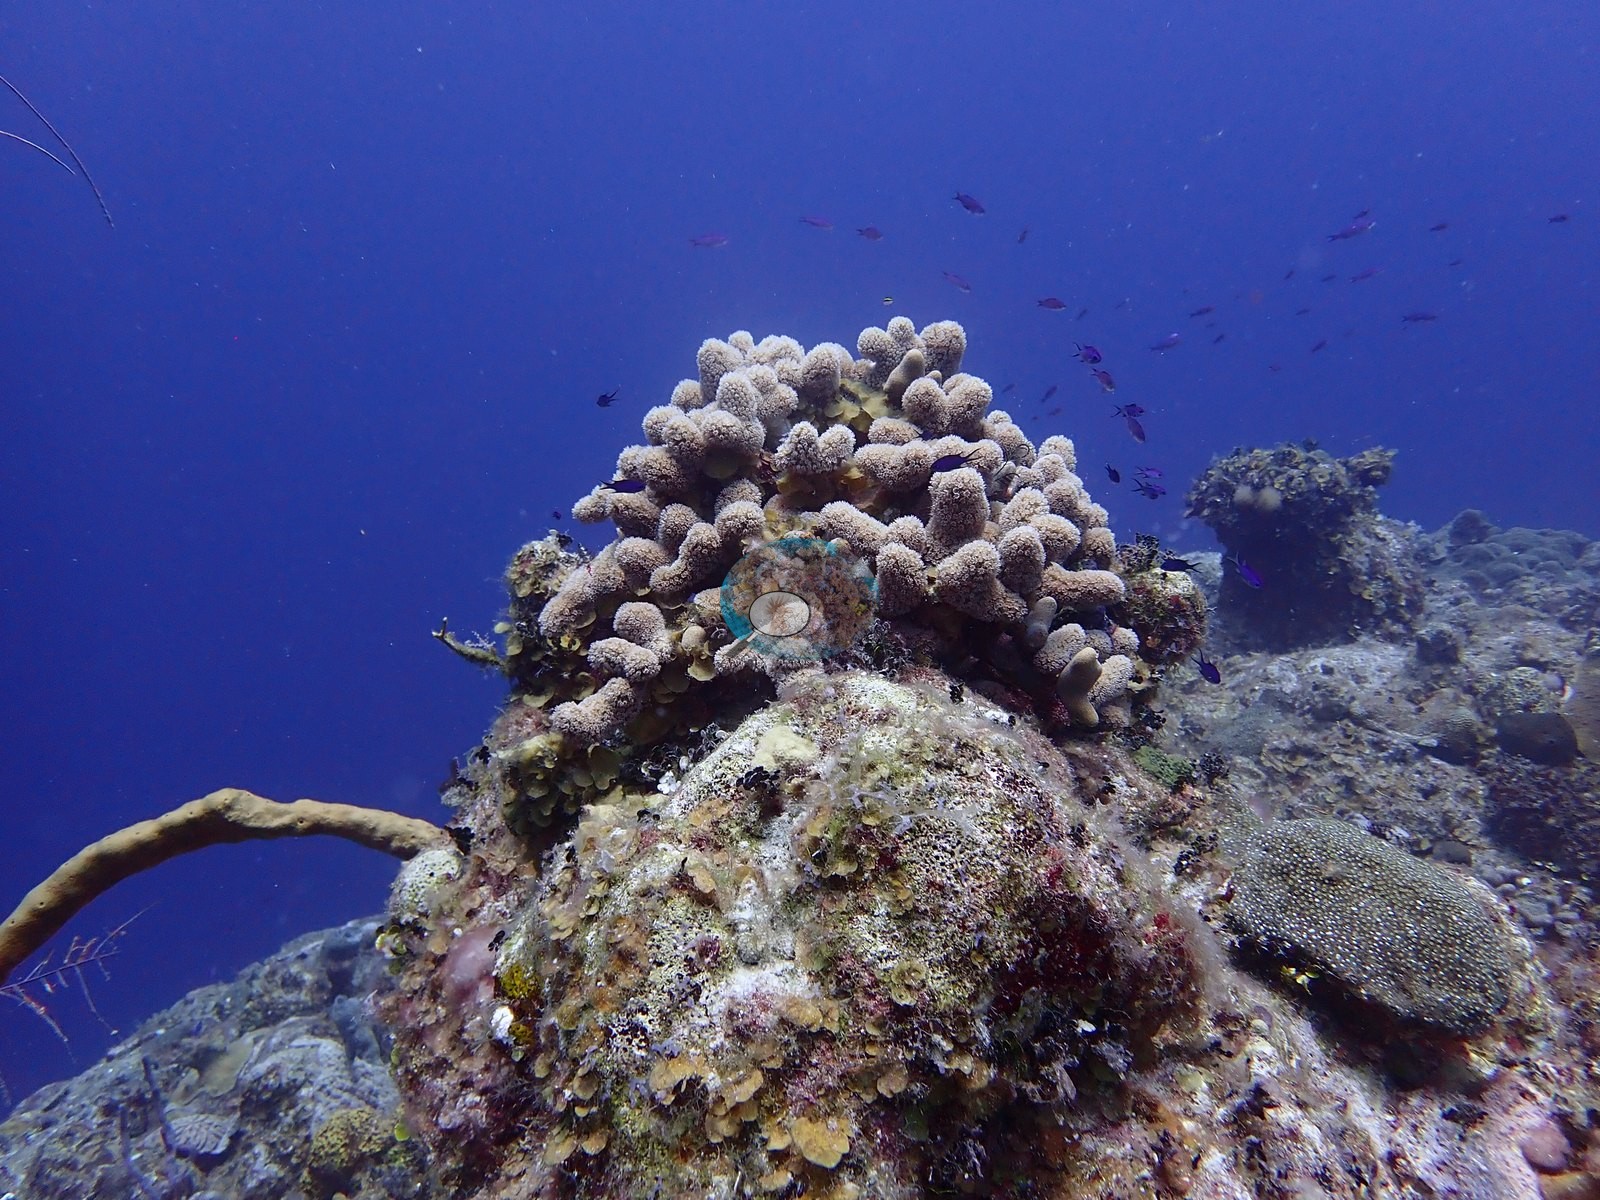
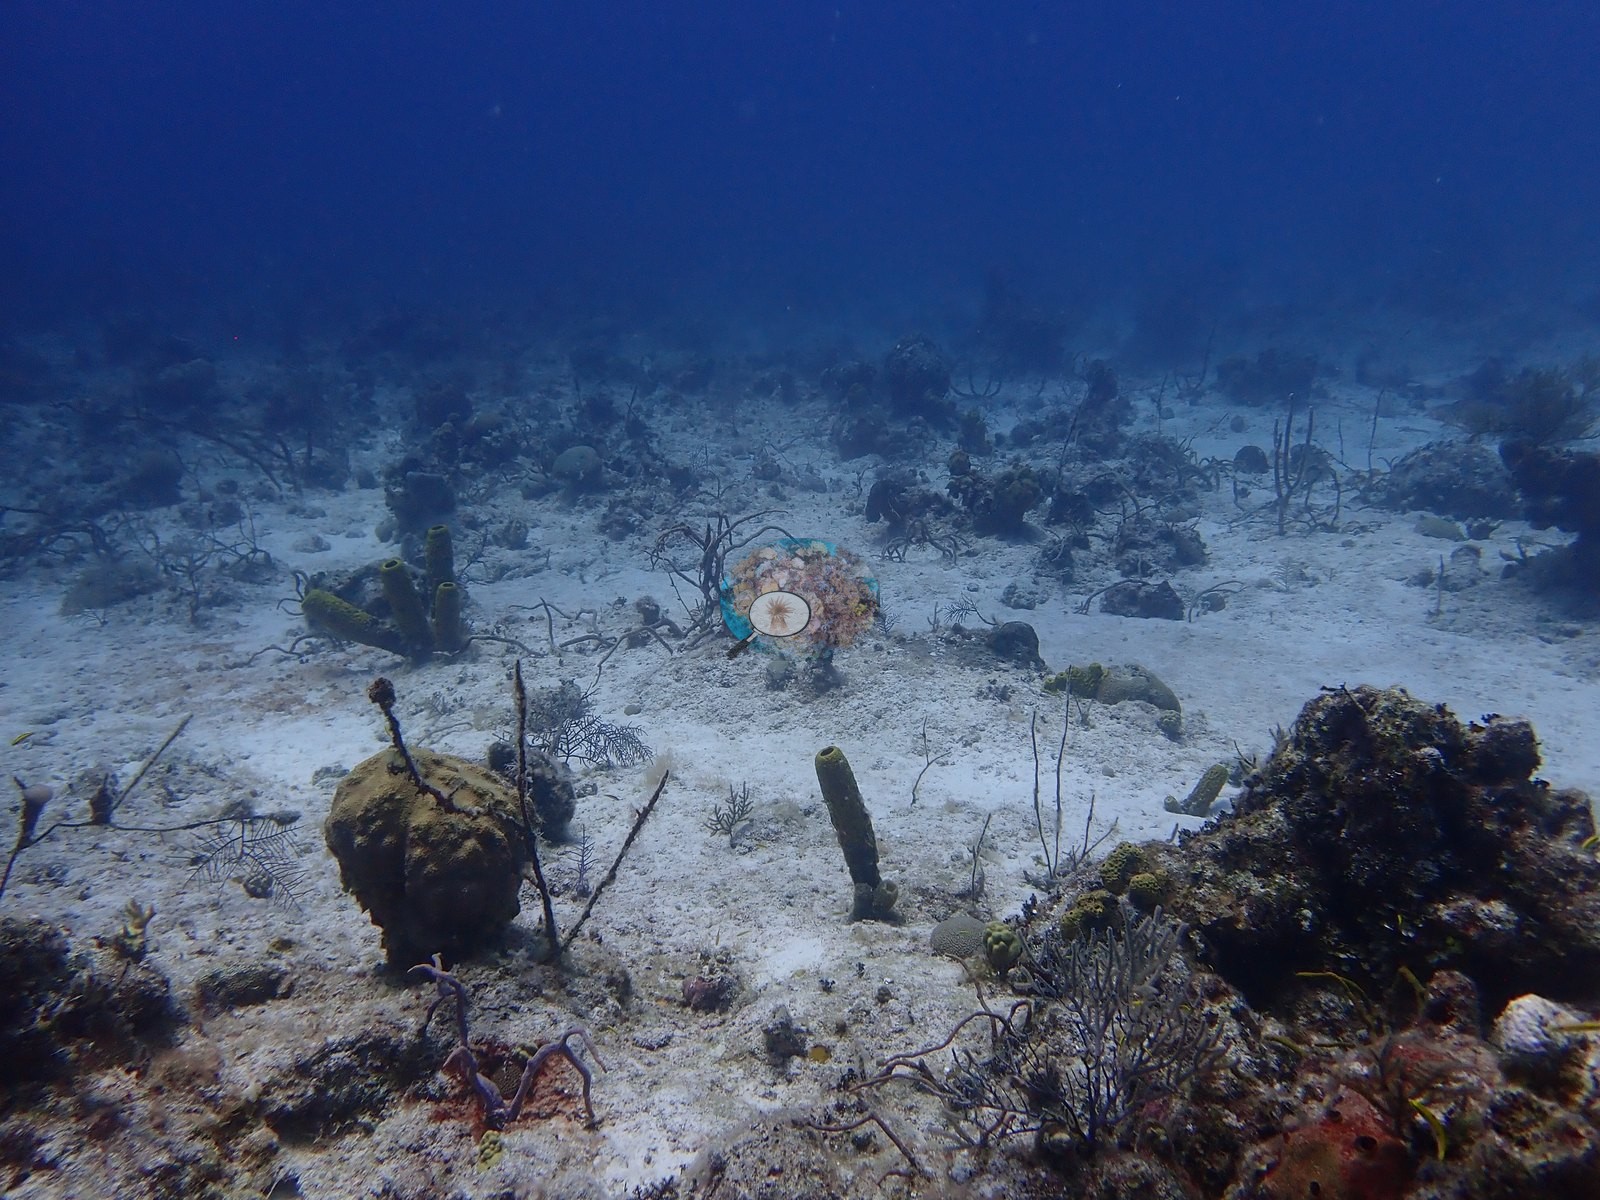
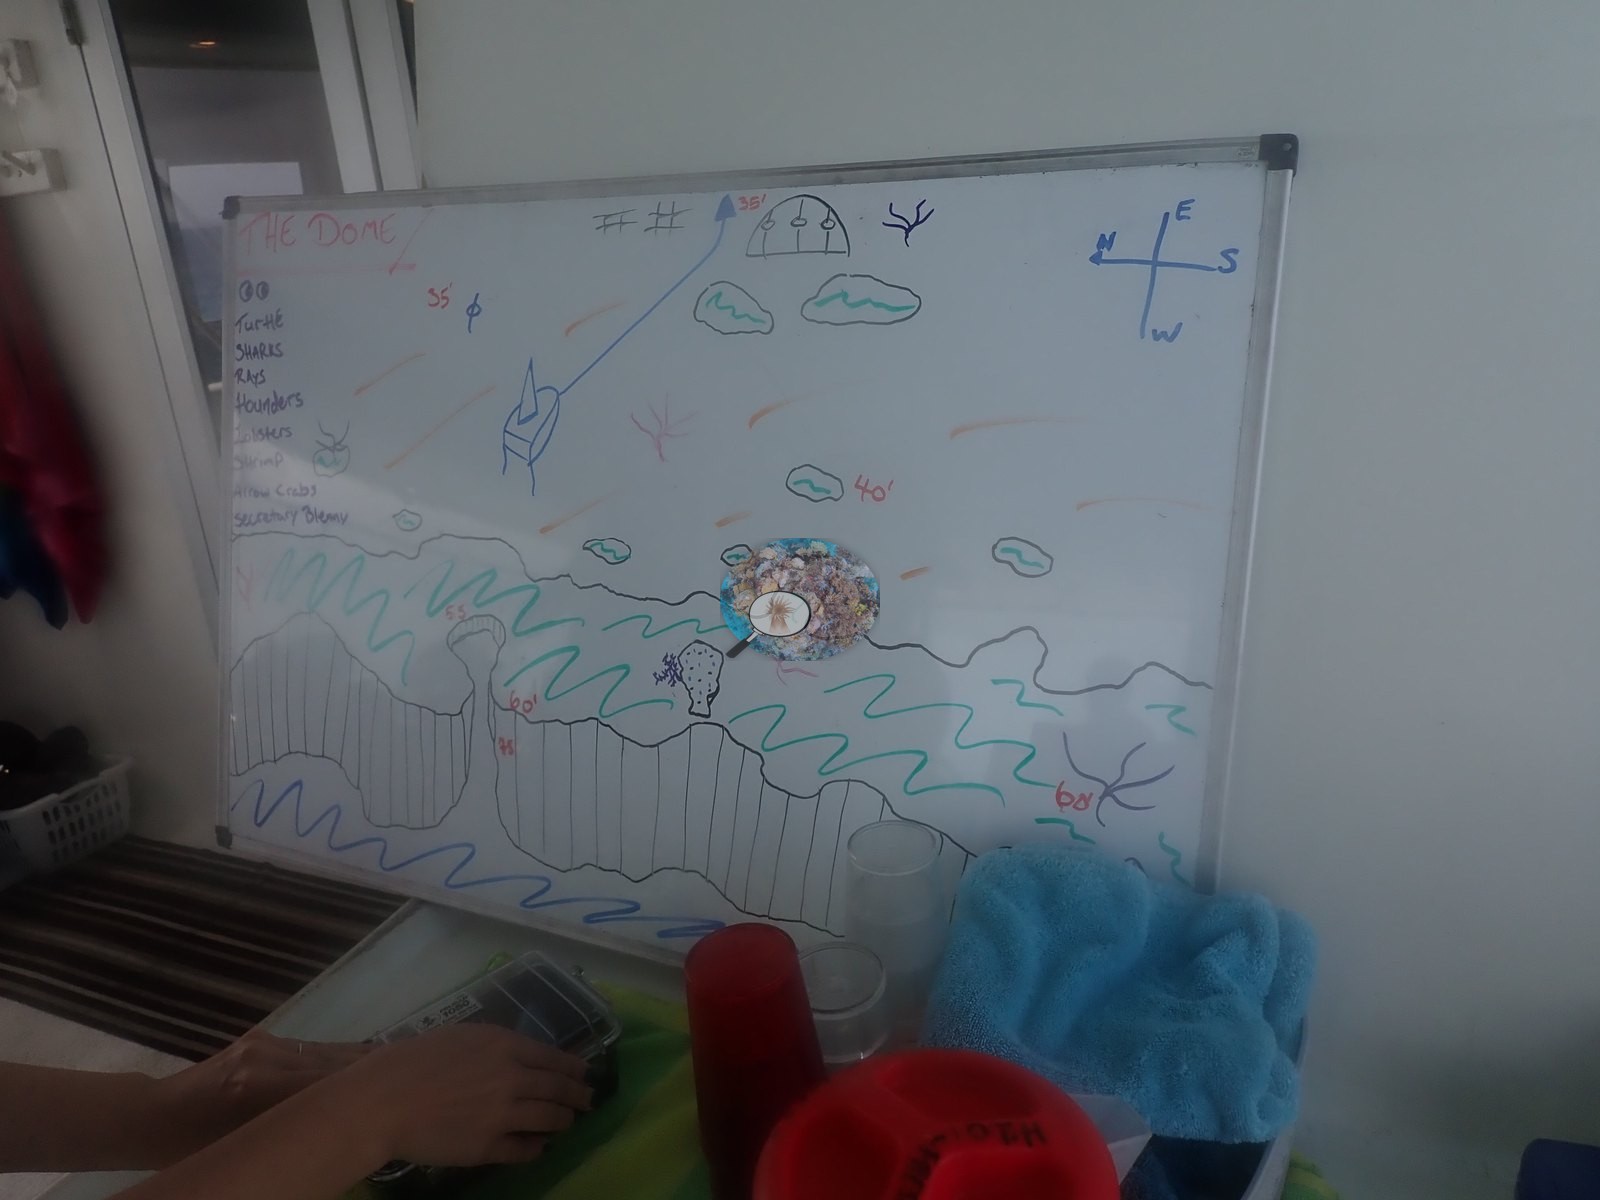
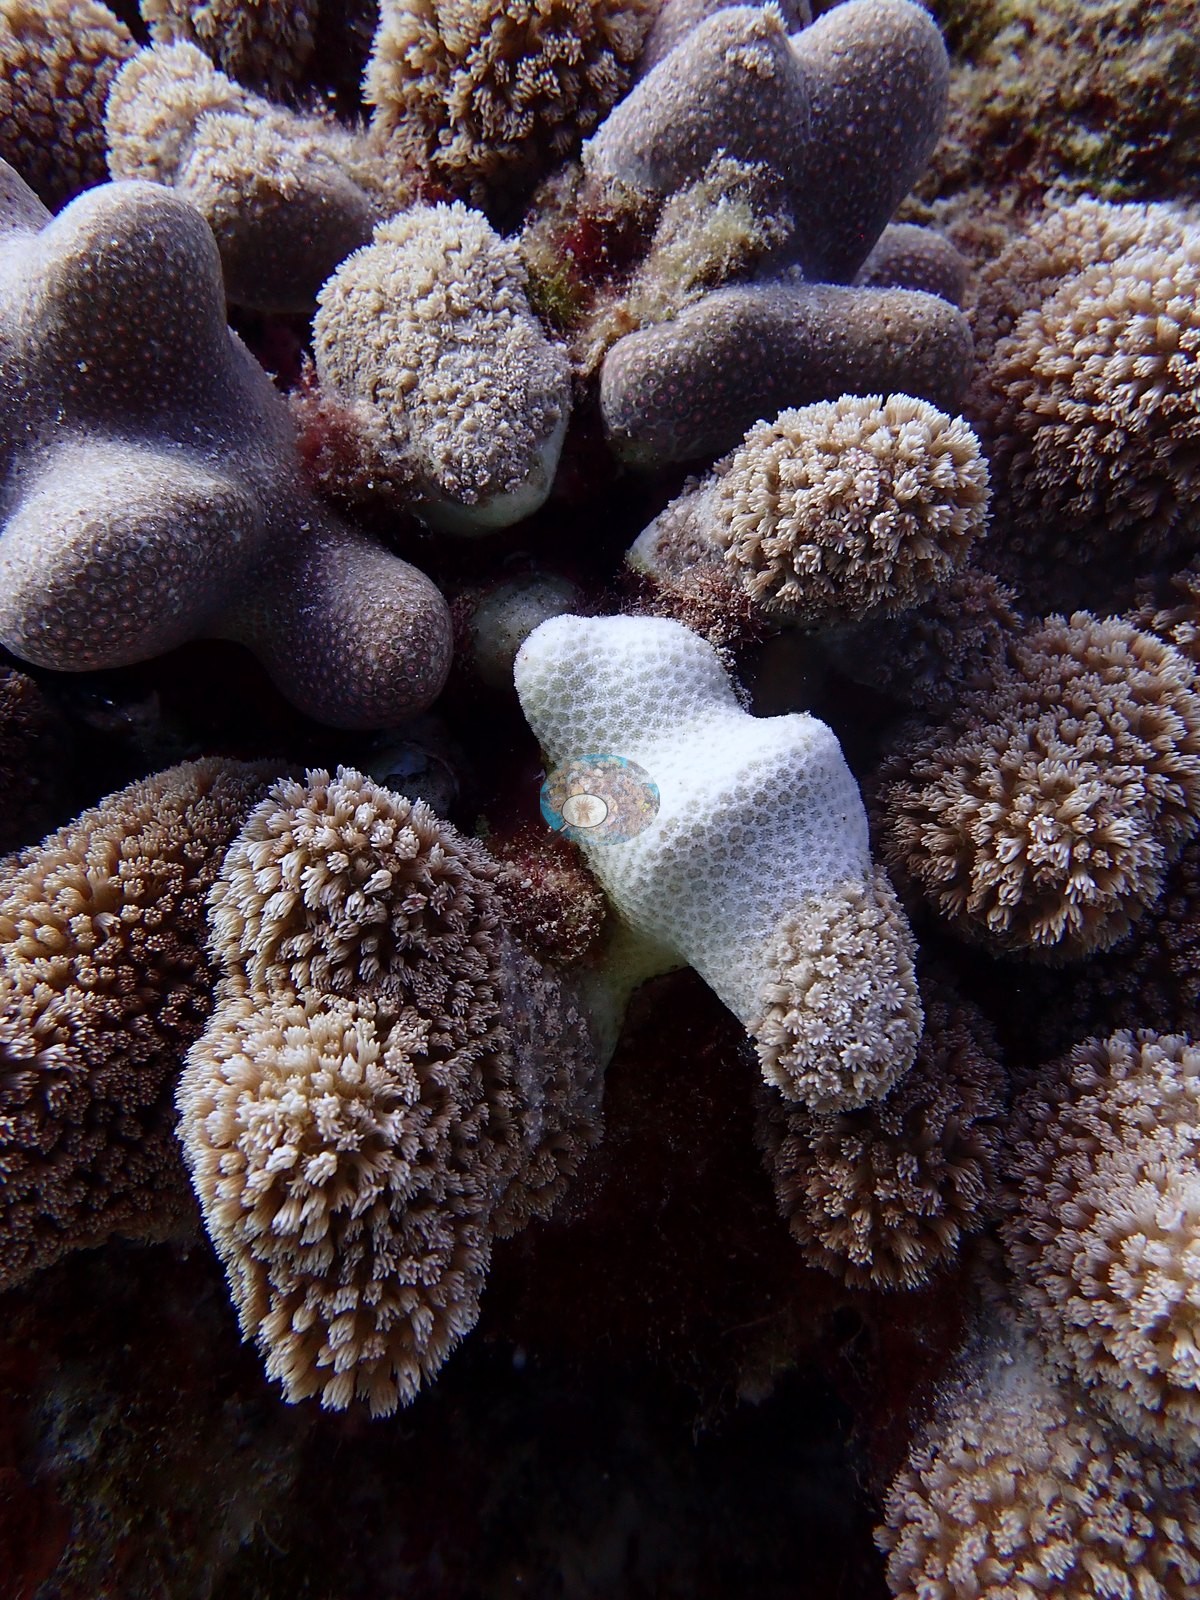
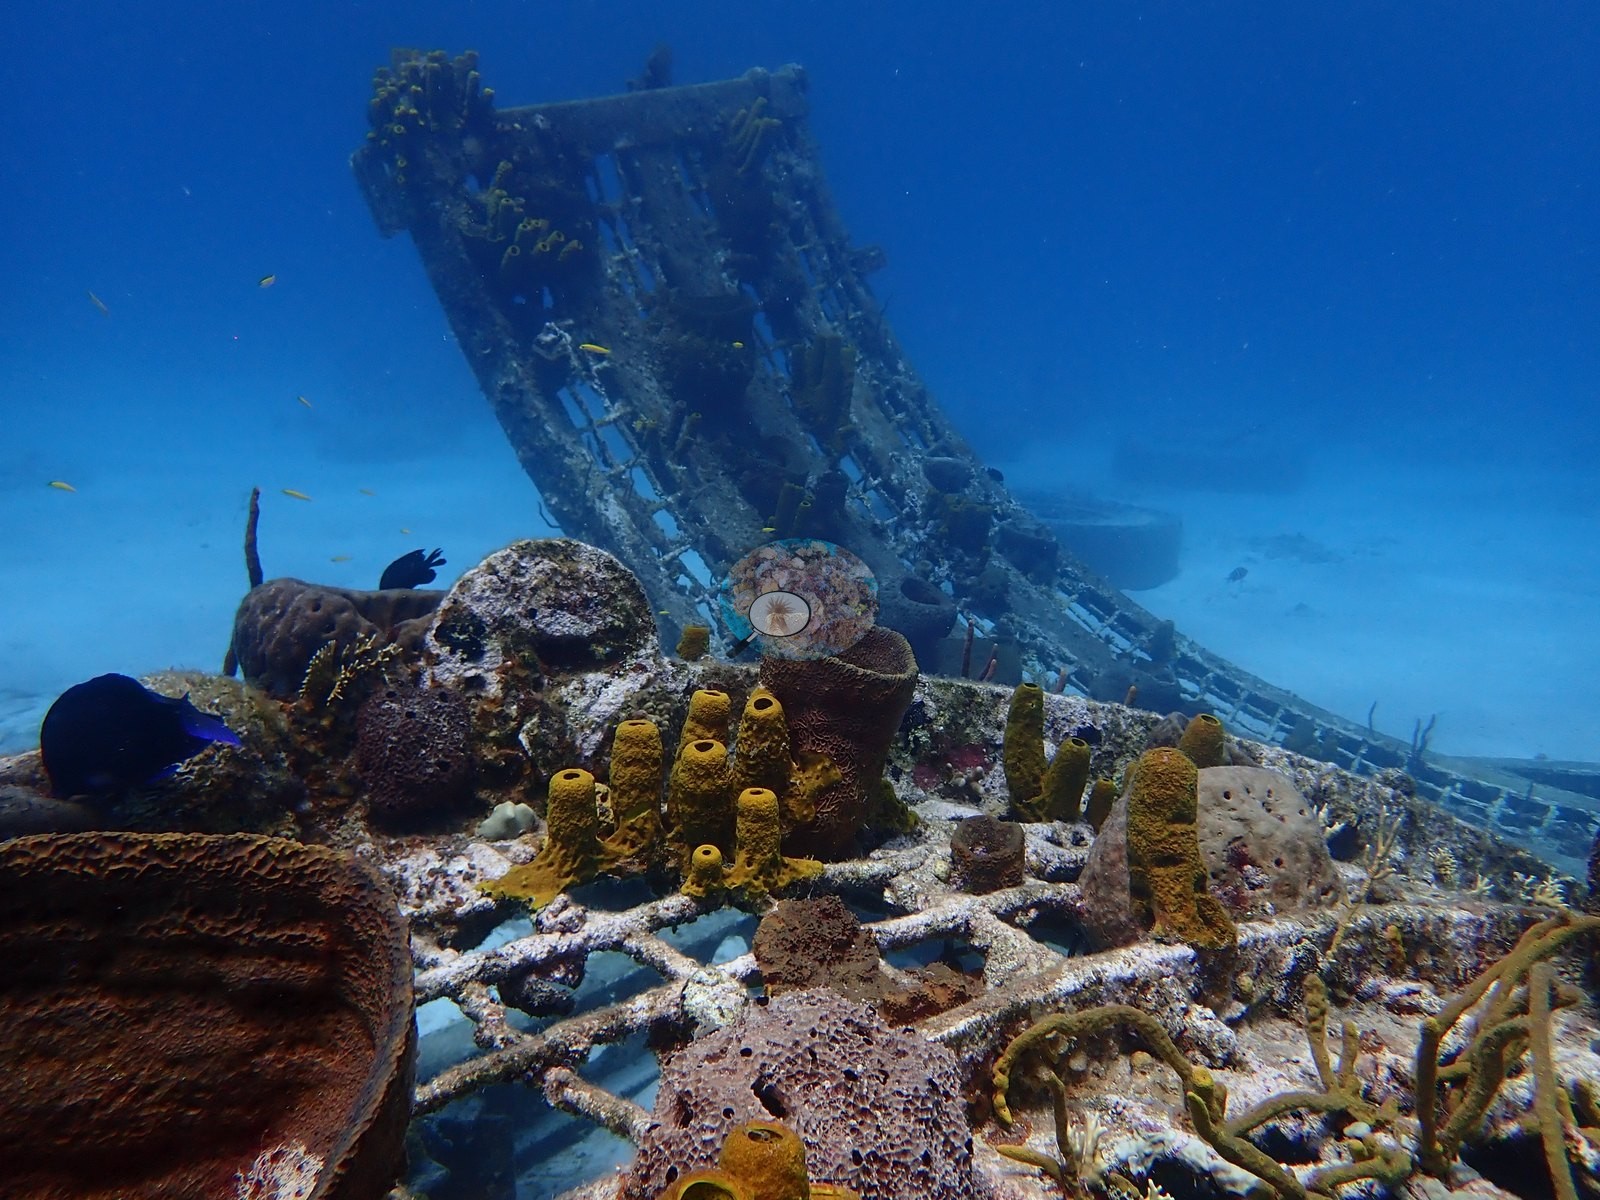
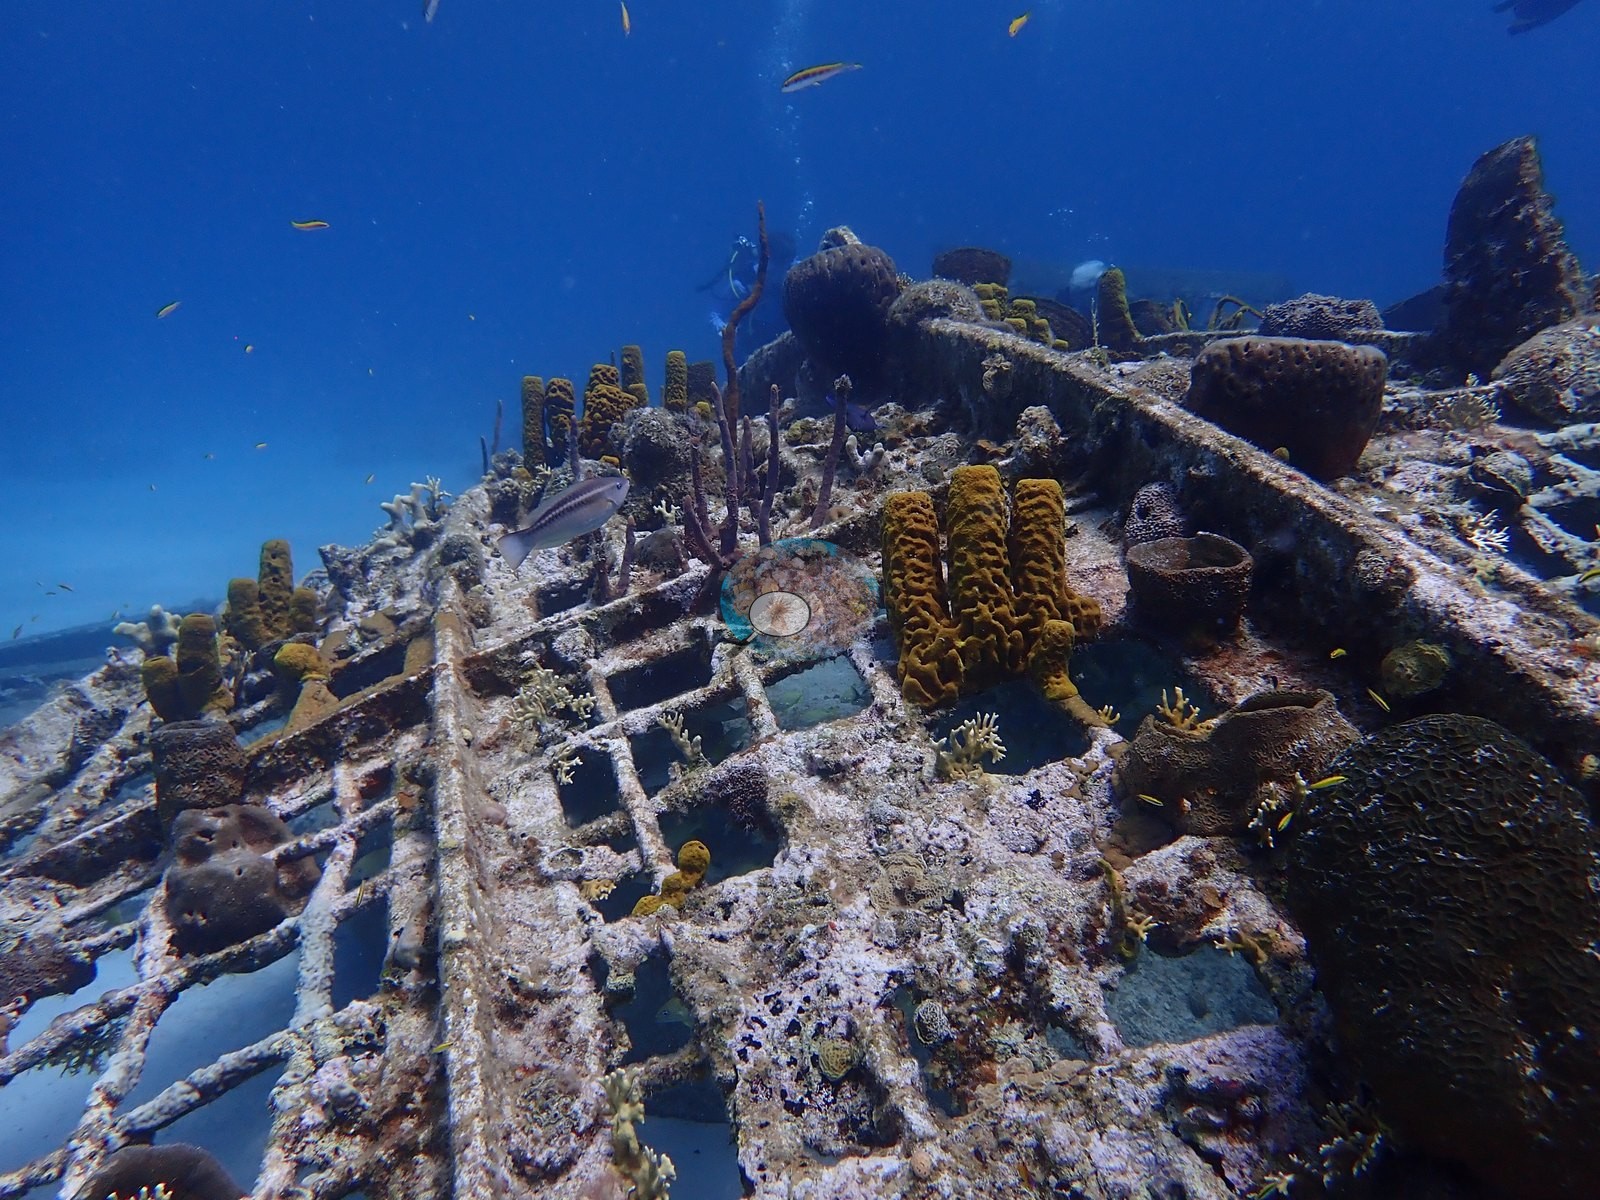
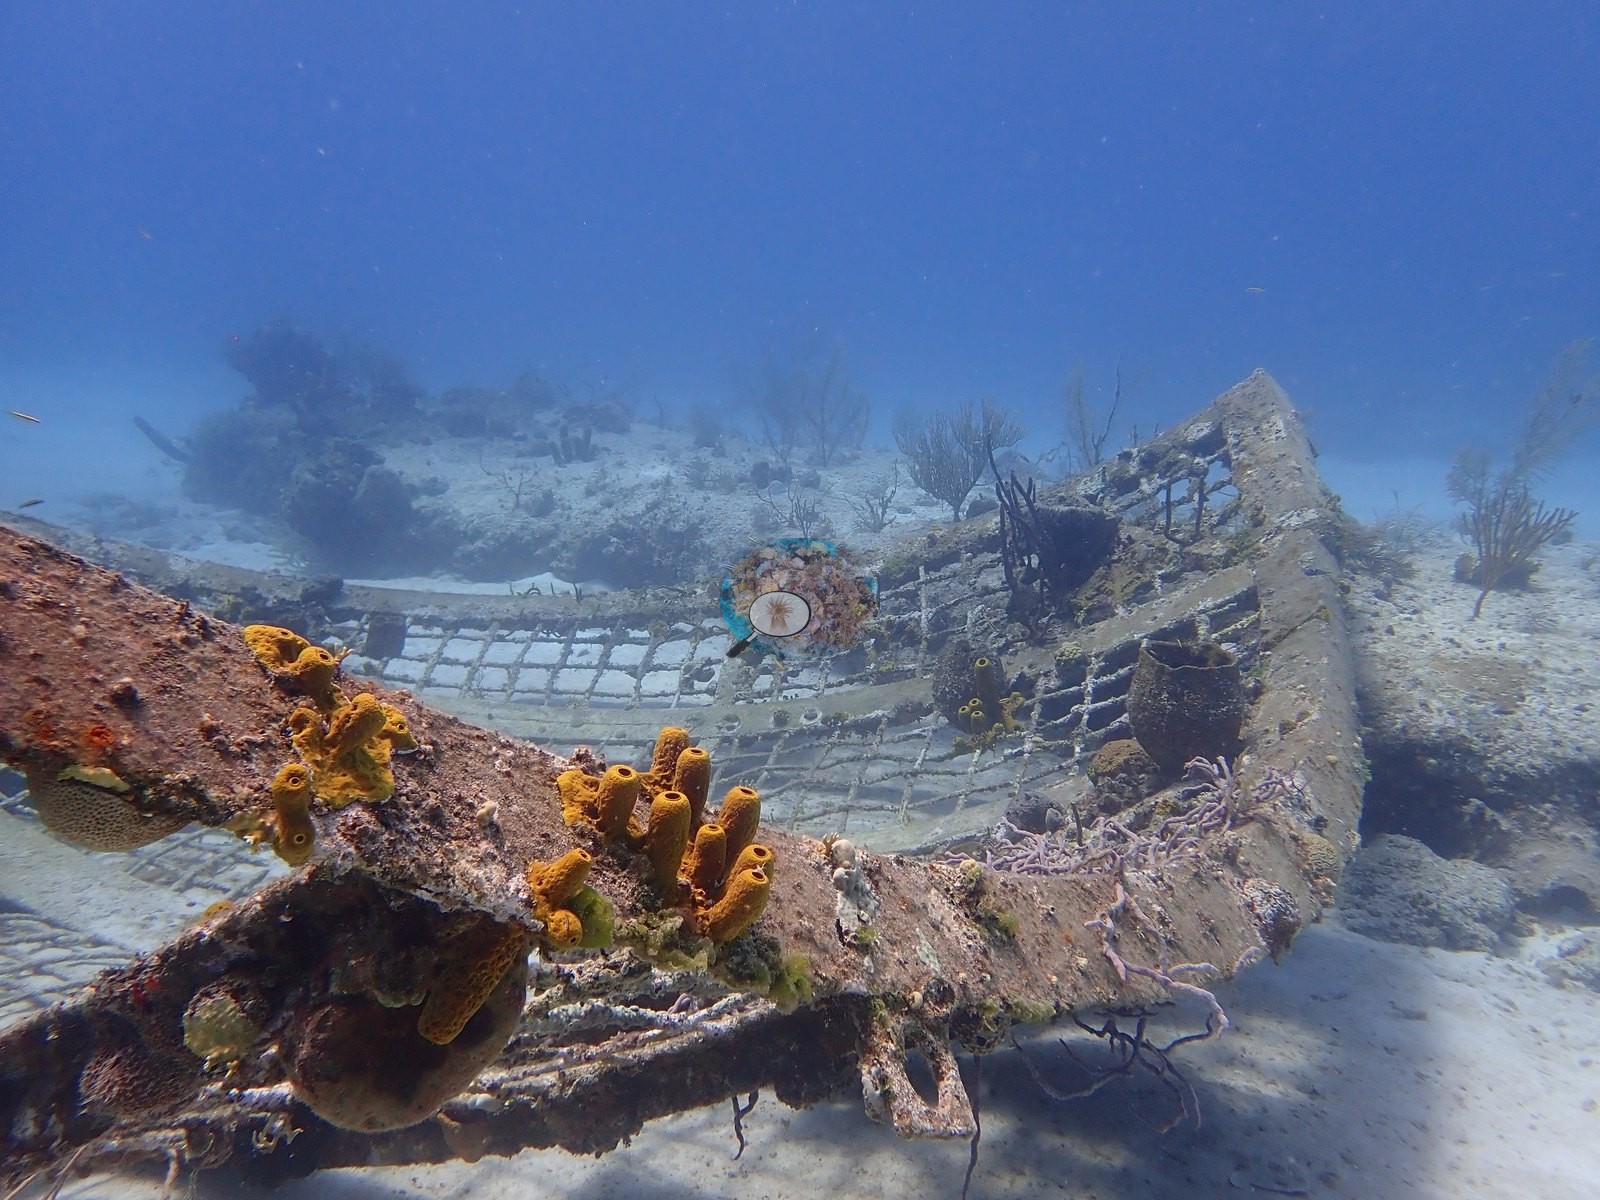
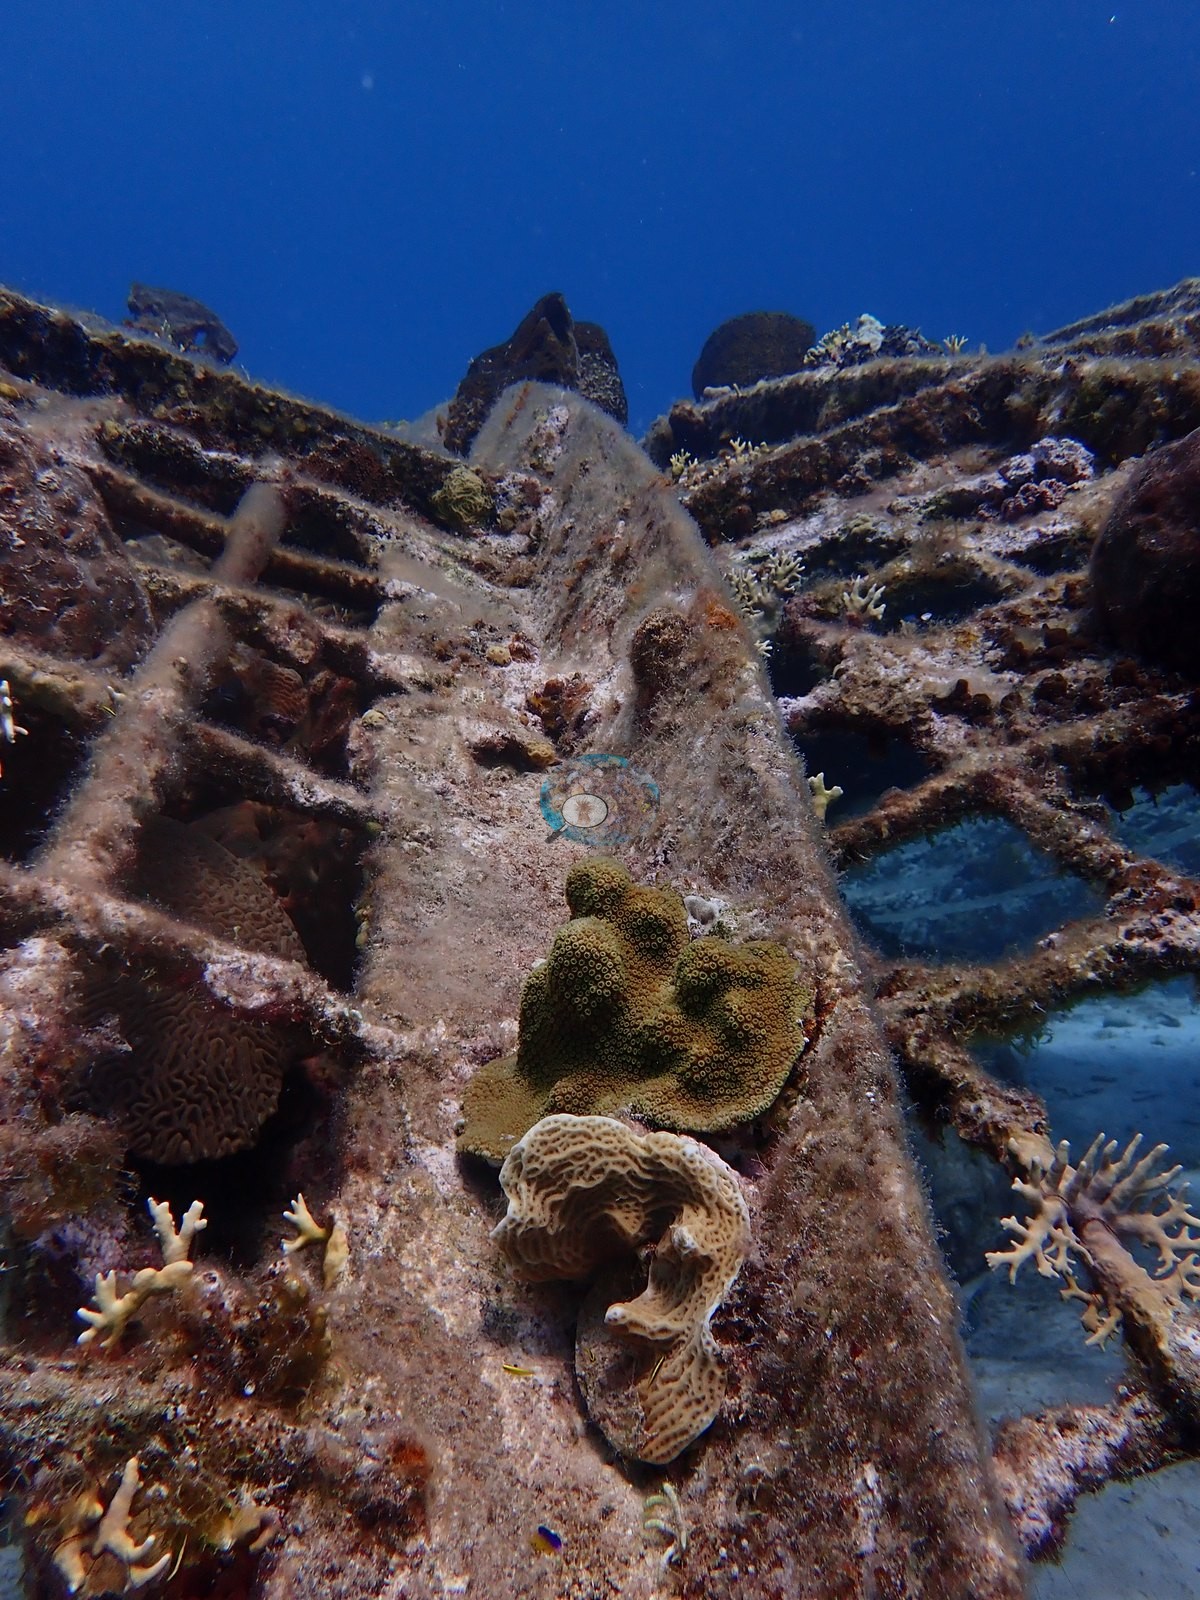
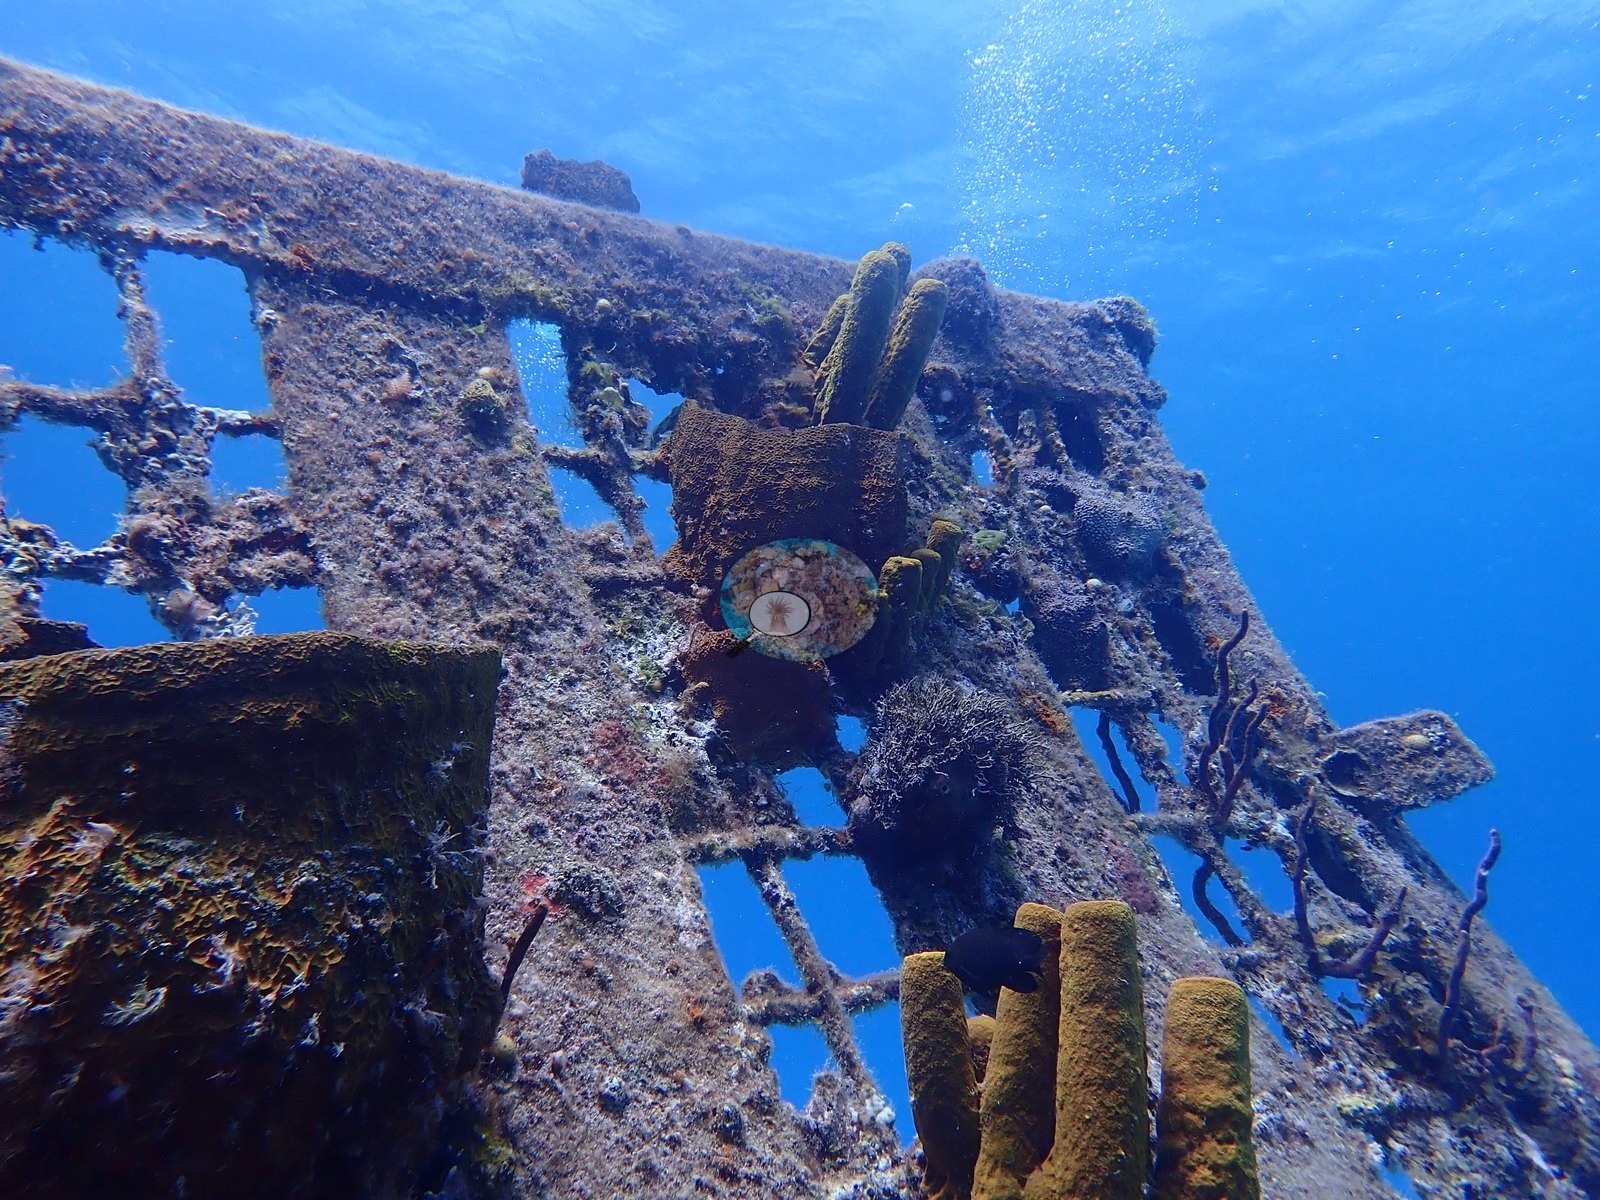
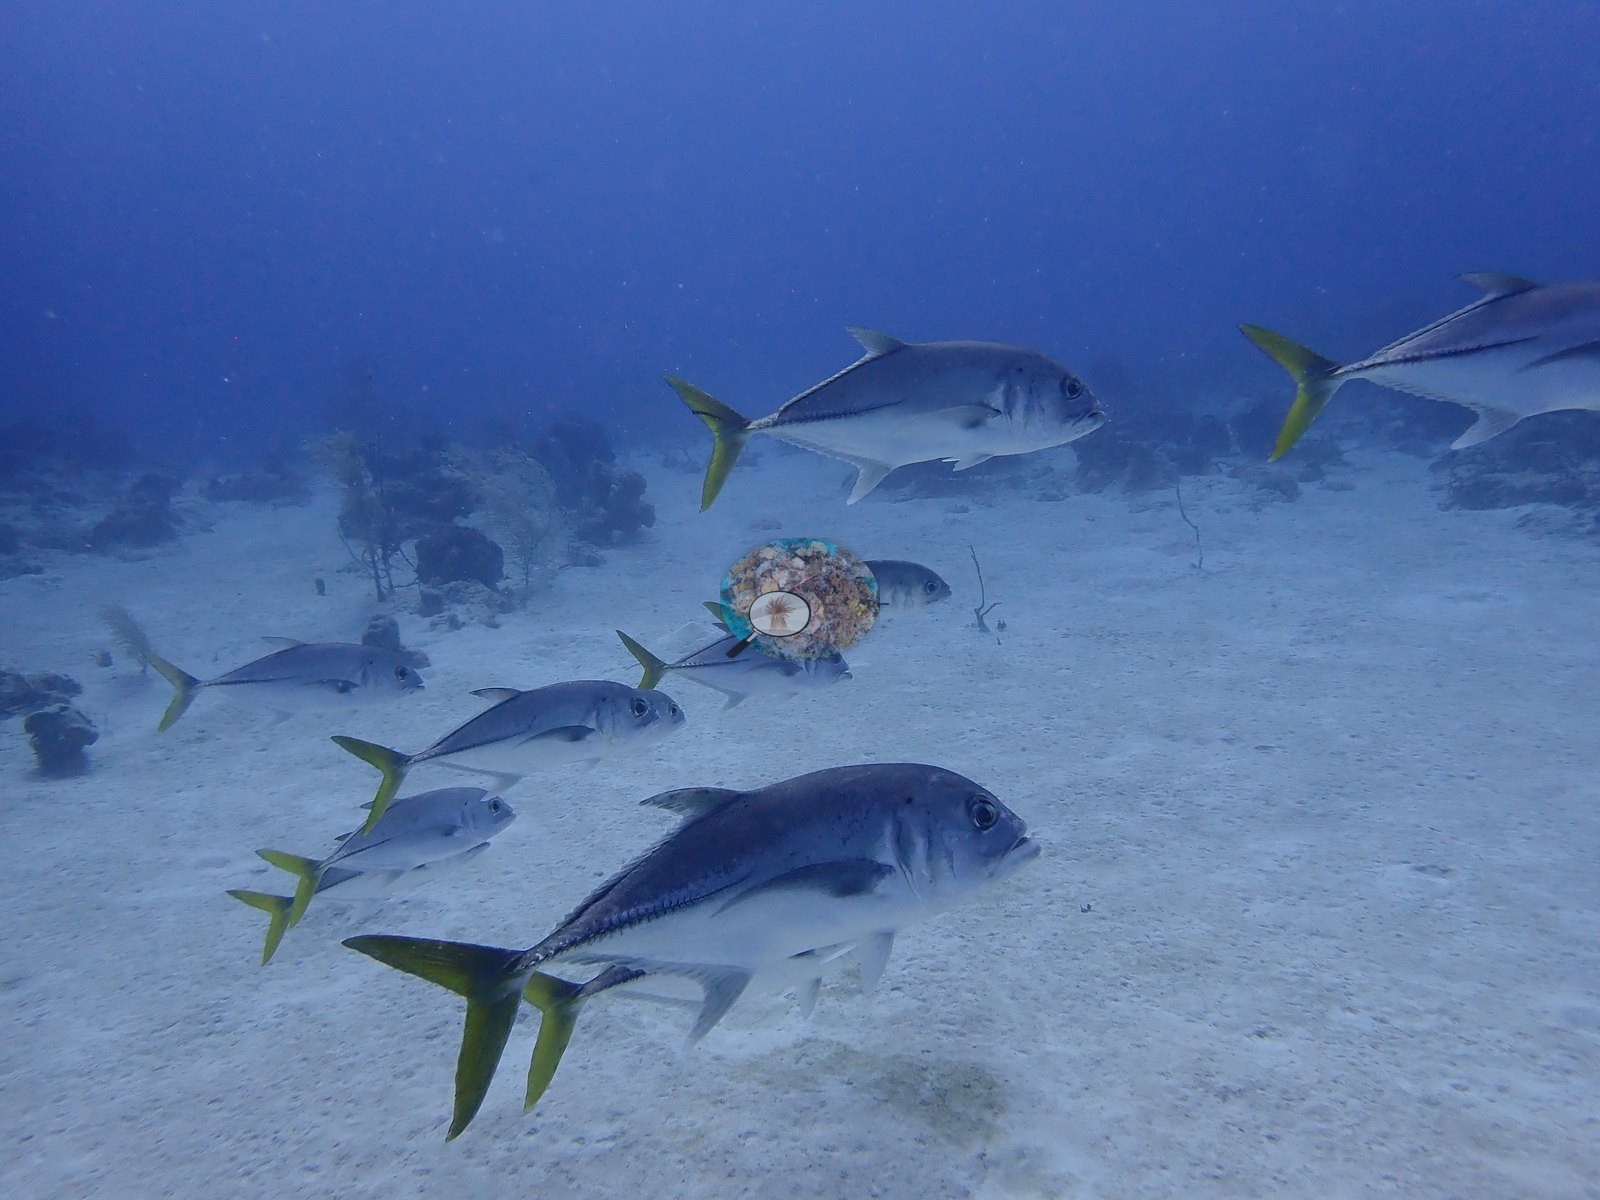
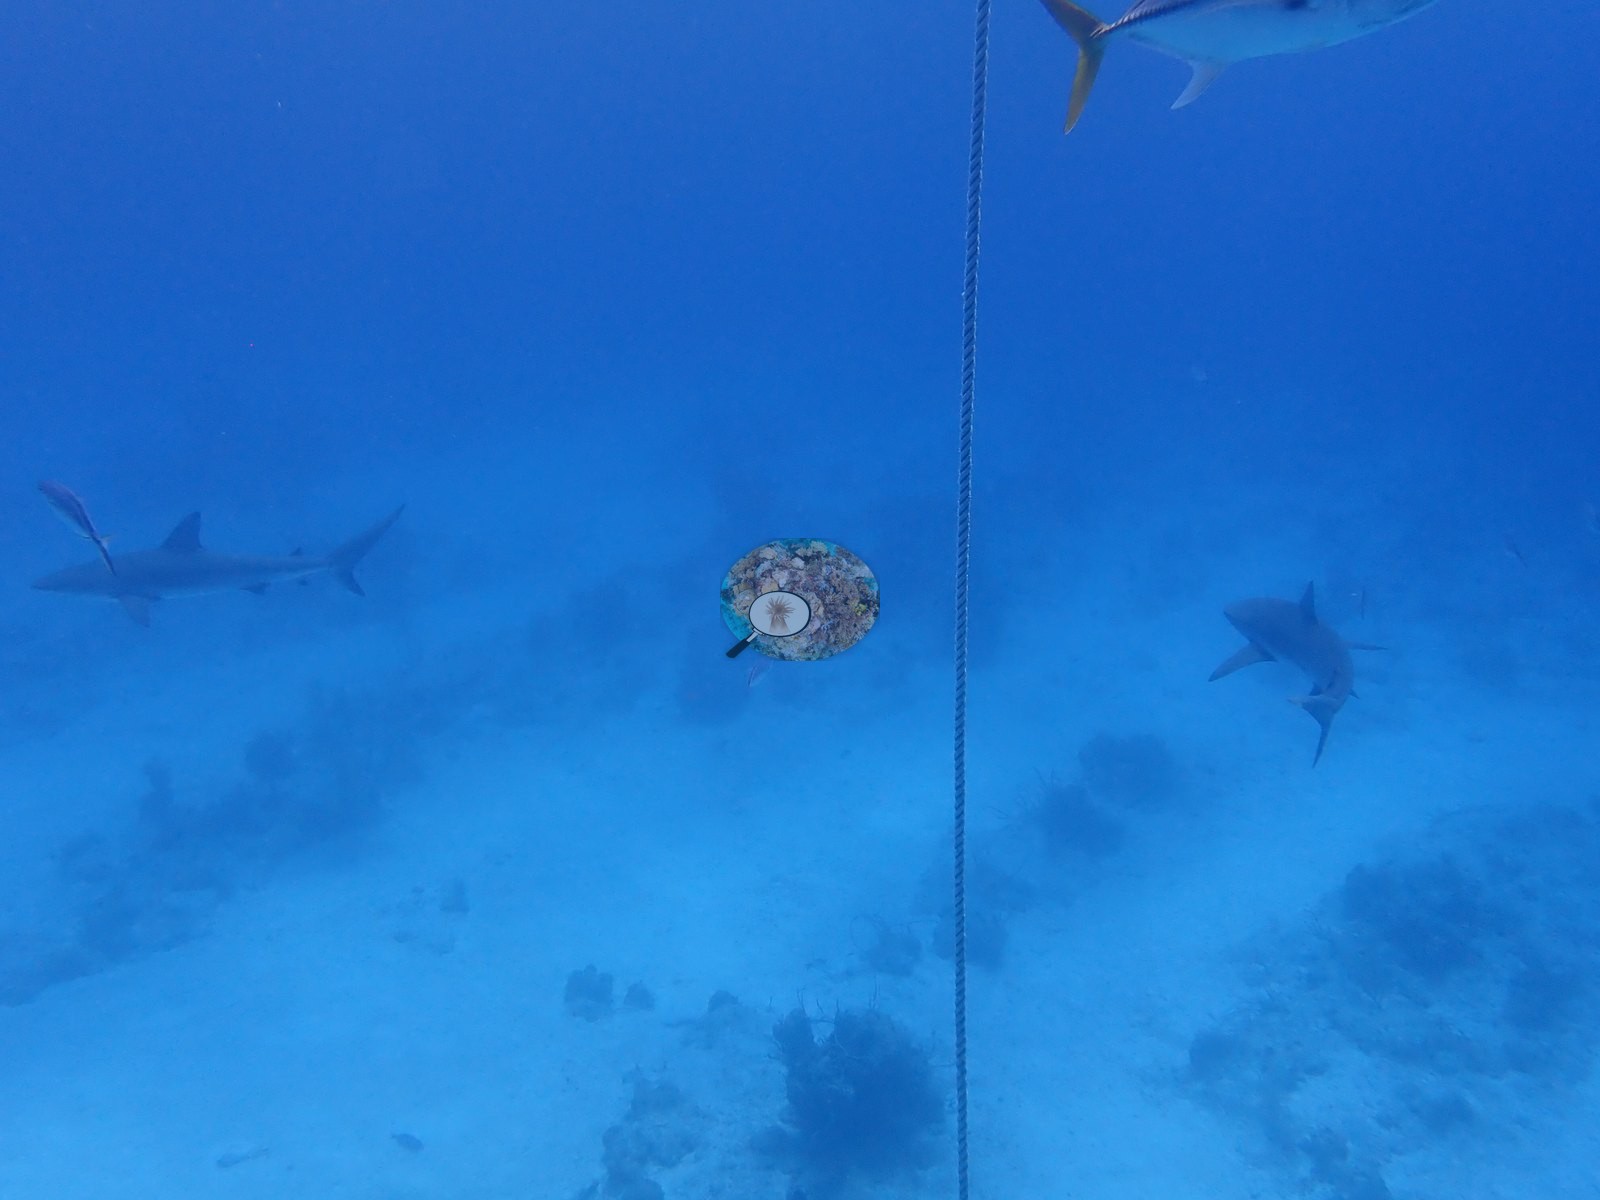
Turks and Caicos (NOAA CRW virtual station) · Bahamian ecoregion mean: 9.1 degree heating weeksThunderdome is the collapsed, rusting metal dome of a 1980s French TV game show set, sitting on sand in about 12 m off Providenciales and now crusted with sponges and golden sun corals. Horse-eye jacks and Caribbean reef sharks circle it, making it a favorite freediving and night-dive site; one finger coral nearby had a single fully bleached branch.
Five independent survey stations shown with the program’s logo — click one to see how far it is from this site.
Four other CRD dive sites within 5 km shown in orange — click a marker to open its page.
This page shows 50 of the 54 photographs from this site, including every one the text cites.
17 of the 50 photographs on this page are shown beside the text that discusses them under "Site description" below.
Site description
Setting
Thunderdome (Providenciales (Northwest Point / Columbus Landfall Marine Park)), Turks & Caicos — dived from the Turks & Caicos Explorer II liveaboard (2022-08-01 (dives 8-10, incl. night dive)).
General benthic features
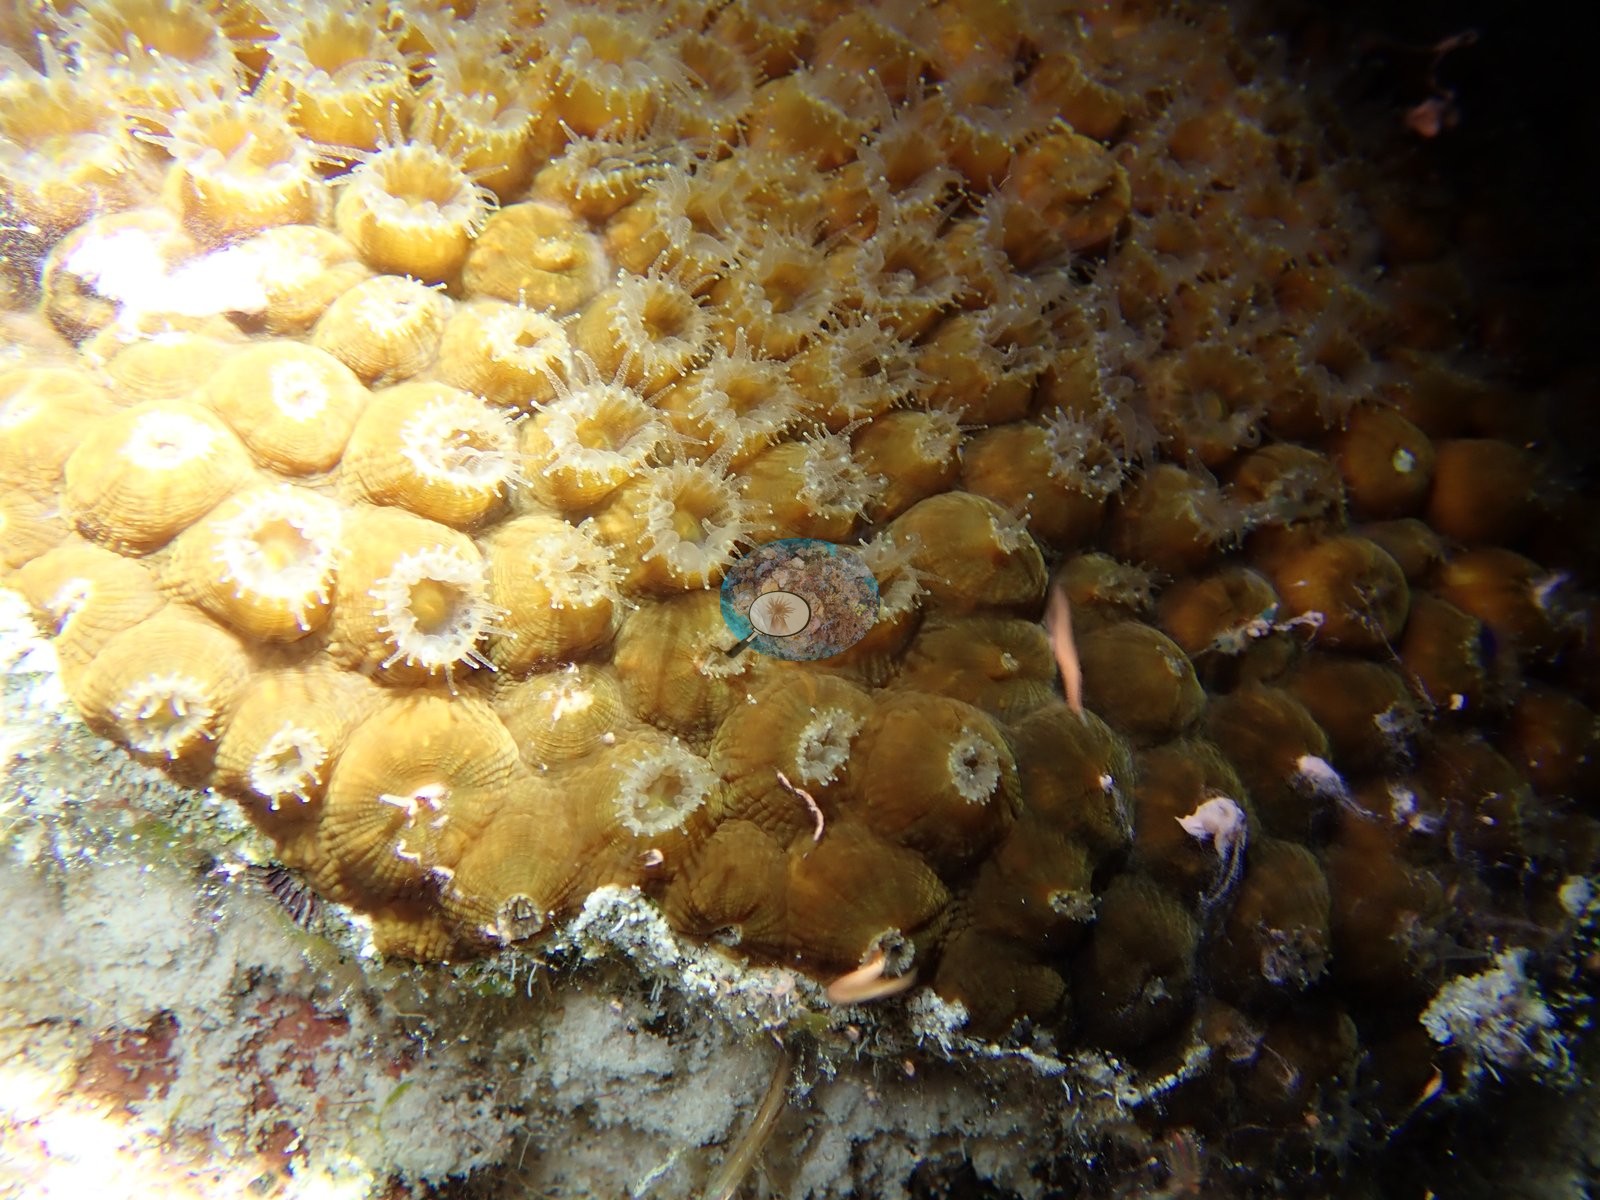
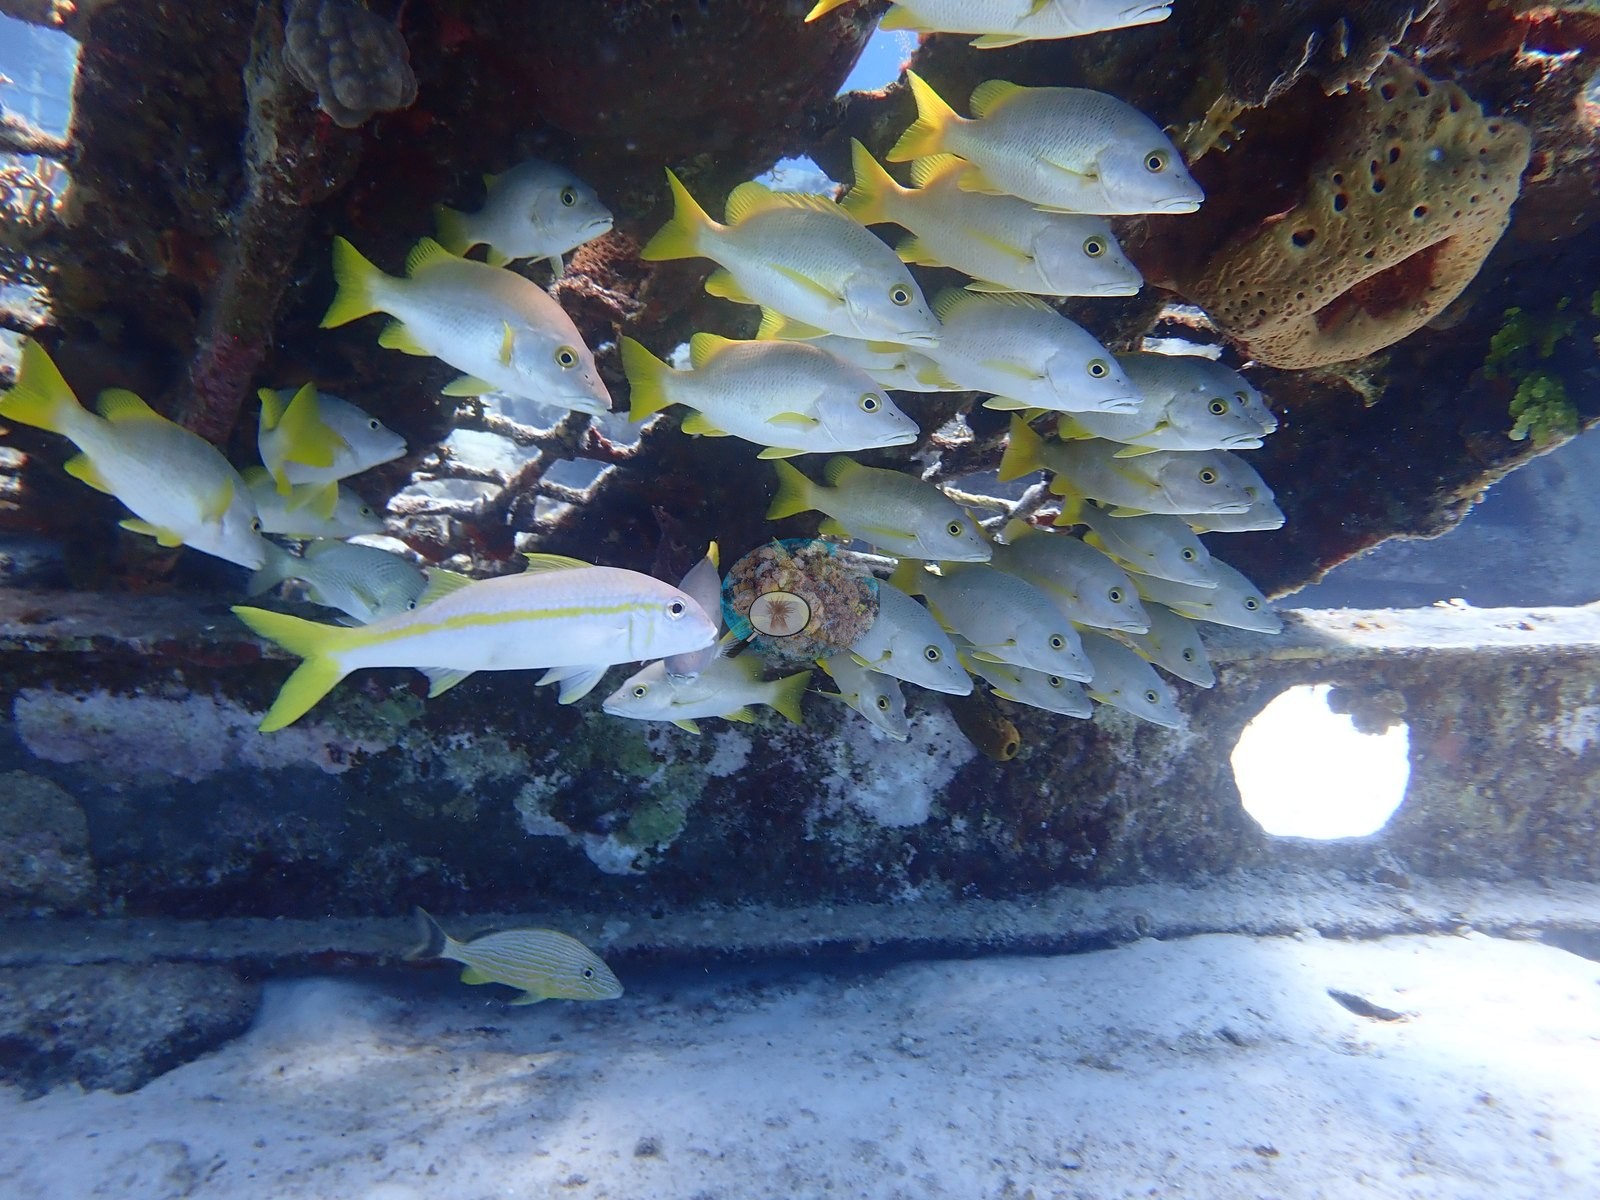
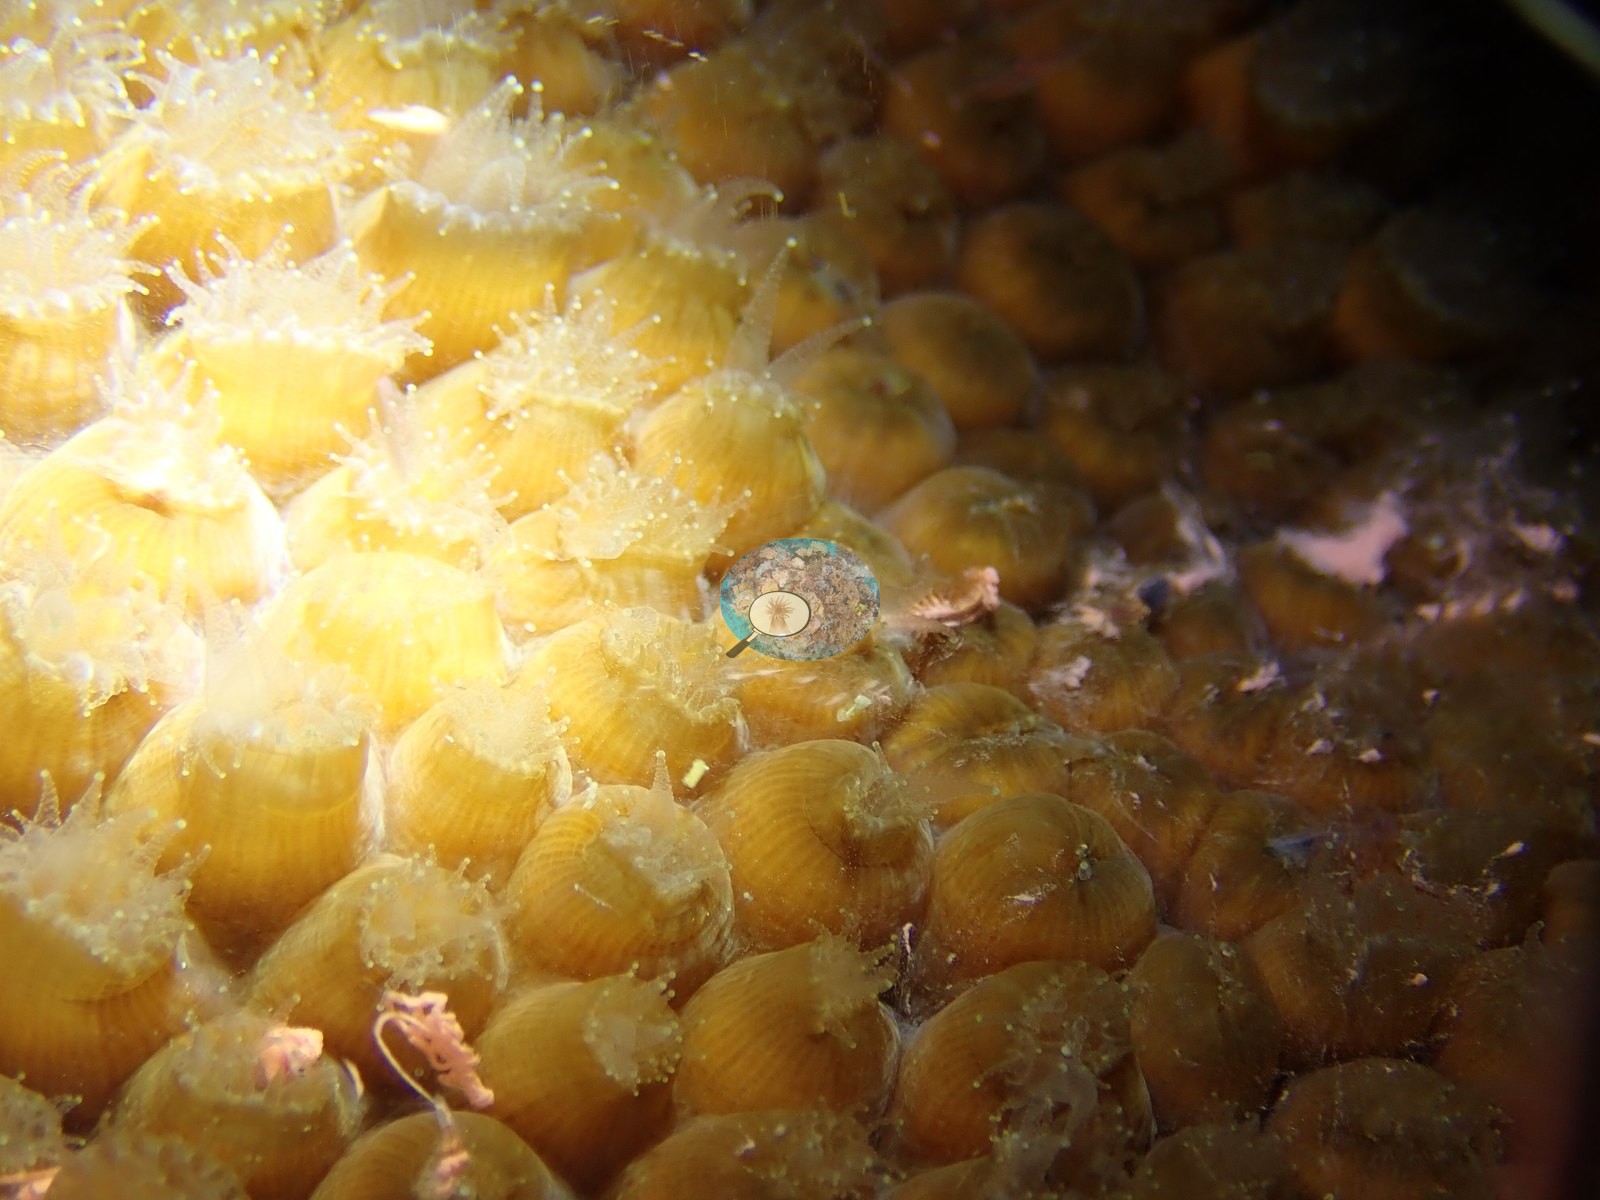
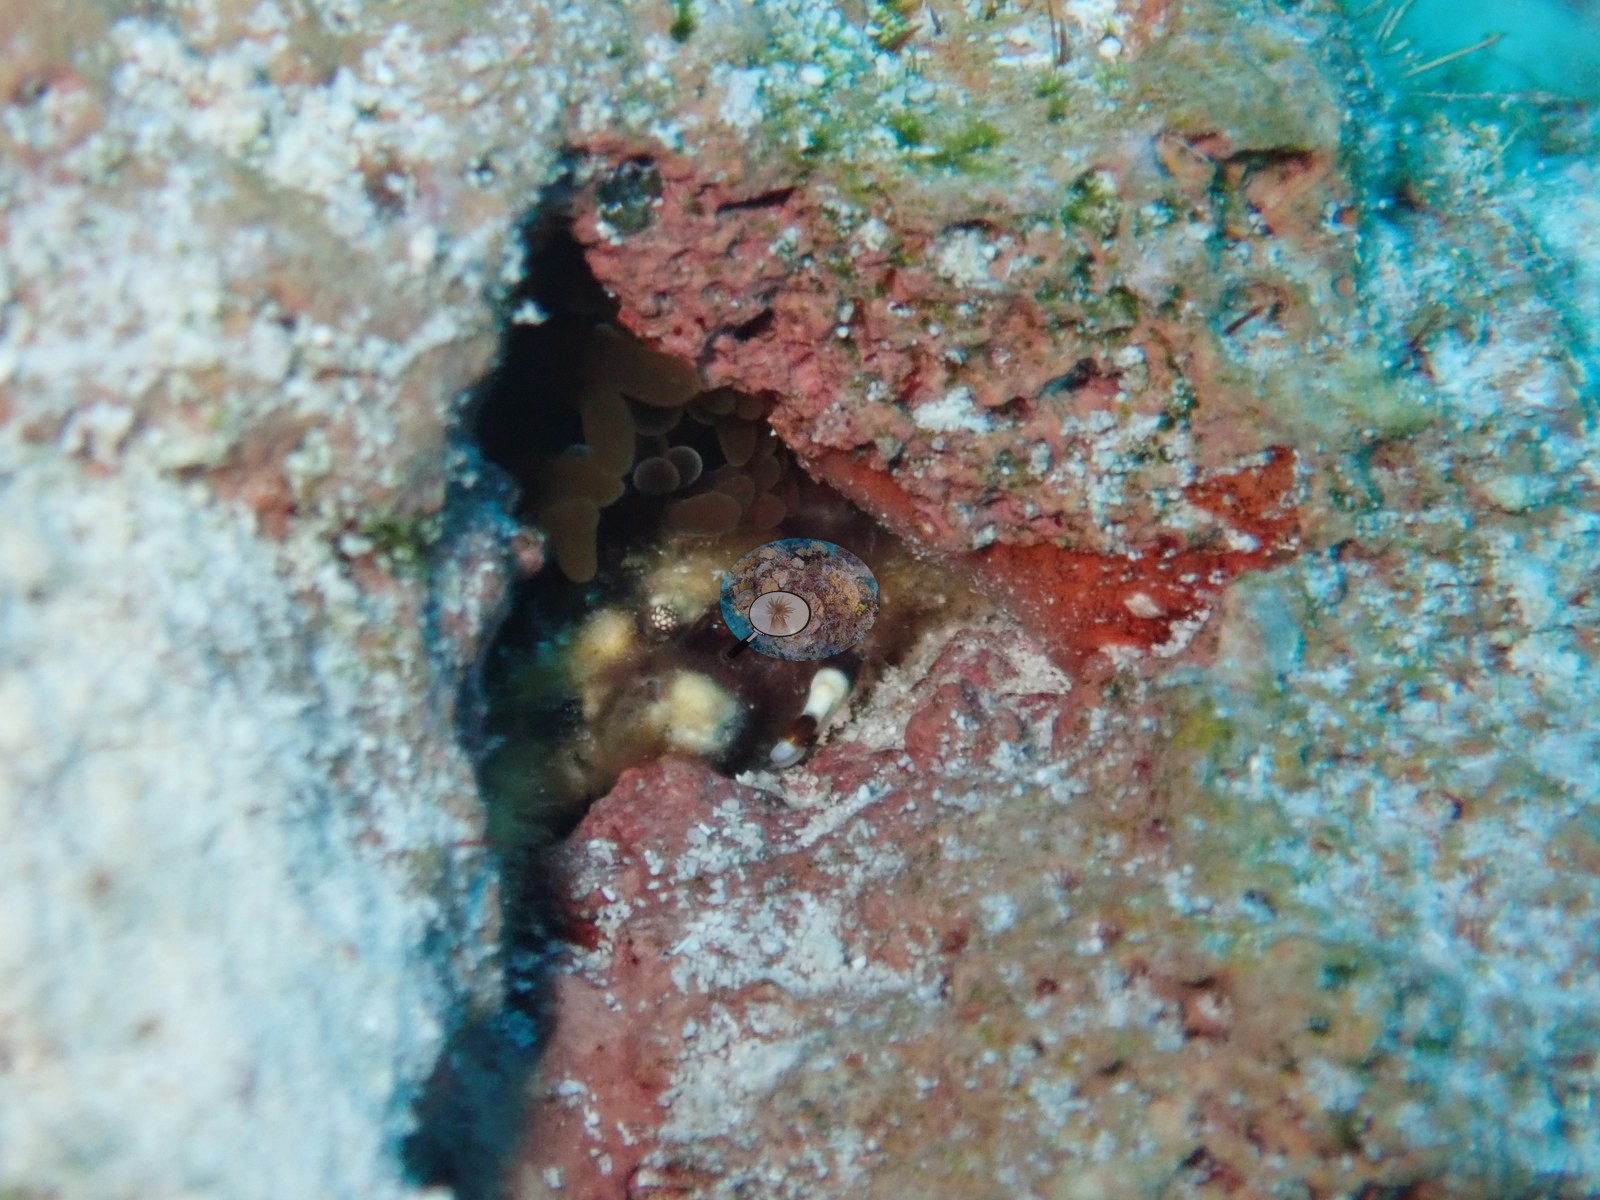
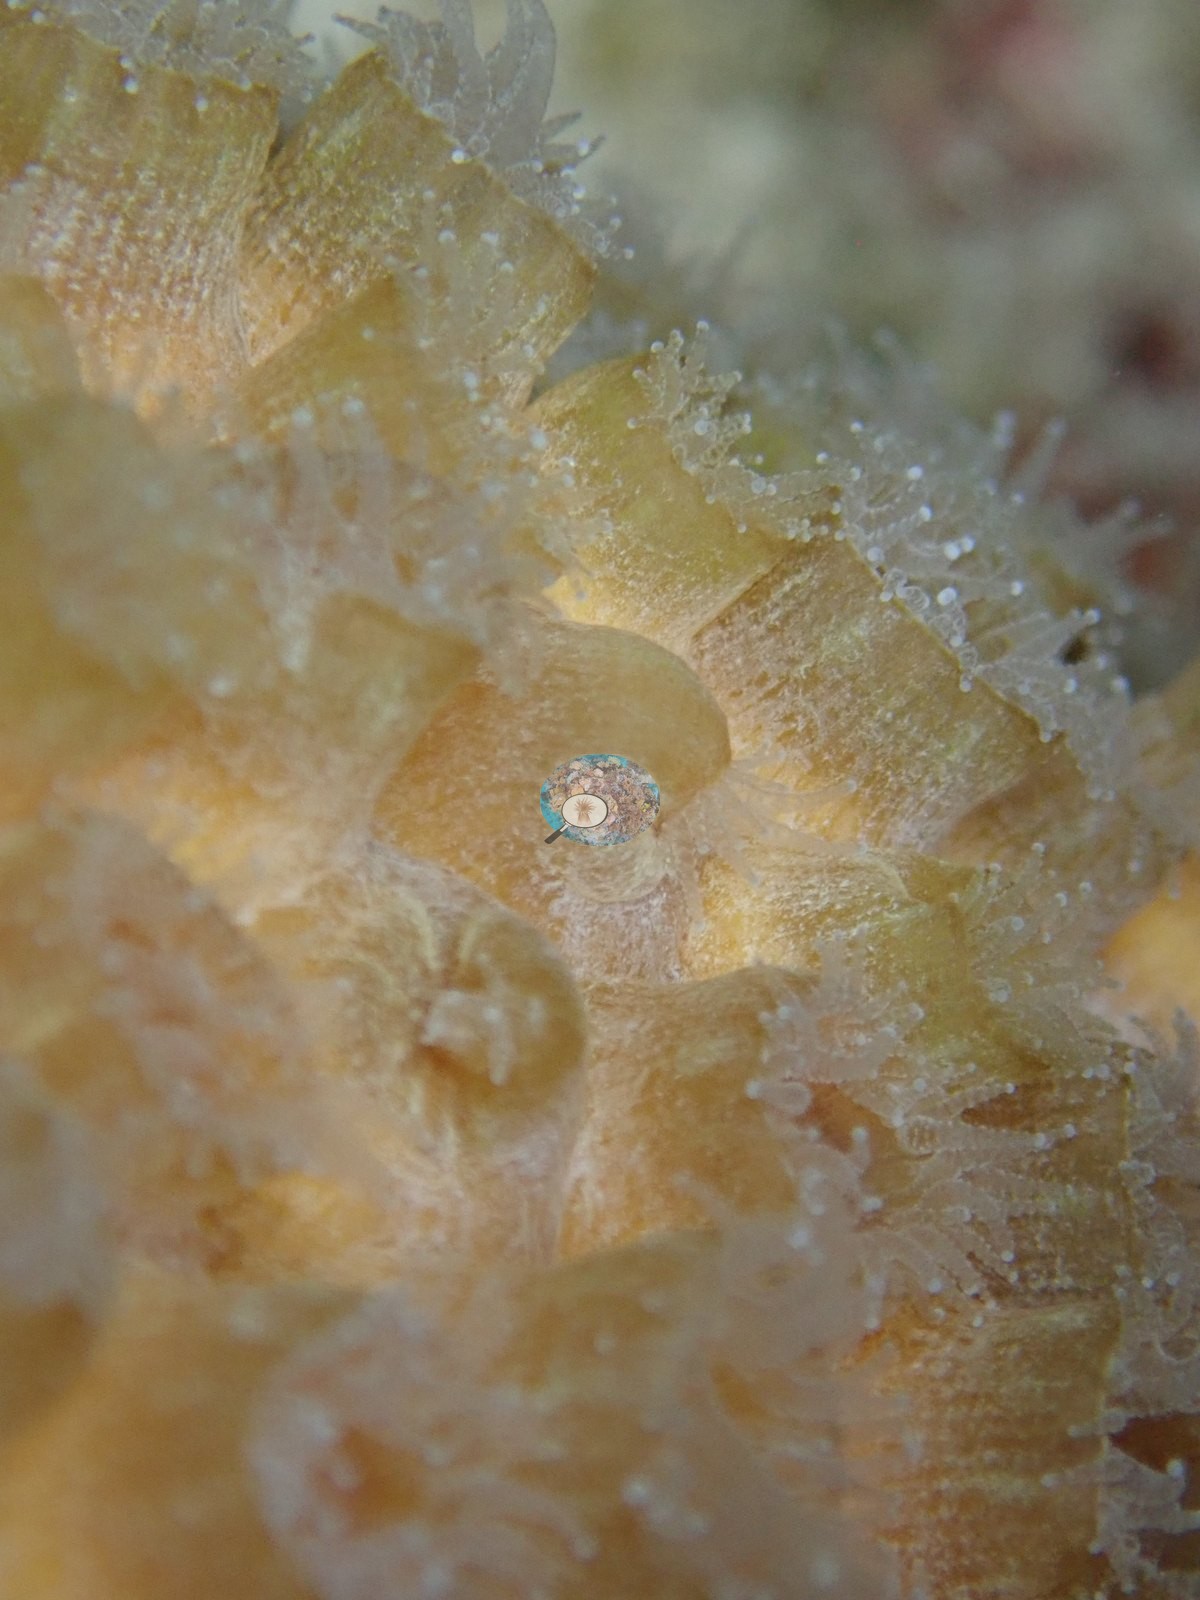
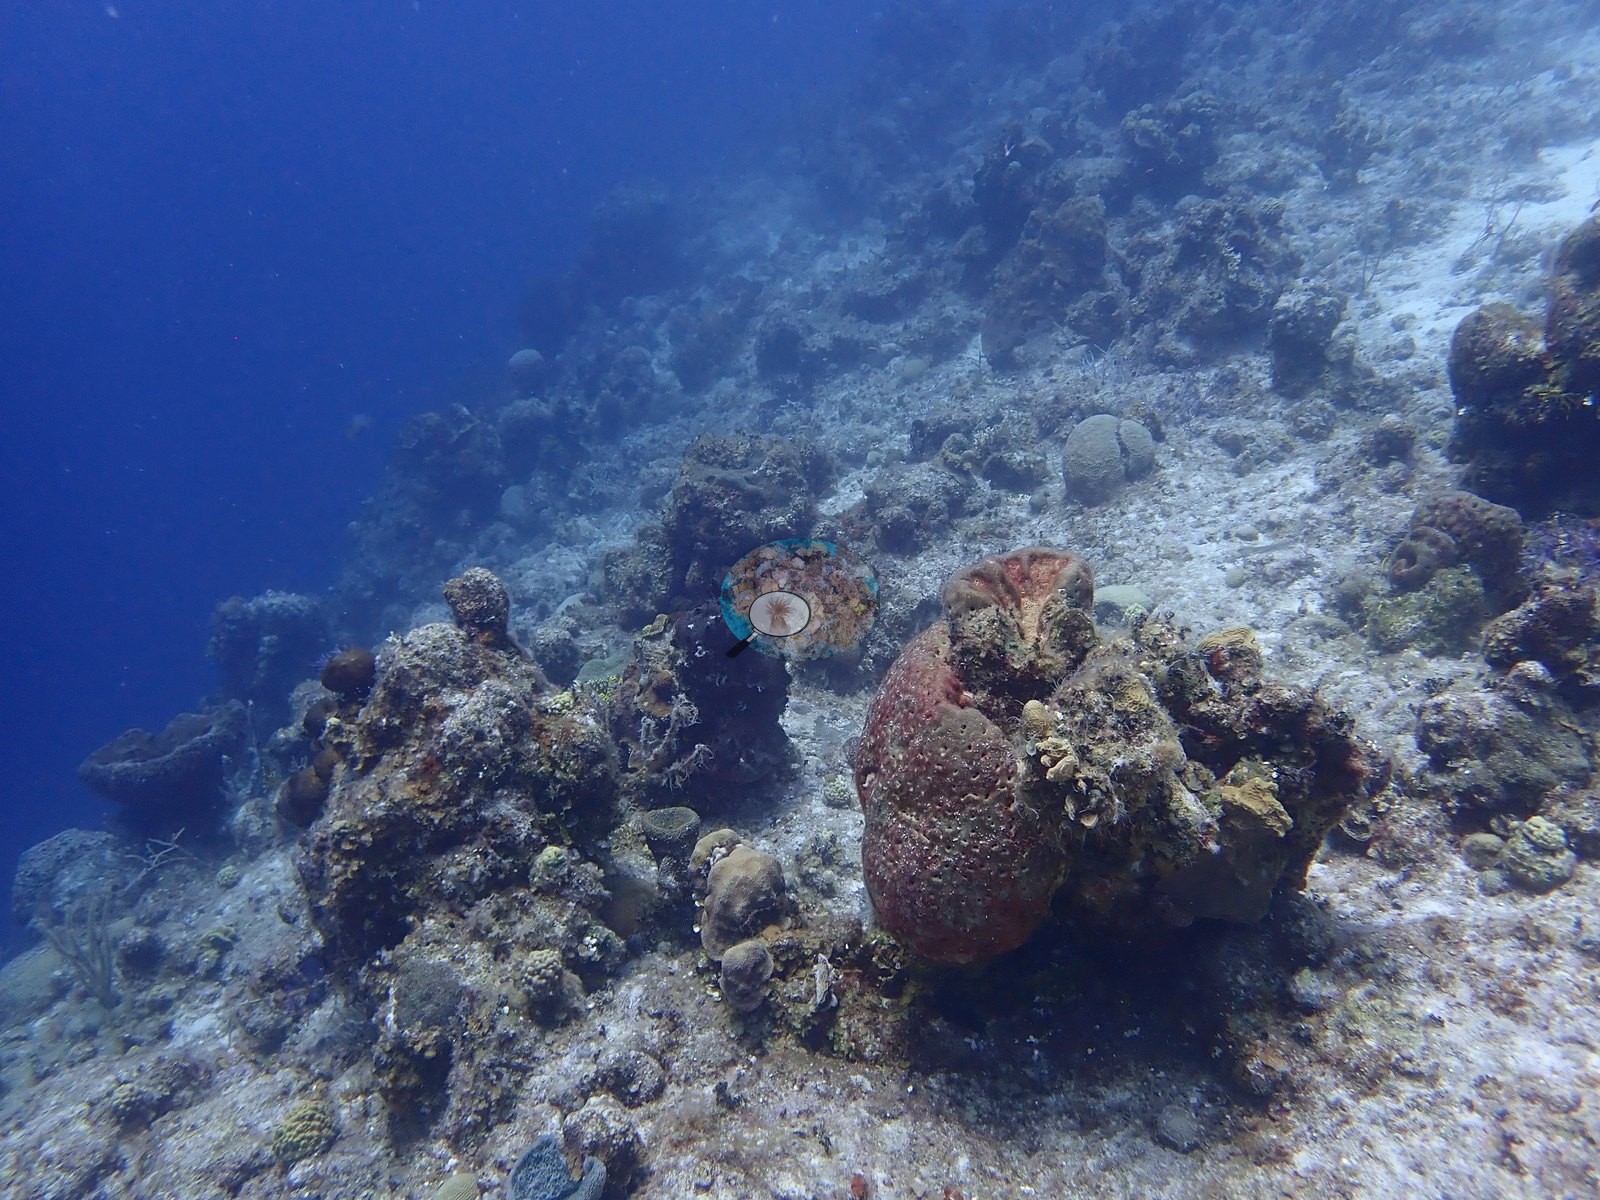
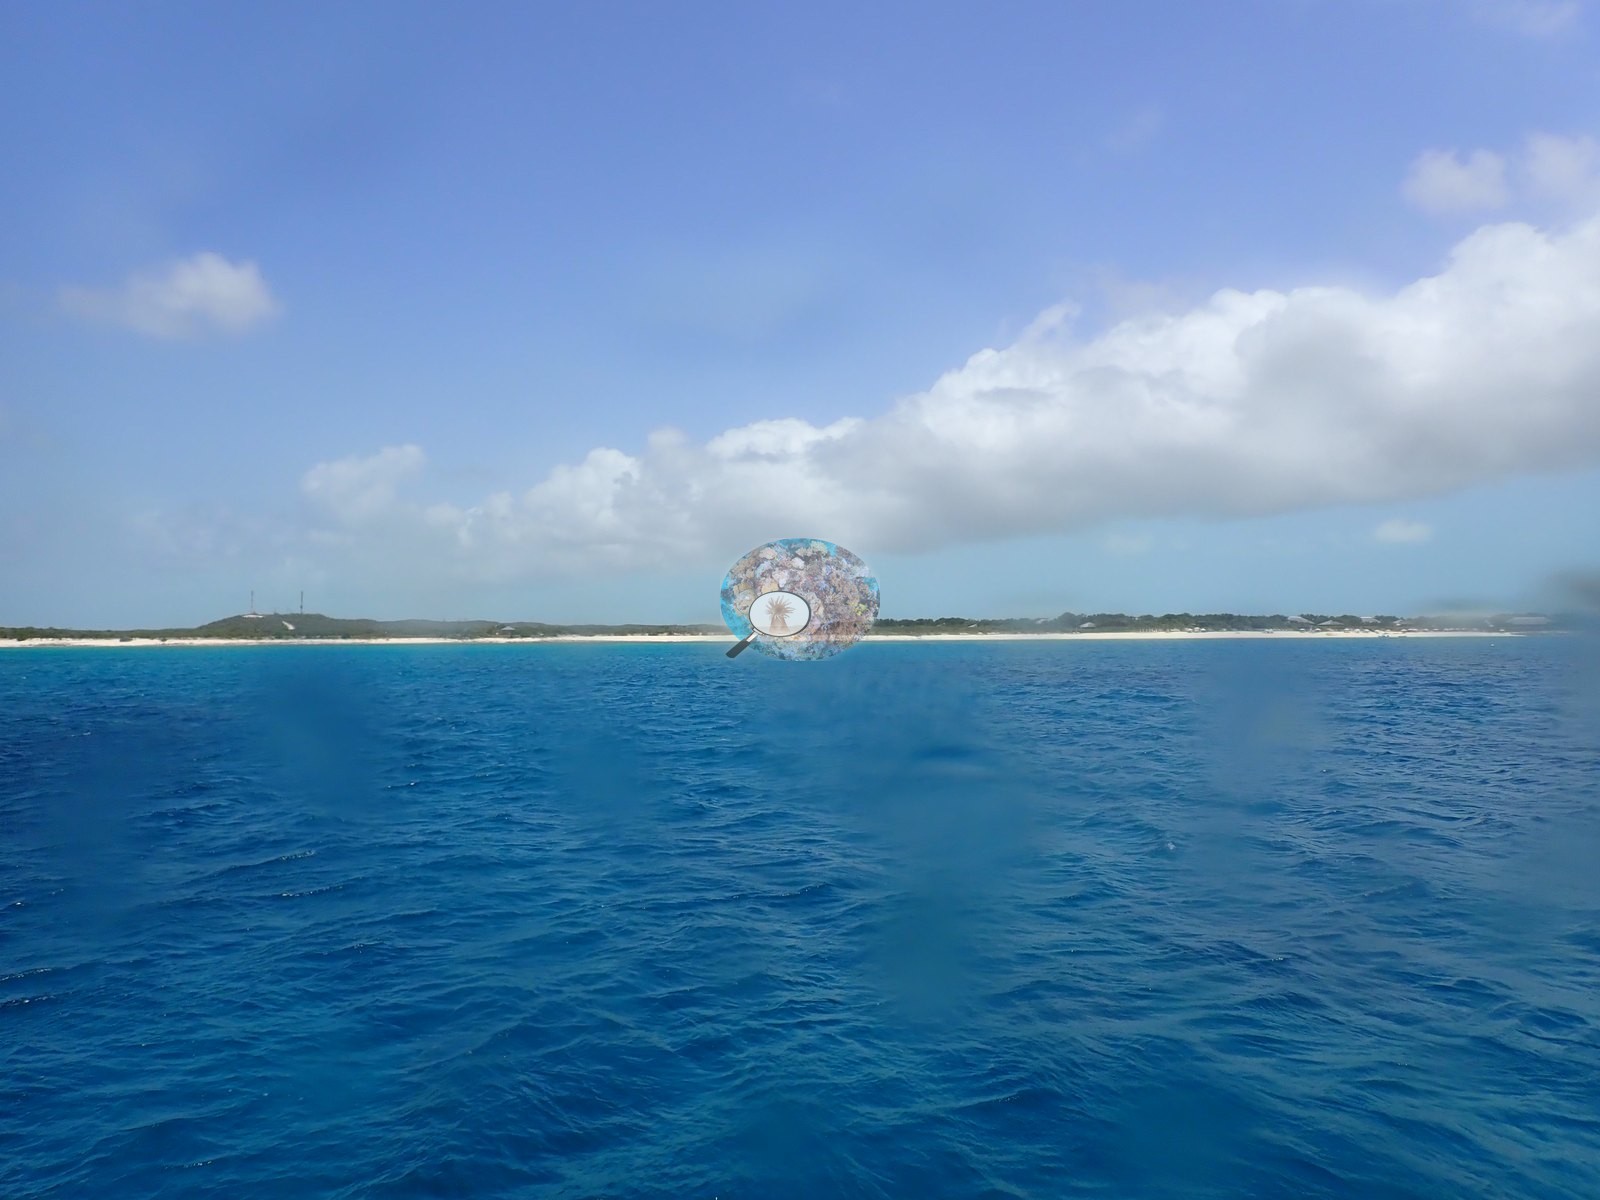
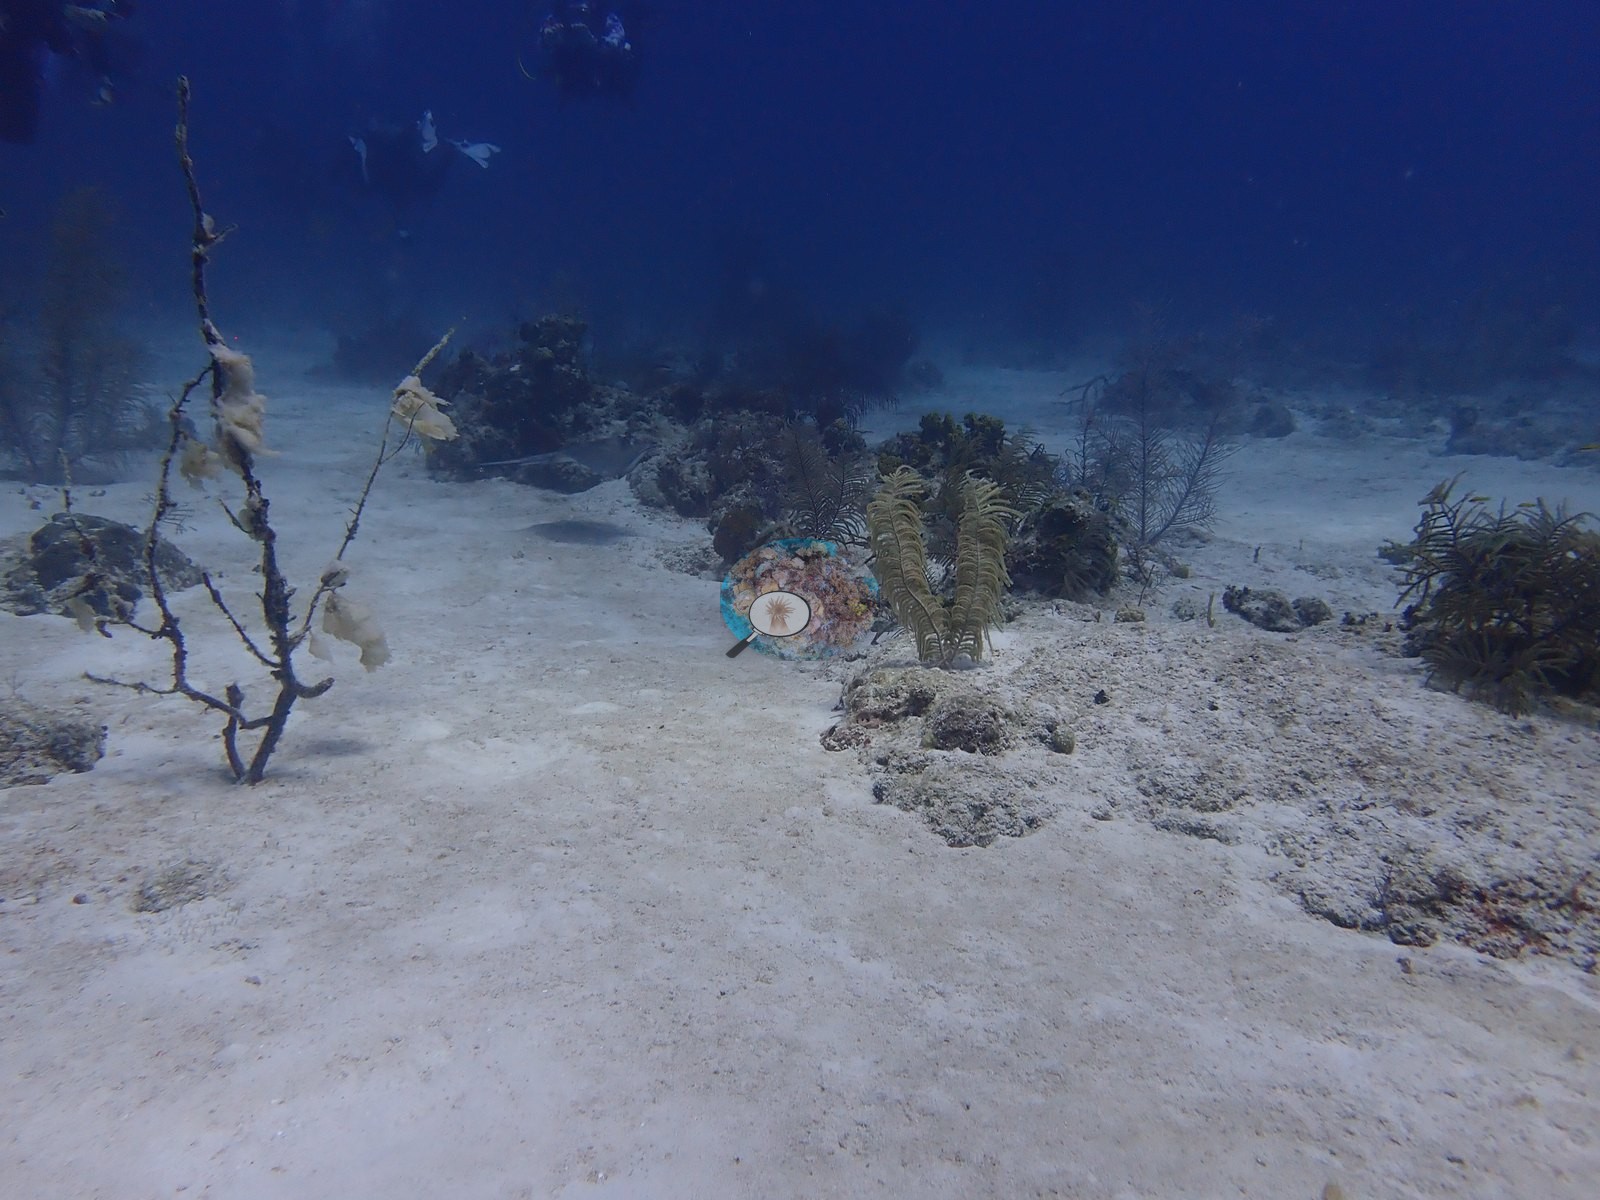
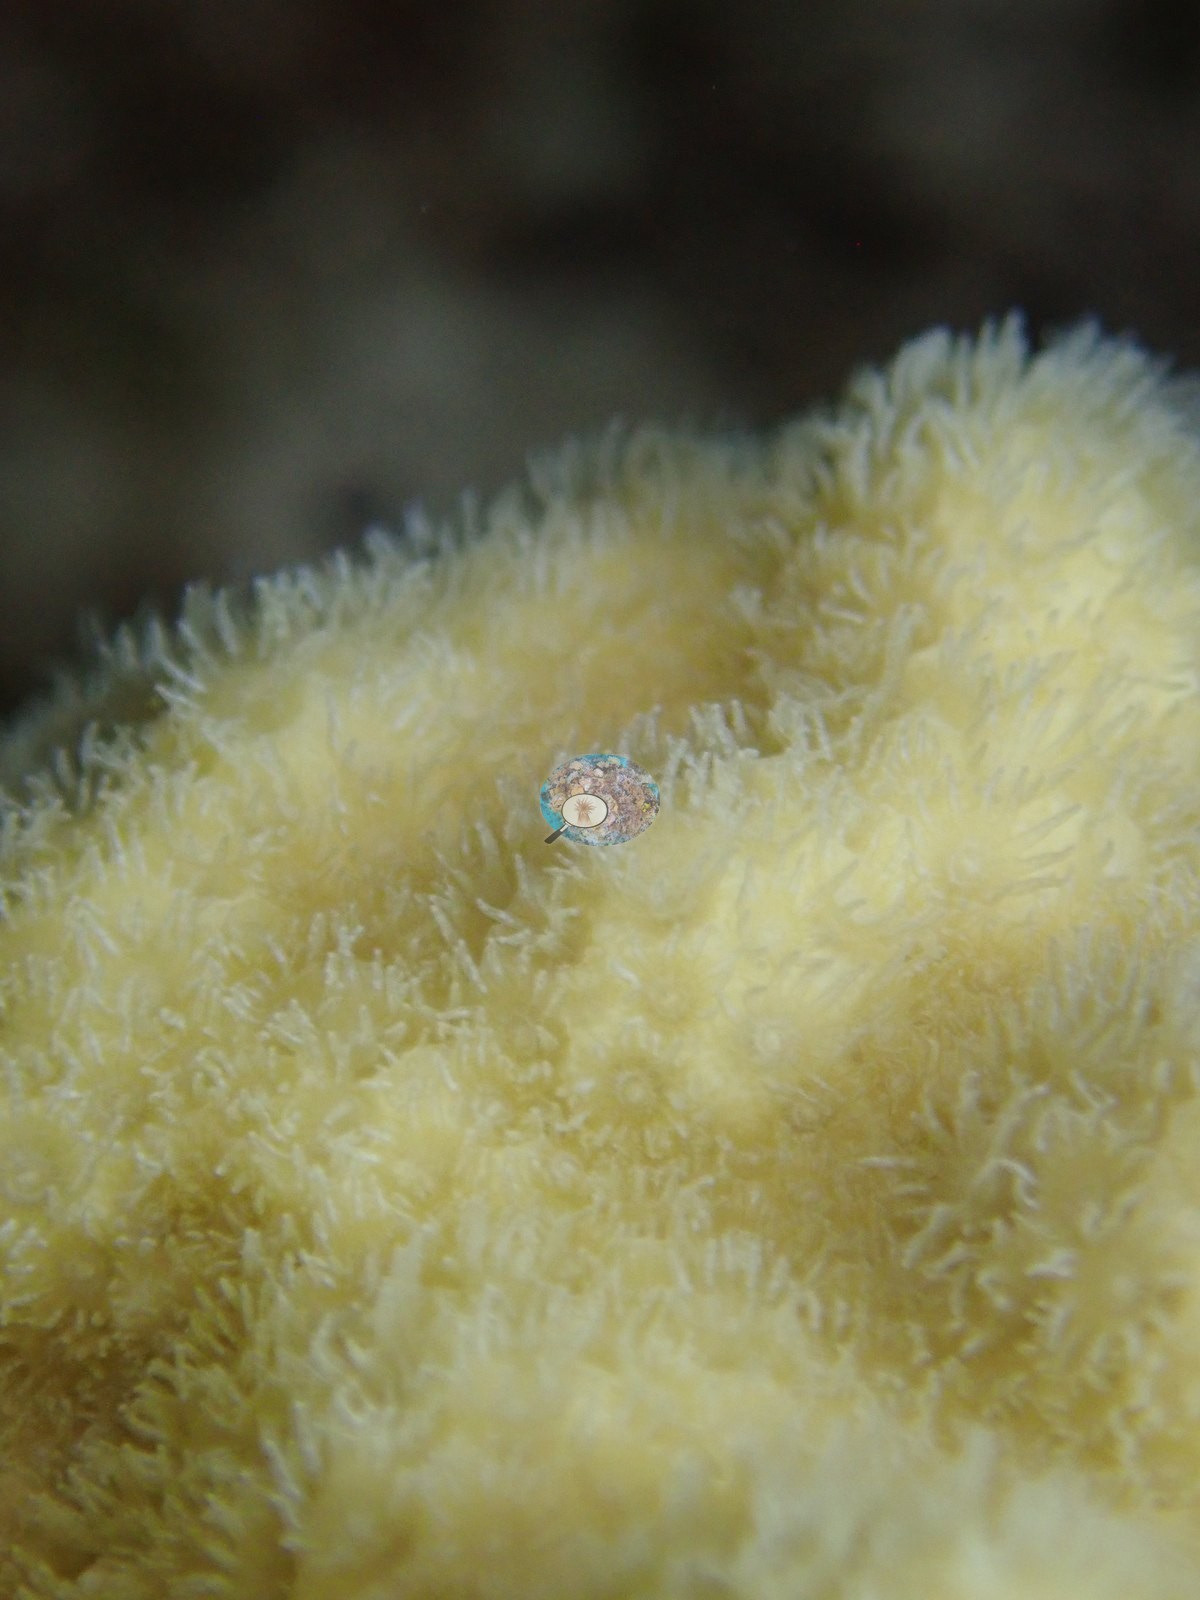
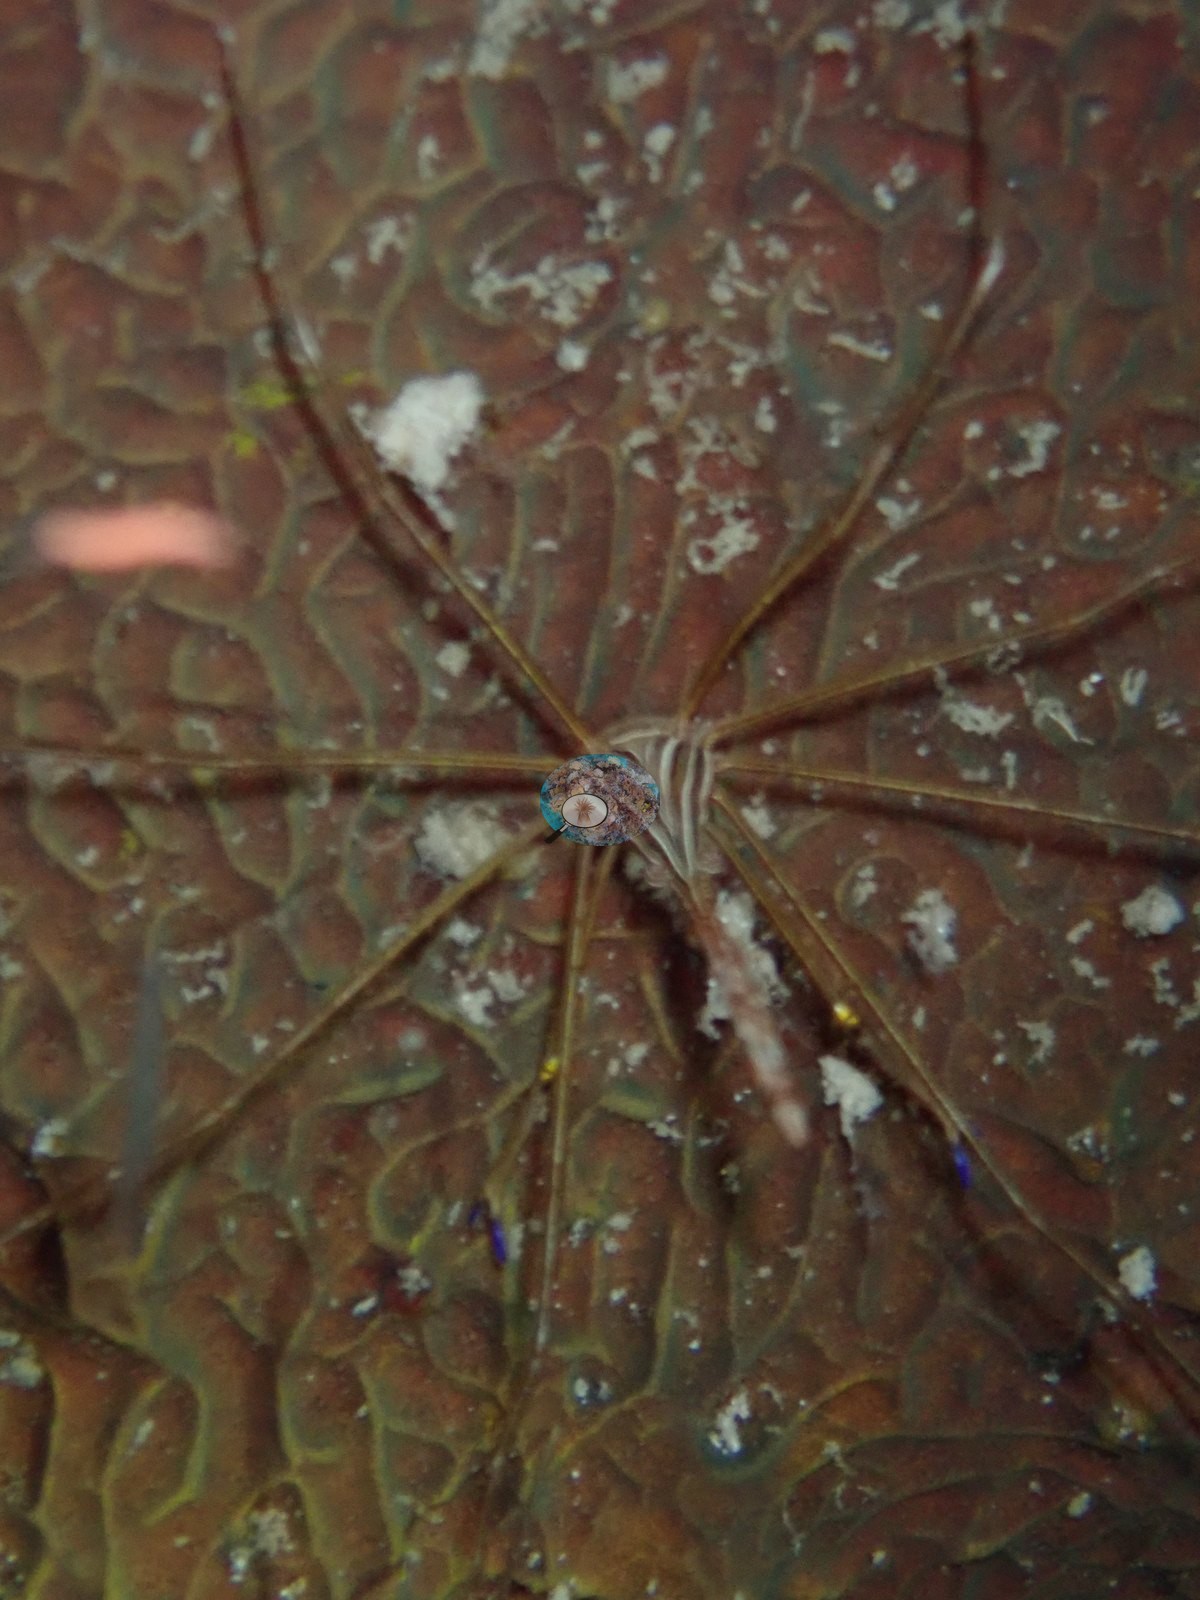
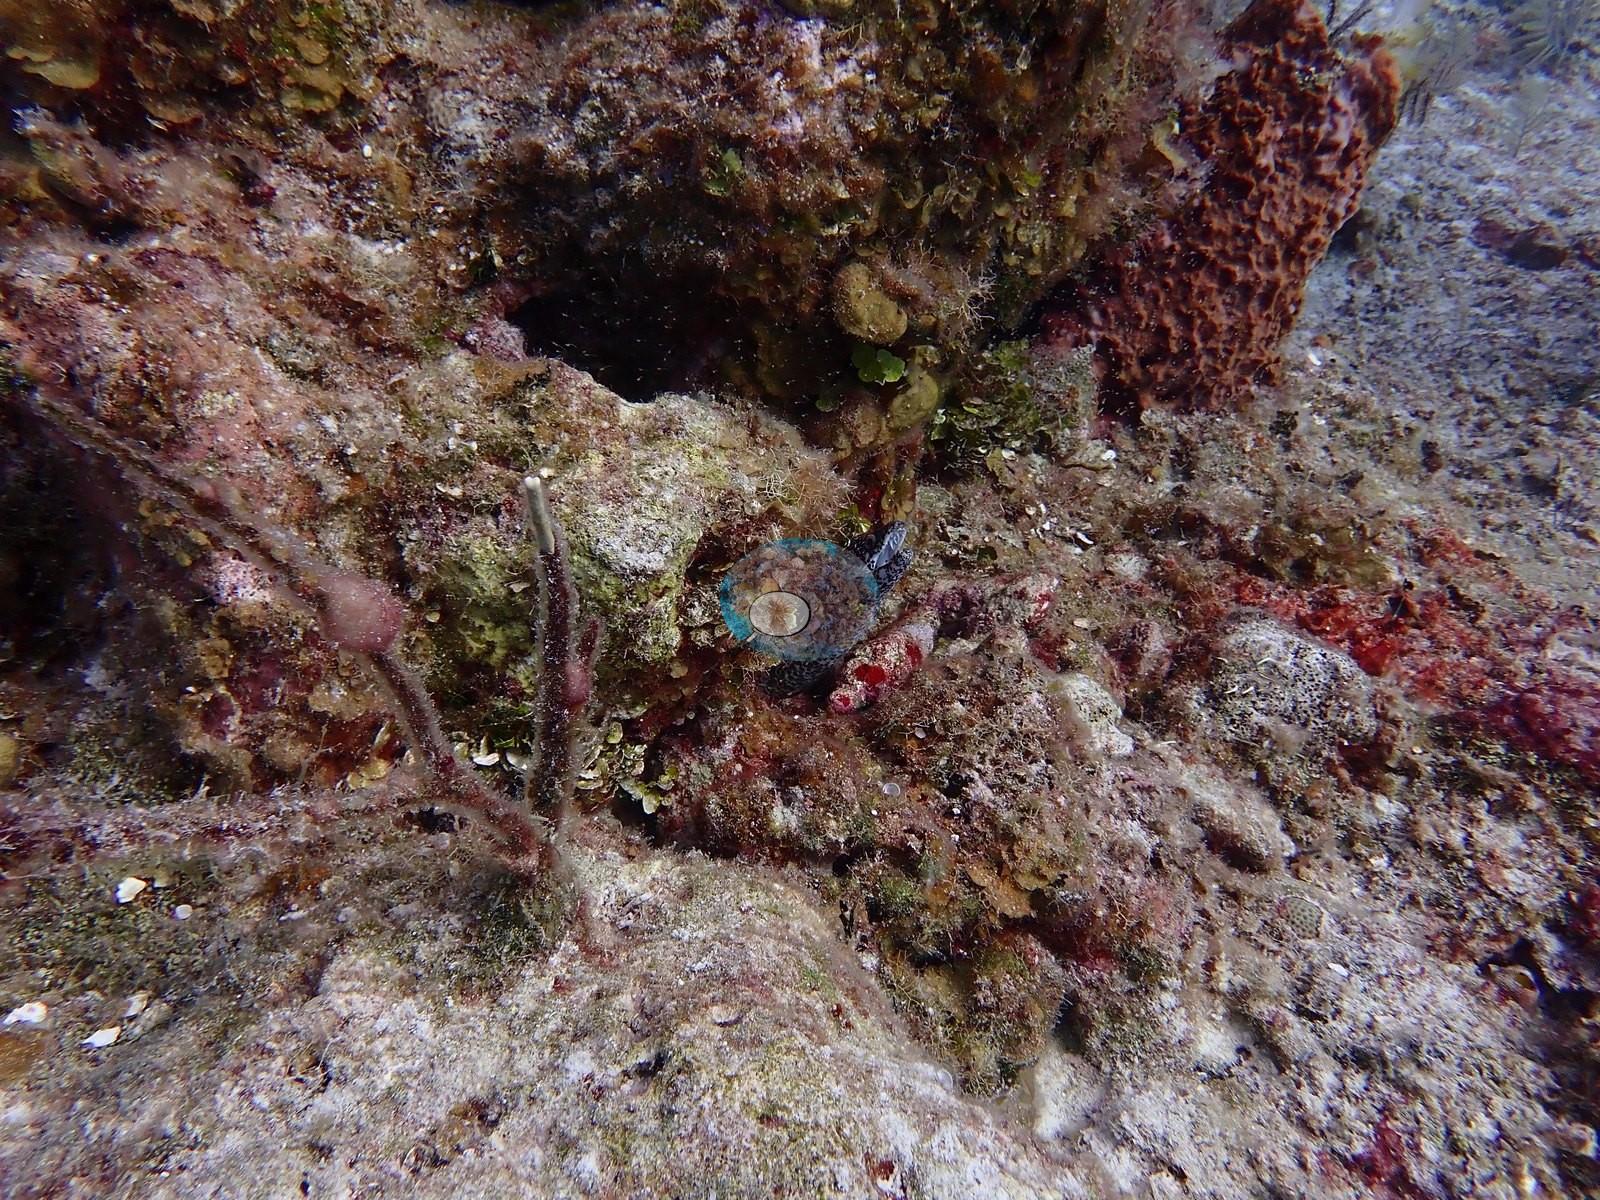
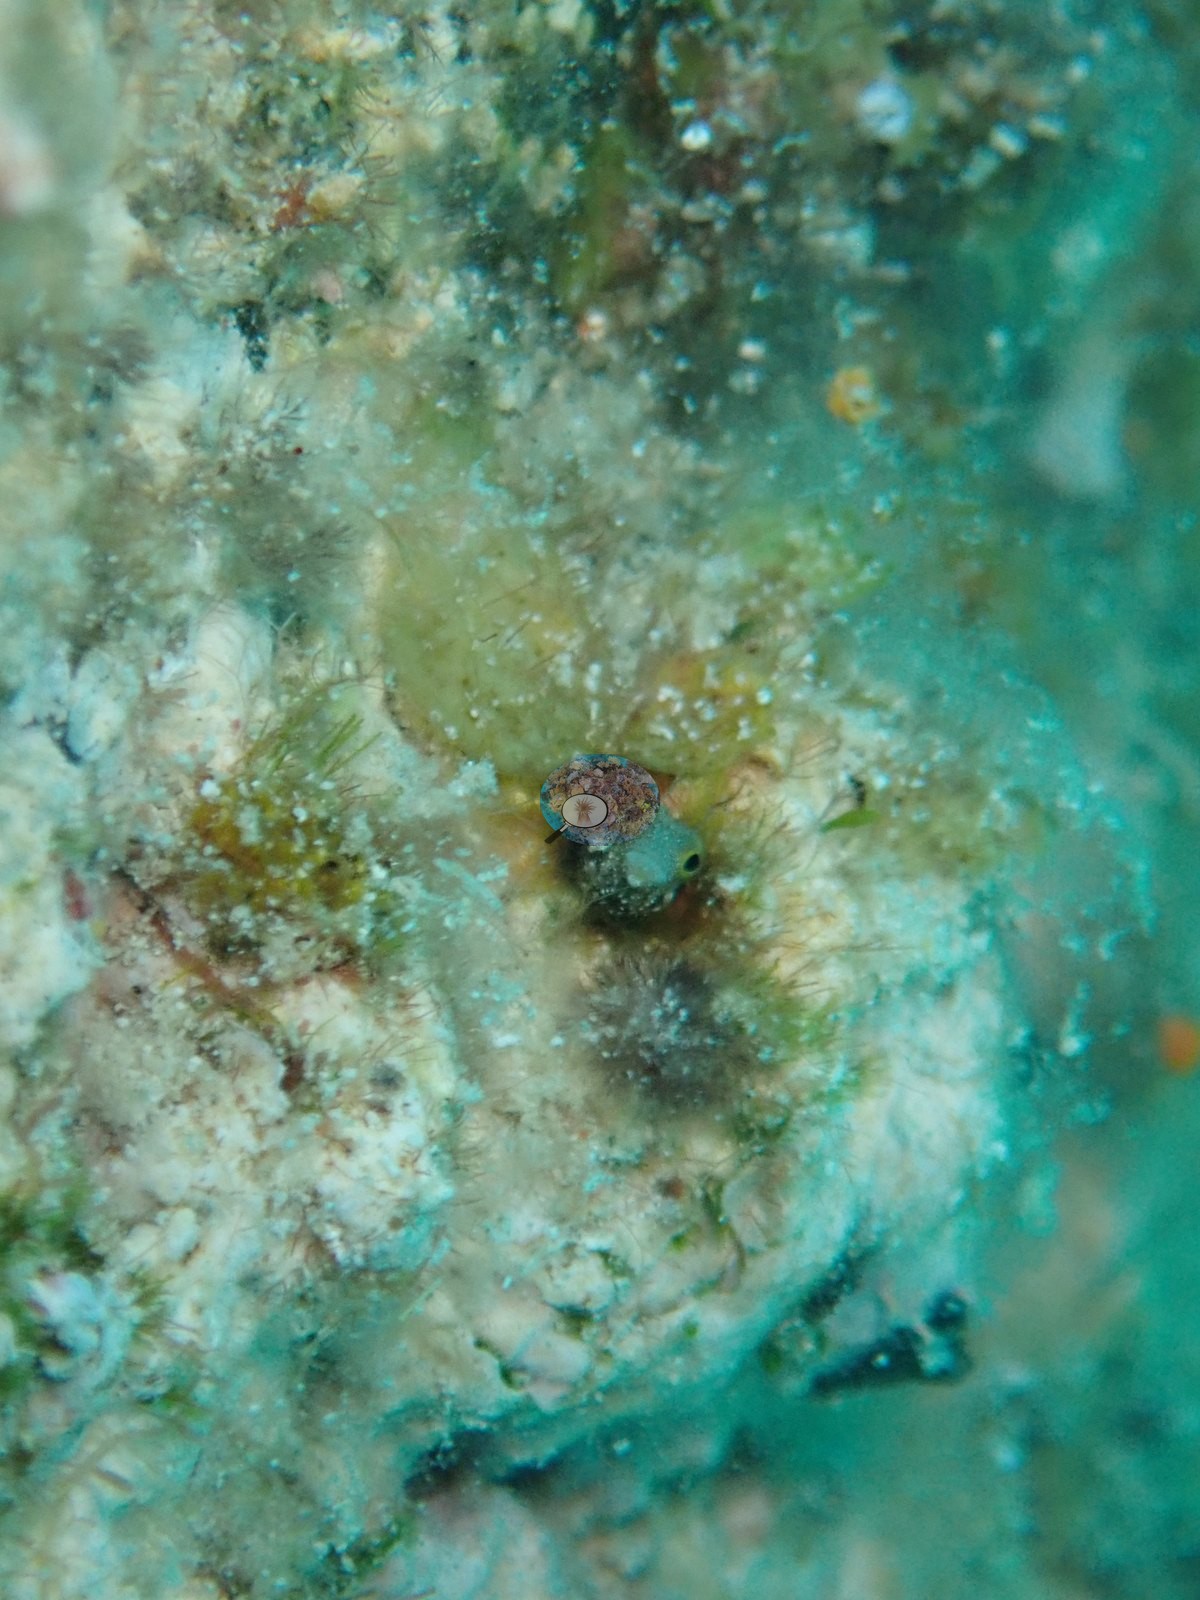
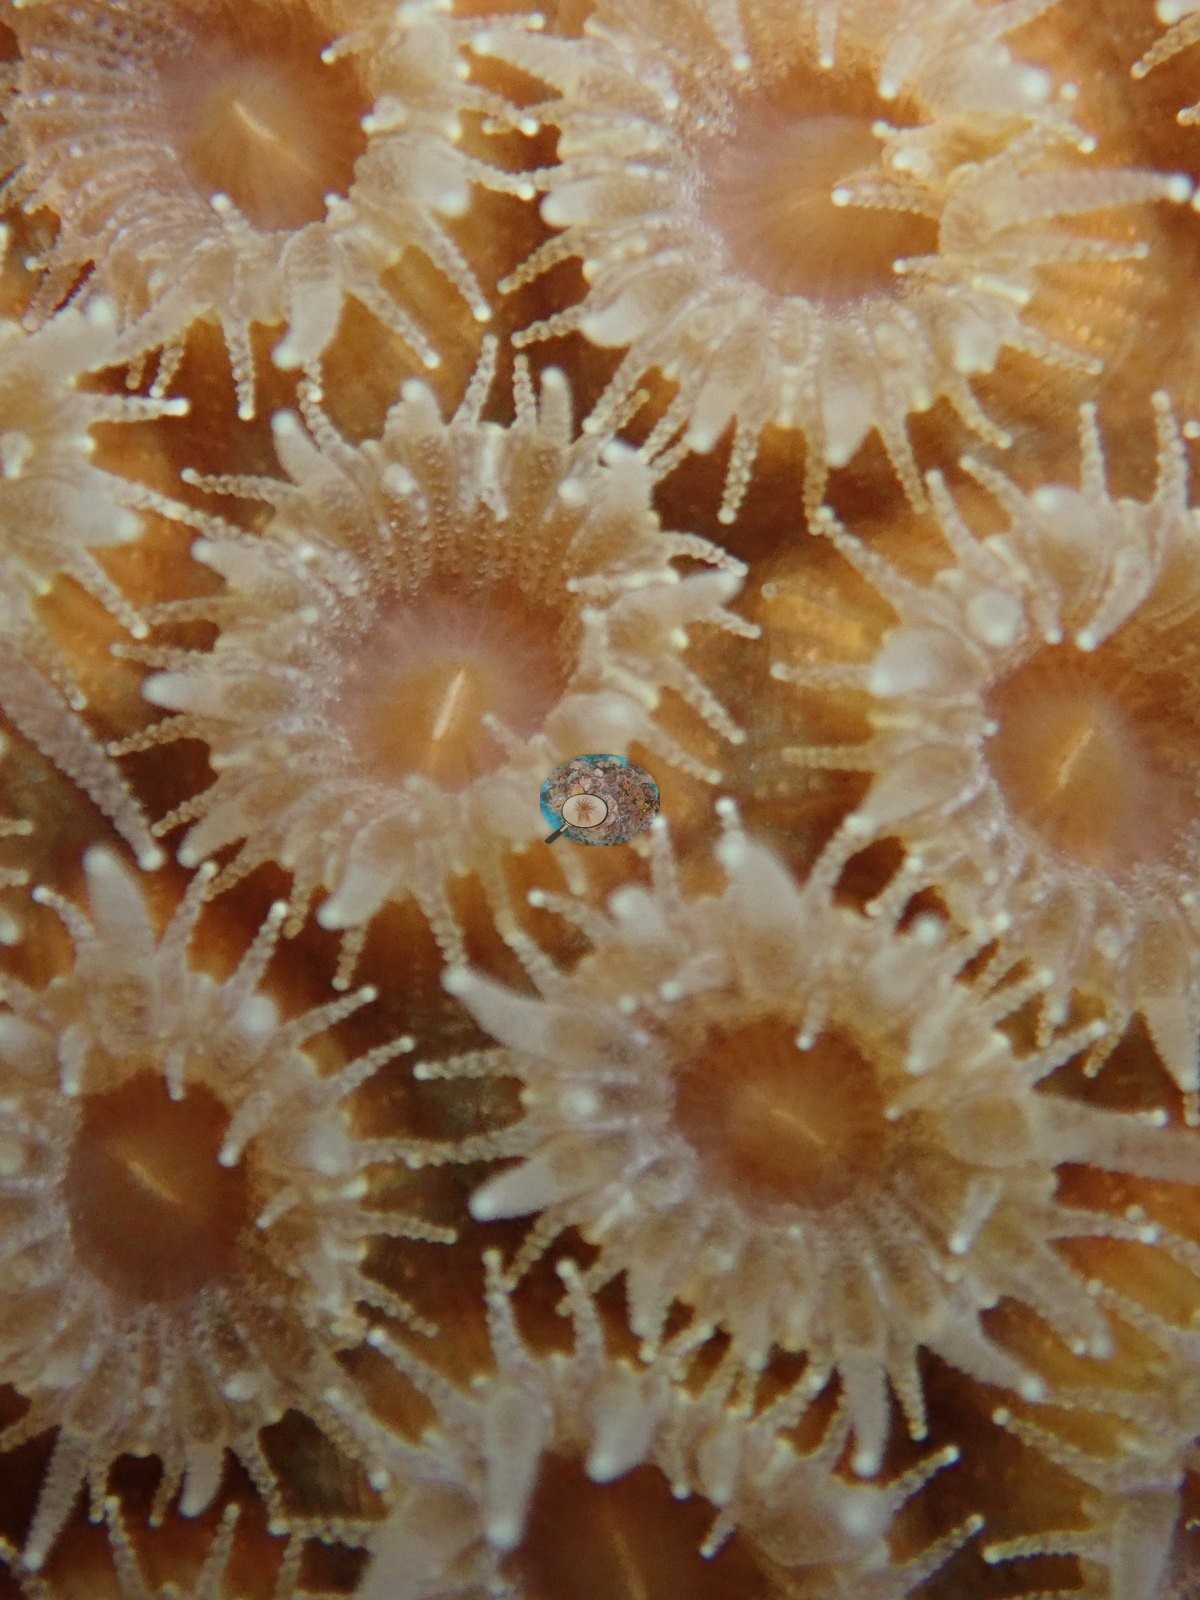
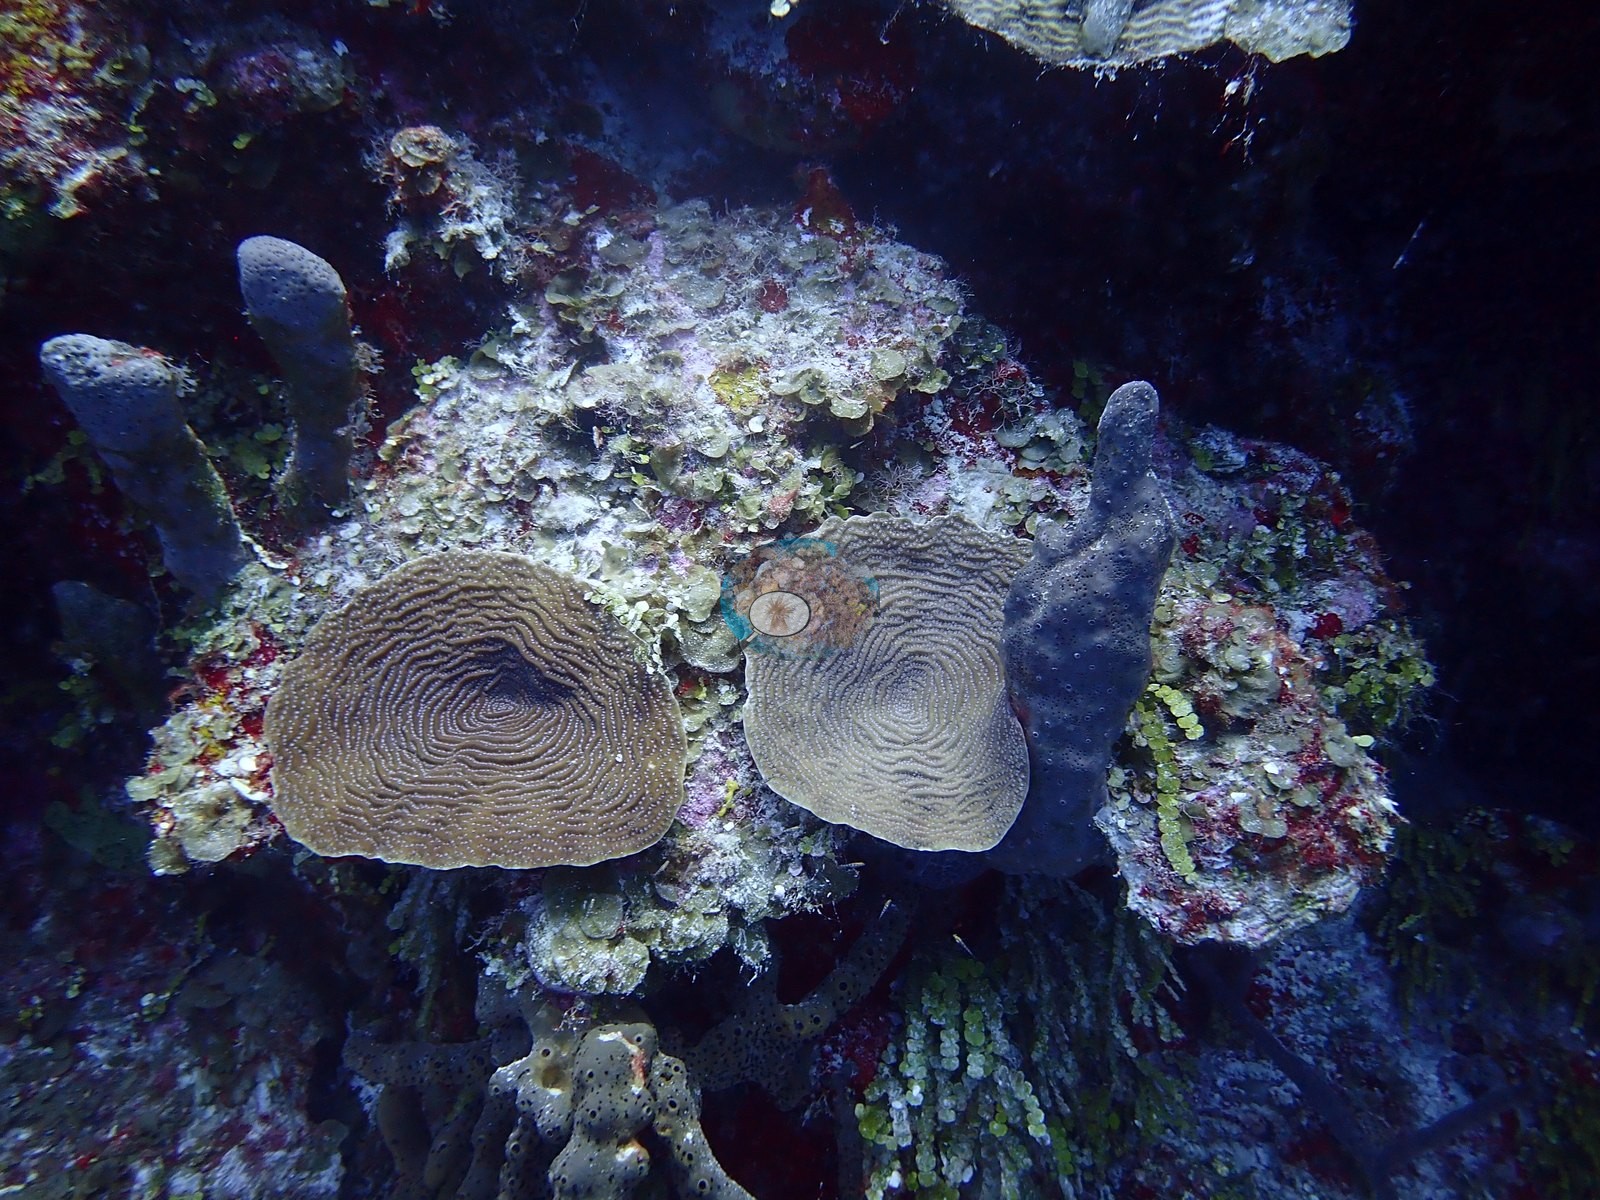
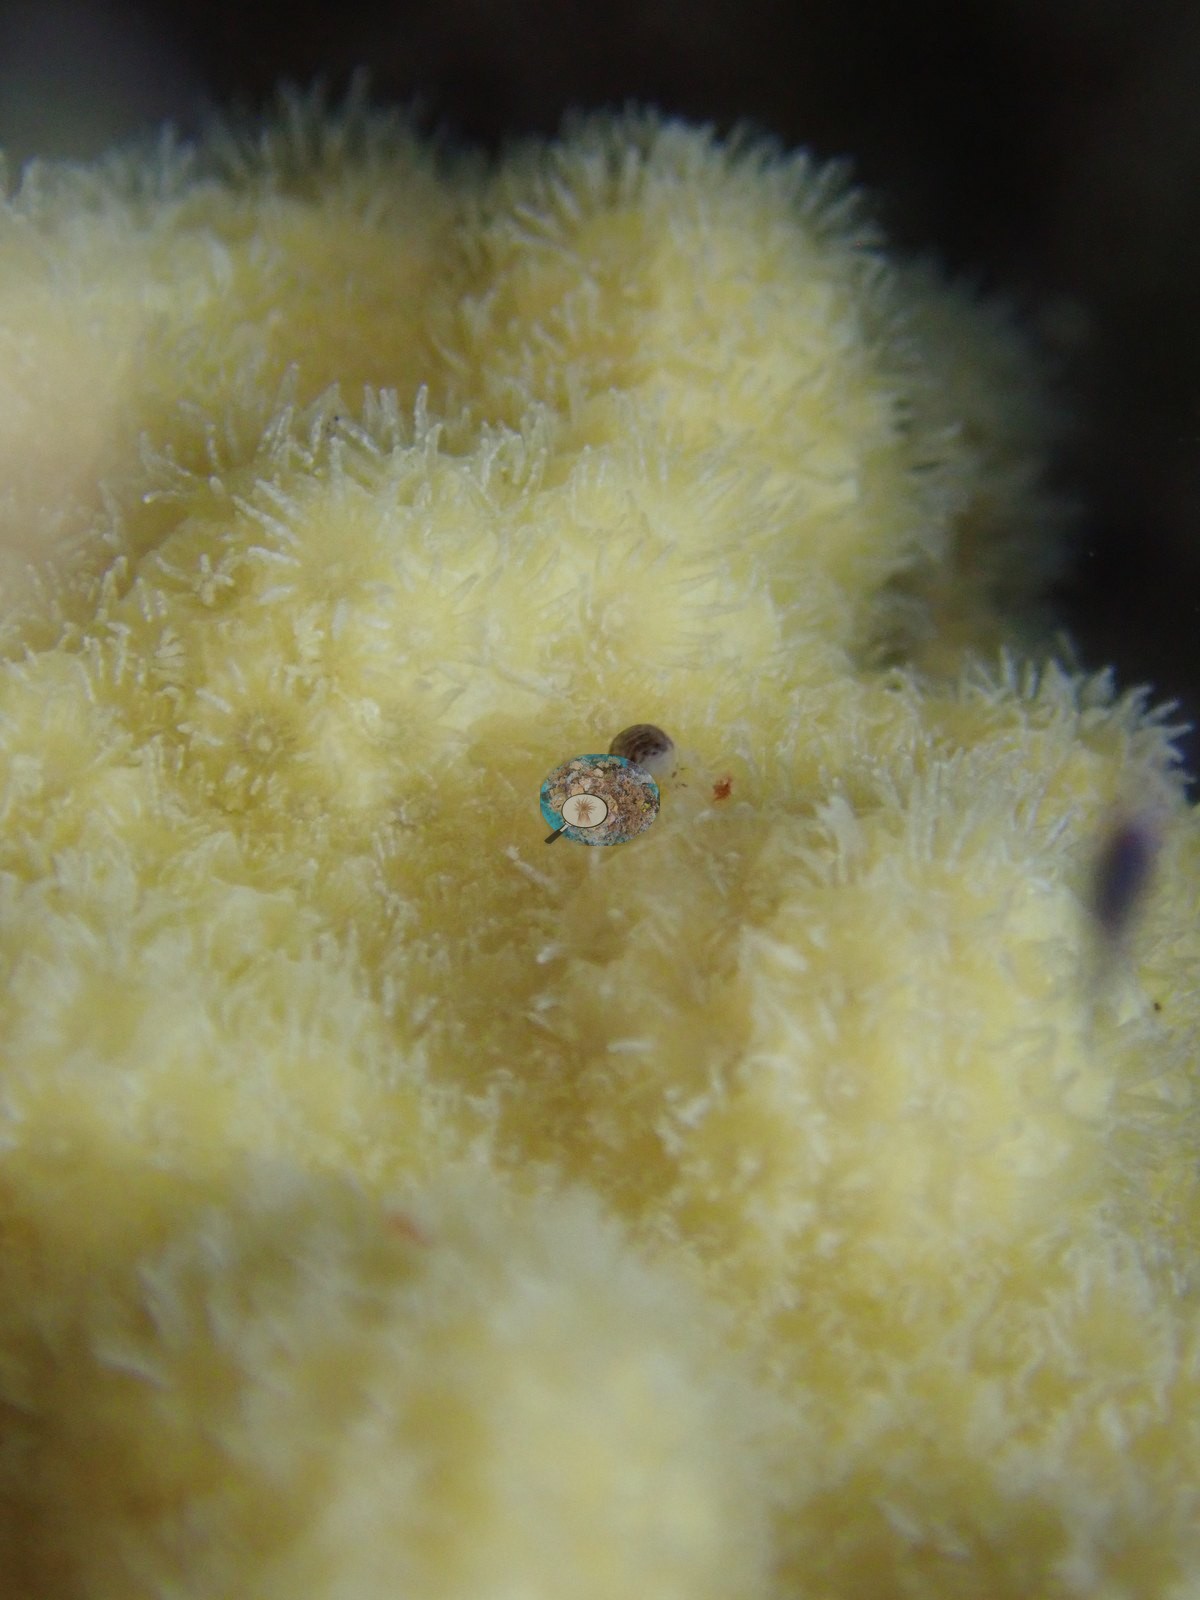
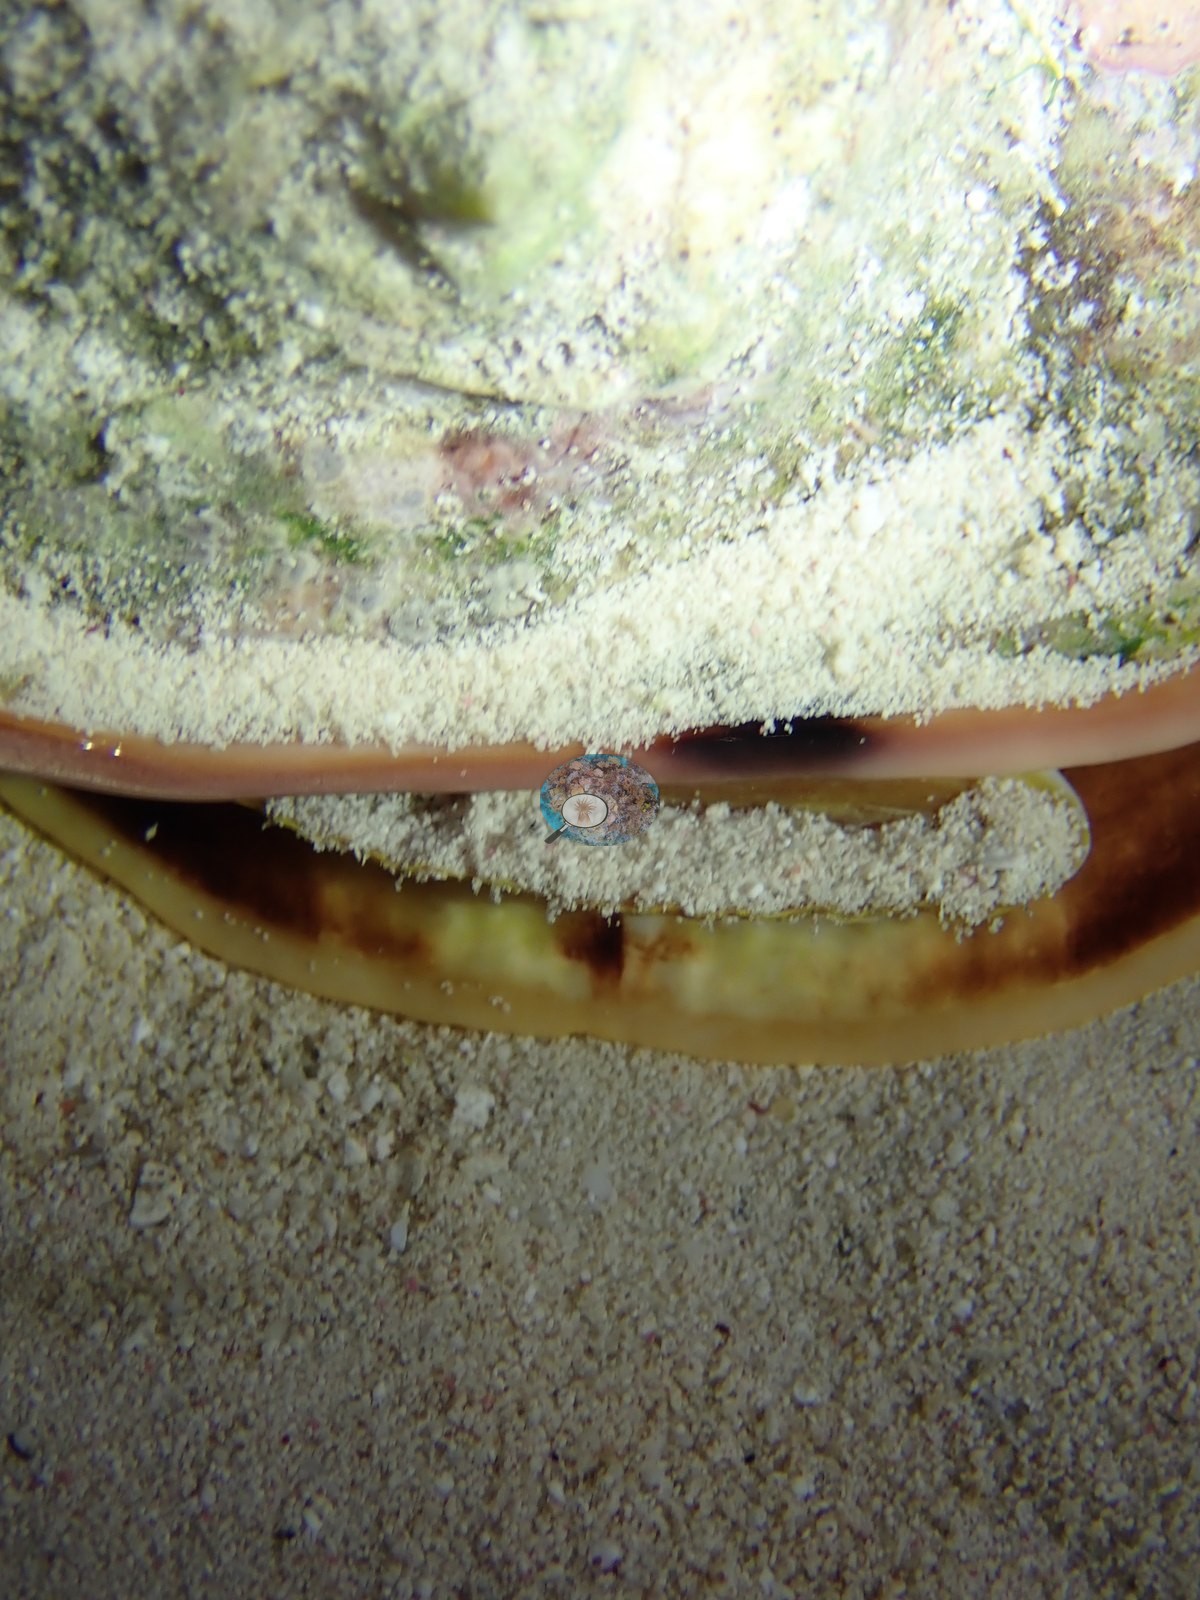
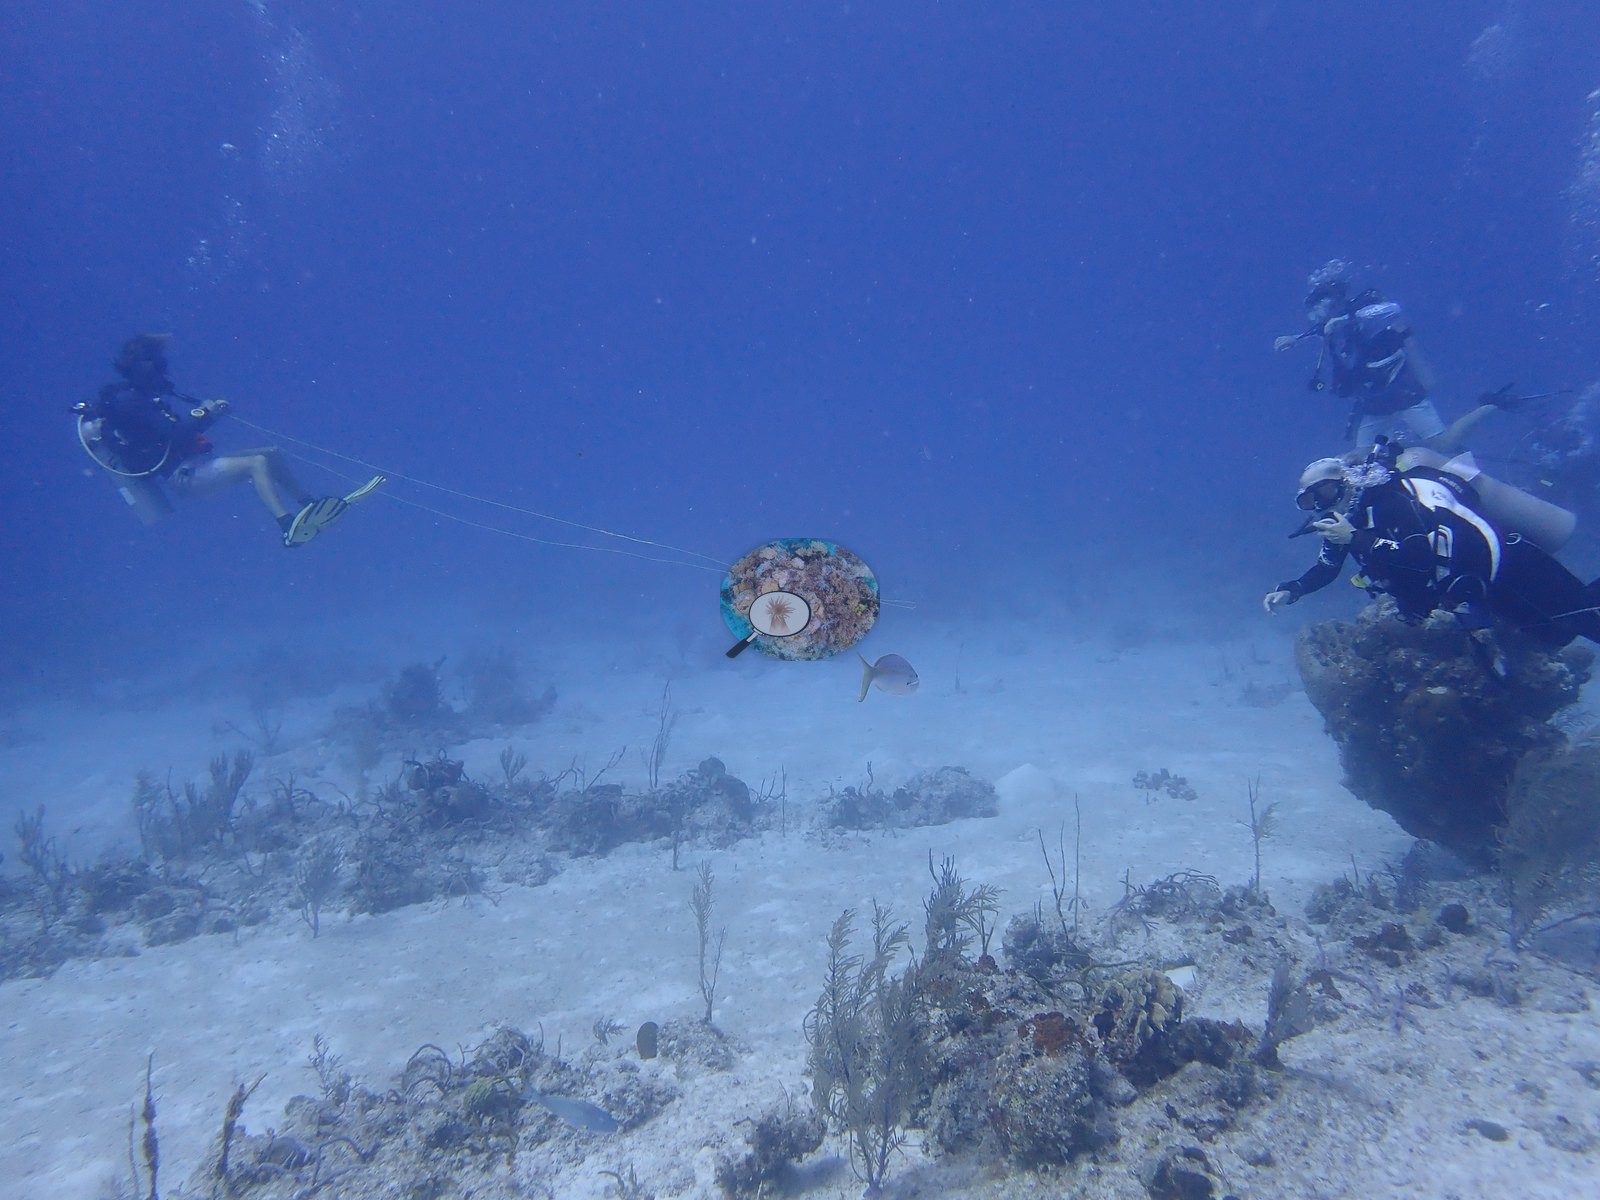
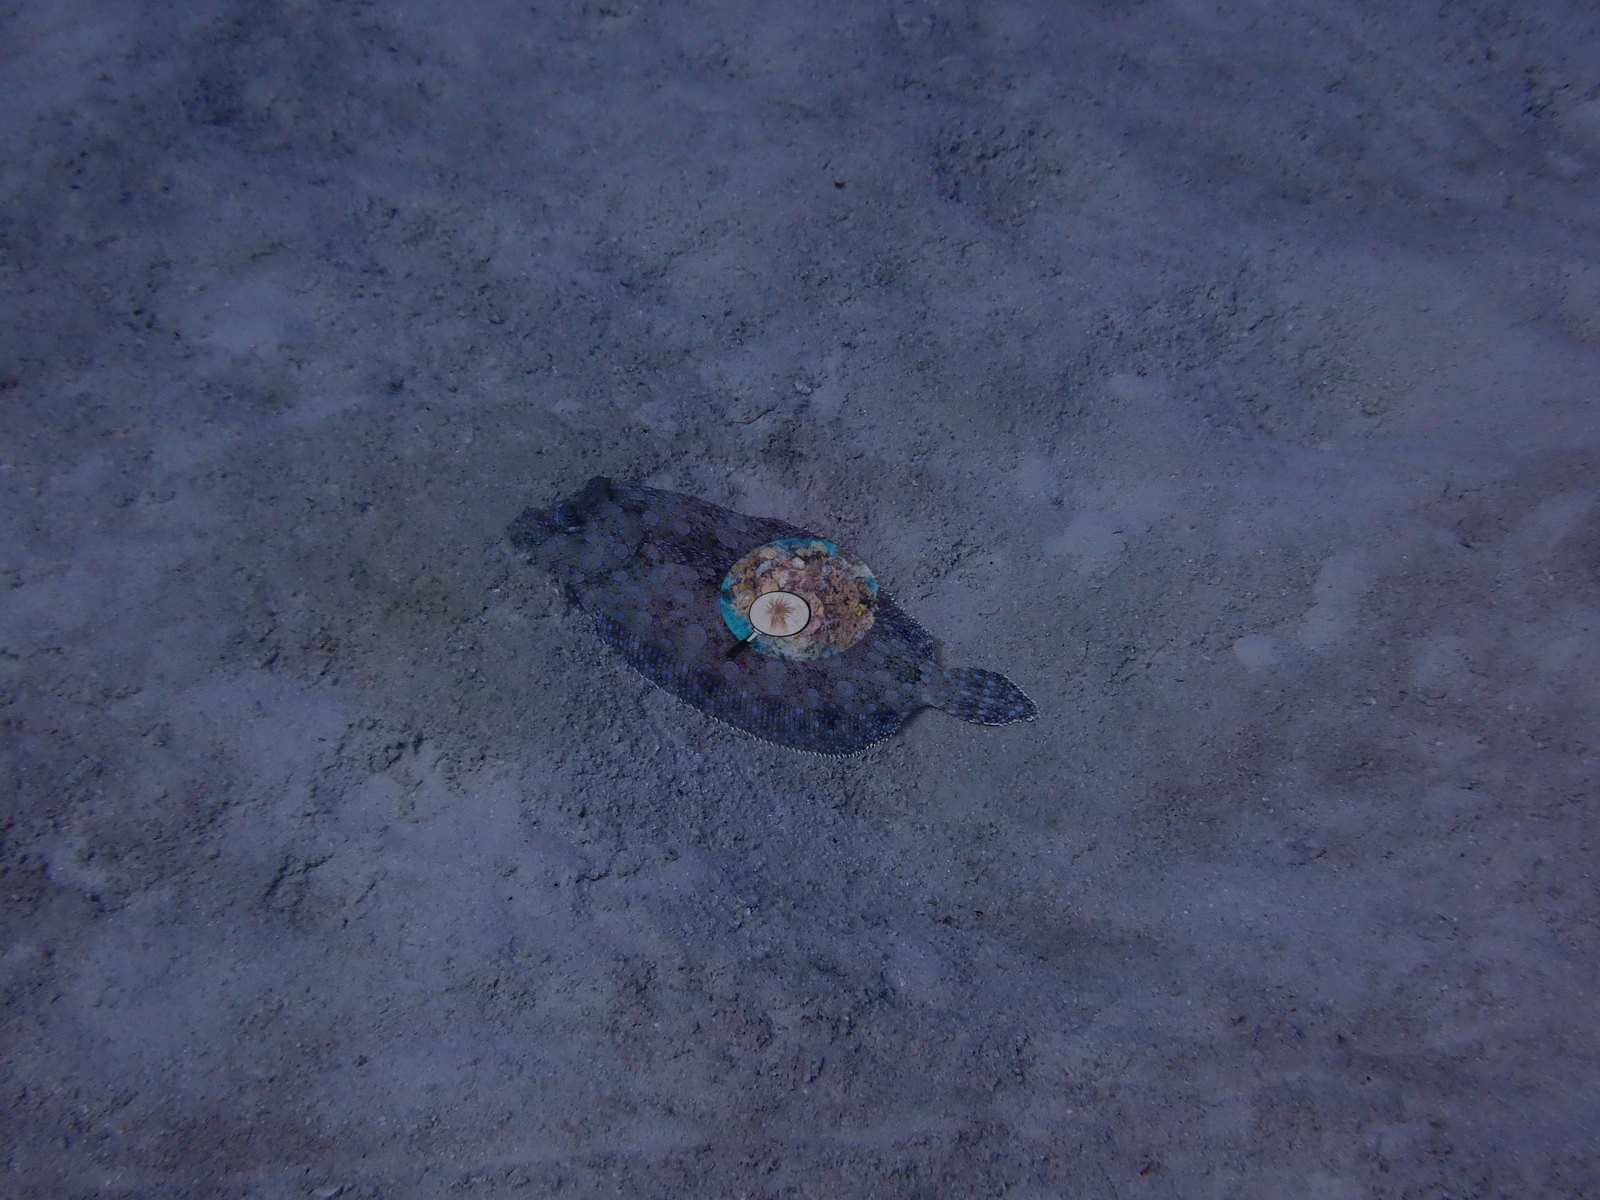
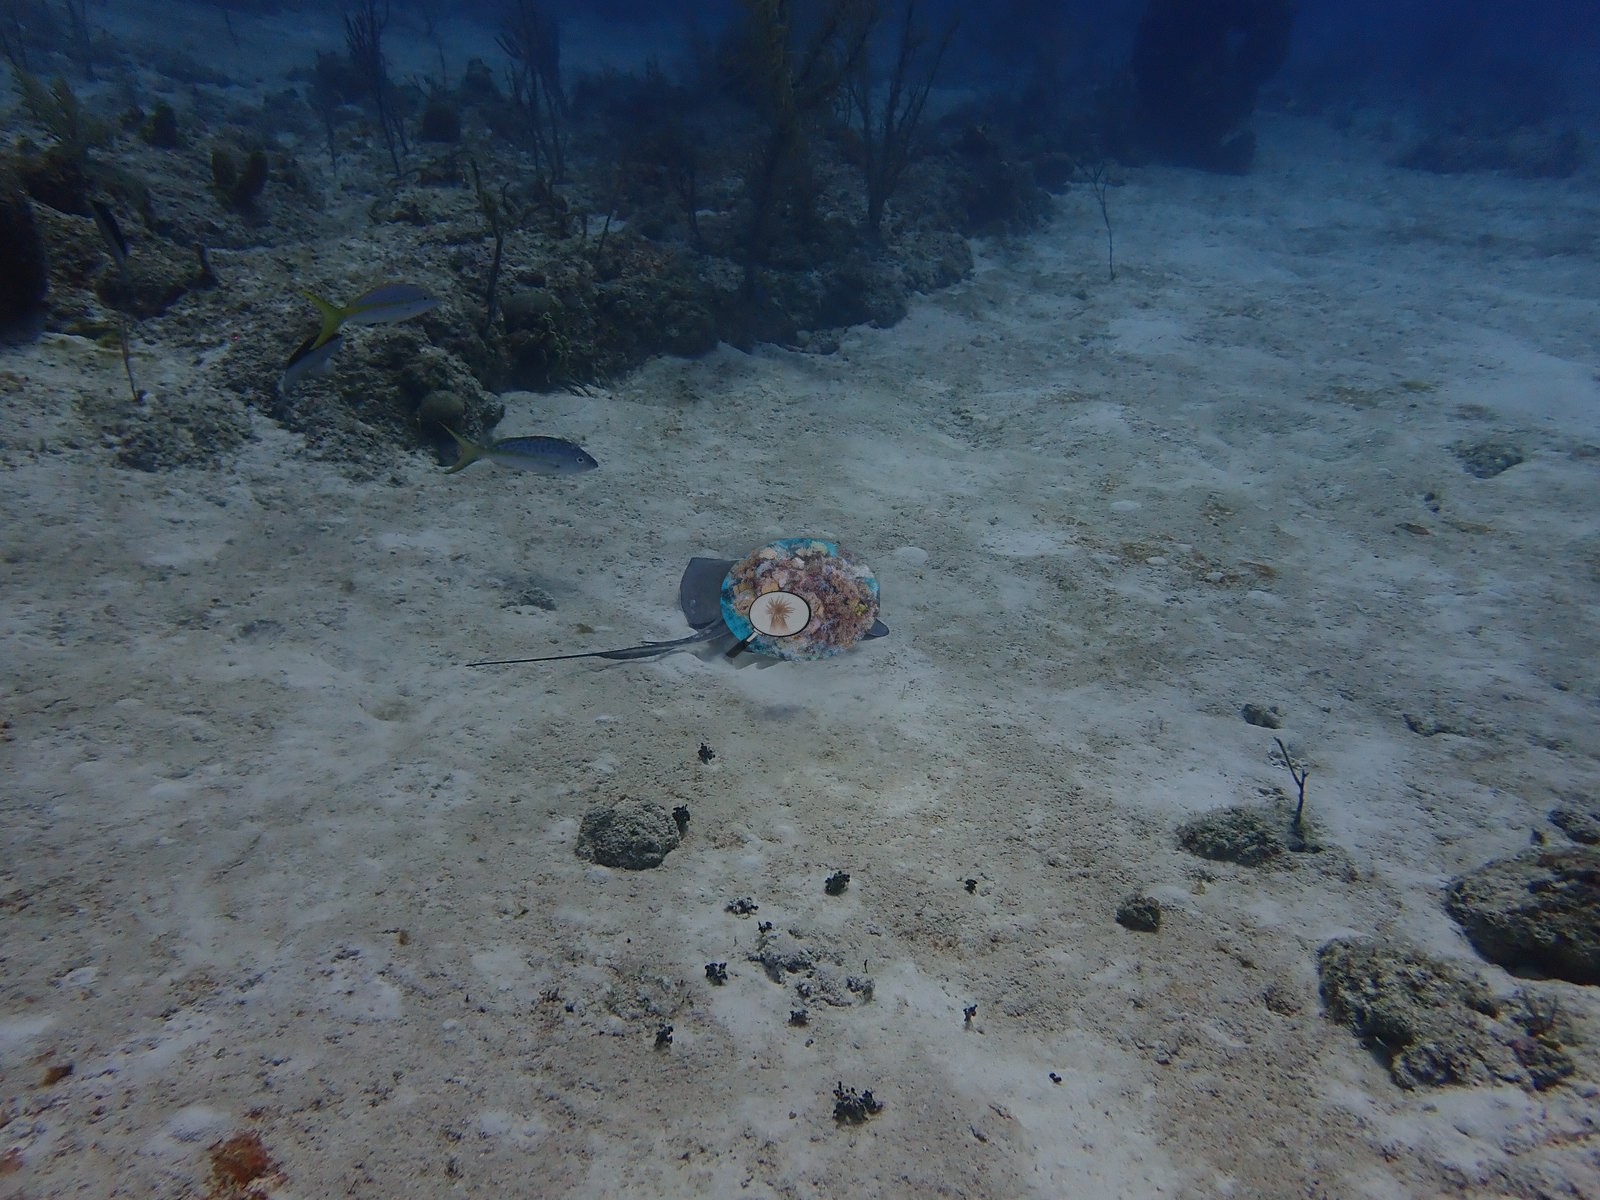
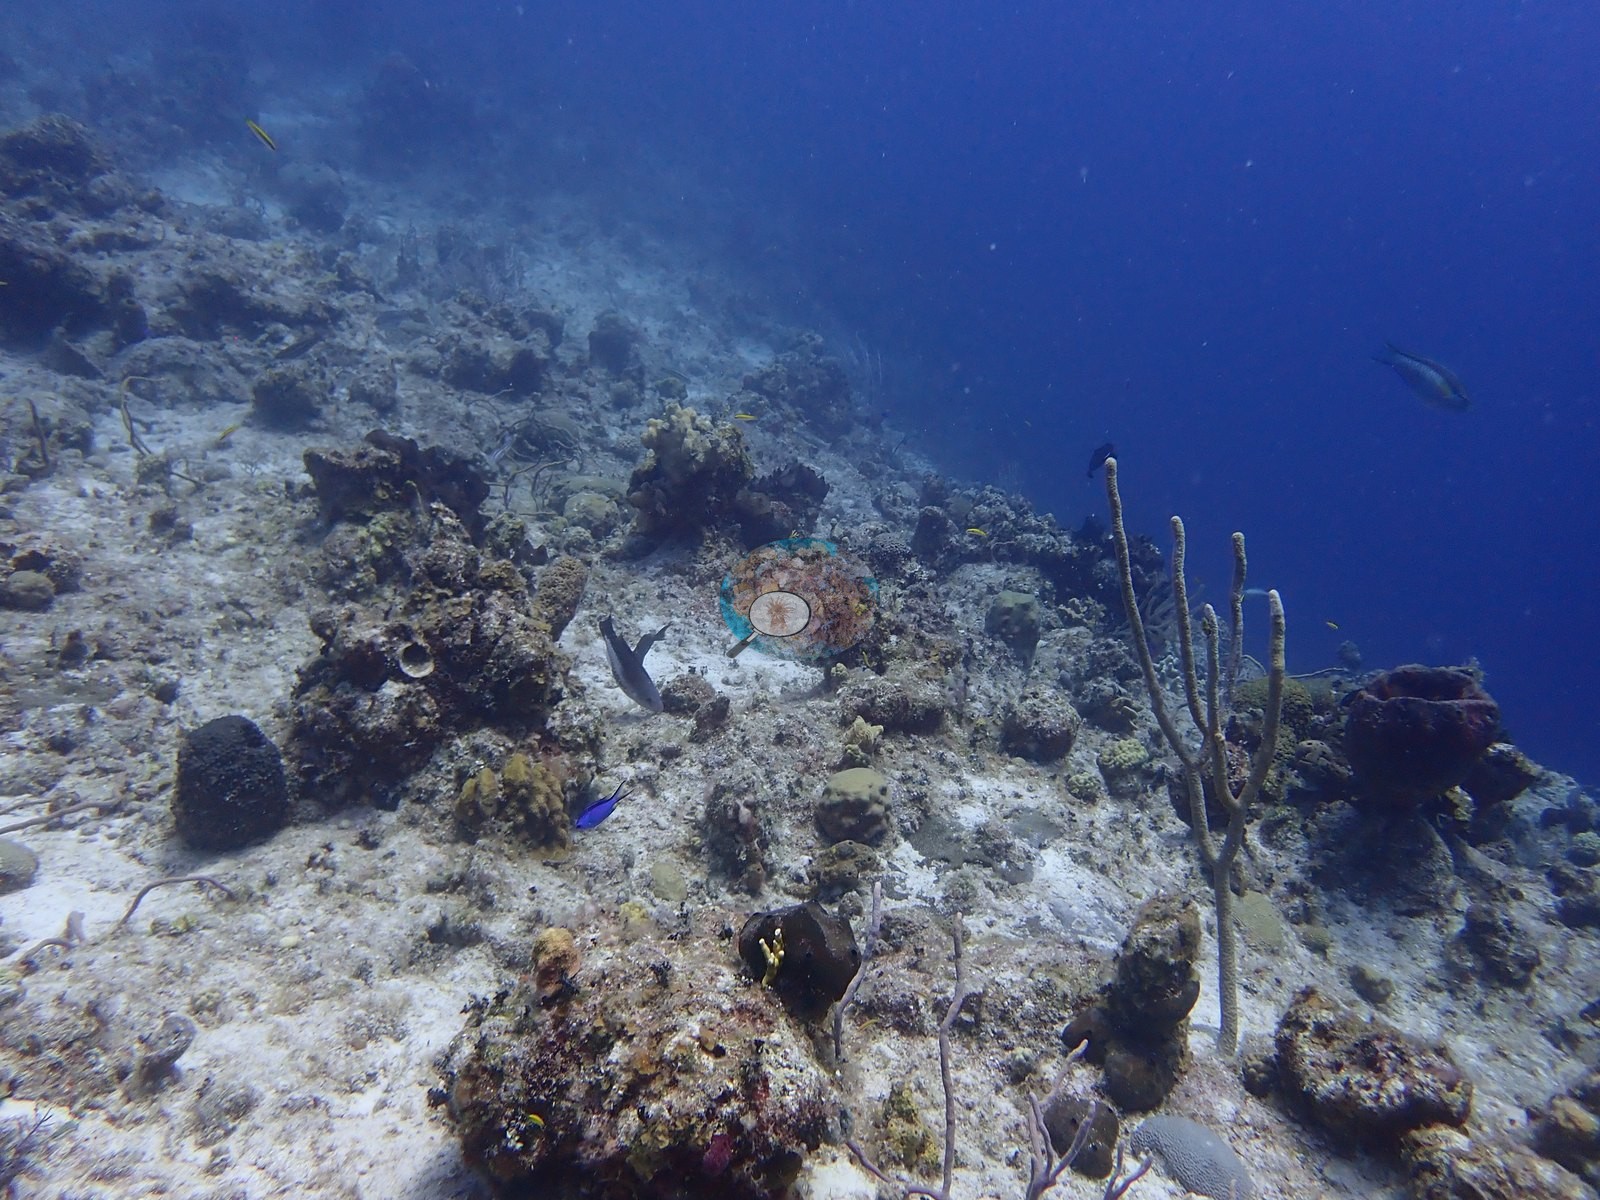
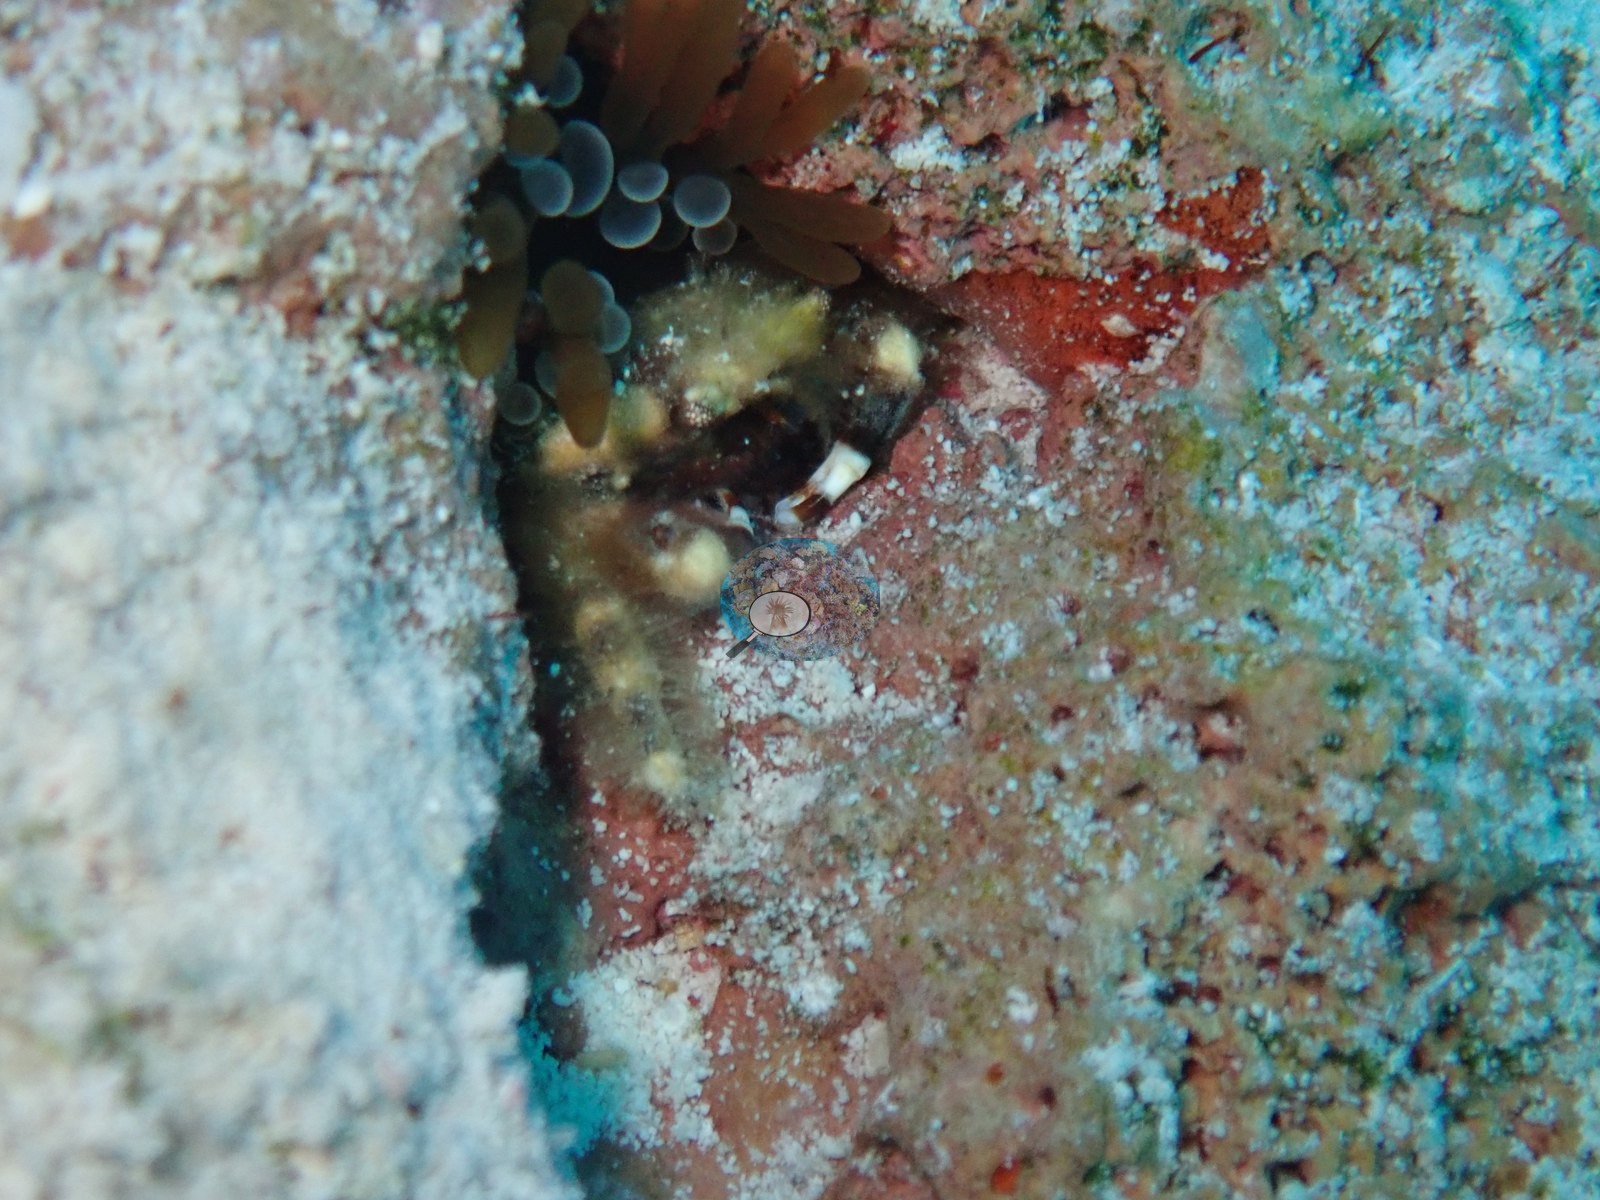
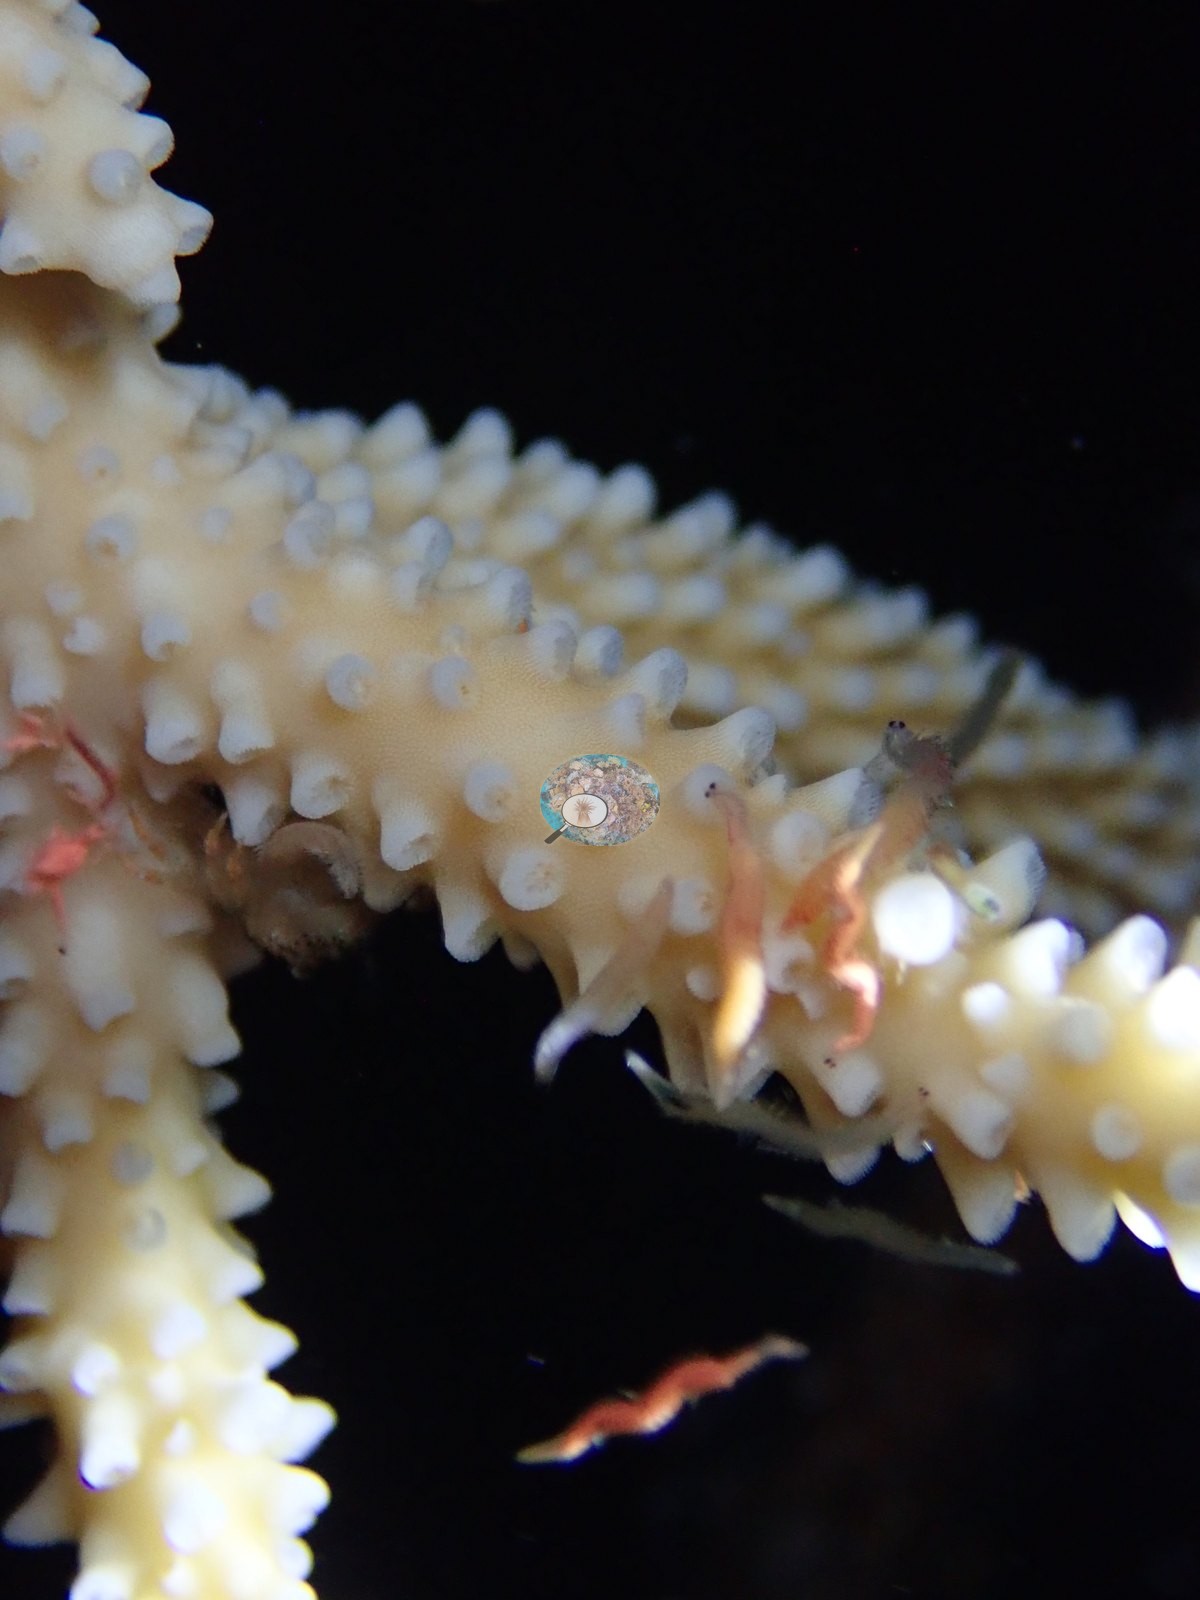
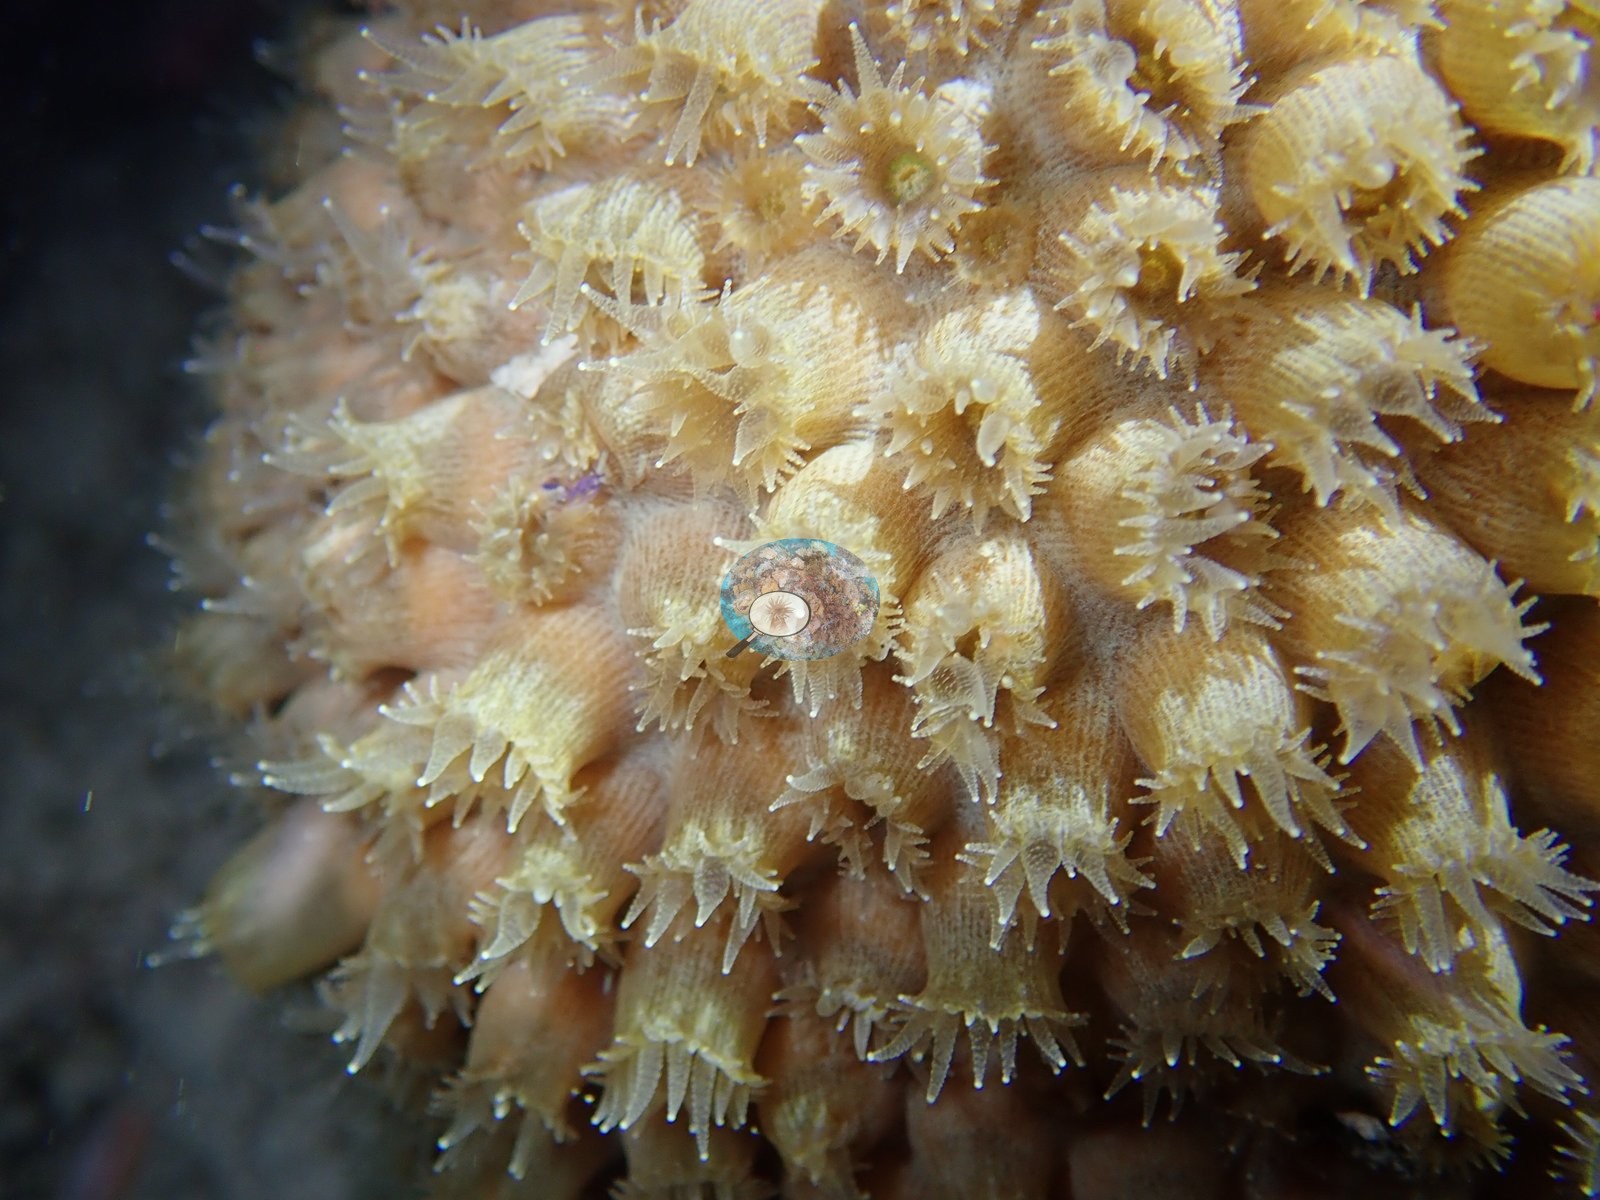
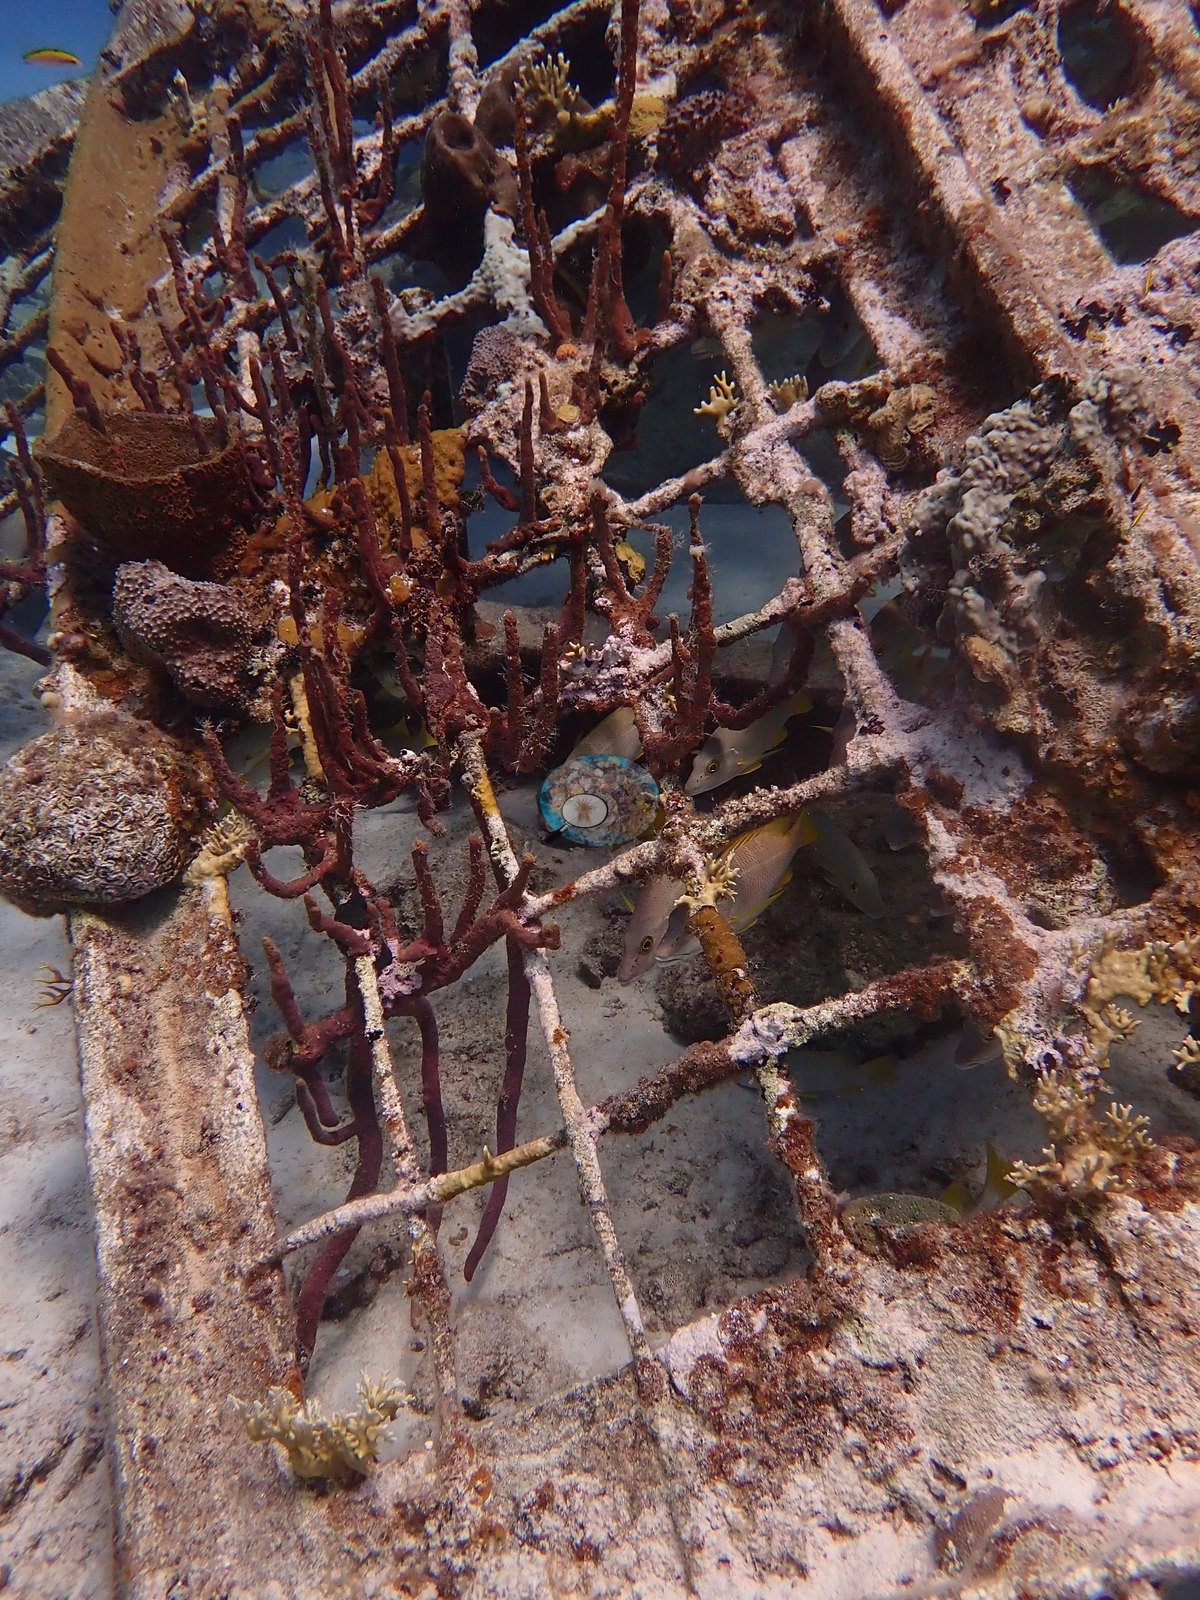
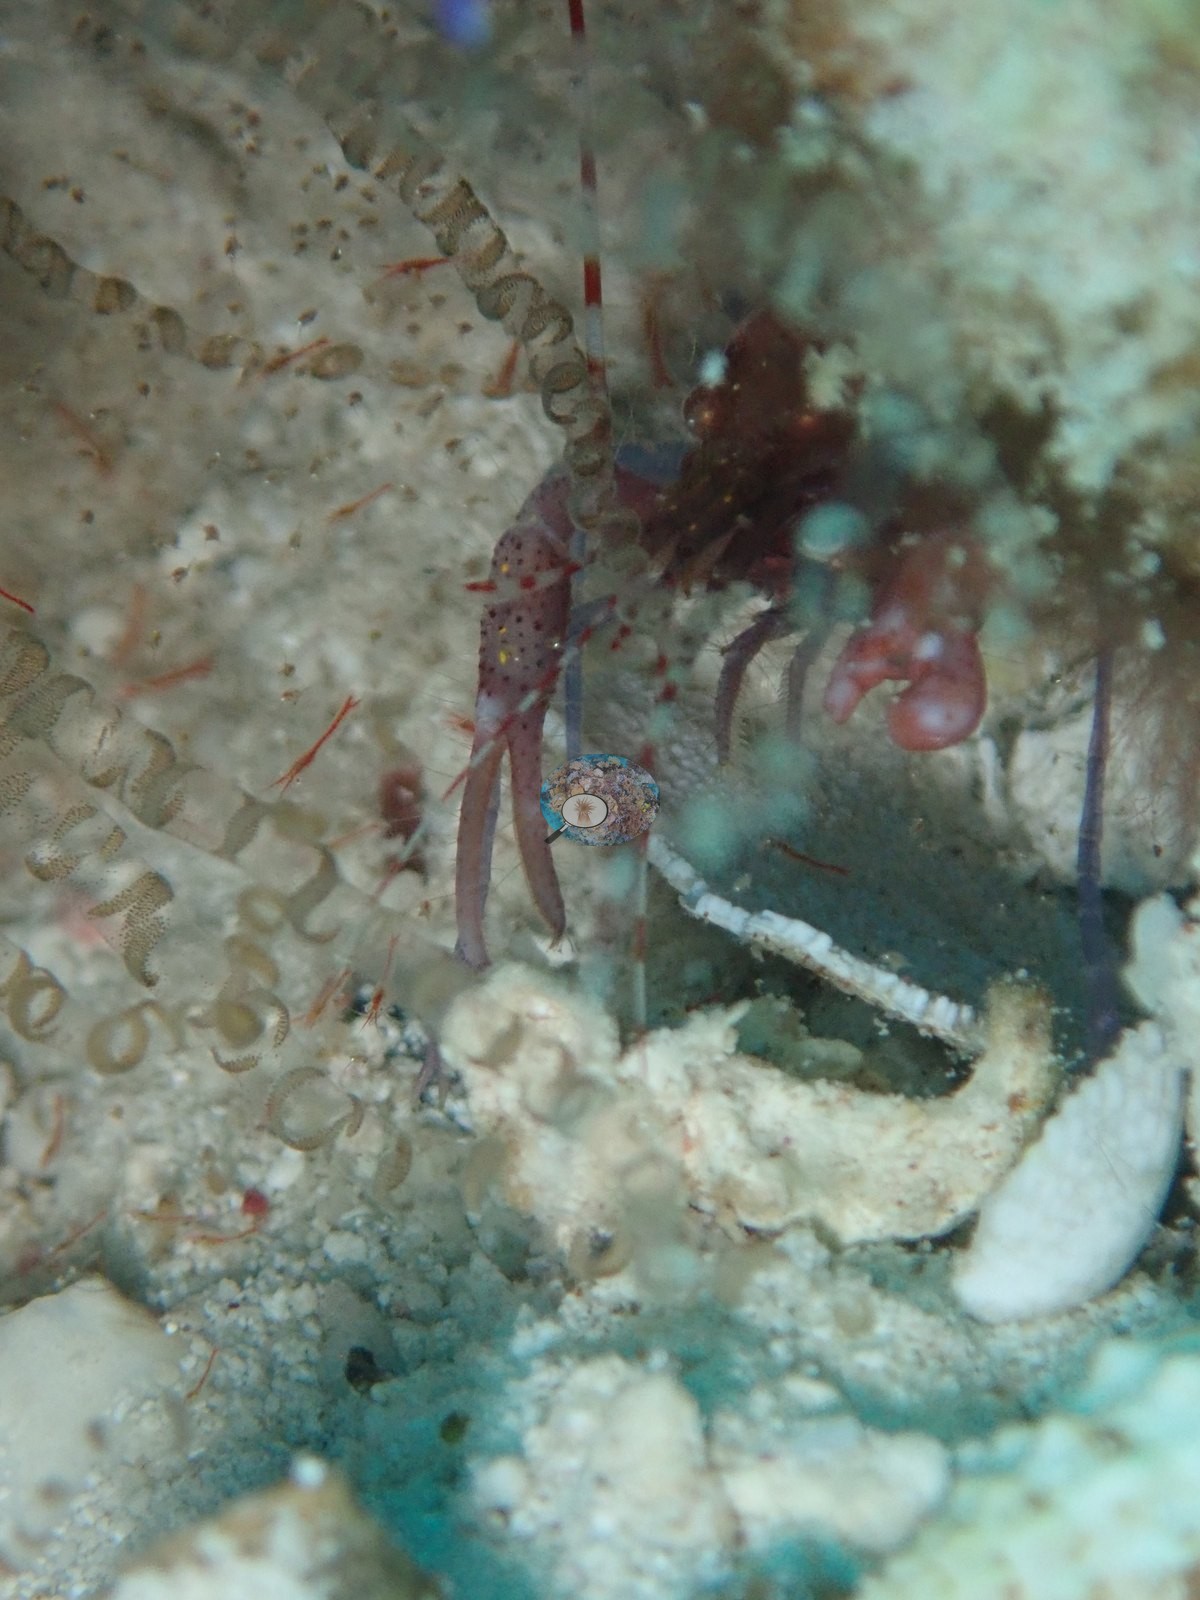
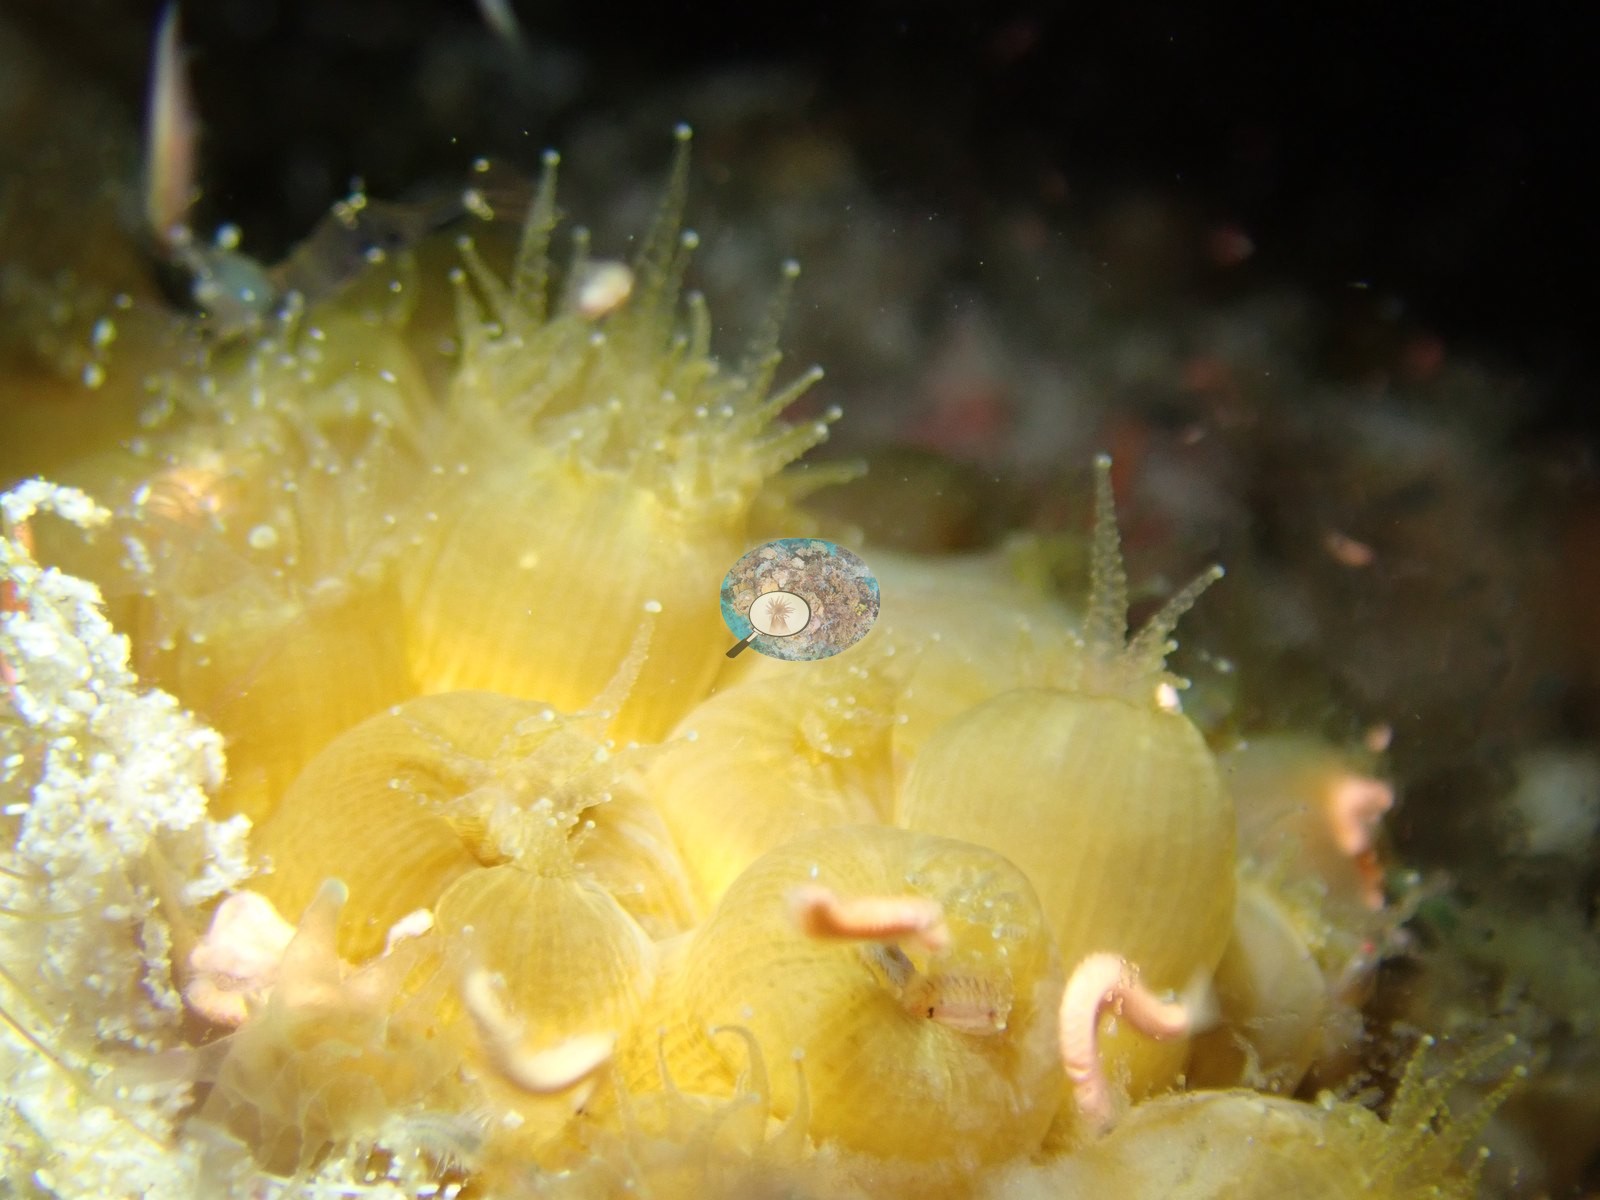
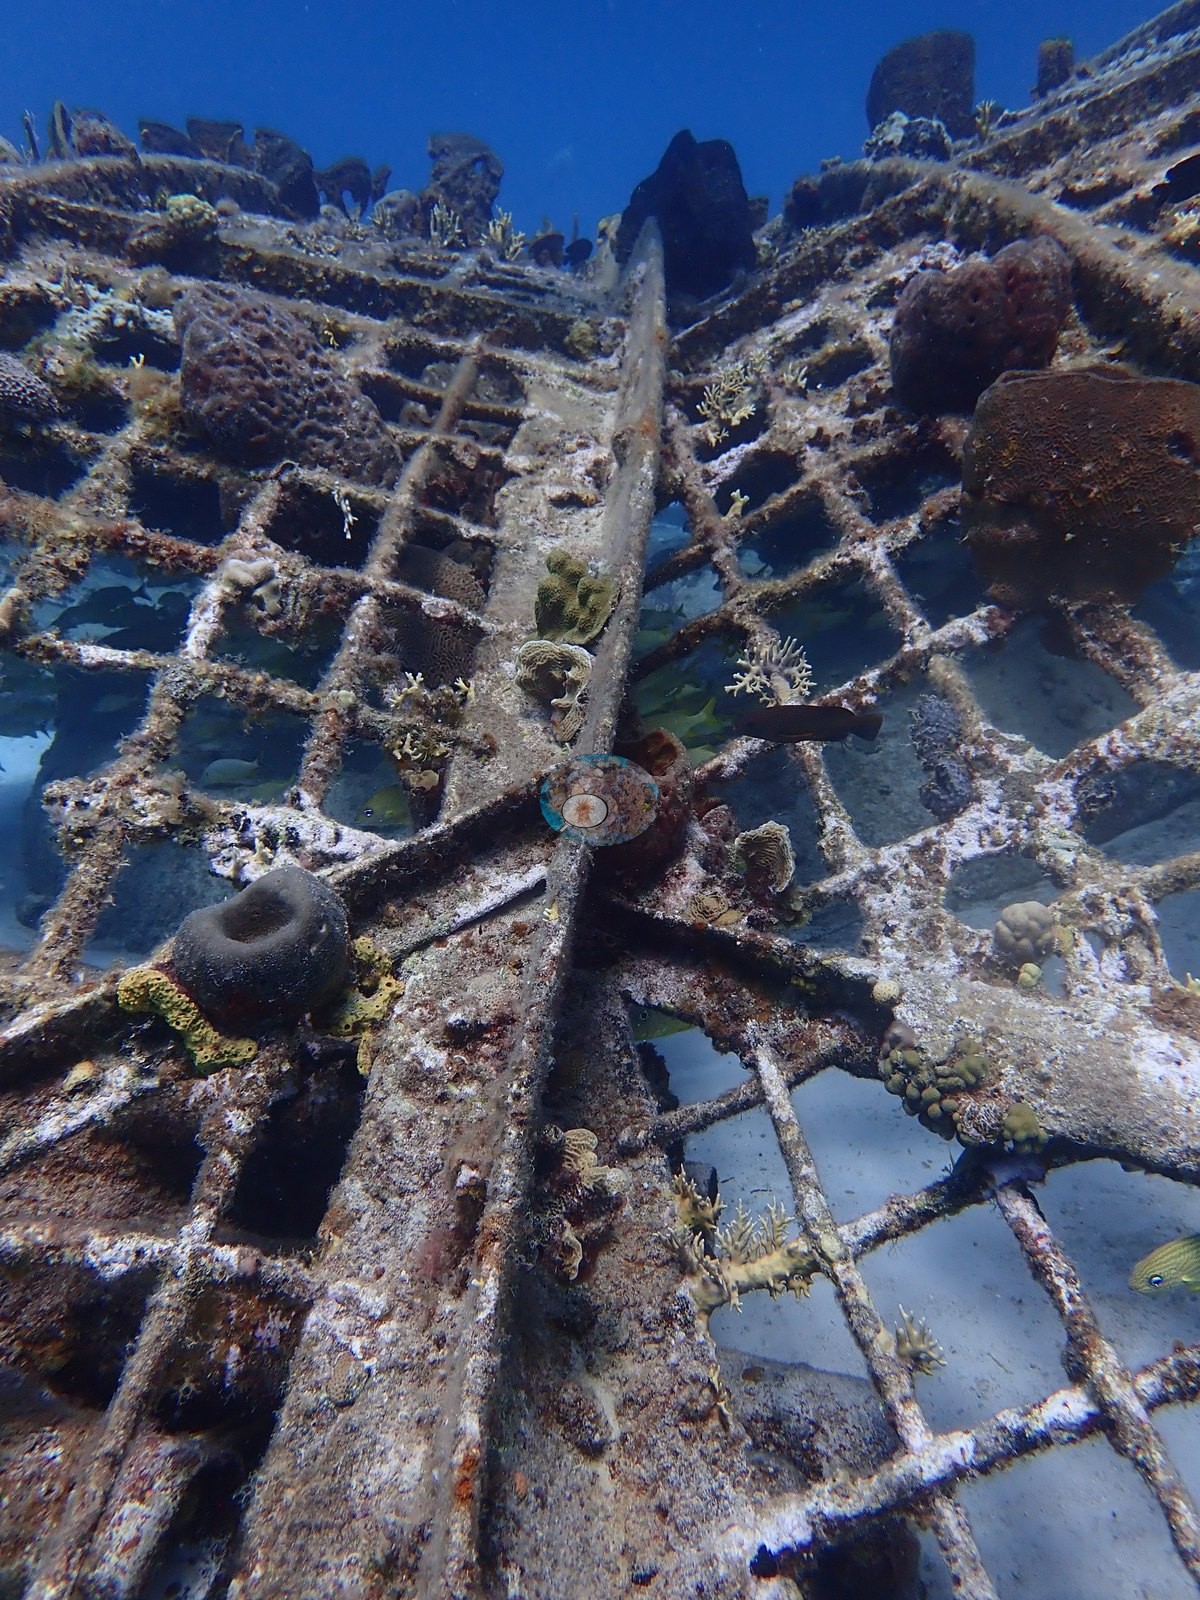
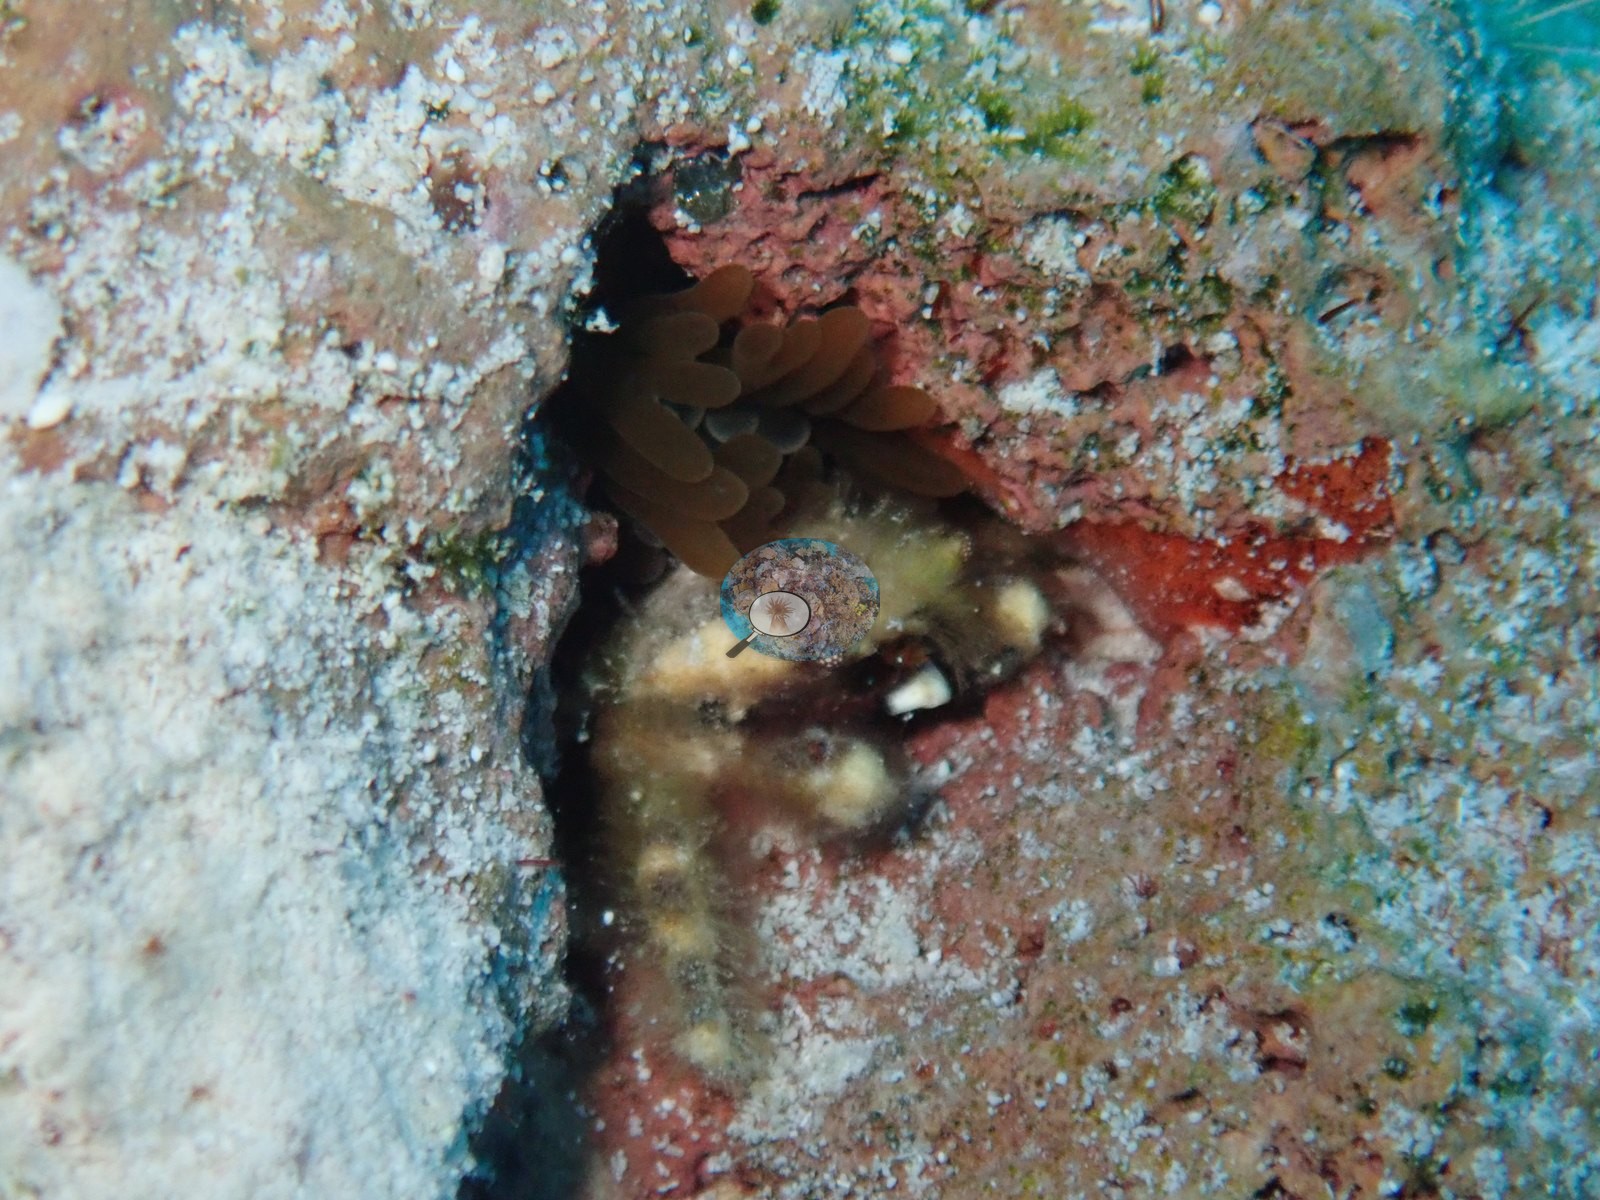
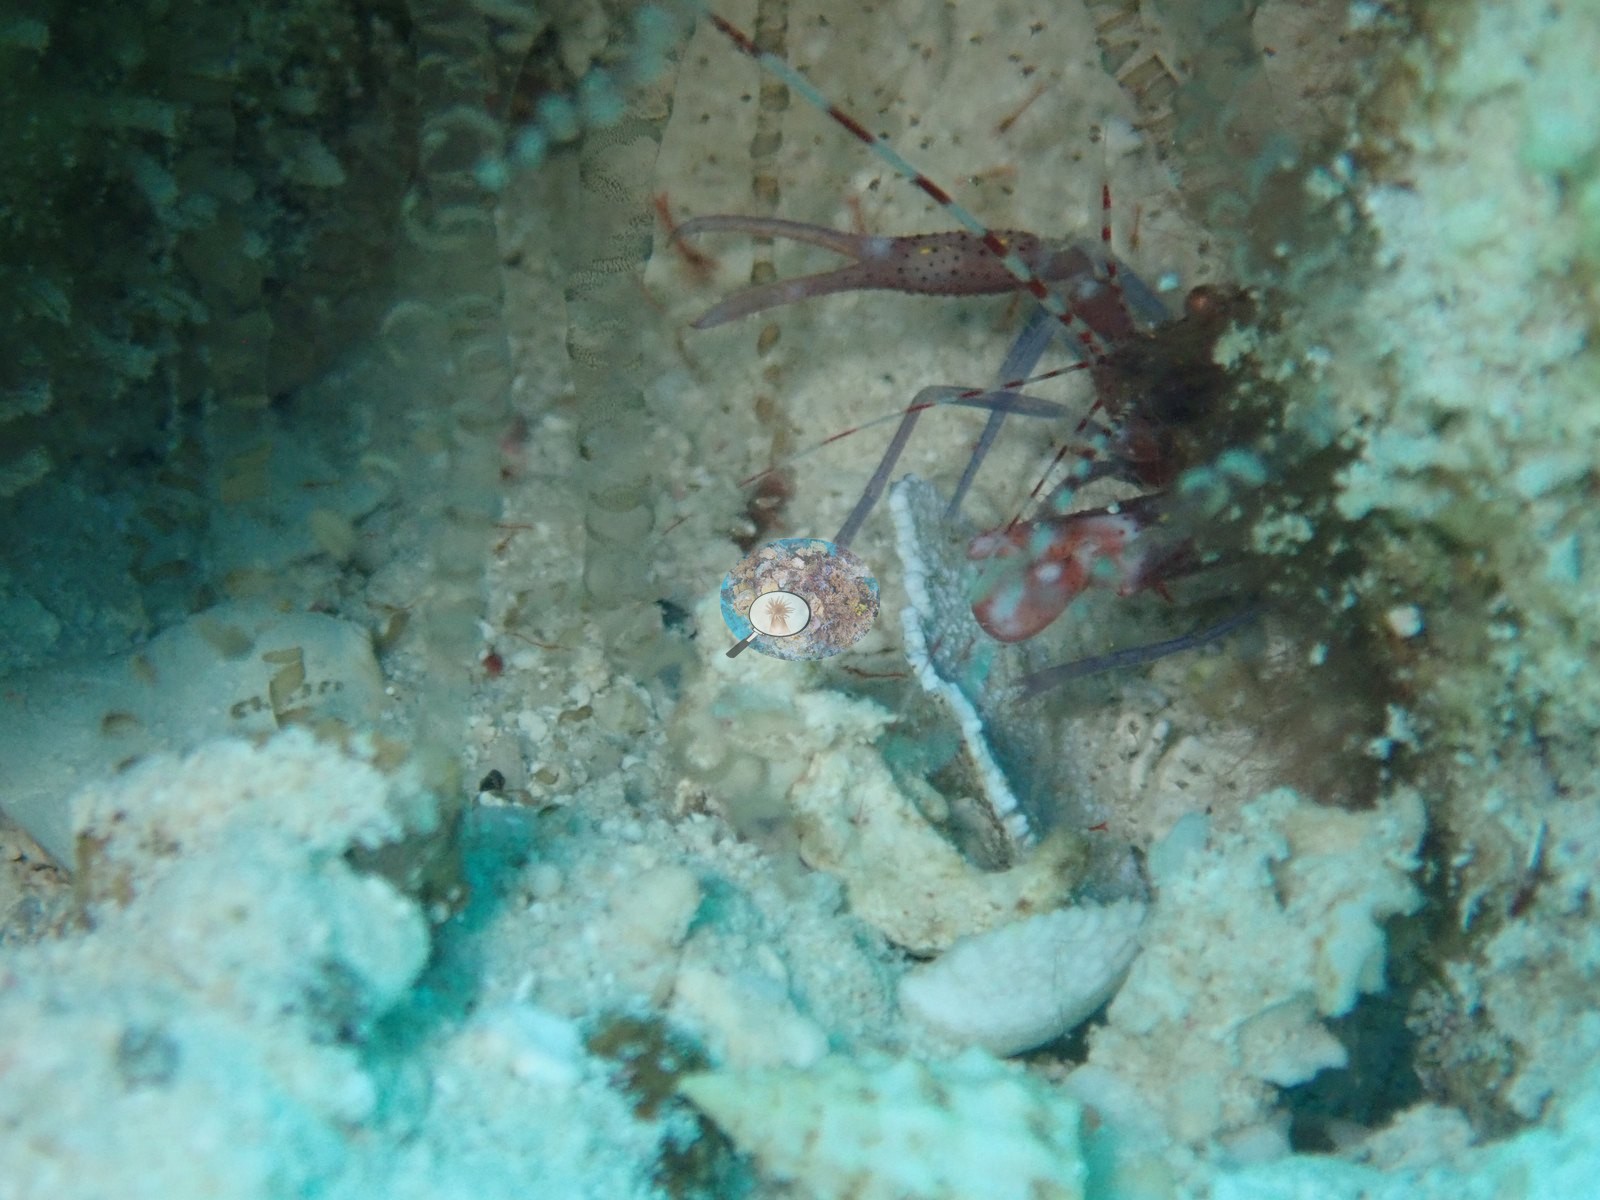
The collapsed metal set of a 1980s French TV game show sits in about 40ft of water, its rusted grid now an artificial reef colonized by golden-yellow sun coral (Tubastraea) polyps, tube sponges, and banded coral shrimp (e.g., Image 1, Image 6, Image 7, Image 17, Image 24, Image 25, Image 31, Image 32, Image 37, Image 39, Image 44, Image 55, Image 56).
Coral cover
- Reference: Claude CV point count (this site's photos)
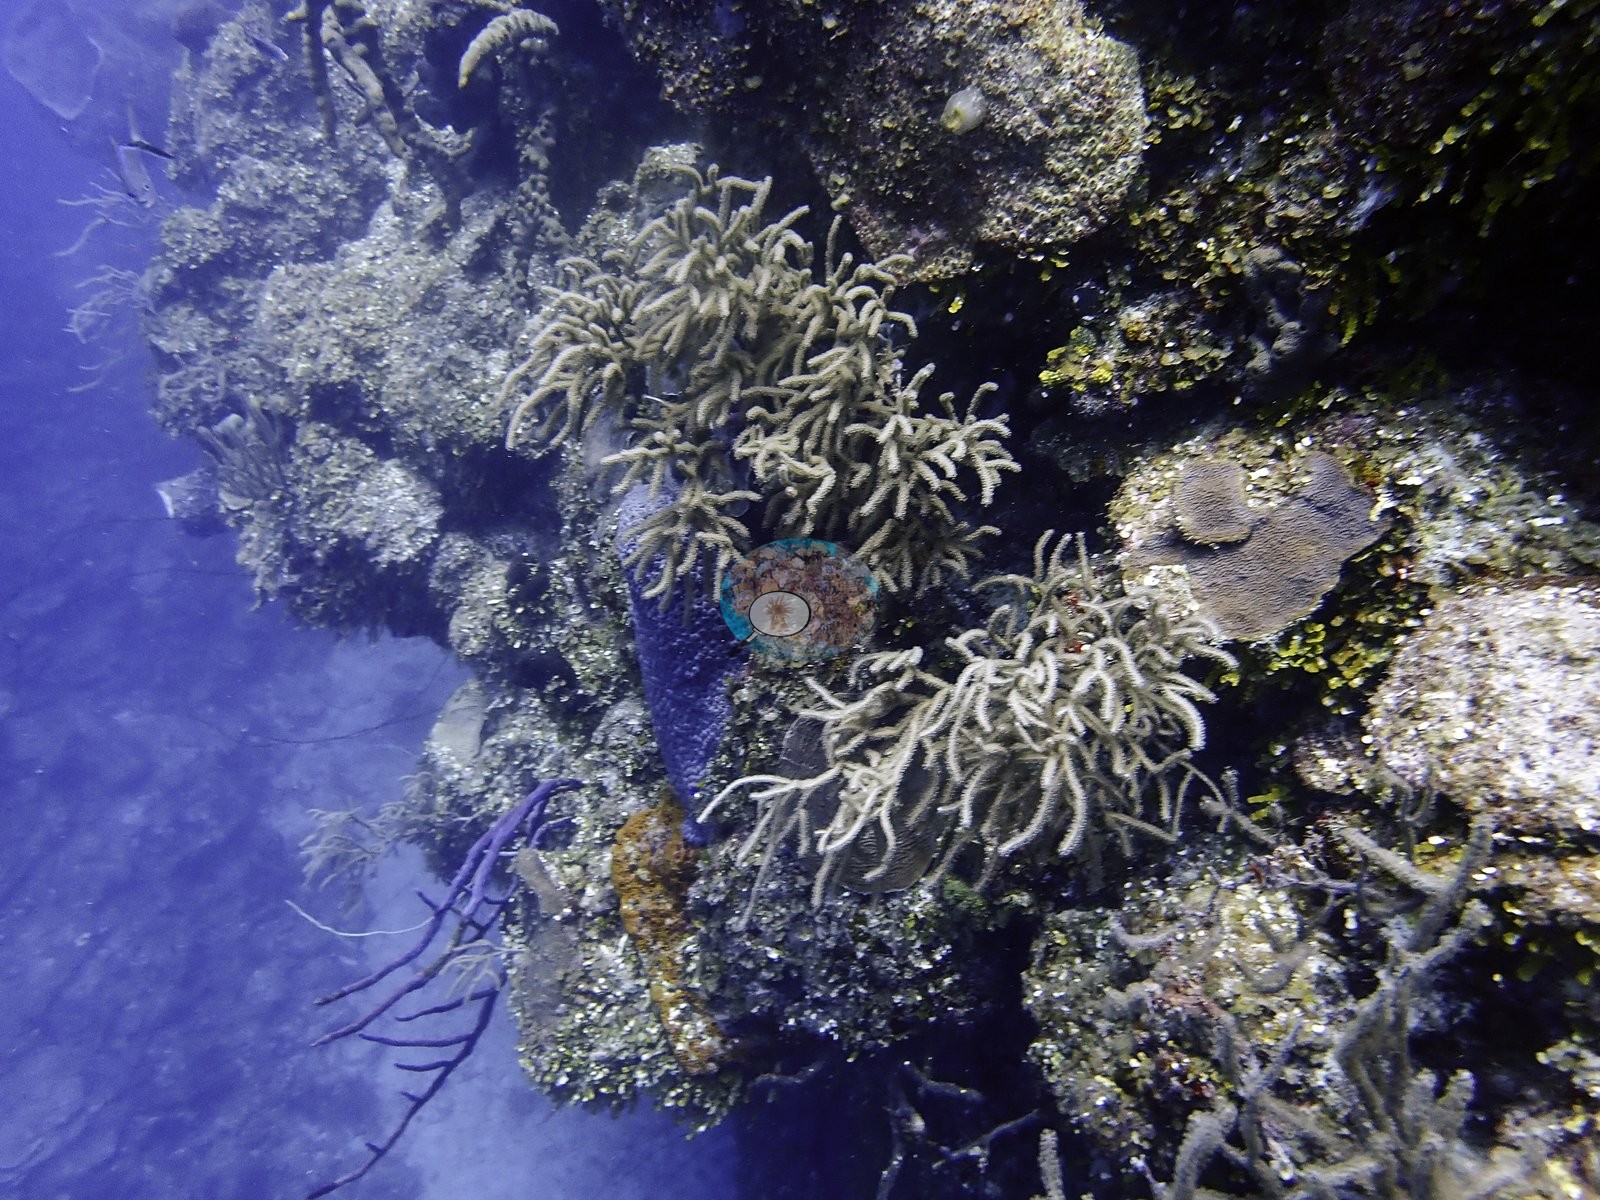
- Coral cover: 8.6% — a blind Claude computer-vision point count of 54 of Anderson's edited photographs (the mean of the two dives' means; 20 points per photo; water, fish, and obstructions excluded). Other computer-vision methods are listed in the method table.
Stressors
No corallivores evident.
Fish and other fauna
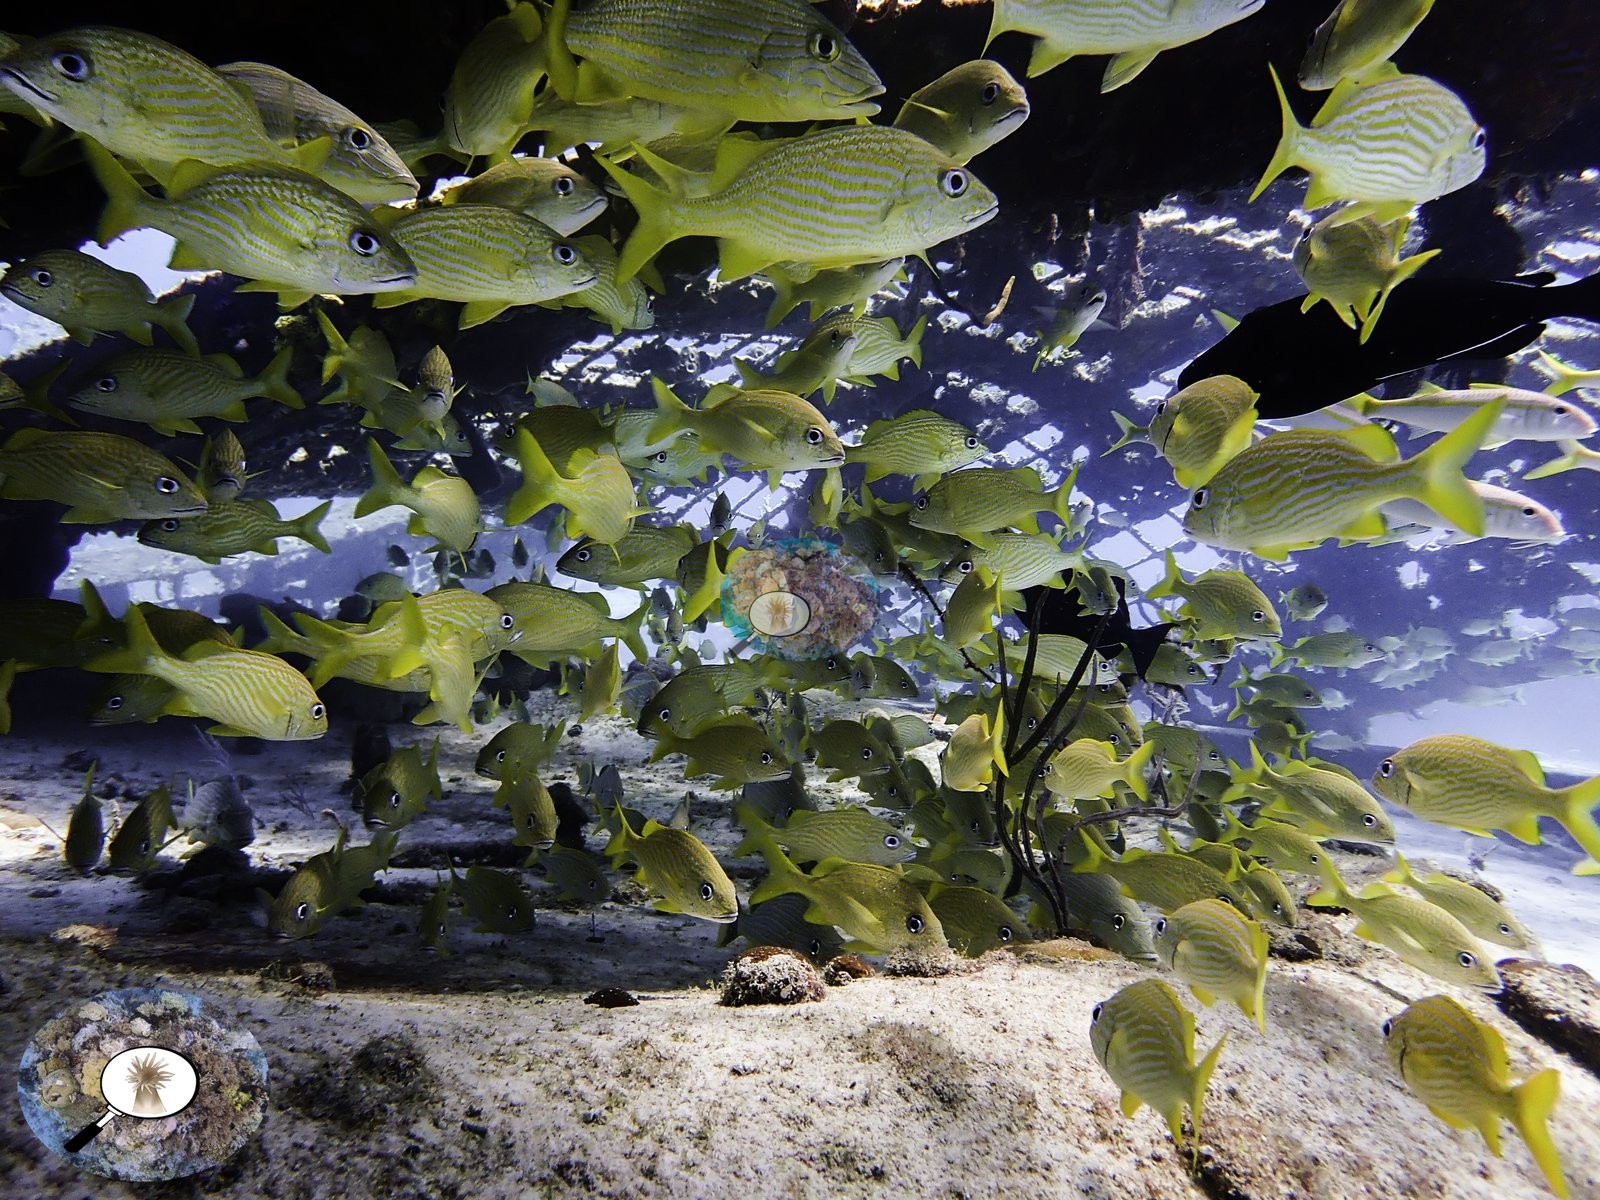
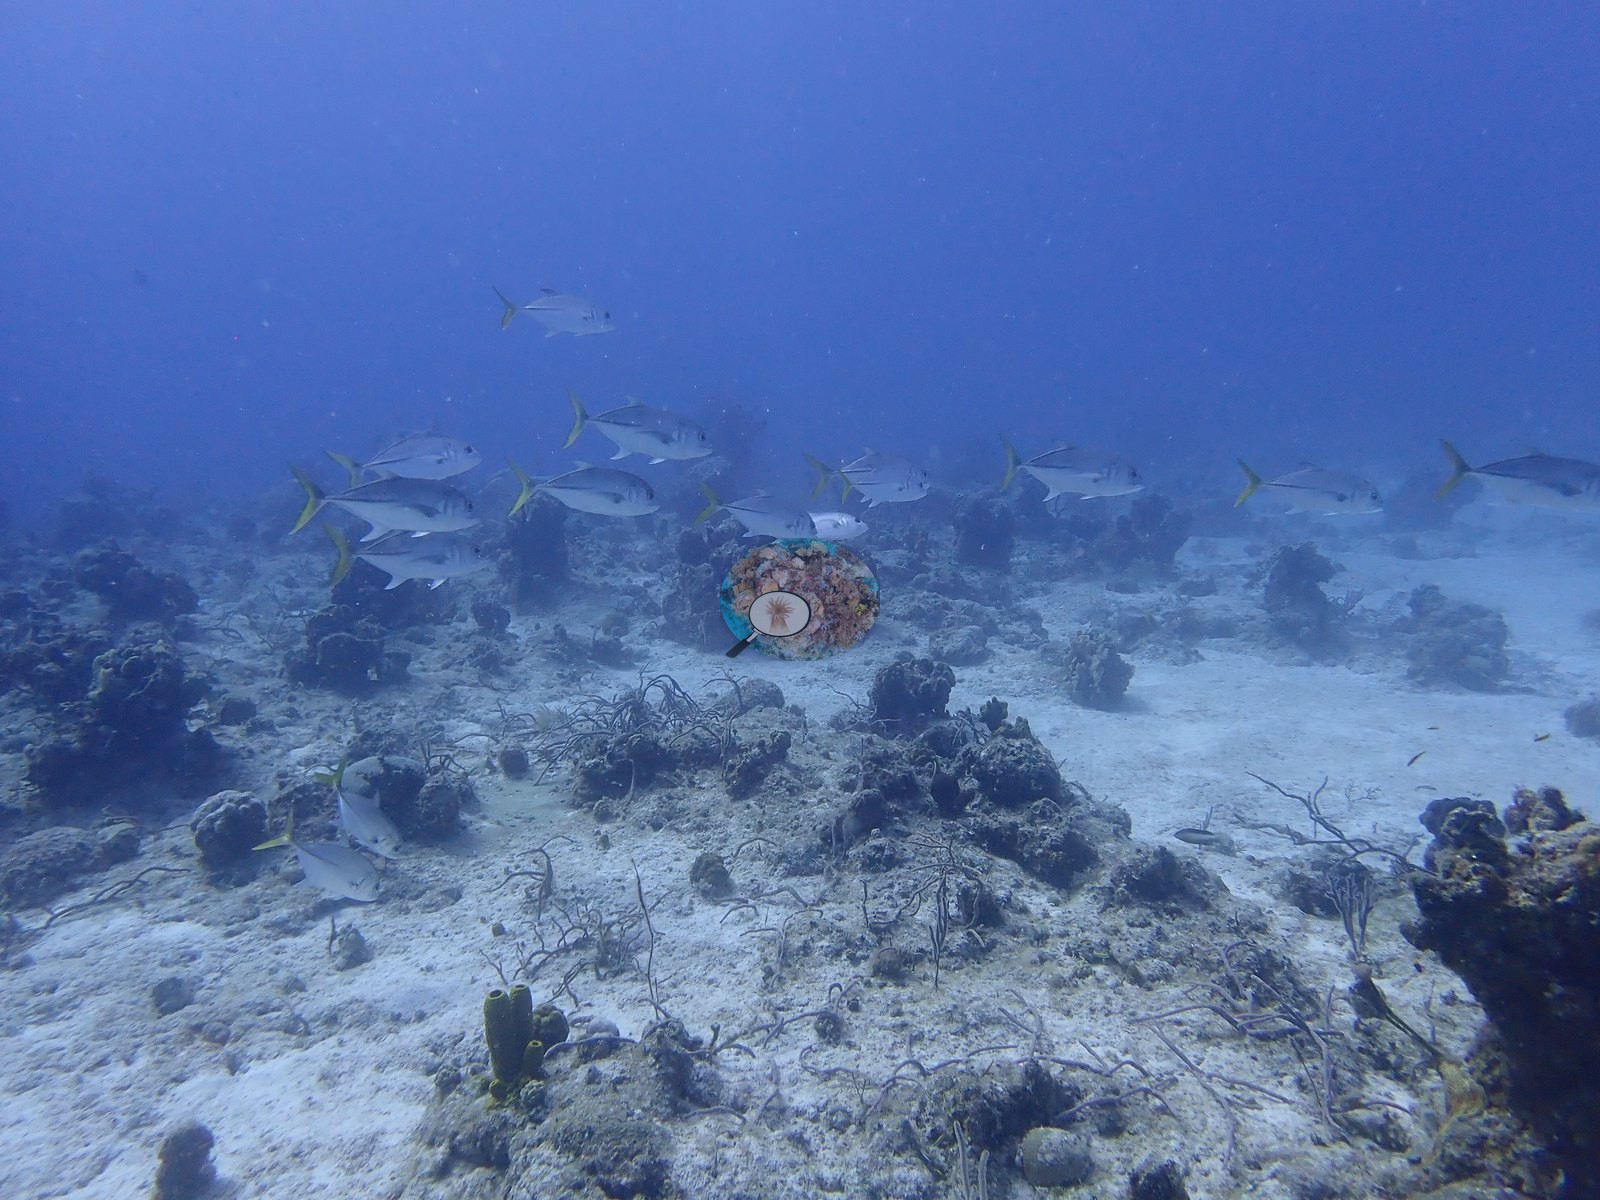
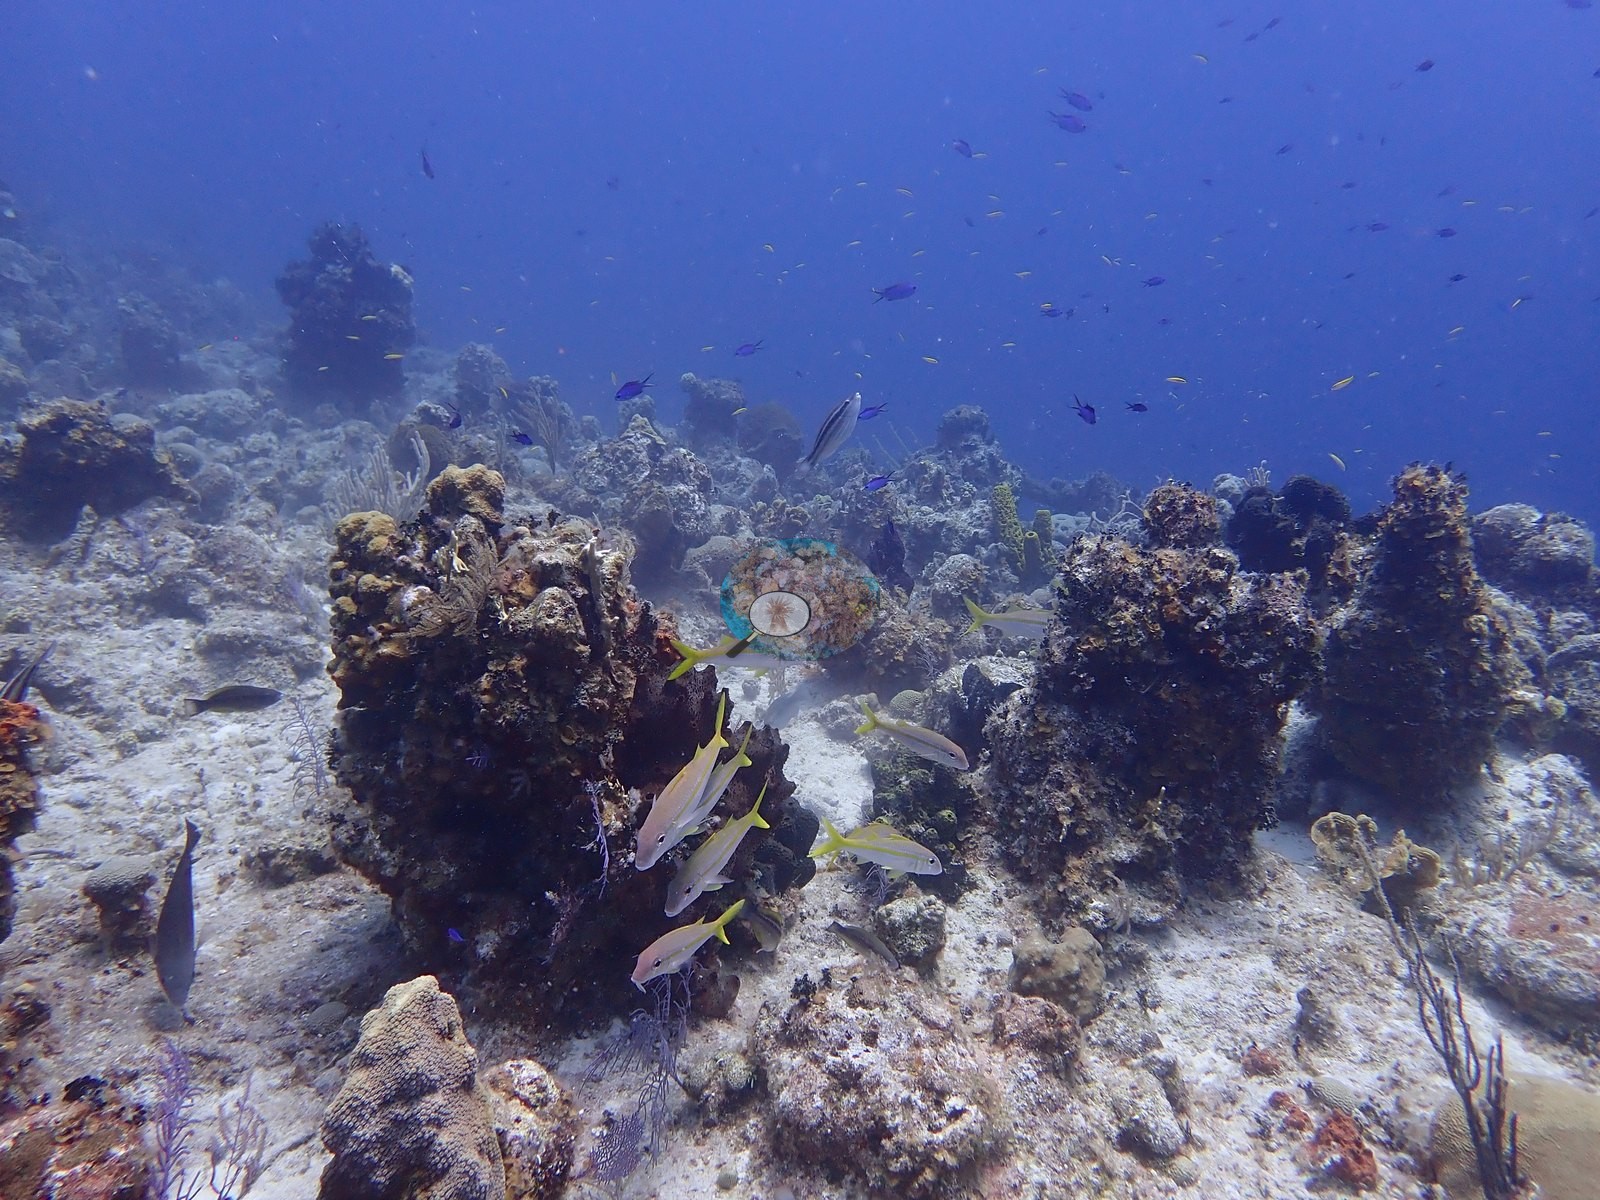
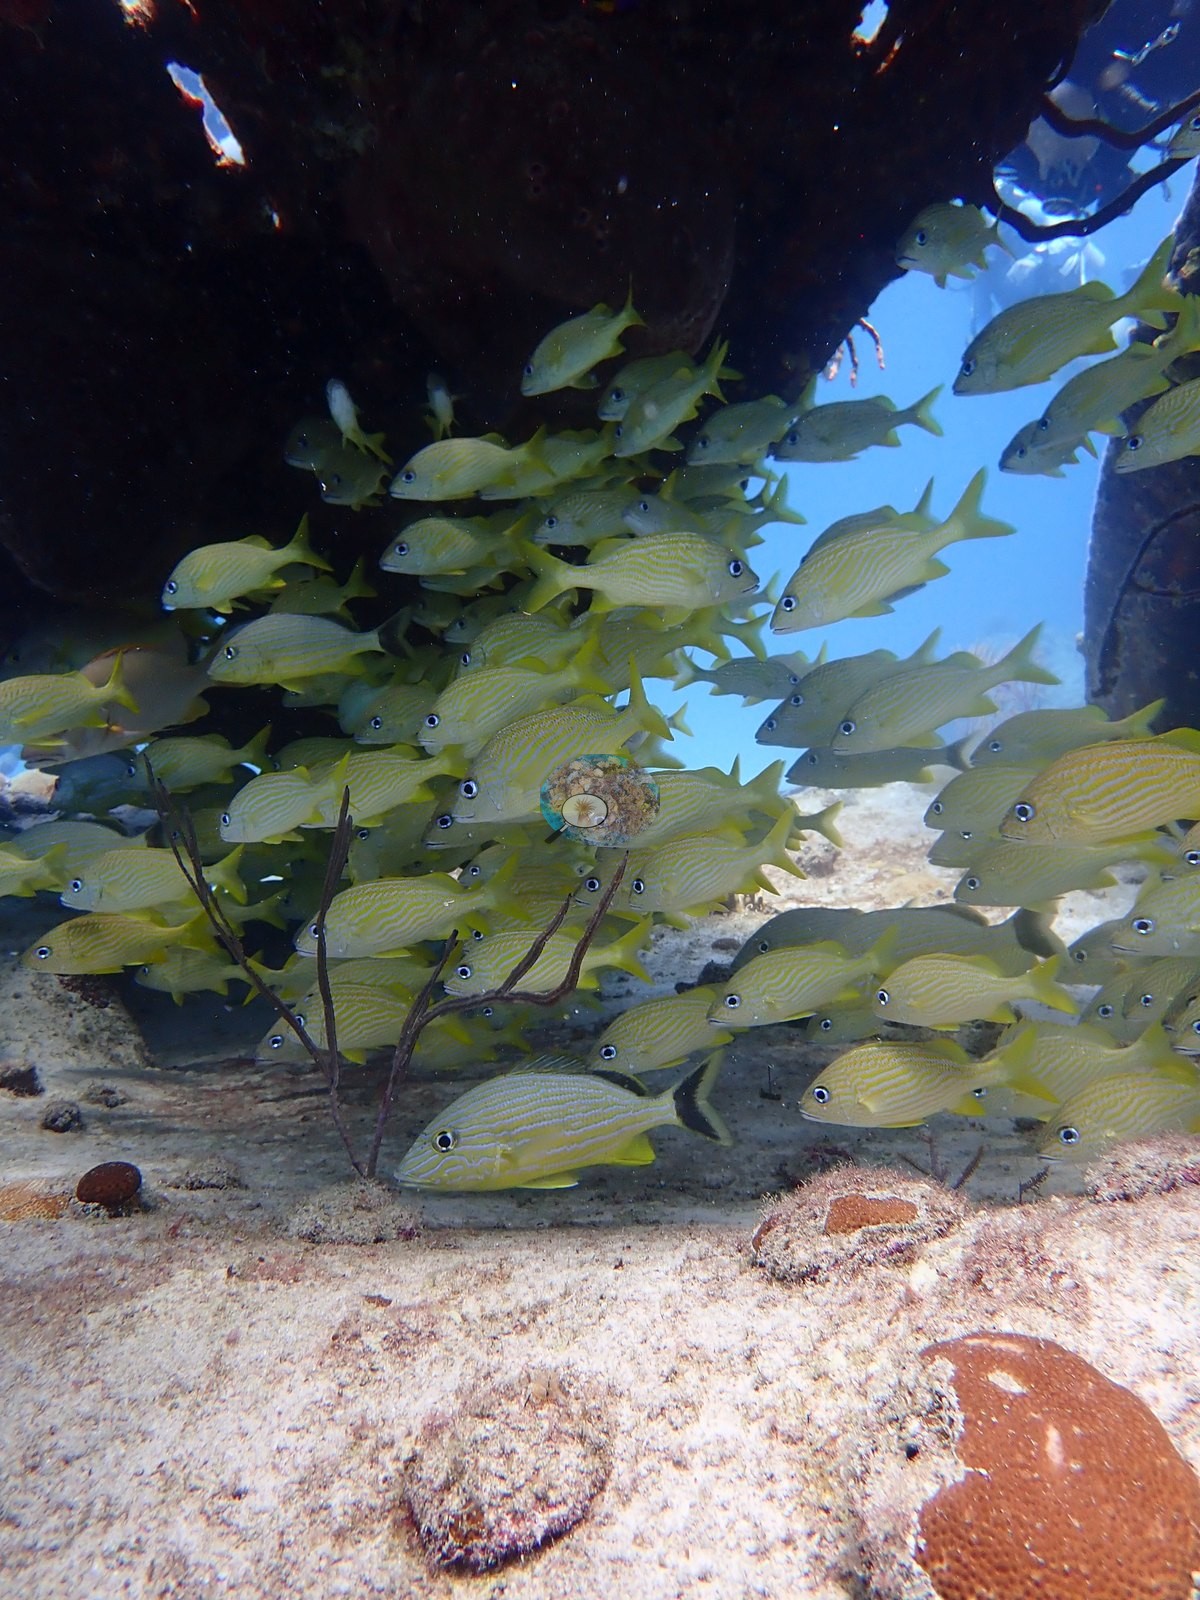
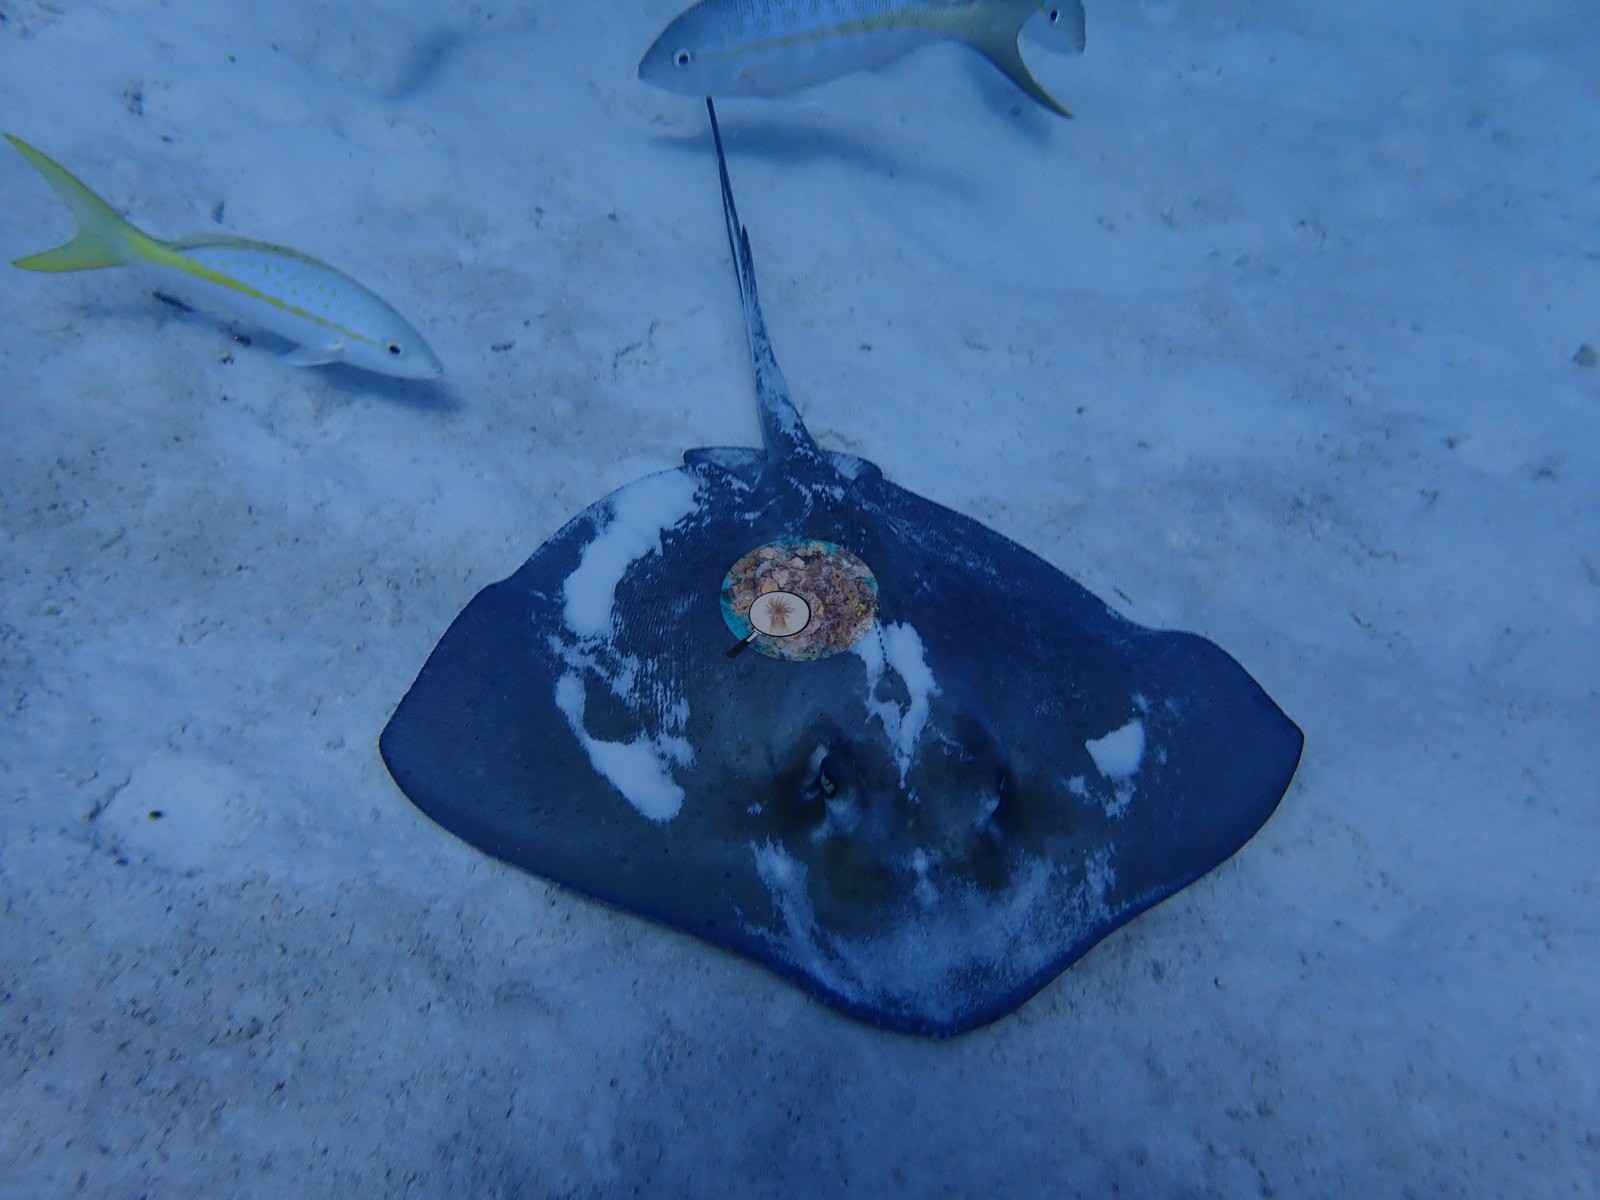
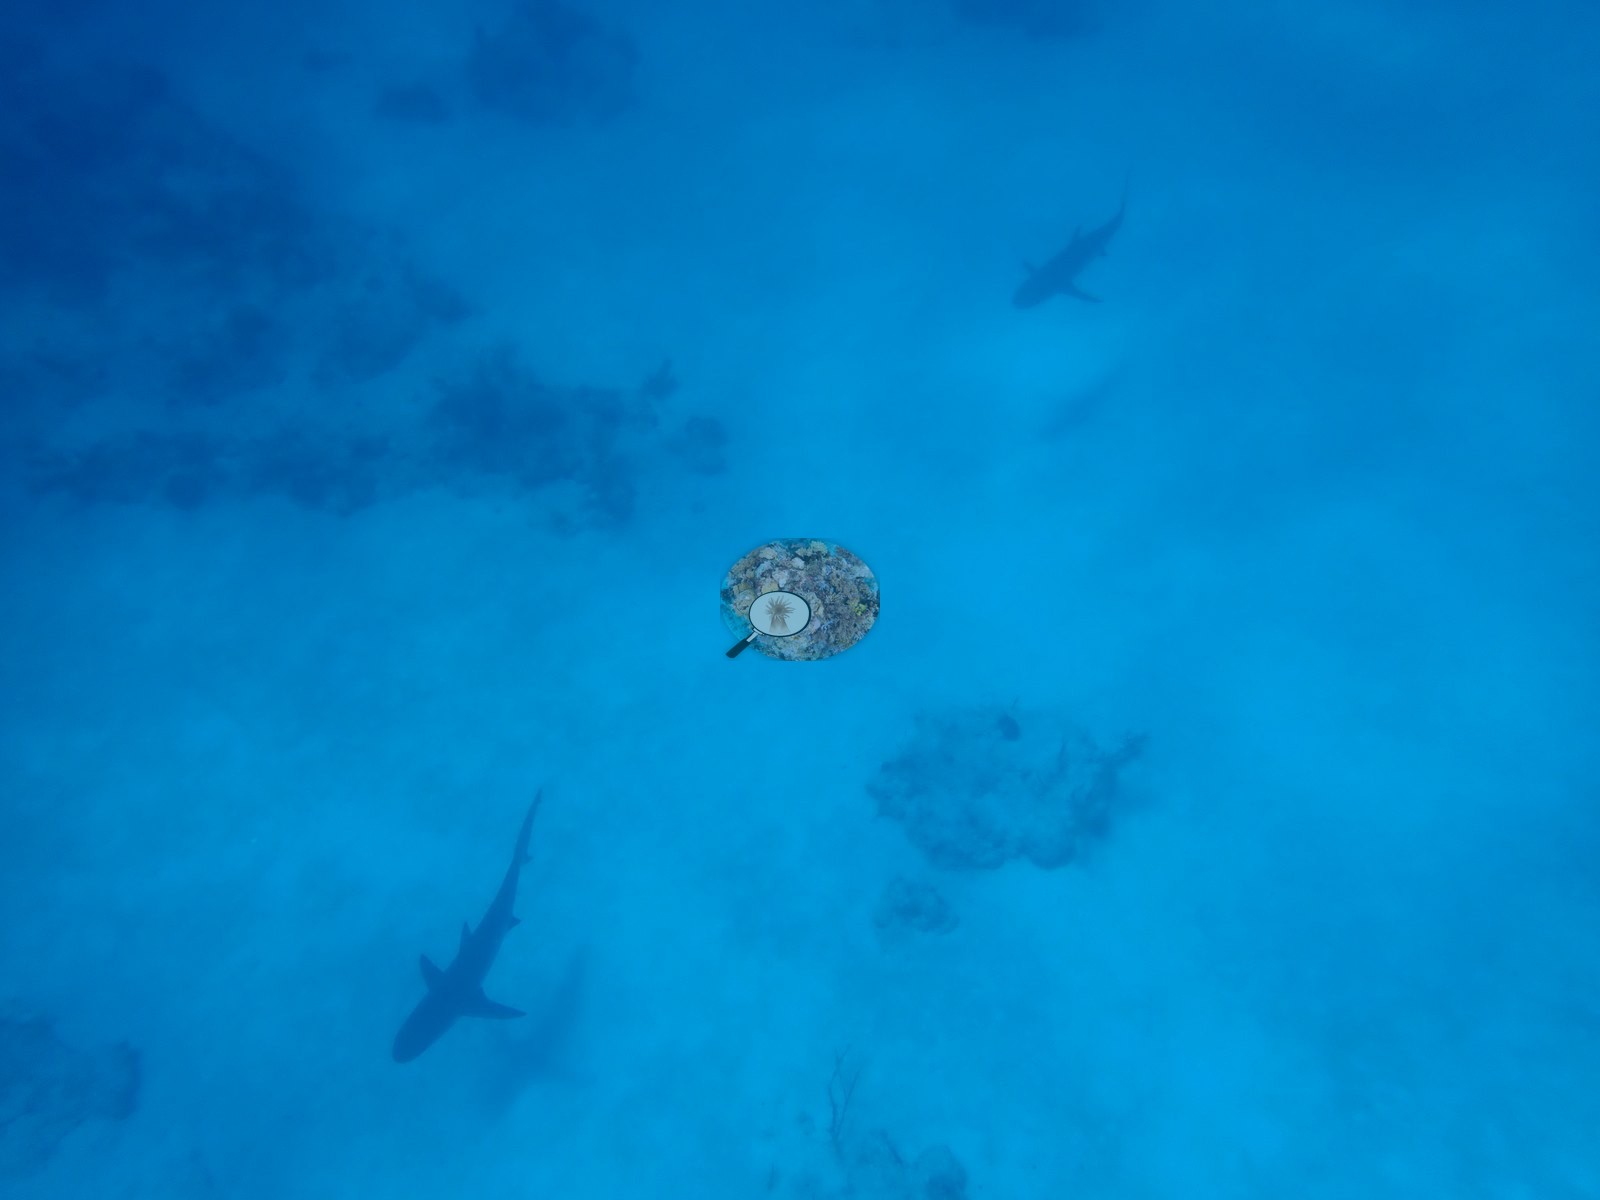
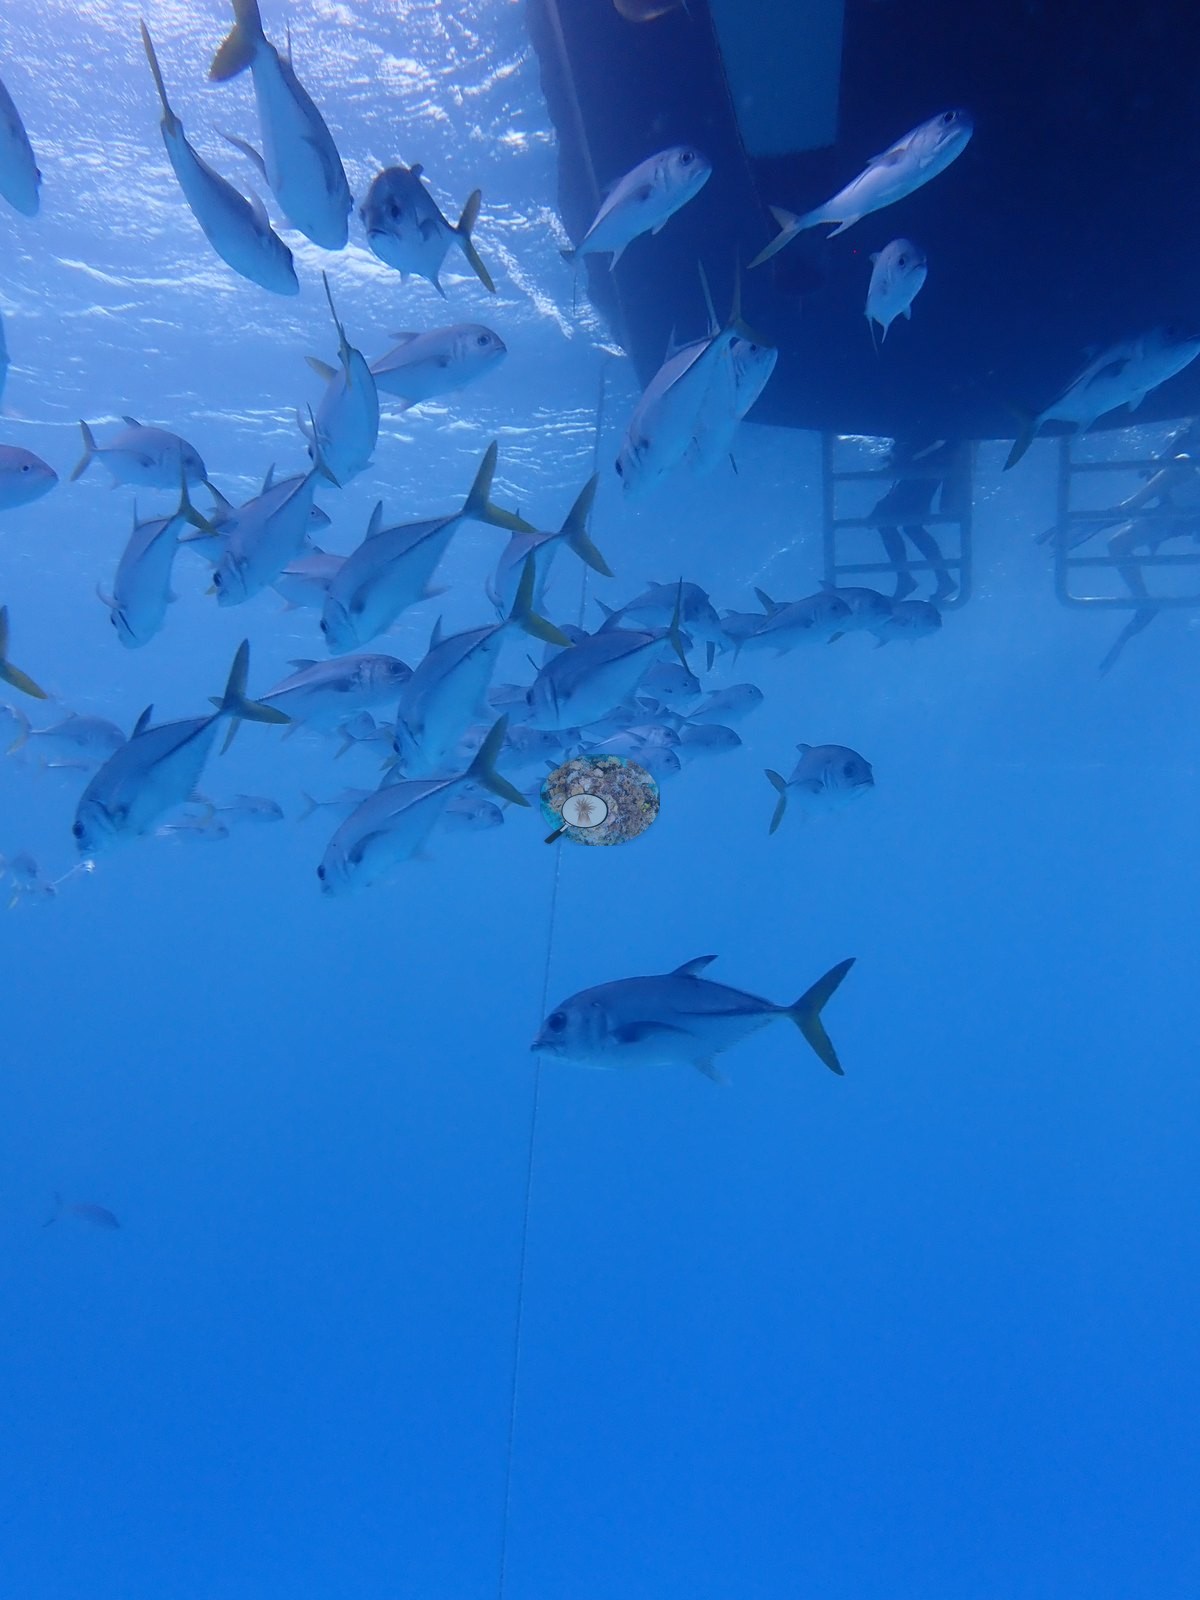
Schooling horse-eye jacks and Caribbean reef sharks circle the structure, making it a popular freediving and night-dive site (e.g., Image 15, Image 42, Image 43, Image 45).
Comparisons with other data
No other surveys have been conducted at this site to date. Within 5 km, five independent stations (Reef Check and XL Catlin Seaview Survey) recorded 2.9–17% hard coral cover between 2005 and 2013; the nearest, Reef Check at Chimney, 0.13 km away, read 6.2% in 2005.
CV model comparison
More info
A few colony-focused photos raise the mean; the median is the typical photo. No computer-vision method yet estimates coral cover accurately on new images, so treat this as indicative rather than a measurement; it is revised as the methods improve.More info
Other rows are for comparison only and are never averaged. No diver transect exists for this trip, so agreement between rows is not accuracy.| Method | Hard-coral cover (%) |
|---|---|
| CoralSCOP edited | 17.3 |
| Claude (edited photos) | 8.6 |
| Reef Check 2005 (same site) | 6.2 |
See a more detailed, stand-alone version of this table.
Dive history
| Date | Time in | Max depth (m) | Bottom time (min) |
|---|---|---|---|
| 2022-08-01 | 14:02 | 29.0 | 62 |
| 2022-08-01 | 16:34 | 25.3 | 64 |
| 2022-08-01 | 20:14 | 12.2 | 49 |
Independent surveys nearby
| Agency / program | Year(s) | Stations / distance | Link |
|---|---|---|---|
| Reef Check | 2005–2007 | 4 stations, 0.13–0.81 km | Records ↓ |
| XL Catlin Seaview Survey | 2013 | 1 station, 0.92 km | Records ↓ |
 Coral Reef Diagnostics
Within 5 km, 5 independent survey stations recorded hard coral cover in 5 records between 2005 and 2013. The most recent nearby survey is from 2013, so these values predate recent heat stress. This site's own estimate (8.6%) sits within the range of these surveys (2.9–17%); the methods differ, so the comparison is context, not a like-for-like test.
Collected by other programs using different methods (Reef Check uses point-intercept transects; the XL Catlin Seaview Survey uses photo-transects with automated image annotation), so these are context for the figures above, not a like-for-like comparison. Where a station was surveyed more than once the range is shown. Station names are not dive-site names.
| Agency | Site / location | Date | Hard coral cover (%) | Distance | Link |
|---|---|---|---|---|---|
| Reef Check | Chimney | 2005 | 6.2% | 0.13 km | — |
| Reef Check | Black Coral Forest | 2005 | 5.6% | 0.55 km | — |
| Reef Check | Eel Garden | 2007 | 17% | 0.31 km | — |
| Reef Check | Shark Hotel | 2007 | 10% | 0.81 km | — |
| XL Catlin Seaview Survey | transect 24044 | 2013 | 2.9% | 0.92 km | doi:10.14264/uql.2019.930 |
Data & links
All images from Coral Reef Diagnostics. Data are from Coral Reef Diagnostics and the organizations named in the data sources above.
© Coral Reef Diagnostics.