
Regional summary of 5 dive sites. Figures are averages across the sites that report them (n = sites with a value); each site's own page has its individual values.
⬇ Download this region as a report card
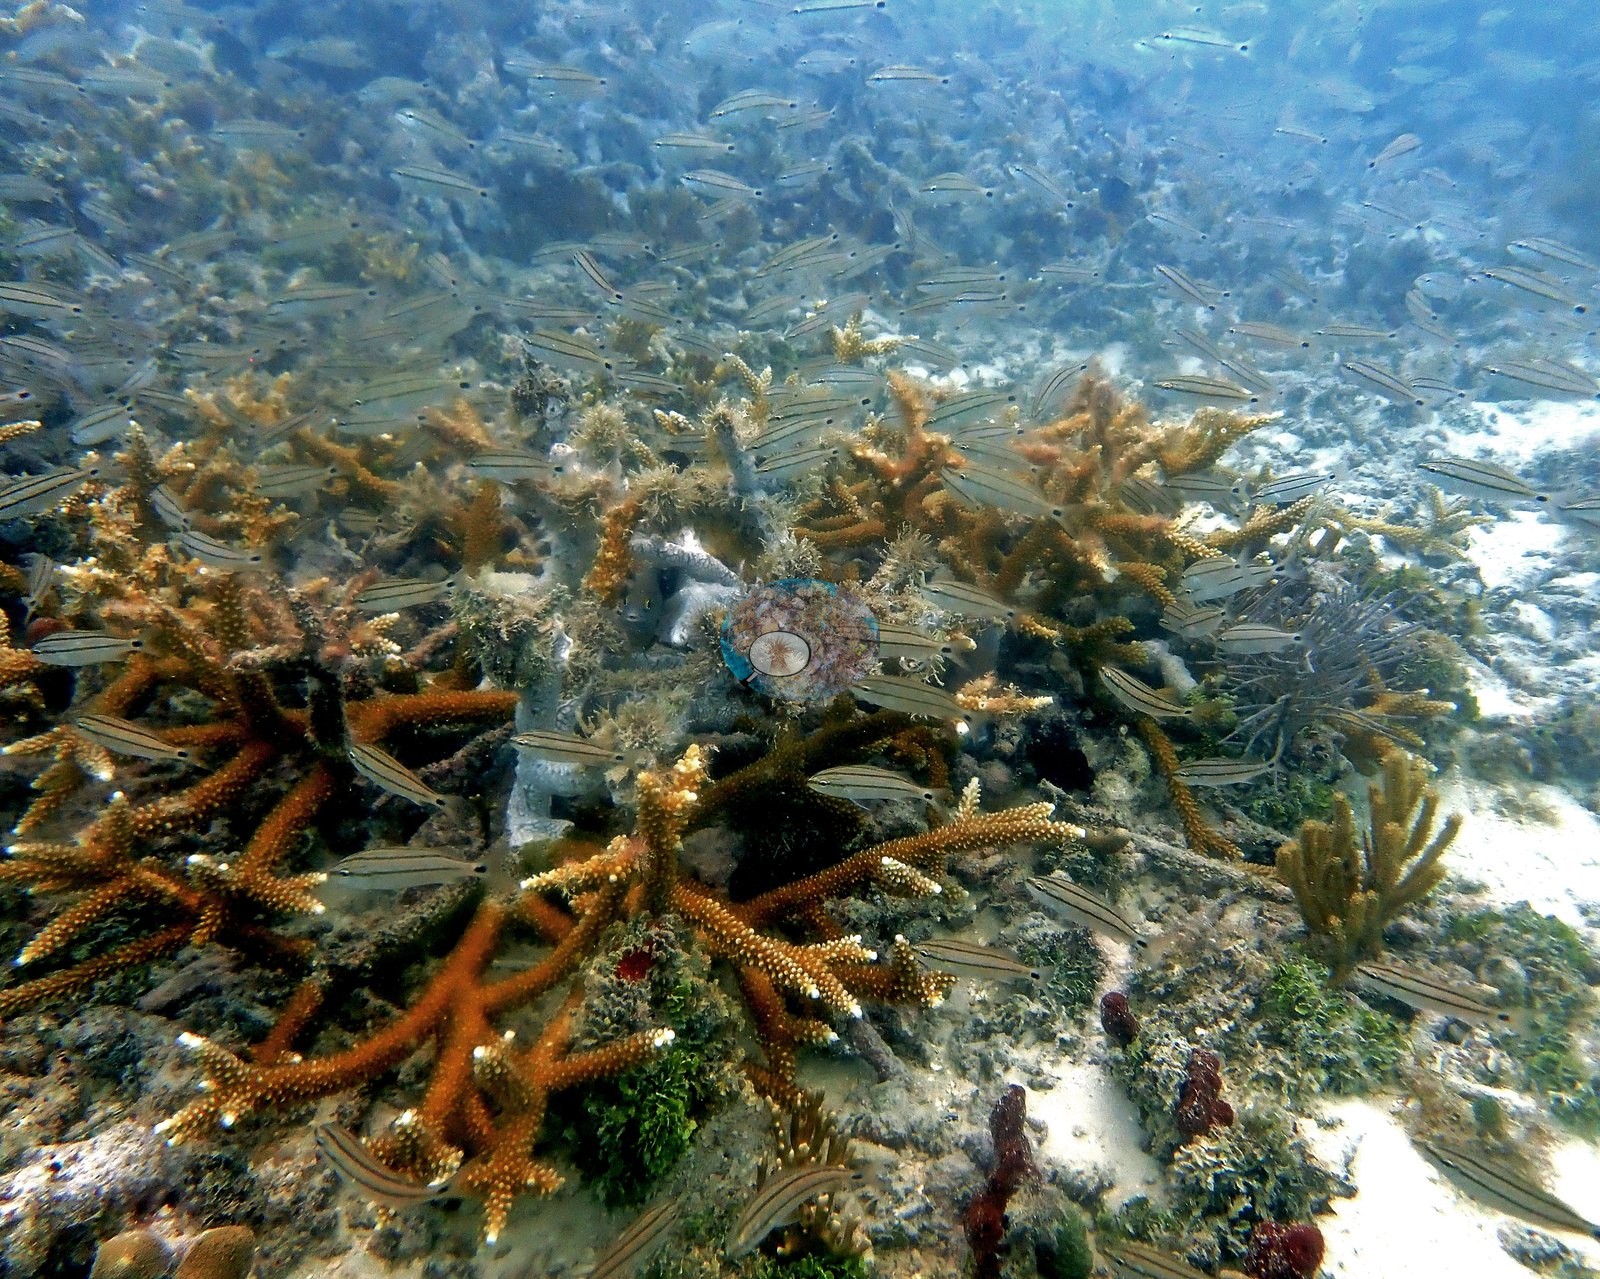

Five Dry Tortugas sites, four of them dived in late June 2021 and the fifth, Pulaski Shoal, visited only to service a temperature recorder, range from White Shoal's continuous staghorn thickets to deeper, cooler hard-bottom with scattered coral heads. Hard coral is sparse overall: the 2021 FWC Dry Tortugas CREMP station means nearest the four dived sites read 3.3% to 12%.
Heat stress
Long-term record: 9 years from 1985 through 2025 reached 8 or more °C-weeks at NOAA’s Florida Keys station. Download the annual DHW data (CSV).
5 sites in this region — click a marker to open that site.
Regional setting
The Dry Tortugas, about 116 km west of Key West, form a pseudo-atoll of seven keys on three main banks, Pulaski, Loggerhead, and Long Key, which ring a lagoon 12–23 m deep; roughly 100 km of open water separates them from the main Florida reef tract (Wells 1988). When the reefs were mapped in 1976, living reef occupied under 4% of the seafloor shallower than 18 m. Bank reef, confined to a narrow band on the southeastern edges of Long Key and Pulaski Banks, accounted for a mere 0.6% of the complex and had almost no Acropora palmata. Staghorn (A. cervicornis) reef covered 478 ha and supplied 55% of stony coral cover, mostly in one 220 ha reef northwest of Loggerhead Shoal, and coral-head buttresses of Montastraea annularis and Siderastrea siderea lined Pulaski Shoal. Research here is long-standing: the Carnegie Institution's laboratory on Loggerhead Key operated from 1904 until fire destroyed it in 1937. Wells (1988) ranks the Tortugas, far from mainland runoff, among the western Atlantic's least-disturbed reefs, but winter cold fronts periodically chill the shallows to lethal levels: a "black water" event killed nearly all staghorn in 1878, and a front in 1976–77 killed about 90% of its colonies, while the 44 ha elkhorn stand mapped on the Long Key reef crest in 1881 had been reduced to rubble by 1976. Spalding et al. (2001) give about 1,250 km² of coral reef for the USA's Atlantic sector as a whole, a figure that includes the Tortugas.
Souter et al. (2021) report recent trends only for their Gulf of Mexico and Florida subregion, where mean hard coral cover slid steadily from about 13% (1999) to 9.1% (2019), and algal cover, after dipping to 16.9% in 2005, rose about 2.3-fold to 39% by 2015. The same report records that stony coral tissue loss disease (SCTLD) emerged in Florida in 2014, during a severe bleaching event and beside a dredging project on an urban reef, and calls it the deadliest disturbance on record in the Caribbean, with population losses above 90% in the most susceptible species. Earlier, Spalding et al. (2001) noted that bleaching in 1997 and the more intense bleaching of 1998, followed by Hurricane Georges, caused considerable coral loss in Florida's shallow reefs. Wilkinson (2006), drawing on the 2004 status report for the American Caribbean, described heavy losses from disease, bleaching, and human damage in the 1980s and 1990s that seemed to have leveled off at much lower cover.
Overview
The five Dry Tortugas sites are NOAA monitoring locations visited during the AOML climate-monitoring leg of late June 2021, with logged dives on 25-28 June. Logged maximum depths were 14.3 m at White Shoal (6.1 m average), 22.6 m at Bird Key Reef, 17.1 m at Texas Reef, and 25.6 m at Black Coral Rock, with Pulaski Shoal, near the park's northeastern boundary, a long-term USGS and NOAA location for tracking staghorn coral.
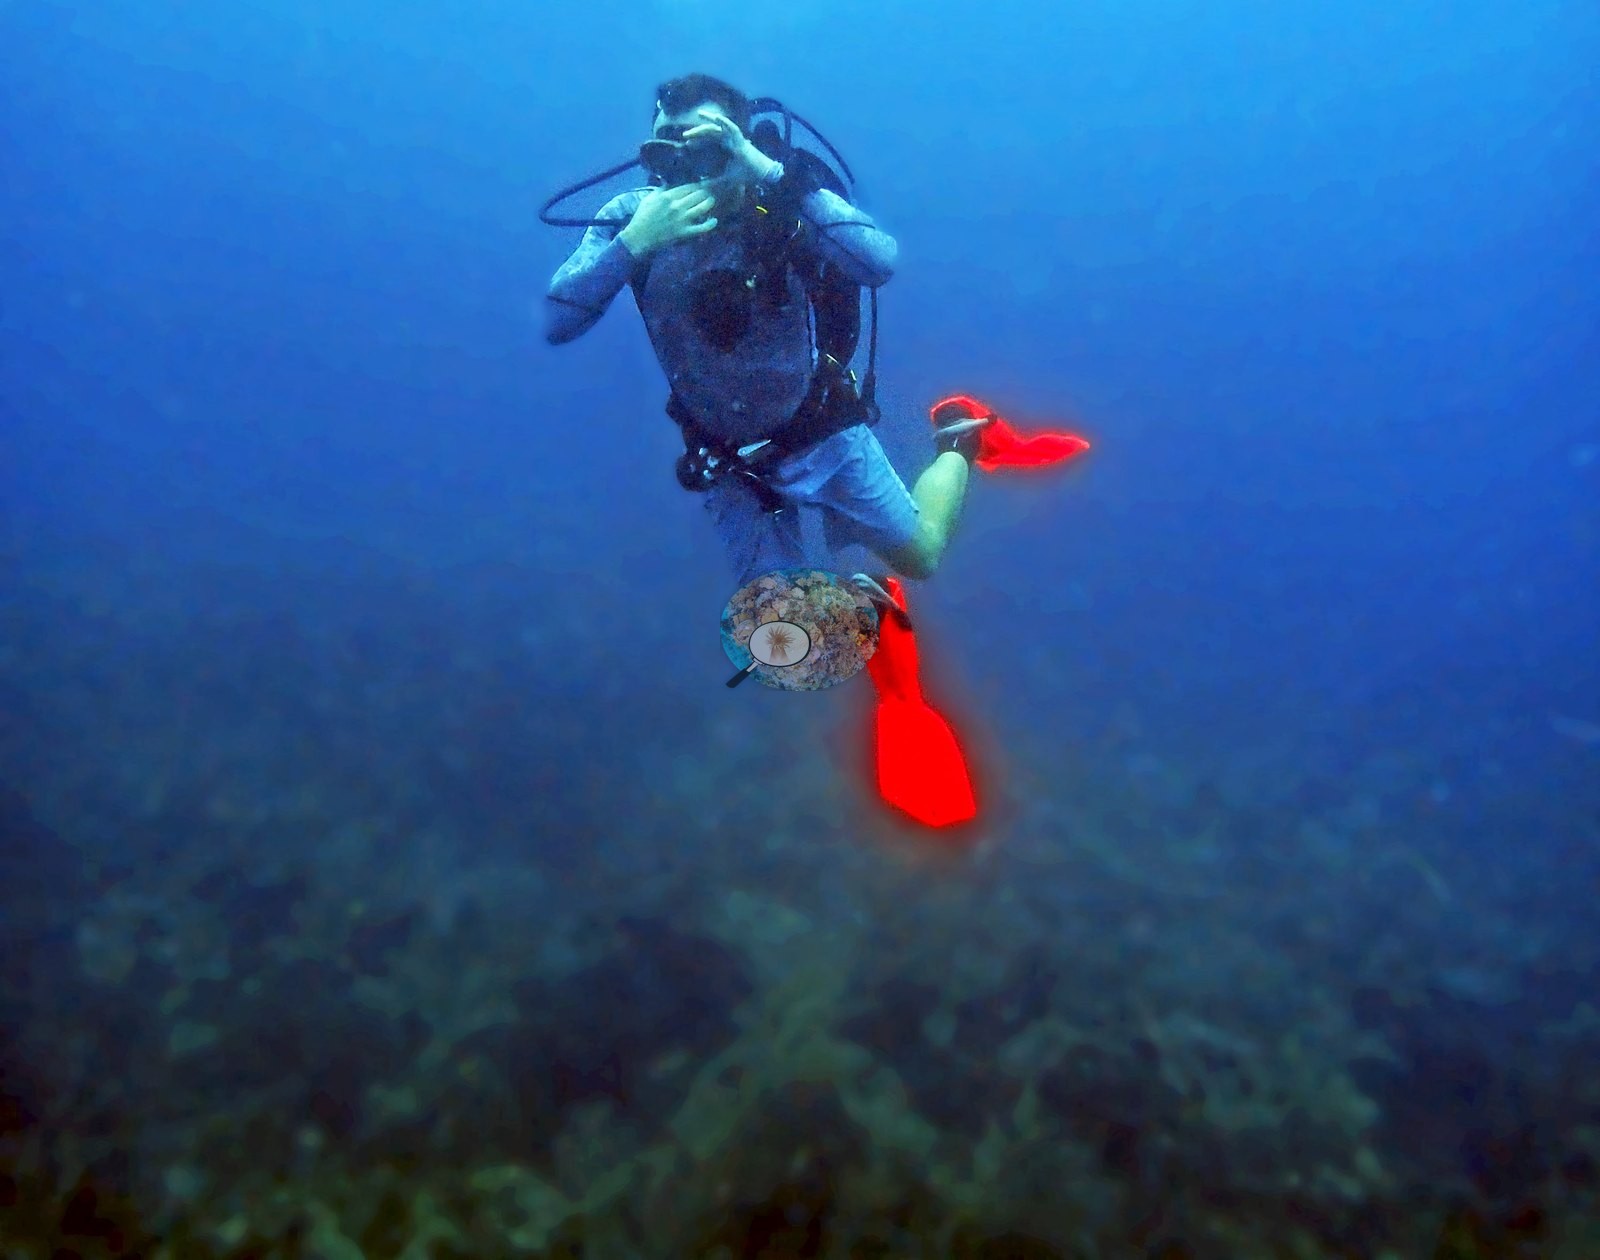
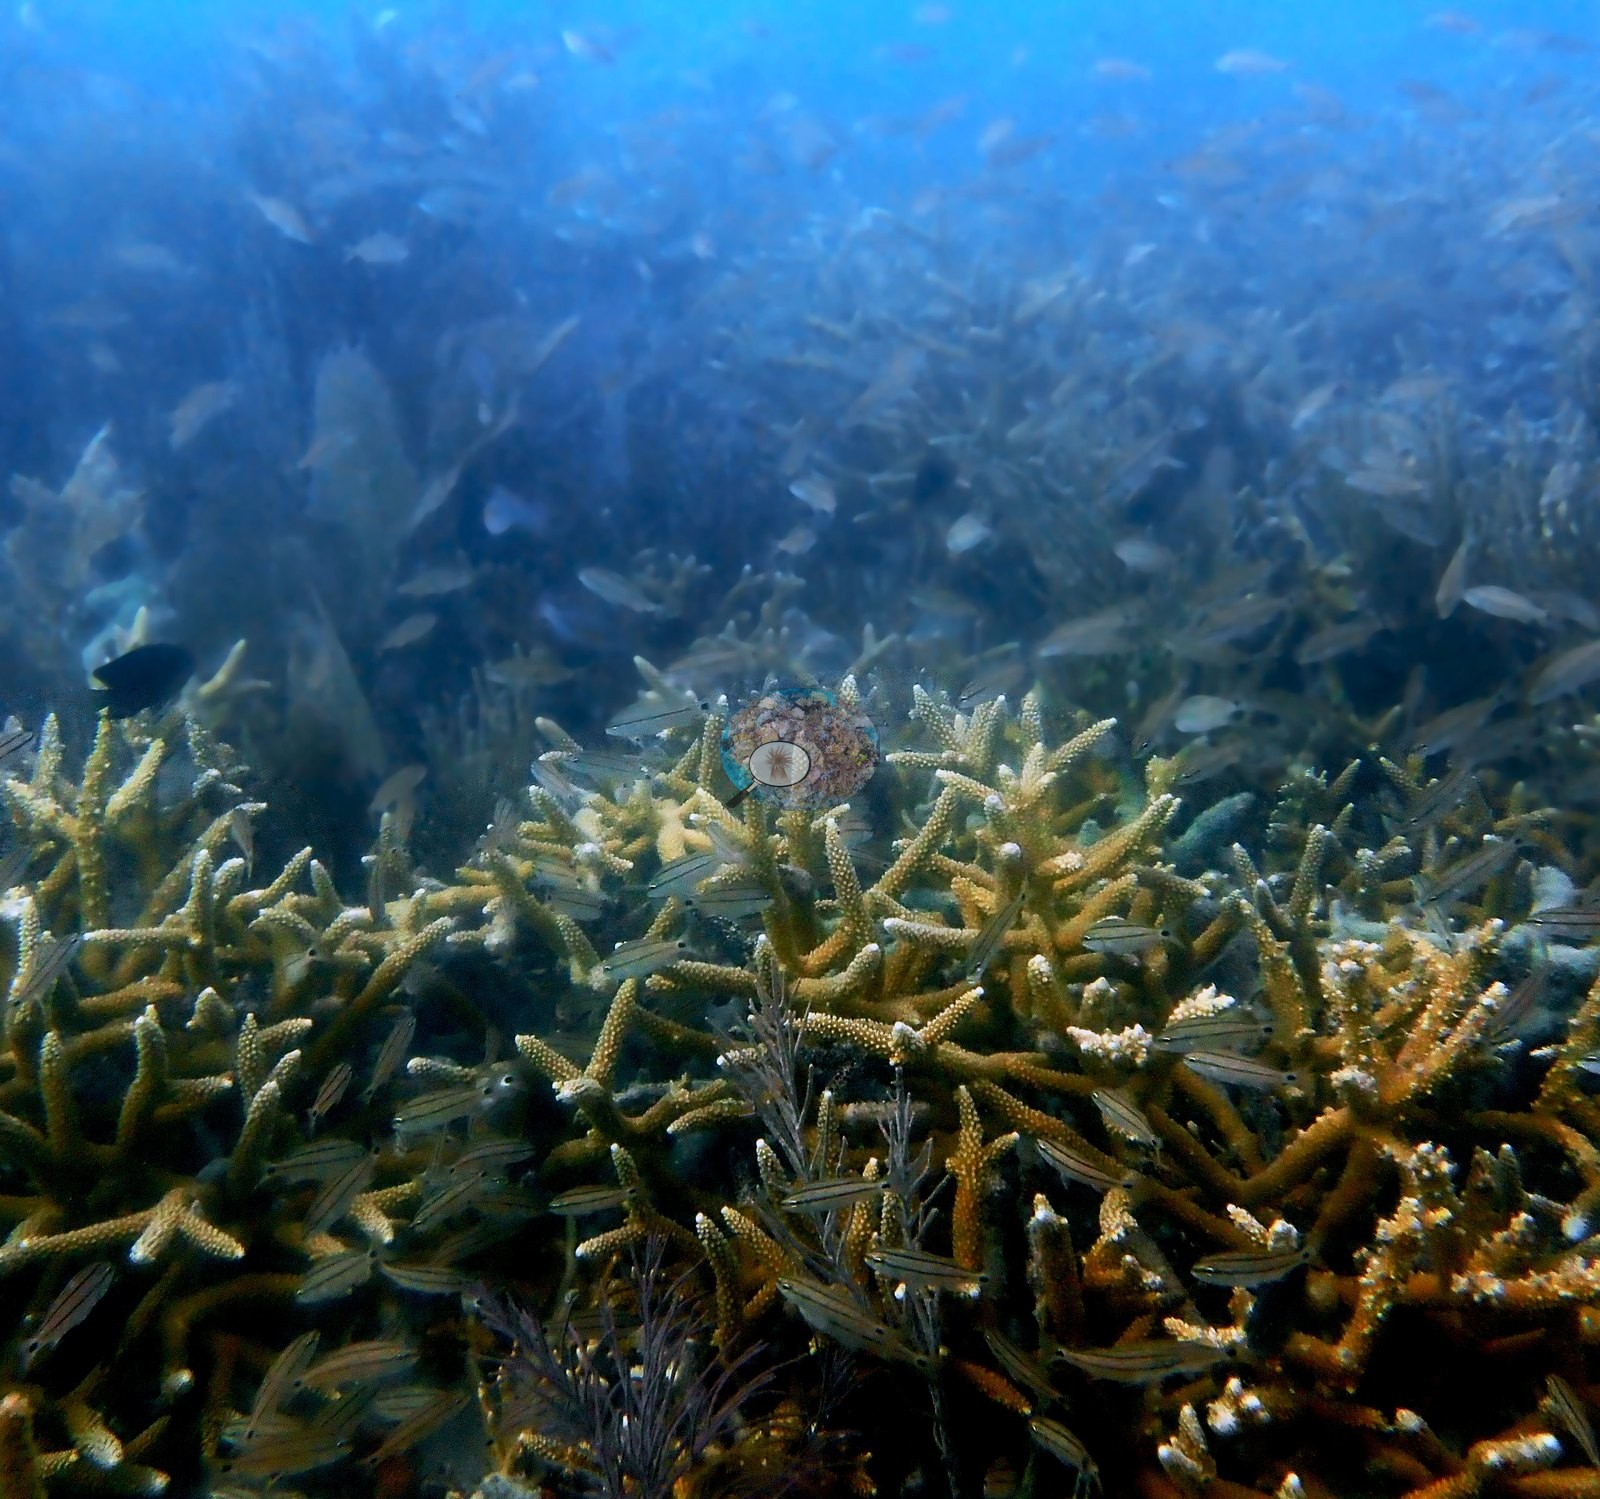
The stations differ sharply in character. White Shoal is carpeted in continuous thickets of staghorn, Acropora cervicornis, on a shallow rubble bottom, with mounding heads, brain corals, and gorgonians filling the gaps. Bird Key Reef is a gorgonian-draped hard-bottom instrumented with pH, light, and current sensors, where well-spaced massive heads, including Montastraea cavernosa and Orbicella faveolata, rise from stands of orange gorgonians. Black Coral Rock (logged to 25.6 m, 28.3°C dive average) is a low-relief rubble-and-turf bottom with scattered brain corals and mounding heads and far more fish than coral. Texas Reef, not one of the fixed stations, is a low rocky hard-bottom threaded with small swim-throughs, with scattered coral domes and tube sponges. Pulaski Shoal's surroundings are described as rubble, carbonate sand, seagrass, and remnant reef.
Hard coral is sparse across the group. The FWC-FWRI Dry Tortugas CREMP point counts of 2021, the year of these visits, read 3.3% at White Shoal, 6.8% at Texas Reef, 7.8% at Bird Key Reef, and 12% at Black Coral Rock, where the four stations ranged from 9.5% to 17%; the NOAA NCRMP station 0.58 km from Pulaski Shoal recorded no stony coral in September 2021. Shallow-station temperatures ran from the low 20s to nearly 32°C. Black Coral Rock has a Coral Health Index of 0.75 (0-5 scale). At Bird Key Reef one Siderastrea head showed white patches of tissue loss, and on 27 June at least two more massive colonies carried tissue-loss fronts consistent with stony coral tissue loss disease (SCTLD), beside a recently dead colony; Black Coral Rock had one more SCTLD-consistent front. The Pulaski Shoal site record also notes published USGS work documenting severe heat stress and loss of elkhorn coral, Acropora palmata, across the Dry Tortugas in the 2023 marine heatwave, two years after these visits.
Highlights
- White Shoal: continuous thickets of staghorn, Acropora cervicornis, on shallow rubble
- Bird Key Reef: an instrumented NOAA station with massive Montastraea cavernosa and Orbicella faveolata heads among gorgonians
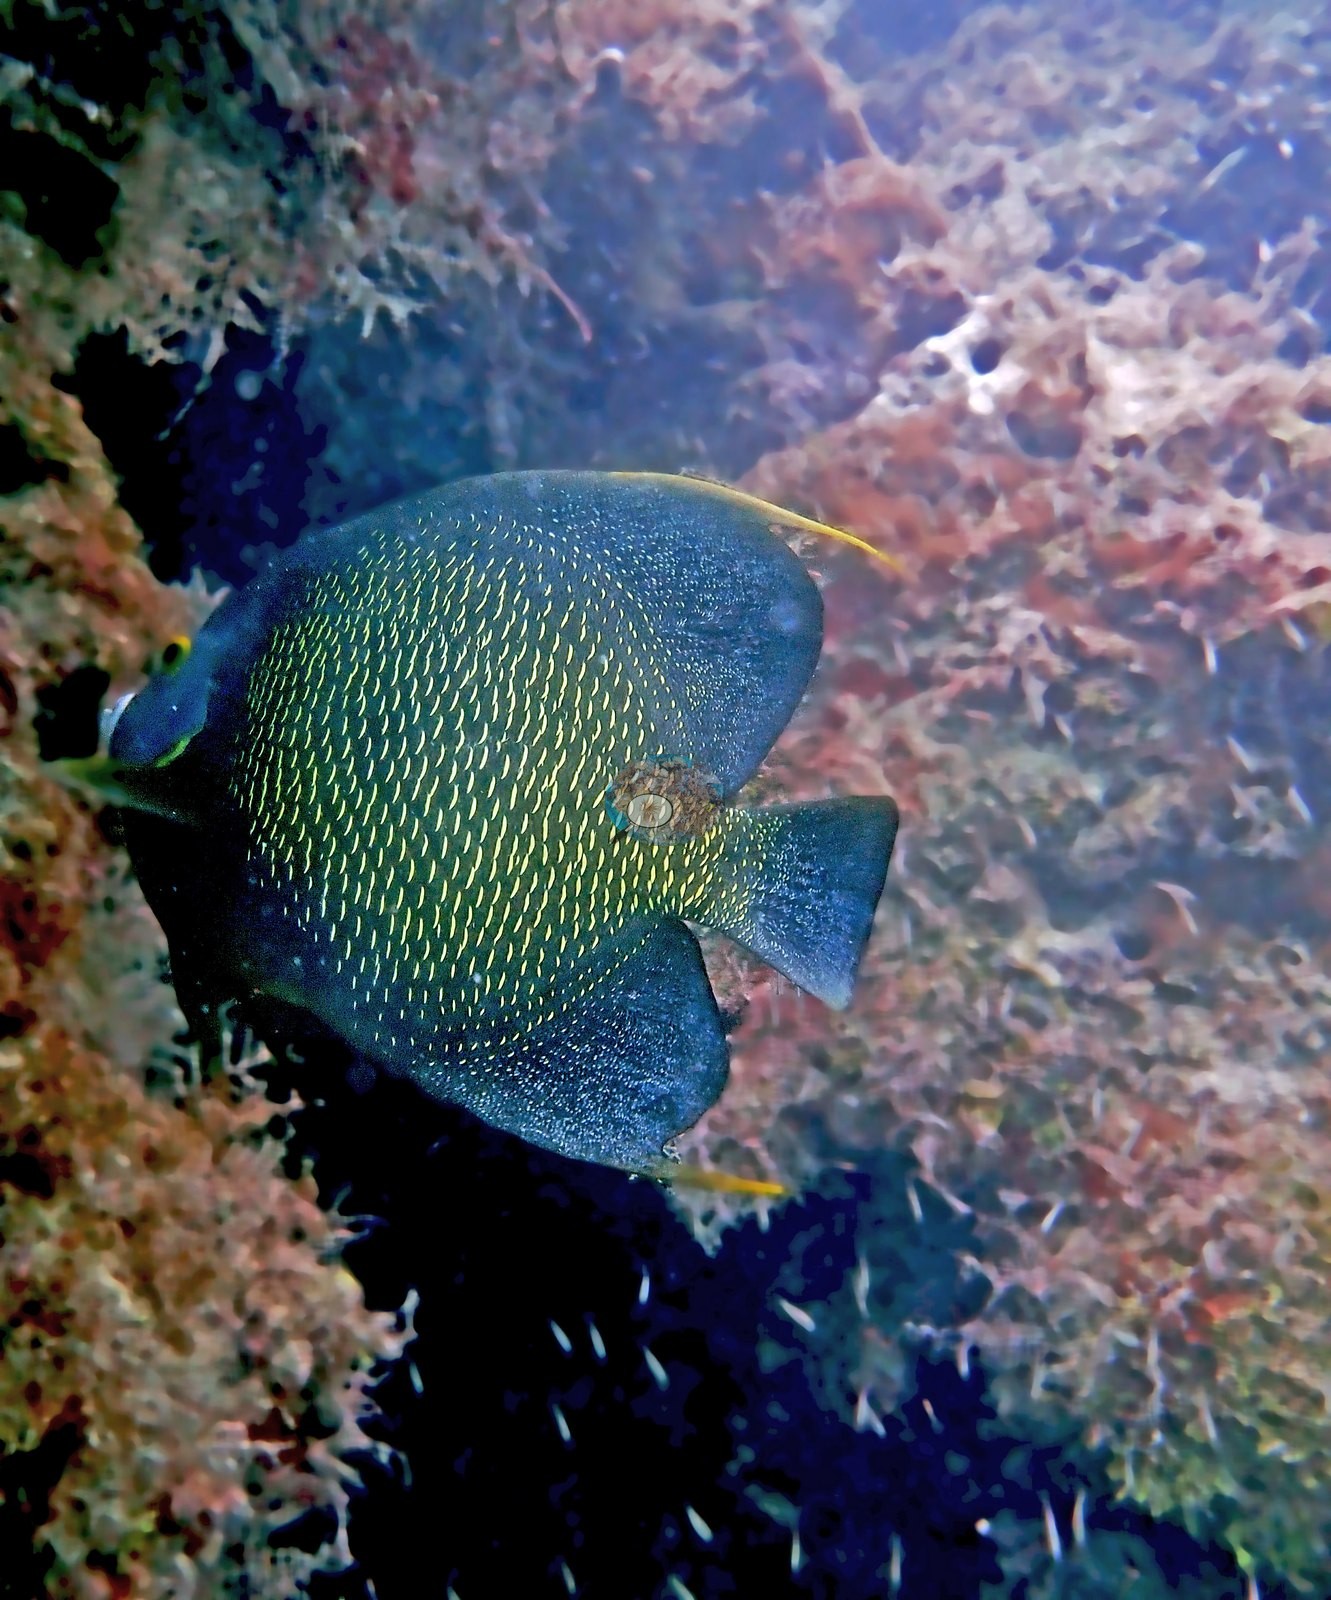
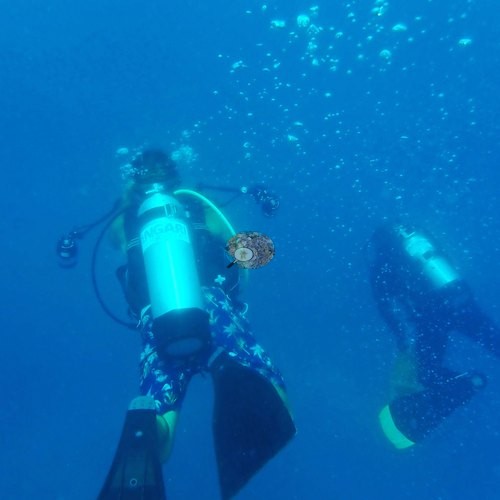 photo: NOAA - Bird Key Reef, Dry Tortugas
- Texas Reef: a low rocky hard-bottom threaded with small swim-throughs, scattered coral domes, and tube sponges
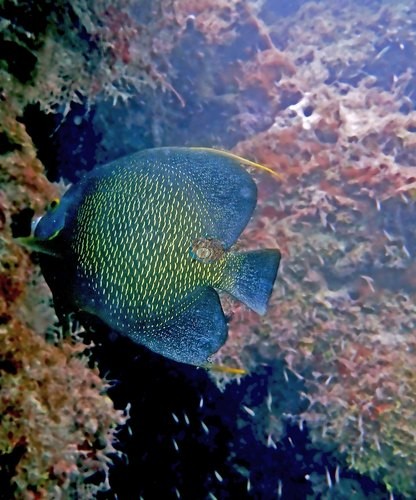 photo: NOAA - Texas Reef, Dry Tortugas
- Black Coral Rock (25.6 m): a NOAA temperature-logger station with a Coral Health Index of 0.75 (0-5 scale)
- 2021 FWC-FWRI CREMP point counts read 3.3% at White Shoal to 12% at Black Coral Rock; the NCRMP station nearest Pulaski Shoal recorded no stony coral
Notable observations
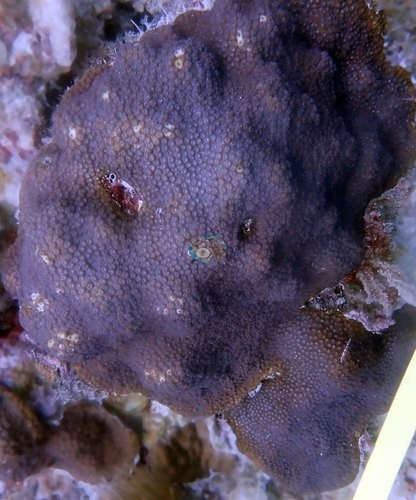
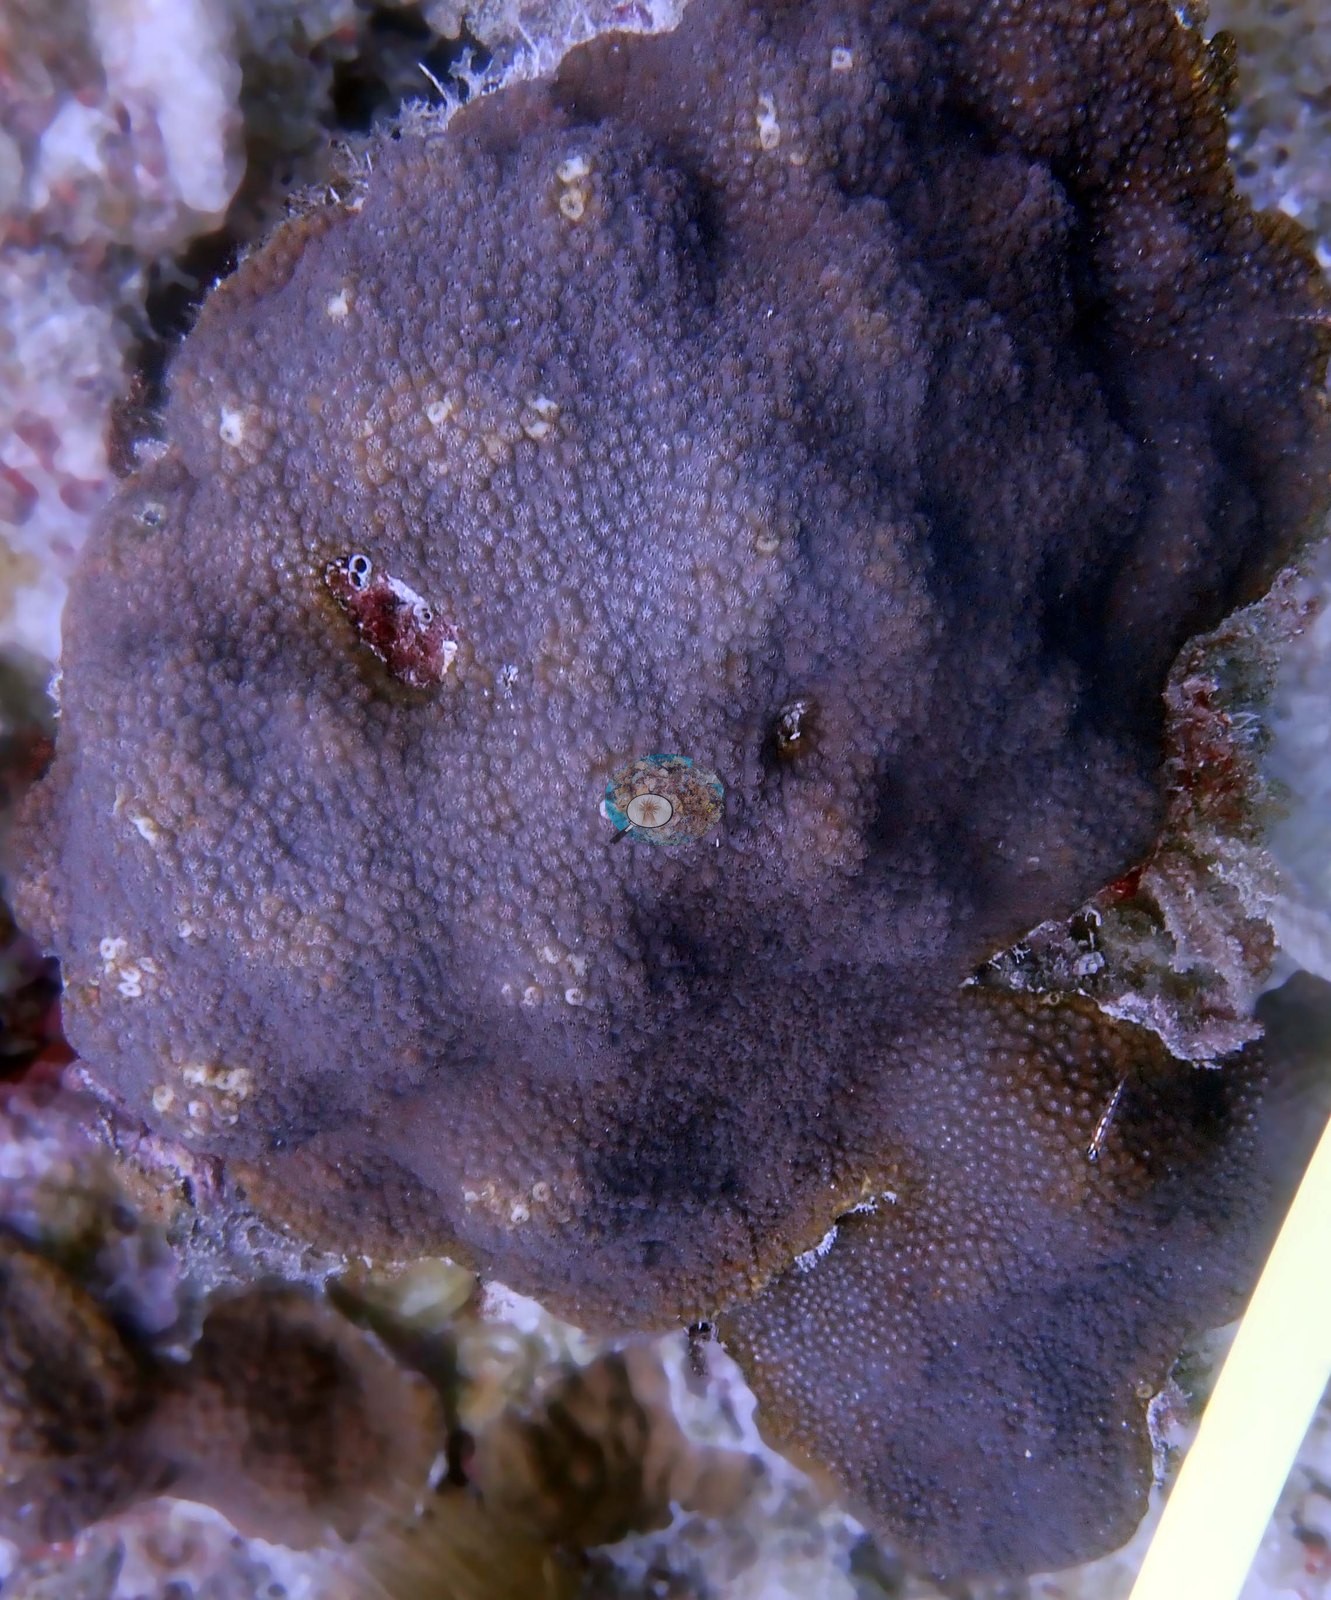
- NOAA - Bird Key Reef, Dry Tortugas: Tissue loss: one Siderastrea head carries sharp white patches of tissue loss, even at this closely watched monitoring station; on the 27 June dives at least two more massive colonies carry tissue-loss fronts consistent with SCTLD, beside a recently dead stark-white colony.
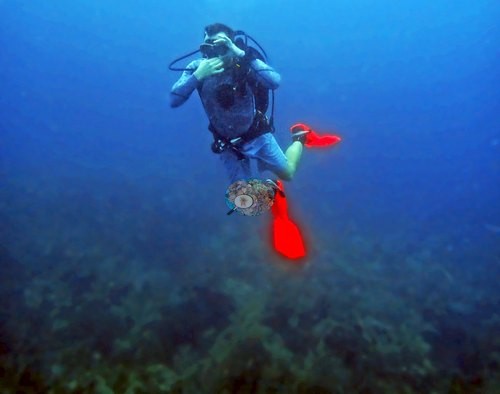
- NOAA - Pulaski Shoal, Dry Tortugas: Heat stress (published USGS work, regional): severe heat stress and loss of elkhorn coral, Acropora palmata, across the Dry Tortugas in the 2023 marine heatwave, two years after the June 2021 visit; not specific to this shoal, and the site has no photographs.
- NOAA - Black Coral Rock, Dry Tortugas: Disease: one massive colony with a tissue-loss front consistent with stony coral tissue loss disease (SCTLD).
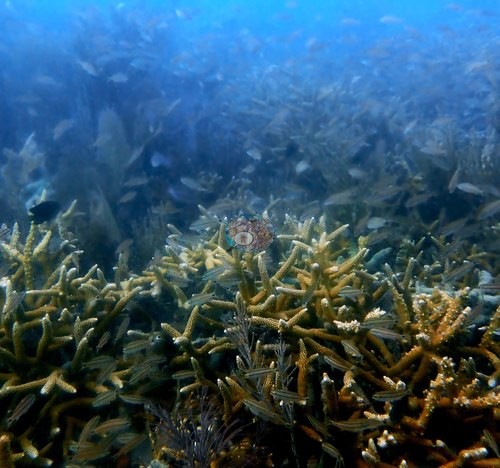
- NOAA - White Shoal, Dry Tortugas: Debris and algae: an old, heavily fouled rope coiled around a small branching colony; red filamentous algae on some live staghorn (recorded as biofouling).
Coral cover over time (pooled)
Sites in this region
- NOAA - Bird Key Reef, Dry Tortugas — 5.1% coral cover
- NOAA - Black Coral Rock, Dry Tortugas — 12% coral cover
- NOAA - Pulaski Shoal, Dry Tortugas — 0.0% (nearest survey station, not this site: NOAA NCRMP Florida (NCEI 0253452), Tortugas PSU 1570-1 station, 2021-09-20, 0.58 km away)
- NOAA - Texas Reef, Dry Tortugas — 6.8% coral cover
- NOAA - White Shoal, Dry Tortugas — 3.3% coral cover
Nearby external survey stations
948 independent survey records within 5 km of a site in this region (each record counted once).
Show all 948 records
- FWC CREMP (Dry Tortugas, DTCREMP) — Bird Key Reef #821 (1999): 24% hard coral cover, 0.00 km from NOAA - Bird Key Reef, Dry Tortugas
- FWC CREMP (Dry Tortugas, DTCREMP) — Bird Key Reef #821 (2000): 21% hard coral cover, 0.00 km from NOAA - Bird Key Reef, Dry Tortugas
- FWC CREMP (Dry Tortugas, DTCREMP) — Bird Key Reef #821 (2001): 24% hard coral cover, 0.00 km from NOAA - Bird Key Reef, Dry Tortugas
- FWC CREMP (Dry Tortugas, DTCREMP) — Bird Key Reef #821 (2002): 12% hard coral cover, 0.00 km from NOAA - Bird Key Reef, Dry Tortugas
- FWC CREMP (Dry Tortugas, DTCREMP) — Bird Key Reef #821 (2003): 17% hard coral cover, 0.00 km from NOAA - Bird Key Reef, Dry Tortugas
- FWC CREMP (Dry Tortugas, DTCREMP) — Bird Key Reef #821 (2004): 17% hard coral cover, 0.00 km from NOAA - Bird Key Reef, Dry Tortugas
- FWC CREMP (Dry Tortugas, DTCREMP) — Bird Key Reef #821 (2005): 15% hard coral cover, 0.00 km from NOAA - Bird Key Reef, Dry Tortugas
- FWC CREMP (Dry Tortugas, DTCREMP) — Bird Key Reef #821 (2006): 13% hard coral cover, 0.00 km from NOAA - Bird Key Reef, Dry Tortugas
- FWC CREMP (Dry Tortugas, DTCREMP) — Bird Key Reef #821 (2007): 12% hard coral cover, 0.00 km from NOAA - Bird Key Reef, Dry Tortugas
- FWC CREMP (Dry Tortugas, DTCREMP) — Bird Key Reef #821 (2008): 13% hard coral cover, 0.00 km from NOAA - Bird Key Reef, Dry Tortugas
- FWC CREMP (Dry Tortugas, DTCREMP) — Bird Key Reef #821 (2009): 14% hard coral cover, 0.00 km from NOAA - Bird Key Reef, Dry Tortugas
- FWC CREMP (Dry Tortugas, DTCREMP) — Bird Key Reef #821 (2010): 11% hard coral cover, 0.00 km from NOAA - Bird Key Reef, Dry Tortugas
- FWC CREMP (Dry Tortugas, DTCREMP) — Bird Key Reef #821 (2011): 13% hard coral cover, 0.00 km from NOAA - Bird Key Reef, Dry Tortugas
- FWC CREMP (Dry Tortugas, DTCREMP) — Bird Key Reef #821 (2012): 11% hard coral cover, 0.00 km from NOAA - Bird Key Reef, Dry Tortugas
- FWC CREMP (Dry Tortugas, DTCREMP) — Bird Key Reef #821 (2013): 10% hard coral cover, 0.00 km from NOAA - Bird Key Reef, Dry Tortugas
- FWC CREMP (Dry Tortugas, DTCREMP) — Bird Key Reef #821 (2014): 10% hard coral cover, 0.00 km from NOAA - Bird Key Reef, Dry Tortugas
- FWC CREMP (Dry Tortugas, DTCREMP) — Bird Key Reef #821 (2015): 8.7% hard coral cover, 0.00 km from NOAA - Bird Key Reef, Dry Tortugas
- FWC CREMP (Dry Tortugas, DTCREMP) — Bird Key Reef #821 (2016): 11% hard coral cover, 0.00 km from NOAA - Bird Key Reef, Dry Tortugas
- FWC CREMP (Dry Tortugas, DTCREMP) — Bird Key Reef #821 (2017): 8.6% hard coral cover, 0.00 km from NOAA - Bird Key Reef, Dry Tortugas
- FWC CREMP (Dry Tortugas, DTCREMP) — Bird Key Reef #821 (2018): 9.3% hard coral cover, 0.00 km from NOAA - Bird Key Reef, Dry Tortugas
- FWC CREMP (Dry Tortugas, DTCREMP) — Bird Key Reef #821 (2019): 10% hard coral cover, 0.00 km from NOAA - Bird Key Reef, Dry Tortugas
- FWC CREMP (Dry Tortugas, DTCREMP) — Bird Key Reef #821 (2020): 8.5% hard coral cover, 0.00 km from NOAA - Bird Key Reef, Dry Tortugas
- FWC CREMP (Dry Tortugas, DTCREMP) — Bird Key Reef #821 (2021): 8.2% hard coral cover, 0.00 km from NOAA - Bird Key Reef, Dry Tortugas
- FWC CREMP (Dry Tortugas, DTCREMP) — Bird Key Reef #821 (2022): 7.5% hard coral cover, 0.00 km from NOAA - Bird Key Reef, Dry Tortugas
- FWC CREMP (Dry Tortugas, DTCREMP) — Bird Key Reef #821 (2023): 5.1% hard coral cover, 0.00 km from NOAA - Bird Key Reef, Dry Tortugas
- FWC CREMP (Dry Tortugas, DTCREMP) — Bird Key Reef #821 (2024): 4.7% hard coral cover, 0.00 km from NOAA - Bird Key Reef, Dry Tortugas
- FWC CREMP (Dry Tortugas, DTCREMP) — Bird Key Reef #822 (1999): 17% hard coral cover, 0.00 km from NOAA - Bird Key Reef, Dry Tortugas
- FWC CREMP (Dry Tortugas, DTCREMP) — Bird Key Reef #822 (2000): 22% hard coral cover, 0.00 km from NOAA - Bird Key Reef, Dry Tortugas
- FWC CREMP (Dry Tortugas, DTCREMP) — Bird Key Reef #822 (2001): 20% hard coral cover, 0.00 km from NOAA - Bird Key Reef, Dry Tortugas
- FWC CREMP (Dry Tortugas, DTCREMP) — Bird Key Reef #822 (2002): 10% hard coral cover, 0.00 km from NOAA - Bird Key Reef, Dry Tortugas
- FWC CREMP (Dry Tortugas, DTCREMP) — Bird Key Reef #822 (2003): 9.2% hard coral cover, 0.00 km from NOAA - Bird Key Reef, Dry Tortugas
- FWC CREMP (Dry Tortugas, DTCREMP) — Bird Key Reef #822 (2004): 8.9% hard coral cover, 0.00 km from NOAA - Bird Key Reef, Dry Tortugas
- FWC CREMP (Dry Tortugas, DTCREMP) — Bird Key Reef #822 (2005): 8.4% hard coral cover, 0.00 km from NOAA - Bird Key Reef, Dry Tortugas
- FWC CREMP (Dry Tortugas, DTCREMP) — Bird Key Reef #822 (2006): 6.5% hard coral cover, 0.00 km from NOAA - Bird Key Reef, Dry Tortugas
- FWC CREMP (Dry Tortugas, DTCREMP) — Bird Key Reef #822 (2007): 5.5% hard coral cover, 0.00 km from NOAA - Bird Key Reef, Dry Tortugas
- FWC CREMP (Dry Tortugas, DTCREMP) — Bird Key Reef #822 (2008): 8.1% hard coral cover, 0.00 km from NOAA - Bird Key Reef, Dry Tortugas
- FWC CREMP (Dry Tortugas, DTCREMP) — Bird Key Reef #822 (2009): 11% hard coral cover, 0.00 km from NOAA - Bird Key Reef, Dry Tortugas
- FWC CREMP (Dry Tortugas, DTCREMP) — Bird Key Reef #822 (2010): 3.8% hard coral cover, 0.00 km from NOAA - Bird Key Reef, Dry Tortugas
- FWC CREMP (Dry Tortugas, DTCREMP) — Bird Key Reef #822 (2011): 5.0% hard coral cover, 0.00 km from NOAA - Bird Key Reef, Dry Tortugas
- FWC CREMP (Dry Tortugas, DTCREMP) — Bird Key Reef #822 (2012): 4.9% hard coral cover, 0.00 km from NOAA - Bird Key Reef, Dry Tortugas
- FWC CREMP (Dry Tortugas, DTCREMP) — Bird Key Reef #822 (2013): 6.0% hard coral cover, 0.00 km from NOAA - Bird Key Reef, Dry Tortugas
- FWC CREMP (Dry Tortugas, DTCREMP) — Bird Key Reef #822 (2014): 6.4% hard coral cover, 0.00 km from NOAA - Bird Key Reef, Dry Tortugas
- FWC CREMP (Dry Tortugas, DTCREMP) — Bird Key Reef #822 (2015): 4.7% hard coral cover, 0.00 km from NOAA - Bird Key Reef, Dry Tortugas
- FWC CREMP (Dry Tortugas, DTCREMP) — Bird Key Reef #822 (2016): 5.8% hard coral cover, 0.00 km from NOAA - Bird Key Reef, Dry Tortugas
- FWC CREMP (Dry Tortugas, DTCREMP) — Bird Key Reef #822 (2017): 5.2% hard coral cover, 0.00 km from NOAA - Bird Key Reef, Dry Tortugas
- FWC CREMP (Dry Tortugas, DTCREMP) — Bird Key Reef #822 (2018): 5.5% hard coral cover, 0.00 km from NOAA - Bird Key Reef, Dry Tortugas
- FWC CREMP (Dry Tortugas, DTCREMP) — Bird Key Reef #822 (2019): 7.8% hard coral cover, 0.00 km from NOAA - Bird Key Reef, Dry Tortugas
- FWC CREMP (Dry Tortugas, DTCREMP) — Bird Key Reef #822 (2020): 4.2% hard coral cover, 0.00 km from NOAA - Bird Key Reef, Dry Tortugas
- FWC CREMP (Dry Tortugas, DTCREMP) — Bird Key Reef #822 (2021): 5.7% hard coral cover, 0.00 km from NOAA - Bird Key Reef, Dry Tortugas
- FWC CREMP (Dry Tortugas, DTCREMP) — Bird Key Reef #822 (2022): 7.1% hard coral cover, 0.00 km from NOAA - Bird Key Reef, Dry Tortugas
- FWC CREMP (Dry Tortugas, DTCREMP) — Bird Key Reef #822 (2023): 6.4% hard coral cover, 0.00 km from NOAA - Bird Key Reef, Dry Tortugas
- FWC CREMP (Dry Tortugas, DTCREMP) — Bird Key Reef #822 (2024): 3.0% hard coral cover, 0.00 km from NOAA - Bird Key Reef, Dry Tortugas
- FWC CREMP (Dry Tortugas, DTCREMP) — Bird Key Reef #823 (1999): 18% hard coral cover, 0.00 km from NOAA - Bird Key Reef, Dry Tortugas
- FWC CREMP (Dry Tortugas, DTCREMP) — Bird Key Reef #823 (2000): 20% hard coral cover, 0.00 km from NOAA - Bird Key Reef, Dry Tortugas
- FWC CREMP (Dry Tortugas, DTCREMP) — Bird Key Reef #823 (2001): 16% hard coral cover, 0.00 km from NOAA - Bird Key Reef, Dry Tortugas
- FWC CREMP (Dry Tortugas, DTCREMP) — Bird Key Reef #823 (2002): 14% hard coral cover, 0.00 km from NOAA - Bird Key Reef, Dry Tortugas
- FWC CREMP (Dry Tortugas, DTCREMP) — Bird Key Reef #823 (2003): 17% hard coral cover, 0.00 km from NOAA - Bird Key Reef, Dry Tortugas
- FWC CREMP (Dry Tortugas, DTCREMP) — Bird Key Reef #823 (2004): 12% hard coral cover, 0.00 km from NOAA - Bird Key Reef, Dry Tortugas
- FWC CREMP (Dry Tortugas, DTCREMP) — Bird Key Reef #823 (2005): 8.9% hard coral cover, 0.00 km from NOAA - Bird Key Reef, Dry Tortugas
- FWC CREMP (Dry Tortugas, DTCREMP) — Bird Key Reef #823 (2006): 11% hard coral cover, 0.00 km from NOAA - Bird Key Reef, Dry Tortugas
- FWC CREMP (Dry Tortugas, DTCREMP) — Bird Key Reef #823 (2007): 11% hard coral cover, 0.00 km from NOAA - Bird Key Reef, Dry Tortugas
- FWC CREMP (Dry Tortugas, DTCREMP) — Bird Key Reef #823 (2008): 12% hard coral cover, 0.00 km from NOAA - Bird Key Reef, Dry Tortugas
- FWC CREMP (Dry Tortugas, DTCREMP) — Bird Key Reef #823 (2009): 11% hard coral cover, 0.00 km from NOAA - Bird Key Reef, Dry Tortugas
- FWC CREMP (Dry Tortugas, DTCREMP) — Bird Key Reef #823 (2010): 8.6% hard coral cover, 0.00 km from NOAA - Bird Key Reef, Dry Tortugas
- FWC CREMP (Dry Tortugas, DTCREMP) — Bird Key Reef #823 (2011): 13% hard coral cover, 0.00 km from NOAA - Bird Key Reef, Dry Tortugas
- FWC CREMP (Dry Tortugas, DTCREMP) — Bird Key Reef #823 (2012): 12% hard coral cover, 0.00 km from NOAA - Bird Key Reef, Dry Tortugas
- FWC CREMP (Dry Tortugas, DTCREMP) — Bird Key Reef #823 (2013): 13% hard coral cover, 0.00 km from NOAA - Bird Key Reef, Dry Tortugas
- FWC CREMP (Dry Tortugas, DTCREMP) — Bird Key Reef #823 (2014): 15% hard coral cover, 0.00 km from NOAA - Bird Key Reef, Dry Tortugas
- FWC CREMP (Dry Tortugas, DTCREMP) — Bird Key Reef #823 (2015): 14% hard coral cover, 0.00 km from NOAA - Bird Key Reef, Dry Tortugas
- FWC CREMP (Dry Tortugas, DTCREMP) — Bird Key Reef #823 (2016): 13% hard coral cover, 0.00 km from NOAA - Bird Key Reef, Dry Tortugas
- FWC CREMP (Dry Tortugas, DTCREMP) — Bird Key Reef #823 (2017): 13% hard coral cover, 0.00 km from NOAA - Bird Key Reef, Dry Tortugas
- FWC CREMP (Dry Tortugas, DTCREMP) — Bird Key Reef #823 (2018): 11% hard coral cover, 0.00 km from NOAA - Bird Key Reef, Dry Tortugas
- FWC CREMP (Dry Tortugas, DTCREMP) — Bird Key Reef #823 (2019): 11% hard coral cover, 0.00 km from NOAA - Bird Key Reef, Dry Tortugas
- FWC CREMP (Dry Tortugas, DTCREMP) — Bird Key Reef #823 (2020): 12% hard coral cover, 0.00 km from NOAA - Bird Key Reef, Dry Tortugas
- FWC CREMP (Dry Tortugas, DTCREMP) — Bird Key Reef #823 (2021): 9.9% hard coral cover, 0.00 km from NOAA - Bird Key Reef, Dry Tortugas
- FWC CREMP (Dry Tortugas, DTCREMP) — Bird Key Reef #823 (2022): 5.3% hard coral cover, 0.00 km from NOAA - Bird Key Reef, Dry Tortugas
- FWC CREMP (Dry Tortugas, DTCREMP) — Bird Key Reef #823 (2023): 6.0% hard coral cover, 0.00 km from NOAA - Bird Key Reef, Dry Tortugas
- FWC CREMP (Dry Tortugas, DTCREMP) — Bird Key Reef #823 (2024): 4.1% hard coral cover, 0.00 km from NOAA - Bird Key Reef, Dry Tortugas
- FWC CREMP (Dry Tortugas, DTCREMP) — Bird Key Reef #824 (1999): 19% hard coral cover, 0.00 km from NOAA - Bird Key Reef, Dry Tortugas
- FWC CREMP (Dry Tortugas, DTCREMP) — Bird Key Reef #824 (2000): 16% hard coral cover, 0.00 km from NOAA - Bird Key Reef, Dry Tortugas
- FWC CREMP (Dry Tortugas, DTCREMP) — Bird Key Reef #824 (2001): 21% hard coral cover, 0.00 km from NOAA - Bird Key Reef, Dry Tortugas
- FWC CREMP (Dry Tortugas, DTCREMP) — Bird Key Reef #824 (2002): 15% hard coral cover, 0.00 km from NOAA - Bird Key Reef, Dry Tortugas
- FWC CREMP (Dry Tortugas, DTCREMP) — Bird Key Reef #824 (2003): 18% hard coral cover, 0.00 km from NOAA - Bird Key Reef, Dry Tortugas
- FWC CREMP (Dry Tortugas, DTCREMP) — Bird Key Reef #824 (2004): 14% hard coral cover, 0.00 km from NOAA - Bird Key Reef, Dry Tortugas
- FWC CREMP (Dry Tortugas, DTCREMP) — Bird Key Reef #824 (2005): 9.2% hard coral cover, 0.00 km from NOAA - Bird Key Reef, Dry Tortugas
- FWC CREMP (Dry Tortugas, DTCREMP) — Bird Key Reef #824 (2006): 10% hard coral cover, 0.00 km from NOAA - Bird Key Reef, Dry Tortugas
- FWC CREMP (Dry Tortugas, DTCREMP) — Bird Key Reef #824 (2007): 9.5% hard coral cover, 0.00 km from NOAA - Bird Key Reef, Dry Tortugas
- FWC CREMP (Dry Tortugas, DTCREMP) — Bird Key Reef #824 (2008): 11% hard coral cover, 0.00 km from NOAA - Bird Key Reef, Dry Tortugas
- FWC CREMP (Dry Tortugas, DTCREMP) — Bird Key Reef #824 (2009): 12% hard coral cover, 0.00 km from NOAA - Bird Key Reef, Dry Tortugas
- FWC CREMP (Dry Tortugas, DTCREMP) — Bird Key Reef #824 (2010): 9.8% hard coral cover, 0.00 km from NOAA - Bird Key Reef, Dry Tortugas
- FWC CREMP (Dry Tortugas, DTCREMP) — Bird Key Reef #824 (2011): 11% hard coral cover, 0.00 km from NOAA - Bird Key Reef, Dry Tortugas
- FWC CREMP (Dry Tortugas, DTCREMP) — Bird Key Reef #824 (2012): 7.9% hard coral cover, 0.00 km from NOAA - Bird Key Reef, Dry Tortugas
- FWC CREMP (Dry Tortugas, DTCREMP) — Bird Key Reef #824 (2013): 7.8% hard coral cover, 0.00 km from NOAA - Bird Key Reef, Dry Tortugas
- FWC CREMP (Dry Tortugas, DTCREMP) — Bird Key Reef #824 (2014): 10% hard coral cover, 0.00 km from NOAA - Bird Key Reef, Dry Tortugas
- FWC CREMP (Dry Tortugas, DTCREMP) — Bird Key Reef #824 (2015): 8.8% hard coral cover, 0.00 km from NOAA - Bird Key Reef, Dry Tortugas
- FWC CREMP (Dry Tortugas, DTCREMP) — Bird Key Reef #824 (2016): 11% hard coral cover, 0.00 km from NOAA - Bird Key Reef, Dry Tortugas
- FWC CREMP (Dry Tortugas, DTCREMP) — Bird Key Reef #824 (2017): 9.0% hard coral cover, 0.00 km from NOAA - Bird Key Reef, Dry Tortugas
- FWC CREMP (Dry Tortugas, DTCREMP) — Bird Key Reef #824 (2018): 8.8% hard coral cover, 0.00 km from NOAA - Bird Key Reef, Dry Tortugas
- FWC CREMP (Dry Tortugas, DTCREMP) — Bird Key Reef #824 (2019): 9.0% hard coral cover, 0.00 km from NOAA - Bird Key Reef, Dry Tortugas
- FWC CREMP (Dry Tortugas, DTCREMP) — Bird Key Reef #824 (2020): 7.9% hard coral cover, 0.00 km from NOAA - Bird Key Reef, Dry Tortugas
- FWC CREMP (Dry Tortugas, DTCREMP) — Bird Key Reef #824 (2021): 7.6% hard coral cover, 0.00 km from NOAA - Bird Key Reef, Dry Tortugas
- FWC CREMP (Dry Tortugas, DTCREMP) — Bird Key Reef #824 (2022): 6.1% hard coral cover, 0.00 km from NOAA - Bird Key Reef, Dry Tortugas
- FWC CREMP (Dry Tortugas, DTCREMP) — Bird Key Reef #824 (2023): 5.8% hard coral cover, 0.00 km from NOAA - Bird Key Reef, Dry Tortugas
- FWC CREMP (Dry Tortugas, DTCREMP) — Bird Key Reef #824 (2024): 4.3% hard coral cover, 0.00 km from NOAA - Bird Key Reef, Dry Tortugas
- FWC CREMP (Dry Tortugas, DTCREMP) — Black Coral Rock #831 (1999): 19% hard coral cover, 0.00 km from NOAA - Black Coral Rock, Dry Tortugas
- FWC CREMP (Dry Tortugas, DTCREMP) — Black Coral Rock #831 (2000): 19% hard coral cover, 0.00 km from NOAA - Black Coral Rock, Dry Tortugas
- FWC CREMP (Dry Tortugas, DTCREMP) — Black Coral Rock #831 (2001): 17% hard coral cover, 0.00 km from NOAA - Black Coral Rock, Dry Tortugas
- FWC CREMP (Dry Tortugas, DTCREMP) — Black Coral Rock #831 (2002): 25% hard coral cover, 0.00 km from NOAA - Black Coral Rock, Dry Tortugas
- FWC CREMP (Dry Tortugas, DTCREMP) — Black Coral Rock #831 (2003): 22% hard coral cover, 0.00 km from NOAA - Black Coral Rock, Dry Tortugas
- FWC CREMP (Dry Tortugas, DTCREMP) — Black Coral Rock #831 (2004): 19% hard coral cover, 0.00 km from NOAA - Black Coral Rock, Dry Tortugas
- FWC CREMP (Dry Tortugas, DTCREMP) — Black Coral Rock #831 (2005): 22% hard coral cover, 0.00 km from NOAA - Black Coral Rock, Dry Tortugas
- FWC CREMP (Dry Tortugas, DTCREMP) — Black Coral Rock #831 (2006): 13% hard coral cover, 0.00 km from NOAA - Black Coral Rock, Dry Tortugas
- FWC CREMP (Dry Tortugas, DTCREMP) — Black Coral Rock #831 (2007): 13% hard coral cover, 0.00 km from NOAA - Black Coral Rock, Dry Tortugas
- FWC CREMP (Dry Tortugas, DTCREMP) — Black Coral Rock #831 (2008): 13% hard coral cover, 0.00 km from NOAA - Black Coral Rock, Dry Tortugas
- FWC CREMP (Dry Tortugas, DTCREMP) — Black Coral Rock #831 (2009): 12% hard coral cover, 0.00 km from NOAA - Black Coral Rock, Dry Tortugas
- FWC CREMP (Dry Tortugas, DTCREMP) — Black Coral Rock #831 (2010): 13% hard coral cover, 0.00 km from NOAA - Black Coral Rock, Dry Tortugas
- FWC CREMP (Dry Tortugas, DTCREMP) — Black Coral Rock #831 (2011): 11% hard coral cover, 0.00 km from NOAA - Black Coral Rock, Dry Tortugas
- FWC CREMP (Dry Tortugas, DTCREMP) — Black Coral Rock #831 (2012): 11% hard coral cover, 0.00 km from NOAA - Black Coral Rock, Dry Tortugas
- FWC CREMP (Dry Tortugas, DTCREMP) — Black Coral Rock #831 (2013): 9.7% hard coral cover, 0.00 km from NOAA - Black Coral Rock, Dry Tortugas
- FWC CREMP (Dry Tortugas, DTCREMP) — Black Coral Rock #831 (2014): 12% hard coral cover, 0.00 km from NOAA - Black Coral Rock, Dry Tortugas
- FWC CREMP (Dry Tortugas, DTCREMP) — Black Coral Rock #831 (2015): 7.1% hard coral cover, 0.00 km from NOAA - Black Coral Rock, Dry Tortugas
- FWC CREMP (Dry Tortugas, DTCREMP) — Black Coral Rock #831 (2016): 10% hard coral cover, 0.00 km from NOAA - Black Coral Rock, Dry Tortugas
- FWC CREMP (Dry Tortugas, DTCREMP) — Black Coral Rock #831 (2017): 8.7% hard coral cover, 0.00 km from NOAA - Black Coral Rock, Dry Tortugas
- FWC CREMP (Dry Tortugas, DTCREMP) — Black Coral Rock #831 (2018): 10% hard coral cover, 0.00 km from NOAA - Black Coral Rock, Dry Tortugas
- FWC CREMP (Dry Tortugas, DTCREMP) — Black Coral Rock #831 (2019): 9.7% hard coral cover, 0.00 km from NOAA - Black Coral Rock, Dry Tortugas
- FWC CREMP (Dry Tortugas, DTCREMP) — Black Coral Rock #831 (2020): 11% hard coral cover, 0.00 km from NOAA - Black Coral Rock, Dry Tortugas
- FWC CREMP (Dry Tortugas, DTCREMP) — Black Coral Rock #831 (2021): 9.5% hard coral cover, 0.00 km from NOAA - Black Coral Rock, Dry Tortugas
- FWC CREMP (Dry Tortugas, DTCREMP) — Black Coral Rock #831 (2022): 6.2% hard coral cover, 0.00 km from NOAA - Black Coral Rock, Dry Tortugas
- FWC CREMP (Dry Tortugas, DTCREMP) — Black Coral Rock #831 (2023): 2.0% hard coral cover, 0.00 km from NOAA - Black Coral Rock, Dry Tortugas
- FWC CREMP (Dry Tortugas, DTCREMP) — Black Coral Rock #831 (2024): 3.7% hard coral cover, 0.00 km from NOAA - Black Coral Rock, Dry Tortugas
- FWC CREMP (Dry Tortugas, DTCREMP) — Black Coral Rock #832 (1999): 30% hard coral cover, 0.00 km from NOAA - Black Coral Rock, Dry Tortugas
- FWC CREMP (Dry Tortugas, DTCREMP) — Black Coral Rock #832 (2000): 23% hard coral cover, 0.00 km from NOAA - Black Coral Rock, Dry Tortugas
- FWC CREMP (Dry Tortugas, DTCREMP) — Black Coral Rock #832 (2001): 26% hard coral cover, 0.00 km from NOAA - Black Coral Rock, Dry Tortugas
- FWC CREMP (Dry Tortugas, DTCREMP) — Black Coral Rock #832 (2002): 18% hard coral cover, 0.00 km from NOAA - Black Coral Rock, Dry Tortugas
- FWC CREMP (Dry Tortugas, DTCREMP) — Black Coral Rock #832 (2003): 29% hard coral cover, 0.00 km from NOAA - Black Coral Rock, Dry Tortugas
- FWC CREMP (Dry Tortugas, DTCREMP) — Black Coral Rock #832 (2004): 23% hard coral cover, 0.00 km from NOAA - Black Coral Rock, Dry Tortugas
- FWC CREMP (Dry Tortugas, DTCREMP) — Black Coral Rock #832 (2005): 24% hard coral cover, 0.00 km from NOAA - Black Coral Rock, Dry Tortugas
- FWC CREMP (Dry Tortugas, DTCREMP) — Black Coral Rock #832 (2006): 18% hard coral cover, 0.00 km from NOAA - Black Coral Rock, Dry Tortugas
- FWC CREMP (Dry Tortugas, DTCREMP) — Black Coral Rock #832 (2007): 21% hard coral cover, 0.00 km from NOAA - Black Coral Rock, Dry Tortugas
- FWC CREMP (Dry Tortugas, DTCREMP) — Black Coral Rock #832 (2008): 26% hard coral cover, 0.00 km from NOAA - Black Coral Rock, Dry Tortugas
- FWC CREMP (Dry Tortugas, DTCREMP) — Black Coral Rock #832 (2009): 22% hard coral cover, 0.00 km from NOAA - Black Coral Rock, Dry Tortugas
- FWC CREMP (Dry Tortugas, DTCREMP) — Black Coral Rock #832 (2010): 17% hard coral cover, 0.00 km from NOAA - Black Coral Rock, Dry Tortugas
- FWC CREMP (Dry Tortugas, DTCREMP) — Black Coral Rock #832 (2011): 18% hard coral cover, 0.00 km from NOAA - Black Coral Rock, Dry Tortugas
- FWC CREMP (Dry Tortugas, DTCREMP) — Black Coral Rock #832 (2012): 21% hard coral cover, 0.00 km from NOAA - Black Coral Rock, Dry Tortugas
- FWC CREMP (Dry Tortugas, DTCREMP) — Black Coral Rock #832 (2013): 19% hard coral cover, 0.00 km from NOAA - Black Coral Rock, Dry Tortugas
- FWC CREMP (Dry Tortugas, DTCREMP) — Black Coral Rock #832 (2014): 18% hard coral cover, 0.00 km from NOAA - Black Coral Rock, Dry Tortugas
- FWC CREMP (Dry Tortugas, DTCREMP) — Black Coral Rock #832 (2015): 18% hard coral cover, 0.00 km from NOAA - Black Coral Rock, Dry Tortugas
- FWC CREMP (Dry Tortugas, DTCREMP) — Black Coral Rock #832 (2016): 17% hard coral cover, 0.00 km from NOAA - Black Coral Rock, Dry Tortugas
- FWC CREMP (Dry Tortugas, DTCREMP) — Black Coral Rock #832 (2017): 18% hard coral cover, 0.00 km from NOAA - Black Coral Rock, Dry Tortugas
- FWC CREMP (Dry Tortugas, DTCREMP) — Black Coral Rock #832 (2018): 18% hard coral cover, 0.00 km from NOAA - Black Coral Rock, Dry Tortugas
- FWC CREMP (Dry Tortugas, DTCREMP) — Black Coral Rock #832 (2019): 20% hard coral cover, 0.00 km from NOAA - Black Coral Rock, Dry Tortugas
- FWC CREMP (Dry Tortugas, DTCREMP) — Black Coral Rock #832 (2020): 18% hard coral cover, 0.00 km from NOAA - Black Coral Rock, Dry Tortugas
- FWC CREMP (Dry Tortugas, DTCREMP) — Black Coral Rock #832 (2021): 17% hard coral cover, 0.00 km from NOAA - Black Coral Rock, Dry Tortugas
- FWC CREMP (Dry Tortugas, DTCREMP) — Black Coral Rock #832 (2022): 11% hard coral cover, 0.00 km from NOAA - Black Coral Rock, Dry Tortugas
- FWC CREMP (Dry Tortugas, DTCREMP) — Black Coral Rock #832 (2023): 5.7% hard coral cover, 0.00 km from NOAA - Black Coral Rock, Dry Tortugas
- FWC CREMP (Dry Tortugas, DTCREMP) — Black Coral Rock #832 (2024): 4.5% hard coral cover, 0.00 km from NOAA - Black Coral Rock, Dry Tortugas
- FWC CREMP (Dry Tortugas, DTCREMP) — Black Coral Rock #833 (1999): 26% hard coral cover, 0.00 km from NOAA - Black Coral Rock, Dry Tortugas
- FWC CREMP (Dry Tortugas, DTCREMP) — Black Coral Rock #833 (2000): 19% hard coral cover, 0.00 km from NOAA - Black Coral Rock, Dry Tortugas
- FWC CREMP (Dry Tortugas, DTCREMP) — Black Coral Rock #833 (2001): 18% hard coral cover, 0.00 km from NOAA - Black Coral Rock, Dry Tortugas
- FWC CREMP (Dry Tortugas, DTCREMP) — Black Coral Rock #833 (2002): 16% hard coral cover, 0.00 km from NOAA - Black Coral Rock, Dry Tortugas
- FWC CREMP (Dry Tortugas, DTCREMP) — Black Coral Rock #833 (2003): 14% hard coral cover, 0.00 km from NOAA - Black Coral Rock, Dry Tortugas
- FWC CREMP (Dry Tortugas, DTCREMP) — Black Coral Rock #833 (2004): 16% hard coral cover, 0.00 km from NOAA - Black Coral Rock, Dry Tortugas
- FWC CREMP (Dry Tortugas, DTCREMP) — Black Coral Rock #833 (2005): 16% hard coral cover, 0.00 km from NOAA - Black Coral Rock, Dry Tortugas
- FWC CREMP (Dry Tortugas, DTCREMP) — Black Coral Rock #833 (2006): 13% hard coral cover, 0.00 km from NOAA - Black Coral Rock, Dry Tortugas
- FWC CREMP (Dry Tortugas, DTCREMP) — Black Coral Rock #833 (2007): 11% hard coral cover, 0.00 km from NOAA - Black Coral Rock, Dry Tortugas
- FWC CREMP (Dry Tortugas, DTCREMP) — Black Coral Rock #833 (2008): 12% hard coral cover, 0.00 km from NOAA - Black Coral Rock, Dry Tortugas
- FWC CREMP (Dry Tortugas, DTCREMP) — Black Coral Rock #833 (2009): 14% hard coral cover, 0.00 km from NOAA - Black Coral Rock, Dry Tortugas
- FWC CREMP (Dry Tortugas, DTCREMP) — Black Coral Rock #833 (2010): 12% hard coral cover, 0.00 km from NOAA - Black Coral Rock, Dry Tortugas
- FWC CREMP (Dry Tortugas, DTCREMP) — Black Coral Rock #833 (2011): 11% hard coral cover, 0.00 km from NOAA - Black Coral Rock, Dry Tortugas
- FWC CREMP (Dry Tortugas, DTCREMP) — Black Coral Rock #833 (2012): 11% hard coral cover, 0.00 km from NOAA - Black Coral Rock, Dry Tortugas
- FWC CREMP (Dry Tortugas, DTCREMP) — Black Coral Rock #833 (2013): 13% hard coral cover, 0.00 km from NOAA - Black Coral Rock, Dry Tortugas
- FWC CREMP (Dry Tortugas, DTCREMP) — Black Coral Rock #833 (2014): 12% hard coral cover, 0.00 km from NOAA - Black Coral Rock, Dry Tortugas
- FWC CREMP (Dry Tortugas, DTCREMP) — Black Coral Rock #833 (2015): 11% hard coral cover, 0.00 km from NOAA - Black Coral Rock, Dry Tortugas
- FWC CREMP (Dry Tortugas, DTCREMP) — Black Coral Rock #833 (2016): 11% hard coral cover, 0.00 km from NOAA - Black Coral Rock, Dry Tortugas
- FWC CREMP (Dry Tortugas, DTCREMP) — Black Coral Rock #833 (2017): 14% hard coral cover, 0.00 km from NOAA - Black Coral Rock, Dry Tortugas
- FWC CREMP (Dry Tortugas, DTCREMP) — Black Coral Rock #833 (2018): 12% hard coral cover, 0.00 km from NOAA - Black Coral Rock, Dry Tortugas
- FWC CREMP (Dry Tortugas, DTCREMP) — Black Coral Rock #833 (2019): 12% hard coral cover, 0.00 km from NOAA - Black Coral Rock, Dry Tortugas
- FWC CREMP (Dry Tortugas, DTCREMP) — Black Coral Rock #833 (2020): 11% hard coral cover, 0.00 km from NOAA - Black Coral Rock, Dry Tortugas
- FWC CREMP (Dry Tortugas, DTCREMP) — Black Coral Rock #833 (2021): 12% hard coral cover, 0.00 km from NOAA - Black Coral Rock, Dry Tortugas
- FWC CREMP (Dry Tortugas, DTCREMP) — Black Coral Rock #833 (2022): 9.6% hard coral cover, 0.00 km from NOAA - Black Coral Rock, Dry Tortugas
- FWC CREMP (Dry Tortugas, DTCREMP) — Black Coral Rock #833 (2023): 3.5% hard coral cover, 0.00 km from NOAA - Black Coral Rock, Dry Tortugas
- FWC CREMP (Dry Tortugas, DTCREMP) — Black Coral Rock #833 (2024): 5.9% hard coral cover, 0.00 km from NOAA - Black Coral Rock, Dry Tortugas
- FWC CREMP (Dry Tortugas, DTCREMP) — Black Coral Rock #834 (1999): 26% hard coral cover, 0.00 km from NOAA - Black Coral Rock, Dry Tortugas
- FWC CREMP (Dry Tortugas, DTCREMP) — Black Coral Rock #834 (2000): 20% hard coral cover, 0.00 km from NOAA - Black Coral Rock, Dry Tortugas
- FWC CREMP (Dry Tortugas, DTCREMP) — Black Coral Rock #834 (2001): 24% hard coral cover, 0.00 km from NOAA - Black Coral Rock, Dry Tortugas
- FWC CREMP (Dry Tortugas, DTCREMP) — Black Coral Rock #834 (2002): 17% hard coral cover, 0.00 km from NOAA - Black Coral Rock, Dry Tortugas
- FWC CREMP (Dry Tortugas, DTCREMP) — Black Coral Rock #834 (2003): 21% hard coral cover, 0.00 km from NOAA - Black Coral Rock, Dry Tortugas
- FWC CREMP (Dry Tortugas, DTCREMP) — Black Coral Rock #834 (2004): 24% hard coral cover, 0.00 km from NOAA - Black Coral Rock, Dry Tortugas
- FWC CREMP (Dry Tortugas, DTCREMP) — Black Coral Rock #834 (2005): 27% hard coral cover, 0.00 km from NOAA - Black Coral Rock, Dry Tortugas
- FWC CREMP (Dry Tortugas, DTCREMP) — Black Coral Rock #834 (2006): 21% hard coral cover, 0.00 km from NOAA - Black Coral Rock, Dry Tortugas
- FWC CREMP (Dry Tortugas, DTCREMP) — Black Coral Rock #834 (2007): 16% hard coral cover, 0.00 km from NOAA - Black Coral Rock, Dry Tortugas
- FWC CREMP (Dry Tortugas, DTCREMP) — Black Coral Rock #834 (2008): 20% hard coral cover, 0.00 km from NOAA - Black Coral Rock, Dry Tortugas
- FWC CREMP (Dry Tortugas, DTCREMP) — Black Coral Rock #834 (2009): 24% hard coral cover, 0.00 km from NOAA - Black Coral Rock, Dry Tortugas
- FWC CREMP (Dry Tortugas, DTCREMP) — Black Coral Rock #834 (2010): 19% hard coral cover, 0.00 km from NOAA - Black Coral Rock, Dry Tortugas
- FWC CREMP (Dry Tortugas, DTCREMP) — Black Coral Rock #834 (2011): 16% hard coral cover, 0.00 km from NOAA - Black Coral Rock, Dry Tortugas
- FWC CREMP (Dry Tortugas, DTCREMP) — Black Coral Rock #834 (2012): 18% hard coral cover, 0.00 km from NOAA - Black Coral Rock, Dry Tortugas
- FWC CREMP (Dry Tortugas, DTCREMP) — Black Coral Rock #834 (2013): 13% hard coral cover, 0.00 km from NOAA - Black Coral Rock, Dry Tortugas
- FWC CREMP (Dry Tortugas, DTCREMP) — Black Coral Rock #834 (2014): 17% hard coral cover, 0.00 km from NOAA - Black Coral Rock, Dry Tortugas
- FWC CREMP (Dry Tortugas, DTCREMP) — Black Coral Rock #834 (2015): 19% hard coral cover, 0.00 km from NOAA - Black Coral Rock, Dry Tortugas
- FWC CREMP (Dry Tortugas, DTCREMP) — Black Coral Rock #834 (2016): 17% hard coral cover, 0.00 km from NOAA - Black Coral Rock, Dry Tortugas
- FWC CREMP (Dry Tortugas, DTCREMP) — Black Coral Rock #834 (2017): 15% hard coral cover, 0.00 km from NOAA - Black Coral Rock, Dry Tortugas
- FWC CREMP (Dry Tortugas, DTCREMP) — Black Coral Rock #834 (2018): 12% hard coral cover, 0.00 km from NOAA - Black Coral Rock, Dry Tortugas
- FWC CREMP (Dry Tortugas, DTCREMP) — Black Coral Rock #834 (2019): 12% hard coral cover, 0.00 km from NOAA - Black Coral Rock, Dry Tortugas
- FWC CREMP (Dry Tortugas, DTCREMP) — Black Coral Rock #834 (2020): 12% hard coral cover, 0.00 km from NOAA - Black Coral Rock, Dry Tortugas
- FWC CREMP (Dry Tortugas, DTCREMP) — Black Coral Rock #834 (2021): 11% hard coral cover, 0.00 km from NOAA - Black Coral Rock, Dry Tortugas
- FWC CREMP (Dry Tortugas, DTCREMP) — Black Coral Rock #834 (2022): 9.6% hard coral cover, 0.00 km from NOAA - Black Coral Rock, Dry Tortugas
- FWC CREMP (Dry Tortugas, DTCREMP) — Black Coral Rock #834 (2023): 3.8% hard coral cover, 0.00 km from NOAA - Black Coral Rock, Dry Tortugas
- FWC CREMP (Dry Tortugas, DTCREMP) — Black Coral Rock #834 (2024): 4.9% hard coral cover, 0.00 km from NOAA - Black Coral Rock, Dry Tortugas
- FWC CREMP (Dry Tortugas, DTCREMP) — Davis Rock #281 (2009): 9.2% hard coral cover, 2.33 km from NOAA - Texas Reef, Dry Tortugas
- FWC CREMP (Dry Tortugas, DTCREMP) — Davis Rock #281 (2010): 12% hard coral cover, 2.33 km from NOAA - Texas Reef, Dry Tortugas
- FWC CREMP (Dry Tortugas, DTCREMP) — Davis Rock #281 (2011): 9.9% hard coral cover, 2.33 km from NOAA - Texas Reef, Dry Tortugas
- FWC CREMP (Dry Tortugas, DTCREMP) — Davis Rock #281 (2012): 11% hard coral cover, 2.33 km from NOAA - Texas Reef, Dry Tortugas
- FWC CREMP (Dry Tortugas, DTCREMP) — Davis Rock #281 (2013): 11% hard coral cover, 2.33 km from NOAA - Texas Reef, Dry Tortugas
- FWC CREMP (Dry Tortugas, DTCREMP) — Davis Rock #281 (2014): 13% hard coral cover, 2.33 km from NOAA - Texas Reef, Dry Tortugas
- FWC CREMP (Dry Tortugas, DTCREMP) — Davis Rock #281 (2015): 7.3% hard coral cover, 2.33 km from NOAA - Texas Reef, Dry Tortugas
- FWC CREMP (Dry Tortugas, DTCREMP) — Davis Rock #281 (2016): 11% hard coral cover, 2.33 km from NOAA - Texas Reef, Dry Tortugas
- FWC CREMP (Dry Tortugas, DTCREMP) — Davis Rock #281 (2017): 11% hard coral cover, 2.33 km from NOAA - Texas Reef, Dry Tortugas
- FWC CREMP (Dry Tortugas, DTCREMP) — Davis Rock #281 (2018): 6.9% hard coral cover, 2.33 km from NOAA - Texas Reef, Dry Tortugas
- FWC CREMP (Dry Tortugas, DTCREMP) — Davis Rock #281 (2019): 9.3% hard coral cover, 2.33 km from NOAA - Texas Reef, Dry Tortugas
- FWC CREMP (Dry Tortugas, DTCREMP) — Davis Rock #281 (2020): 7.0% hard coral cover, 2.33 km from NOAA - Texas Reef, Dry Tortugas
- FWC CREMP (Dry Tortugas, DTCREMP) — Davis Rock #281 (2021): 9.9% hard coral cover, 2.33 km from NOAA - Texas Reef, Dry Tortugas
- FWC CREMP (Dry Tortugas, DTCREMP) — Davis Rock #281 (2022): 9.1% hard coral cover, 2.33 km from NOAA - Texas Reef, Dry Tortugas
- FWC CREMP (Dry Tortugas, DTCREMP) — Davis Rock #281 (2023): 6.1% hard coral cover, 2.33 km from NOAA - Texas Reef, Dry Tortugas
- FWC CREMP (Dry Tortugas, DTCREMP) — Davis Rock #281 (2024): 3.3% hard coral cover, 2.33 km from NOAA - Texas Reef, Dry Tortugas
- FWC CREMP (Dry Tortugas, DTCREMP) — Davis Rock #282 (2009): 1.9% hard coral cover, 2.33 km from NOAA - Texas Reef, Dry Tortugas
- FWC CREMP (Dry Tortugas, DTCREMP) — Davis Rock #282 (2010): 10% hard coral cover, 2.33 km from NOAA - Texas Reef, Dry Tortugas
- FWC CREMP (Dry Tortugas, DTCREMP) — Davis Rock #282 (2011): 5.4% hard coral cover, 2.33 km from NOAA - Texas Reef, Dry Tortugas
- FWC CREMP (Dry Tortugas, DTCREMP) — Davis Rock #282 (2012): 3.9% hard coral cover, 2.33 km from NOAA - Texas Reef, Dry Tortugas
- FWC CREMP (Dry Tortugas, DTCREMP) — Davis Rock #282 (2013): 10% hard coral cover, 2.33 km from NOAA - Texas Reef, Dry Tortugas
- FWC CREMP (Dry Tortugas, DTCREMP) — Davis Rock #282 (2014): 5.9% hard coral cover, 2.33 km from NOAA - Texas Reef, Dry Tortugas
- FWC CREMP (Dry Tortugas, DTCREMP) — Davis Rock #282 (2015): 2.4% hard coral cover, 2.33 km from NOAA - Texas Reef, Dry Tortugas
- FWC CREMP (Dry Tortugas, DTCREMP) — Davis Rock #282 (2016): 5.1% hard coral cover, 2.33 km from NOAA - Texas Reef, Dry Tortugas
- FWC CREMP (Dry Tortugas, DTCREMP) — Davis Rock #282 (2017): 3.0% hard coral cover, 2.33 km from NOAA - Texas Reef, Dry Tortugas
- FWC CREMP (Dry Tortugas, DTCREMP) — Davis Rock #282 (2018): 8.7% hard coral cover, 2.33 km from NOAA - Texas Reef, Dry Tortugas
- FWC CREMP (Dry Tortugas, DTCREMP) — Davis Rock #282 (2019): 4.1% hard coral cover, 2.33 km from NOAA - Texas Reef, Dry Tortugas
- FWC CREMP (Dry Tortugas, DTCREMP) — Davis Rock #282 (2020): 2.4% hard coral cover, 2.33 km from NOAA - Texas Reef, Dry Tortugas
- FWC CREMP (Dry Tortugas, DTCREMP) — Davis Rock #282 (2021): 4.7% hard coral cover, 2.33 km from NOAA - Texas Reef, Dry Tortugas
- FWC CREMP (Dry Tortugas, DTCREMP) — Davis Rock #282 (2022): 5.8% hard coral cover, 2.33 km from NOAA - Texas Reef, Dry Tortugas
- FWC CREMP (Dry Tortugas, DTCREMP) — Davis Rock #282 (2023): 1.7% hard coral cover, 2.33 km from NOAA - Texas Reef, Dry Tortugas
- FWC CREMP (Dry Tortugas, DTCREMP) — Davis Rock #282 (2024): 1.6% hard coral cover, 2.33 km from NOAA - Texas Reef, Dry Tortugas
- FWC CREMP (Dry Tortugas, DTCREMP) — Davis Rock #283 (2009): 4.9% hard coral cover, 2.33 km from NOAA - Texas Reef, Dry Tortugas
- FWC CREMP (Dry Tortugas, DTCREMP) — Davis Rock #283 (2010): 6.3% hard coral cover, 2.33 km from NOAA - Texas Reef, Dry Tortugas
- FWC CREMP (Dry Tortugas, DTCREMP) — Davis Rock #283 (2011): 7.4% hard coral cover, 2.33 km from NOAA - Texas Reef, Dry Tortugas
- FWC CREMP (Dry Tortugas, DTCREMP) — Davis Rock #283 (2012): 9.5% hard coral cover, 2.33 km from NOAA - Texas Reef, Dry Tortugas
- FWC CREMP (Dry Tortugas, DTCREMP) — Davis Rock #283 (2013): 7.5% hard coral cover, 2.33 km from NOAA - Texas Reef, Dry Tortugas
- FWC CREMP (Dry Tortugas, DTCREMP) — Davis Rock #283 (2014): 9.1% hard coral cover, 2.33 km from NOAA - Texas Reef, Dry Tortugas
- FWC CREMP (Dry Tortugas, DTCREMP) — Davis Rock #283 (2015): 7.7% hard coral cover, 2.33 km from NOAA - Texas Reef, Dry Tortugas
- FWC CREMP (Dry Tortugas, DTCREMP) — Davis Rock #283 (2016): 7.5% hard coral cover, 2.33 km from NOAA - Texas Reef, Dry Tortugas
- FWC CREMP (Dry Tortugas, DTCREMP) — Davis Rock #283 (2017): 6.2% hard coral cover, 2.33 km from NOAA - Texas Reef, Dry Tortugas
- FWC CREMP (Dry Tortugas, DTCREMP) — Davis Rock #283 (2018): 5.1% hard coral cover, 2.33 km from NOAA - Texas Reef, Dry Tortugas
- FWC CREMP (Dry Tortugas, DTCREMP) — Davis Rock #283 (2019): 7.5% hard coral cover, 2.33 km from NOAA - Texas Reef, Dry Tortugas
- FWC CREMP (Dry Tortugas, DTCREMP) — Davis Rock #283 (2020): 8.9% hard coral cover, 2.33 km from NOAA - Texas Reef, Dry Tortugas
- FWC CREMP (Dry Tortugas, DTCREMP) — Davis Rock #283 (2021): 6.6% hard coral cover, 2.33 km from NOAA - Texas Reef, Dry Tortugas
- FWC CREMP (Dry Tortugas, DTCREMP) — Davis Rock #283 (2022): 4.4% hard coral cover, 2.33 km from NOAA - Texas Reef, Dry Tortugas
- FWC CREMP (Dry Tortugas, DTCREMP) — Davis Rock #283 (2023): 1.6% hard coral cover, 2.33 km from NOAA - Texas Reef, Dry Tortugas
- FWC CREMP (Dry Tortugas, DTCREMP) — Davis Rock #283 (2024): 2.0% hard coral cover, 2.33 km from NOAA - Texas Reef, Dry Tortugas
- FWC CREMP (Dry Tortugas, DTCREMP) — Davis Rock #284 (2009): 18% hard coral cover, 2.33 km from NOAA - Texas Reef, Dry Tortugas
- FWC CREMP (Dry Tortugas, DTCREMP) — Davis Rock #284 (2010): 11% hard coral cover, 2.33 km from NOAA - Texas Reef, Dry Tortugas
- FWC CREMP (Dry Tortugas, DTCREMP) — Davis Rock #284 (2011): 15% hard coral cover, 2.33 km from NOAA - Texas Reef, Dry Tortugas
- FWC CREMP (Dry Tortugas, DTCREMP) — Davis Rock #284 (2012): 18% hard coral cover, 2.33 km from NOAA - Texas Reef, Dry Tortugas
- FWC CREMP (Dry Tortugas, DTCREMP) — Davis Rock #284 (2013): 13% hard coral cover, 2.33 km from NOAA - Texas Reef, Dry Tortugas
- FWC CREMP (Dry Tortugas, DTCREMP) — Davis Rock #284 (2014): 15% hard coral cover, 2.33 km from NOAA - Texas Reef, Dry Tortugas
- FWC CREMP (Dry Tortugas, DTCREMP) — Davis Rock #284 (2015): 17% hard coral cover, 2.33 km from NOAA - Texas Reef, Dry Tortugas
- FWC CREMP (Dry Tortugas, DTCREMP) — Davis Rock #284 (2016): 15% hard coral cover, 2.33 km from NOAA - Texas Reef, Dry Tortugas
- FWC CREMP (Dry Tortugas, DTCREMP) — Davis Rock #284 (2017): 17% hard coral cover, 2.33 km from NOAA - Texas Reef, Dry Tortugas
- FWC CREMP (Dry Tortugas, DTCREMP) — Davis Rock #284 (2018): 15% hard coral cover, 2.33 km from NOAA - Texas Reef, Dry Tortugas
- FWC CREMP (Dry Tortugas, DTCREMP) — Davis Rock #284 (2019): 15% hard coral cover, 2.33 km from NOAA - Texas Reef, Dry Tortugas
- FWC CREMP (Dry Tortugas, DTCREMP) — Davis Rock #284 (2020): 15% hard coral cover, 2.33 km from NOAA - Texas Reef, Dry Tortugas
- FWC CREMP (Dry Tortugas, DTCREMP) — Davis Rock #284 (2021): 14% hard coral cover, 2.33 km from NOAA - Texas Reef, Dry Tortugas
- FWC CREMP (Dry Tortugas, DTCREMP) — Davis Rock #284 (2022): 13% hard coral cover, 2.33 km from NOAA - Texas Reef, Dry Tortugas
- FWC CREMP (Dry Tortugas, DTCREMP) — Davis Rock #284 (2023): 11% hard coral cover, 2.33 km from NOAA - Texas Reef, Dry Tortugas
- FWC CREMP (Dry Tortugas, DTCREMP) — Davis Rock #284 (2024): 6.5% hard coral cover, 2.33 km from NOAA - Texas Reef, Dry Tortugas
- FWC CREMP (Dry Tortugas, DTCREMP) — Loggerhead Patch #461 (2005): 3.9% hard coral cover, 2.13 km from NOAA - White Shoal, Dry Tortugas
- FWC CREMP (Dry Tortugas, DTCREMP) — Loggerhead Patch #461 (2006): 2.5% hard coral cover, 2.13 km from NOAA - White Shoal, Dry Tortugas
- FWC CREMP (Dry Tortugas, DTCREMP) — Loggerhead Patch #461 (2007): 3.3% hard coral cover, 2.13 km from NOAA - White Shoal, Dry Tortugas
- FWC CREMP (Dry Tortugas, DTCREMP) — Loggerhead Patch #461 (2008): 2.9% hard coral cover, 2.13 km from NOAA - White Shoal, Dry Tortugas
- FWC CREMP (Dry Tortugas, DTCREMP) — Loggerhead Patch #461 (2009): 2.8% hard coral cover, 2.13 km from NOAA - White Shoal, Dry Tortugas
- FWC CREMP (Dry Tortugas, DTCREMP) — Loggerhead Patch #461 (2010): 3.0% hard coral cover, 2.13 km from NOAA - White Shoal, Dry Tortugas
- FWC CREMP (Dry Tortugas, DTCREMP) — Loggerhead Patch #461 (2011): 4.5% hard coral cover, 2.13 km from NOAA - White Shoal, Dry Tortugas
- FWC CREMP (Dry Tortugas, DTCREMP) — Loggerhead Patch #461 (2012): 2.7% hard coral cover, 2.13 km from NOAA - White Shoal, Dry Tortugas
- FWC CREMP (Dry Tortugas, DTCREMP) — Loggerhead Patch #461 (2013): 2.8% hard coral cover, 2.13 km from NOAA - White Shoal, Dry Tortugas
- FWC CREMP (Dry Tortugas, DTCREMP) — Loggerhead Patch #461 (2014): 2.9% hard coral cover, 2.13 km from NOAA - White Shoal, Dry Tortugas
- FWC CREMP (Dry Tortugas, DTCREMP) — Loggerhead Patch #461 (2015): 2.8% hard coral cover, 2.13 km from NOAA - White Shoal, Dry Tortugas
- FWC CREMP (Dry Tortugas, DTCREMP) — Loggerhead Patch #461 (2016): 2.0% hard coral cover, 2.13 km from NOAA - White Shoal, Dry Tortugas
- FWC CREMP (Dry Tortugas, DTCREMP) — Loggerhead Patch #461 (2017): 1.5% hard coral cover, 2.13 km from NOAA - White Shoal, Dry Tortugas
- FWC CREMP (Dry Tortugas, DTCREMP) — Loggerhead Patch #461 (2018): 1.7% hard coral cover, 2.13 km from NOAA - White Shoal, Dry Tortugas
- FWC CREMP (Dry Tortugas, DTCREMP) — Loggerhead Patch #461 (2019): 1.9% hard coral cover, 2.13 km from NOAA - White Shoal, Dry Tortugas
- FWC CREMP (Dry Tortugas, DTCREMP) — Loggerhead Patch #461 (2020): 1.8% hard coral cover, 2.13 km from NOAA - White Shoal, Dry Tortugas
- FWC CREMP (Dry Tortugas, DTCREMP) — Loggerhead Patch #461 (2021): 2.5% hard coral cover, 2.13 km from NOAA - White Shoal, Dry Tortugas
- FWC CREMP (Dry Tortugas, DTCREMP) — Loggerhead Patch #461 (2022): 3.2% hard coral cover, 2.13 km from NOAA - White Shoal, Dry Tortugas
- FWC CREMP (Dry Tortugas, DTCREMP) — Loggerhead Patch #461 (2023): 2.6% hard coral cover, 2.13 km from NOAA - White Shoal, Dry Tortugas
- FWC CREMP (Dry Tortugas, DTCREMP) — Loggerhead Patch #461 (2024): 0.2% hard coral cover, 2.13 km from NOAA - White Shoal, Dry Tortugas
- FWC CREMP (Dry Tortugas, DTCREMP) — Loggerhead Patch #462 (2005): 4.3% hard coral cover, 2.13 km from NOAA - White Shoal, Dry Tortugas
- FWC CREMP (Dry Tortugas, DTCREMP) — Loggerhead Patch #462 (2006): 0.6% hard coral cover, 2.13 km from NOAA - White Shoal, Dry Tortugas
- FWC CREMP (Dry Tortugas, DTCREMP) — Loggerhead Patch #462 (2007): 1.7% hard coral cover, 2.13 km from NOAA - White Shoal, Dry Tortugas
- FWC CREMP (Dry Tortugas, DTCREMP) — Loggerhead Patch #462 (2008): 0.7% hard coral cover, 2.13 km from NOAA - White Shoal, Dry Tortugas
- FWC CREMP (Dry Tortugas, DTCREMP) — Loggerhead Patch #462 (2009): 1.7% hard coral cover, 2.13 km from NOAA - White Shoal, Dry Tortugas
- FWC CREMP (Dry Tortugas, DTCREMP) — Loggerhead Patch #462 (2010): 0.8% hard coral cover, 2.13 km from NOAA - White Shoal, Dry Tortugas
- FWC CREMP (Dry Tortugas, DTCREMP) — Loggerhead Patch #462 (2011): 0.6% hard coral cover, 2.13 km from NOAA - White Shoal, Dry Tortugas
- FWC CREMP (Dry Tortugas, DTCREMP) — Loggerhead Patch #462 (2012): 0.9% hard coral cover, 2.13 km from NOAA - White Shoal, Dry Tortugas
- FWC CREMP (Dry Tortugas, DTCREMP) — Loggerhead Patch #462 (2013): 1.2% hard coral cover, 2.13 km from NOAA - White Shoal, Dry Tortugas
- FWC CREMP (Dry Tortugas, DTCREMP) — Loggerhead Patch #462 (2014): 0.9% hard coral cover, 2.13 km from NOAA - White Shoal, Dry Tortugas
- FWC CREMP (Dry Tortugas, DTCREMP) — Loggerhead Patch #462 (2015): 1.1% hard coral cover, 2.13 km from NOAA - White Shoal, Dry Tortugas
- FWC CREMP (Dry Tortugas, DTCREMP) — Loggerhead Patch #462 (2016): 0.7% hard coral cover, 2.13 km from NOAA - White Shoal, Dry Tortugas
- FWC CREMP (Dry Tortugas, DTCREMP) — Loggerhead Patch #462 (2017): 0.5% hard coral cover, 2.13 km from NOAA - White Shoal, Dry Tortugas
- FWC CREMP (Dry Tortugas, DTCREMP) — Loggerhead Patch #462 (2018): 0.2% hard coral cover, 2.13 km from NOAA - White Shoal, Dry Tortugas
- FWC CREMP (Dry Tortugas, DTCREMP) — Loggerhead Patch #462 (2019): 0.0% hard coral cover, 2.13 km from NOAA - White Shoal, Dry Tortugas
- FWC CREMP (Dry Tortugas, DTCREMP) — Loggerhead Patch #462 (2020): 0.0% hard coral cover, 2.13 km from NOAA - White Shoal, Dry Tortugas
- FWC CREMP (Dry Tortugas, DTCREMP) — Loggerhead Patch #462 (2021): 0.0% hard coral cover, 2.13 km from NOAA - White Shoal, Dry Tortugas
- FWC CREMP (Dry Tortugas, DTCREMP) — Loggerhead Patch #462 (2022): 0.0% hard coral cover, 2.13 km from NOAA - White Shoal, Dry Tortugas
- FWC CREMP (Dry Tortugas, DTCREMP) — Loggerhead Patch #462 (2023): 0.0% hard coral cover, 2.13 km from NOAA - White Shoal, Dry Tortugas
- FWC CREMP (Dry Tortugas, DTCREMP) — Loggerhead Patch #462 (2024): 0.2% hard coral cover, 2.13 km from NOAA - White Shoal, Dry Tortugas
- FWC CREMP (Dry Tortugas, DTCREMP) — Palmata Patch #421 (2004): 4.0% hard coral cover, 1.04 km from NOAA - Bird Key Reef, Dry Tortugas
- FWC CREMP (Dry Tortugas, DTCREMP) — Palmata Patch #421 (2005): 2.5% hard coral cover, 1.04 km from NOAA - Bird Key Reef, Dry Tortugas
- FWC CREMP (Dry Tortugas, DTCREMP) — Palmata Patch #421 (2006): 0.7% hard coral cover, 1.04 km from NOAA - Bird Key Reef, Dry Tortugas
- FWC CREMP (Dry Tortugas, DTCREMP) — Palmata Patch #421 (2007): 1.1% hard coral cover, 1.04 km from NOAA - Bird Key Reef, Dry Tortugas
- FWC CREMP (Dry Tortugas, DTCREMP) — Palmata Patch #421 (2008): 0.8% hard coral cover, 1.04 km from NOAA - Bird Key Reef, Dry Tortugas
- FWC CREMP (Dry Tortugas, DTCREMP) — Palmata Patch #421 (2009): 1.0% hard coral cover, 1.04 km from NOAA - Bird Key Reef, Dry Tortugas
- FWC CREMP (Dry Tortugas, DTCREMP) — Palmata Patch #421 (2010): 1.4% hard coral cover, 1.04 km from NOAA - Bird Key Reef, Dry Tortugas
- FWC CREMP (Dry Tortugas, DTCREMP) — Palmata Patch #421 (2011): 2.3% hard coral cover, 1.04 km from NOAA - Bird Key Reef, Dry Tortugas
- FWC CREMP (Dry Tortugas, DTCREMP) — Palmata Patch #421 (2012): 1.1% hard coral cover, 1.04 km from NOAA - Bird Key Reef, Dry Tortugas
- FWC CREMP (Dry Tortugas, DTCREMP) — Palmata Patch #421 (2013): 1.4% hard coral cover, 1.04 km from NOAA - Bird Key Reef, Dry Tortugas
- FWC CREMP (Dry Tortugas, DTCREMP) — Palmata Patch #421 (2014): 2.5% hard coral cover, 1.04 km from NOAA - Bird Key Reef, Dry Tortugas
- FWC CREMP (Dry Tortugas, DTCREMP) — Palmata Patch #421 (2015): 2.0% hard coral cover, 1.04 km from NOAA - Bird Key Reef, Dry Tortugas
- FWC CREMP (Dry Tortugas, DTCREMP) — Palmata Patch #421 (2016): 1.0% hard coral cover, 1.04 km from NOAA - Bird Key Reef, Dry Tortugas
- FWC CREMP (Dry Tortugas, DTCREMP) — Palmata Patch #421 (2017): 1.6% hard coral cover, 1.04 km from NOAA - Bird Key Reef, Dry Tortugas
- FWC CREMP (Dry Tortugas, DTCREMP) — Palmata Patch #421 (2018): 1.8% hard coral cover, 1.04 km from NOAA - Bird Key Reef, Dry Tortugas
- FWC CREMP (Dry Tortugas, DTCREMP) — Palmata Patch #421 (2019): 1.9% hard coral cover, 1.04 km from NOAA - Bird Key Reef, Dry Tortugas
- FWC CREMP (Dry Tortugas, DTCREMP) — Palmata Patch #421 (2020): 2.0% hard coral cover, 1.04 km from NOAA - Bird Key Reef, Dry Tortugas
- FWC CREMP (Dry Tortugas, DTCREMP) — Palmata Patch #421 (2021): 2.3% hard coral cover, 1.04 km from NOAA - Bird Key Reef, Dry Tortugas
- FWC CREMP (Dry Tortugas, DTCREMP) — Palmata Patch #421 (2022): 3.1% hard coral cover, 1.04 km from NOAA - Bird Key Reef, Dry Tortugas
- FWC CREMP (Dry Tortugas, DTCREMP) — Palmata Patch #421 (2023): 2.4% hard coral cover, 1.04 km from NOAA - Bird Key Reef, Dry Tortugas
- FWC CREMP (Dry Tortugas, DTCREMP) — Palmata Patch #421 (2024): 0.1% hard coral cover, 1.04 km from NOAA - Bird Key Reef, Dry Tortugas
- FWC CREMP (Dry Tortugas, DTCREMP) — Palmata Patch #422 (2004): 7.5% hard coral cover, 1.04 km from NOAA - Bird Key Reef, Dry Tortugas
- FWC CREMP (Dry Tortugas, DTCREMP) — Palmata Patch #422 (2005): 8.6% hard coral cover, 1.04 km from NOAA - Bird Key Reef, Dry Tortugas
- FWC CREMP (Dry Tortugas, DTCREMP) — Palmata Patch #422 (2006): 4.3% hard coral cover, 1.04 km from NOAA - Bird Key Reef, Dry Tortugas
- FWC CREMP (Dry Tortugas, DTCREMP) — Palmata Patch #422 (2007): 4.7% hard coral cover, 1.04 km from NOAA - Bird Key Reef, Dry Tortugas
- FWC CREMP (Dry Tortugas, DTCREMP) — Palmata Patch #422 (2008): 6.3% hard coral cover, 1.04 km from NOAA - Bird Key Reef, Dry Tortugas
- FWC CREMP (Dry Tortugas, DTCREMP) — Palmata Patch #422 (2009): 7.8% hard coral cover, 1.04 km from NOAA - Bird Key Reef, Dry Tortugas
- FWC CREMP (Dry Tortugas, DTCREMP) — Palmata Patch #422 (2010): 11% hard coral cover, 1.04 km from NOAA - Bird Key Reef, Dry Tortugas
- FWC CREMP (Dry Tortugas, DTCREMP) — Palmata Patch #422 (2011): 16% hard coral cover, 1.04 km from NOAA - Bird Key Reef, Dry Tortugas
- FWC CREMP (Dry Tortugas, DTCREMP) — Palmata Patch #422 (2012): 14% hard coral cover, 1.04 km from NOAA - Bird Key Reef, Dry Tortugas
- FWC CREMP (Dry Tortugas, DTCREMP) — Palmata Patch #422 (2013): 15% hard coral cover, 1.04 km from NOAA - Bird Key Reef, Dry Tortugas
- FWC CREMP (Dry Tortugas, DTCREMP) — Palmata Patch #422 (2014): 17% hard coral cover, 1.04 km from NOAA - Bird Key Reef, Dry Tortugas
- FWC CREMP (Dry Tortugas, DTCREMP) — Palmata Patch #422 (2015): 13% hard coral cover, 1.04 km from NOAA - Bird Key Reef, Dry Tortugas
- FWC CREMP (Dry Tortugas, DTCREMP) — Palmata Patch #422 (2016): 15% hard coral cover, 1.04 km from NOAA - Bird Key Reef, Dry Tortugas
- FWC CREMP (Dry Tortugas, DTCREMP) — Palmata Patch #422 (2017): 15% hard coral cover, 1.04 km from NOAA - Bird Key Reef, Dry Tortugas
- FWC CREMP (Dry Tortugas, DTCREMP) — Palmata Patch #422 (2018): 11% hard coral cover, 1.04 km from NOAA - Bird Key Reef, Dry Tortugas
- FWC CREMP (Dry Tortugas, DTCREMP) — Palmata Patch #422 (2019): 15% hard coral cover, 1.04 km from NOAA - Bird Key Reef, Dry Tortugas
- FWC CREMP (Dry Tortugas, DTCREMP) — Palmata Patch #422 (2020): 17% hard coral cover, 1.04 km from NOAA - Bird Key Reef, Dry Tortugas
- FWC CREMP (Dry Tortugas, DTCREMP) — Palmata Patch #422 (2021): 20% hard coral cover, 1.04 km from NOAA - Bird Key Reef, Dry Tortugas
- FWC CREMP (Dry Tortugas, DTCREMP) — Palmata Patch #422 (2022): 19% hard coral cover, 1.04 km from NOAA - Bird Key Reef, Dry Tortugas
- FWC CREMP (Dry Tortugas, DTCREMP) — Palmata Patch #422 (2023): 16% hard coral cover, 1.04 km from NOAA - Bird Key Reef, Dry Tortugas
- FWC CREMP (Dry Tortugas, DTCREMP) — Palmata Patch #422 (2024): 0.0% hard coral cover, 1.04 km from NOAA - Bird Key Reef, Dry Tortugas
- FWC CREMP (Dry Tortugas, DTCREMP) — Prolifera Patch #431 (2004): 15% hard coral cover, 0.99 km from NOAA - Bird Key Reef, Dry Tortugas
- FWC CREMP (Dry Tortugas, DTCREMP) — Prolifera Patch #431 (2005): 14% hard coral cover, 0.99 km from NOAA - Bird Key Reef, Dry Tortugas
- FWC CREMP (Dry Tortugas, DTCREMP) — Prolifera Patch #431 (2006): 10% hard coral cover, 0.99 km from NOAA - Bird Key Reef, Dry Tortugas
- FWC CREMP (Dry Tortugas, DTCREMP) — Prolifera Patch #431 (2007): 14% hard coral cover, 0.99 km from NOAA - Bird Key Reef, Dry Tortugas
- FWC CREMP (Dry Tortugas, DTCREMP) — Prolifera Patch #431 (2008): 16% hard coral cover, 0.99 km from NOAA - Bird Key Reef, Dry Tortugas
- FWC CREMP (Dry Tortugas, DTCREMP) — Prolifera Patch #431 (2009): 19% hard coral cover, 0.99 km from NOAA - Bird Key Reef, Dry Tortugas
- FWC CREMP (Dry Tortugas, DTCREMP) — Prolifera Patch #431 (2010): 21% hard coral cover, 0.99 km from NOAA - Bird Key Reef, Dry Tortugas
- FWC CREMP (Dry Tortugas, DTCREMP) — Prolifera Patch #431 (2011): 25% hard coral cover, 0.99 km from NOAA - Bird Key Reef, Dry Tortugas
- FWC CREMP (Dry Tortugas, DTCREMP) — Prolifera Patch #431 (2012): 26% hard coral cover, 0.99 km from NOAA - Bird Key Reef, Dry Tortugas
- FWC CREMP (Dry Tortugas, DTCREMP) — Prolifera Patch #431 (2013): 25% hard coral cover, 0.99 km from NOAA - Bird Key Reef, Dry Tortugas
- FWC CREMP (Dry Tortugas, DTCREMP) — Prolifera Patch #431 (2014): 25% hard coral cover, 0.99 km from NOAA - Bird Key Reef, Dry Tortugas
- FWC CREMP (Dry Tortugas, DTCREMP) — Prolifera Patch #431 (2015): 28% hard coral cover, 0.99 km from NOAA - Bird Key Reef, Dry Tortugas
- FWC CREMP (Dry Tortugas, DTCREMP) — Prolifera Patch #431 (2016): 22% hard coral cover, 0.99 km from NOAA - Bird Key Reef, Dry Tortugas
- FWC CREMP (Dry Tortugas, DTCREMP) — Prolifera Patch #431 (2017): 24% hard coral cover, 0.99 km from NOAA - Bird Key Reef, Dry Tortugas
- FWC CREMP (Dry Tortugas, DTCREMP) — Prolifera Patch #431 (2018): 24% hard coral cover, 0.99 km from NOAA - Bird Key Reef, Dry Tortugas
- FWC CREMP (Dry Tortugas, DTCREMP) — Prolifera Patch #431 (2019): 31% hard coral cover, 0.99 km from NOAA - Bird Key Reef, Dry Tortugas
- FWC CREMP (Dry Tortugas, DTCREMP) — Prolifera Patch #431 (2020): 41% hard coral cover, 0.99 km from NOAA - Bird Key Reef, Dry Tortugas
- FWC CREMP (Dry Tortugas, DTCREMP) — Prolifera Patch #431 (2021): 49% hard coral cover, 0.99 km from NOAA - Bird Key Reef, Dry Tortugas
- FWC CREMP (Dry Tortugas, DTCREMP) — Prolifera Patch #431 (2022): 39% hard coral cover, 0.99 km from NOAA - Bird Key Reef, Dry Tortugas
- FWC CREMP (Dry Tortugas, DTCREMP) — Prolifera Patch #431 (2023): 8.6% hard coral cover, 0.99 km from NOAA - Bird Key Reef, Dry Tortugas
- FWC CREMP (Dry Tortugas, DTCREMP) — Prolifera Patch #431 (2024): 0.0% hard coral cover, 0.99 km from NOAA - Bird Key Reef, Dry Tortugas
- FWC CREMP (Dry Tortugas, DTCREMP) — Prolifera Patch #432 (2004): 6.9% hard coral cover, 0.99 km from NOAA - Bird Key Reef, Dry Tortugas
- FWC CREMP (Dry Tortugas, DTCREMP) — Prolifera Patch #432 (2005): 5.2% hard coral cover, 0.99 km from NOAA - Bird Key Reef, Dry Tortugas
- FWC CREMP (Dry Tortugas, DTCREMP) — Prolifera Patch #432 (2006): 3.4% hard coral cover, 0.99 km from NOAA - Bird Key Reef, Dry Tortugas
- FWC CREMP (Dry Tortugas, DTCREMP) — Prolifera Patch #432 (2007): 5.2% hard coral cover, 0.99 km from NOAA - Bird Key Reef, Dry Tortugas
- FWC CREMP (Dry Tortugas, DTCREMP) — Prolifera Patch #432 (2008): 4.8% hard coral cover, 0.99 km from NOAA - Bird Key Reef, Dry Tortugas
- FWC CREMP (Dry Tortugas, DTCREMP) — Prolifera Patch #432 (2009): 4.7% hard coral cover, 0.99 km from NOAA - Bird Key Reef, Dry Tortugas
- FWC CREMP (Dry Tortugas, DTCREMP) — Prolifera Patch #432 (2010): 4.5% hard coral cover, 0.99 km from NOAA - Bird Key Reef, Dry Tortugas
- FWC CREMP (Dry Tortugas, DTCREMP) — Prolifera Patch #432 (2011): 7.0% hard coral cover, 0.99 km from NOAA - Bird Key Reef, Dry Tortugas
- FWC CREMP (Dry Tortugas, DTCREMP) — Prolifera Patch #432 (2012): 7.3% hard coral cover, 0.99 km from NOAA - Bird Key Reef, Dry Tortugas
- FWC CREMP (Dry Tortugas, DTCREMP) — Prolifera Patch #432 (2013): 5.9% hard coral cover, 0.99 km from NOAA - Bird Key Reef, Dry Tortugas
- FWC CREMP (Dry Tortugas, DTCREMP) — Prolifera Patch #432 (2014): 6.0% hard coral cover, 0.99 km from NOAA - Bird Key Reef, Dry Tortugas
- FWC CREMP (Dry Tortugas, DTCREMP) — Prolifera Patch #432 (2015): 4.3% hard coral cover, 0.99 km from NOAA - Bird Key Reef, Dry Tortugas
- FWC CREMP (Dry Tortugas, DTCREMP) — Prolifera Patch #432 (2016): 4.5% hard coral cover, 0.99 km from NOAA - Bird Key Reef, Dry Tortugas
- FWC CREMP (Dry Tortugas, DTCREMP) — Prolifera Patch #432 (2017): 5.8% hard coral cover, 0.99 km from NOAA - Bird Key Reef, Dry Tortugas
- FWC CREMP (Dry Tortugas, DTCREMP) — Prolifera Patch #432 (2018): 3.3% hard coral cover, 0.99 km from NOAA - Bird Key Reef, Dry Tortugas
- FWC CREMP (Dry Tortugas, DTCREMP) — Prolifera Patch #432 (2019): 4.7% hard coral cover, 0.99 km from NOAA - Bird Key Reef, Dry Tortugas
- FWC CREMP (Dry Tortugas, DTCREMP) — Prolifera Patch #432 (2020): 5.6% hard coral cover, 0.99 km from NOAA - Bird Key Reef, Dry Tortugas
- FWC CREMP (Dry Tortugas, DTCREMP) — Prolifera Patch #432 (2021): 4.1% hard coral cover, 0.99 km from NOAA - Bird Key Reef, Dry Tortugas
- FWC CREMP (Dry Tortugas, DTCREMP) — Prolifera Patch #432 (2022): 5.4% hard coral cover, 0.99 km from NOAA - Bird Key Reef, Dry Tortugas
- FWC CREMP (Dry Tortugas, DTCREMP) — Prolifera Patch #432 (2023): 1.6% hard coral cover, 0.99 km from NOAA - Bird Key Reef, Dry Tortugas
- FWC CREMP (Dry Tortugas, DTCREMP) — Prolifera Patch #432 (2024): 0.5% hard coral cover, 0.99 km from NOAA - Bird Key Reef, Dry Tortugas
- FWC CREMP (Dry Tortugas, DTCREMP) — Prolifera Patch #433 (2004): 23% hard coral cover, 0.99 km from NOAA - Bird Key Reef, Dry Tortugas
- FWC CREMP (Dry Tortugas, DTCREMP) — Prolifera Patch #433 (2005): 22% hard coral cover, 0.99 km from NOAA - Bird Key Reef, Dry Tortugas
- FWC CREMP (Dry Tortugas, DTCREMP) — Prolifera Patch #433 (2006): 23% hard coral cover, 0.99 km from NOAA - Bird Key Reef, Dry Tortugas
- FWC CREMP (Dry Tortugas, DTCREMP) — Prolifera Patch #433 (2007): 24% hard coral cover, 0.99 km from NOAA - Bird Key Reef, Dry Tortugas
- FWC CREMP (Dry Tortugas, DTCREMP) — Prolifera Patch #433 (2008): 18% hard coral cover, 0.99 km from NOAA - Bird Key Reef, Dry Tortugas
- FWC CREMP (Dry Tortugas, DTCREMP) — Prolifera Patch #433 (2009): 18% hard coral cover, 0.99 km from NOAA - Bird Key Reef, Dry Tortugas
- FWC CREMP (Dry Tortugas, DTCREMP) — Prolifera Patch #433 (2010): 21% hard coral cover, 0.99 km from NOAA - Bird Key Reef, Dry Tortugas
- FWC CREMP (Dry Tortugas, DTCREMP) — Prolifera Patch #433 (2011): 22% hard coral cover, 0.99 km from NOAA - Bird Key Reef, Dry Tortugas
- FWC CREMP (Dry Tortugas, DTCREMP) — Prolifera Patch #433 (2012): 25% hard coral cover, 0.99 km from NOAA - Bird Key Reef, Dry Tortugas
- FWC CREMP (Dry Tortugas, DTCREMP) — Prolifera Patch #433 (2013): 25% hard coral cover, 0.99 km from NOAA - Bird Key Reef, Dry Tortugas
- FWC CREMP (Dry Tortugas, DTCREMP) — Prolifera Patch #433 (2014): 29% hard coral cover, 0.99 km from NOAA - Bird Key Reef, Dry Tortugas
- FWC CREMP (Dry Tortugas, DTCREMP) — Prolifera Patch #433 (2015): 20% hard coral cover, 0.99 km from NOAA - Bird Key Reef, Dry Tortugas
- FWC CREMP (Dry Tortugas, DTCREMP) — Prolifera Patch #433 (2016): 21% hard coral cover, 0.99 km from NOAA - Bird Key Reef, Dry Tortugas
- FWC CREMP (Dry Tortugas, DTCREMP) — Prolifera Patch #433 (2017): 20% hard coral cover, 0.99 km from NOAA - Bird Key Reef, Dry Tortugas
- FWC CREMP (Dry Tortugas, DTCREMP) — Prolifera Patch #433 (2018): 16% hard coral cover, 0.99 km from NOAA - Bird Key Reef, Dry Tortugas
- FWC CREMP (Dry Tortugas, DTCREMP) — Prolifera Patch #433 (2019): 16% hard coral cover, 0.99 km from NOAA - Bird Key Reef, Dry Tortugas
- FWC CREMP (Dry Tortugas, DTCREMP) — Prolifera Patch #433 (2020): 16% hard coral cover, 0.99 km from NOAA - Bird Key Reef, Dry Tortugas
- FWC CREMP (Dry Tortugas, DTCREMP) — Prolifera Patch #433 (2021): 16% hard coral cover, 0.99 km from NOAA - Bird Key Reef, Dry Tortugas
- FWC CREMP (Dry Tortugas, DTCREMP) — Prolifera Patch #433 (2022): 15% hard coral cover, 0.99 km from NOAA - Bird Key Reef, Dry Tortugas
- FWC CREMP (Dry Tortugas, DTCREMP) — Prolifera Patch #433 (2023): 9.5% hard coral cover, 0.99 km from NOAA - Bird Key Reef, Dry Tortugas
- FWC CREMP (Dry Tortugas, DTCREMP) — Prolifera Patch #433 (2024): 4.4% hard coral cover, 0.99 km from NOAA - Bird Key Reef, Dry Tortugas
- FWC CREMP (Dry Tortugas, DTCREMP) — Temptation Rock #441 (2004): 3.1% hard coral cover, 3.44 km from NOAA - White Shoal, Dry Tortugas
- FWC CREMP (Dry Tortugas, DTCREMP) — Temptation Rock #441 (2005): 3.2% hard coral cover, 3.44 km from NOAA - White Shoal, Dry Tortugas
- FWC CREMP (Dry Tortugas, DTCREMP) — Temptation Rock #441 (2006): 2.5% hard coral cover, 3.44 km from NOAA - White Shoal, Dry Tortugas
- FWC CREMP (Dry Tortugas, DTCREMP) — Temptation Rock #441 (2007): 3.0% hard coral cover, 3.44 km from NOAA - White Shoal, Dry Tortugas
- FWC CREMP (Dry Tortugas, DTCREMP) — Temptation Rock #441 (2008): 3.7% hard coral cover, 3.44 km from NOAA - White Shoal, Dry Tortugas
- FWC CREMP (Dry Tortugas, DTCREMP) — Temptation Rock #441 (2009): 3.6% hard coral cover, 3.44 km from NOAA - White Shoal, Dry Tortugas
- FWC CREMP (Dry Tortugas, DTCREMP) — Temptation Rock #441 (2010): 5.7% hard coral cover, 3.44 km from NOAA - White Shoal, Dry Tortugas
- FWC CREMP (Dry Tortugas, DTCREMP) — Temptation Rock #441 (2011): 8.2% hard coral cover, 3.44 km from NOAA - White Shoal, Dry Tortugas
- FWC CREMP (Dry Tortugas, DTCREMP) — Temptation Rock #441 (2012): 5.0% hard coral cover, 3.44 km from NOAA - White Shoal, Dry Tortugas
- FWC CREMP (Dry Tortugas, DTCREMP) — Temptation Rock #441 (2013): 2.5% hard coral cover, 3.44 km from NOAA - White Shoal, Dry Tortugas
- FWC CREMP (Dry Tortugas, DTCREMP) — Temptation Rock #441 (2014): 5.0% hard coral cover, 3.44 km from NOAA - White Shoal, Dry Tortugas
- FWC CREMP (Dry Tortugas, DTCREMP) — Temptation Rock #441 (2015): 5.2% hard coral cover, 3.44 km from NOAA - White Shoal, Dry Tortugas
- FWC CREMP (Dry Tortugas, DTCREMP) — Temptation Rock #441 (2016): 4.2% hard coral cover, 3.44 km from NOAA - White Shoal, Dry Tortugas
- FWC CREMP (Dry Tortugas, DTCREMP) — Temptation Rock #441 (2017): 6.6% hard coral cover, 3.44 km from NOAA - White Shoal, Dry Tortugas
- FWC CREMP (Dry Tortugas, DTCREMP) — Temptation Rock #441 (2018): 2.8% hard coral cover, 3.44 km from NOAA - White Shoal, Dry Tortugas
- FWC CREMP (Dry Tortugas, DTCREMP) — Temptation Rock #441 (2019): 6.9% hard coral cover, 3.44 km from NOAA - White Shoal, Dry Tortugas
- FWC CREMP (Dry Tortugas, DTCREMP) — Temptation Rock #441 (2020): 3.2% hard coral cover, 3.44 km from NOAA - White Shoal, Dry Tortugas
- FWC CREMP (Dry Tortugas, DTCREMP) — Temptation Rock #441 (2021): 6.9% hard coral cover, 3.44 km from NOAA - White Shoal, Dry Tortugas
- FWC CREMP (Dry Tortugas, DTCREMP) — Temptation Rock #441 (2022): 4.8% hard coral cover, 3.44 km from NOAA - White Shoal, Dry Tortugas
- FWC CREMP (Dry Tortugas, DTCREMP) — Temptation Rock #441 (2023): 5.5% hard coral cover, 3.44 km from NOAA - White Shoal, Dry Tortugas
- FWC CREMP (Dry Tortugas, DTCREMP) — Temptation Rock #441 (2024): 2.1% hard coral cover, 3.44 km from NOAA - White Shoal, Dry Tortugas
- FWC CREMP (Dry Tortugas, DTCREMP) — Temptation Rock #442 (2004): 5.8% hard coral cover, 3.44 km from NOAA - White Shoal, Dry Tortugas
- FWC CREMP (Dry Tortugas, DTCREMP) — Temptation Rock #442 (2005): 6.5% hard coral cover, 3.44 km from NOAA - White Shoal, Dry Tortugas
- FWC CREMP (Dry Tortugas, DTCREMP) — Temptation Rock #442 (2006): 3.3% hard coral cover, 3.44 km from NOAA - White Shoal, Dry Tortugas
- FWC CREMP (Dry Tortugas, DTCREMP) — Temptation Rock #442 (2007): 4.3% hard coral cover, 3.44 km from NOAA - White Shoal, Dry Tortugas
- FWC CREMP (Dry Tortugas, DTCREMP) — Temptation Rock #442 (2008): 6.3% hard coral cover, 3.44 km from NOAA - White Shoal, Dry Tortugas
- FWC CREMP (Dry Tortugas, DTCREMP) — Temptation Rock #442 (2009): 7.4% hard coral cover, 3.44 km from NOAA - White Shoal, Dry Tortugas
- FWC CREMP (Dry Tortugas, DTCREMP) — Temptation Rock #442 (2010): 6.4% hard coral cover, 3.44 km from NOAA - White Shoal, Dry Tortugas
- FWC CREMP (Dry Tortugas, DTCREMP) — Temptation Rock #442 (2011): 8.5% hard coral cover, 3.44 km from NOAA - White Shoal, Dry Tortugas
- FWC CREMP (Dry Tortugas, DTCREMP) — Temptation Rock #442 (2012): 6.9% hard coral cover, 3.44 km from NOAA - White Shoal, Dry Tortugas
- FWC CREMP (Dry Tortugas, DTCREMP) — Temptation Rock #442 (2013): 6.9% hard coral cover, 3.44 km from NOAA - White Shoal, Dry Tortugas
- FWC CREMP (Dry Tortugas, DTCREMP) — Temptation Rock #442 (2014): 7.4% hard coral cover, 3.44 km from NOAA - White Shoal, Dry Tortugas
- FWC CREMP (Dry Tortugas, DTCREMP) — Temptation Rock #442 (2015): 11% hard coral cover, 3.44 km from NOAA - White Shoal, Dry Tortugas
- FWC CREMP (Dry Tortugas, DTCREMP) — Temptation Rock #442 (2016): 6.9% hard coral cover, 3.44 km from NOAA - White Shoal, Dry Tortugas
- FWC CREMP (Dry Tortugas, DTCREMP) — Temptation Rock #442 (2017): 5.4% hard coral cover, 3.44 km from NOAA - White Shoal, Dry Tortugas
- FWC CREMP (Dry Tortugas, DTCREMP) — Temptation Rock #442 (2018): 6.3% hard coral cover, 3.44 km from NOAA - White Shoal, Dry Tortugas
- FWC CREMP (Dry Tortugas, DTCREMP) — Temptation Rock #442 (2019): 7.2% hard coral cover, 3.44 km from NOAA - White Shoal, Dry Tortugas
- FWC CREMP (Dry Tortugas, DTCREMP) — Temptation Rock #442 (2020): 8.3% hard coral cover, 3.44 km from NOAA - White Shoal, Dry Tortugas
- FWC CREMP (Dry Tortugas, DTCREMP) — Temptation Rock #442 (2021): 4.6% hard coral cover, 3.44 km from NOAA - White Shoal, Dry Tortugas
- FWC CREMP (Dry Tortugas, DTCREMP) — Temptation Rock #442 (2022): 4.6% hard coral cover, 3.44 km from NOAA - White Shoal, Dry Tortugas
- FWC CREMP (Dry Tortugas, DTCREMP) — Temptation Rock #442 (2023): 4.0% hard coral cover, 3.44 km from NOAA - White Shoal, Dry Tortugas
- FWC CREMP (Dry Tortugas, DTCREMP) — Temptation Rock #442 (2024): 2.1% hard coral cover, 3.44 km from NOAA - White Shoal, Dry Tortugas
- FWC CREMP (Dry Tortugas, DTCREMP) — Temptation Rock #443 (2004): 4.0% hard coral cover, 3.44 km from NOAA - White Shoal, Dry Tortugas
- FWC CREMP (Dry Tortugas, DTCREMP) — Temptation Rock #443 (2005): 3.6% hard coral cover, 3.44 km from NOAA - White Shoal, Dry Tortugas
- FWC CREMP (Dry Tortugas, DTCREMP) — Temptation Rock #443 (2006): 4.1% hard coral cover, 3.44 km from NOAA - White Shoal, Dry Tortugas
- FWC CREMP (Dry Tortugas, DTCREMP) — Temptation Rock #443 (2007): 1.4% hard coral cover, 3.44 km from NOAA - White Shoal, Dry Tortugas
- FWC CREMP (Dry Tortugas, DTCREMP) — Temptation Rock #443 (2008): 5.3% hard coral cover, 3.44 km from NOAA - White Shoal, Dry Tortugas
- FWC CREMP (Dry Tortugas, DTCREMP) — Temptation Rock #443 (2009): 5.3% hard coral cover, 3.44 km from NOAA - White Shoal, Dry Tortugas
- FWC CREMP (Dry Tortugas, DTCREMP) — Temptation Rock #443 (2010): 1.4% hard coral cover, 3.44 km from NOAA - White Shoal, Dry Tortugas
- FWC CREMP (Dry Tortugas, DTCREMP) — Temptation Rock #443 (2011): 2.5% hard coral cover, 3.44 km from NOAA - White Shoal, Dry Tortugas
- FWC CREMP (Dry Tortugas, DTCREMP) — Temptation Rock #443 (2012): 1.5% hard coral cover, 3.44 km from NOAA - White Shoal, Dry Tortugas
- FWC CREMP (Dry Tortugas, DTCREMP) — Temptation Rock #443 (2013): 9.3% hard coral cover, 3.44 km from NOAA - White Shoal, Dry Tortugas
- FWC CREMP (Dry Tortugas, DTCREMP) — Temptation Rock #443 (2014): 7.0% hard coral cover, 3.44 km from NOAA - White Shoal, Dry Tortugas
- FWC CREMP (Dry Tortugas, DTCREMP) — Temptation Rock #443 (2015): 6.5% hard coral cover, 3.44 km from NOAA - White Shoal, Dry Tortugas
- FWC CREMP (Dry Tortugas, DTCREMP) — Temptation Rock #443 (2016): 7.8% hard coral cover, 3.44 km from NOAA - White Shoal, Dry Tortugas
- FWC CREMP (Dry Tortugas, DTCREMP) — Temptation Rock #443 (2017): 2.7% hard coral cover, 3.44 km from NOAA - White Shoal, Dry Tortugas
- FWC CREMP (Dry Tortugas, DTCREMP) — Temptation Rock #443 (2018): 1.0% hard coral cover, 3.44 km from NOAA - White Shoal, Dry Tortugas
- FWC CREMP (Dry Tortugas, DTCREMP) — Temptation Rock #443 (2019): 0.8% hard coral cover, 3.44 km from NOAA - White Shoal, Dry Tortugas
- FWC CREMP (Dry Tortugas, DTCREMP) — Temptation Rock #443 (2020): 2.5% hard coral cover, 3.44 km from NOAA - White Shoal, Dry Tortugas
- FWC CREMP (Dry Tortugas, DTCREMP) — Temptation Rock #443 (2021): 2.3% hard coral cover, 3.44 km from NOAA - White Shoal, Dry Tortugas
- FWC CREMP (Dry Tortugas, DTCREMP) — Temptation Rock #443 (2022): 1.4% hard coral cover, 3.44 km from NOAA - White Shoal, Dry Tortugas
- FWC CREMP (Dry Tortugas, DTCREMP) — Temptation Rock #443 (2023): 1.6% hard coral cover, 3.44 km from NOAA - White Shoal, Dry Tortugas
- FWC CREMP (Dry Tortugas, DTCREMP) — Temptation Rock #443 (2024): 1.1% hard coral cover, 3.44 km from NOAA - White Shoal, Dry Tortugas
- FWC CREMP (Dry Tortugas, DTCREMP) — Temptation Rock #444 (2004): 4.0% hard coral cover, 3.44 km from NOAA - White Shoal, Dry Tortugas
- FWC CREMP (Dry Tortugas, DTCREMP) — Temptation Rock #444 (2005): 2.7% hard coral cover, 3.44 km from NOAA - White Shoal, Dry Tortugas
- FWC CREMP (Dry Tortugas, DTCREMP) — Temptation Rock #444 (2006): 3.2% hard coral cover, 3.44 km from NOAA - White Shoal, Dry Tortugas
- FWC CREMP (Dry Tortugas, DTCREMP) — Temptation Rock #444 (2007): 1.1% hard coral cover, 3.44 km from NOAA - White Shoal, Dry Tortugas
- FWC CREMP (Dry Tortugas, DTCREMP) — Temptation Rock #444 (2008): 2.0% hard coral cover, 3.44 km from NOAA - White Shoal, Dry Tortugas
- FWC CREMP (Dry Tortugas, DTCREMP) — Temptation Rock #444 (2009): 3.4% hard coral cover, 3.44 km from NOAA - White Shoal, Dry Tortugas
- FWC CREMP (Dry Tortugas, DTCREMP) — Temptation Rock #444 (2010): 2.5% hard coral cover, 3.44 km from NOAA - White Shoal, Dry Tortugas
- FWC CREMP (Dry Tortugas, DTCREMP) — Temptation Rock #444 (2011): 2.9% hard coral cover, 3.44 km from NOAA - White Shoal, Dry Tortugas
- FWC CREMP (Dry Tortugas, DTCREMP) — Temptation Rock #444 (2012): 1.8% hard coral cover, 3.44 km from NOAA - White Shoal, Dry Tortugas
- FWC CREMP (Dry Tortugas, DTCREMP) — Temptation Rock #444 (2013): 1.0% hard coral cover, 3.44 km from NOAA - White Shoal, Dry Tortugas
- FWC CREMP (Dry Tortugas, DTCREMP) — Temptation Rock #444 (2014): 3.6% hard coral cover, 3.44 km from NOAA - White Shoal, Dry Tortugas
- FWC CREMP (Dry Tortugas, DTCREMP) — Temptation Rock #444 (2015): 3.0% hard coral cover, 3.44 km from NOAA - White Shoal, Dry Tortugas
- FWC CREMP (Dry Tortugas, DTCREMP) — Temptation Rock #444 (2016): 1.1% hard coral cover, 3.44 km from NOAA - White Shoal, Dry Tortugas
- FWC CREMP (Dry Tortugas, DTCREMP) — Temptation Rock #444 (2017): 3.4% hard coral cover, 3.44 km from NOAA - White Shoal, Dry Tortugas
- FWC CREMP (Dry Tortugas, DTCREMP) — Temptation Rock #444 (2018): 1.7% hard coral cover, 3.44 km from NOAA - White Shoal, Dry Tortugas
- FWC CREMP (Dry Tortugas, DTCREMP) — Temptation Rock #444 (2019): 4.2% hard coral cover, 3.44 km from NOAA - White Shoal, Dry Tortugas
- FWC CREMP (Dry Tortugas, DTCREMP) — Temptation Rock #444 (2020): 4.5% hard coral cover, 3.44 km from NOAA - White Shoal, Dry Tortugas
- FWC CREMP (Dry Tortugas, DTCREMP) — Temptation Rock #444 (2021): 7.7% hard coral cover, 3.44 km from NOAA - White Shoal, Dry Tortugas
- FWC CREMP (Dry Tortugas, DTCREMP) — Temptation Rock #444 (2022): 2.9% hard coral cover, 3.44 km from NOAA - White Shoal, Dry Tortugas
- FWC CREMP (Dry Tortugas, DTCREMP) — Temptation Rock #444 (2023): 3.4% hard coral cover, 3.44 km from NOAA - White Shoal, Dry Tortugas
- FWC CREMP (Dry Tortugas, DTCREMP) — Temptation Rock #444 (2024): 2.6% hard coral cover, 3.44 km from NOAA - White Shoal, Dry Tortugas
- FWC CREMP (Dry Tortugas, DTCREMP) — Texas Rock #291 (2009): 7.2% hard coral cover, 0.00 km from NOAA - Texas Reef, Dry Tortugas
- FWC CREMP (Dry Tortugas, DTCREMP) — Texas Rock #291 (2010): 9.2% hard coral cover, 0.00 km from NOAA - Texas Reef, Dry Tortugas
- FWC CREMP (Dry Tortugas, DTCREMP) — Texas Rock #291 (2011): 9.5% hard coral cover, 0.00 km from NOAA - Texas Reef, Dry Tortugas
- FWC CREMP (Dry Tortugas, DTCREMP) — Texas Rock #291 (2012): 10% hard coral cover, 0.00 km from NOAA - Texas Reef, Dry Tortugas
- FWC CREMP (Dry Tortugas, DTCREMP) — Texas Rock #291 (2013): 7.6% hard coral cover, 0.00 km from NOAA - Texas Reef, Dry Tortugas
- FWC CREMP (Dry Tortugas, DTCREMP) — Texas Rock #291 (2014): 10% hard coral cover, 0.00 km from NOAA - Texas Reef, Dry Tortugas
- FWC CREMP (Dry Tortugas, DTCREMP) — Texas Rock #291 (2015): 9.8% hard coral cover, 0.00 km from NOAA - Texas Reef, Dry Tortugas
- FWC CREMP (Dry Tortugas, DTCREMP) — Texas Rock #291 (2016): 6.4% hard coral cover, 0.00 km from NOAA - Texas Reef, Dry Tortugas
- FWC CREMP (Dry Tortugas, DTCREMP) — Texas Rock #291 (2017): 7.5% hard coral cover, 0.00 km from NOAA - Texas Reef, Dry Tortugas
- FWC CREMP (Dry Tortugas, DTCREMP) — Texas Rock #291 (2018): 5.9% hard coral cover, 0.00 km from NOAA - Texas Reef, Dry Tortugas
- FWC CREMP (Dry Tortugas, DTCREMP) — Texas Rock #291 (2019): 6.2% hard coral cover, 0.00 km from NOAA - Texas Reef, Dry Tortugas
- FWC CREMP (Dry Tortugas, DTCREMP) — Texas Rock #291 (2020): 7.5% hard coral cover, 0.00 km from NOAA - Texas Reef, Dry Tortugas
- FWC CREMP (Dry Tortugas, DTCREMP) — Texas Rock #291 (2021): 5.0% hard coral cover, 0.00 km from NOAA - Texas Reef, Dry Tortugas
- FWC CREMP (Dry Tortugas, DTCREMP) — Texas Rock #291 (2022): 3.8% hard coral cover, 0.00 km from NOAA - Texas Reef, Dry Tortugas
- FWC CREMP (Dry Tortugas, DTCREMP) — Texas Rock #291 (2023): 4.3% hard coral cover, 0.00 km from NOAA - Texas Reef, Dry Tortugas
- FWC CREMP (Dry Tortugas, DTCREMP) — Texas Rock #291 (2024): 2.3% hard coral cover, 0.00 km from NOAA - Texas Reef, Dry Tortugas
- FWC CREMP (Dry Tortugas, DTCREMP) — Texas Rock #292 (2009): 3.2% hard coral cover, 0.00 km from NOAA - Texas Reef, Dry Tortugas
- FWC CREMP (Dry Tortugas, DTCREMP) — Texas Rock #292 (2010): 4.6% hard coral cover, 0.00 km from NOAA - Texas Reef, Dry Tortugas
- FWC CREMP (Dry Tortugas, DTCREMP) — Texas Rock #292 (2011): 6.4% hard coral cover, 0.00 km from NOAA - Texas Reef, Dry Tortugas
- FWC CREMP (Dry Tortugas, DTCREMP) — Texas Rock #292 (2012): 5.7% hard coral cover, 0.00 km from NOAA - Texas Reef, Dry Tortugas
- FWC CREMP (Dry Tortugas, DTCREMP) — Texas Rock #292 (2013): 5.0% hard coral cover, 0.00 km from NOAA - Texas Reef, Dry Tortugas
- FWC CREMP (Dry Tortugas, DTCREMP) — Texas Rock #292 (2014): 6.3% hard coral cover, 0.00 km from NOAA - Texas Reef, Dry Tortugas
- FWC CREMP (Dry Tortugas, DTCREMP) — Texas Rock #292 (2015): 3.8% hard coral cover, 0.00 km from NOAA - Texas Reef, Dry Tortugas
- FWC CREMP (Dry Tortugas, DTCREMP) — Texas Rock #292 (2016): 7.0% hard coral cover, 0.00 km from NOAA - Texas Reef, Dry Tortugas
- FWC CREMP (Dry Tortugas, DTCREMP) — Texas Rock #292 (2017): 5.0% hard coral cover, 0.00 km from NOAA - Texas Reef, Dry Tortugas
- FWC CREMP (Dry Tortugas, DTCREMP) — Texas Rock #292 (2018): 3.6% hard coral cover, 0.00 km from NOAA - Texas Reef, Dry Tortugas
- FWC CREMP (Dry Tortugas, DTCREMP) — Texas Rock #292 (2019): 5.1% hard coral cover, 0.00 km from NOAA - Texas Reef, Dry Tortugas
- FWC CREMP (Dry Tortugas, DTCREMP) — Texas Rock #292 (2020): 5.5% hard coral cover, 0.00 km from NOAA - Texas Reef, Dry Tortugas
- FWC CREMP (Dry Tortugas, DTCREMP) — Texas Rock #292 (2021): 3.8% hard coral cover, 0.00 km from NOAA - Texas Reef, Dry Tortugas
- FWC CREMP (Dry Tortugas, DTCREMP) — Texas Rock #292 (2022): 1.9% hard coral cover, 0.00 km from NOAA - Texas Reef, Dry Tortugas
- FWC CREMP (Dry Tortugas, DTCREMP) — Texas Rock #292 (2023): 1.5% hard coral cover, 0.00 km from NOAA - Texas Reef, Dry Tortugas
- FWC CREMP (Dry Tortugas, DTCREMP) — Texas Rock #292 (2024): 2.7% hard coral cover, 0.00 km from NOAA - Texas Reef, Dry Tortugas
- FWC CREMP (Dry Tortugas, DTCREMP) — Texas Rock #293 (2009): 7.6% hard coral cover, 0.00 km from NOAA - Texas Reef, Dry Tortugas
- FWC CREMP (Dry Tortugas, DTCREMP) — Texas Rock #293 (2010): 13% hard coral cover, 0.00 km from NOAA - Texas Reef, Dry Tortugas
- FWC CREMP (Dry Tortugas, DTCREMP) — Texas Rock #293 (2011): 8.6% hard coral cover, 0.00 km from NOAA - Texas Reef, Dry Tortugas
- FWC CREMP (Dry Tortugas, DTCREMP) — Texas Rock #293 (2012): 10% hard coral cover, 0.00 km from NOAA - Texas Reef, Dry Tortugas
- FWC CREMP (Dry Tortugas, DTCREMP) — Texas Rock #293 (2013): 6.3% hard coral cover, 0.00 km from NOAA - Texas Reef, Dry Tortugas
- FWC CREMP (Dry Tortugas, DTCREMP) — Texas Rock #293 (2014): 5.1% hard coral cover, 0.00 km from NOAA - Texas Reef, Dry Tortugas
- FWC CREMP (Dry Tortugas, DTCREMP) — Texas Rock #293 (2015): 9.2% hard coral cover, 0.00 km from NOAA - Texas Reef, Dry Tortugas
- FWC CREMP (Dry Tortugas, DTCREMP) — Texas Rock #293 (2016): 7.1% hard coral cover, 0.00 km from NOAA - Texas Reef, Dry Tortugas
- FWC CREMP (Dry Tortugas, DTCREMP) — Texas Rock #293 (2017): 8.5% hard coral cover, 0.00 km from NOAA - Texas Reef, Dry Tortugas
- FWC CREMP (Dry Tortugas, DTCREMP) — Texas Rock #293 (2018): 7.3% hard coral cover, 0.00 km from NOAA - Texas Reef, Dry Tortugas
- FWC CREMP (Dry Tortugas, DTCREMP) — Texas Rock #293 (2019): 6.6% hard coral cover, 0.00 km from NOAA - Texas Reef, Dry Tortugas
- FWC CREMP (Dry Tortugas, DTCREMP) — Texas Rock #293 (2020): 5.8% hard coral cover, 0.00 km from NOAA - Texas Reef, Dry Tortugas
- FWC CREMP (Dry Tortugas, DTCREMP) — Texas Rock #293 (2021): 9.2% hard coral cover, 0.00 km from NOAA - Texas Reef, Dry Tortugas
- FWC CREMP (Dry Tortugas, DTCREMP) — Texas Rock #293 (2022): 2.8% hard coral cover, 0.00 km from NOAA - Texas Reef, Dry Tortugas
- FWC CREMP (Dry Tortugas, DTCREMP) — Texas Rock #293 (2023): 3.0% hard coral cover, 0.00 km from NOAA - Texas Reef, Dry Tortugas
- FWC CREMP (Dry Tortugas, DTCREMP) — Texas Rock #293 (2024): 2.8% hard coral cover, 0.00 km from NOAA - Texas Reef, Dry Tortugas
- FWC CREMP (Dry Tortugas, DTCREMP) — Texas Rock #294 (2009): 7.0% hard coral cover, 0.00 km from NOAA - Texas Reef, Dry Tortugas
- FWC CREMP (Dry Tortugas, DTCREMP) — Texas Rock #294 (2010): 7.2% hard coral cover, 0.00 km from NOAA - Texas Reef, Dry Tortugas
- FWC CREMP (Dry Tortugas, DTCREMP) — Texas Rock #294 (2011): 5.6% hard coral cover, 0.00 km from NOAA - Texas Reef, Dry Tortugas
- FWC CREMP (Dry Tortugas, DTCREMP) — Texas Rock #294 (2012): 8.5% hard coral cover, 0.00 km from NOAA - Texas Reef, Dry Tortugas
- FWC CREMP (Dry Tortugas, DTCREMP) — Texas Rock #294 (2013): 7.9% hard coral cover, 0.00 km from NOAA - Texas Reef, Dry Tortugas
- FWC CREMP (Dry Tortugas, DTCREMP) — Texas Rock #294 (2014): 8.2% hard coral cover, 0.00 km from NOAA - Texas Reef, Dry Tortugas
- FWC CREMP (Dry Tortugas, DTCREMP) — Texas Rock #294 (2015): 7.7% hard coral cover, 0.00 km from NOAA - Texas Reef, Dry Tortugas
- FWC CREMP (Dry Tortugas, DTCREMP) — Texas Rock #294 (2016): 7.4% hard coral cover, 0.00 km from NOAA - Texas Reef, Dry Tortugas
- FWC CREMP (Dry Tortugas, DTCREMP) — Texas Rock #294 (2017): 5.6% hard coral cover, 0.00 km from NOAA - Texas Reef, Dry Tortugas
- FWC CREMP (Dry Tortugas, DTCREMP) — Texas Rock #294 (2018): 8.3% hard coral cover, 0.00 km from NOAA - Texas Reef, Dry Tortugas
- FWC CREMP (Dry Tortugas, DTCREMP) — Texas Rock #294 (2019): 5.5% hard coral cover, 0.00 km from NOAA - Texas Reef, Dry Tortugas
- FWC CREMP (Dry Tortugas, DTCREMP) — Texas Rock #294 (2020): 7.5% hard coral cover, 0.00 km from NOAA - Texas Reef, Dry Tortugas
- FWC CREMP (Dry Tortugas, DTCREMP) — Texas Rock #294 (2021): 9.4% hard coral cover, 0.00 km from NOAA - Texas Reef, Dry Tortugas
- FWC CREMP (Dry Tortugas, DTCREMP) — Texas Rock #294 (2022): 5.3% hard coral cover, 0.00 km from NOAA - Texas Reef, Dry Tortugas
- FWC CREMP (Dry Tortugas, DTCREMP) — Texas Rock #294 (2023): 4.4% hard coral cover, 0.00 km from NOAA - Texas Reef, Dry Tortugas
- FWC CREMP (Dry Tortugas, DTCREMP) — Texas Rock #294 (2024): 4.8% hard coral cover, 0.00 km from NOAA - Texas Reef, Dry Tortugas
- FWC CREMP (Dry Tortugas, DTCREMP) — White Shoal #411 (1999): 9.0% hard coral cover, 0.06 km from NOAA - White Shoal, Dry Tortugas
- FWC CREMP (Dry Tortugas, DTCREMP) — White Shoal #411 (2000): 9.0% hard coral cover, 0.06 km from NOAA - White Shoal, Dry Tortugas
- FWC CREMP (Dry Tortugas, DTCREMP) — White Shoal #411 (2001): 6.4% hard coral cover, 0.06 km from NOAA - White Shoal, Dry Tortugas
- FWC CREMP (Dry Tortugas, DTCREMP) — White Shoal #411 (2002): 8.8% hard coral cover, 0.06 km from NOAA - White Shoal, Dry Tortugas
- FWC CREMP (Dry Tortugas, DTCREMP) — White Shoal #411 (2003): 5.2% hard coral cover, 0.06 km from NOAA - White Shoal, Dry Tortugas
- FWC CREMP (Dry Tortugas, DTCREMP) — White Shoal #411 (2004): 3.6% hard coral cover, 0.06 km from NOAA - White Shoal, Dry Tortugas
- FWC CREMP (Dry Tortugas, DTCREMP) — White Shoal #411 (2005): 3.3% hard coral cover, 0.06 km from NOAA - White Shoal, Dry Tortugas
- FWC CREMP (Dry Tortugas, DTCREMP) — White Shoal #411 (2006): 3.2% hard coral cover, 0.06 km from NOAA - White Shoal, Dry Tortugas
- FWC CREMP (Dry Tortugas, DTCREMP) — White Shoal #411 (2007): 2.9% hard coral cover, 0.06 km from NOAA - White Shoal, Dry Tortugas
- FWC CREMP (Dry Tortugas, DTCREMP) — White Shoal #411 (2008): 3.1% hard coral cover, 0.06 km from NOAA - White Shoal, Dry Tortugas
- FWC CREMP (Dry Tortugas, DTCREMP) — White Shoal #411 (2009): 2.6% hard coral cover, 0.06 km from NOAA - White Shoal, Dry Tortugas
- FWC CREMP (Dry Tortugas, DTCREMP) — White Shoal #411 (2010): 3.9% hard coral cover, 0.06 km from NOAA - White Shoal, Dry Tortugas
- FWC CREMP (Dry Tortugas, DTCREMP) — White Shoal #411 (2011): 4.7% hard coral cover, 0.06 km from NOAA - White Shoal, Dry Tortugas
- FWC CREMP (Dry Tortugas, DTCREMP) — White Shoal #411 (2012): 3.5% hard coral cover, 0.06 km from NOAA - White Shoal, Dry Tortugas
- FWC CREMP (Dry Tortugas, DTCREMP) — White Shoal #411 (2013): 4.3% hard coral cover, 0.06 km from NOAA - White Shoal, Dry Tortugas
- FWC CREMP (Dry Tortugas, DTCREMP) — White Shoal #411 (2014): 4.8% hard coral cover, 0.06 km from NOAA - White Shoal, Dry Tortugas
- FWC CREMP (Dry Tortugas, DTCREMP) — White Shoal #411 (2015): 3.8% hard coral cover, 0.06 km from NOAA - White Shoal, Dry Tortugas
- FWC CREMP (Dry Tortugas, DTCREMP) — White Shoal #411 (2016): 5.2% hard coral cover, 0.06 km from NOAA - White Shoal, Dry Tortugas
- FWC CREMP (Dry Tortugas, DTCREMP) — White Shoal #411 (2017): 4.3% hard coral cover, 0.06 km from NOAA - White Shoal, Dry Tortugas
- FWC CREMP (Dry Tortugas, DTCREMP) — White Shoal #411 (2018): 5.0% hard coral cover, 0.06 km from NOAA - White Shoal, Dry Tortugas
- FWC CREMP (Dry Tortugas, DTCREMP) — White Shoal #411 (2019): 4.5% hard coral cover, 0.06 km from NOAA - White Shoal, Dry Tortugas
- FWC CREMP (Dry Tortugas, DTCREMP) — White Shoal #411 (2020): 5.6% hard coral cover, 0.06 km from NOAA - White Shoal, Dry Tortugas
- FWC CREMP (Dry Tortugas, DTCREMP) — White Shoal #411 (2021): 6.9% hard coral cover, 0.06 km from NOAA - White Shoal, Dry Tortugas
- FWC CREMP (Dry Tortugas, DTCREMP) — White Shoal #411 (2022): 5.3% hard coral cover, 0.06 km from NOAA - White Shoal, Dry Tortugas
- FWC CREMP (Dry Tortugas, DTCREMP) — White Shoal #411 (2023): 4.0% hard coral cover, 0.06 km from NOAA - White Shoal, Dry Tortugas
- FWC CREMP (Dry Tortugas, DTCREMP) — White Shoal #411 (2024): 0.5% hard coral cover, 0.06 km from NOAA - White Shoal, Dry Tortugas
- FWC CREMP (Dry Tortugas, DTCREMP) — White Shoal #412 (1999): 12% hard coral cover, 0.06 km from NOAA - White Shoal, Dry Tortugas
- FWC CREMP (Dry Tortugas, DTCREMP) — White Shoal #412 (2000): 10% hard coral cover, 0.06 km from NOAA - White Shoal, Dry Tortugas
- FWC CREMP (Dry Tortugas, DTCREMP) — White Shoal #412 (2001): 6.1% hard coral cover, 0.06 km from NOAA - White Shoal, Dry Tortugas
- FWC CREMP (Dry Tortugas, DTCREMP) — White Shoal #412 (2002): 4.6% hard coral cover, 0.06 km from NOAA - White Shoal, Dry Tortugas
- FWC CREMP (Dry Tortugas, DTCREMP) — White Shoal #412 (2003): 3.6% hard coral cover, 0.06 km from NOAA - White Shoal, Dry Tortugas
- FWC CREMP (Dry Tortugas, DTCREMP) — White Shoal #412 (2004): 0.8% hard coral cover, 0.06 km from NOAA - White Shoal, Dry Tortugas
- FWC CREMP (Dry Tortugas, DTCREMP) — White Shoal #412 (2005): 0.9% hard coral cover, 0.06 km from NOAA - White Shoal, Dry Tortugas
- FWC CREMP (Dry Tortugas, DTCREMP) — White Shoal #412 (2006): 0.4% hard coral cover, 0.06 km from NOAA - White Shoal, Dry Tortugas
- FWC CREMP (Dry Tortugas, DTCREMP) — White Shoal #412 (2007): 0.5% hard coral cover, 0.06 km from NOAA - White Shoal, Dry Tortugas
- FWC CREMP (Dry Tortugas, DTCREMP) — White Shoal #412 (2008): 1.4% hard coral cover, 0.06 km from NOAA - White Shoal, Dry Tortugas
- FWC CREMP (Dry Tortugas, DTCREMP) — White Shoal #412 (2009): 0.4% hard coral cover, 0.06 km from NOAA - White Shoal, Dry Tortugas
- FWC CREMP (Dry Tortugas, DTCREMP) — White Shoal #412 (2010): 2.5% hard coral cover, 0.06 km from NOAA - White Shoal, Dry Tortugas
- FWC CREMP (Dry Tortugas, DTCREMP) — White Shoal #412 (2011): 1.8% hard coral cover, 0.06 km from NOAA - White Shoal, Dry Tortugas
- FWC CREMP (Dry Tortugas, DTCREMP) — White Shoal #412 (2012): 1.4% hard coral cover, 0.06 km from NOAA - White Shoal, Dry Tortugas
- FWC CREMP (Dry Tortugas, DTCREMP) — White Shoal #412 (2013): 2.5% hard coral cover, 0.06 km from NOAA - White Shoal, Dry Tortugas
- FWC CREMP (Dry Tortugas, DTCREMP) — White Shoal #412 (2014): 2.5% hard coral cover, 0.06 km from NOAA - White Shoal, Dry Tortugas
- FWC CREMP (Dry Tortugas, DTCREMP) — White Shoal #412 (2015): 3.7% hard coral cover, 0.06 km from NOAA - White Shoal, Dry Tortugas
- FWC CREMP (Dry Tortugas, DTCREMP) — White Shoal #412 (2016): 2.5% hard coral cover, 0.06 km from NOAA - White Shoal, Dry Tortugas
- FWC CREMP (Dry Tortugas, DTCREMP) — White Shoal #412 (2017): 4.3% hard coral cover, 0.06 km from NOAA - White Shoal, Dry Tortugas
- FWC CREMP (Dry Tortugas, DTCREMP) — White Shoal #412 (2018): 3.1% hard coral cover, 0.06 km from NOAA - White Shoal, Dry Tortugas
- FWC CREMP (Dry Tortugas, DTCREMP) — White Shoal #412 (2019): 2.0% hard coral cover, 0.06 km from NOAA - White Shoal, Dry Tortugas
- FWC CREMP (Dry Tortugas, DTCREMP) — White Shoal #412 (2020): 6.4% hard coral cover, 0.06 km from NOAA - White Shoal, Dry Tortugas
- FWC CREMP (Dry Tortugas, DTCREMP) — White Shoal #412 (2021): 2.6% hard coral cover, 0.06 km from NOAA - White Shoal, Dry Tortugas
- FWC CREMP (Dry Tortugas, DTCREMP) — White Shoal #412 (2022): 2.9% hard coral cover, 0.06 km from NOAA - White Shoal, Dry Tortugas
- FWC CREMP (Dry Tortugas, DTCREMP) — White Shoal #412 (2023): 0.1% hard coral cover, 0.06 km from NOAA - White Shoal, Dry Tortugas
- FWC CREMP (Dry Tortugas, DTCREMP) — White Shoal #412 (2024): 0.0% hard coral cover, 0.06 km from NOAA - White Shoal, Dry Tortugas
- FWC CREMP (Dry Tortugas, DTCREMP) — White Shoal #413 (1999): 11% hard coral cover, 0.06 km from NOAA - White Shoal, Dry Tortugas
- FWC CREMP (Dry Tortugas, DTCREMP) — White Shoal #413 (2000): 6.9% hard coral cover, 0.06 km from NOAA - White Shoal, Dry Tortugas
- FWC CREMP (Dry Tortugas, DTCREMP) — White Shoal #413 (2001): 4.3% hard coral cover, 0.06 km from NOAA - White Shoal, Dry Tortugas
- FWC CREMP (Dry Tortugas, DTCREMP) — White Shoal #413 (2002): 7.4% hard coral cover, 0.06 km from NOAA - White Shoal, Dry Tortugas
- FWC CREMP (Dry Tortugas, DTCREMP) — White Shoal #413 (2003): 6.2% hard coral cover, 0.06 km from NOAA - White Shoal, Dry Tortugas
- FWC CREMP (Dry Tortugas, DTCREMP) — White Shoal #413 (2004): 1.4% hard coral cover, 0.06 km from NOAA - White Shoal, Dry Tortugas
- FWC CREMP (Dry Tortugas, DTCREMP) — White Shoal #413 (2005): 0.1% hard coral cover, 0.06 km from NOAA - White Shoal, Dry Tortugas
- FWC CREMP (Dry Tortugas, DTCREMP) — White Shoal #413 (2006): 0.3% hard coral cover, 0.06 km from NOAA - White Shoal, Dry Tortugas
- FWC CREMP (Dry Tortugas, DTCREMP) — White Shoal #413 (2007): 0.0% hard coral cover, 0.06 km from NOAA - White Shoal, Dry Tortugas
- FWC CREMP (Dry Tortugas, DTCREMP) — White Shoal #413 (2008): 0.4% hard coral cover, 0.06 km from NOAA - White Shoal, Dry Tortugas
- FWC CREMP (Dry Tortugas, DTCREMP) — White Shoal #413 (2009): 0.7% hard coral cover, 0.06 km from NOAA - White Shoal, Dry Tortugas
- FWC CREMP (Dry Tortugas, DTCREMP) — White Shoal #413 (2010): 0.6% hard coral cover, 0.06 km from NOAA - White Shoal, Dry Tortugas
- FWC CREMP (Dry Tortugas, DTCREMP) — White Shoal #413 (2011): 0.9% hard coral cover, 0.06 km from NOAA - White Shoal, Dry Tortugas
- FWC CREMP (Dry Tortugas, DTCREMP) — White Shoal #413 (2012): 0.5% hard coral cover, 0.06 km from NOAA - White Shoal, Dry Tortugas
- FWC CREMP (Dry Tortugas, DTCREMP) — White Shoal #413 (2013): 2.0% hard coral cover, 0.06 km from NOAA - White Shoal, Dry Tortugas
- FWC CREMP (Dry Tortugas, DTCREMP) — White Shoal #413 (2014): 2.7% hard coral cover, 0.06 km from NOAA - White Shoal, Dry Tortugas
- FWC CREMP (Dry Tortugas, DTCREMP) — White Shoal #413 (2015): 4.7% hard coral cover, 0.06 km from NOAA - White Shoal, Dry Tortugas
- FWC CREMP (Dry Tortugas, DTCREMP) — White Shoal #413 (2016): 3.3% hard coral cover, 0.06 km from NOAA - White Shoal, Dry Tortugas
- FWC CREMP (Dry Tortugas, DTCREMP) — White Shoal #413 (2017): 4.1% hard coral cover, 0.06 km from NOAA - White Shoal, Dry Tortugas
- FWC CREMP (Dry Tortugas, DTCREMP) — White Shoal #413 (2018): 1.9% hard coral cover, 0.06 km from NOAA - White Shoal, Dry Tortugas
- FWC CREMP (Dry Tortugas, DTCREMP) — White Shoal #413 (2019): 2.6% hard coral cover, 0.06 km from NOAA - White Shoal, Dry Tortugas
- FWC CREMP (Dry Tortugas, DTCREMP) — White Shoal #413 (2020): 3.8% hard coral cover, 0.06 km from NOAA - White Shoal, Dry Tortugas
- FWC CREMP (Dry Tortugas, DTCREMP) — White Shoal #413 (2021): 0.7% hard coral cover, 0.06 km from NOAA - White Shoal, Dry Tortugas
- FWC CREMP (Dry Tortugas, DTCREMP) — White Shoal #413 (2022): 4.4% hard coral cover, 0.06 km from NOAA - White Shoal, Dry Tortugas
- FWC CREMP (Dry Tortugas, DTCREMP) — White Shoal #413 (2023): 0.3% hard coral cover, 0.06 km from NOAA - White Shoal, Dry Tortugas
- FWC CREMP (Dry Tortugas, DTCREMP) — White Shoal #413 (2024): 0.0% hard coral cover, 0.06 km from NOAA - White Shoal, Dry Tortugas
- FWC CREMP (Dry Tortugas, DTCREMP) — White Shoal #414 (1999): 3.6% hard coral cover, 0.07 km from NOAA - White Shoal, Dry Tortugas
- FWC CREMP (Dry Tortugas, DTCREMP) — White Shoal #414 (2000): 5.4% hard coral cover, 0.07 km from NOAA - White Shoal, Dry Tortugas
- FWC CREMP (Dry Tortugas, DTCREMP) — White Shoal #414 (2001): 4.5% hard coral cover, 0.07 km from NOAA - White Shoal, Dry Tortugas
- FWC CREMP (Dry Tortugas, DTCREMP) — White Shoal #414 (2002): 5.9% hard coral cover, 0.07 km from NOAA - White Shoal, Dry Tortugas
- FWC CREMP (Dry Tortugas, DTCREMP) — White Shoal #414 (2003): 2.0% hard coral cover, 0.07 km from NOAA - White Shoal, Dry Tortugas
- FWC CREMP (Dry Tortugas, DTCREMP) — White Shoal #414 (2004): 1.7% hard coral cover, 0.07 km from NOAA - White Shoal, Dry Tortugas
- FWC CREMP (Dry Tortugas, DTCREMP) — White Shoal #414 (2005): 1.1% hard coral cover, 0.07 km from NOAA - White Shoal, Dry Tortugas
- FWC CREMP (Dry Tortugas, DTCREMP) — White Shoal #414 (2006): 1.7% hard coral cover, 0.07 km from NOAA - White Shoal, Dry Tortugas
- FWC CREMP (Dry Tortugas, DTCREMP) — White Shoal #414 (2007): 0.6% hard coral cover, 0.07 km from NOAA - White Shoal, Dry Tortugas
- FWC CREMP (Dry Tortugas, DTCREMP) — White Shoal #414 (2008): 1.0% hard coral cover, 0.07 km from NOAA - White Shoal, Dry Tortugas
- FWC CREMP (Dry Tortugas, DTCREMP) — White Shoal #414 (2009): 2.2% hard coral cover, 0.07 km from NOAA - White Shoal, Dry Tortugas
- FWC CREMP (Dry Tortugas, DTCREMP) — White Shoal #414 (2010): 1.6% hard coral cover, 0.07 km from NOAA - White Shoal, Dry Tortugas
- FWC CREMP (Dry Tortugas, DTCREMP) — White Shoal #414 (2011): 2.4% hard coral cover, 0.07 km from NOAA - White Shoal, Dry Tortugas
- FWC CREMP (Dry Tortugas, DTCREMP) — White Shoal #414 (2012): 2.0% hard coral cover, 0.07 km from NOAA - White Shoal, Dry Tortugas
- FWC CREMP (Dry Tortugas, DTCREMP) — White Shoal #414 (2013): 1.9% hard coral cover, 0.07 km from NOAA - White Shoal, Dry Tortugas
- FWC CREMP (Dry Tortugas, DTCREMP) — White Shoal #414 (2014): 3.7% hard coral cover, 0.07 km from NOAA - White Shoal, Dry Tortugas
- FWC CREMP (Dry Tortugas, DTCREMP) — White Shoal #414 (2015): 4.0% hard coral cover, 0.07 km from NOAA - White Shoal, Dry Tortugas
- FWC CREMP (Dry Tortugas, DTCREMP) — White Shoal #414 (2016): 3.2% hard coral cover, 0.07 km from NOAA - White Shoal, Dry Tortugas
- FWC CREMP (Dry Tortugas, DTCREMP) — White Shoal #414 (2017): 2.6% hard coral cover, 0.07 km from NOAA - White Shoal, Dry Tortugas
- FWC CREMP (Dry Tortugas, DTCREMP) — White Shoal #414 (2018): 1.3% hard coral cover, 0.07 km from NOAA - White Shoal, Dry Tortugas
- FWC CREMP (Dry Tortugas, DTCREMP) — White Shoal #414 (2019): 1.2% hard coral cover, 0.07 km from NOAA - White Shoal, Dry Tortugas
- FWC CREMP (Dry Tortugas, DTCREMP) — White Shoal #414 (2020): 1.9% hard coral cover, 0.07 km from NOAA - White Shoal, Dry Tortugas
- FWC CREMP (Dry Tortugas, DTCREMP) — White Shoal #414 (2021): 2.9% hard coral cover, 0.07 km from NOAA - White Shoal, Dry Tortugas
- FWC CREMP (Dry Tortugas, DTCREMP) — White Shoal #414 (2022): 4.5% hard coral cover, 0.07 km from NOAA - White Shoal, Dry Tortugas
- FWC CREMP (Dry Tortugas, DTCREMP) — White Shoal #414 (2023): 2.0% hard coral cover, 0.07 km from NOAA - White Shoal, Dry Tortugas
- FWC CREMP (Dry Tortugas, DTCREMP) — White Shoal #414 (2024): 1.5% hard coral cover, 0.07 km from NOAA - White Shoal, Dry Tortugas
- NOAA NCRMP — Tortugas-1 (2014): 10% hard coral cover, 2.98 km from NOAA - Pulaski Shoal, Dry Tortugas
- NOAA NCRMP — Tortugas-104 (2014): 7.0% hard coral cover, 0.39 km from NOAA - White Shoal, Dry Tortugas
- NOAA NCRMP — Tortugas-105 (2014): 10% hard coral cover, 1.94 km from NOAA - Texas Reef, Dry Tortugas
- NOAA NCRMP — Tortugas-105 (2016): 7.0% hard coral cover, 1.94 km from NOAA - Texas Reef, Dry Tortugas
- NOAA NCRMP — Tortugas-106 (2014): 10% hard coral cover, 3.35 km from NOAA - Texas Reef, Dry Tortugas
- NOAA NCRMP — Tortugas-107 (2014): 19% hard coral cover, 4.00 km from NOAA - Black Coral Rock, Dry Tortugas
- NOAA NCRMP — Tortugas-116 (2014): 37% hard coral cover, 3.93 km from NOAA - White Shoal, Dry Tortugas
- NOAA NCRMP — Tortugas-117 (2014): 40% hard coral cover, 4.83 km from NOAA - White Shoal, Dry Tortugas
- NOAA NCRMP — Tortugas-118 (2014): 3.0% hard coral cover, 4.48 km from NOAA - White Shoal, Dry Tortugas
- NOAA NCRMP — Tortugas-129 (2016): 13% hard coral cover, 3.43 km from NOAA - Pulaski Shoal, Dry Tortugas
- NOAA NCRMP — Tortugas-13 (2014): 6.0% hard coral cover, 4.66 km from NOAA - Texas Reef, Dry Tortugas
- NOAA NCRMP — Tortugas-130 (2014): 0.0% hard coral cover, 4.91 km from NOAA - Pulaski Shoal, Dry Tortugas
- NOAA NCRMP — Tortugas-130 (2016): 0.0% hard coral cover, 4.91 km from NOAA - Pulaski Shoal, Dry Tortugas
- NOAA NCRMP — Tortugas-131 (2016): 25% hard coral cover, 4.77 km from NOAA - Pulaski Shoal, Dry Tortugas
- NOAA NCRMP — Tortugas-133 (2016): 1.0% hard coral cover, 4.77 km from NOAA - Pulaski Shoal, Dry Tortugas
- NOAA NCRMP — Tortugas-134 (2016): 3.0% hard coral cover, 4.77 km from NOAA - Pulaski Shoal, Dry Tortugas
- NOAA NCRMP — Tortugas-135 (2016): 11% hard coral cover, 4.77 km from NOAA - Pulaski Shoal, Dry Tortugas
- NOAA NCRMP — Tortugas-136 (2016): 2.0% hard coral cover, 4.77 km from NOAA - Pulaski Shoal, Dry Tortugas
- NOAA NCRMP — Tortugas-137 (2016): 1.0% hard coral cover, 2.47 km from NOAA - Black Coral Rock, Dry Tortugas
- NOAA NCRMP — Tortugas-138 (2016): 3.0% hard coral cover, 1.43 km from NOAA - Black Coral Rock, Dry Tortugas
- NOAA NCRMP — Tortugas-139 (2016): 1.2% hard coral cover, 0.79 km from NOAA - Black Coral Rock, Dry Tortugas
- NOAA NCRMP — Tortugas-14 (2014): 1.0% hard coral cover, 3.32 km from NOAA - Texas Reef, Dry Tortugas
- NOAA NCRMP — Tortugas-140 (2016): 3.0% hard coral cover, 1.30 km from NOAA - Black Coral Rock, Dry Tortugas
- NOAA NCRMP — Tortugas-141 (2016): 0.0% hard coral cover, 0.24 km from NOAA - Black Coral Rock, Dry Tortugas
- NOAA NCRMP — Tortugas-142 (2016): 9.0% hard coral cover, 0.24 km from NOAA - Black Coral Rock, Dry Tortugas
- NOAA NCRMP — Tortugas-143 (2016): 5.0% hard coral cover, 2.61 km from NOAA - Black Coral Rock, Dry Tortugas
- NOAA NCRMP — Tortugas-144 (2016): 3.0% hard coral cover, 1.71 km from NOAA - Black Coral Rock, Dry Tortugas
- NOAA NCRMP — Tortugas-145 (2016): 22% hard coral cover, 2.47 km from NOAA - Black Coral Rock, Dry Tortugas
- NOAA NCRMP — Tortugas-146 (2016): 14% hard coral cover, 2.47 km from NOAA - Black Coral Rock, Dry Tortugas
- NOAA NCRMP — Tortugas-147 (2016): 4.0% hard coral cover, 2.16 km from NOAA - Black Coral Rock, Dry Tortugas
- NOAA NCRMP — Tortugas-148 (2016): 2.0% hard coral cover, 2.29 km from NOAA - Black Coral Rock, Dry Tortugas
- NOAA NCRMP — Tortugas-149 (2016): 19% hard coral cover, 3.53 km from NOAA - Black Coral Rock, Dry Tortugas
- NOAA NCRMP — Tortugas-15 (2014): 8.0% hard coral cover, 3.31 km from NOAA - Texas Reef, Dry Tortugas
- NOAA NCRMP — Tortugas-150 (2016): 18% hard coral cover, 2.80 km from NOAA - Black Coral Rock, Dry Tortugas
- NOAA NCRMP — Tortugas-151 (2016): 36% hard coral cover, 3.72 km from NOAA - Black Coral Rock, Dry Tortugas
- NOAA NCRMP — Tortugas-152 (2016): 5.0% hard coral cover, 4.73 km from NOAA - Black Coral Rock, Dry Tortugas
- NOAA NCRMP — Tortugas-153 (2016): 0.0% hard coral cover, 4.64 km from NOAA - Bird Key Reef, Dry Tortugas
- NOAA NCRMP — Tortugas-154 (2016): 8.0% hard coral cover, 4.05 km from NOAA - Bird Key Reef, Dry Tortugas
- NOAA NCRMP — Tortugas-155 (2016): 27% hard coral cover, 2.61 km from NOAA - Bird Key Reef, Dry Tortugas
- NOAA NCRMP — Tortugas-156 (2016): 7.0% hard coral cover, 2.41 km from NOAA - Bird Key Reef, Dry Tortugas
- NOAA NCRMP — Tortugas-157 (2016): 4.0% hard coral cover, 1.30 km from NOAA - Bird Key Reef, Dry Tortugas
- NOAA NCRMP — Tortugas-158 (2016): 7.0% hard coral cover, 1.30 km from NOAA - Bird Key Reef, Dry Tortugas
- NOAA NCRMP — Tortugas-159 (2016): 16% hard coral cover, 0.19 km from NOAA - Bird Key Reef, Dry Tortugas
- NOAA NCRMP — Tortugas-16 (2014): 0.0% hard coral cover, 4.12 km from NOAA - Texas Reef, Dry Tortugas
- NOAA NCRMP — Tortugas-160 (2016): 16% hard coral cover, 0.19 km from NOAA - Bird Key Reef, Dry Tortugas
- NOAA NCRMP — Tortugas-161 (2016): 8.0% hard coral cover, 1.38 km from NOAA - Bird Key Reef, Dry Tortugas
- NOAA NCRMP — Tortugas-162 (2016): 6.0% hard coral cover, 2.28 km from NOAA - Bird Key Reef, Dry Tortugas
- NOAA NCRMP — Tortugas-164 (2016): 26% hard coral cover, 4.89 km from NOAA - White Shoal, Dry Tortugas
- NOAA NCRMP — Tortugas-165 (2016): 13% hard coral cover, 4.89 km from NOAA - White Shoal, Dry Tortugas
- NOAA NCRMP — Tortugas-166 (2016): 10% hard coral cover, 3.38 km from NOAA - White Shoal, Dry Tortugas
- NOAA NCRMP — Tortugas-167 (2016): 22% hard coral cover, 3.31 km from NOAA - Bird Key Reef, Dry Tortugas
- NOAA NCRMP — Tortugas-168 (2016): 2.0% hard coral cover, 3.43 km from NOAA - Texas Reef, Dry Tortugas
- NOAA NCRMP — Tortugas-169 (2016): 14% hard coral cover, 2.75 km from NOAA - Texas Reef, Dry Tortugas
- NOAA NCRMP — Tortugas-17 (2014): 2.0% hard coral cover, 2.50 km from NOAA - Texas Reef, Dry Tortugas
- NOAA NCRMP — Tortugas-176 (2016): 6.0% hard coral cover, 4.39 km from NOAA - White Shoal, Dry Tortugas
- NOAA NCRMP — Tortugas-177 (2016): 7.0% hard coral cover, 3.38 km from NOAA - White Shoal, Dry Tortugas
- NOAA NCRMP — Tortugas-179 (2016): 0.0% hard coral cover, 4.57 km from NOAA - White Shoal, Dry Tortugas
- NOAA NCRMP — Tortugas-18 (2014): 3.0% hard coral cover, 1.49 km from NOAA - Texas Reef, Dry Tortugas
- NOAA NCRMP — Tortugas-180 (2016): 1.0% hard coral cover, 3.62 km from NOAA - White Shoal, Dry Tortugas
- NOAA NCRMP — Tortugas-185 (2016): 2.0% hard coral cover, 3.35 km from NOAA - Texas Reef, Dry Tortugas
- NOAA NCRMP — Tortugas-186 (2016): 3.0% hard coral cover, 4.70 km from NOAA - Texas Reef, Dry Tortugas
- NOAA NCRMP — Tortugas-187 (2016): 2.0% hard coral cover, 4.55 km from NOAA - Pulaski Shoal, Dry Tortugas
- NOAA NCRMP — Tortugas-188 (2016): 1.0% hard coral cover, 4.60 km from NOAA - Pulaski Shoal, Dry Tortugas
- NOAA NCRMP — Tortugas-19 (2014): 9.0% hard coral cover, 1.16 km from NOAA - Texas Reef, Dry Tortugas
- NOAA NCRMP — Tortugas-197 (2016): 2.0% hard coral cover, 3.02 km from NOAA - Bird Key Reef, Dry Tortugas
- NOAA NCRMP — Tortugas-198 (2016): 5.0% hard coral cover, 3.02 km from NOAA - Bird Key Reef, Dry Tortugas
- NOAA NCRMP — Tortugas-199 (2016): 1.0% hard coral cover, 2.45 km from NOAA - White Shoal, Dry Tortugas
- NOAA NCRMP — Tortugas-2 (2014): 2.0% hard coral cover, 3.05 km from NOAA - Pulaski Shoal, Dry Tortugas
- NOAA NCRMP — Tortugas-214 (2016): 7.0% hard coral cover, 4.14 km from NOAA - Pulaski Shoal, Dry Tortugas
- NOAA NCRMP — Tortugas-215 (2016): 5.0% hard coral cover, 0.80 km from NOAA - Pulaski Shoal, Dry Tortugas
- NOAA NCRMP — Tortugas-216 (2016): 7.0% hard coral cover, 1.64 km from NOAA - Pulaski Shoal, Dry Tortugas
- NOAA NCRMP — Tortugas-217 (2016): 5.0% hard coral cover, 3.77 km from NOAA - Pulaski Shoal, Dry Tortugas
- NOAA NCRMP — Tortugas-218 (2016): 17% hard coral cover, 2.81 km from NOAA - Black Coral Rock, Dry Tortugas
- NOAA NCRMP — Tortugas-219 (2016): 18% hard coral cover, 4.83 km from NOAA - Black Coral Rock, Dry Tortugas
- NOAA NCRMP — Tortugas-231 (2016): 14% hard coral cover, 4.12 km from NOAA - Texas Reef, Dry Tortugas
- NOAA NCRMP — Tortugas-234 (2016): 6.0% hard coral cover, 4.38 km from NOAA - Bird Key Reef, Dry Tortugas
- NOAA NCRMP — Tortugas-235 (2016): 3.0% hard coral cover, 4.54 km from NOAA - Bird Key Reef, Dry Tortugas
- NOAA NCRMP — Tortugas-236 (2016): 3.0% hard coral cover, 1.16 km from NOAA - Texas Reef, Dry Tortugas
- NOAA NCRMP — Tortugas-237 (2016): 6.0% hard coral cover, 4.42 km from NOAA - Texas Reef, Dry Tortugas
- NOAA NCRMP — Tortugas-28 (2014): 1.0% hard coral cover, 4.38 km from NOAA - Black Coral Rock, Dry Tortugas
- NOAA NCRMP — Tortugas-29 (2014): 7.0% hard coral cover, 2.61 km from NOAA - Black Coral Rock, Dry Tortugas
- NOAA NCRMP — Tortugas-3 (2014): 4.0% hard coral cover, 3.43 km from NOAA - Pulaski Shoal, Dry Tortugas
- NOAA NCRMP — Tortugas-30 (2014): 4.0% hard coral cover, 3.21 km from NOAA - Black Coral Rock, Dry Tortugas
- NOAA NCRMP — Tortugas-31 (2014): 2.0% hard coral cover, 1.71 km from NOAA - Black Coral Rock, Dry Tortugas
- NOAA NCRMP — Tortugas-32 (2014): 4.0% hard coral cover, 1.71 km from NOAA - Black Coral Rock, Dry Tortugas
- NOAA NCRMP — Tortugas-33 (2014): 4.0% hard coral cover, 0.79 km from NOAA - Black Coral Rock, Dry Tortugas
- NOAA NCRMP — Tortugas-34 (2014): 9.0% hard coral cover, 3.53 km from NOAA - Black Coral Rock, Dry Tortugas
- NOAA NCRMP — Tortugas-35 (2014): 9.0% hard coral cover, 3.53 km from NOAA - Black Coral Rock, Dry Tortugas
- NOAA NCRMP — Tortugas-36 (2014): 5.0% hard coral cover, 4.69 km from NOAA - Bird Key Reef, Dry Tortugas
- NOAA NCRMP — Tortugas-37 (2014): 27% hard coral cover, 4.23 km from NOAA - Bird Key Reef, Dry Tortugas
- NOAA NCRMP — Tortugas-38 (2014): 0.0% hard coral cover, 2.45 km from NOAA - White Shoal, Dry Tortugas
- NOAA NCRMP — Tortugas-39 (2014): 1.0% hard coral cover, 1.36 km from NOAA - White Shoal, Dry Tortugas
- NOAA NCRMP — Tortugas-4 (2014): 6.0% hard coral cover, 4.91 km from NOAA - Pulaski Shoal, Dry Tortugas
- NOAA NCRMP — Tortugas-40 (2014): 4.0% hard coral cover, 4.23 km from NOAA - Texas Reef, Dry Tortugas
- NOAA NCRMP — Tortugas-44 (2014): 0.0% hard coral cover, 1.61 km from NOAA - Black Coral Rock, Dry Tortugas
- NOAA NCRMP — Tortugas-45 (2014): 1.0% hard coral cover, 1.30 km from NOAA - Black Coral Rock, Dry Tortugas
- NOAA NCRMP — Tortugas-46 (2014): 11% hard coral cover, 2.80 km from NOAA - Black Coral Rock, Dry Tortugas
- NOAA NCRMP — Tortugas-47 (2014): 9.0% hard coral cover, 3.48 km from NOAA - Black Coral Rock, Dry Tortugas
- NOAA NCRMP — Tortugas-48 (2014): 10% hard coral cover, 3.48 km from NOAA - Black Coral Rock, Dry Tortugas
- NOAA NCRMP — Tortugas-49 (2014): 10% hard coral cover, 4.54 km from NOAA - Black Coral Rock, Dry Tortugas
- NOAA NCRMP — Tortugas-5 (2014): 4.0% hard coral cover, 4.91 km from NOAA - Pulaski Shoal, Dry Tortugas
- NOAA NCRMP — Tortugas-56 (2014): 23% hard coral cover, 4.60 km from NOAA - White Shoal, Dry Tortugas
- NOAA NCRMP — Tortugas-57 (2014): 28% hard coral cover, 4.60 km from NOAA - White Shoal, Dry Tortugas
- NOAA NCRMP — Tortugas-58 (2014): 17% hard coral cover, 4.83 km from NOAA - White Shoal, Dry Tortugas
- NOAA NCRMP — Tortugas-58 (2016): 20% hard coral cover, 4.83 km from NOAA - White Shoal, Dry Tortugas
- NOAA NCRMP — Tortugas-59 (2014): 4.0% hard coral cover, 3.38 km from NOAA - White Shoal, Dry Tortugas
- NOAA NCRMP — Tortugas-60 (2014): 1.0% hard coral cover, 3.38 km from NOAA - White Shoal, Dry Tortugas
- NOAA NCRMP — Tortugas-61 (2014): 12% hard coral cover, 4.05 km from NOAA - Bird Key Reef, Dry Tortugas
- NOAA NCRMP — Tortugas-64 (2014): 17% hard coral cover, 4.69 km from NOAA - Bird Key Reef, Dry Tortugas
- NOAA NCRMP — Tortugas-65 (2014): 3.0% hard coral cover, 3.14 km from NOAA - Bird Key Reef, Dry Tortugas
- NOAA NCRMP — Tortugas-66 (2014): 3.0% hard coral cover, 2.61 km from NOAA - Bird Key Reef, Dry Tortugas
- NOAA NCRMP — Tortugas-67 (2014): 30% hard coral cover, 1.30 km from NOAA - Bird Key Reef, Dry Tortugas
- NOAA NCRMP — Tortugas-68 (2014): 12% hard coral cover, 0.92 km from NOAA - Bird Key Reef, Dry Tortugas
- NOAA NCRMP — Tortugas-69 (2014): 5.0% hard coral cover, 2.88 km from NOAA - Bird Key Reef, Dry Tortugas
- NOAA NCRMP — Tortugas-70 (2014): 1.0% hard coral cover, 2.88 km from NOAA - Bird Key Reef, Dry Tortugas
- NOAA NCRMP — Tortugas-8 (2014): 10% hard coral cover, 4.03 km from NOAA - Pulaski Shoal, Dry Tortugas
- NOAA NCRMP — Tortugas-85 (2014): 0.0% hard coral cover, 3.75 km from NOAA - Bird Key Reef, Dry Tortugas
- NOAA NCRMP — Tortugas-86 (2014): 0.0% hard coral cover, 3.67 km from NOAA - Bird Key Reef, Dry Tortugas
- NOAA NCRMP — Tortugas-89 (2014): 6.0% hard coral cover, 3.72 km from NOAA - Pulaski Shoal, Dry Tortugas
- NOAA NCRMP — Tortugas-9 (2014): 3.0% hard coral cover, 2.53 km from NOAA - Pulaski Shoal, Dry Tortugas
- NOAA NCRMP Florida — Tortugas PSU 2063-1 (2024): 9.0% hard coral cover, 0.46 km from NOAA - Black Coral Rock, Dry Tortugas
- NOAA NCRMP Florida — Tortugas PSU 2090-1 (2024): 3.0% hard coral cover, 1.32 km from NOAA - Black Coral Rock, Dry Tortugas
- NOAA NCRMP Florida — Tortugas PSU 2114-1 (2024): 0.0% hard coral cover, 1.19 km from NOAA - Black Coral Rock, Dry Tortugas
- NOAA NCRMP Florida — Tortugas PSU 2116-1 (2024): 0.0% hard coral cover, 2.85 km from NOAA - Black Coral Rock, Dry Tortugas
- NOAA NCRMP Florida — Tortugas PSU 2117-1 (2024): 4.0% hard coral cover, 3.28 km from NOAA - Black Coral Rock, Dry Tortugas
- NOAA NCRMP Florida — Tortugas PSU 2118-1 (2024): 2.0% hard coral cover, 1.53 km from NOAA - Black Coral Rock, Dry Tortugas
- NOAA NCRMP Florida — Tortugas PSU 2119-1 (2024): 0.0% hard coral cover, 2.28 km from NOAA - Black Coral Rock, Dry Tortugas
- NOAA NCRMP Florida — Tortugas PSU 2120-1 (2024): 6.0% hard coral cover, 0.86 km from NOAA - Black Coral Rock, Dry Tortugas
- NOAA NCRMP Florida — Tortugas PSU 2123-1 (2024): 15% hard coral cover, 2.80 km from NOAA - Black Coral Rock, Dry Tortugas
- NOAA NCRMP Florida — Tortugas PSU 2125-1 (2024): 13% hard coral cover, 2.44 km from NOAA - Black Coral Rock, Dry Tortugas
- NOAA NCRMP Florida — Tortugas PSU 2127-1 (2024): 12% hard coral cover, 3.66 km from NOAA - Black Coral Rock, Dry Tortugas
- NOAA NCRMP Florida — Tortugas PSU 2128-1 (2024): 0.0% hard coral cover, 1.82 km from NOAA - Black Coral Rock, Dry Tortugas
- NOAA NCRMP Florida — Tortugas PSU 2129-1 (2024): 9.0% hard coral cover, 3.68 km from NOAA - Black Coral Rock, Dry Tortugas
- NOAA NCRMP Florida — Tortugas PSU 2133-1 (2024): 7.0% hard coral cover, 3.30 km from NOAA - Black Coral Rock, Dry Tortugas
- NOAA NCRMP Florida — Tortugas PSU 2134-1 (2024): 0.0% hard coral cover, 0.57 km from NOAA - Black Coral Rock, Dry Tortugas
- NOAA NCRMP Florida — Tortugas PSU 2137-1 (2024): 4.0% hard coral cover, 3.16 km from NOAA - Black Coral Rock, Dry Tortugas
- NOAA NCRMP Florida — Tortugas PSU 2145-1 (2024): 13% hard coral cover, 4.59 km from NOAA - Black Coral Rock, Dry Tortugas
- NOAA NCRMP Florida — Tortugas PSU 2151-1 (2024): 4.0% hard coral cover, 2.59 km from NOAA - Black Coral Rock, Dry Tortugas
- NOAA NCRMP Florida — Tortugas PSU 2153-1 (2024): 16% hard coral cover, 4.09 km from NOAA - Black Coral Rock, Dry Tortugas
- NOAA NCRMP Florida — Tortugas PSU 2155-1 (2024): 16% hard coral cover, 3.80 km from NOAA - Black Coral Rock, Dry Tortugas
- NOAA NCRMP Florida — Tortugas PSU 2156-1 (2024): 5.0% hard coral cover, 4.59 km from NOAA - Texas Reef, Dry Tortugas
- NOAA NCRMP Florida — Tortugas PSU 2157-1 (2024): 3.0% hard coral cover, 2.38 km from NOAA - Bird Key Reef, Dry Tortugas
- NOAA NCRMP Florida — Tortugas PSU 2159-1 (2024): 1.0% hard coral cover, 1.77 km from NOAA - Bird Key Reef, Dry Tortugas
- NOAA NCRMP Florida — Tortugas PSU 2161-1 (2024): 4.0% hard coral cover, 4.13 km from NOAA - Bird Key Reef, Dry Tortugas
- NOAA NCRMP Florida — Tortugas PSU 2172-1 (2024): 2.0% hard coral cover, 2.19 km from NOAA - Pulaski Shoal, Dry Tortugas
- NOAA NCRMP Florida — Tortugas PSU 2180-1 (2024): 2.0% hard coral cover, 4.16 km from NOAA - White Shoal, Dry Tortugas
- NOAA NCRMP Florida — Tortugas PSU 2182-1 (2024): 1.0% hard coral cover, 1.98 km from NOAA - Texas Reef, Dry Tortugas
- NOAA NCRMP Florida — Tortugas PSU 2183-1 (2024): 3.0% hard coral cover, 3.72 km from NOAA - White Shoal, Dry Tortugas
- NOAA NCRMP Florida — Tortugas PSU 2187-1 (2024): 0.0% hard coral cover, 3.07 km from NOAA - White Shoal, Dry Tortugas
- NOAA NCRMP Florida — Tortugas PSU 2188-1 (2024): 3.0% hard coral cover, 3.11 km from NOAA - Texas Reef, Dry Tortugas
- NOAA NCRMP Florida — Tortugas PSU 2189-1 (2024): 3.0% hard coral cover, 4.76 km from NOAA - Texas Reef, Dry Tortugas
- NOAA NCRMP Florida — Tortugas PSU 2190-1 (2024): 1.0% hard coral cover, 1.53 km from NOAA - Pulaski Shoal, Dry Tortugas
- NOAA NCRMP Florida — Tortugas PSU 2193-1 (2024): 3.0% hard coral cover, 3.82 km from NOAA - Texas Reef, Dry Tortugas
- NOAA NCRMP Florida — Tortugas PSU 2221-1 (2024): 2.0% hard coral cover, 2.79 km from NOAA - Pulaski Shoal, Dry Tortugas
- NOAA NCRMP Florida — Tortugas PSU 2223-1 (2024): 0.0% hard coral cover, 4.56 km from NOAA - Texas Reef, Dry Tortugas
- NOAA NCRMP Florida — Tortugas PSU 2224-1 (2024): 1.0% hard coral cover, 4.85 km from NOAA - Texas Reef, Dry Tortugas
- NOAA NCRMP Florida — Tortugas PSU 2225-1 (2024): 4.0% hard coral cover, 4.80 km from NOAA - White Shoal, Dry Tortugas
- NOAA NCRMP Florida — Tortugas PSU 2226-1 (2024): 2.0% hard coral cover, 4.76 km from NOAA - White Shoal, Dry Tortugas
- NOAA NCRMP Florida — Tortugas PSU 2242-1 (2024): 1.0% hard coral cover, 2.14 km from NOAA - Texas Reef, Dry Tortugas
- NOAA NCRMP Florida — Tortugas PSU 2244-1 (2024): 1.0% hard coral cover, 4.18 km from NOAA - White Shoal, Dry Tortugas
- NOAA NCRMP Florida — Tortugas PSU 2265-1 (2024): 2.0% hard coral cover, 3.78 km from NOAA - Pulaski Shoal, Dry Tortugas
- NOAA NCRMP Florida — Tortugas PSU 2274-1 (2024): 1.0% hard coral cover, 3.64 km from NOAA - Texas Reef, Dry Tortugas
- NOAA NCRMP Florida — Tortugas PSU 2275-1 (2024): 8.0% hard coral cover, 3.35 km from NOAA - Texas Reef, Dry Tortugas
- NOAA NCRMP Florida — Tortugas PSU 2279-1 (2024): 0.0% hard coral cover, 3.50 km from NOAA - White Shoal, Dry Tortugas
- NOAA NCRMP Florida — Tortugas PSU 2280-1 (2024): 2.0% hard coral cover, 4.26 km from NOAA - Texas Reef, Dry Tortugas
- NOAA NCRMP Florida — Tortugas PSU 2286-1 (2024): 2.0% hard coral cover, 4.11 km from NOAA - White Shoal, Dry Tortugas
- NOAA NCRMP Florida — Tortugas PSU 2292-1 (2024): 0.0% hard coral cover, 3.97 km from NOAA - White Shoal, Dry Tortugas
- NOAA NCRMP Florida — Tortugas PSU 2312-1 (2024): 7.0% hard coral cover, 4.48 km from NOAA - Texas Reef, Dry Tortugas
- NOAA NCRMP Florida — Tortugas PSU 2338-1 (2024): 1.0% hard coral cover, 3.27 km from NOAA - Pulaski Shoal, Dry Tortugas
- NOAA NCRMP Florida — Tortugas PSU 2341-1 (2024): 3.0% hard coral cover, 3.18 km from NOAA - Pulaski Shoal, Dry Tortugas
- NOAA NCRMP Florida — Tortugas PSU 2356-1 (2024): 20% hard coral cover, 1.35 km from NOAA - Pulaski Shoal, Dry Tortugas
- NOAA NCRMP Florida — Tortugas PSU 2477-1 (2024): 5.0% hard coral cover, 0.99 km from NOAA - Black Coral Rock, Dry Tortugas
- NOAA NCRMP Florida — Tortugas PSU 2479-1 (2024): 4.0% hard coral cover, 2.13 km from NOAA - Black Coral Rock, Dry Tortugas
- NOAA NCRMP Florida — Tortugas PSU 2480-1 (2024): 0.0% hard coral cover, 2.04 km from NOAA - Black Coral Rock, Dry Tortugas
- NOAA NCRMP Florida — Tortugas PSU 2498-1 (2024): 7.0% hard coral cover, 0.26 km from NOAA - Black Coral Rock, Dry Tortugas
- NOAA NCRMP Florida — Tortugas PSU 2515-1 (2024): 21% hard coral cover, 3.17 km from NOAA - Black Coral Rock, Dry Tortugas
- NOAA NCRMP Florida — Tortugas PSU 2520-1 (2024): 2.0% hard coral cover, 3.47 km from NOAA - Bird Key Reef, Dry Tortugas
- NOAA NCRMP Florida — Tortugas PSU 2532-1 (2024): 2.0% hard coral cover, 2.94 km from NOAA - Pulaski Shoal, Dry Tortugas
- NOAA NCRMP Florida — Tortugas PSU 2540-1 (2024): 1.0% hard coral cover, 1.93 km from NOAA - Pulaski Shoal, Dry Tortugas
- NOAA NCRMP Florida — Tortugas PSU 2543-1 (2024): 0.0% hard coral cover, 3.09 km from NOAA - White Shoal, Dry Tortugas
- NOAA NCRMP Florida — Tortugas PSU 2550-1 (2024): 9.0% hard coral cover, 3.42 km from NOAA - White Shoal, Dry Tortugas
- NOAA NCRMP Florida — Tortugas PSU 2551-1 (2024): 10% hard coral cover, 4.90 km from NOAA - Texas Reef, Dry Tortugas
- NOAA NCRMP Florida — Tortugas PSU 2616-1 (2024): 0.0% hard coral cover, 4.52 km from NOAA - White Shoal, Dry Tortugas
- NOAA NCRMP Florida — Tortugas PSU 2646-1 (2024): 0.0% hard coral cover, 3.55 km from NOAA - White Shoal, Dry Tortugas
- NOAA NCRMP Florida — Tortugas PSU 2647-1 (2024): 0.0% hard coral cover, 4.71 km from NOAA - White Shoal, Dry Tortugas
- NOAA NCRMP Florida — Tortugas PSU 2720-1 (2024): 8.0% hard coral cover, 4.75 km from NOAA - Black Coral Rock, Dry Tortugas
- NOAA NCRMP Florida — Tortugas PSU 2721-1 (2024): 4.0% hard coral cover, 1.78 km from NOAA - Black Coral Rock, Dry Tortugas
- NOAA NCRMP Florida — Tortugas PSU 2722-1 (2024): 6.0% hard coral cover, 2.11 km from NOAA - Black Coral Rock, Dry Tortugas
- NOAA NCRMP Florida — Tortugas PSU 2723-1 (2024): 1.0% hard coral cover, 2.12 km from NOAA - Black Coral Rock, Dry Tortugas
- NOAA NCRMP Florida — Tortugas PSU 2725-1 (2024): 1.0% hard coral cover, 0.35 km from NOAA - Black Coral Rock, Dry Tortugas
- NOAA NCRMP Florida — Tortugas PSU 2775-1 (2024): 1.0% hard coral cover, 4.52 km from NOAA - White Shoal, Dry Tortugas
- NOAA NCRMP Florida — Tortugas PSU 2777-1 (2024): 1.0% hard coral cover, 4.79 km from NOAA - White Shoal, Dry Tortugas
- NOAA NCRMP Florida — Tortugas PSU 2779-1 (2024): 1.0% hard coral cover, 2.78 km from NOAA - White Shoal, Dry Tortugas
- NOAA NCRMP Florida — Tortugas PSU 2783-1 (2024): 7.0% hard coral cover, 1.36 km from NOAA - Texas Reef, Dry Tortugas
- NOAA NCRMP Florida — Tortugas PSU 2784-1 (2024): 1.0% hard coral cover, 2.14 km from NOAA - Texas Reef, Dry Tortugas
- NOAA NCRMP Florida — Tortugas PSU 2785-1 (2024): 0.0% hard coral cover, 3.12 km from NOAA - Texas Reef, Dry Tortugas
- NOAA NCRMP Florida — Tortugas PSU 2787-1 (2024): 1.0% hard coral cover, 2.89 km from NOAA - Texas Reef, Dry Tortugas
- NOAA NCRMP Florida — Tortugas PSU 2790-1 (2024): 8.0% hard coral cover, 4.87 km from NOAA - Pulaski Shoal, Dry Tortugas
- NOAA NCRMP Florida — Tortugas PSU 2803-1 (2024): 5.0% hard coral cover, 4.46 km from NOAA - White Shoal, Dry Tortugas
- NOAA NCRMP Florida — Tortugas PSU 2804-1 (2024): 1.0% hard coral cover, 4.73 km from NOAA - White Shoal, Dry Tortugas
- NOAA NCRMP Florida — Tortugas PSU 2813-1 (2024): 1.0% hard coral cover, 4.90 km from NOAA - Pulaski Shoal, Dry Tortugas
- NOAA NCRMP Florida — Tortugas PSU 2997-1 (2024): 1.0% hard coral cover, 4.12 km from NOAA - White Shoal, Dry Tortugas
- NOAA NCRMP Florida — Tortugas PSU 2998-1 (2024): 1.0% hard coral cover, 3.48 km from NOAA - White Shoal, Dry Tortugas
- NOAA NCRMP Florida — Tortugas PSU 2999-1 (2024): 0.0% hard coral cover, 4.76 km from NOAA - White Shoal, Dry Tortugas
- NOAA NCRMP Florida (NCEI 0253452) — Tortugas PSU 1490-1 (2021): 4.0% hard coral cover, 2.41 km from NOAA - Texas Reef, Dry Tortugas
- NOAA NCRMP Florida (NCEI 0253452) — Tortugas PSU 1562-1 (2021): 2.0% hard coral cover, 3.55 km from NOAA - Pulaski Shoal, Dry Tortugas
- NOAA NCRMP Florida (NCEI 0253452) — Tortugas PSU 1564-1 (2021): 3.0% hard coral cover, 4.52 km from NOAA - Pulaski Shoal, Dry Tortugas
- NOAA NCRMP Florida (NCEI 0253452) — Tortugas PSU 1570-1 (2021): 0.0% hard coral cover, 0.58 km from NOAA - Pulaski Shoal, Dry Tortugas
- NOAA NCRMP Florida (NCEI 0253452) — Tortugas PSU 1571-1 (2021): 22% hard coral cover, 4.30 km from NOAA - Bird Key Reef, Dry Tortugas
- NOAA NCRMP Florida (NCEI 0253452) — Tortugas PSU 2073-1 (2021): 3.0% hard coral cover, 0.83 km from NOAA - Black Coral Rock, Dry Tortugas
- NOAA NCRMP Florida (NCEI 0253452) — Tortugas PSU 2076-1 (2021): 2.0% hard coral cover, 1.48 km from NOAA - Black Coral Rock, Dry Tortugas
- NOAA NCRMP Florida (NCEI 0253452) — Tortugas PSU 2088-1 (2021): 8.0% hard coral cover, 1.58 km from NOAA - Black Coral Rock, Dry Tortugas
- NOAA NCRMP Florida (NCEI 0253452) — Tortugas PSU 2111-1 (2021): 6.0% hard coral cover, 1.44 km from NOAA - Black Coral Rock, Dry Tortugas
- NOAA NCRMP Florida (NCEI 0253452) — Tortugas PSU 2113-1 (2021): 2.0% hard coral cover, 1.76 km from NOAA - Black Coral Rock, Dry Tortugas
- NOAA NCRMP Florida (NCEI 0253452) — Tortugas PSU 2119-1 (2021): 4.0% hard coral cover, 0.69 km from NOAA - Black Coral Rock, Dry Tortugas
- NOAA NCRMP Florida (NCEI 0253452) — Tortugas PSU 2136-1 (2021): 1.0% hard coral cover, 2.00 km from NOAA - Black Coral Rock, Dry Tortugas
- NOAA NCRMP Florida (NCEI 0253452) — Tortugas PSU 2138-1 (2021): 3.0% hard coral cover, 2.42 km from NOAA - Black Coral Rock, Dry Tortugas
- NOAA NCRMP Florida (NCEI 0253452) — Tortugas PSU 2143-1 (2021): 12% hard coral cover, 2.37 km from NOAA - Black Coral Rock, Dry Tortugas
- NOAA NCRMP Florida (NCEI 0253452) — Tortugas PSU 2145-1 (2021): 6.0% hard coral cover, 1.45 km from NOAA - Black Coral Rock, Dry Tortugas
- NOAA NCRMP Florida (NCEI 0253452) — Tortugas PSU 2147-1 (2021): 1.0% hard coral cover, 2.95 km from NOAA - Black Coral Rock, Dry Tortugas
- NOAA NCRMP Florida (NCEI 0253452) — Tortugas PSU 2150-1 (2021): 2.0% hard coral cover, 2.48 km from NOAA - Black Coral Rock, Dry Tortugas
- NOAA NCRMP Florida (NCEI 0253452) — Tortugas PSU 2152-1 (2021): 0.0% hard coral cover, 3.78 km from NOAA - Black Coral Rock, Dry Tortugas
- NOAA NCRMP Florida (NCEI 0253452) — Tortugas PSU 2164-1 (2021): 1.0% hard coral cover, 2.75 km from NOAA - Black Coral Rock, Dry Tortugas
- NOAA NCRMP Florida (NCEI 0253452) — Tortugas PSU 2166-1 (2021): 0.0% hard coral cover, 4.01 km from NOAA - Bird Key Reef, Dry Tortugas
- NOAA NCRMP Florida (NCEI 0253452) — Tortugas PSU 2167-1 (2021): 7.0% hard coral cover, 0.81 km from NOAA - Pulaski Shoal, Dry Tortugas
- NOAA NCRMP Florida (NCEI 0253452) — Tortugas PSU 2170-1 (2021): 0.0% hard coral cover, 3.86 km from NOAA - Pulaski Shoal, Dry Tortugas
- NOAA NCRMP Florida (NCEI 0253452) — Tortugas PSU 2172-1 (2021): 1.0% hard coral cover, 4.51 km from NOAA - Pulaski Shoal, Dry Tortugas
- NOAA NCRMP Florida (NCEI 0253452) — Tortugas PSU 2187-1 (2021): 6.0% hard coral cover, 4.37 km from NOAA - Bird Key Reef, Dry Tortugas
- NOAA NCRMP Florida (NCEI 0253452) — Tortugas PSU 2188-1 (2021): 0.0% hard coral cover, 2.17 km from NOAA - Pulaski Shoal, Dry Tortugas
- NOAA NCRMP Florida (NCEI 0253452) — Tortugas PSU 2215-1 (2021): 0.0% hard coral cover, 2.90 km from NOAA - Pulaski Shoal, Dry Tortugas
- NOAA NCRMP Florida (NCEI 0253452) — Tortugas PSU 2219-1 (2021): 5.0% hard coral cover, 1.32 km from NOAA - Bird Key Reef, Dry Tortugas
- NOAA NCRMP Florida (NCEI 0253452) — Tortugas PSU 2227-1 (2021): 4.0% hard coral cover, 3.45 km from NOAA - Pulaski Shoal, Dry Tortugas
- NOAA NCRMP Florida (NCEI 0253452) — Tortugas PSU 2229-1 (2021): 11% hard coral cover, 0.09 km from NOAA - Bird Key Reef, Dry Tortugas
- NOAA NCRMP Florida (NCEI 0253452) — Tortugas PSU 2231-1 (2021): 0.0% hard coral cover, 4.24 km from NOAA - White Shoal, Dry Tortugas
- NOAA NCRMP Florida (NCEI 0253452) — Tortugas PSU 2241-1 (2021): 0.0% hard coral cover, 3.11 km from NOAA - White Shoal, Dry Tortugas
- NOAA NCRMP Florida (NCEI 0253452) — Tortugas PSU 2243-1 (2021): 3.0% hard coral cover, 3.06 km from NOAA - White Shoal, Dry Tortugas
- NOAA NCRMP Florida (NCEI 0253452) — Tortugas PSU 2266-1 (2021): 0.0% hard coral cover, 3.59 km from NOAA - Pulaski Shoal, Dry Tortugas
- NOAA NCRMP Florida (NCEI 0253452) — Tortugas PSU 2279-1 (2021): 0.0% hard coral cover, 3.54 km from NOAA - White Shoal, Dry Tortugas
- NOAA NCRMP Florida (NCEI 0253452) — Tortugas PSU 2281-1 (2021): 1.0% hard coral cover, 3.25 km from NOAA - Texas Reef, Dry Tortugas
- NOAA NCRMP Florida (NCEI 0253452) — Tortugas PSU 2286-1 (2021): 1.0% hard coral cover, 3.24 km from NOAA - White Shoal, Dry Tortugas
- NOAA NCRMP Florida (NCEI 0253452) — Tortugas PSU 2289-1 (2021): 3.0% hard coral cover, 2.75 km from NOAA - Texas Reef, Dry Tortugas
- NOAA NCRMP Florida (NCEI 0253452) — Tortugas PSU 2291-1 (2021): 6.0% hard coral cover, 2.91 km from NOAA - Texas Reef, Dry Tortugas
- NOAA NCRMP Florida (NCEI 0253452) — Tortugas PSU 2297-1 (2021): 12% hard coral cover, 3.21 km from NOAA - Pulaski Shoal, Dry Tortugas
- NOAA NCRMP Florida (NCEI 0253452) — Tortugas PSU 2300-1 (2021): 5.0% hard coral cover, 4.52 km from NOAA - Pulaski Shoal, Dry Tortugas
- NOAA NCRMP Florida (NCEI 0253452) — Tortugas PSU 2307-1 (2021): 8.0% hard coral cover, 3.33 km from NOAA - Texas Reef, Dry Tortugas
- NOAA NCRMP Florida (NCEI 0253452) — Tortugas PSU 2309-1 (2021): 18% hard coral cover, 3.93 km from NOAA - Texas Reef, Dry Tortugas
- NOAA NCRMP Florida (NCEI 0253452) — Tortugas PSU 2310-1 (2021): 1.0% hard coral cover, 3.85 km from NOAA - Texas Reef, Dry Tortugas
- NOAA NCRMP Florida (NCEI 0253452) — Tortugas PSU 2313-1 (2021): 1.0% hard coral cover, 3.59 km from NOAA - Texas Reef, Dry Tortugas
- NOAA NCRMP Florida (NCEI 0253452) — Tortugas PSU 2315-1 (2021): 8.0% hard coral cover, 3.63 km from NOAA - White Shoal, Dry Tortugas
- NOAA NCRMP Florida (NCEI 0253452) — Tortugas PSU 2316-1 (2021): 7.0% hard coral cover, 3.27 km from NOAA - White Shoal, Dry Tortugas
- NOAA NCRMP Florida (NCEI 0253452) — Tortugas PSU 2317-1 (2021): 4.0% hard coral cover, 3.11 km from NOAA - Texas Reef, Dry Tortugas
- NOAA NCRMP Florida (NCEI 0253452) — Tortugas PSU 2318-1 (2021): 2.0% hard coral cover, 3.83 km from NOAA - Texas Reef, Dry Tortugas
- NOAA NCRMP Florida (NCEI 0253452) — Tortugas PSU 2319-1 (2021): 7.0% hard coral cover, 2.78 km from NOAA - Texas Reef, Dry Tortugas
- NOAA NCRMP Florida (NCEI 0253452) — Tortugas PSU 2332-1 (2021): 16% hard coral cover, 4.53 km from NOAA - Texas Reef, Dry Tortugas
- NOAA NCRMP Florida (NCEI 0253452) — Tortugas PSU 2360-1 (2021): 18% hard coral cover, 4.94 km from NOAA - Texas Reef, Dry Tortugas
- NOAA NCRMP Florida (NCEI 0253452) — Tortugas PSU 2478-1 (2021): 3.0% hard coral cover, 1.39 km from NOAA - Black Coral Rock, Dry Tortugas
- NOAA NCRMP Florida (NCEI 0253452) — Tortugas PSU 2505-1 (2021): 1.0% hard coral cover, 0.79 km from NOAA - Black Coral Rock, Dry Tortugas
- NOAA NCRMP Florida (NCEI 0253452) — Tortugas PSU 2512-1 (2021): 8.0% hard coral cover, 2.45 km from NOAA - Bird Key Reef, Dry Tortugas
- NOAA NCRMP Florida (NCEI 0253452) — Tortugas PSU 2529-1 (2021): 2.0% hard coral cover, 3.19 km from NOAA - Black Coral Rock, Dry Tortugas
- NOAA NCRMP Florida (NCEI 0253452) — Tortugas PSU 2545-1 (2021): 4.0% hard coral cover, 2.54 km from NOAA - Black Coral Rock, Dry Tortugas
- NOAA NCRMP Florida (NCEI 0253452) — Tortugas PSU 2548-1 (2021): 4.0% hard coral cover, 0.83 km from NOAA - Black Coral Rock, Dry Tortugas
- NOAA NCRMP Florida (NCEI 0253452) — Tortugas PSU 2551-1 (2021): 13% hard coral cover, 4.13 km from NOAA - Black Coral Rock, Dry Tortugas
- NOAA NCRMP Florida (NCEI 0253452) — Tortugas PSU 2561-1 (2021): 0.0% hard coral cover, 2.72 km from NOAA - Black Coral Rock, Dry Tortugas
- NOAA NCRMP Florida (NCEI 0253452) — Tortugas PSU 2571-1 (2021): 0.0% hard coral cover, 4.55 km from NOAA - Texas Reef, Dry Tortugas
- NOAA NCRMP Florida (NCEI 0253452) — Tortugas PSU 2606-1 (2021): 5.0% hard coral cover, 3.16 km from NOAA - Bird Key Reef, Dry Tortugas
- NOAA NCRMP Florida (NCEI 0253452) — Tortugas PSU 2638-1 (2021): 0.0% hard coral cover, 4.44 km from NOAA - White Shoal, Dry Tortugas
- NOAA NCRMP Florida (NCEI 0253452) — Tortugas PSU 2646-1 (2021): 15% hard coral cover, 2.57 km from NOAA - White Shoal, Dry Tortugas
- NOAA NCRMP Florida (NCEI 0253452) — Tortugas PSU 2671-1 (2021): 0.0% hard coral cover, 4.52 km from NOAA - Bird Key Reef, Dry Tortugas
- NOAA NCRMP Florida (NCEI 0253452) — Tortugas PSU 2685-1 (2021): 0.0% hard coral cover, 3.55 km from NOAA - Texas Reef, Dry Tortugas
- NOAA NCRMP Florida (NCEI 0253452) — Tortugas PSU 2686-1 (2021): 0.0% hard coral cover, 3.35 km from NOAA - White Shoal, Dry Tortugas
- NOAA NCRMP Florida (NCEI 0253452) — Tortugas PSU 2698-1 (2021): 11% hard coral cover, 4.18 km from NOAA - Bird Key Reef, Dry Tortugas
- NOAA NCRMP Florida (NCEI 0253452) — Tortugas PSU 2704-1 (2021): 0.0% hard coral cover, 3.27 km from NOAA - Texas Reef, Dry Tortugas
- NOAA NCRMP Florida (NCEI 0253452) — Tortugas PSU 2710-1 (2021): 11% hard coral cover, 1.71 km from NOAA - Texas Reef, Dry Tortugas
- NOAA NCRMP Florida (NCEI 0253452) — Tortugas PSU 2716-1 (2021): 24% hard coral cover, 3.46 km from NOAA - White Shoal, Dry Tortugas
- NOAA NCRMP Florida (NCEI 0253452) — Tortugas PSU 2717-1 (2021): 3.0% hard coral cover, 2.97 km from NOAA - Texas Reef, Dry Tortugas
- NOAA NCRMP Florida (NCEI 0253452) — Tortugas PSU 2757-1 (2021): 11% hard coral cover, 4.14 km from NOAA - Bird Key Reef, Dry Tortugas
- NOAA NCRMP Florida (NCEI 0253452) — Tortugas PSU 2760-1 (2021): 10% hard coral cover, 4.07 km from NOAA - Texas Reef, Dry Tortugas
- NOAA NCRMP Florida (NCEI 0253452) — Tortugas PSU 2762-1 (2021): 5.0% hard coral cover, 4.66 km from NOAA - Texas Reef, Dry Tortugas
- NOAA NCRMP Florida (NCEI 0253452) — Tortugas PSU 3023-1 (2021): 8.0% hard coral cover, 4.47 km from NOAA - Bird Key Reef, Dry Tortugas
All images from Coral Reef Diagnostics. Data are from Coral Reef Diagnostics, FWC-FWRI CREMP (Florida Fish and Wildlife Conservation Commission), and NOAA National Coral Reef Monitoring Program.
© Coral Reef Diagnostics.
References
- Souter D, et al. (eds) (2021) Status of Coral Reefs of the World: 2020. International Coral Reef Initiative / Global Coral Reef Monitoring Network. [PDF]
- Spalding MD, et al. (2001) World Atlas of Coral Reefs. University of California Press, Berkeley. [PDF]
- Wells SM (ed.) (1988) Coral Reefs of the World. Volume 1: Atlantic and Eastern Pacific. UNEP/IUCN, Cambridge. [PDF]
- Wilkinson C (2006) Status of coral reefs of the world: summary of threats and remedial action. In: Côté IM, Reynolds JD (eds) Coral Reef Conservation. Cambridge University Press, Cambridge. [PDF]