
NOAA - Star Island (Urban Corals), Miami
Part of the regional summary: USA - Florida
More info
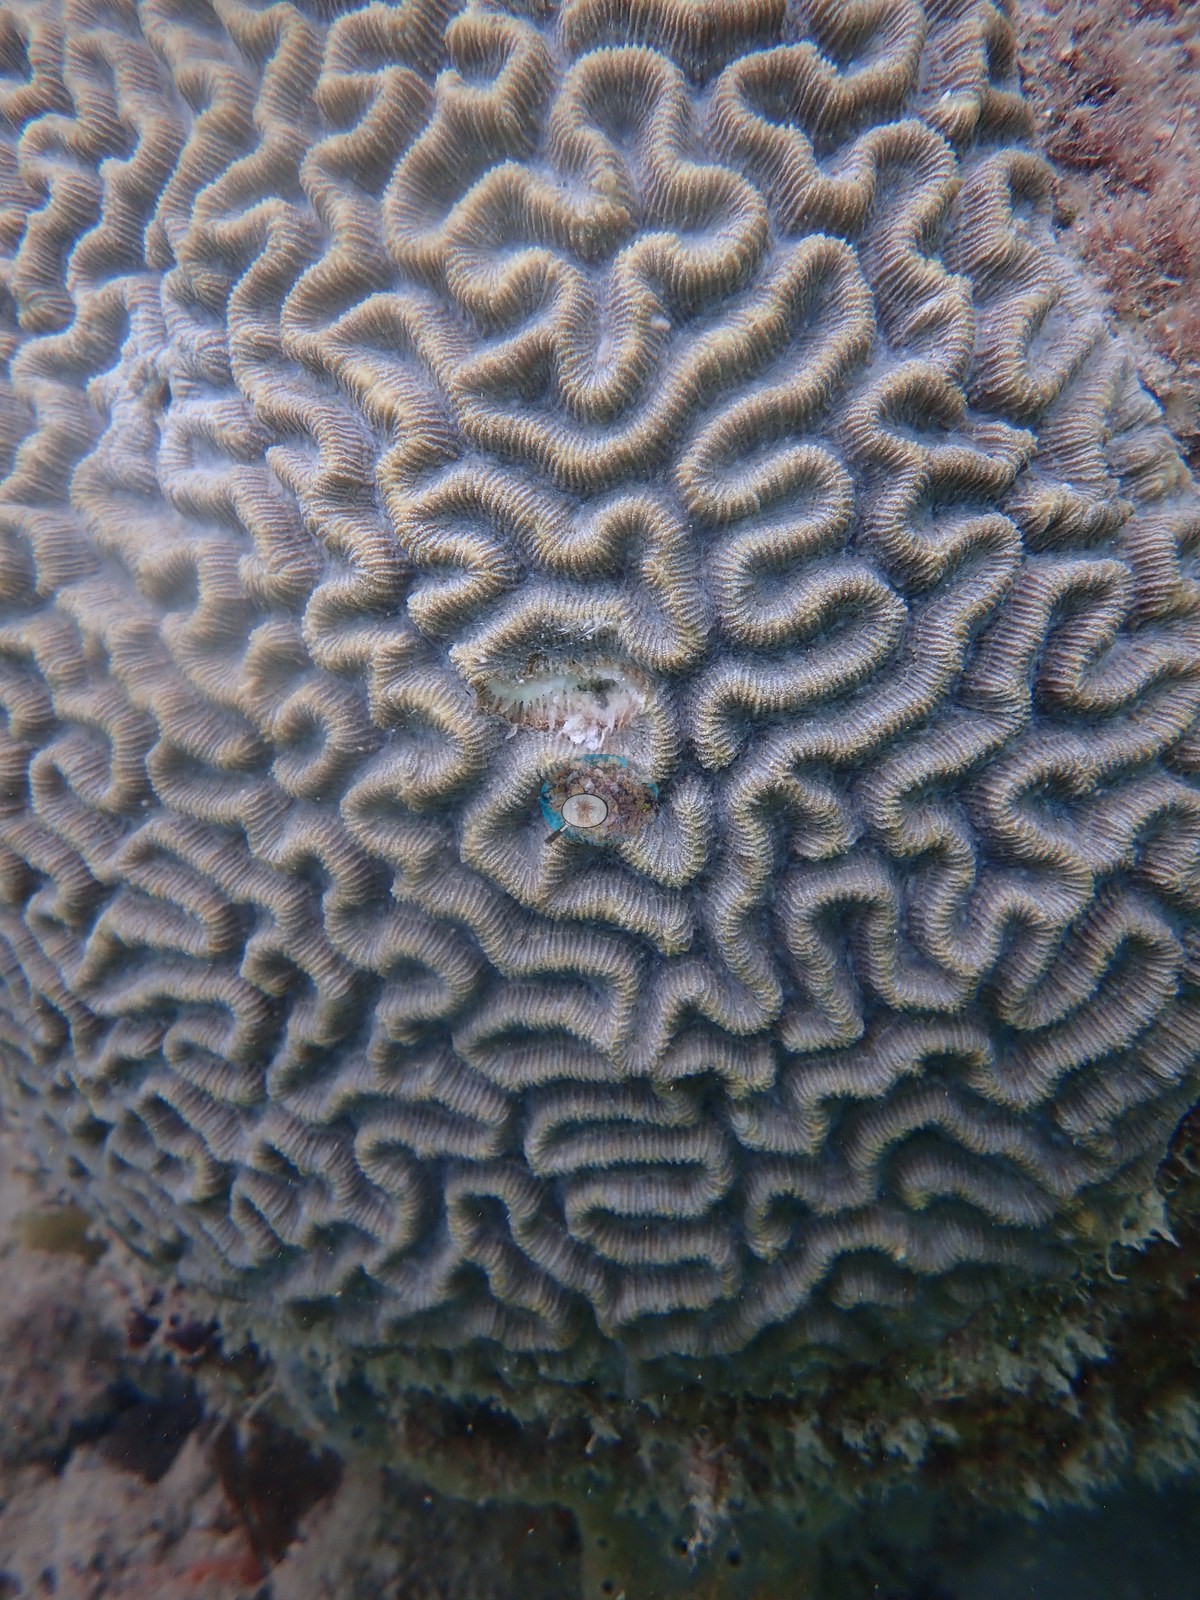
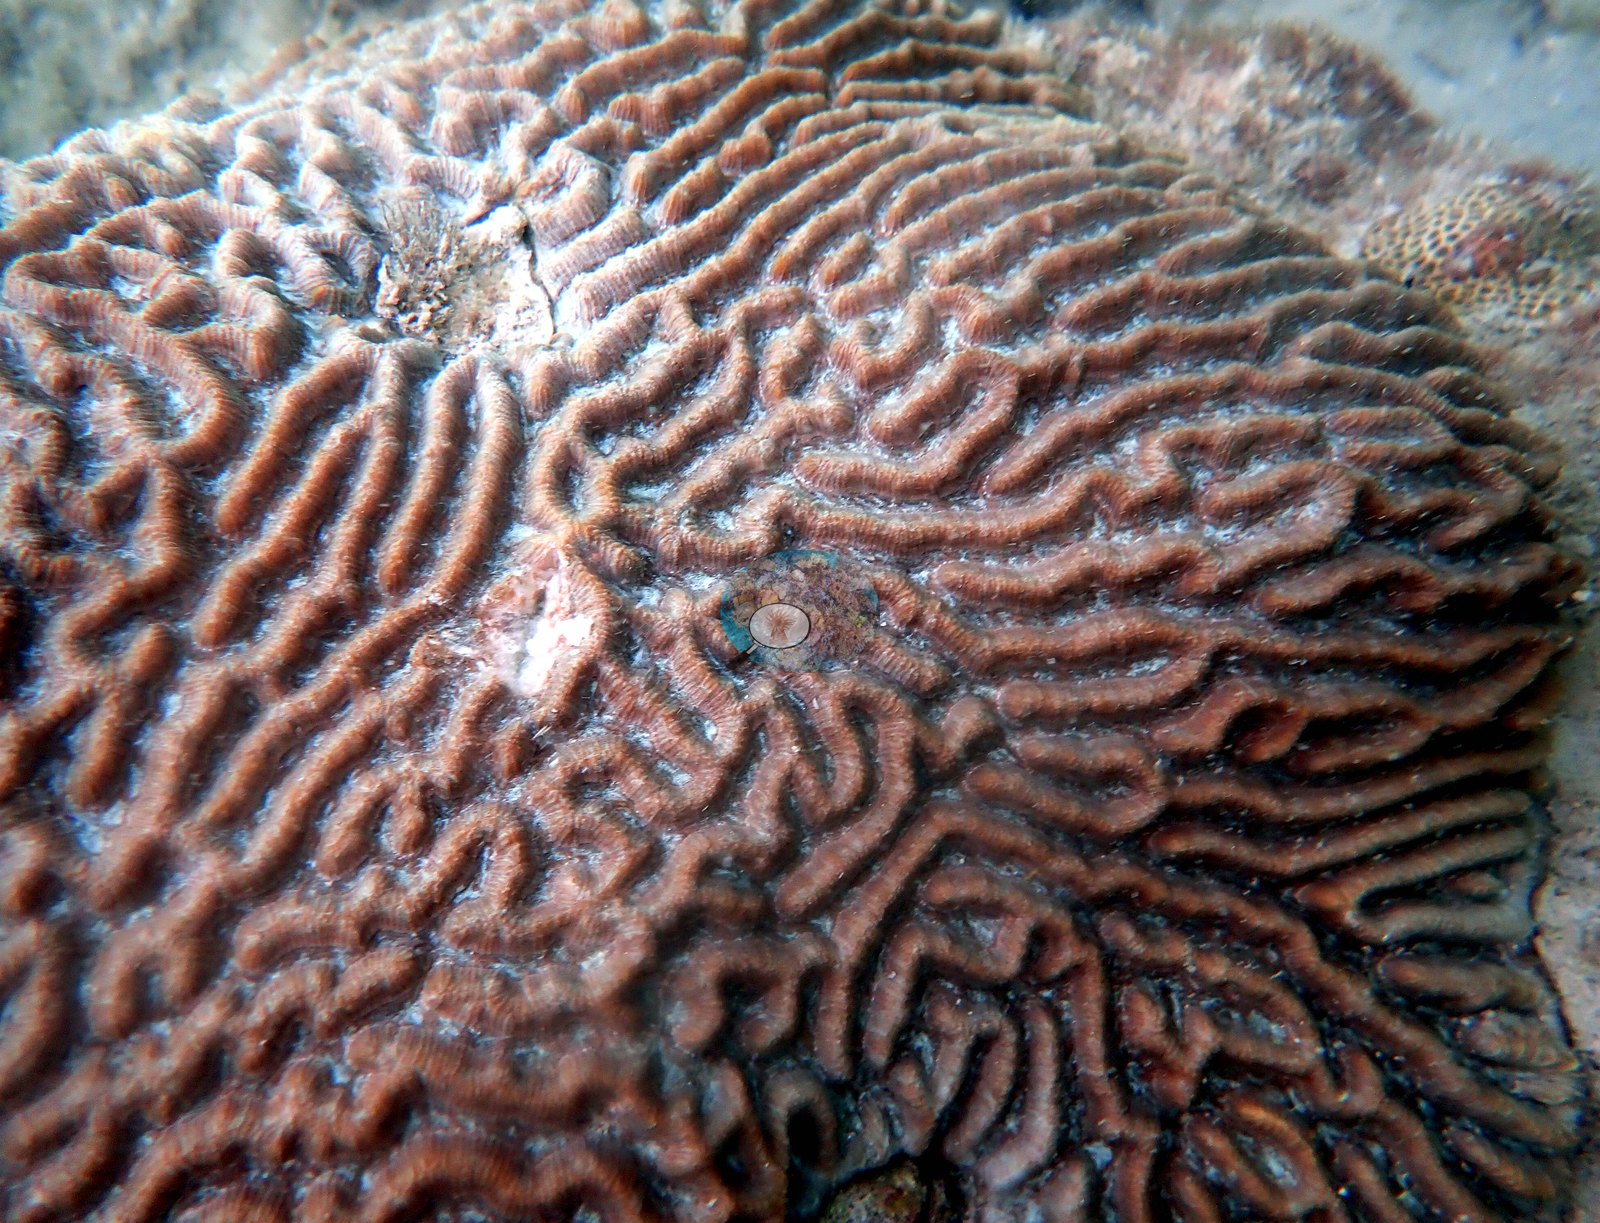
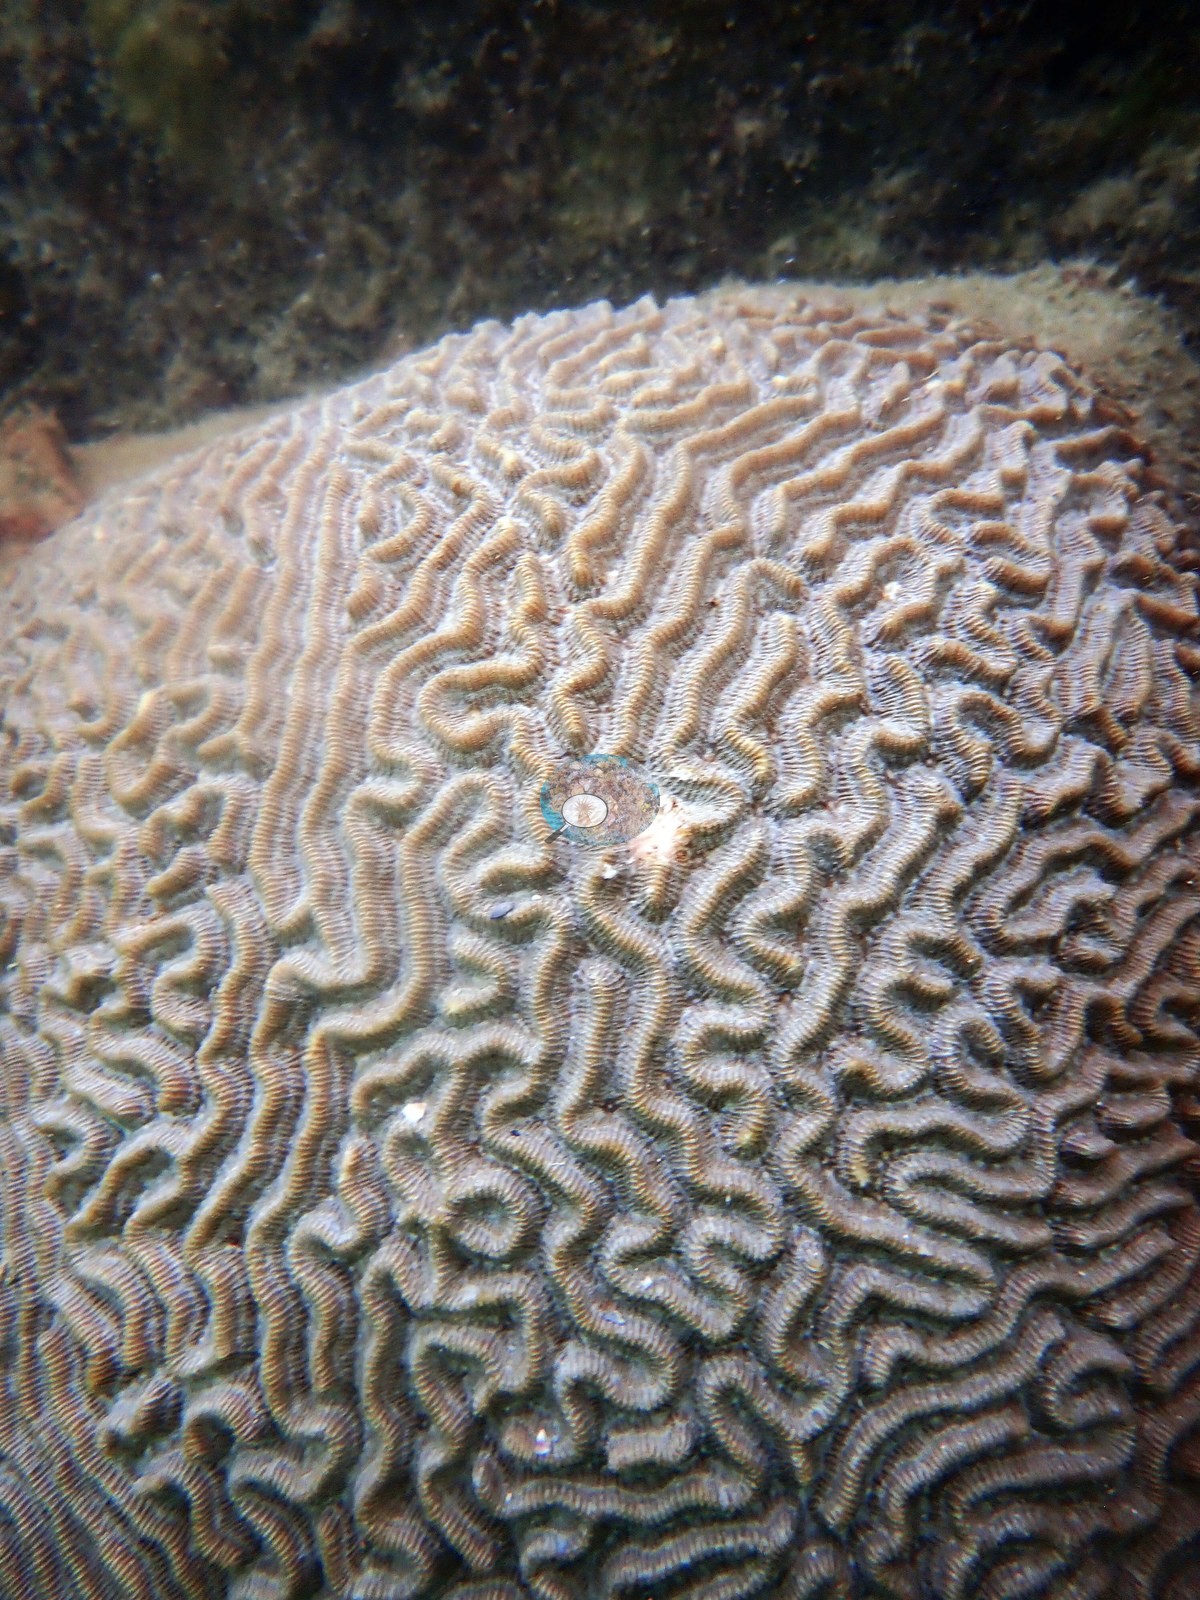
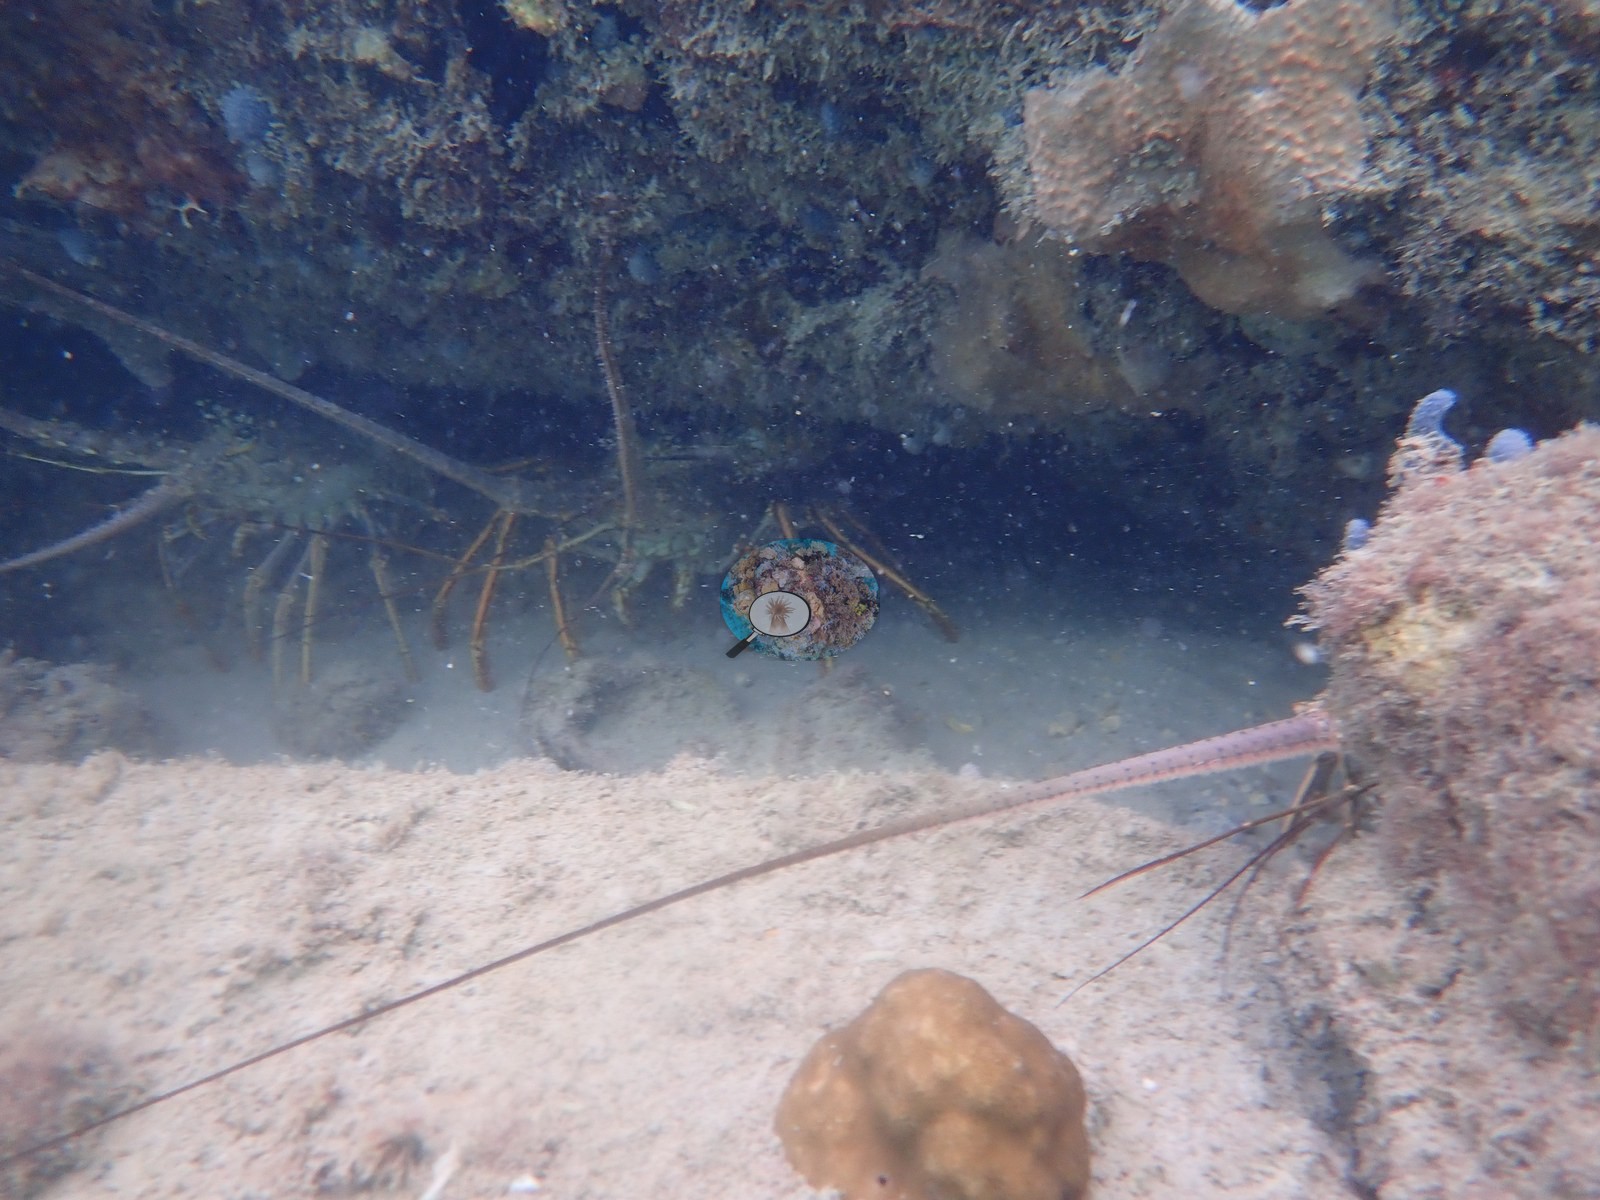
Southeast Florida (NOAA CRW virtual station)A Port of Miami urban-corals site on the Star Island seawall, where Anderson sampled 10 Pseudodiploria strigosa colonies on 26 June 2019; the sample sheet records fish bites on one of them. The Urban Corals gene-expression study (Rubin et al. 2021) reports a separate collection of 9 colonies here on 14 February 2020. The photographs are mostly close-ups of the sampled colonies, plus lobsters under a ledge, and no coral-cover figure exists for this site.
Three independent survey stations shown with the program’s logo — click one to see how far it is from this site.
Three other CRD dive sites with their own pages within 5 km shown in orange — click a marker to open its page.
5 of the 6 photographs on this page are shown beside the text that discusses them under "Site description" below.
Site description
Coral cover
- Most of the surviving frames are close-ups of individually sampled colonies (e.g., Image 2, Image 3), and no benthic transect survey covers this site, so no coral-cover value is reported for it.
Stressors
Anderson's sample sheet records fish bites (corallivory) on one sampled colony, STAR8 ('fairly large colony with fish bites').
Fish and other fauna
Two lobsters shelter under a ledge (e.g., Image 1).
Comparisons with other data
Rubin et al. (2021) is a coral gene-expression study and reports no benthic cover for this site.
Dive record
Anderson sampled 10 Pseudodiploria strigosa colonies here along the seawall on 26 June 2019 (the sample sheet, STAR1-STAR10; the log: 'We found 10 target species colonies in just over half an hour along the sea wall') (e.g., Image 4, Image 5).
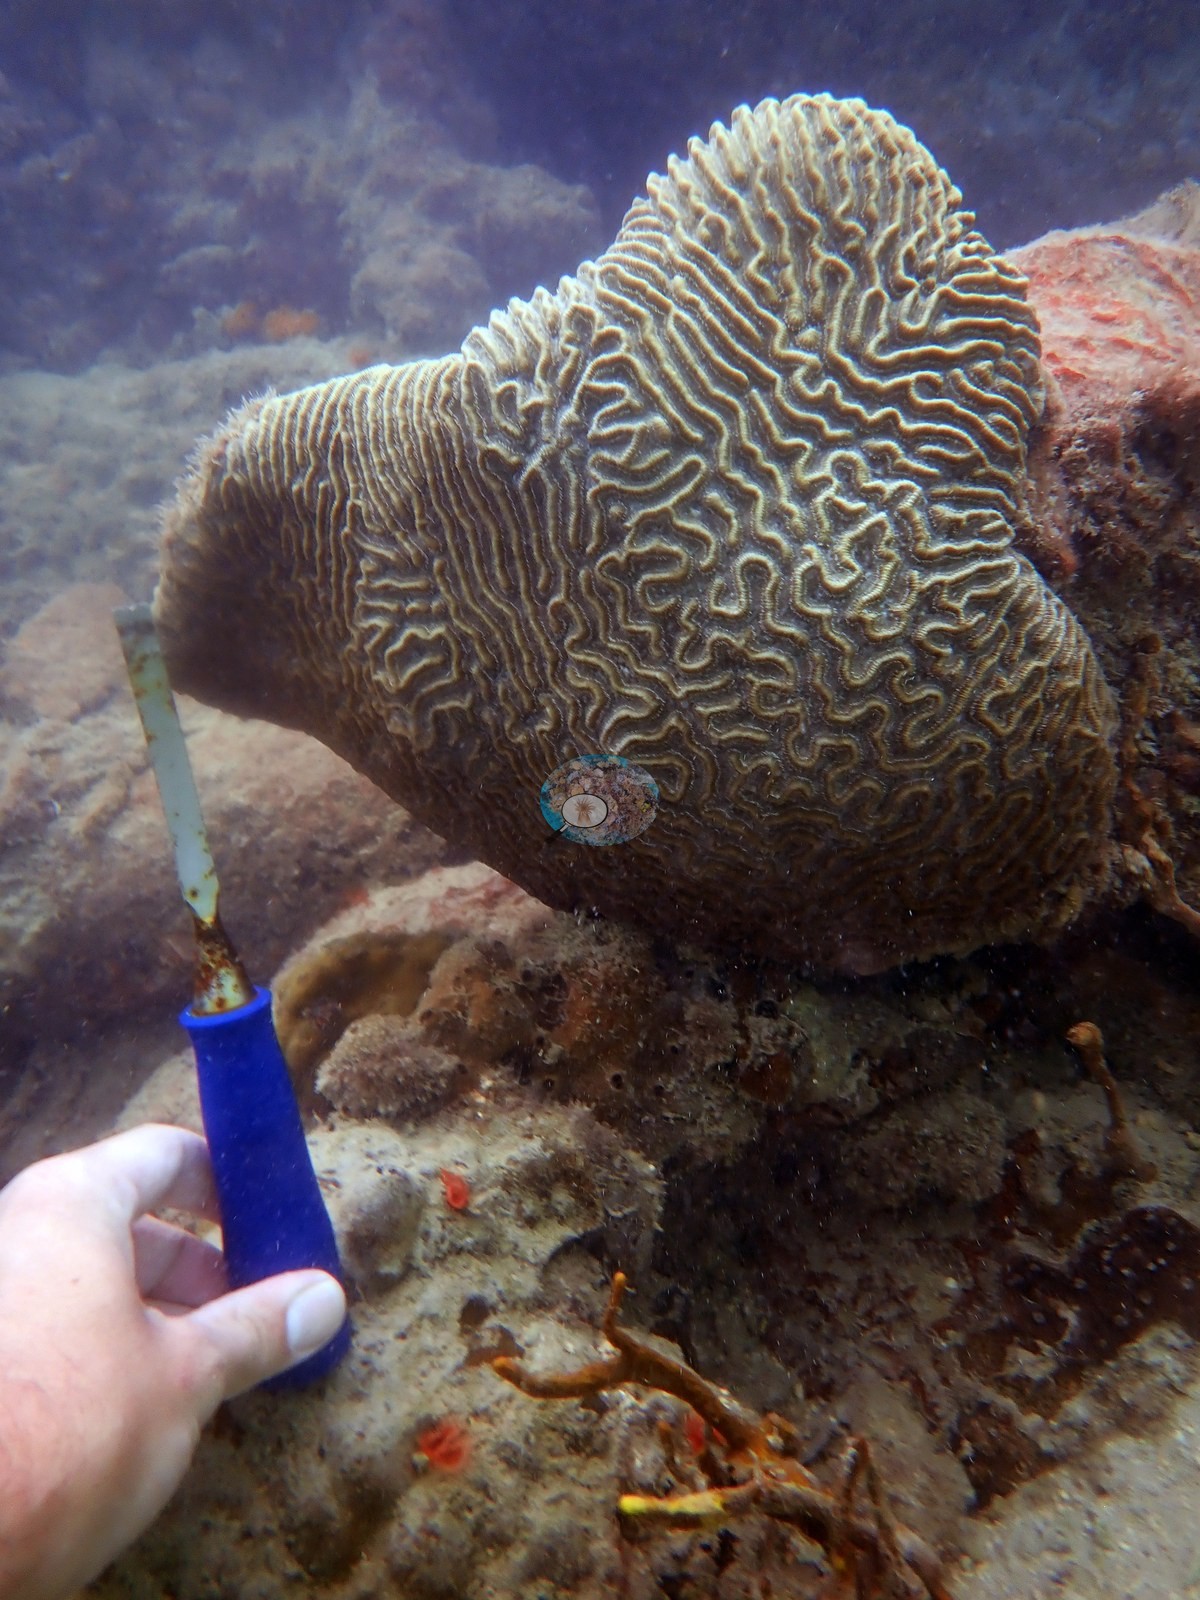
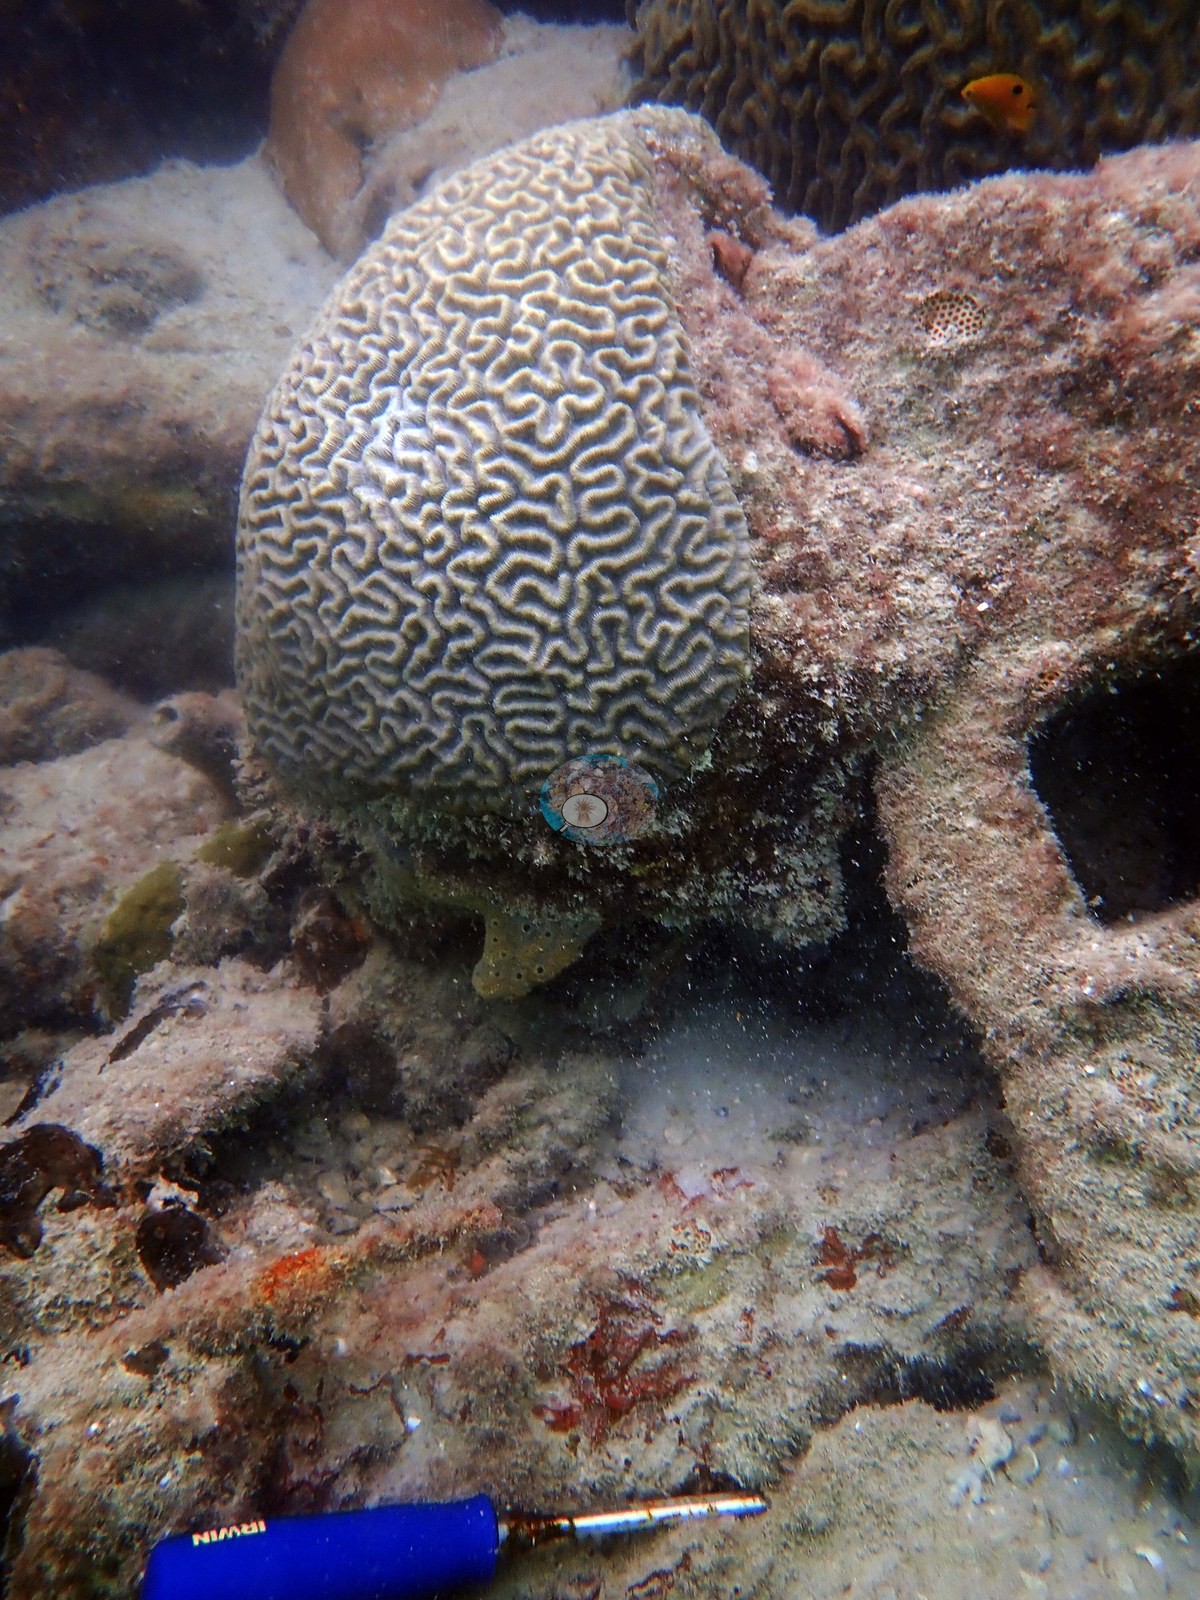
The Urban Corals study reports a separate collection at this site: tissue from 9 P. strigosa colonies on 14 February 2020 (Rubin et al. 2021, Frontiers in Marine Science 8:695236).
Other notes
The photographs that survive describe those sampled colonies, not the reef.
Independent surveys nearby
Within 5 km, 3 independent survey stations recorded hard coral cover in 2024. Since 2021, station-year means average 1.3% (range 0.0–4.0%; n = 3 station-years from 3 surveys).
Collected by other programs using different methods (NOAA rows come from NOAA monitoring programs (NCRMP, PIFSC, NCCOS), and each row's method is in its hover text), so these are context for the figures above, not a like-for-like comparison. Where a station was surveyed more than once, the cell shows either the range of its values or, as a single value, the mean of surveys made in one year. Station names are not dive-site names.
| Agency | Site / location | Date | Hard coral cover (%) | Distance | Link |
|---|---|---|---|---|---|
| NOAA NCRMP Florida | SEFCRI PSU 3094-1 | 2024 | 0.0% | 3.30 km | NCEI 0306238 |
| NOAA NCRMP Florida | SEFCRI PSU 3096-1 | 2024 | 0.0% | 4.92 km | NCEI 0306238 |
| NOAA NCRMP Florida | SEFCRI PSU 3104-1 | 2024 | 4.0% | 4.93 km | NCEI 0306238 |
Data & links
All images from Coral Reef Diagnostics. Data on this page are from Coral Reef Diagnostics (the dive record) and the organizations named in the data sources above; Coral Reef Diagnostics has no coral cover estimate of its own at this site.
© Coral Reef Diagnostics.