
Maldives - Baa Atoll (Hanifaru)
Part of the regional summaries: Maldives - North (Haa Alif to Baa / Lhaviyani) and Maldives
2016-01-24
2016-01-25
More info
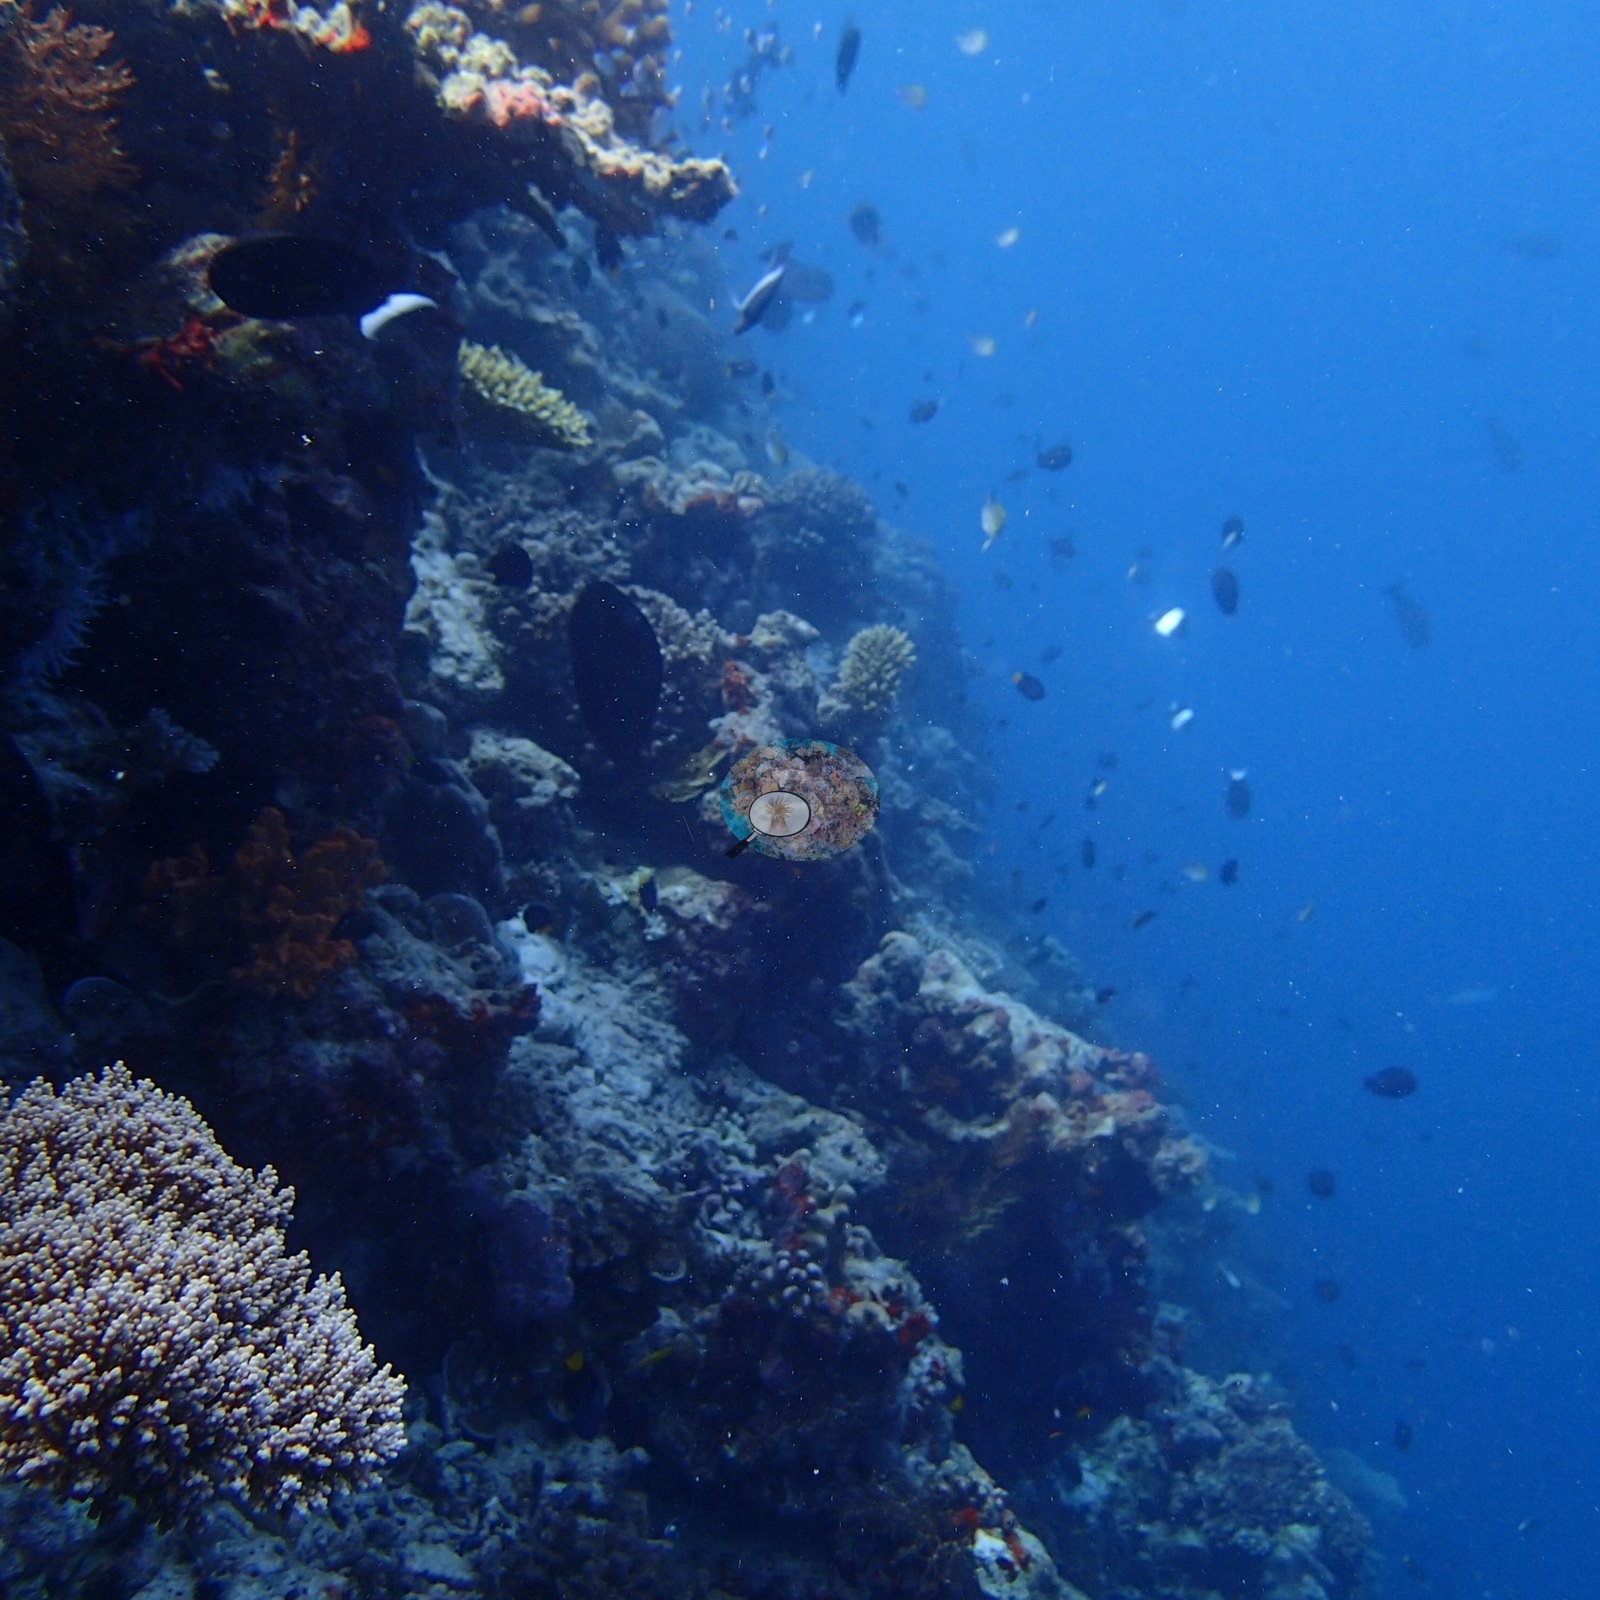
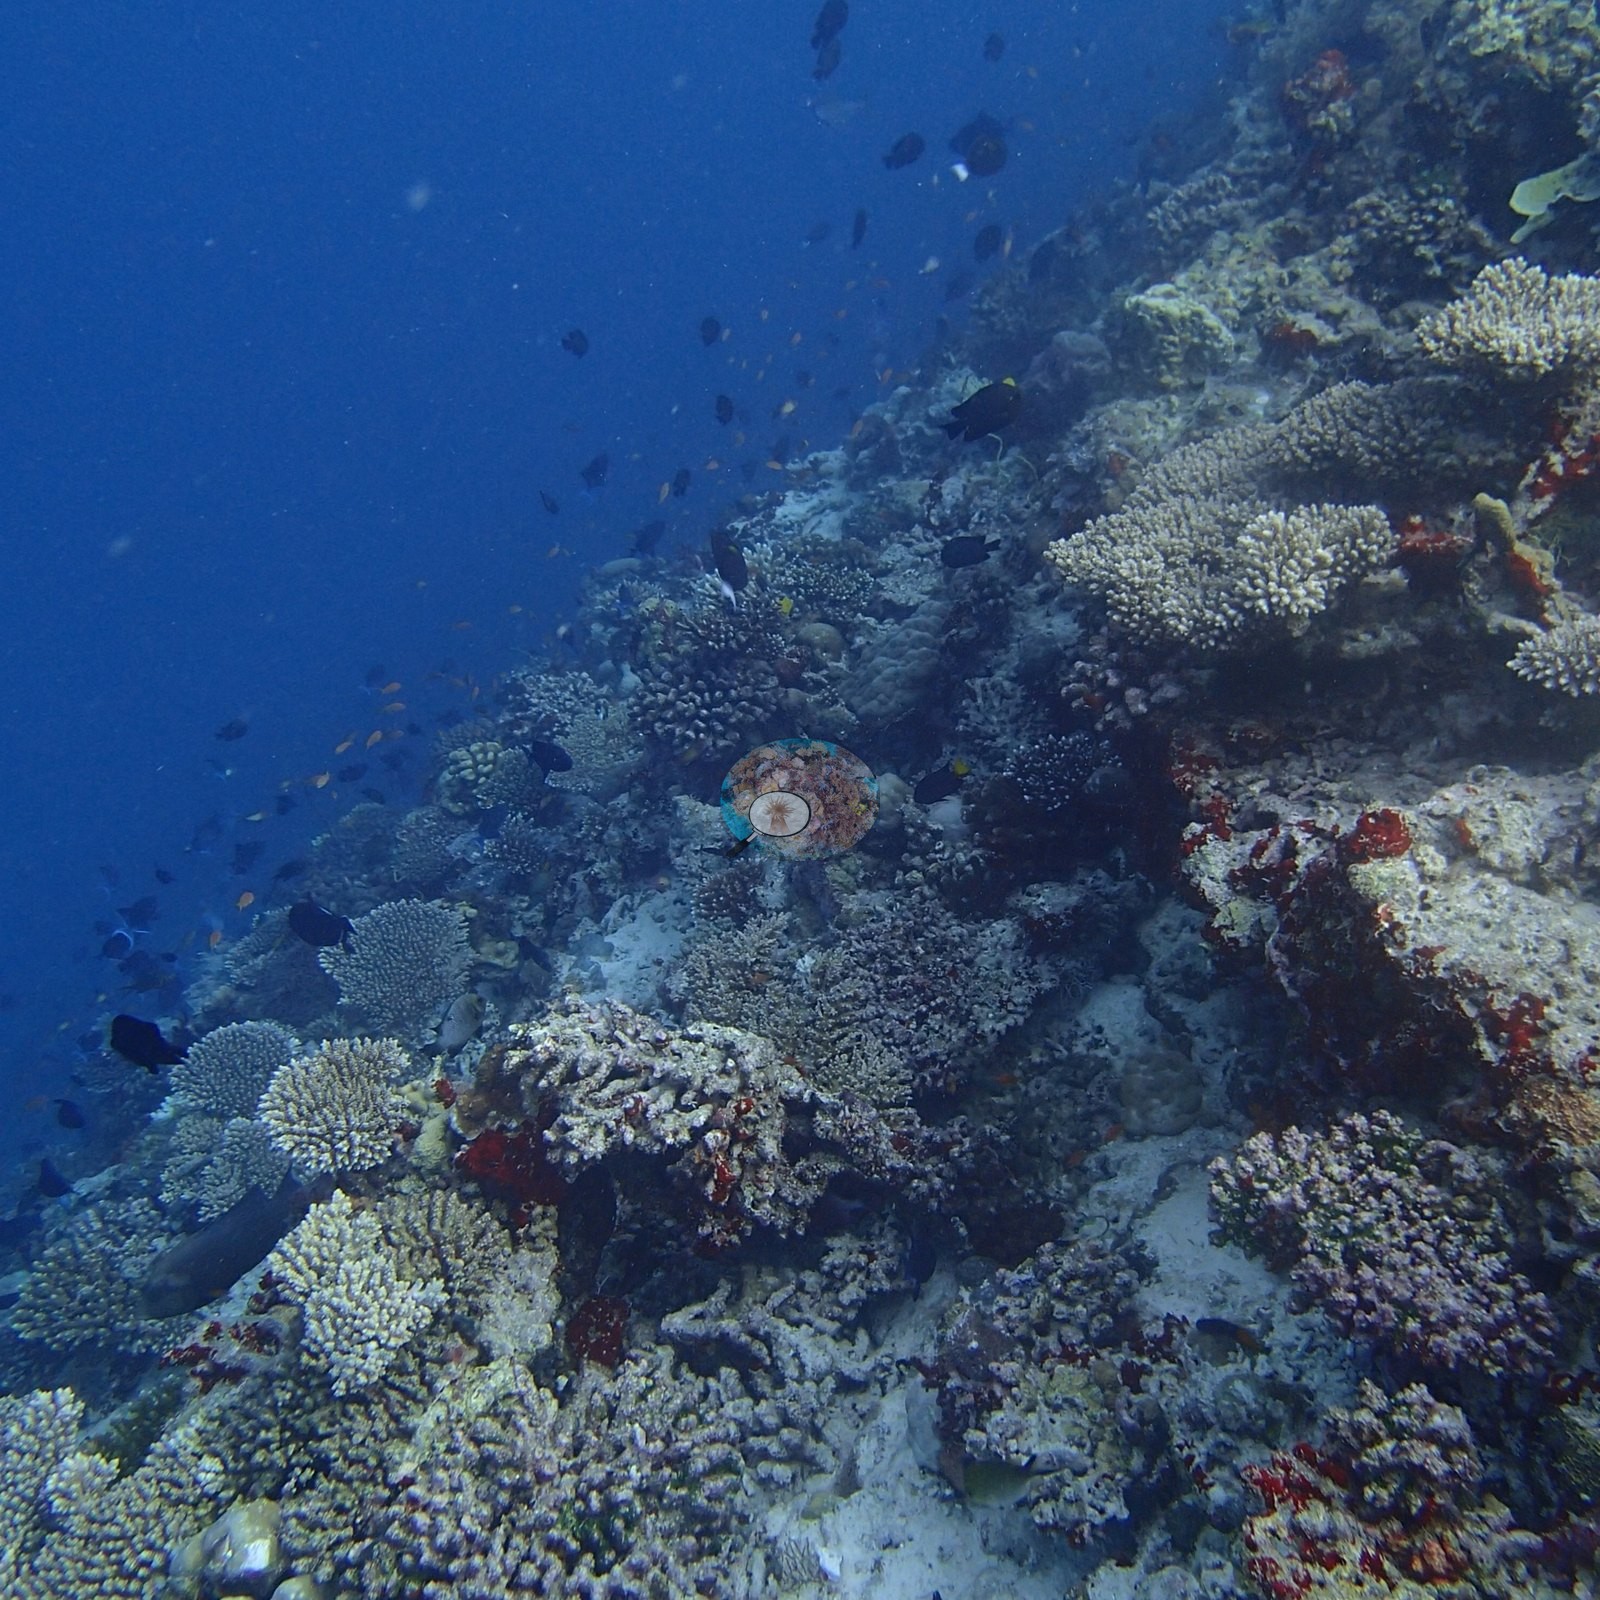
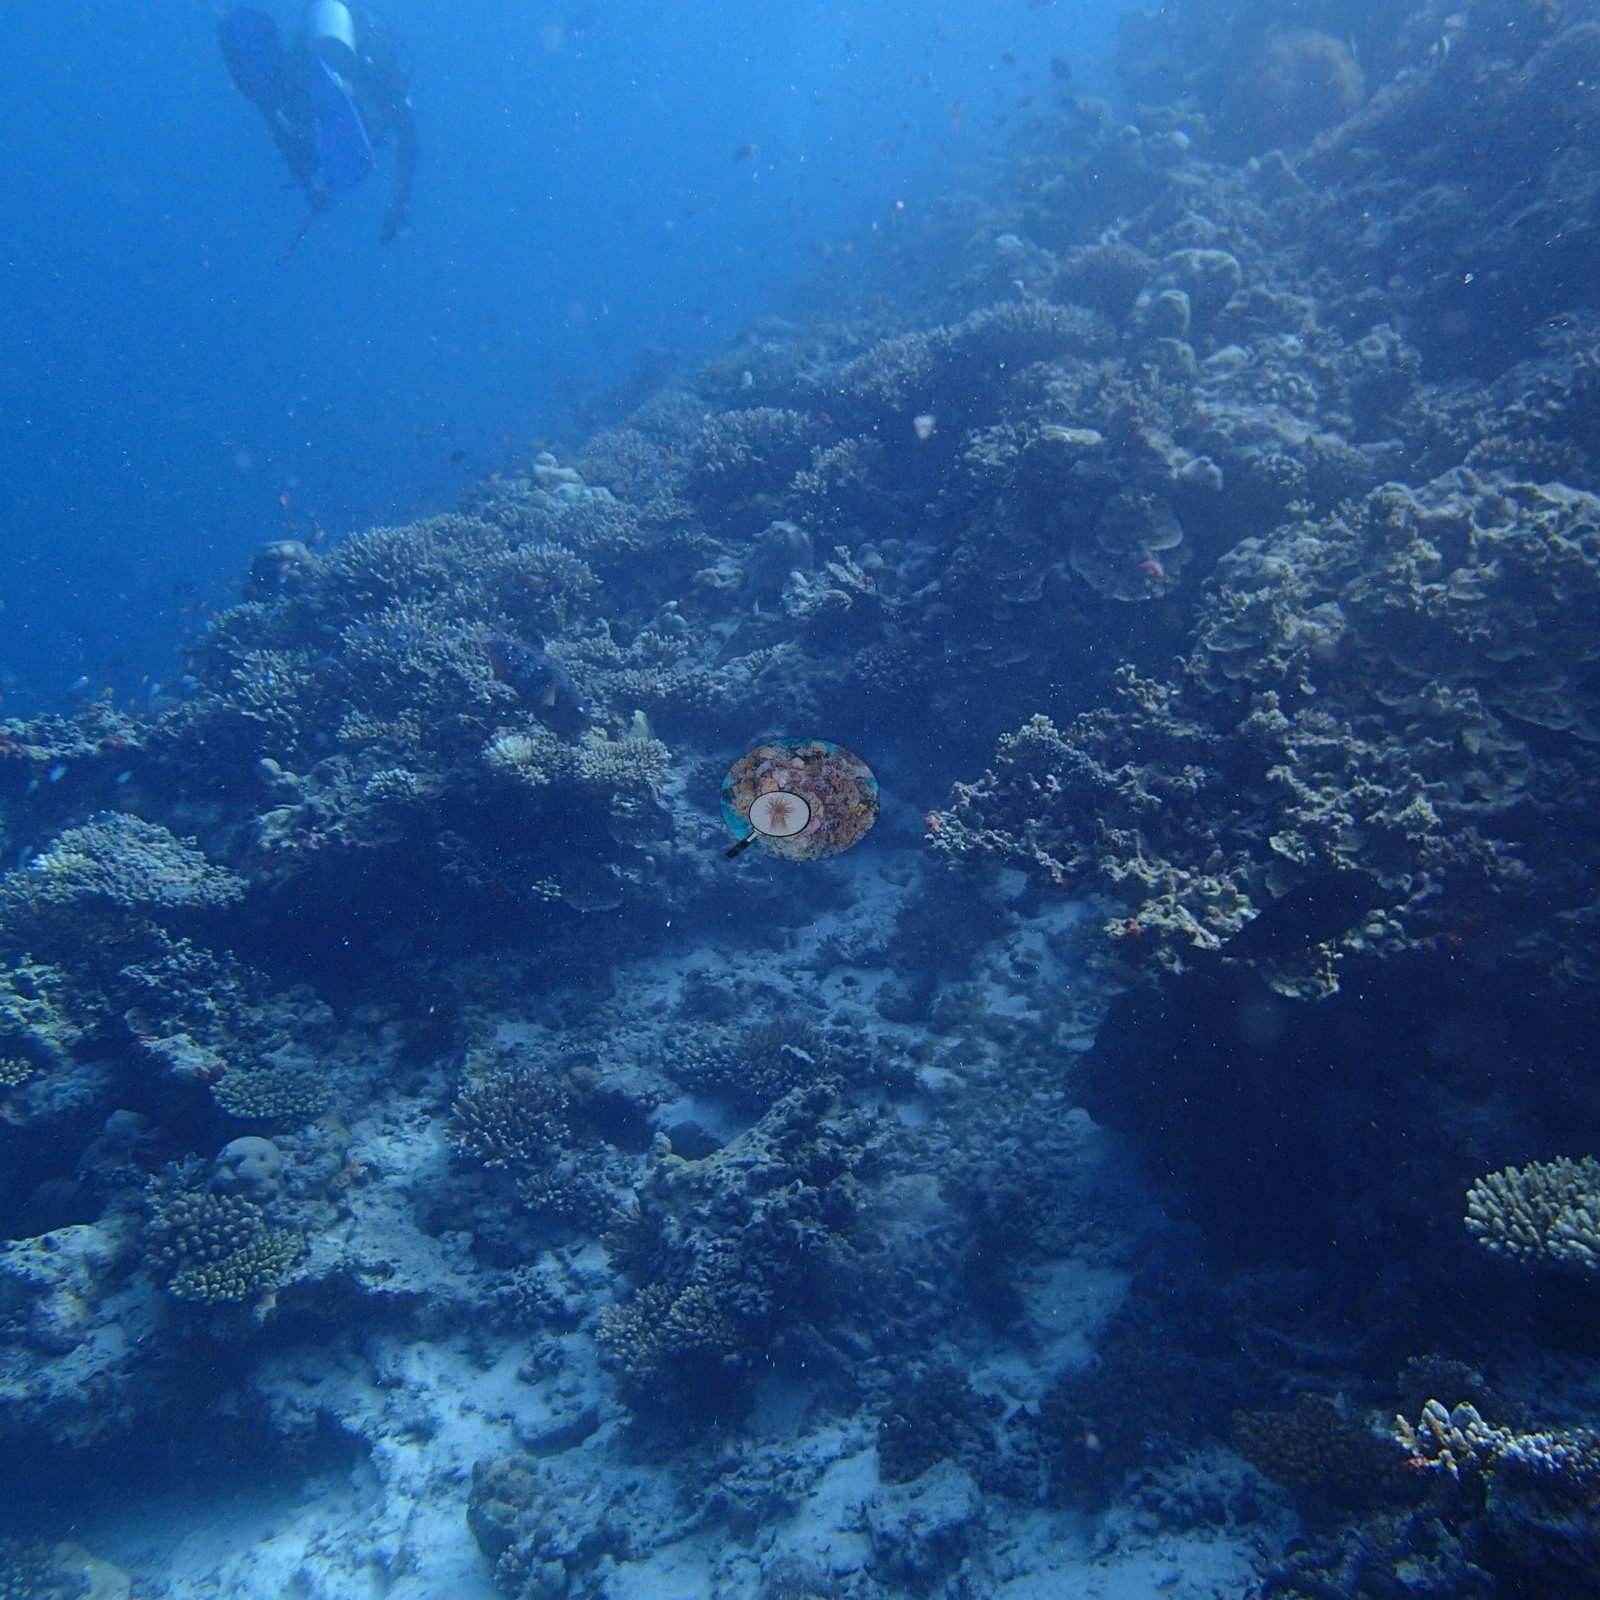
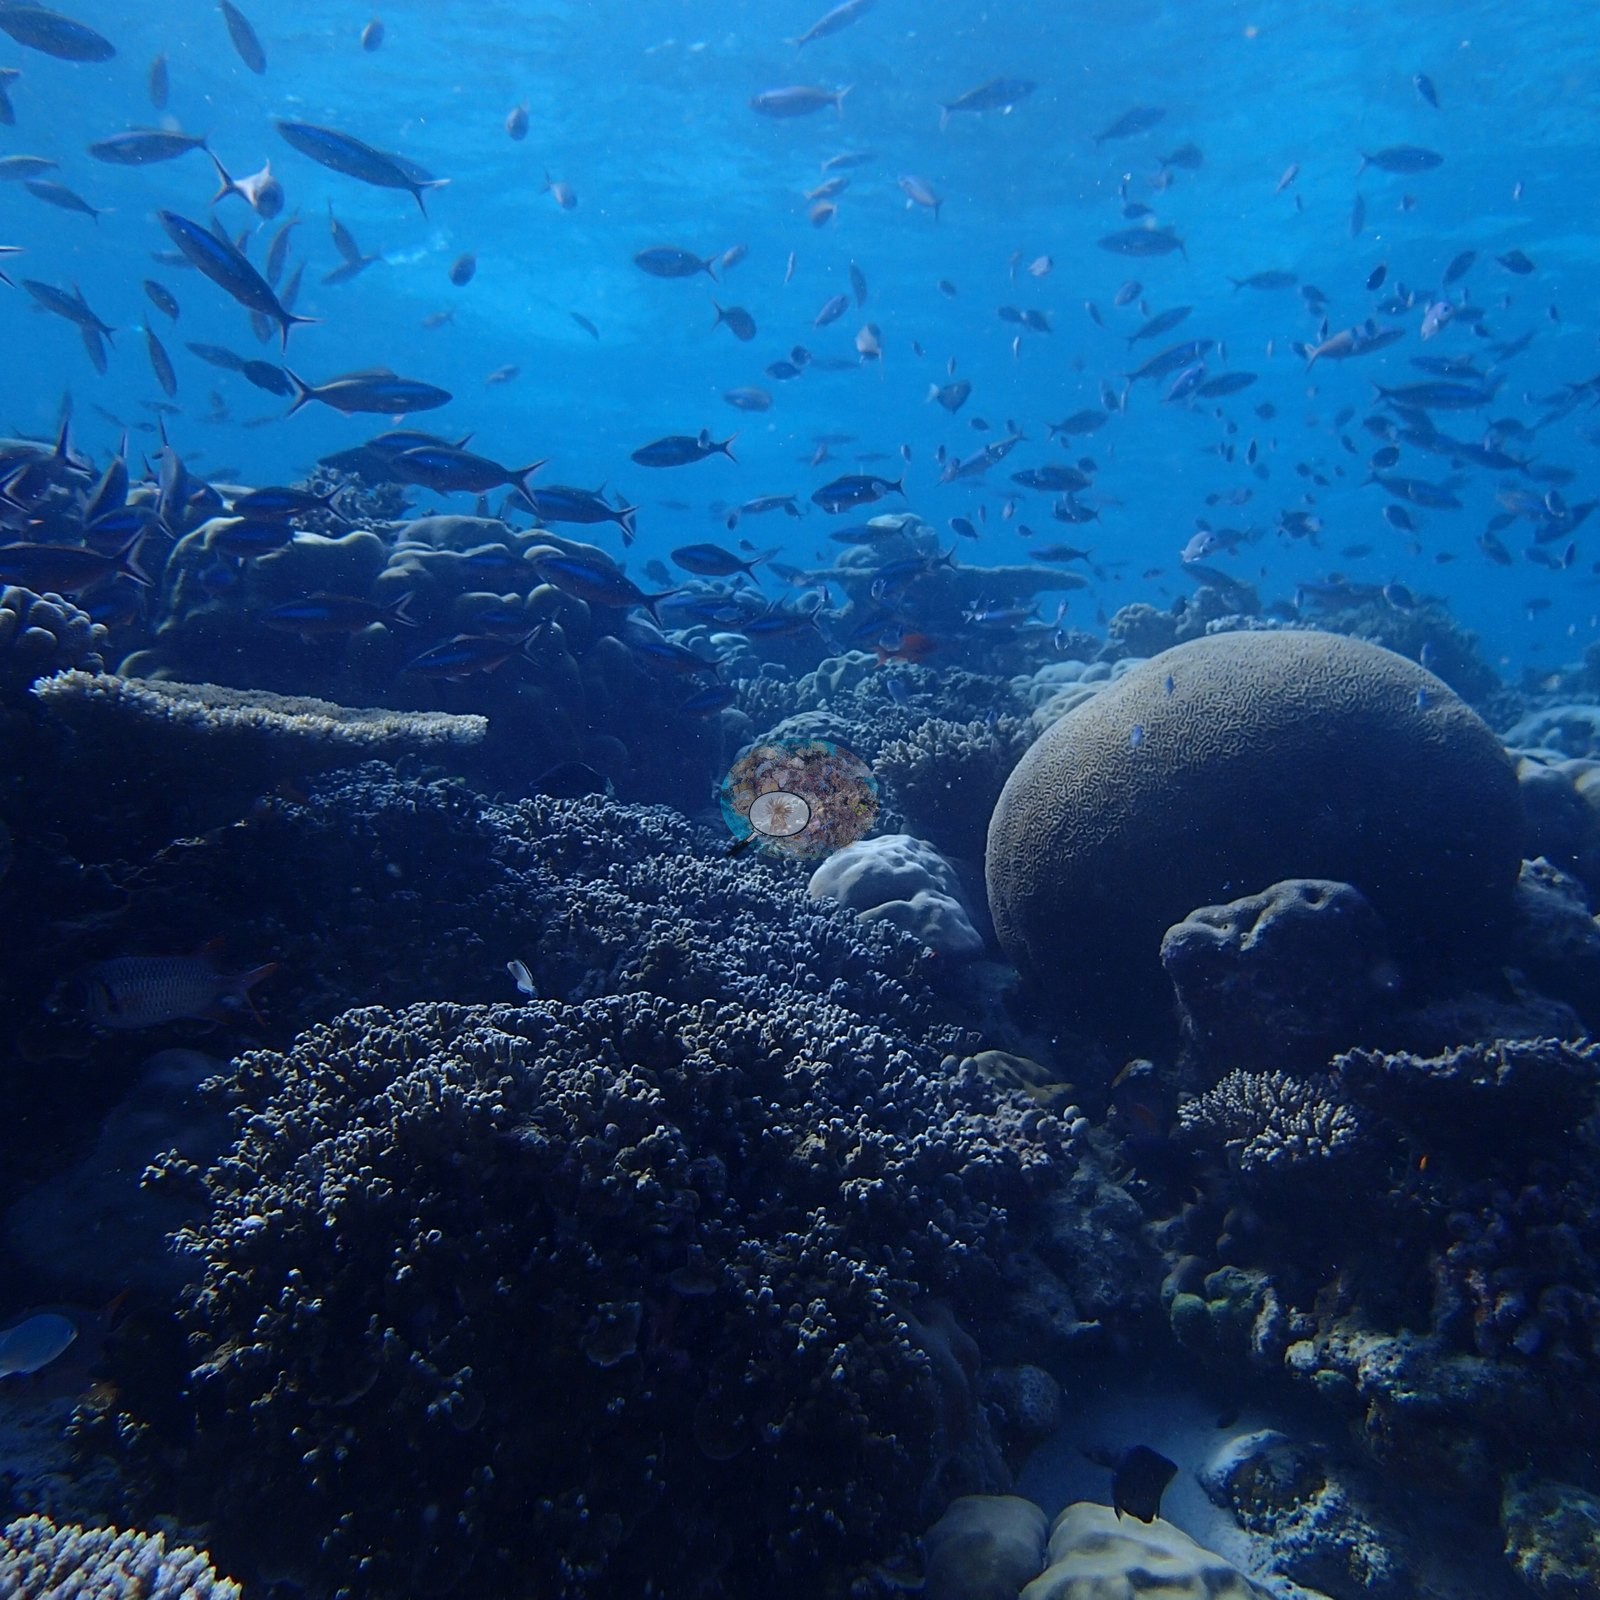
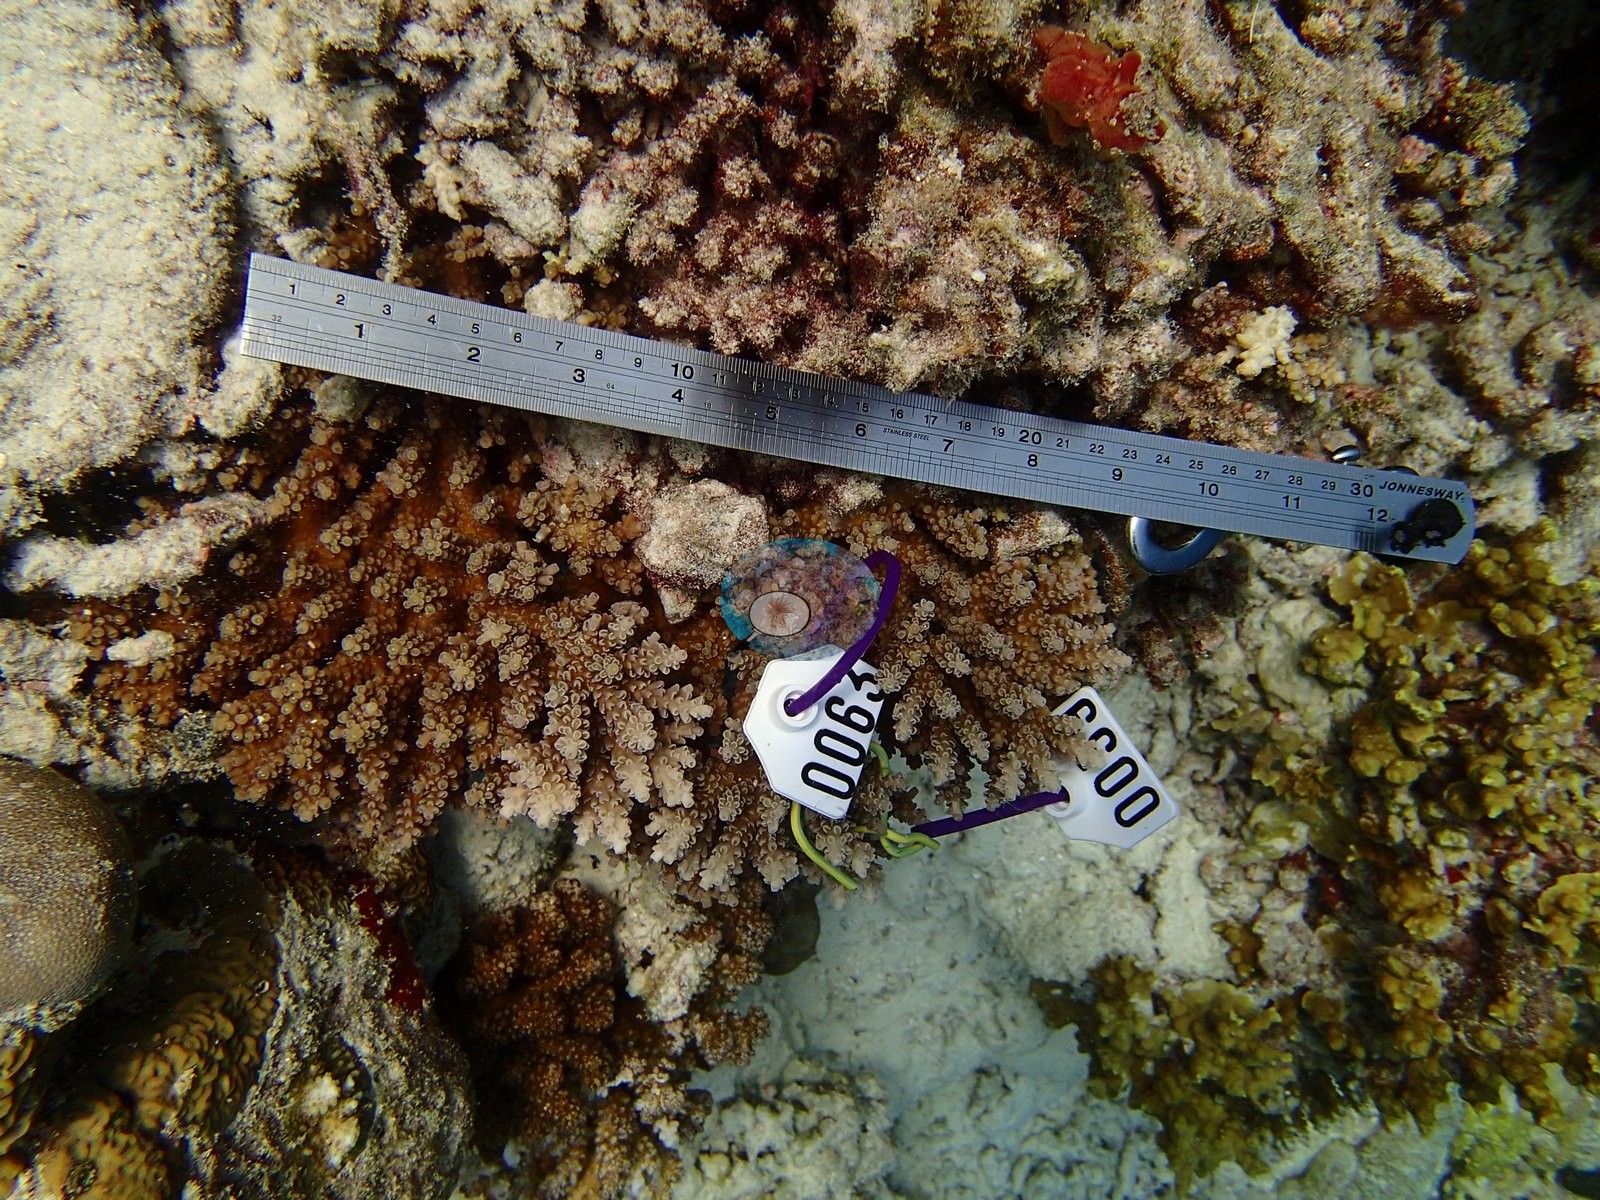
Maldives (NOAA CRW virtual station) · Maldives ecoregion mean=2.9°C-heating weeksThese January 2016 Baa Atoll research dives (parked on the coarse atoll pin since the exact reefs couldn't be geocoded) documented tagged monitoring sites ranging from a high-relief Acropora- and Pocillopora-rich reef front to a gentler field of Porites domes and leather corals - with the first hint of trouble already visible as scattered bone-white branch tips, photographed roughly three months before the 2016 El Nino bleaching event that devastated Baa's study reefs. Computer-vision analysis of these frames puts live cover at 27%.
One independent survey station shown with the program’s logo — click one to see how far it is from this site.
One other CRD dive site within 5 km shown in orange — click a marker to open its page.
23 of these 45 photographs are shown beside the text that discusses them under "Site description" below.
Site description
General benthic features
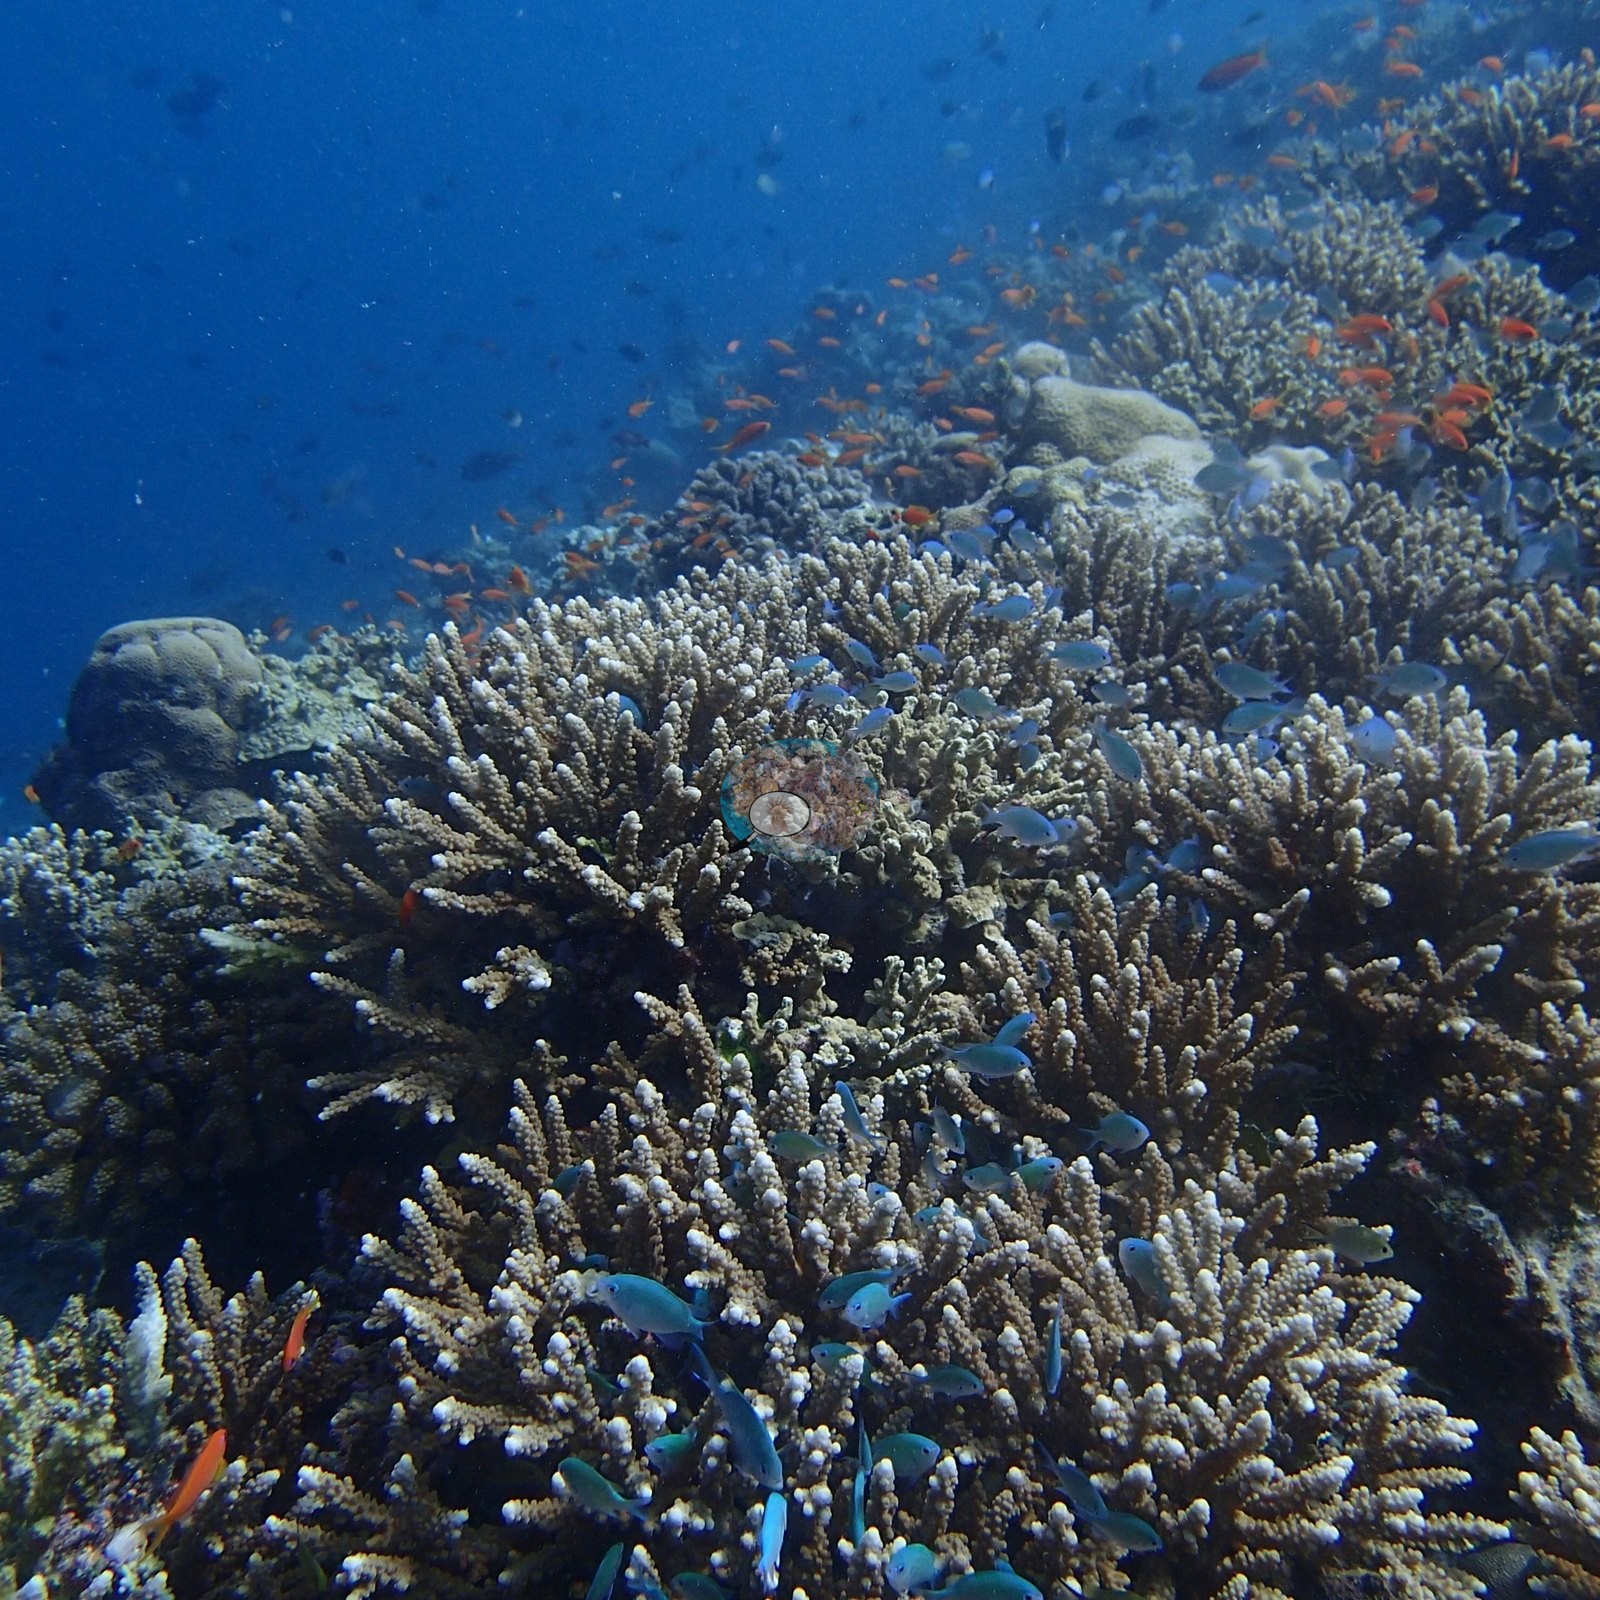
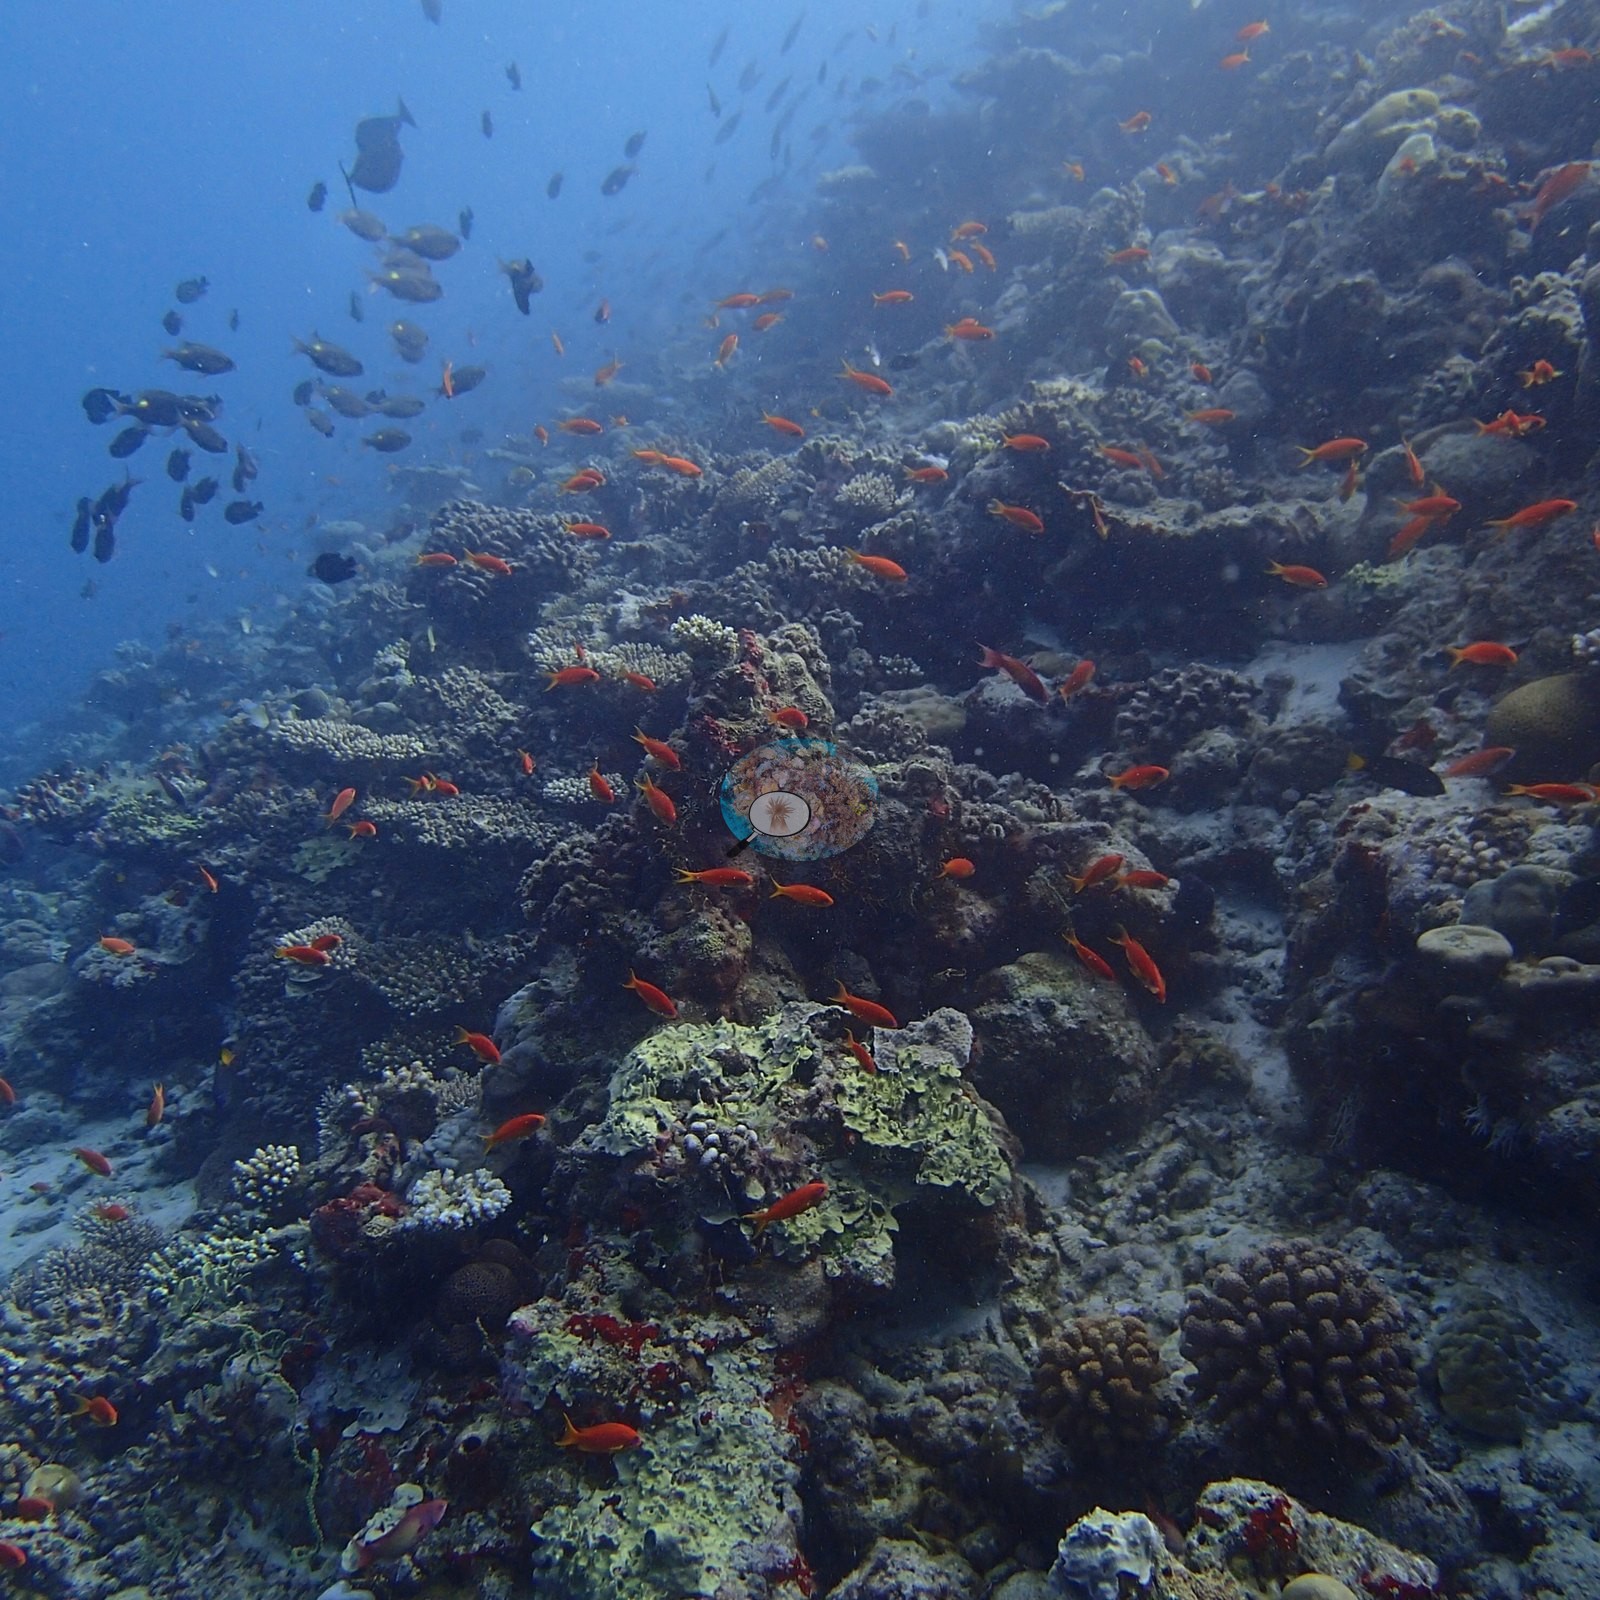
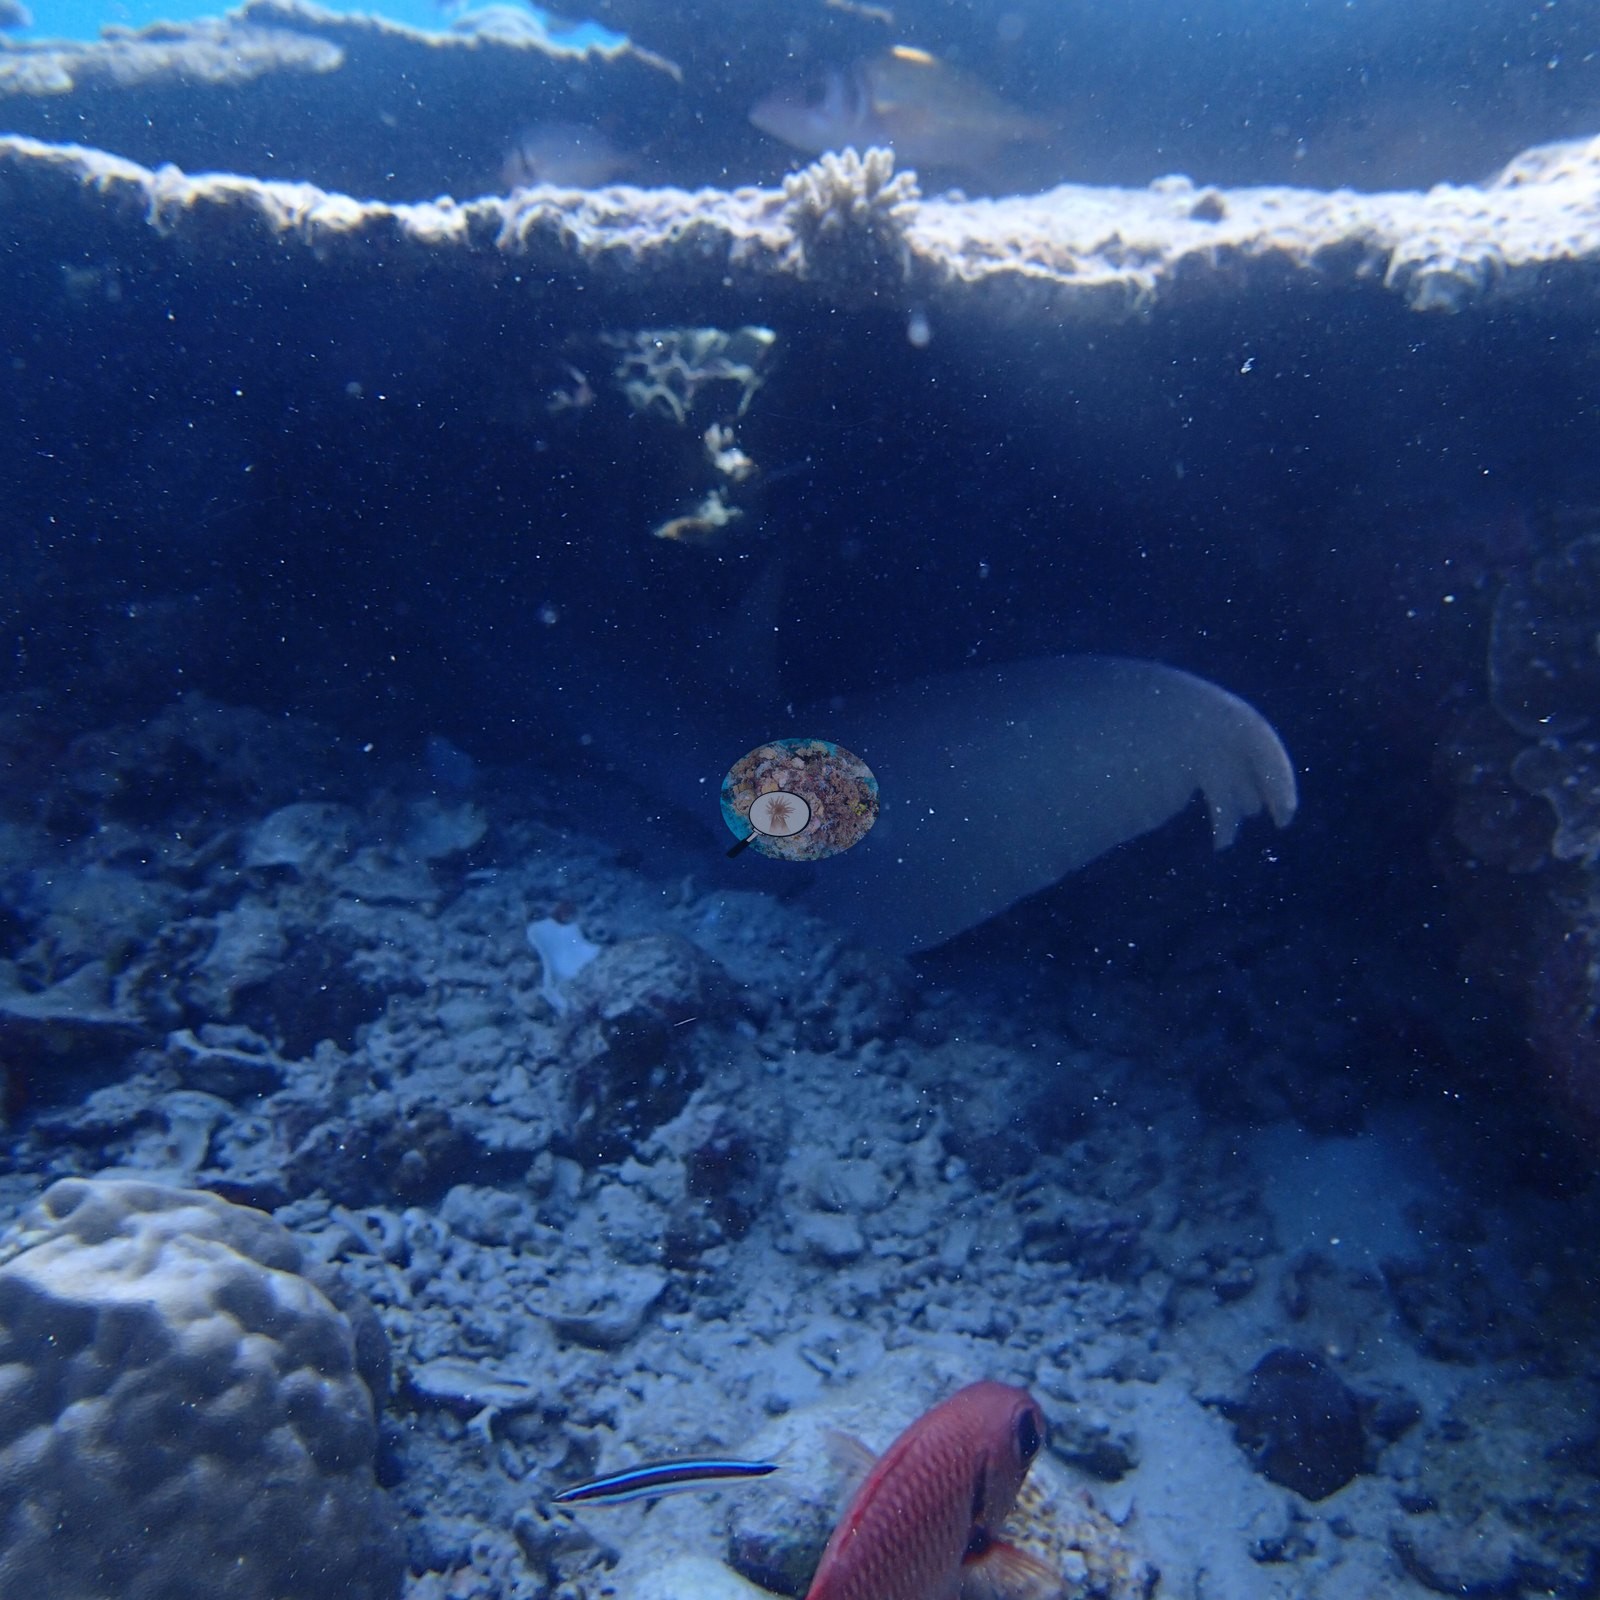
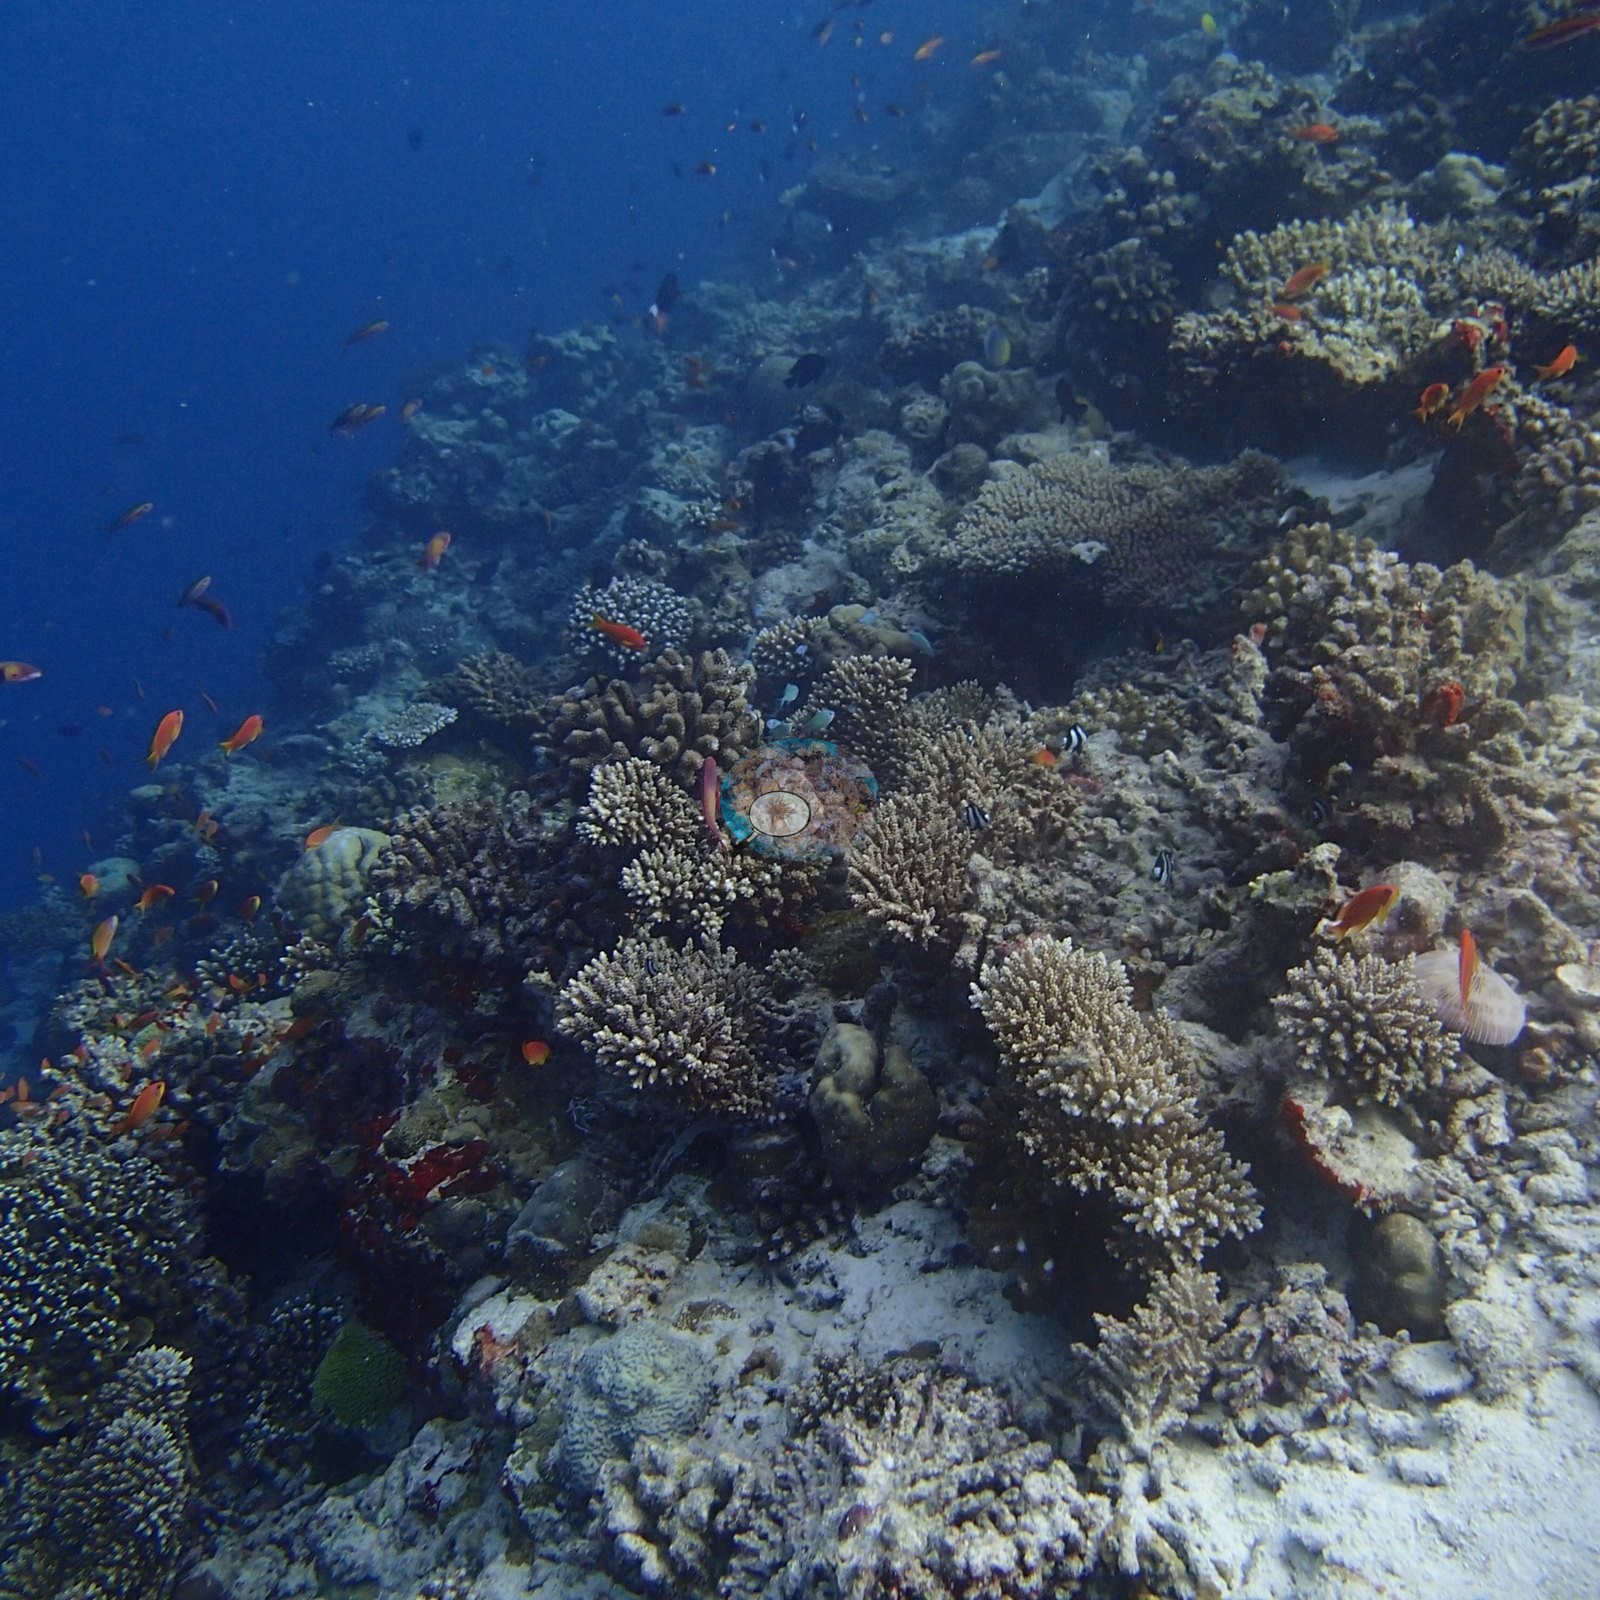
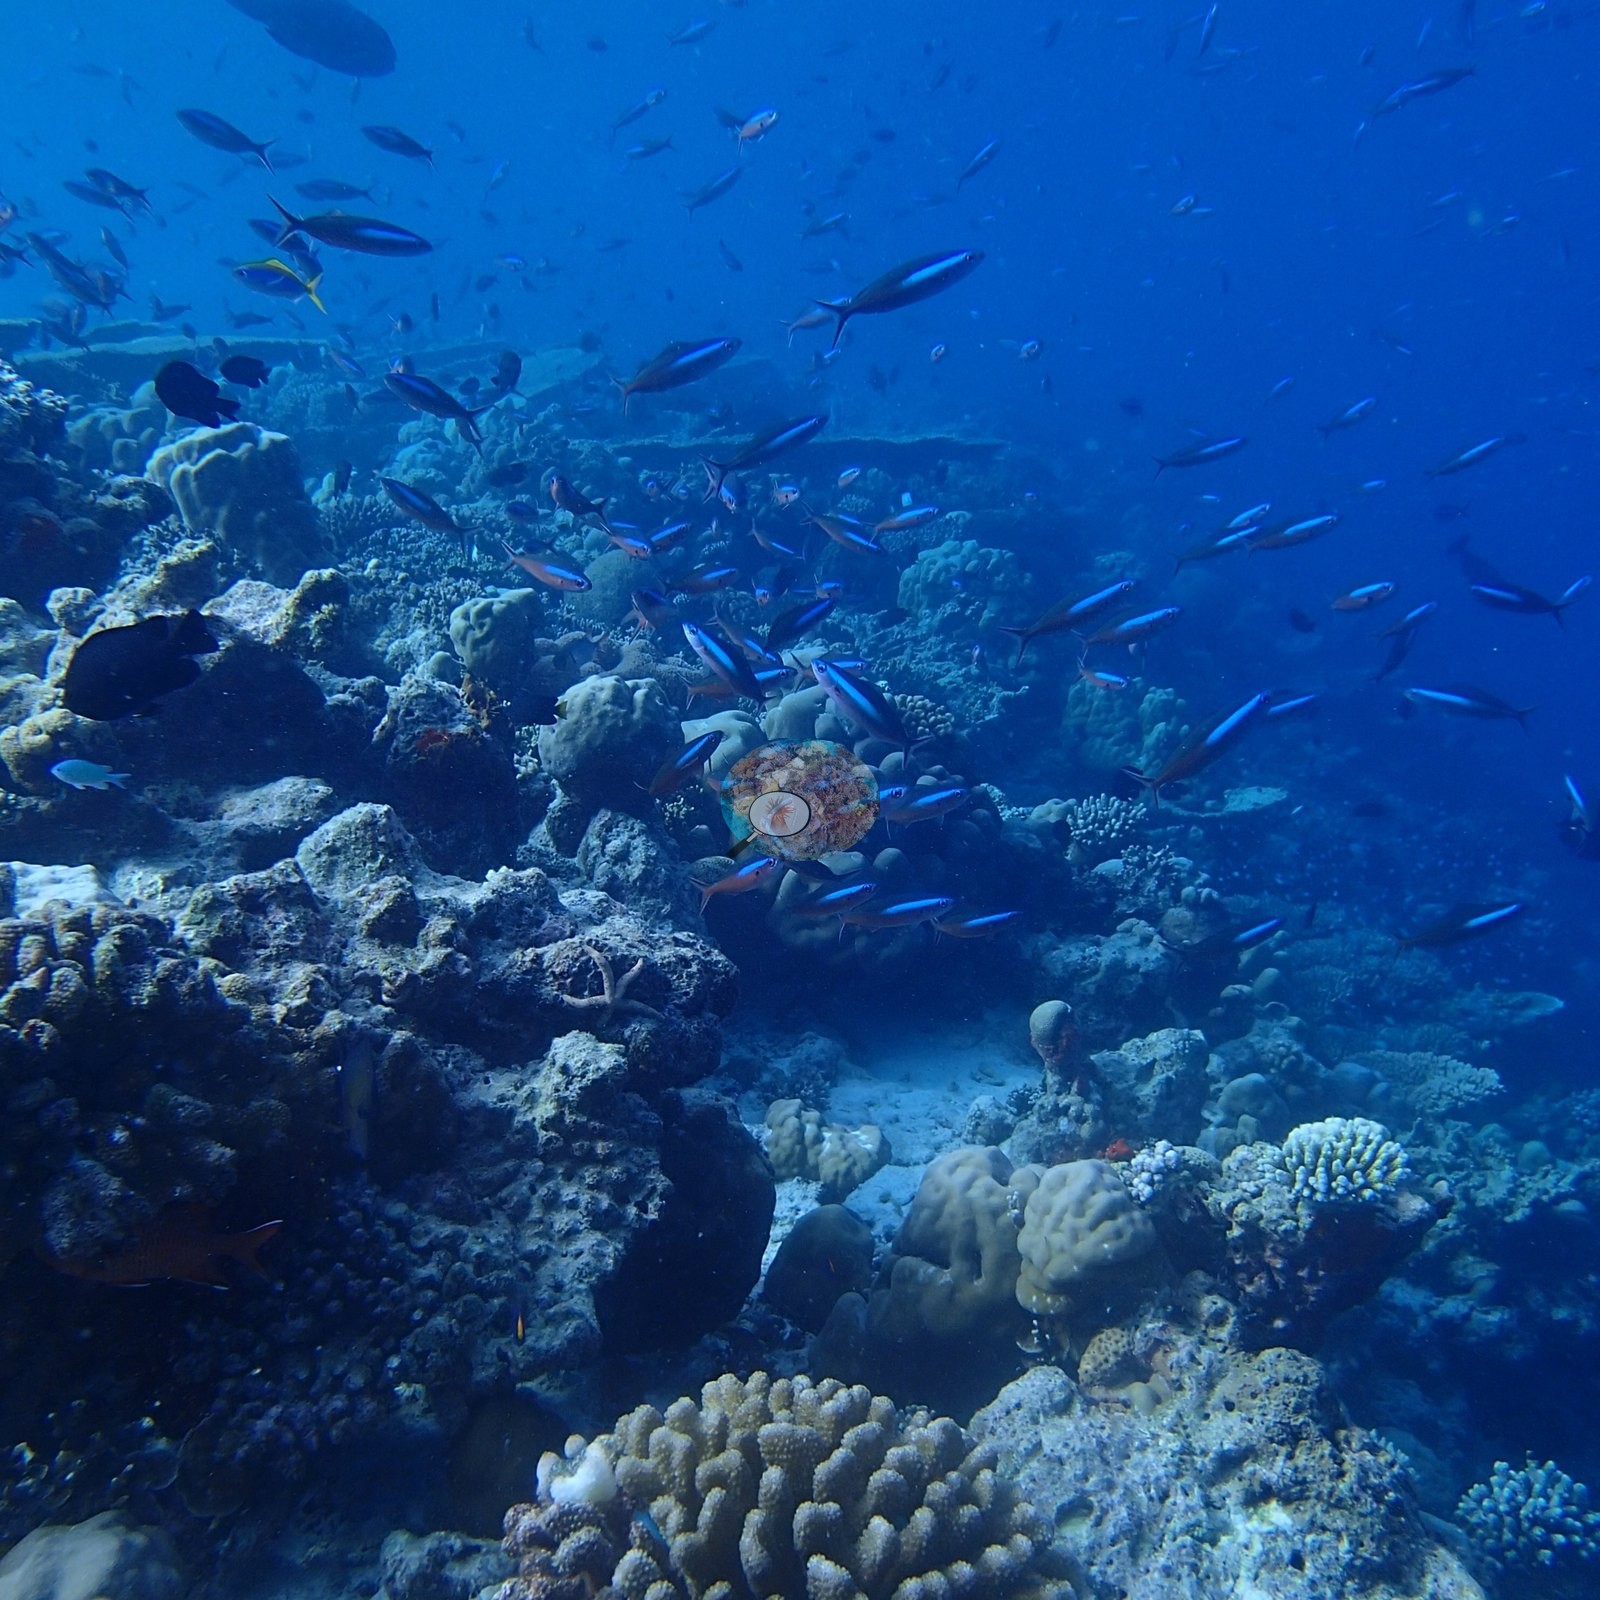
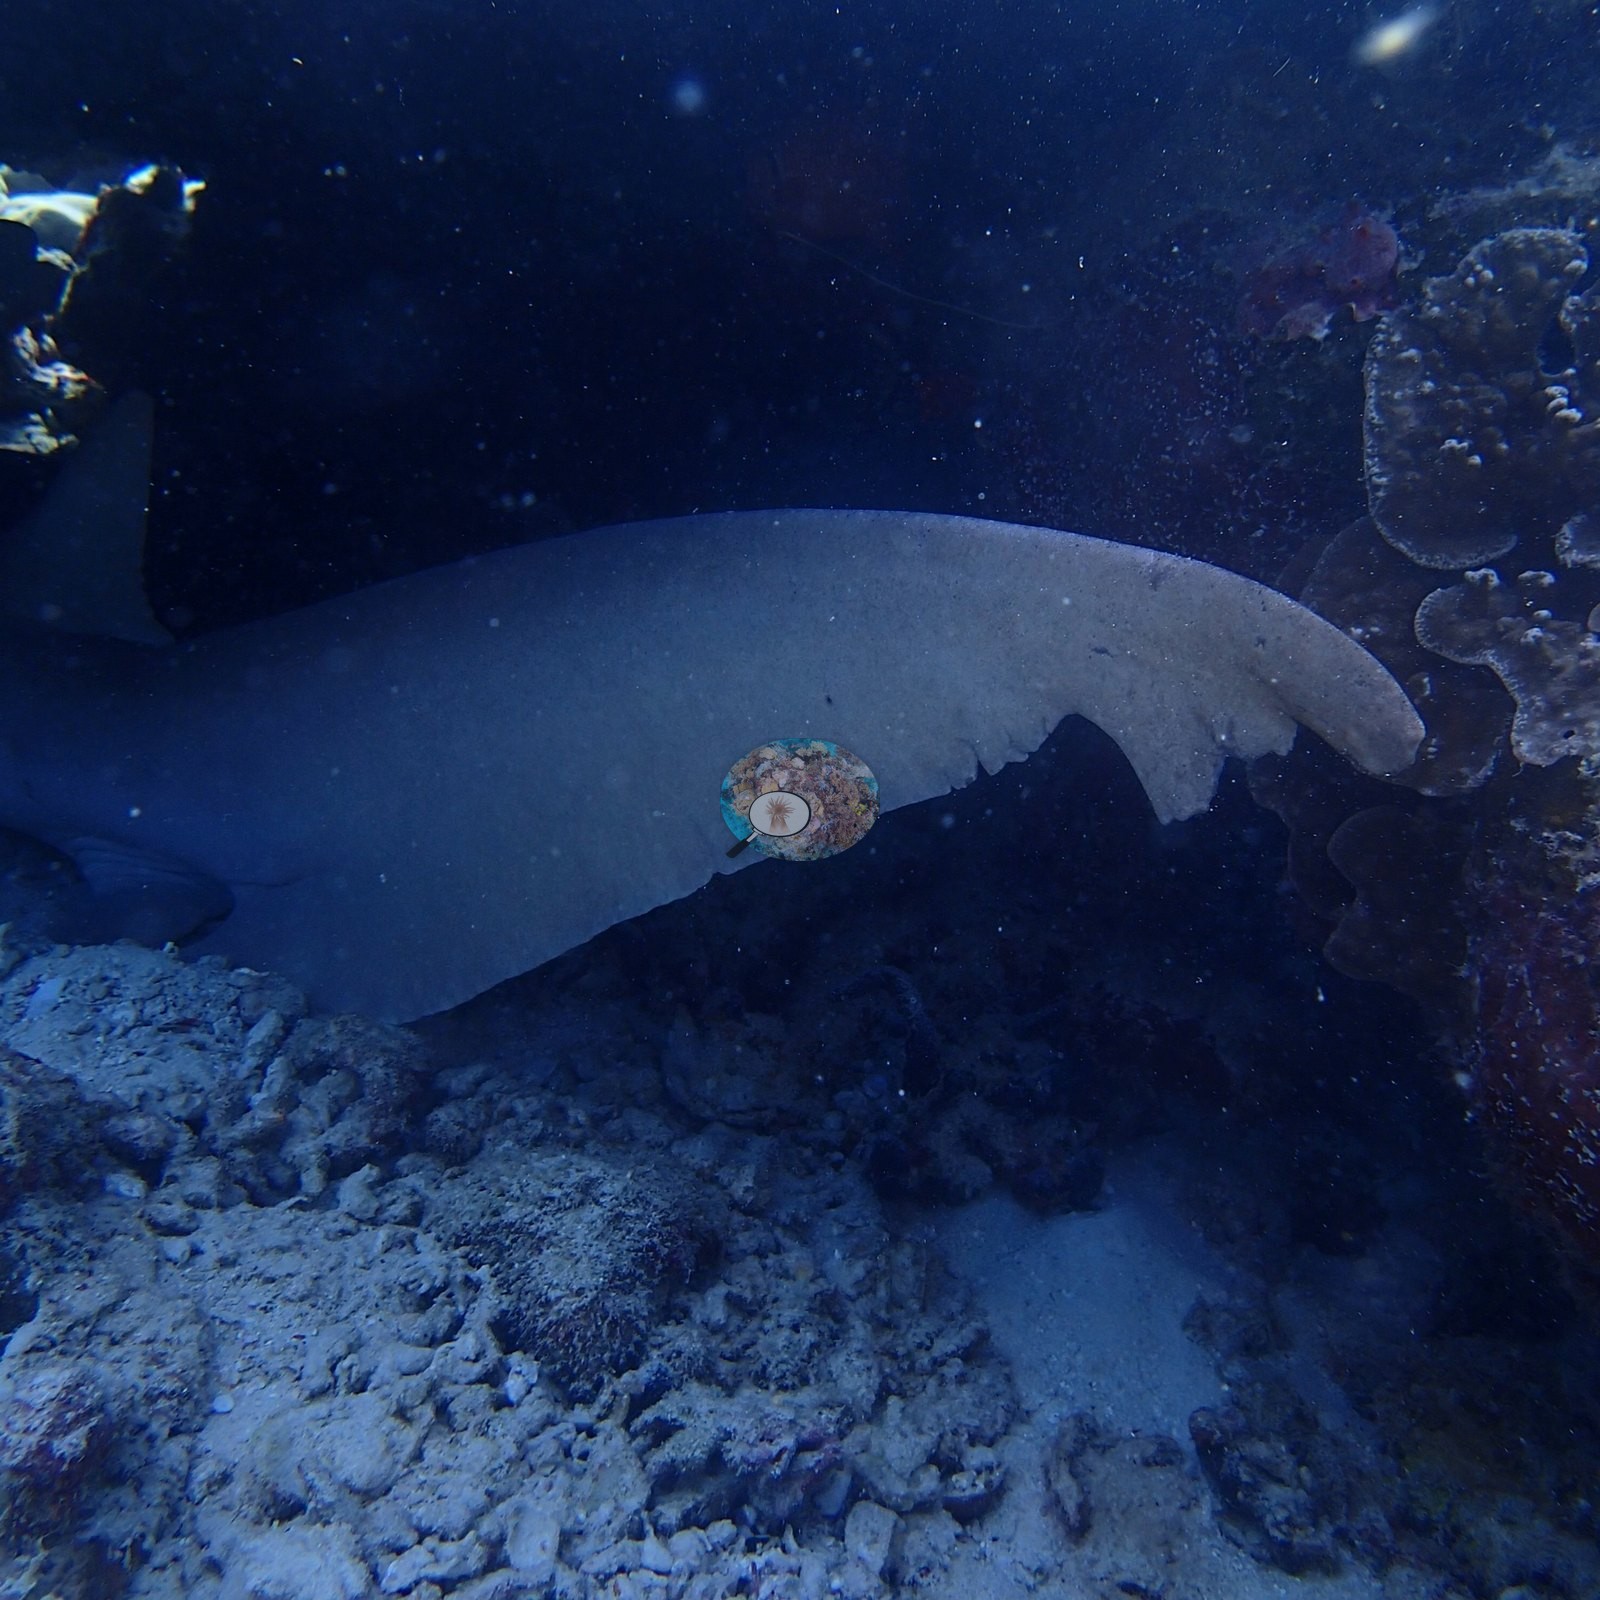
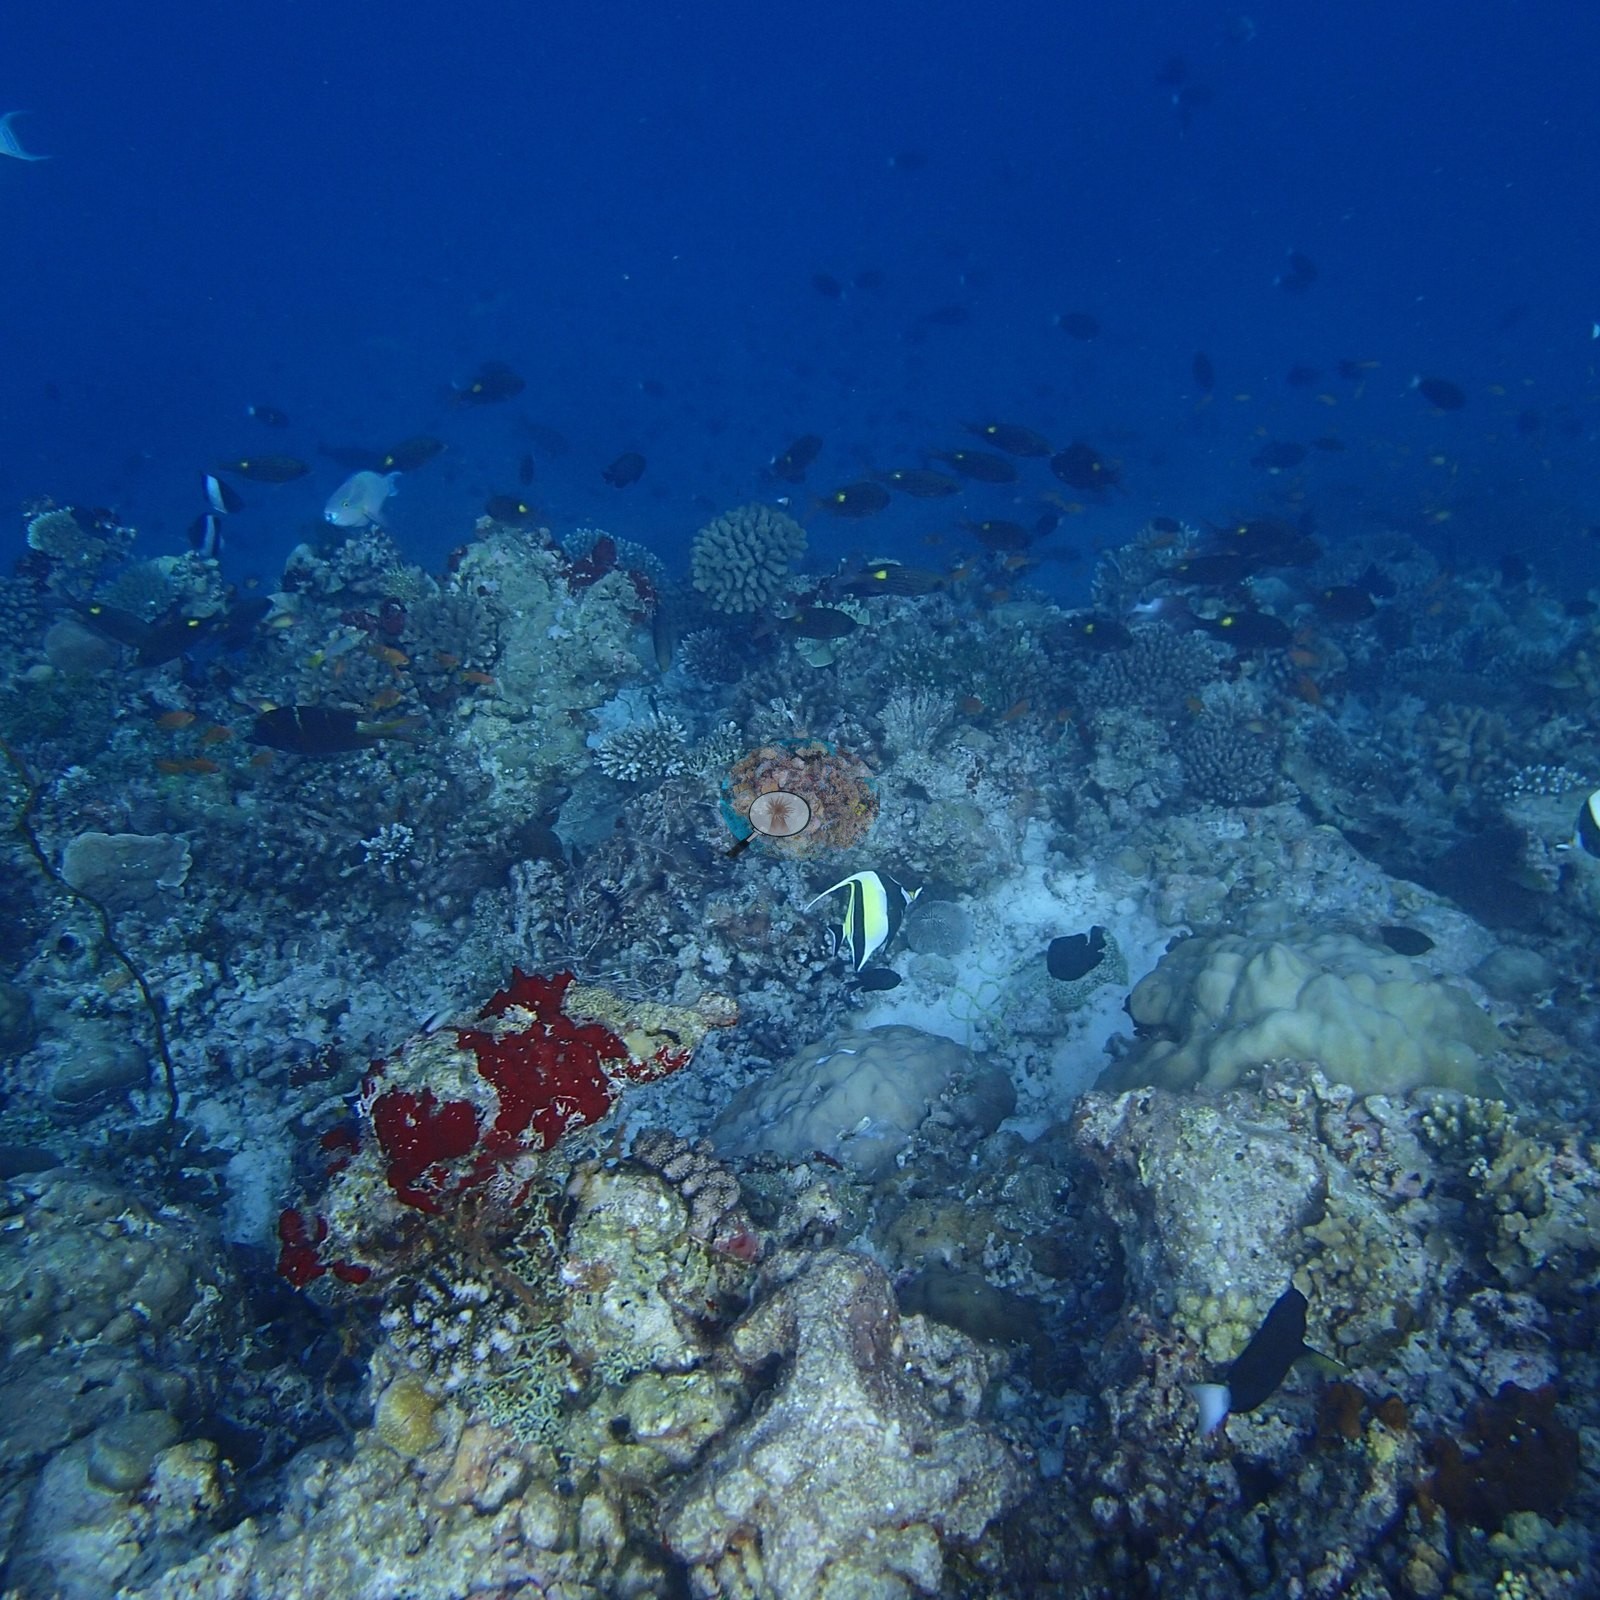
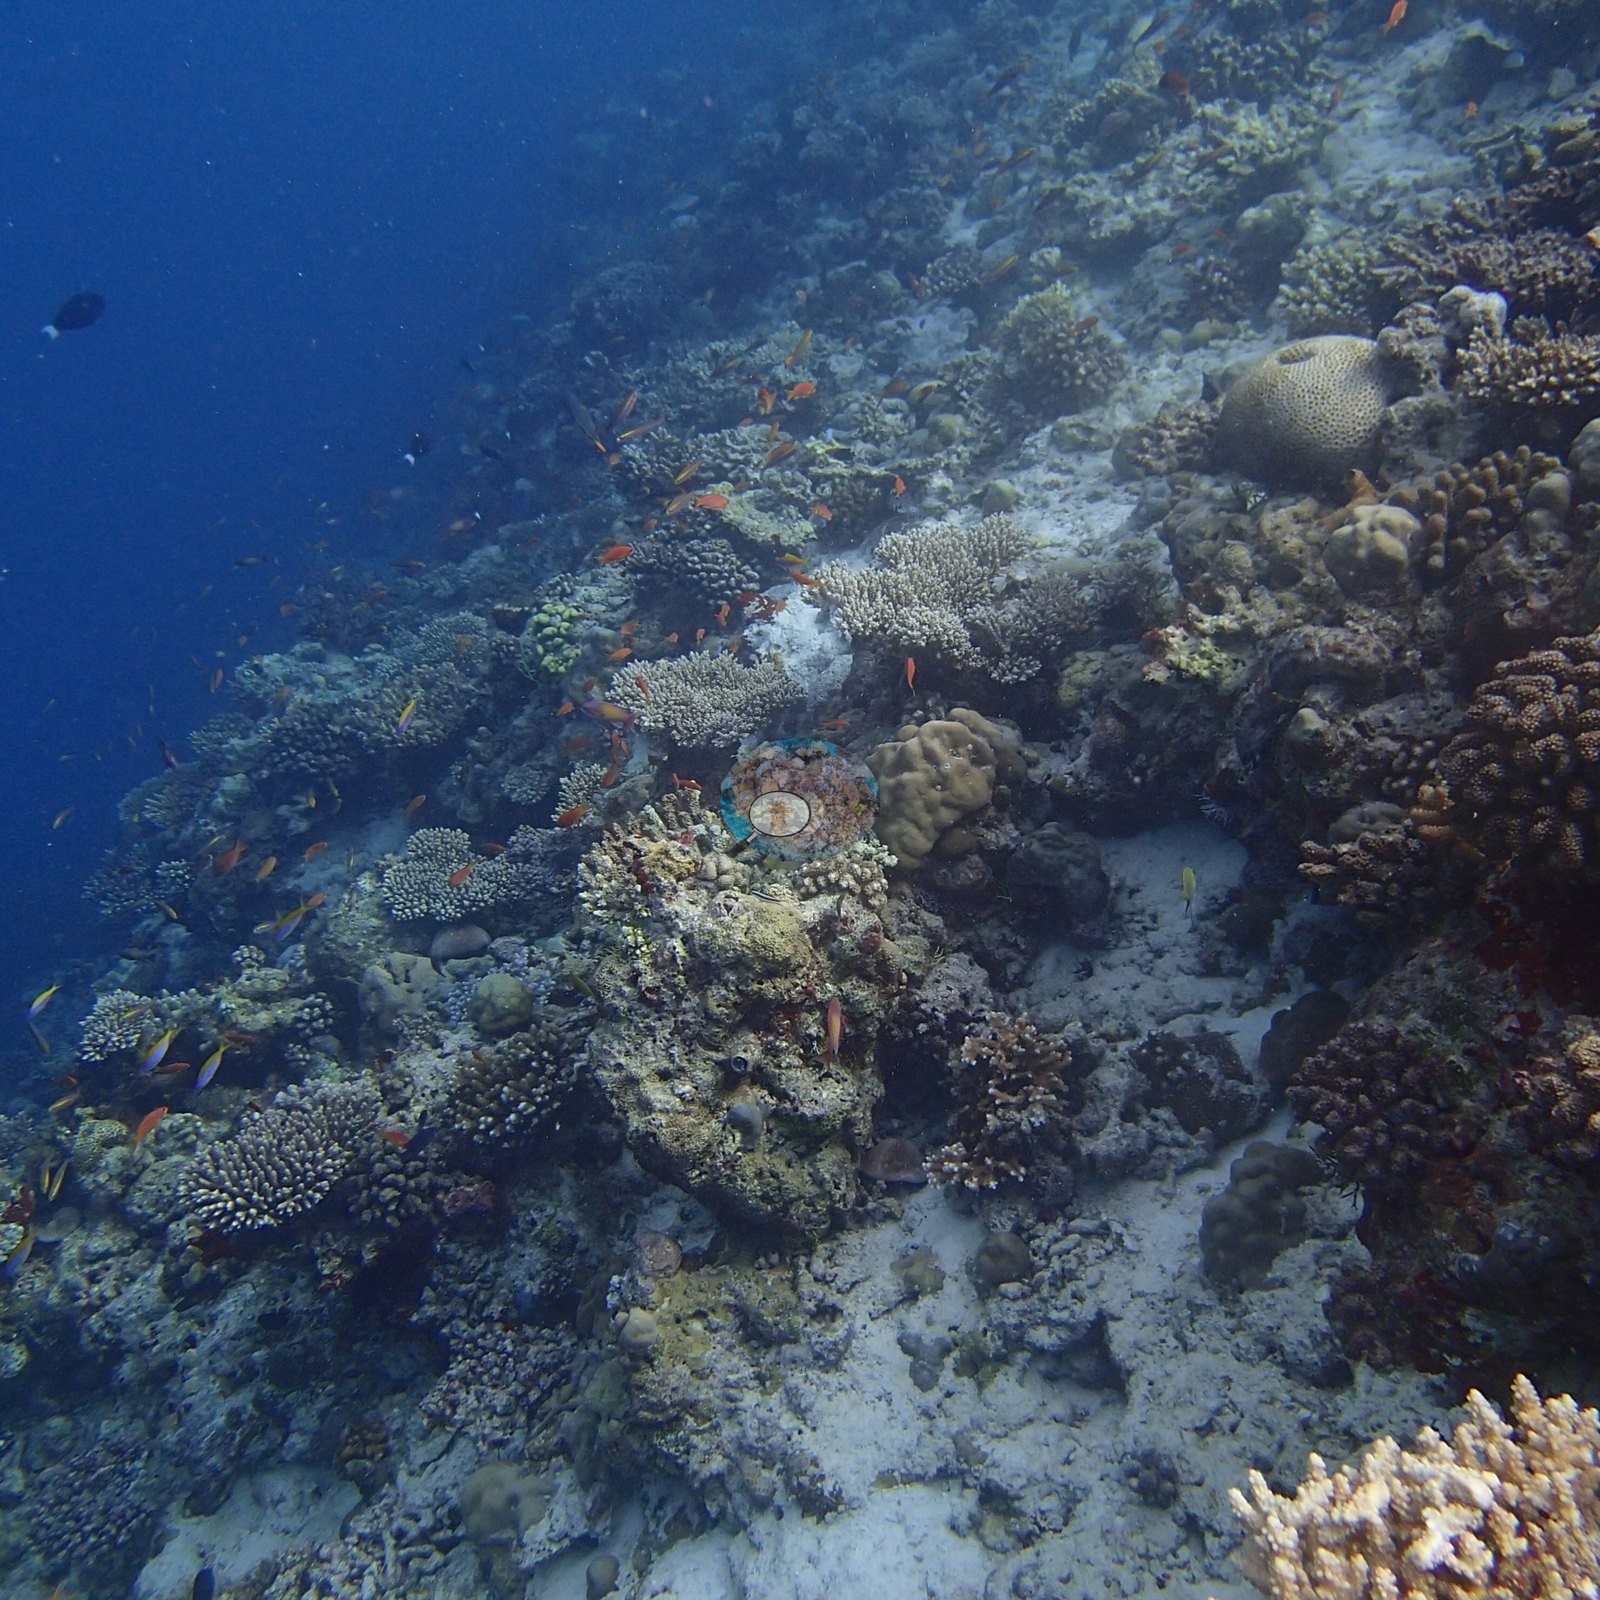
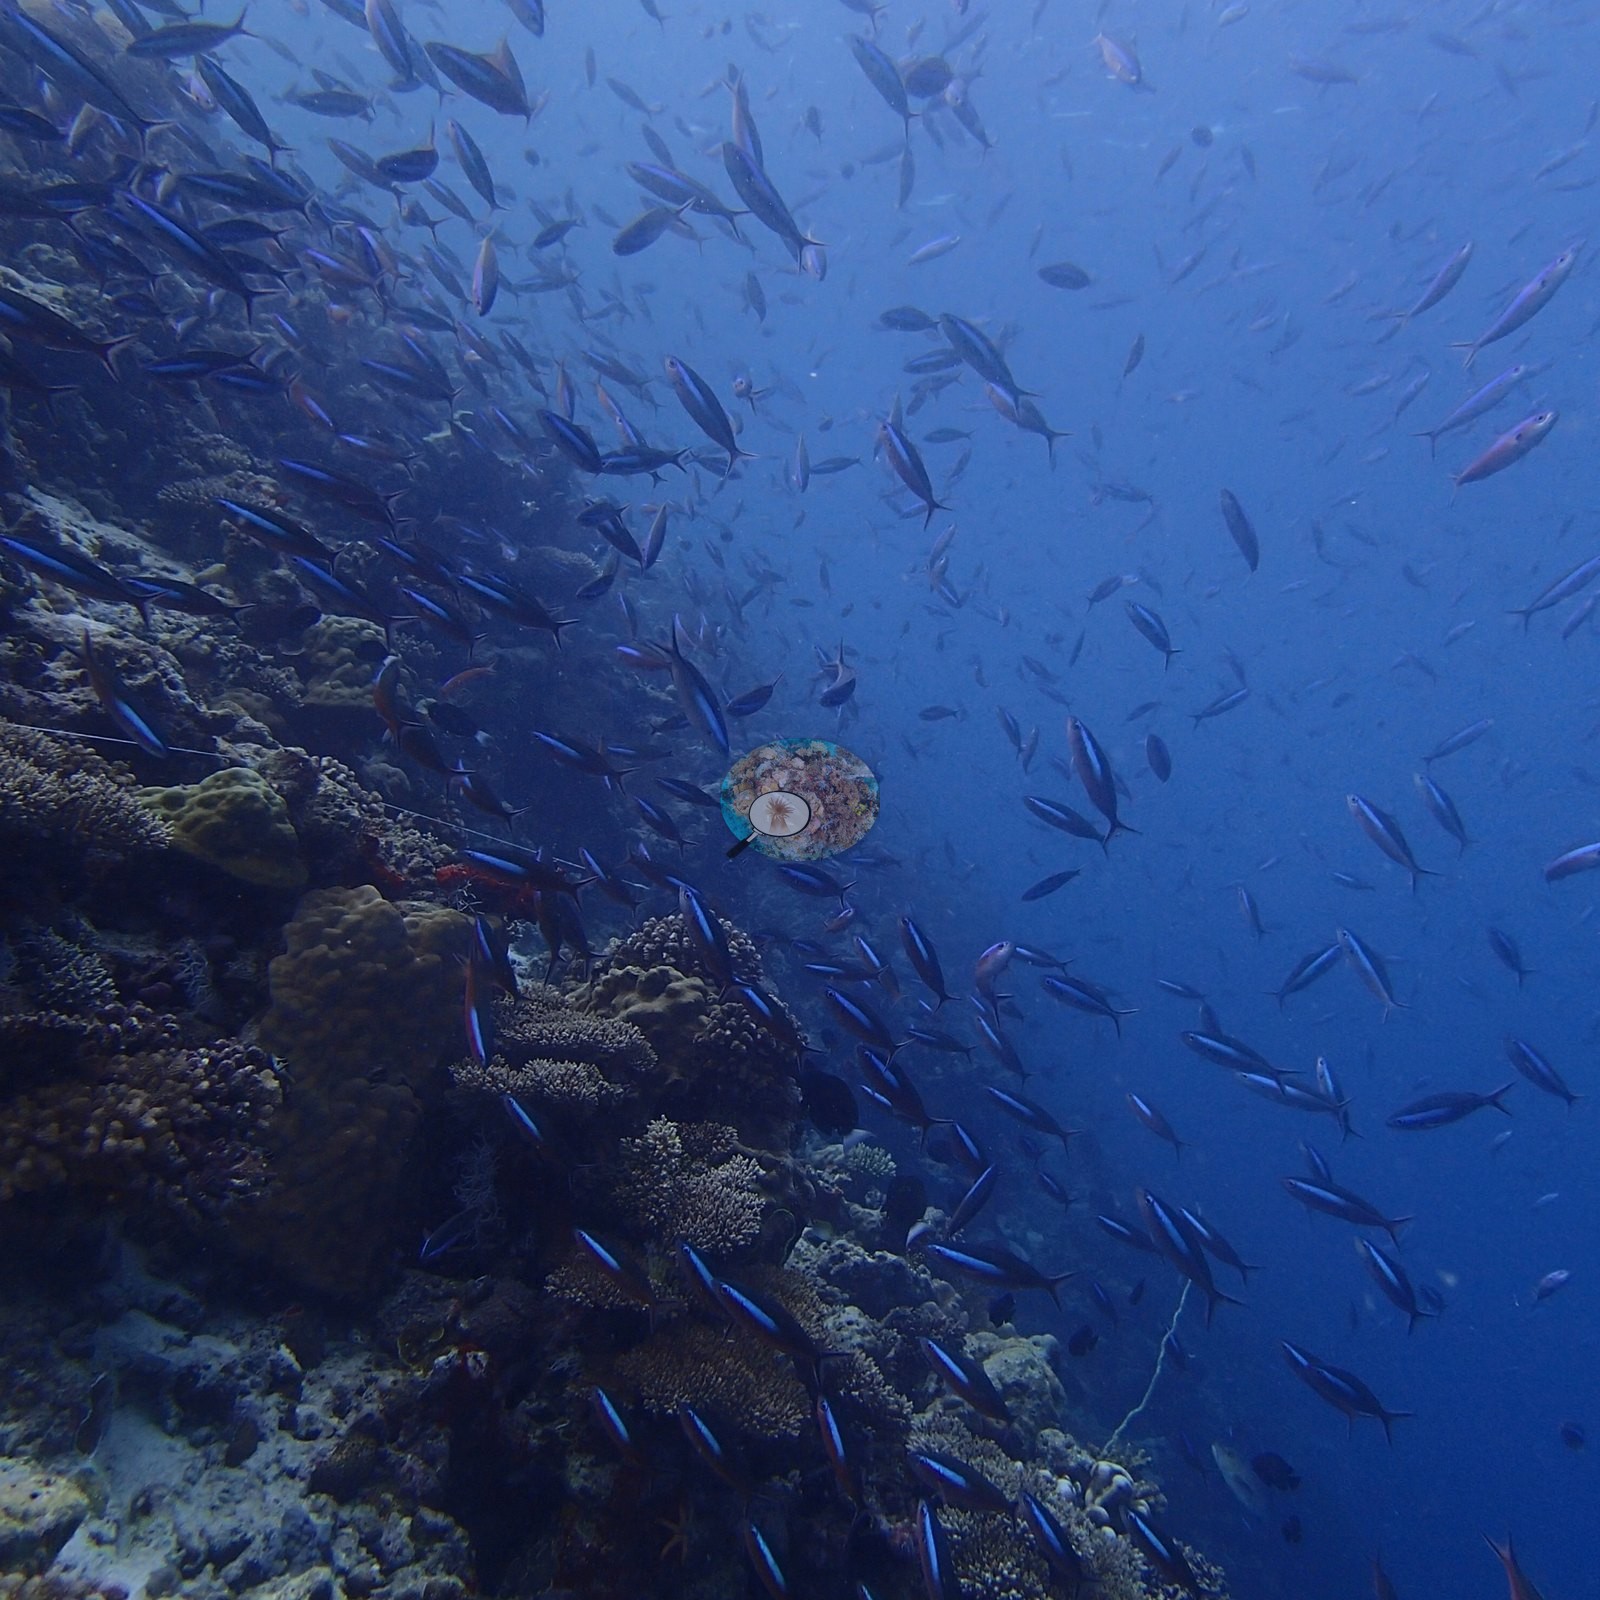
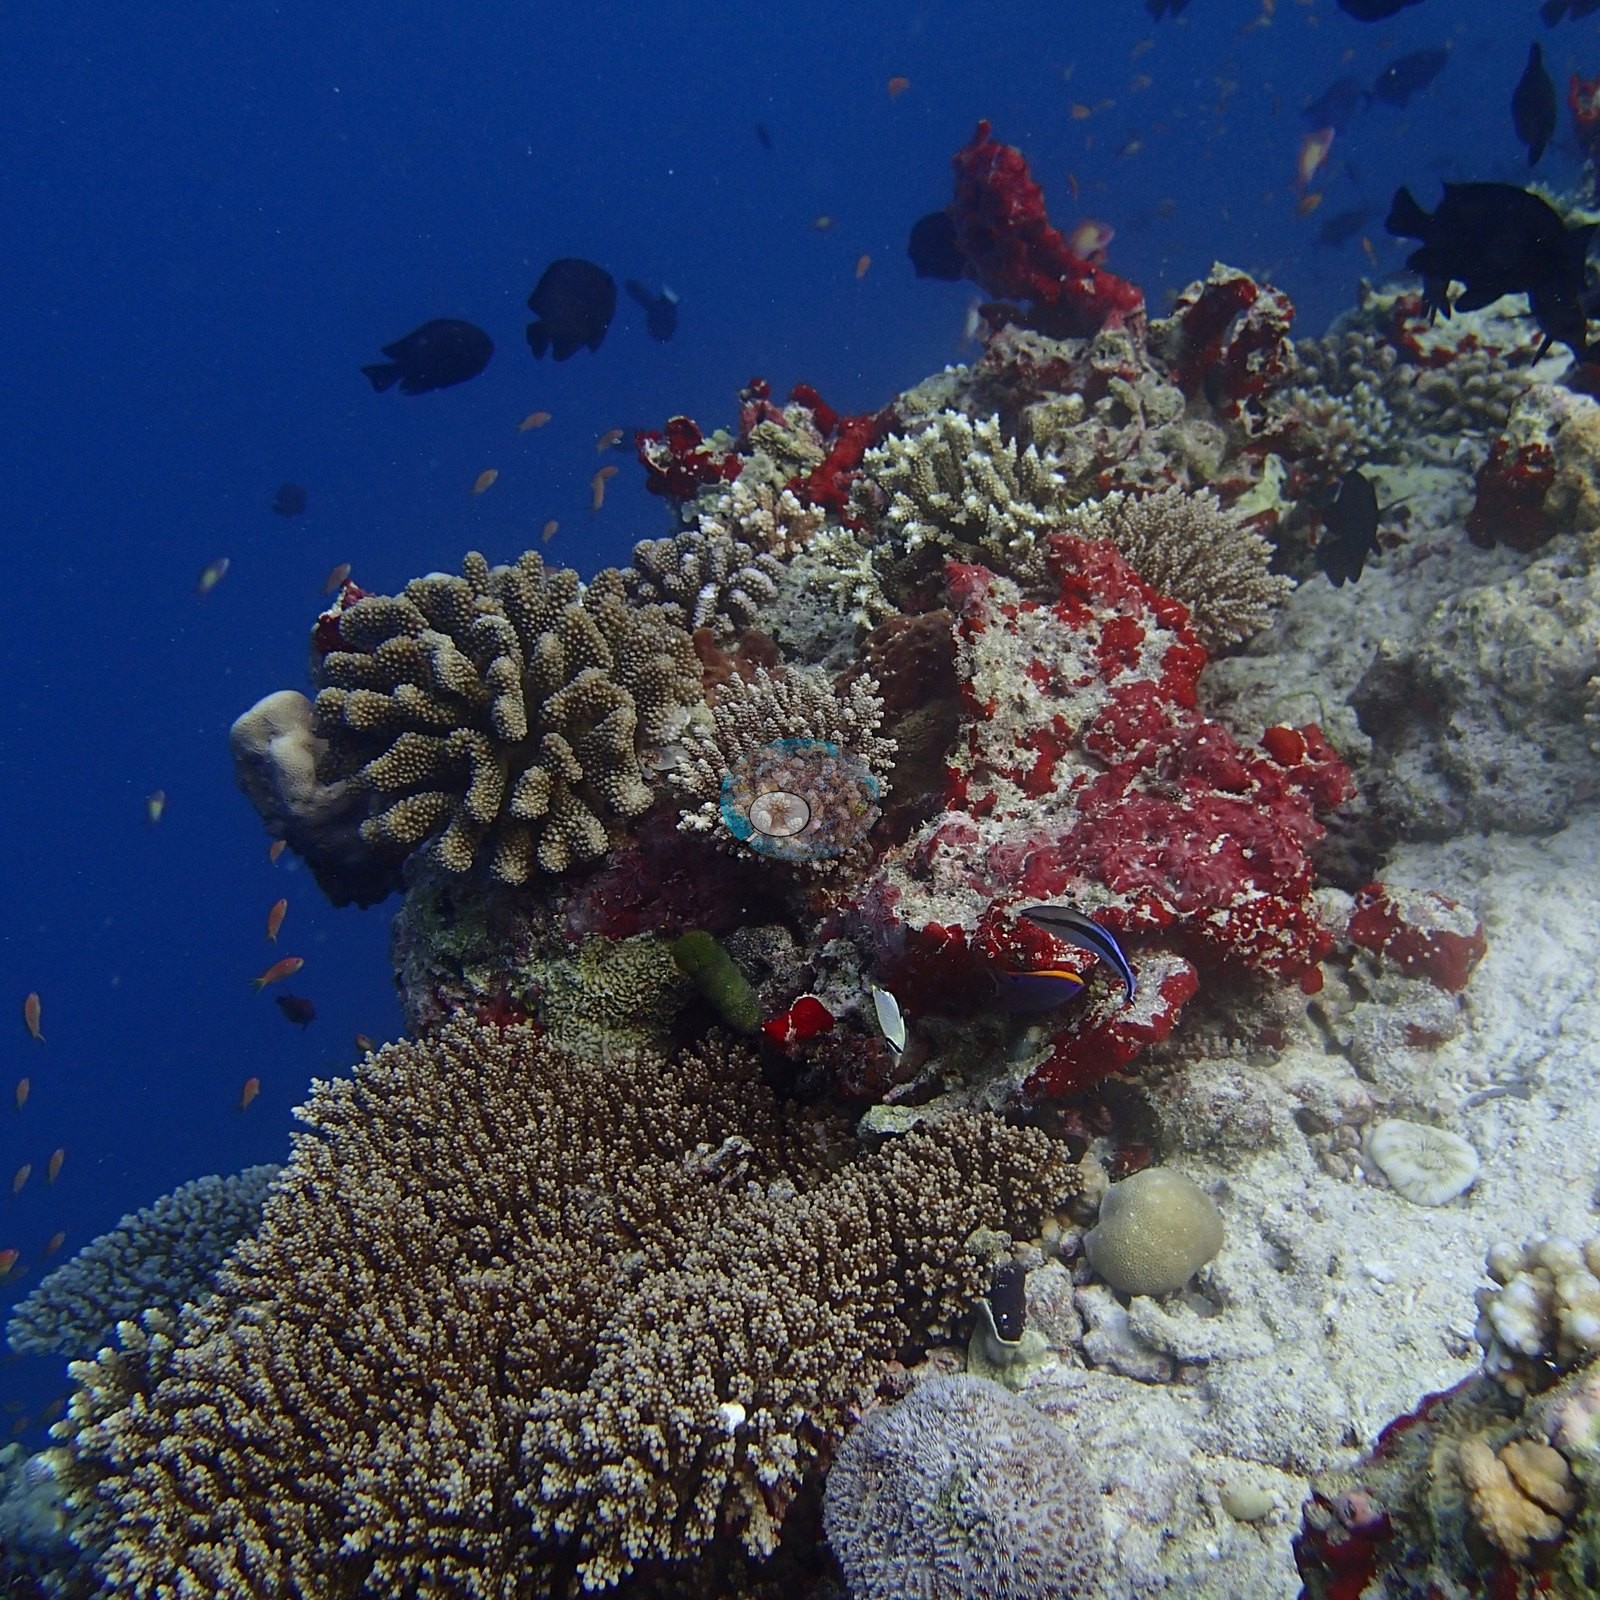
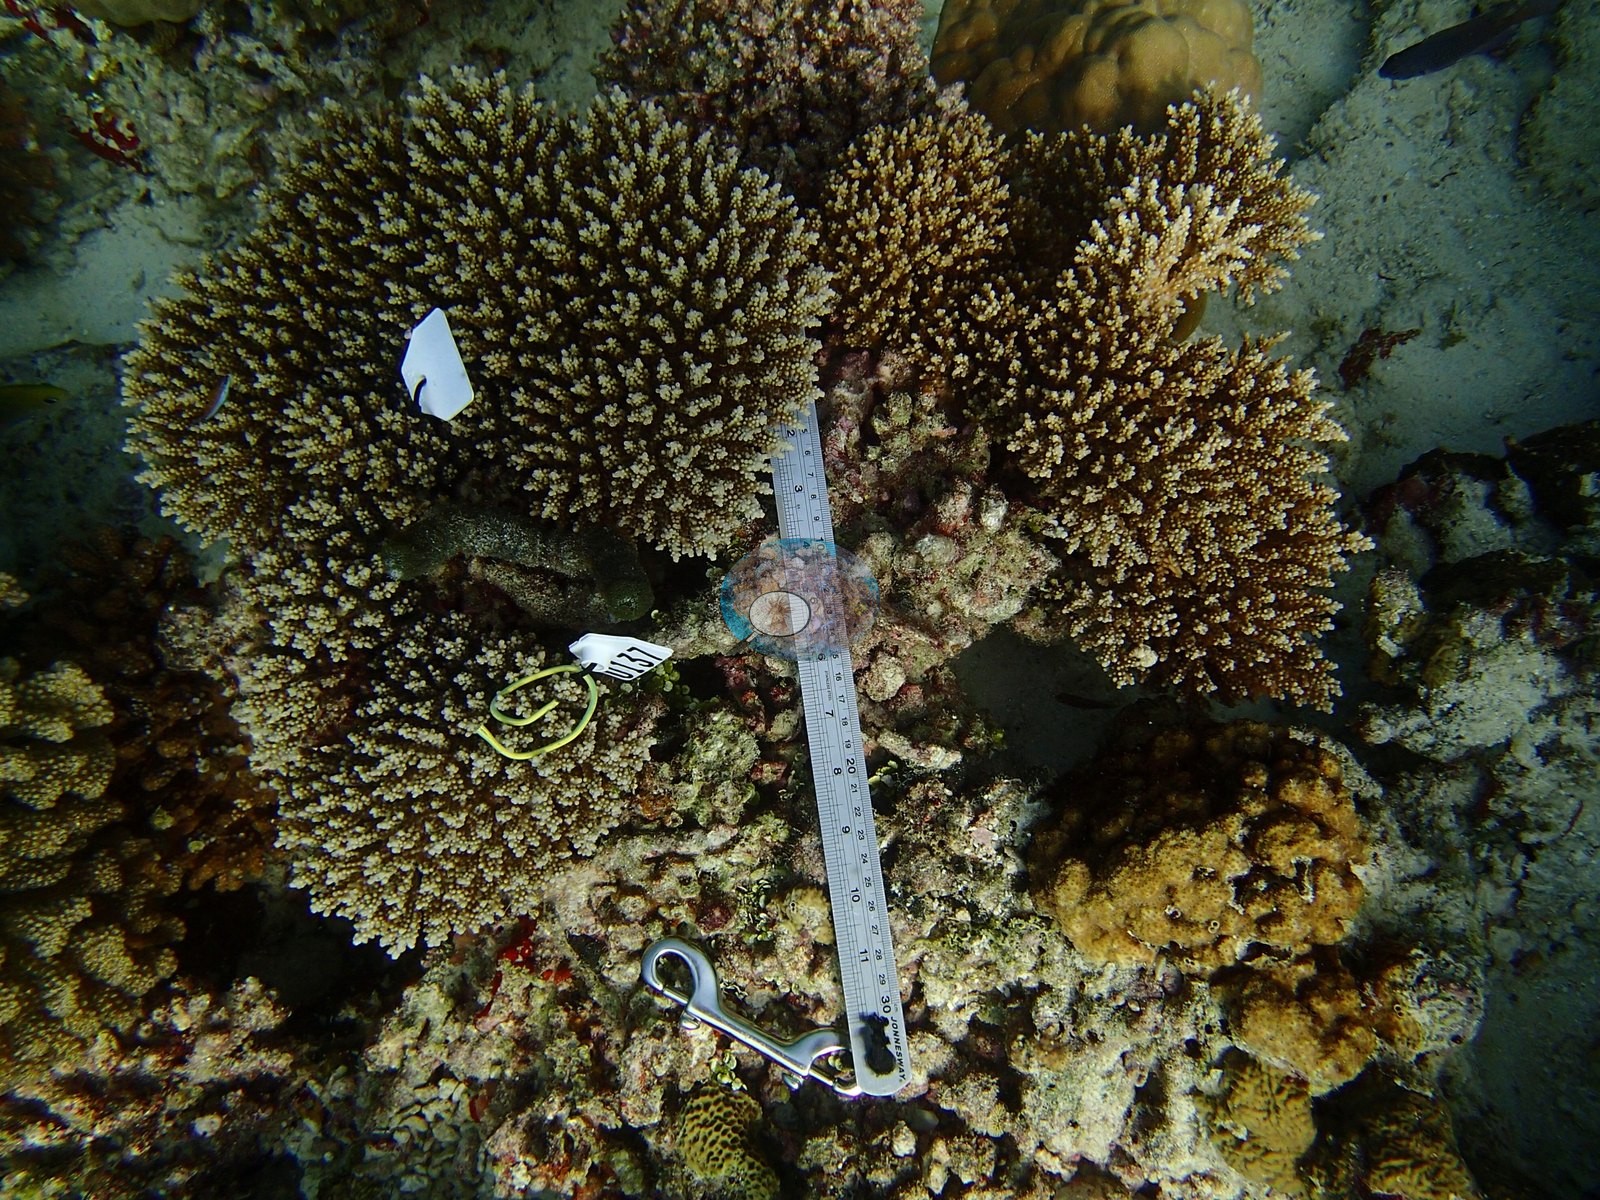
Site 8: a high-relief reef front tumbling from a coral-crowded crest into deep blue, with terraced table Acropora, staghorn thickets, cauliflower Pocillopora, clouds of orange anthias, a school of bannerfish, and a nurse shark resting under a ledge (e.g., Image 10, Image 11, Image 12, Image 13).
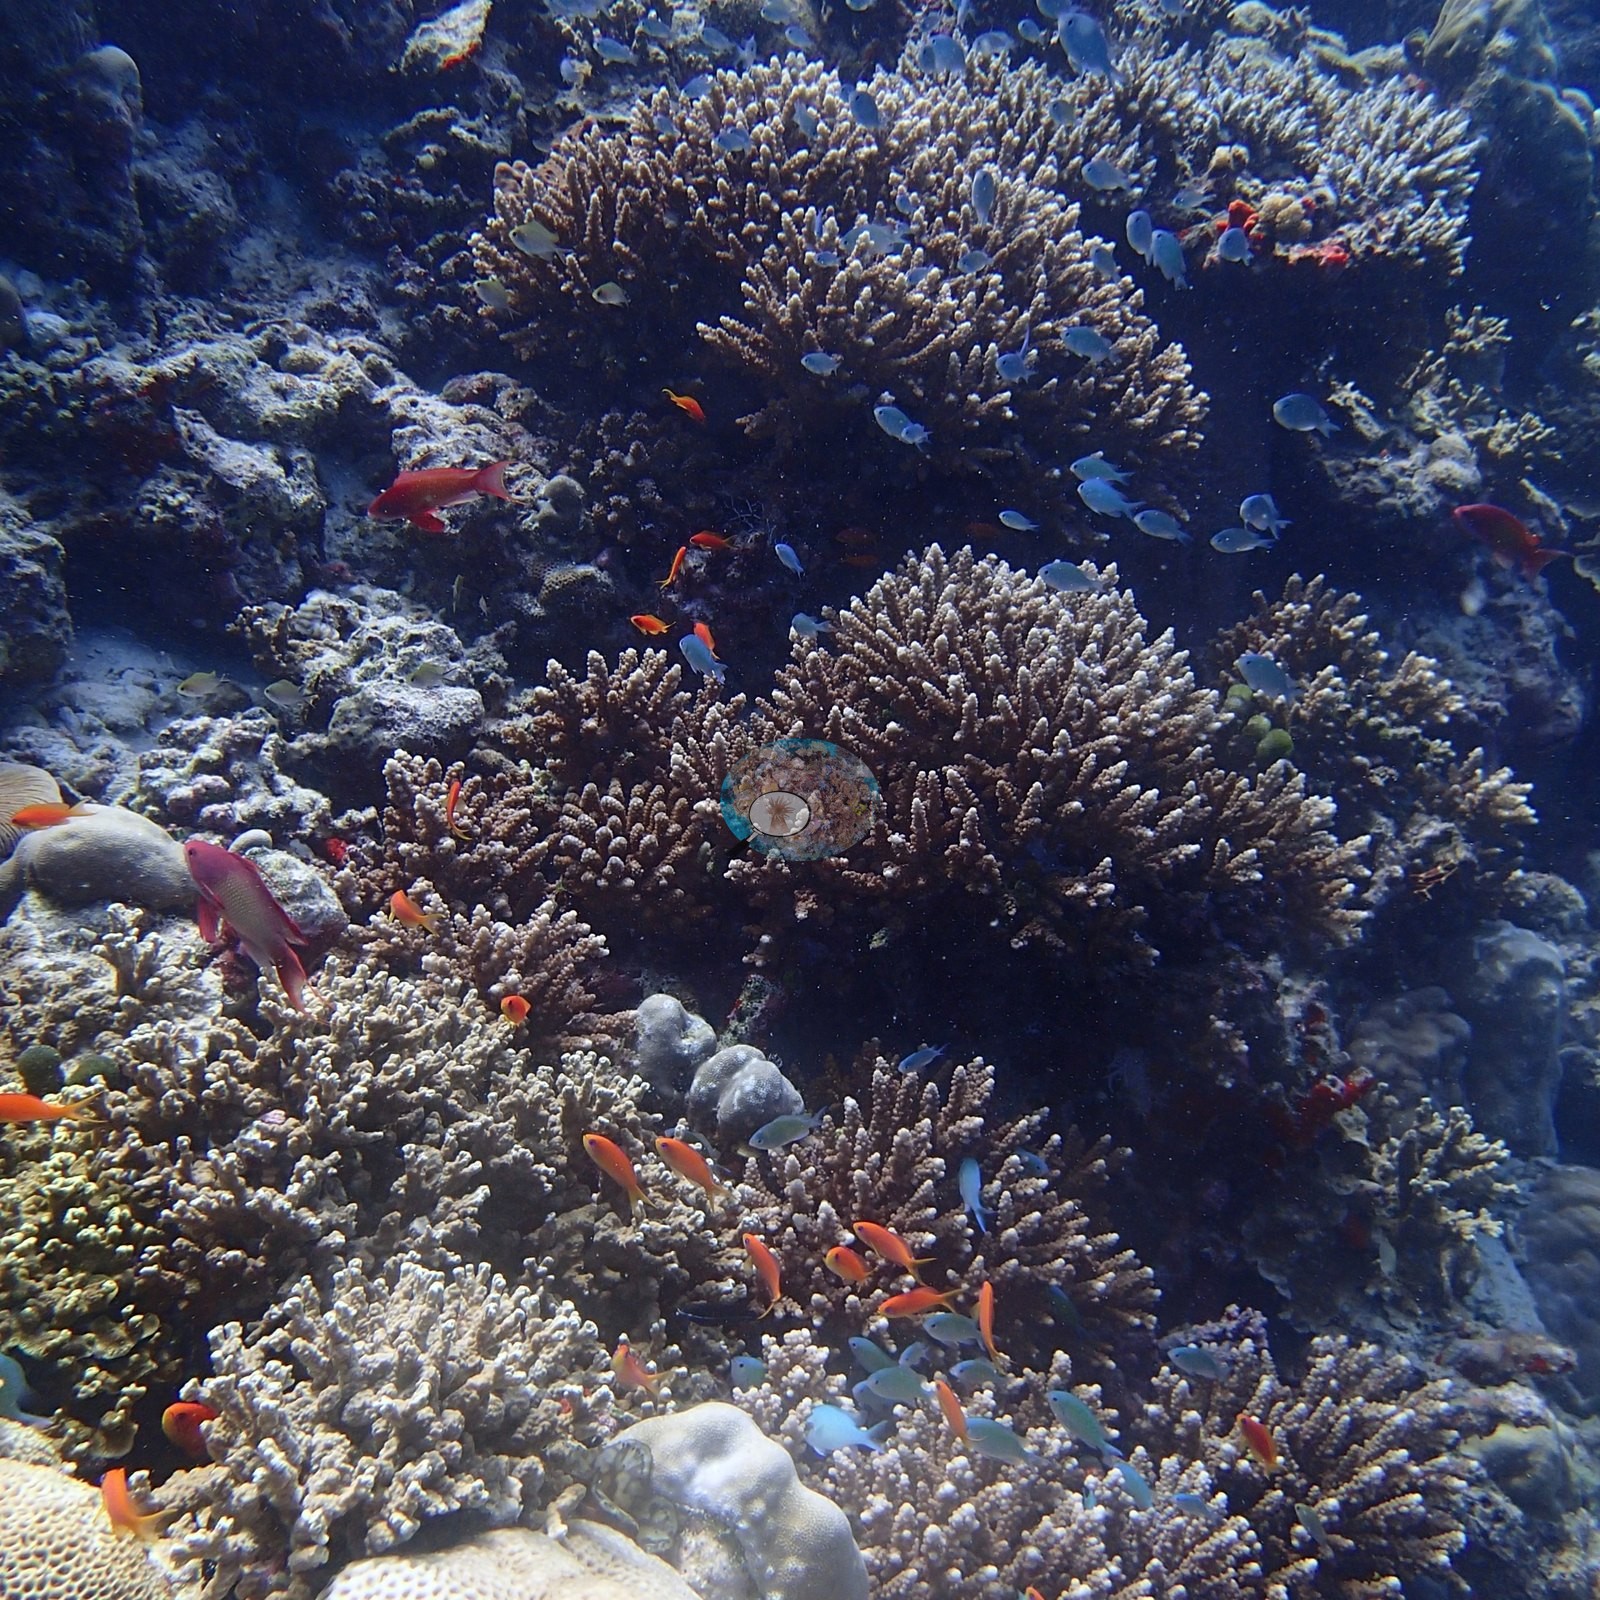
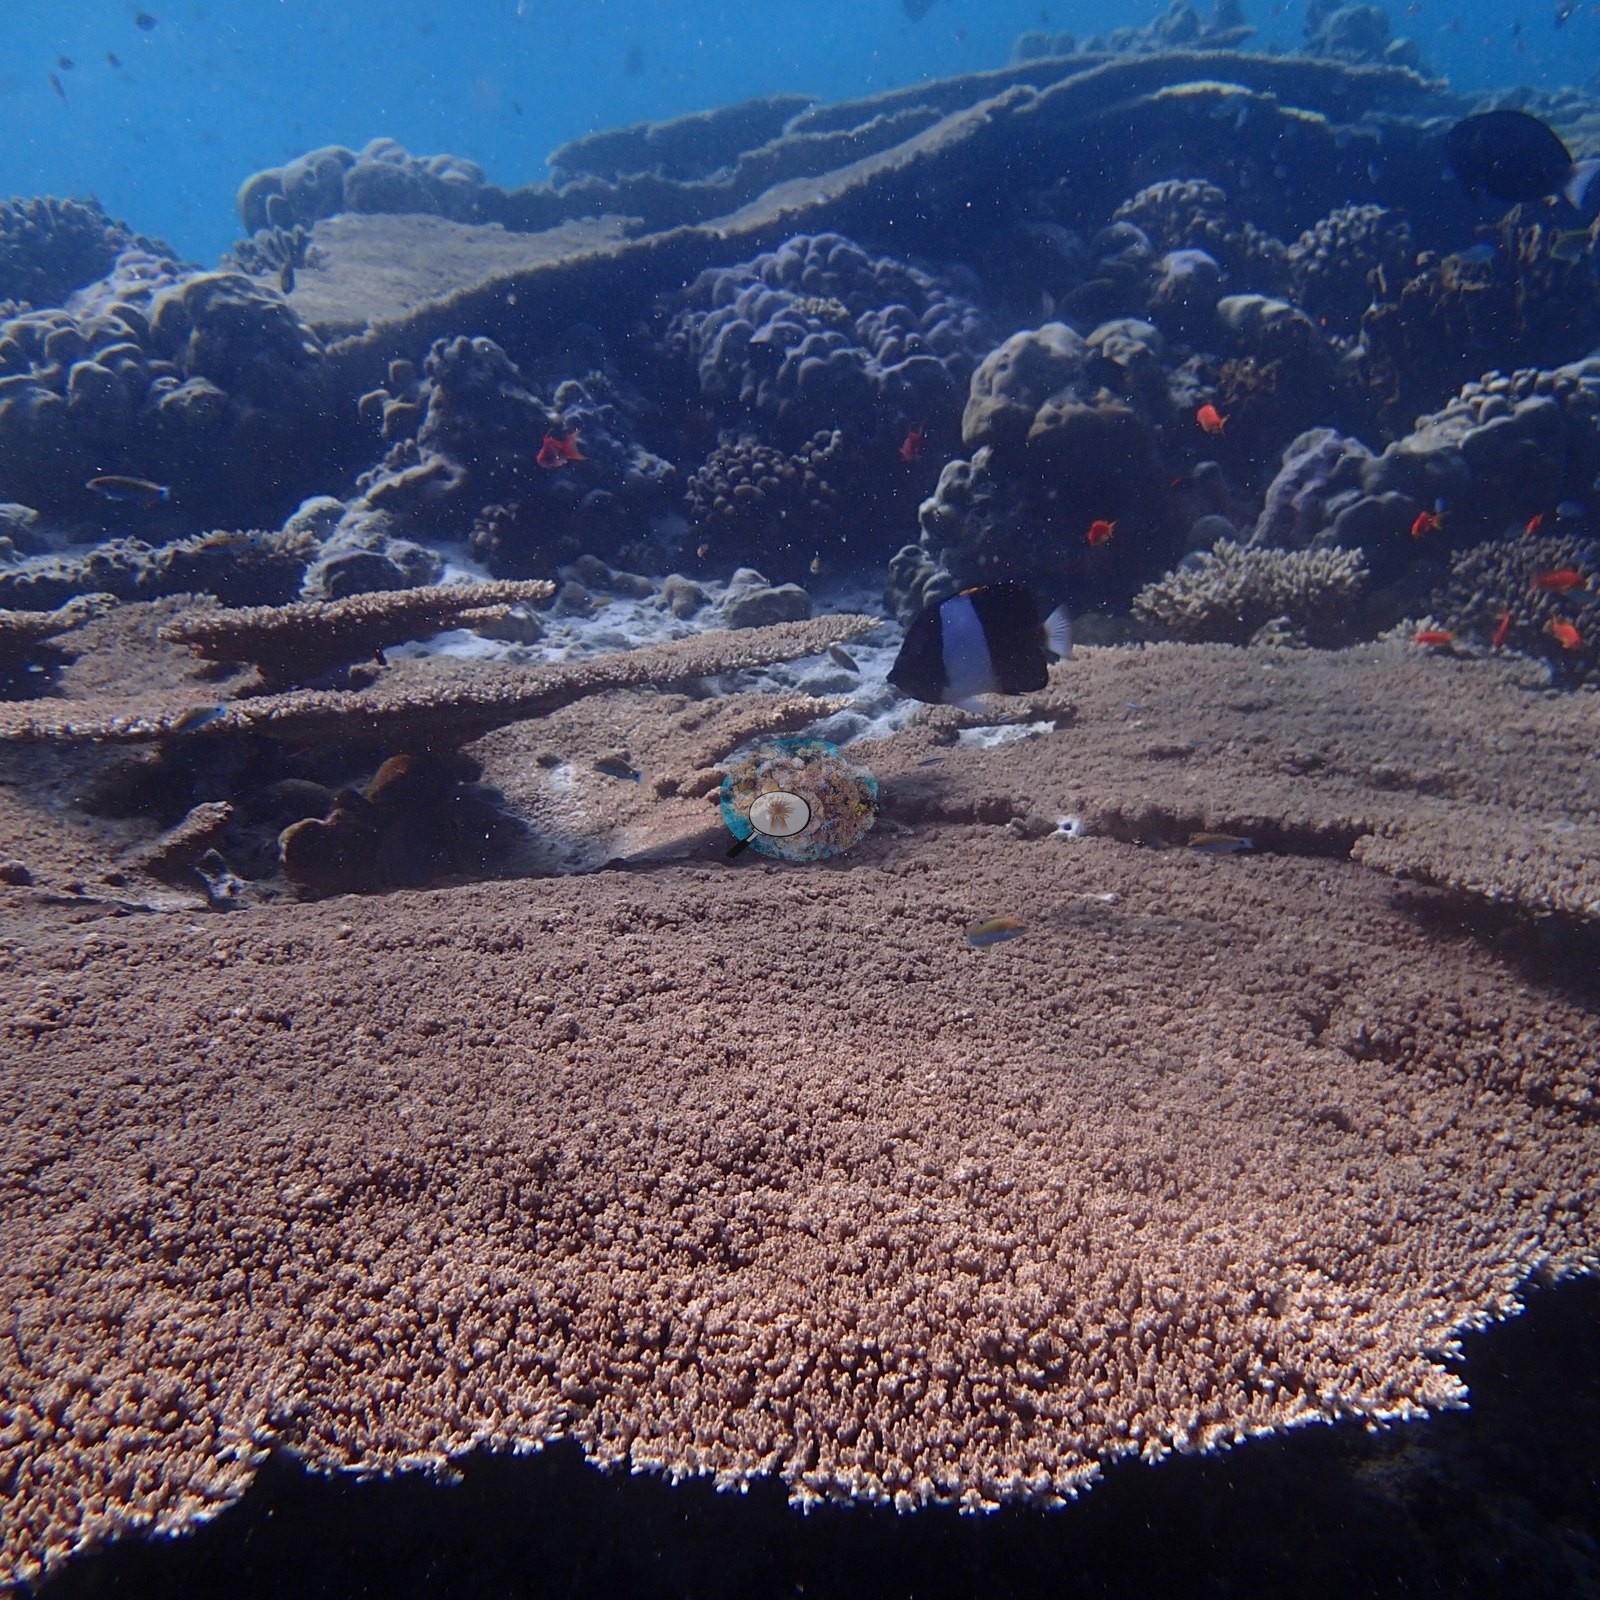
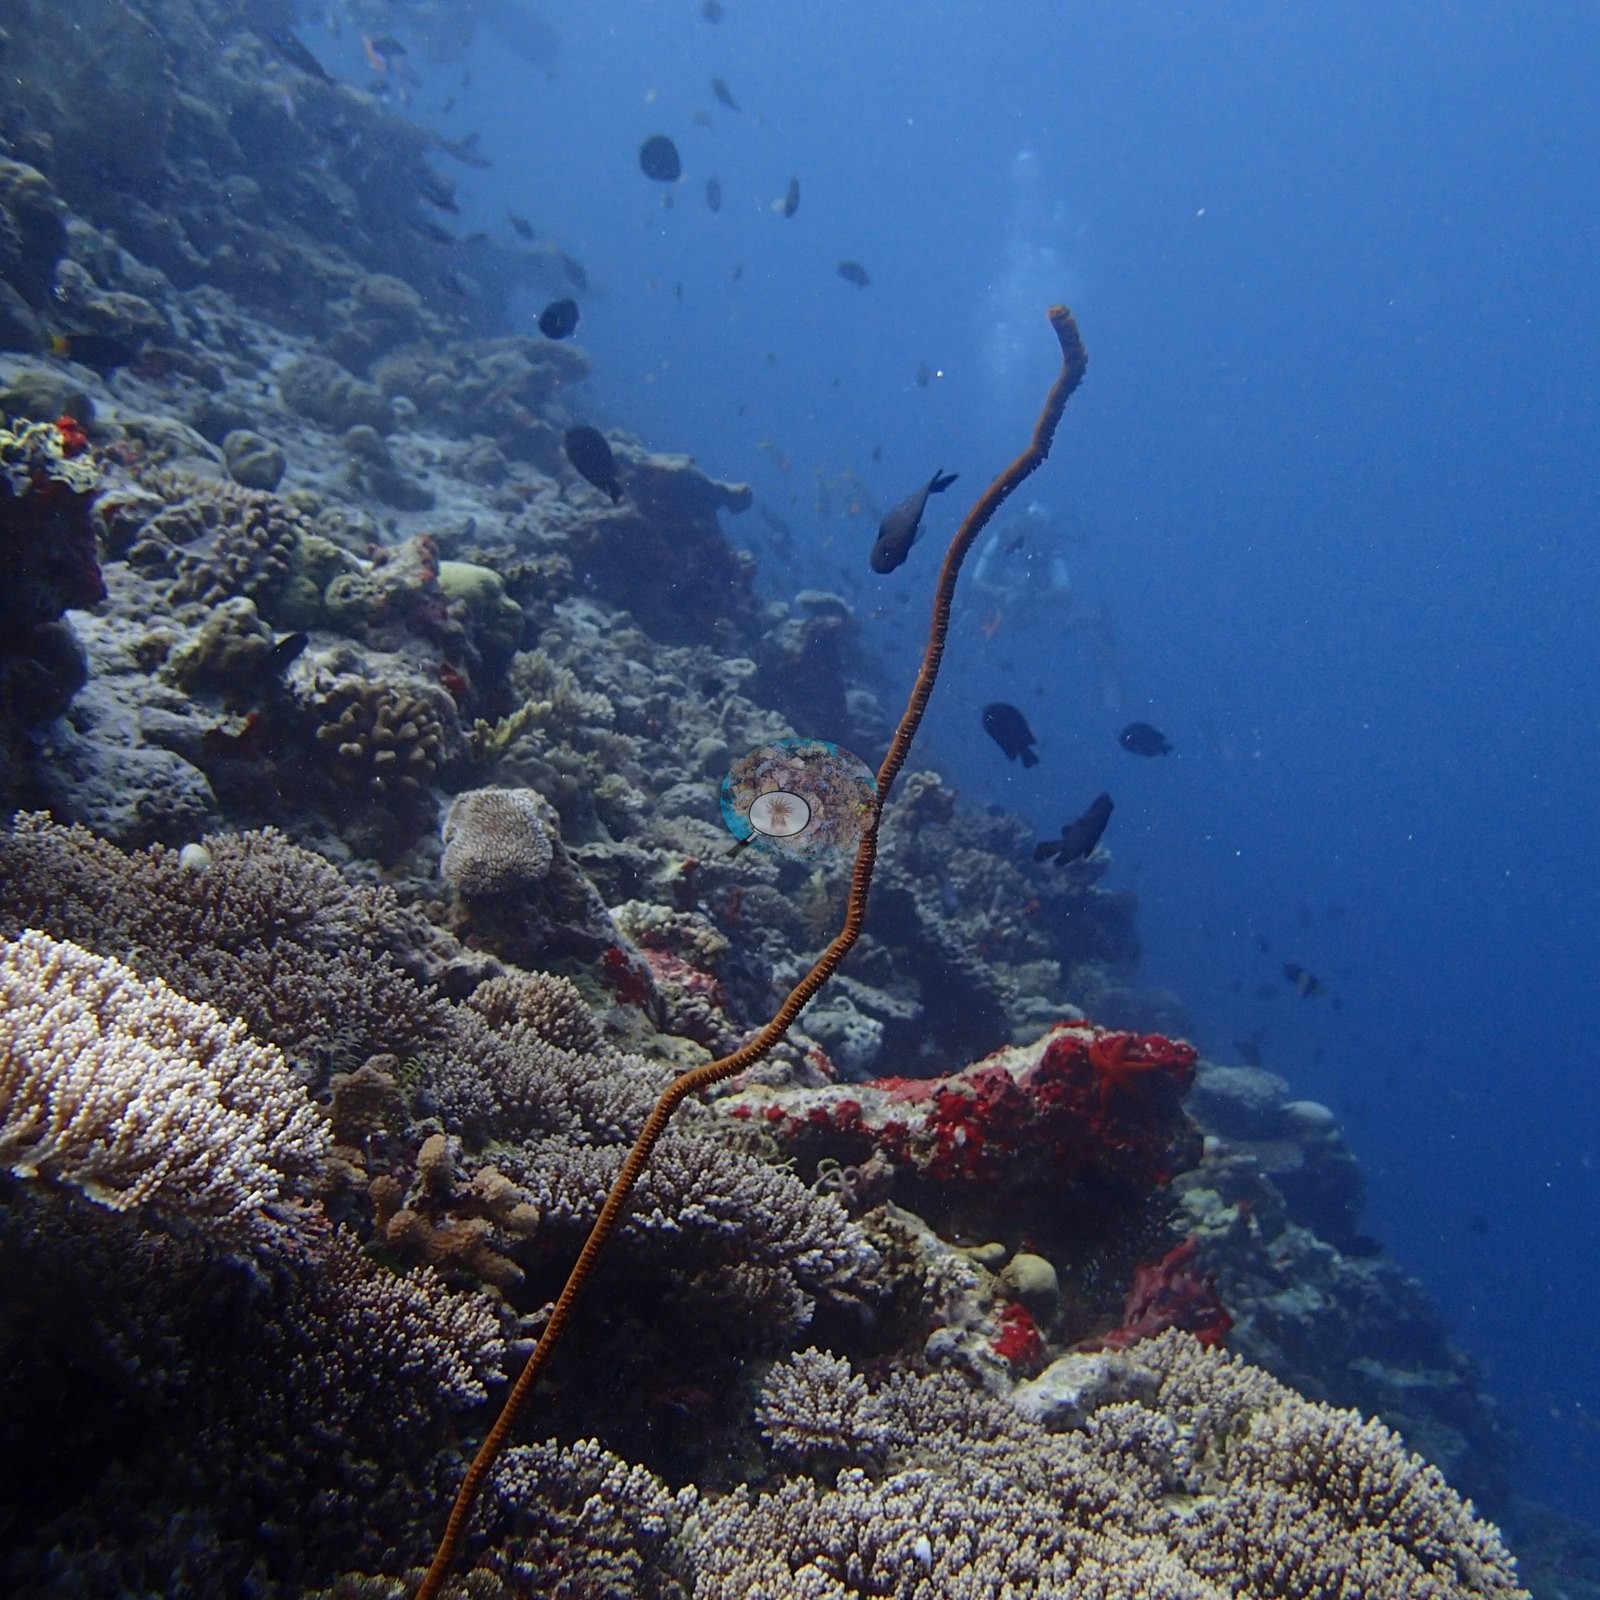
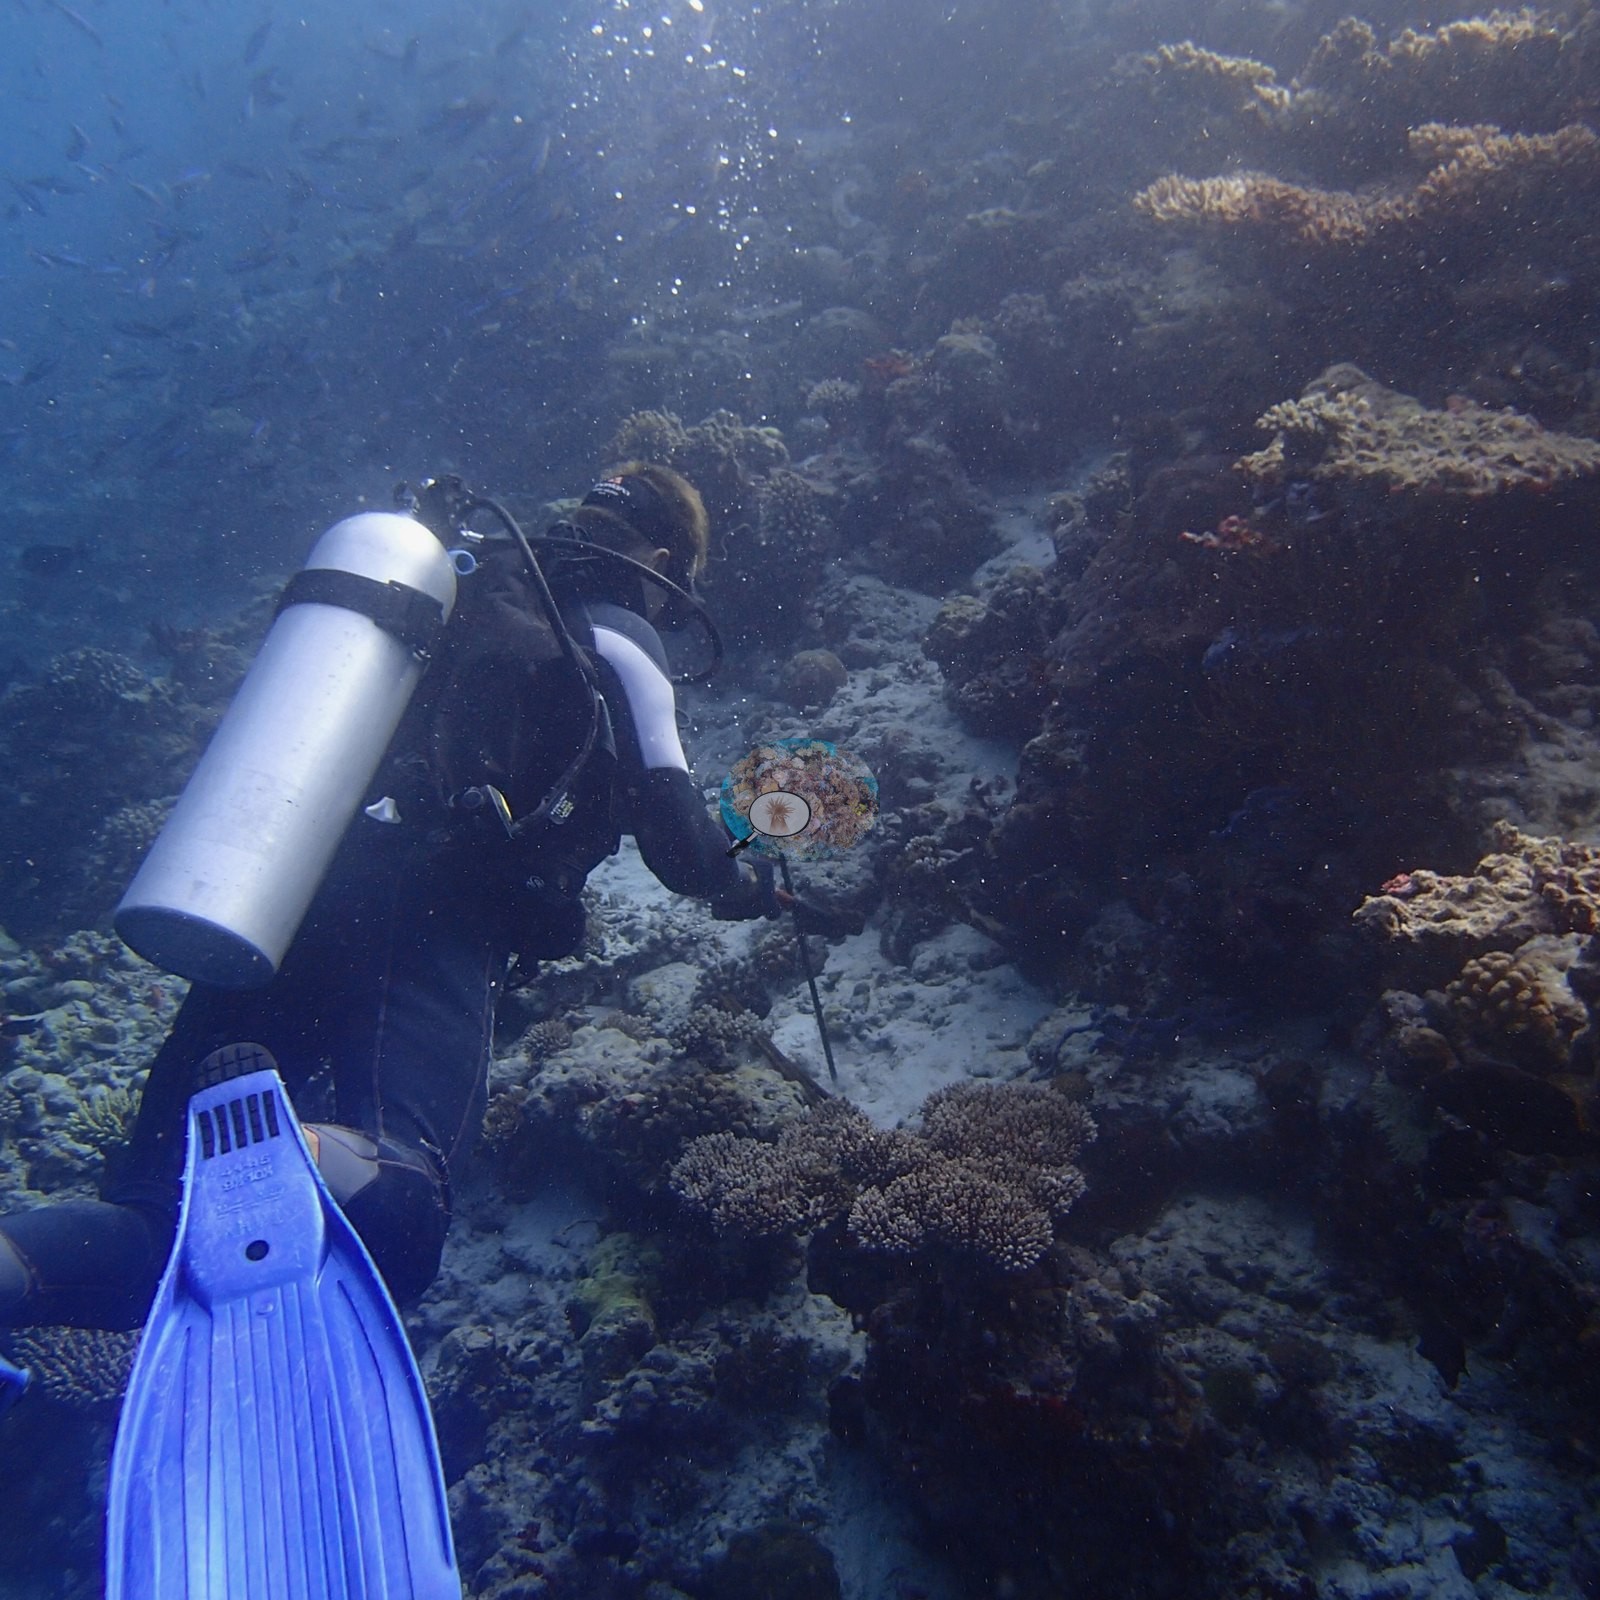
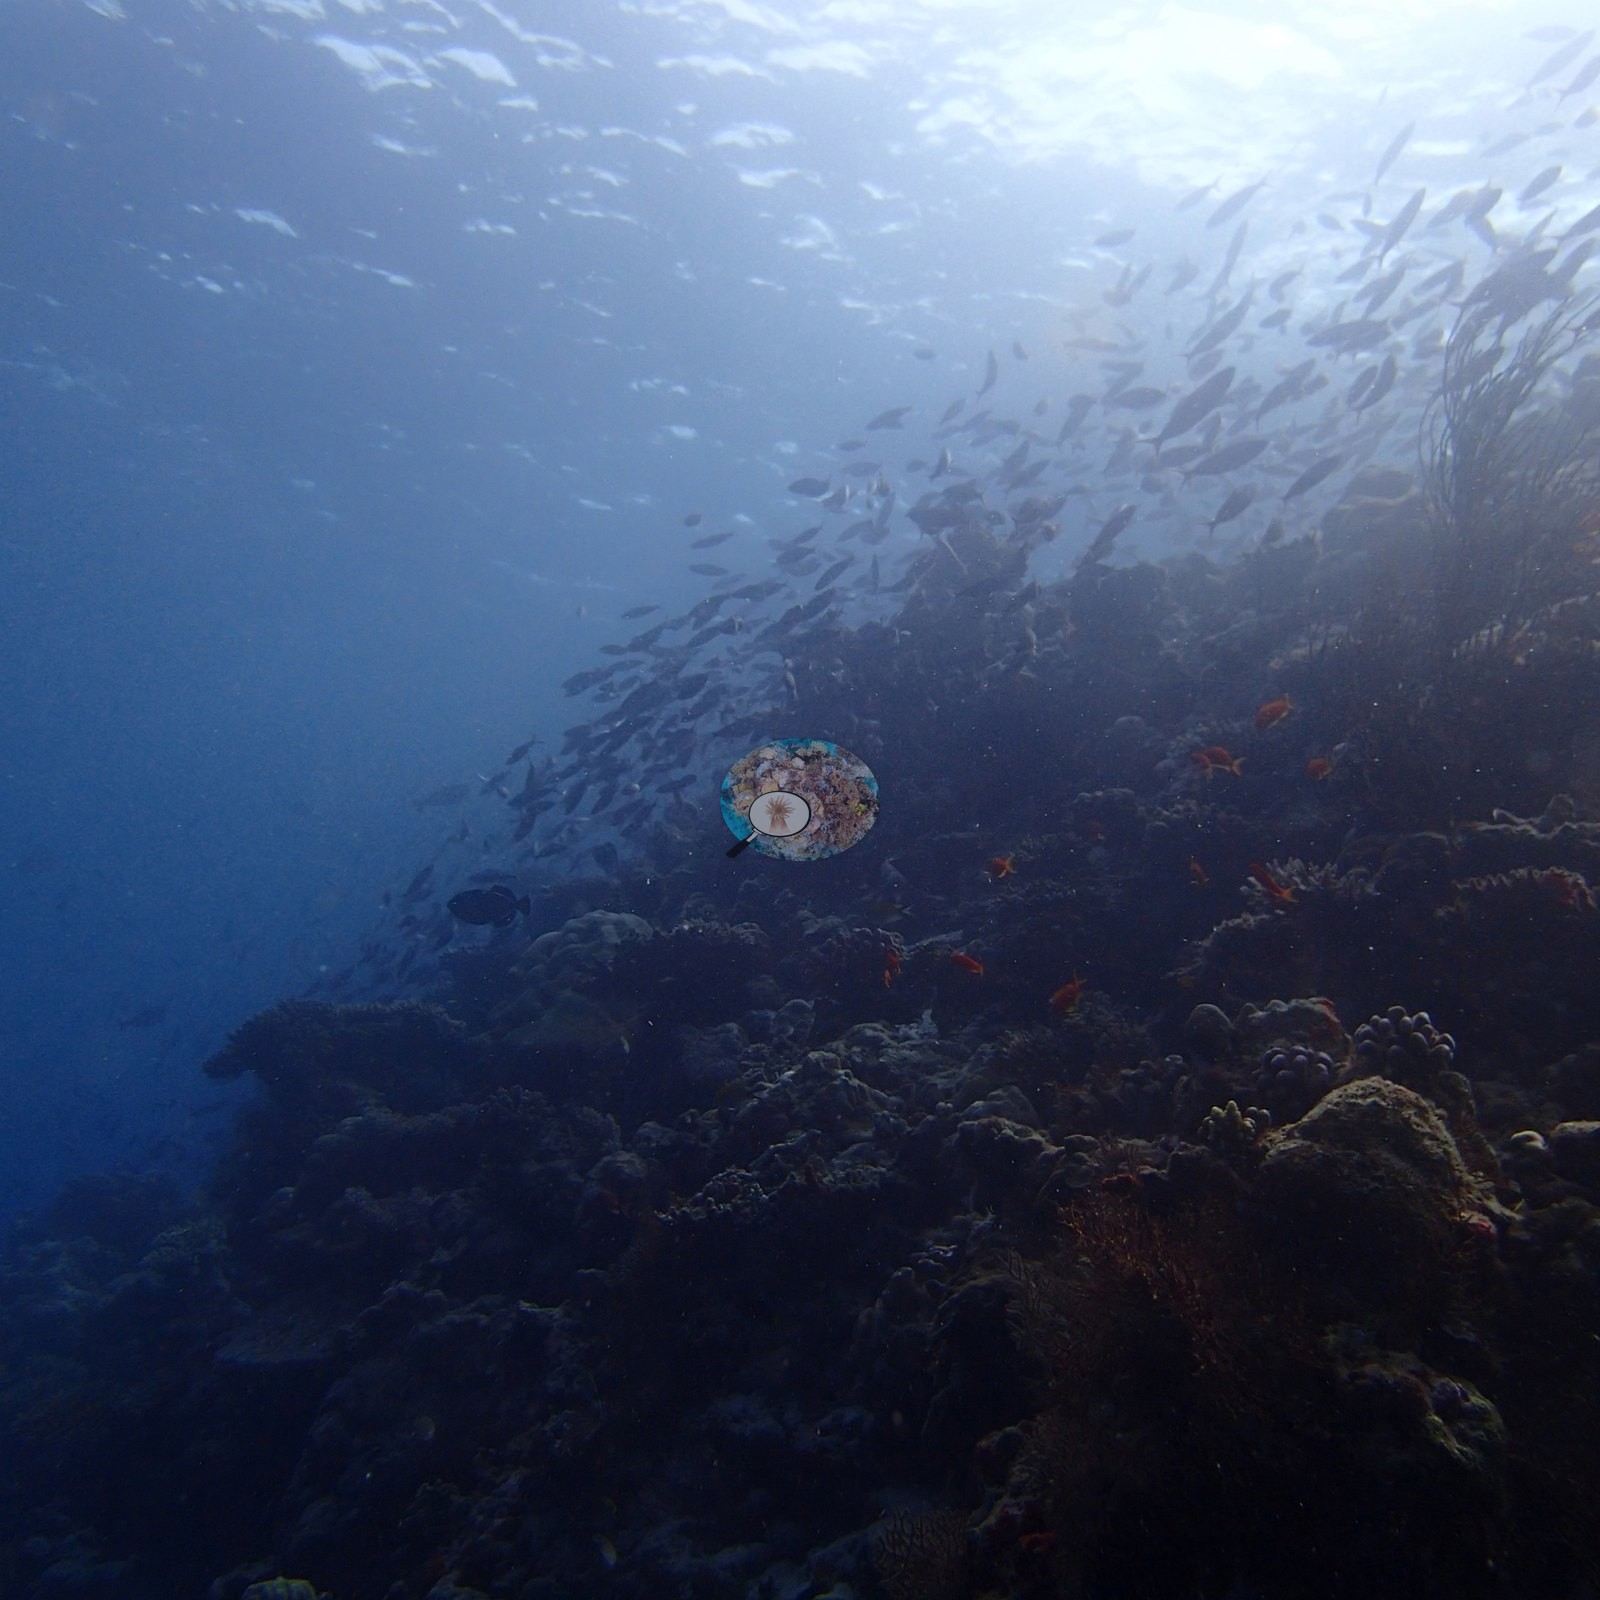
Site 9: a knife-edged coral ridge, the moodiest of the set — much of it shot by flashlight against dark water — with big Porites domes, pink coralline-crusted rock, honeycomb faviids, and a maze-patterned coral compatible with Psammocora, divers stretching measuring tapes across the slope (e.g., Image 2, Image 15, Image 16, Image 17, Image 18).
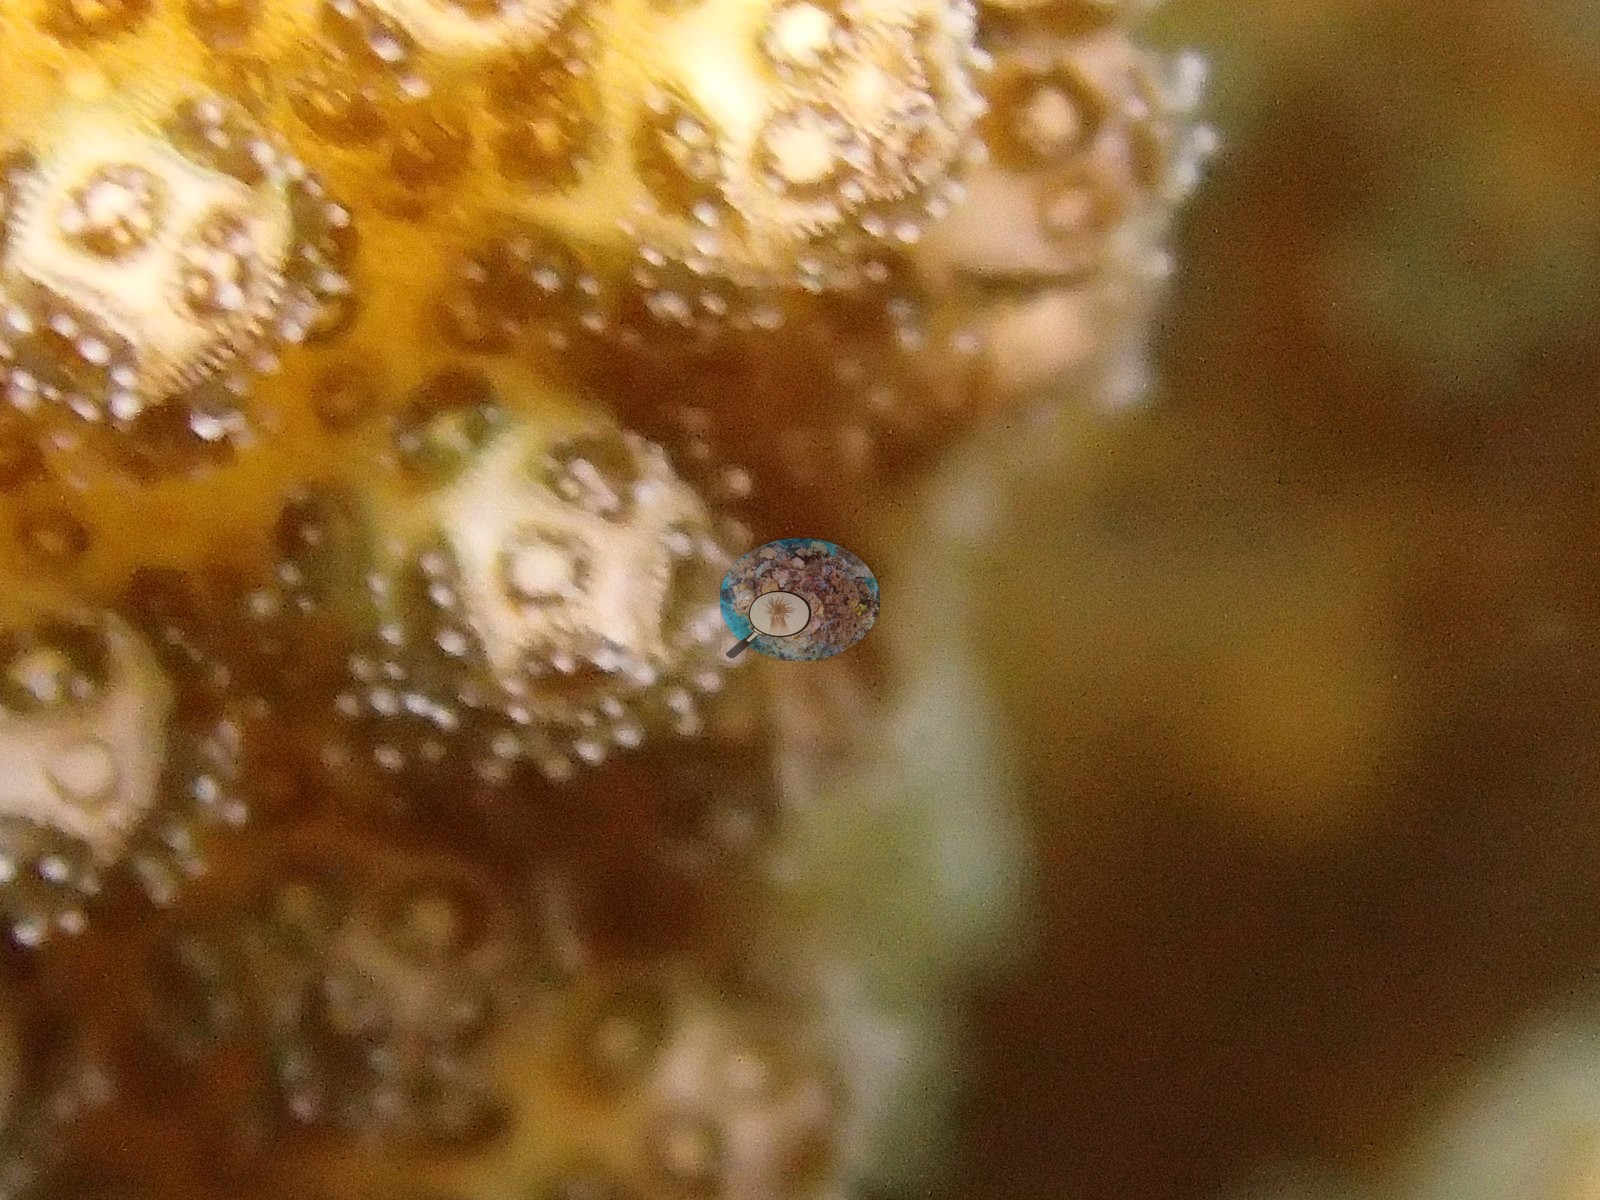
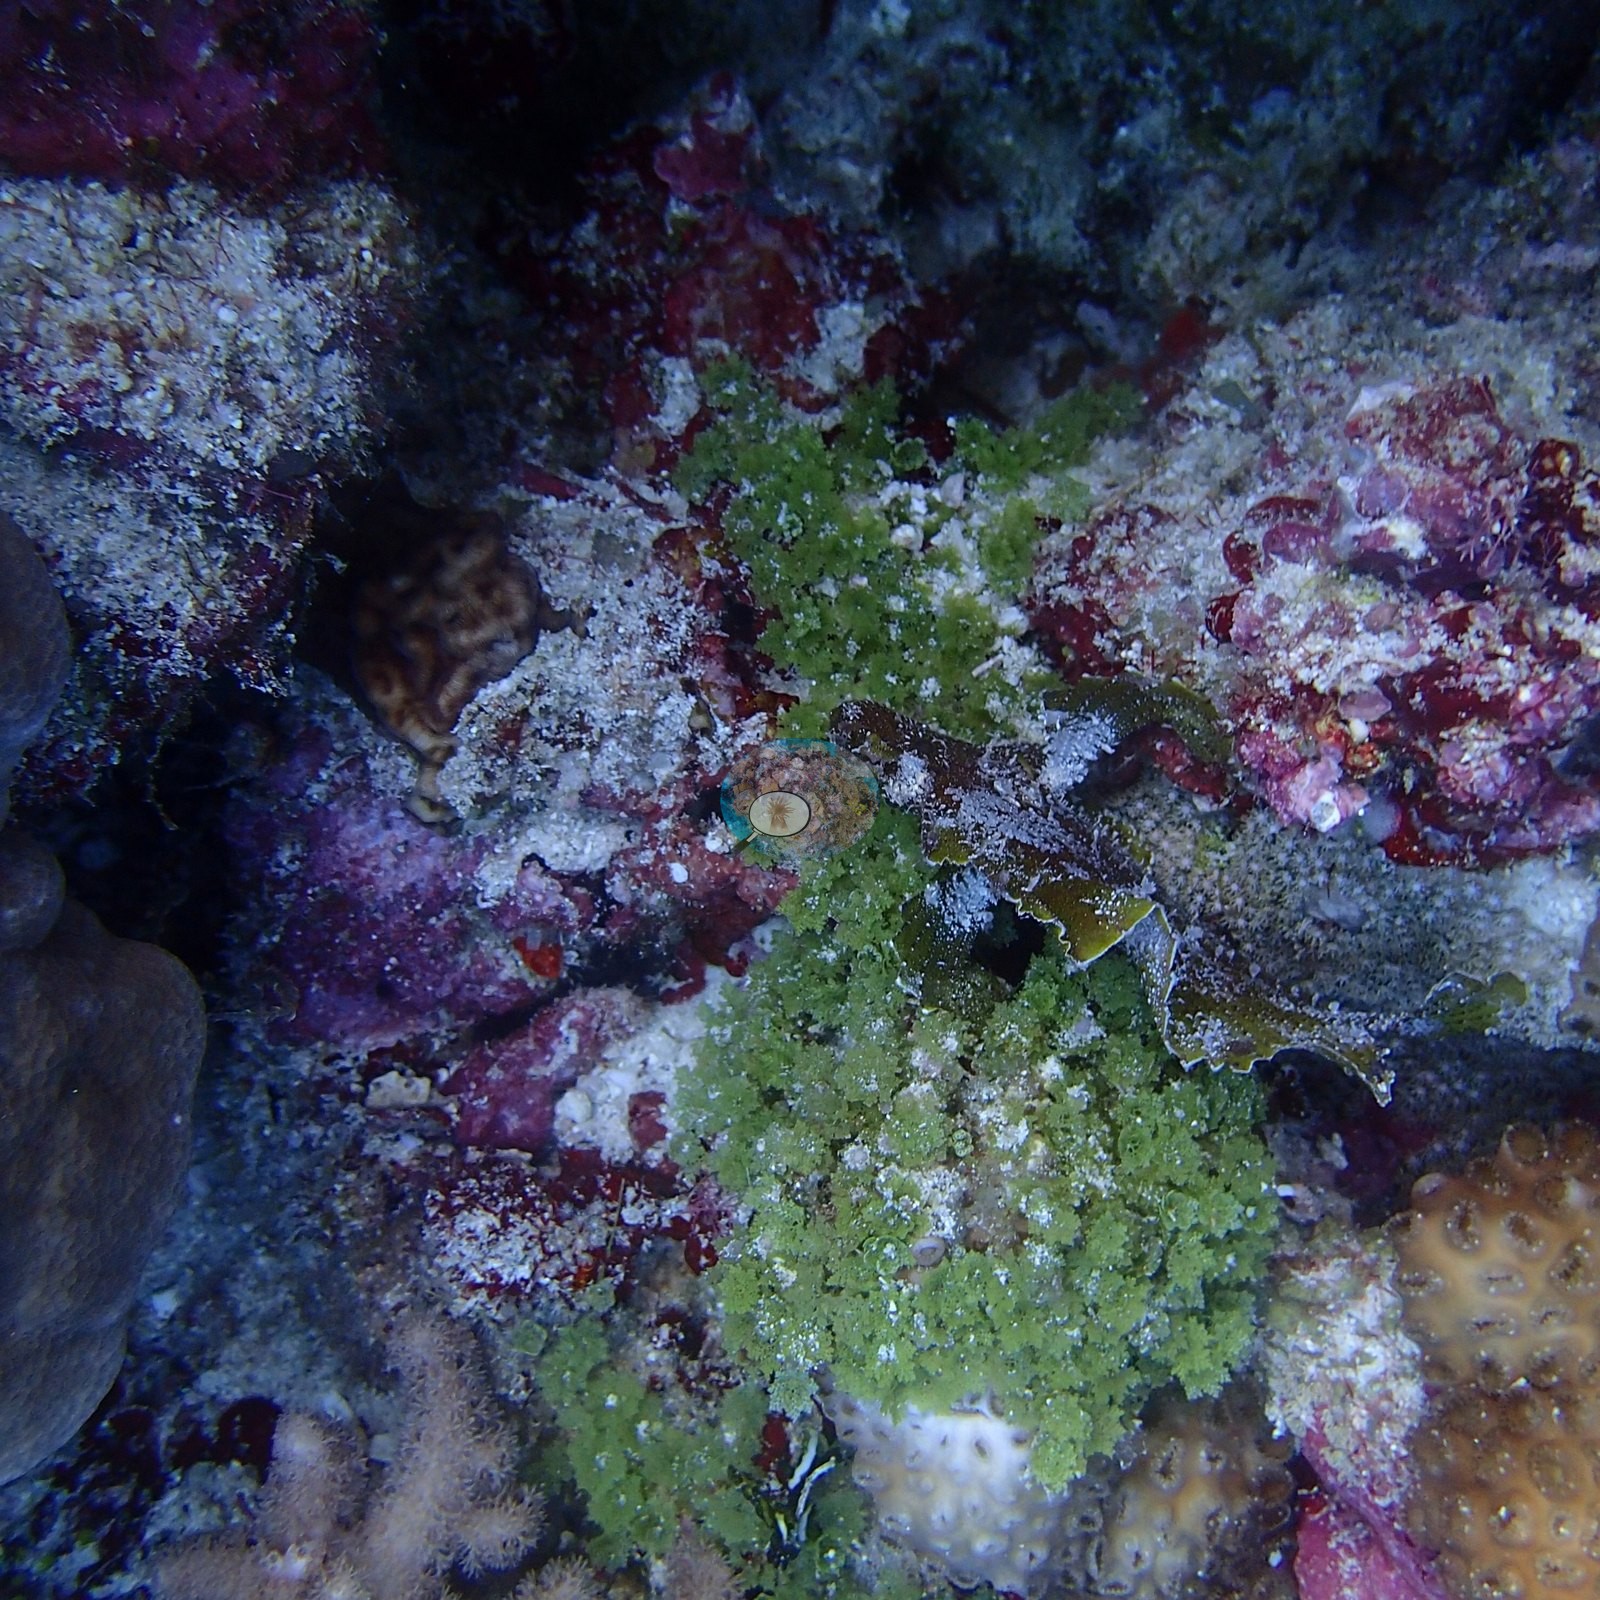
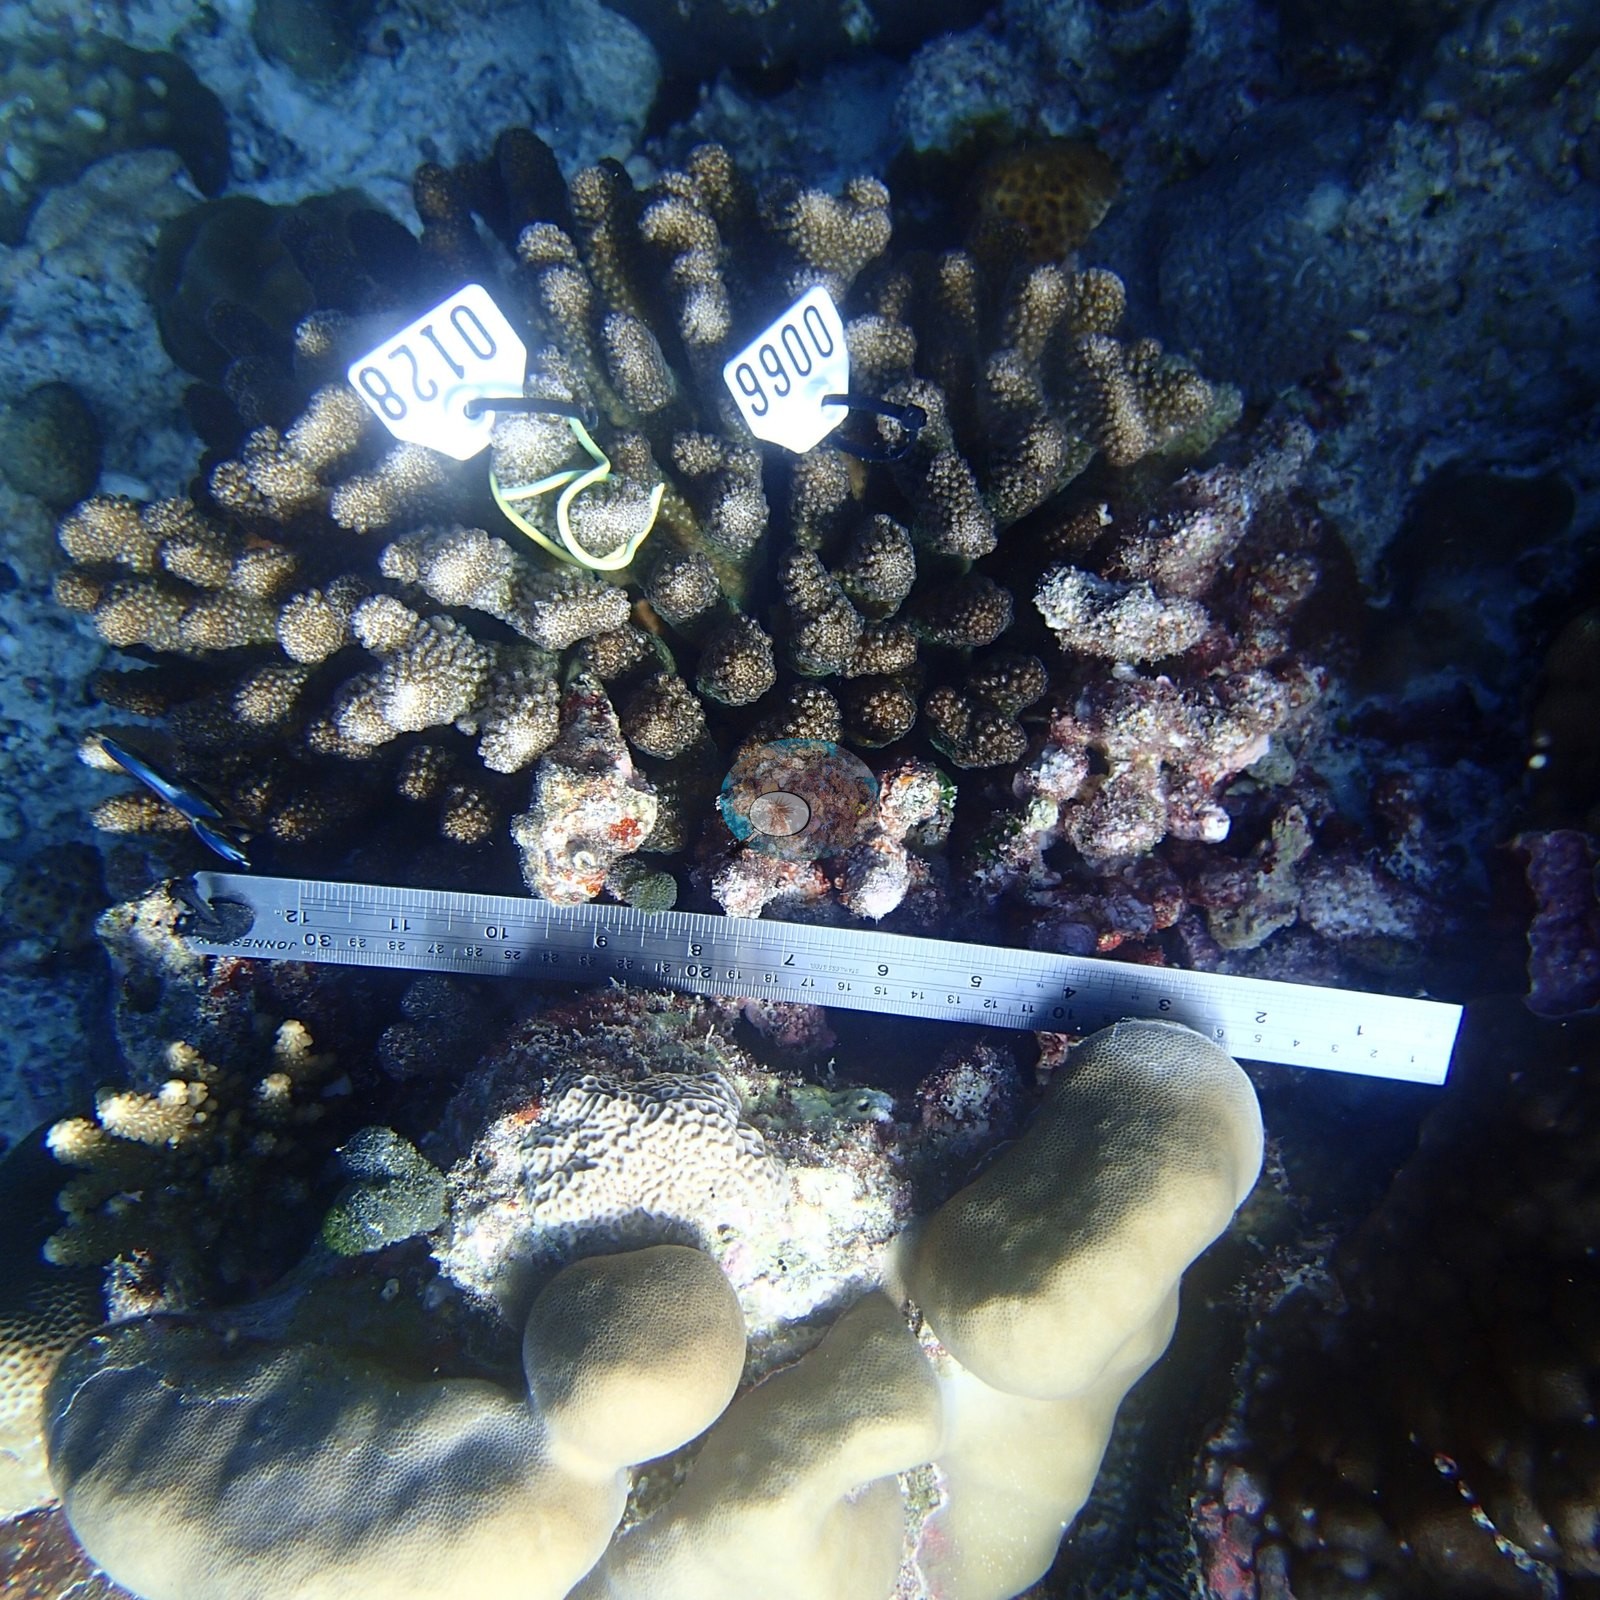
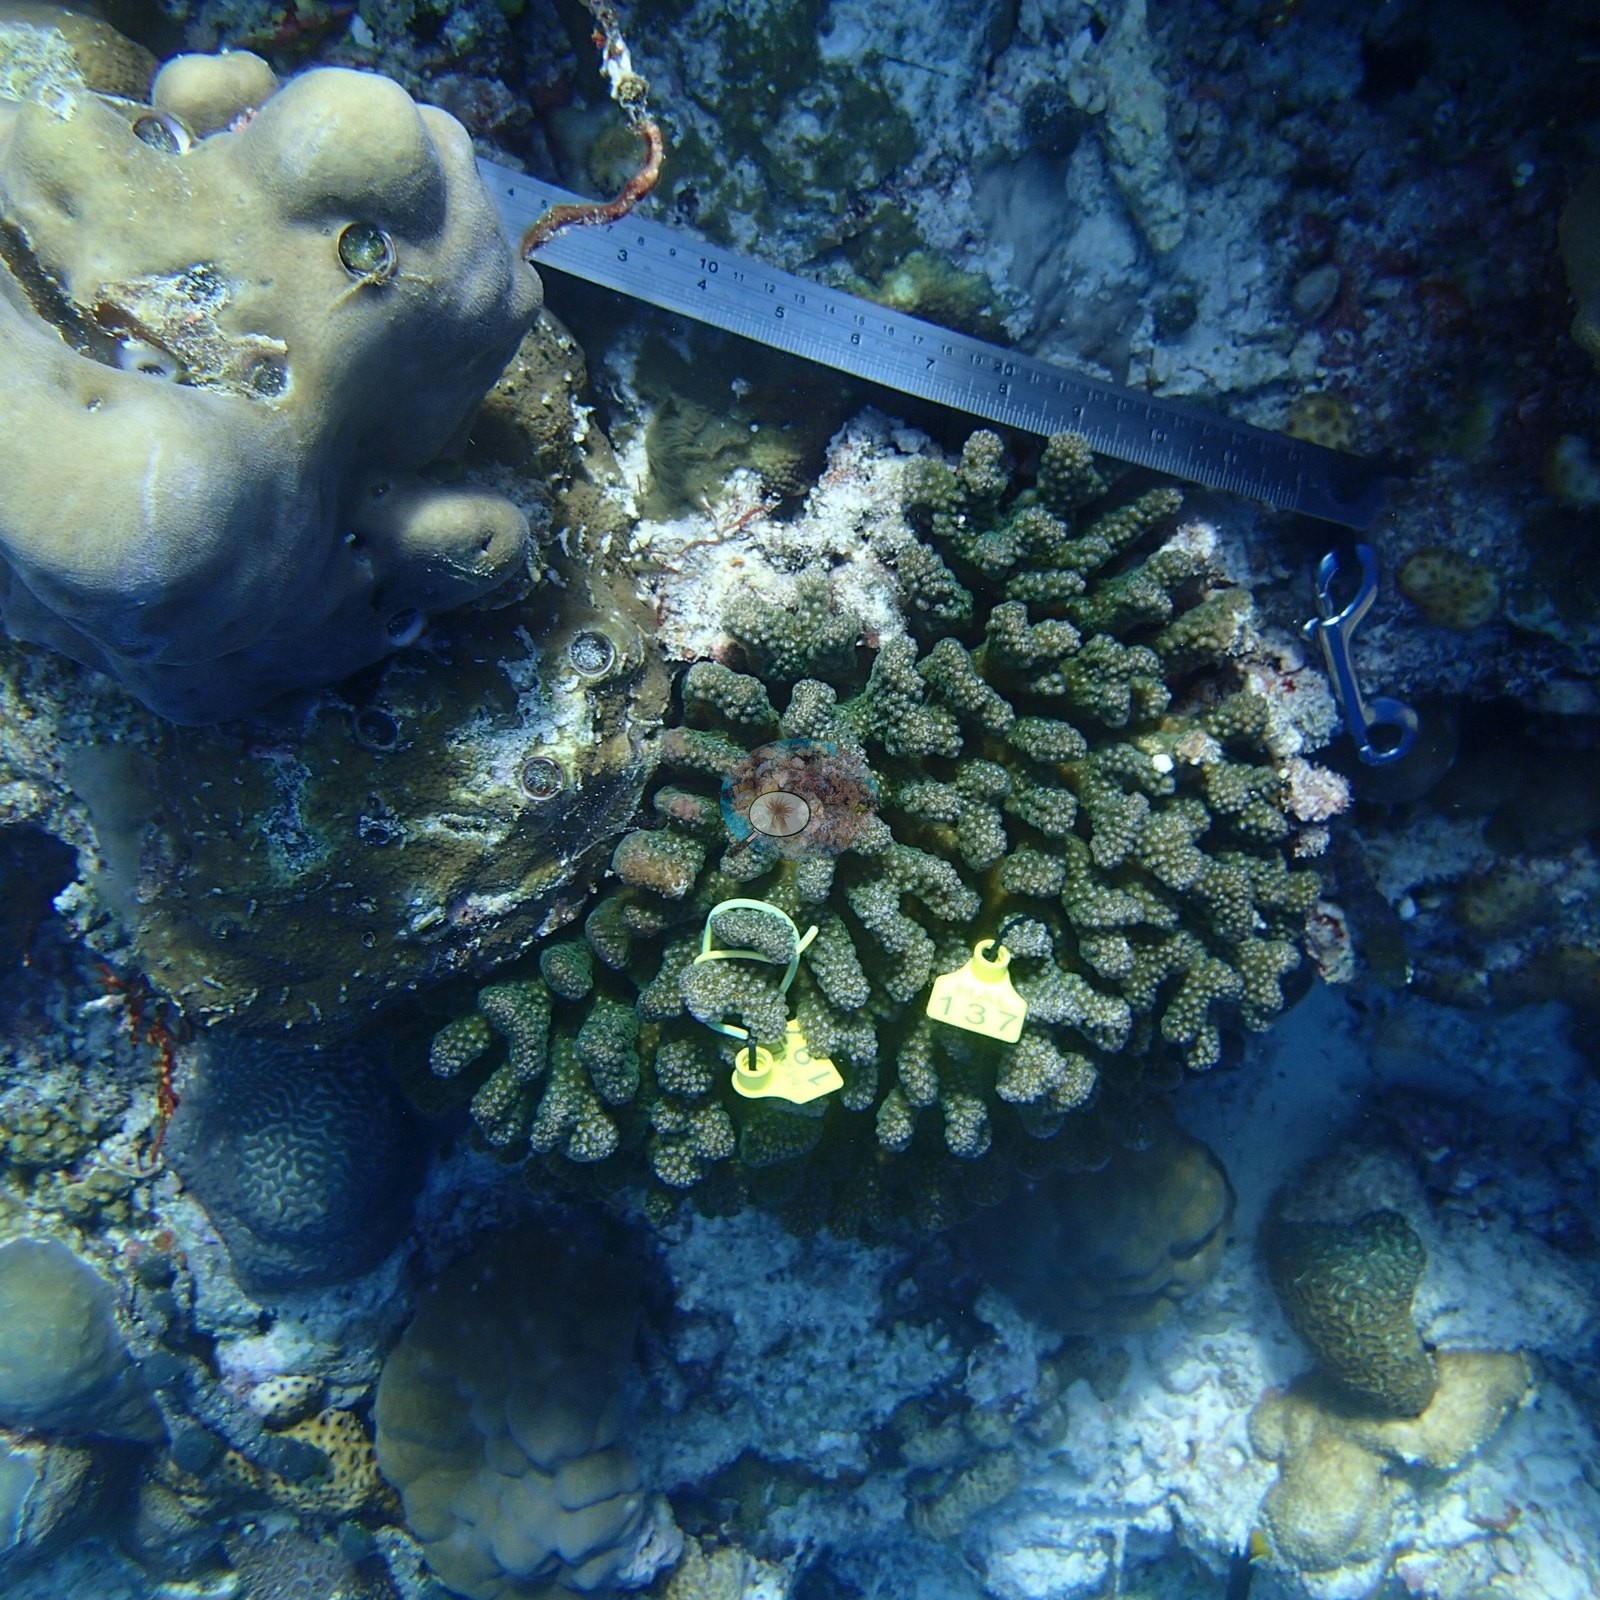
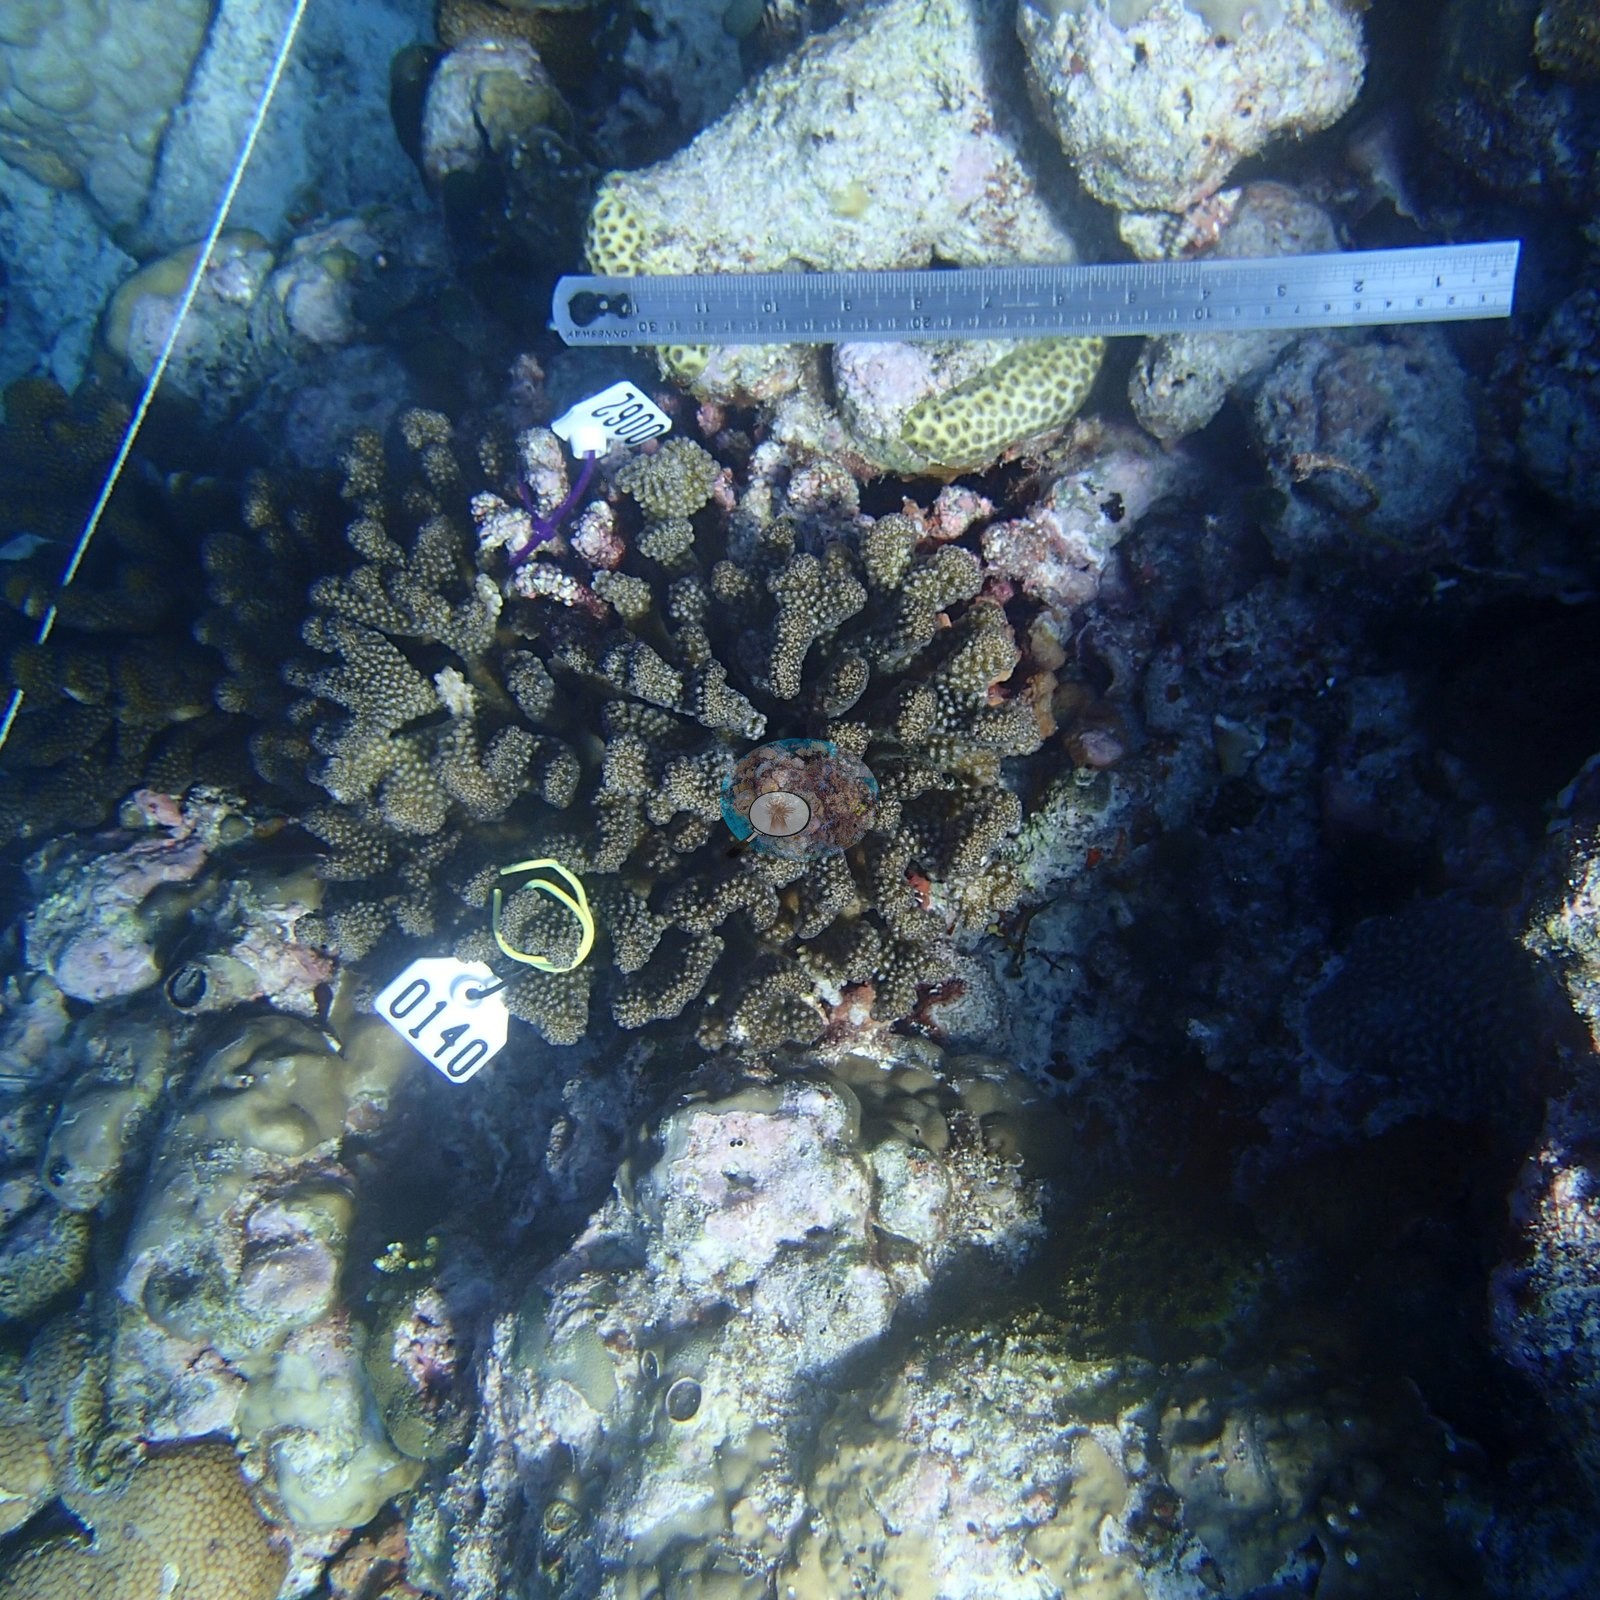
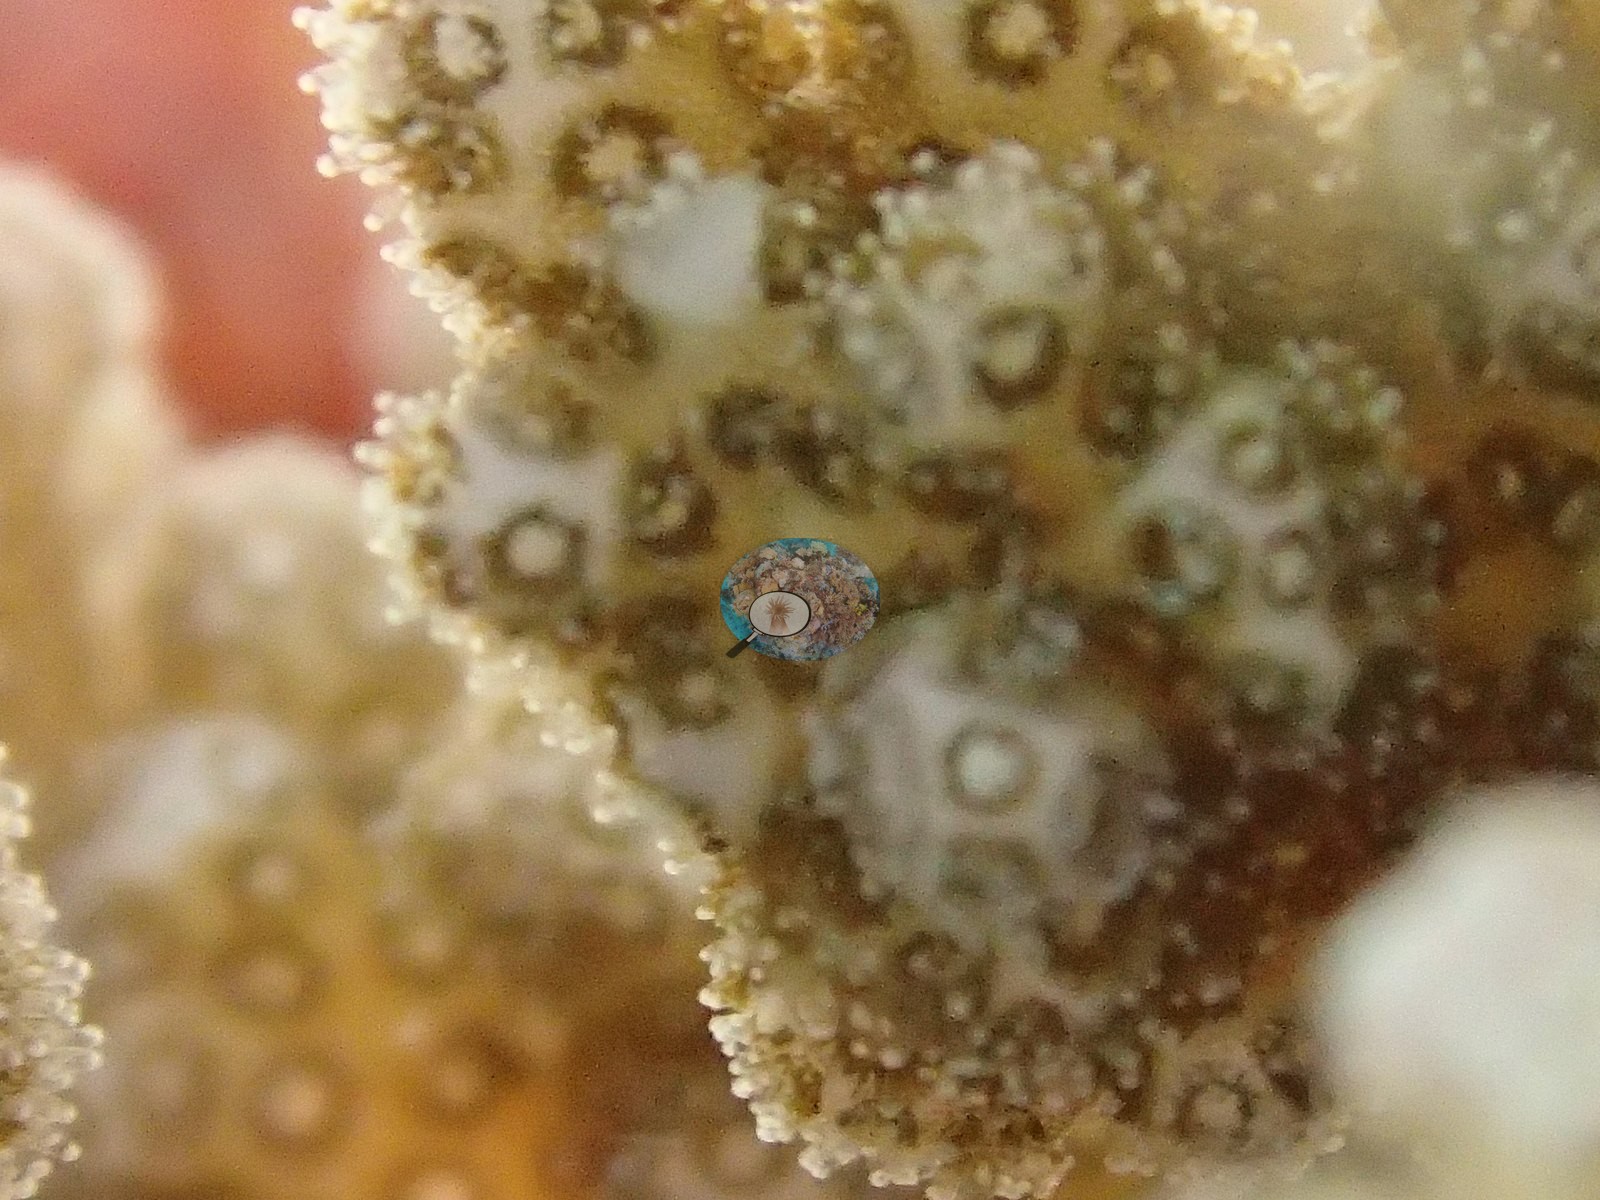
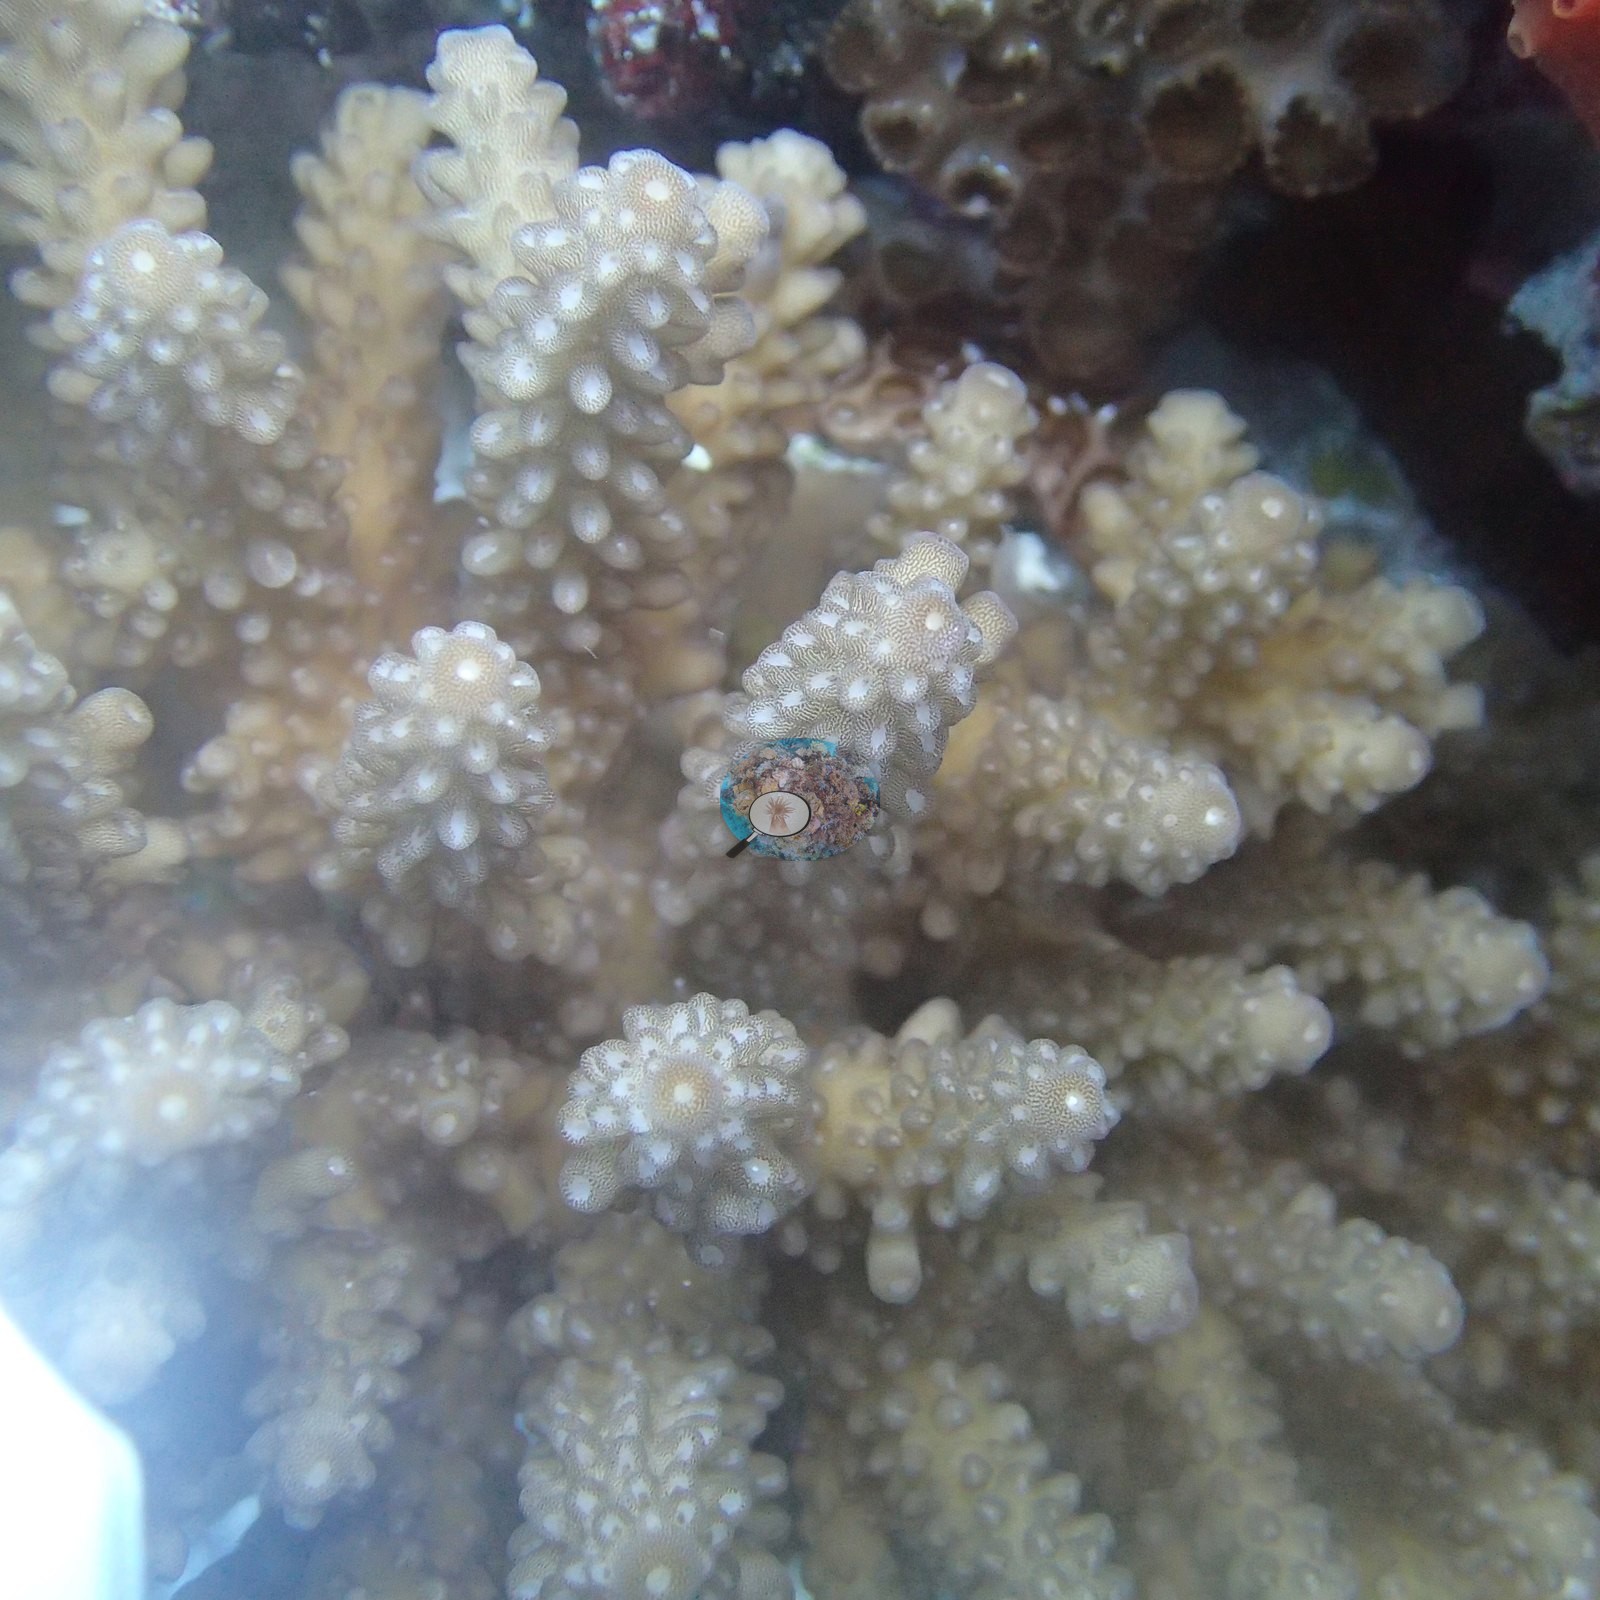
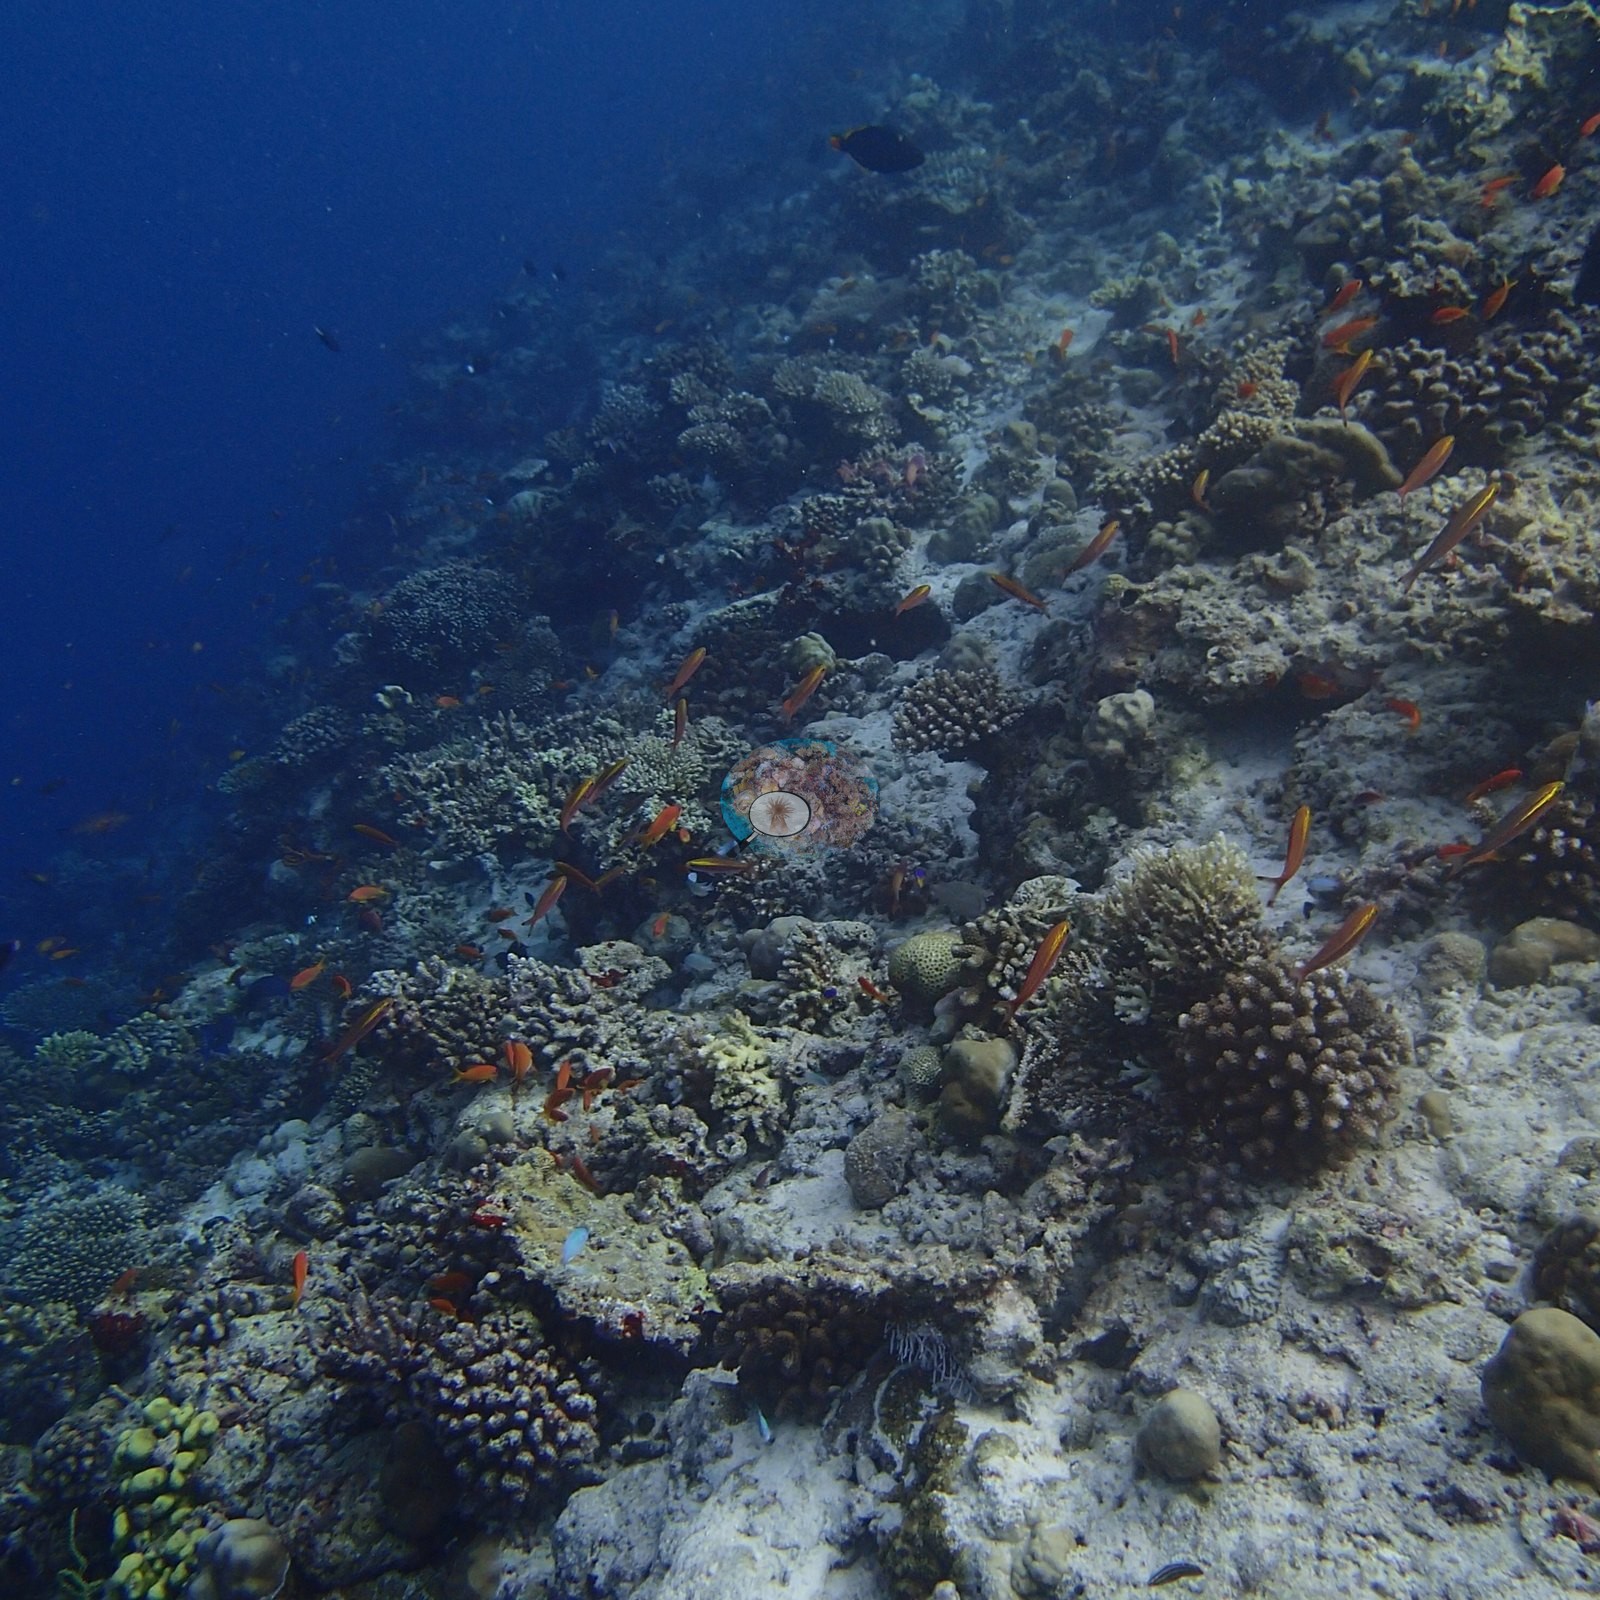
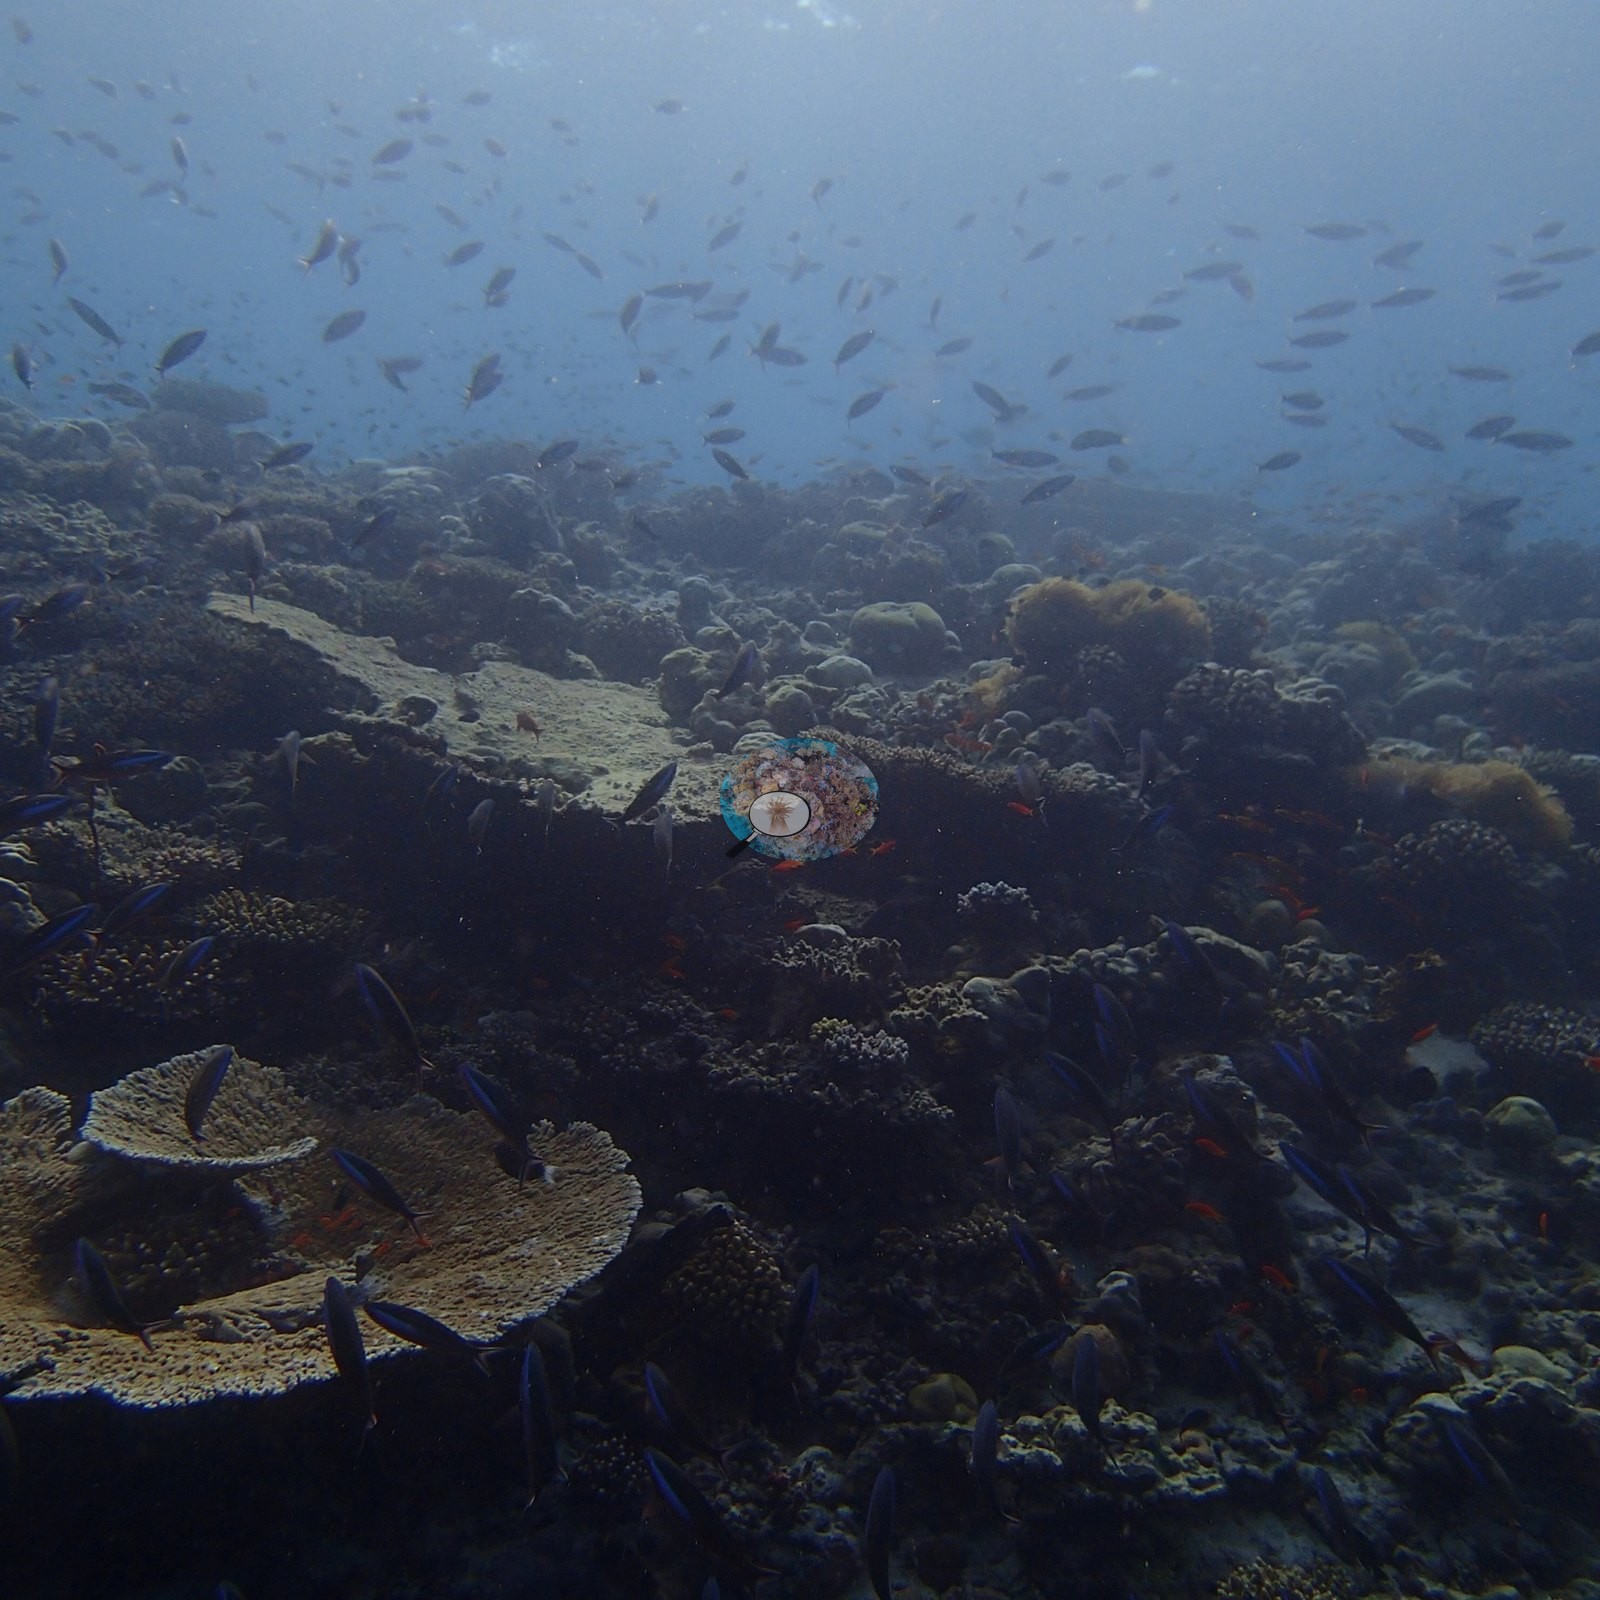
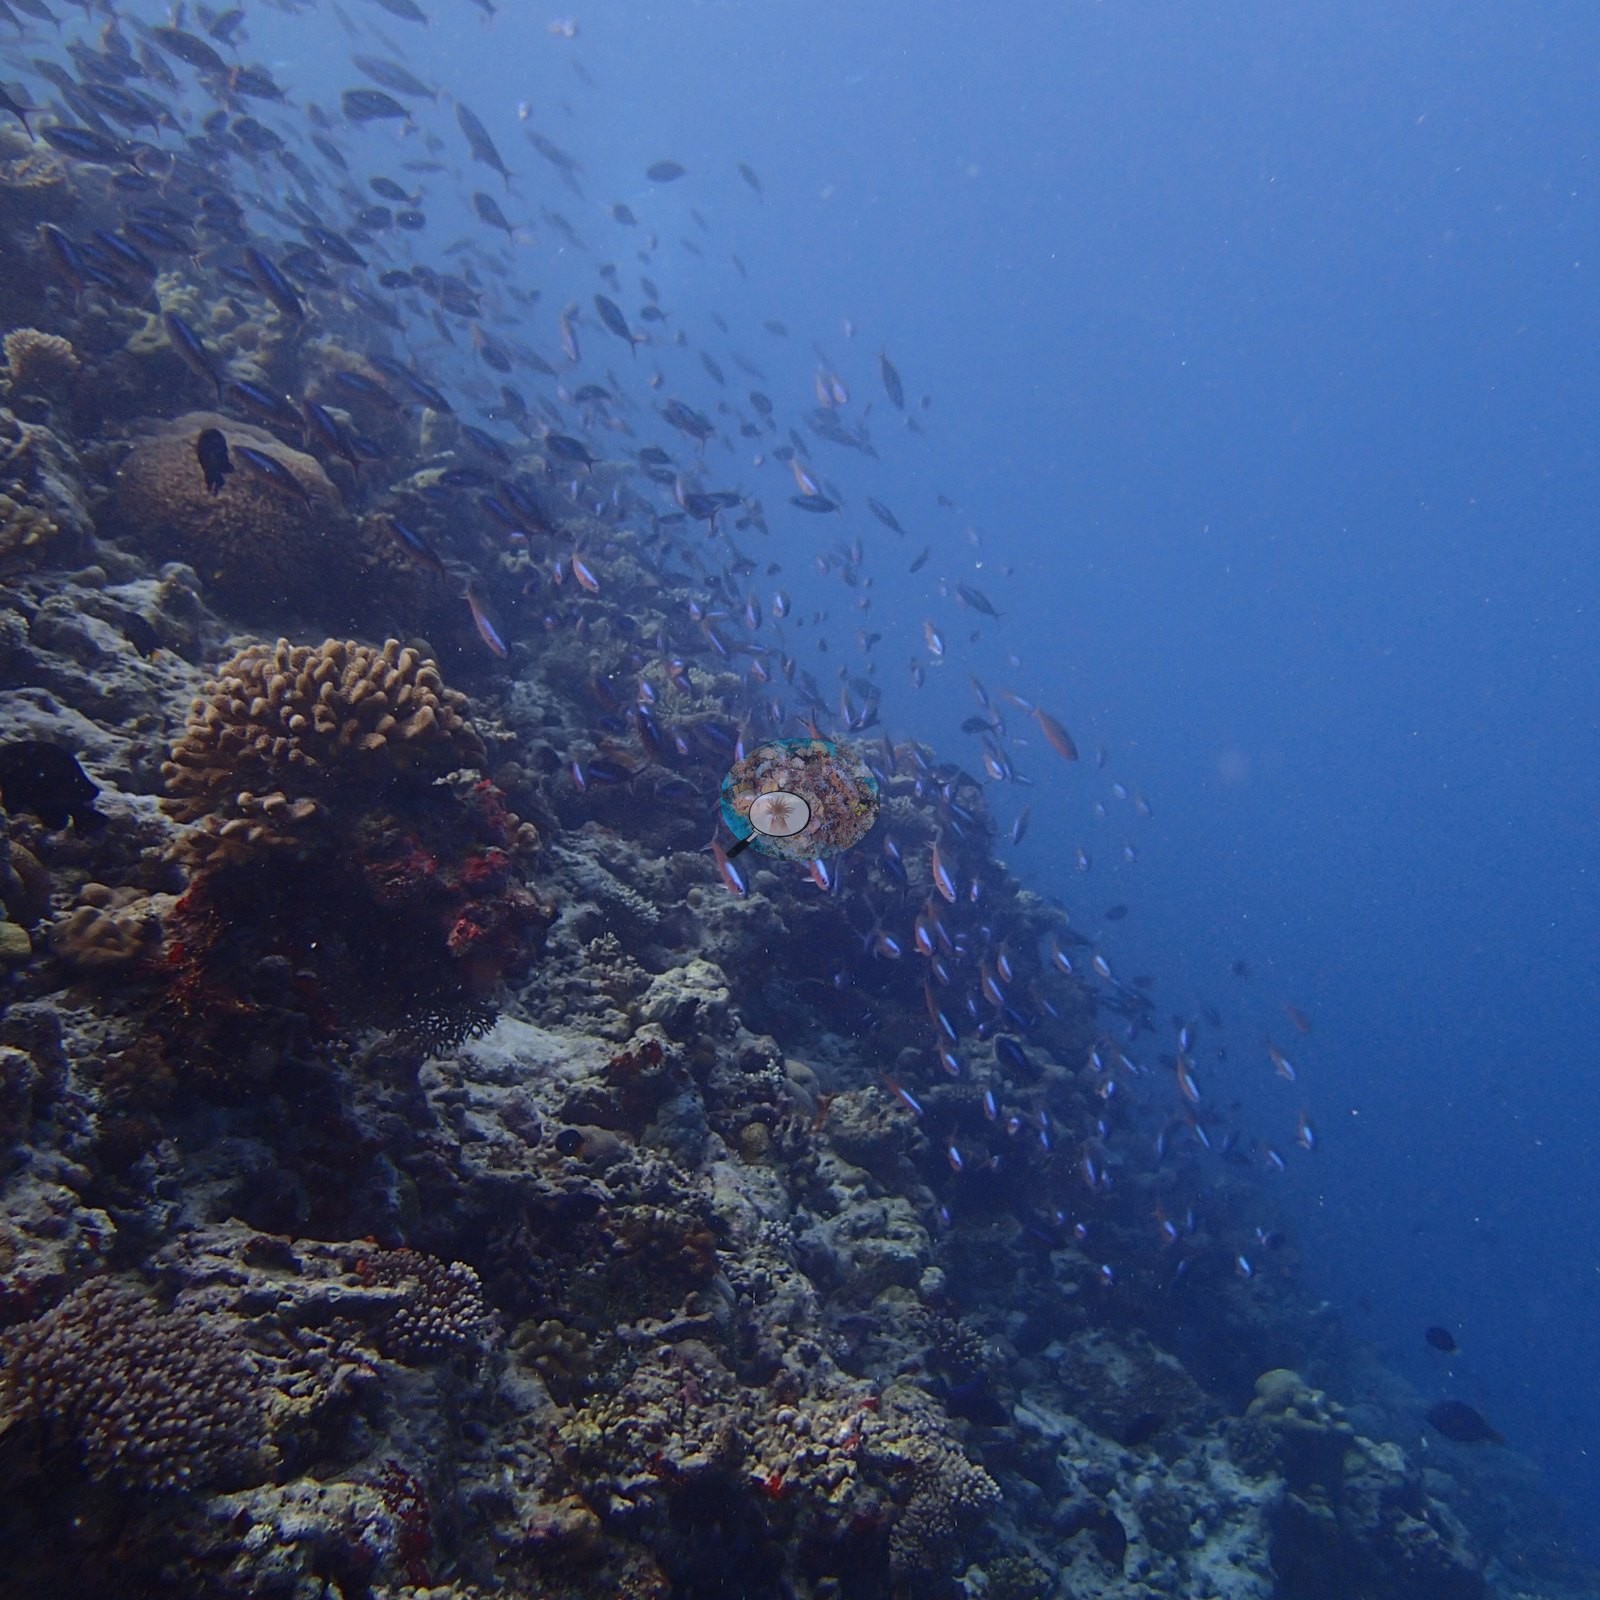
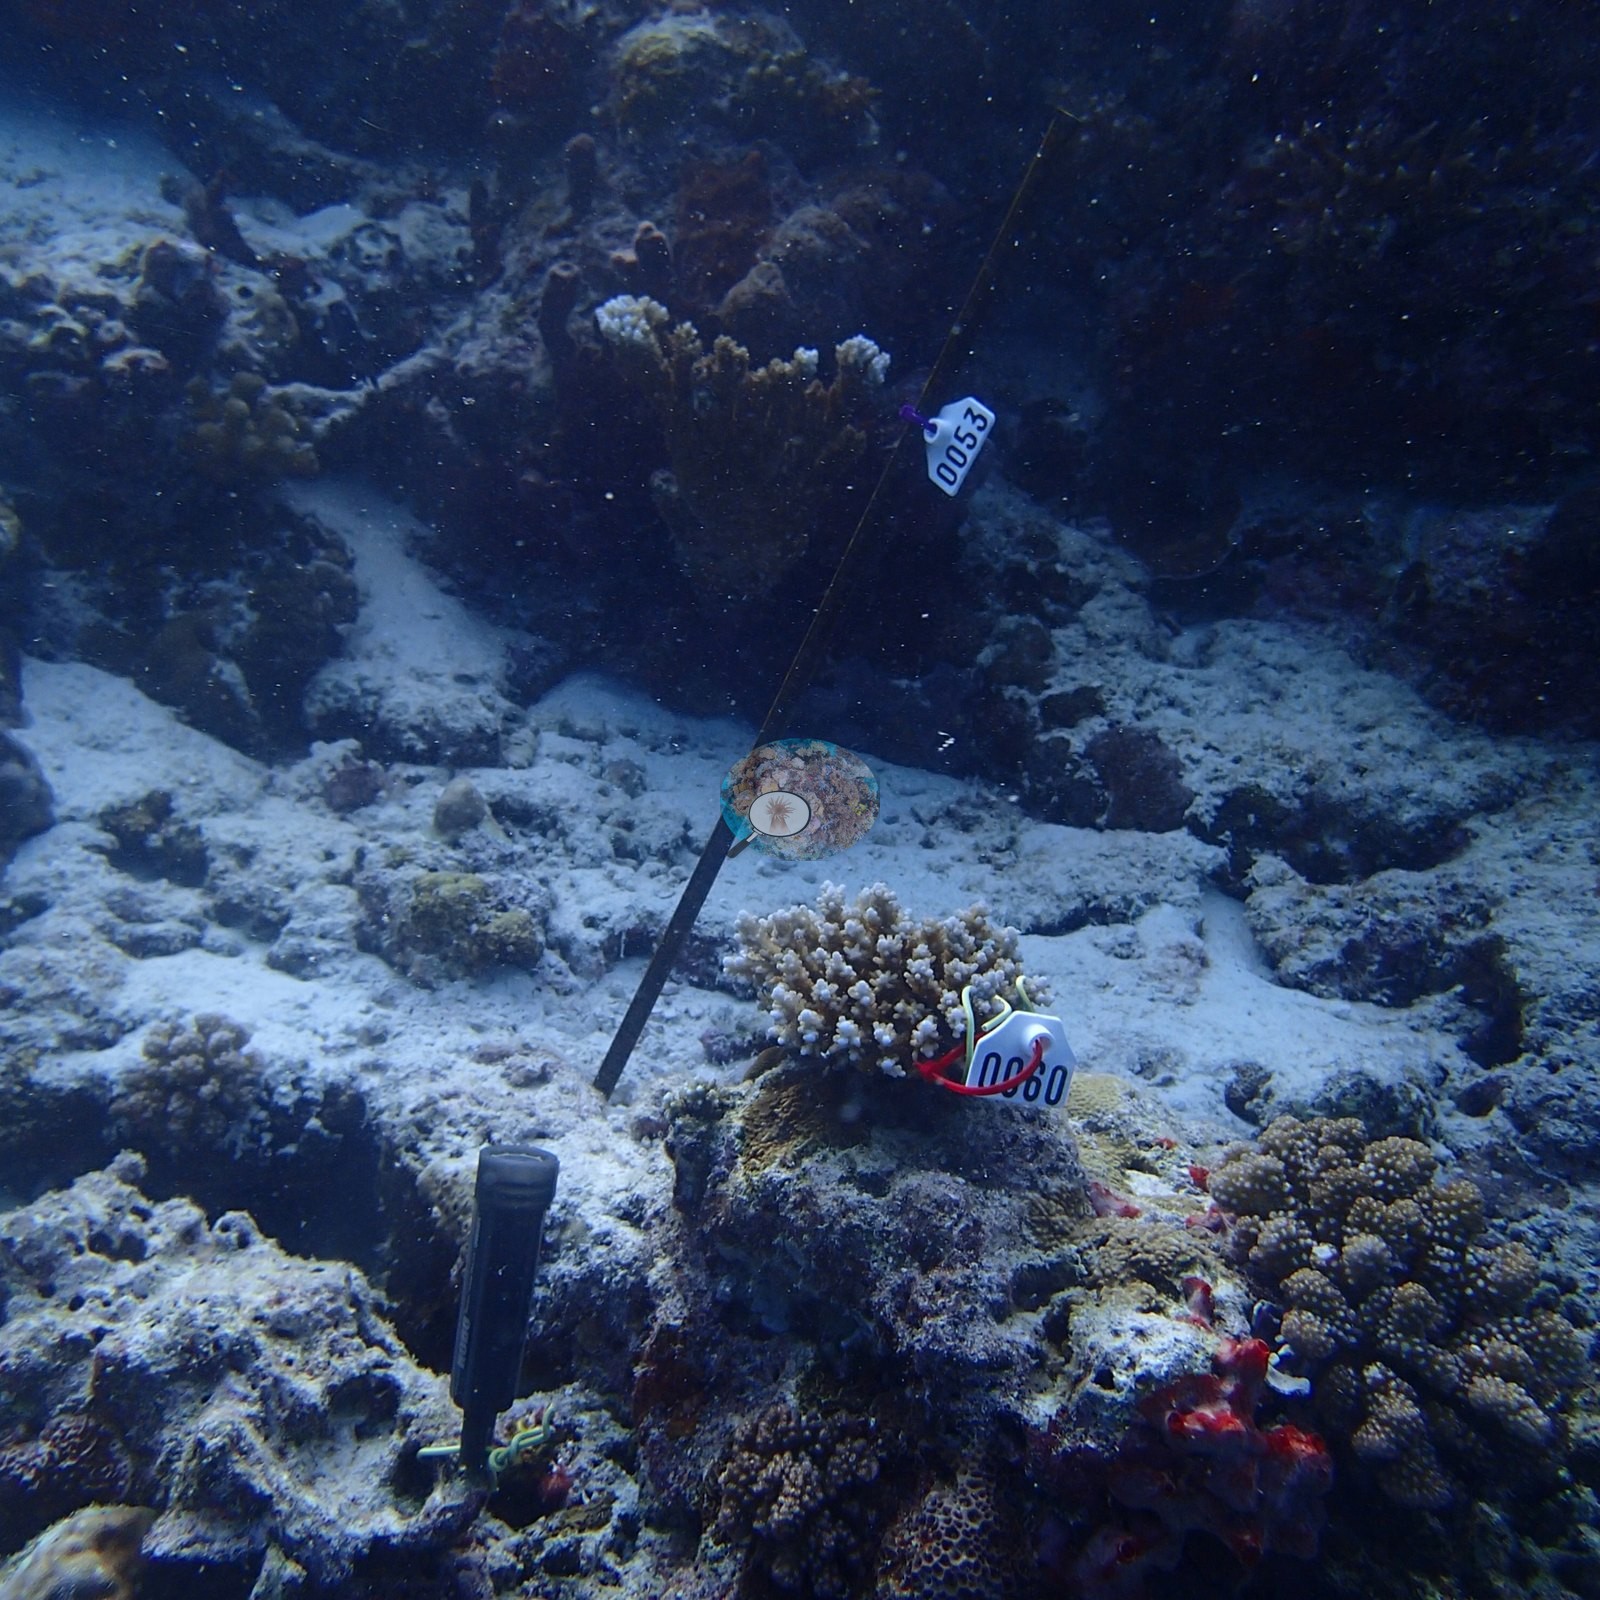
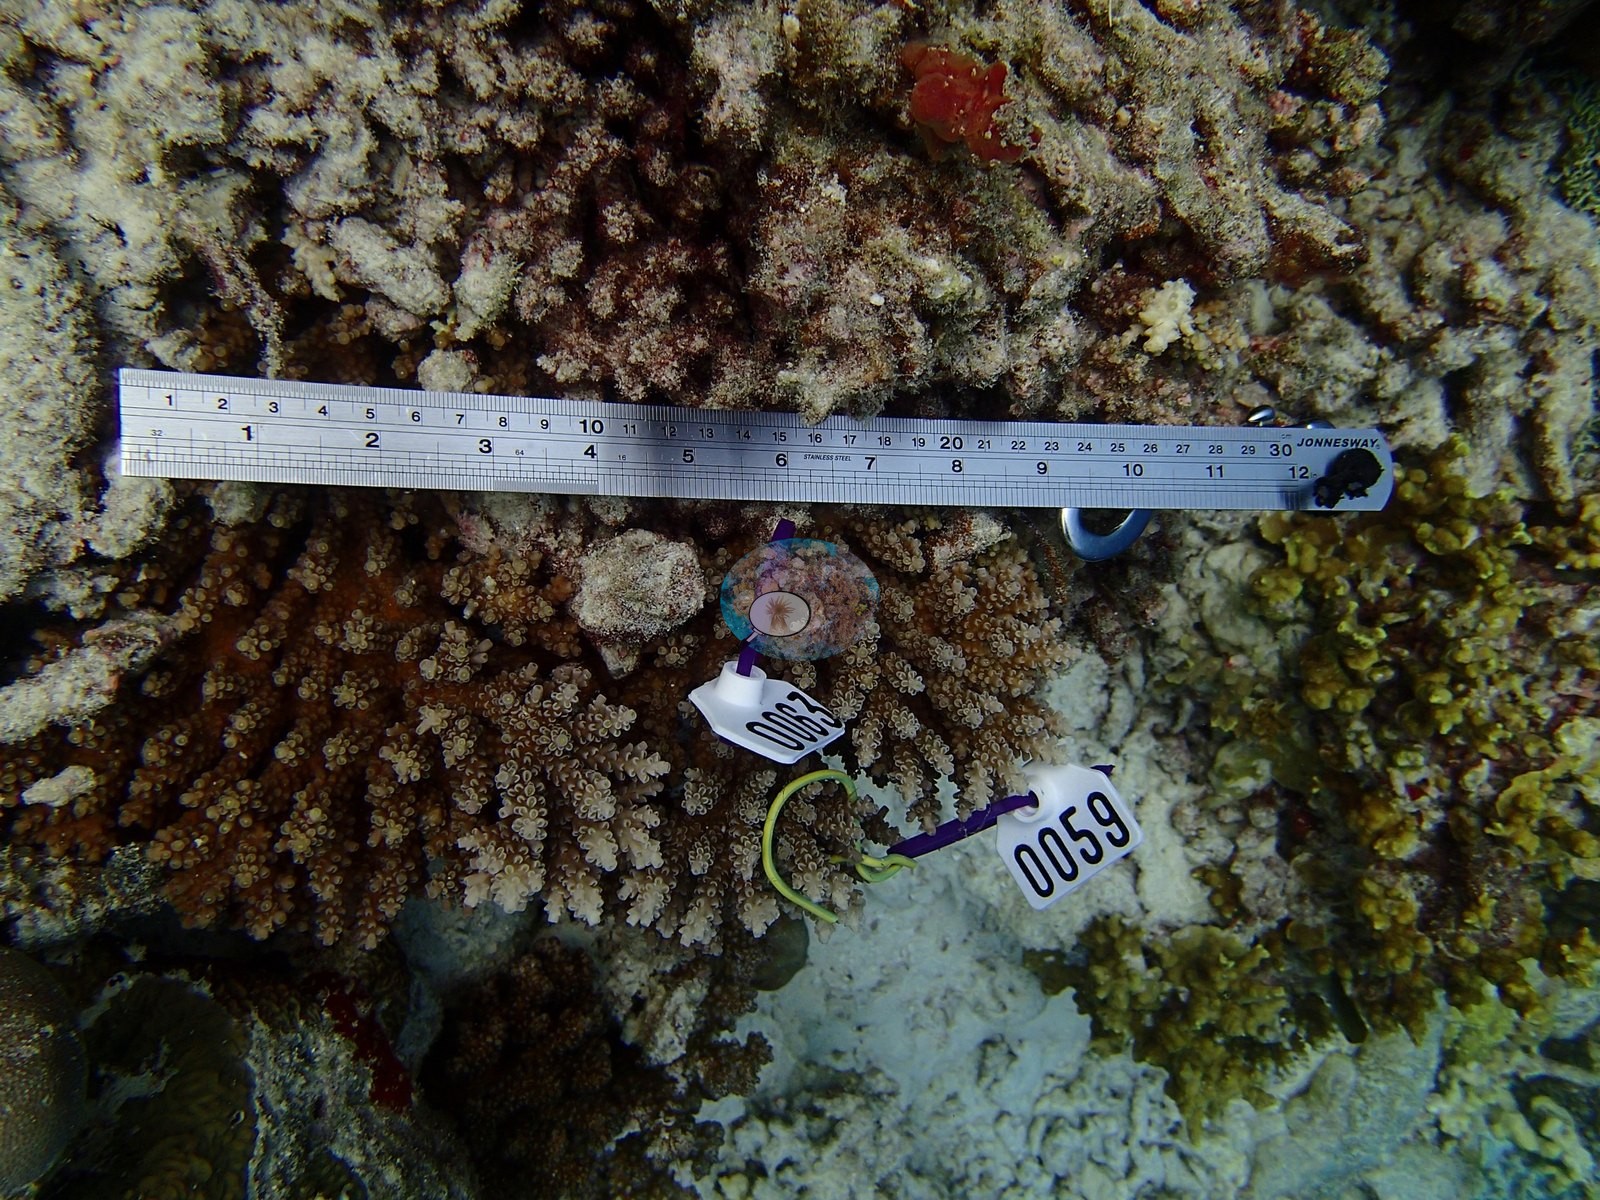
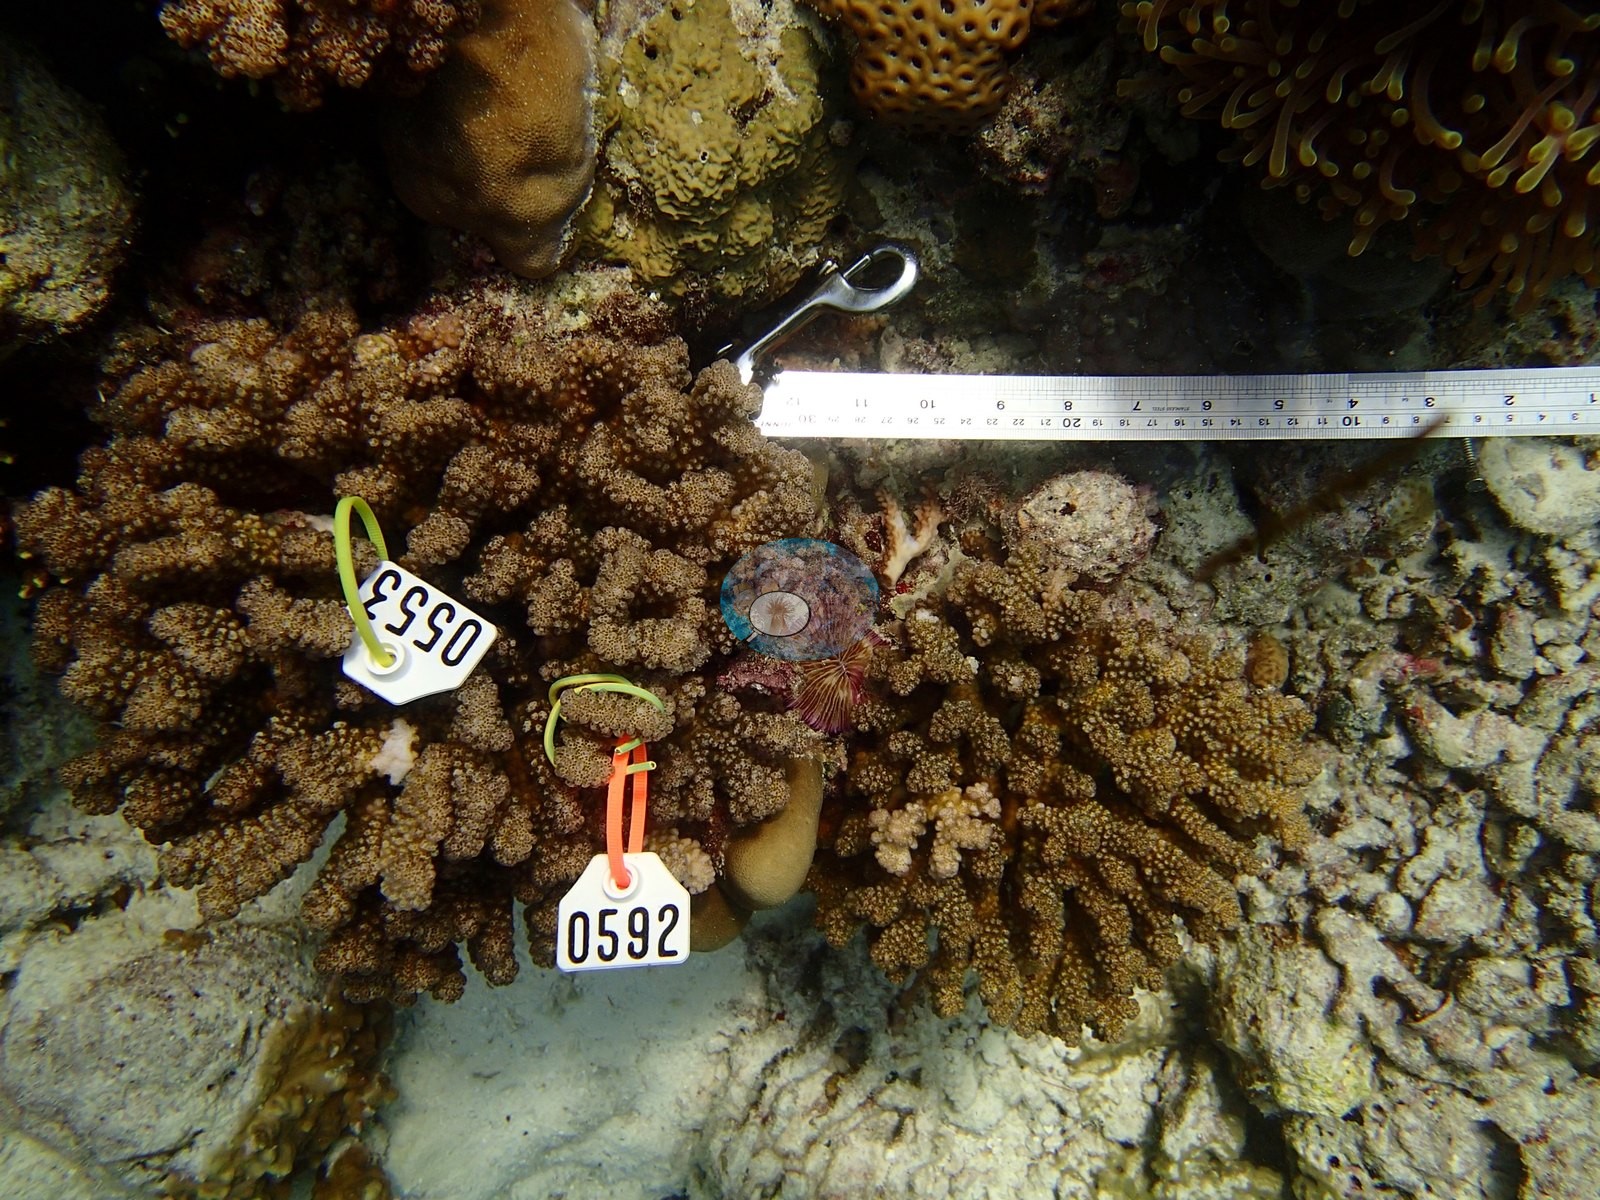
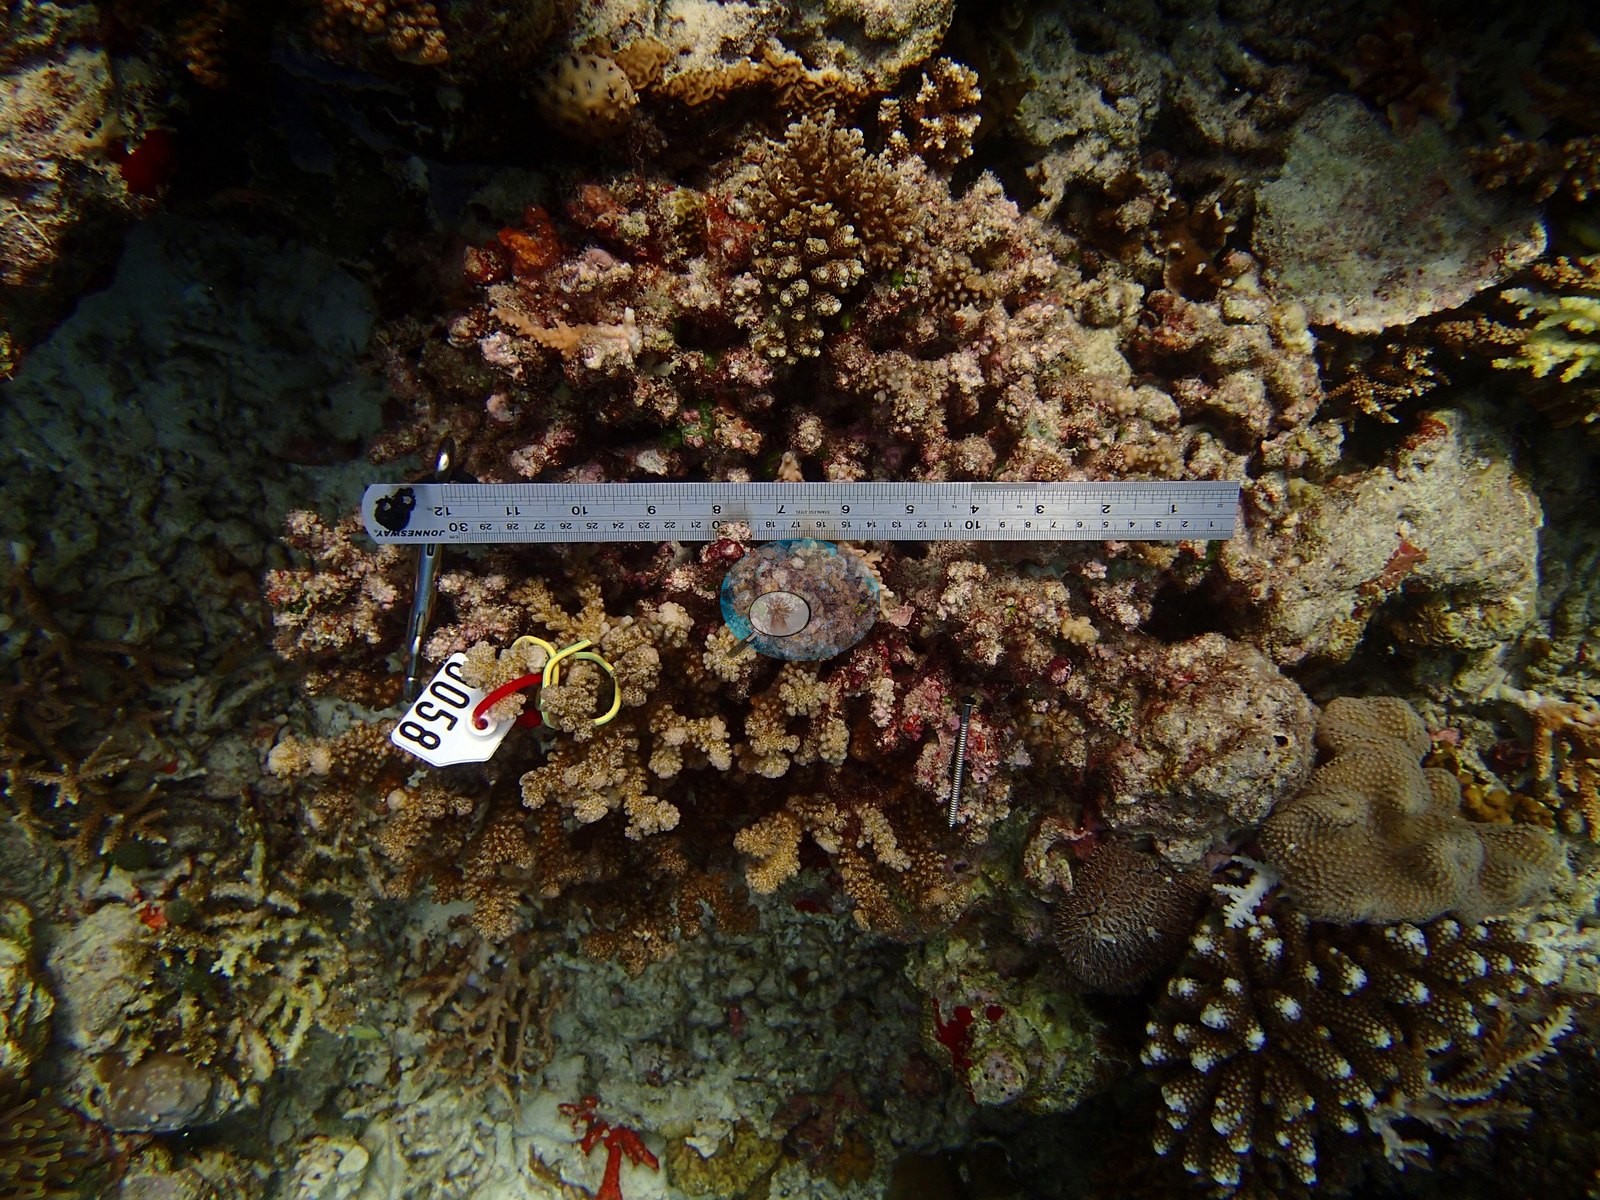
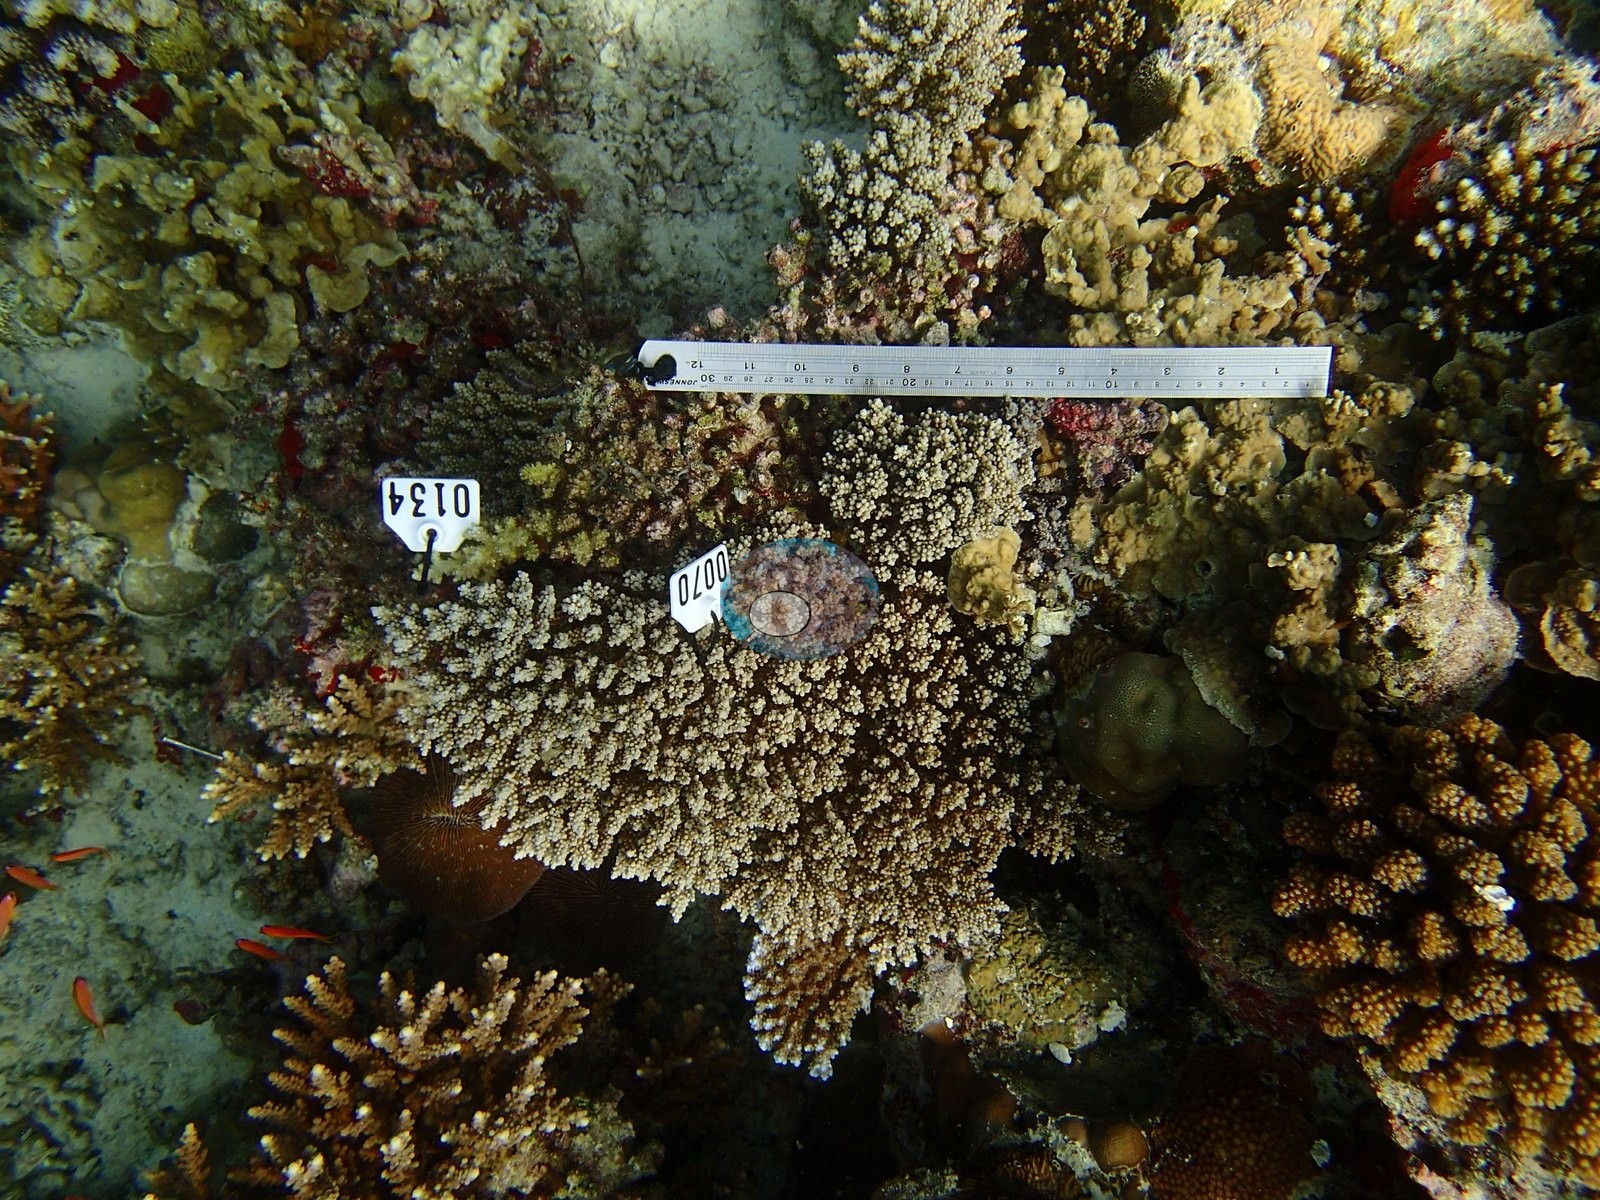
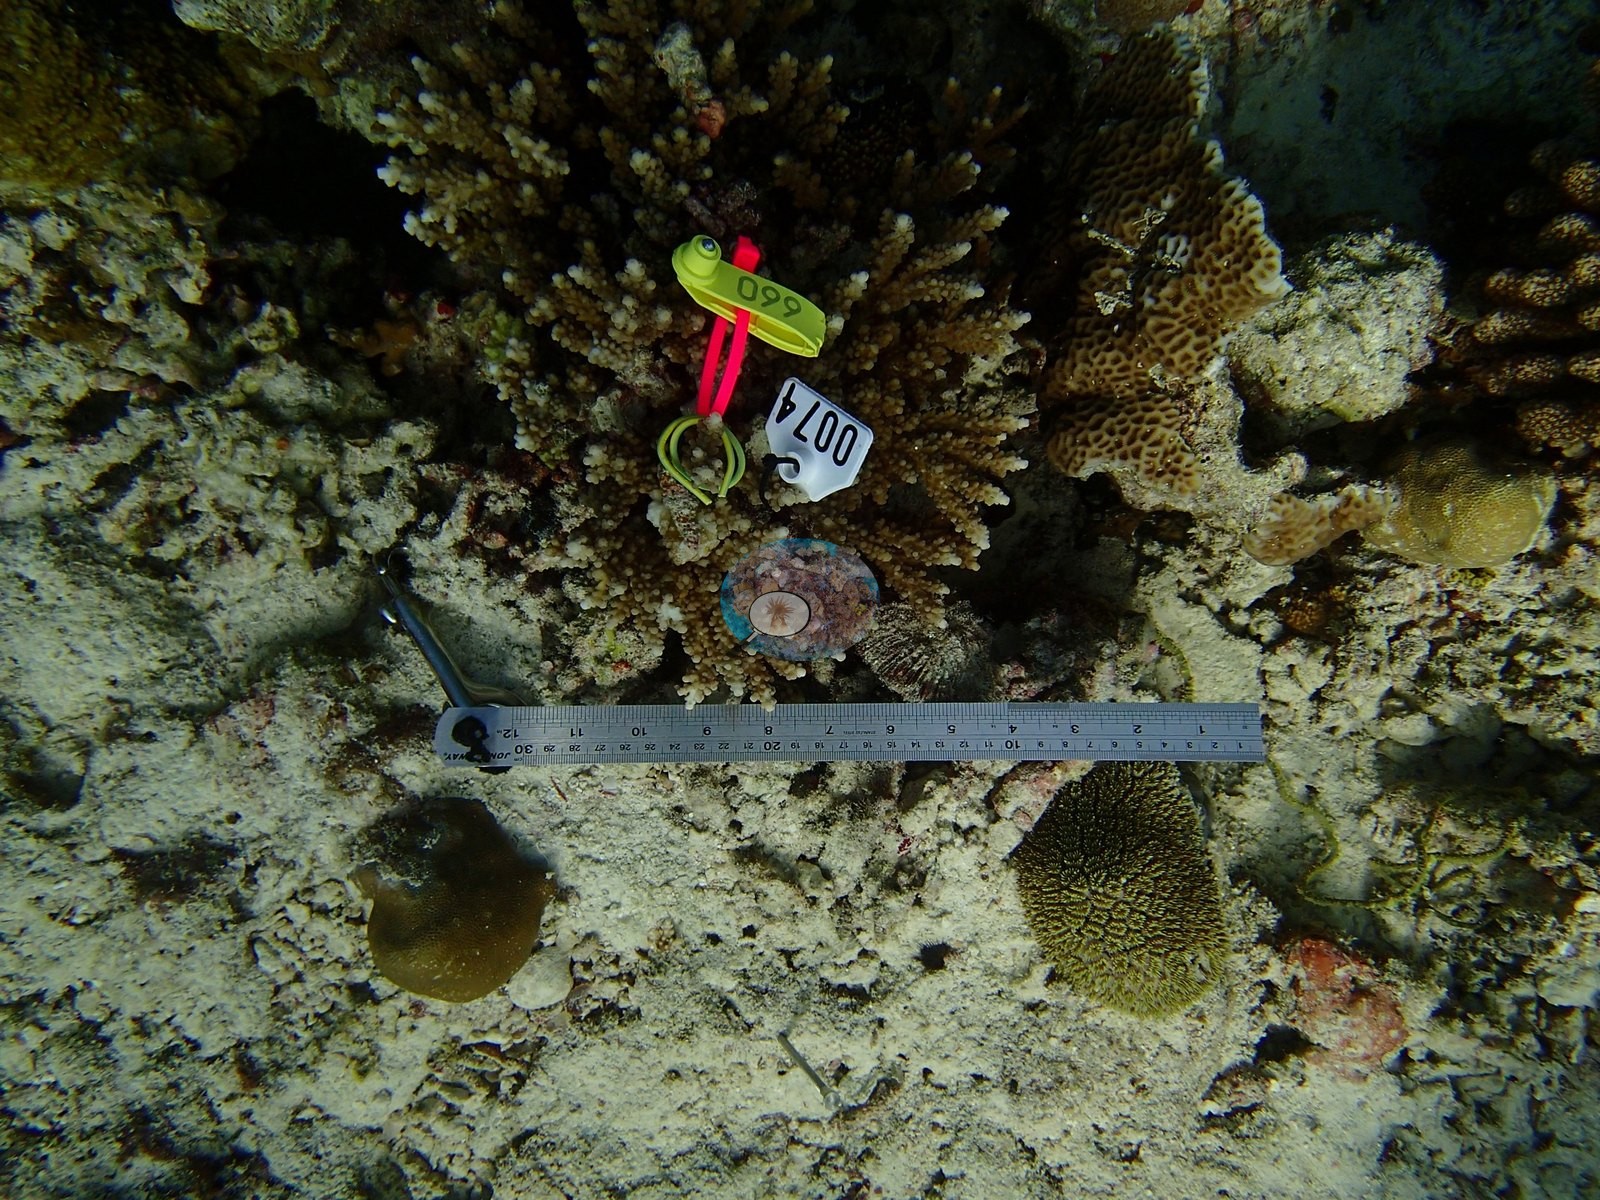
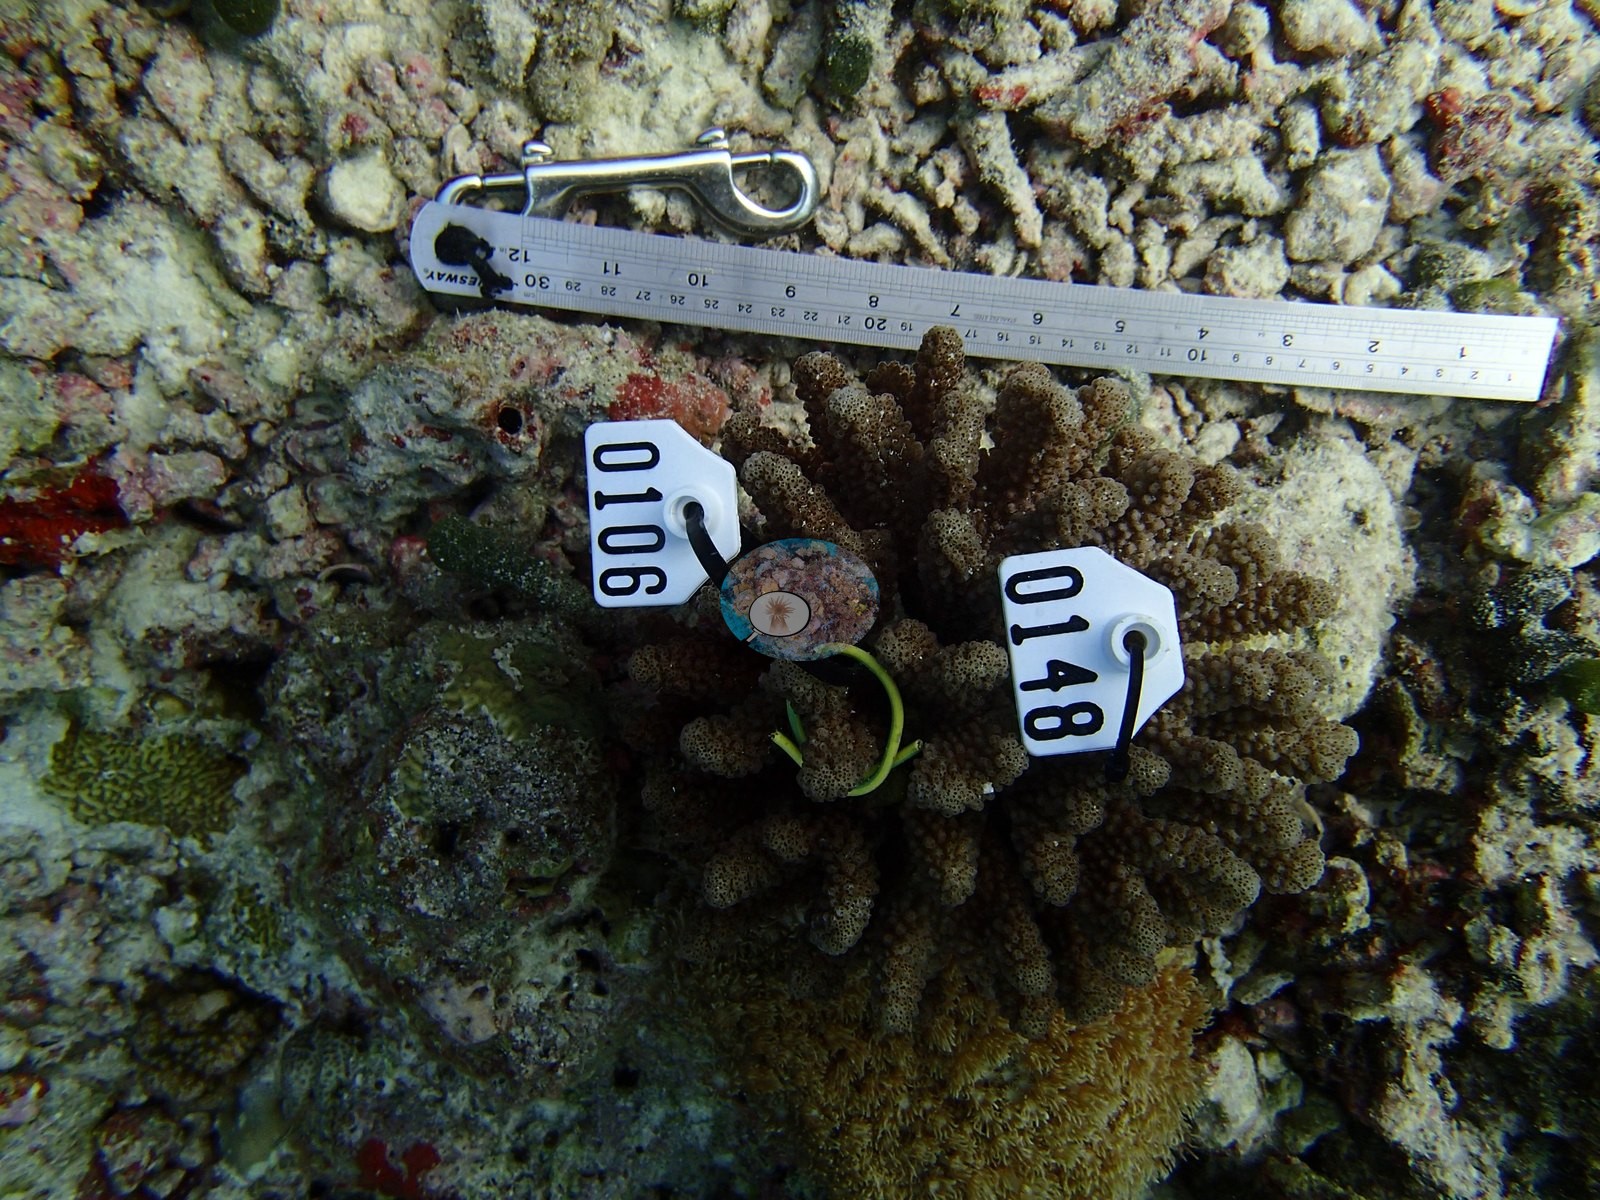
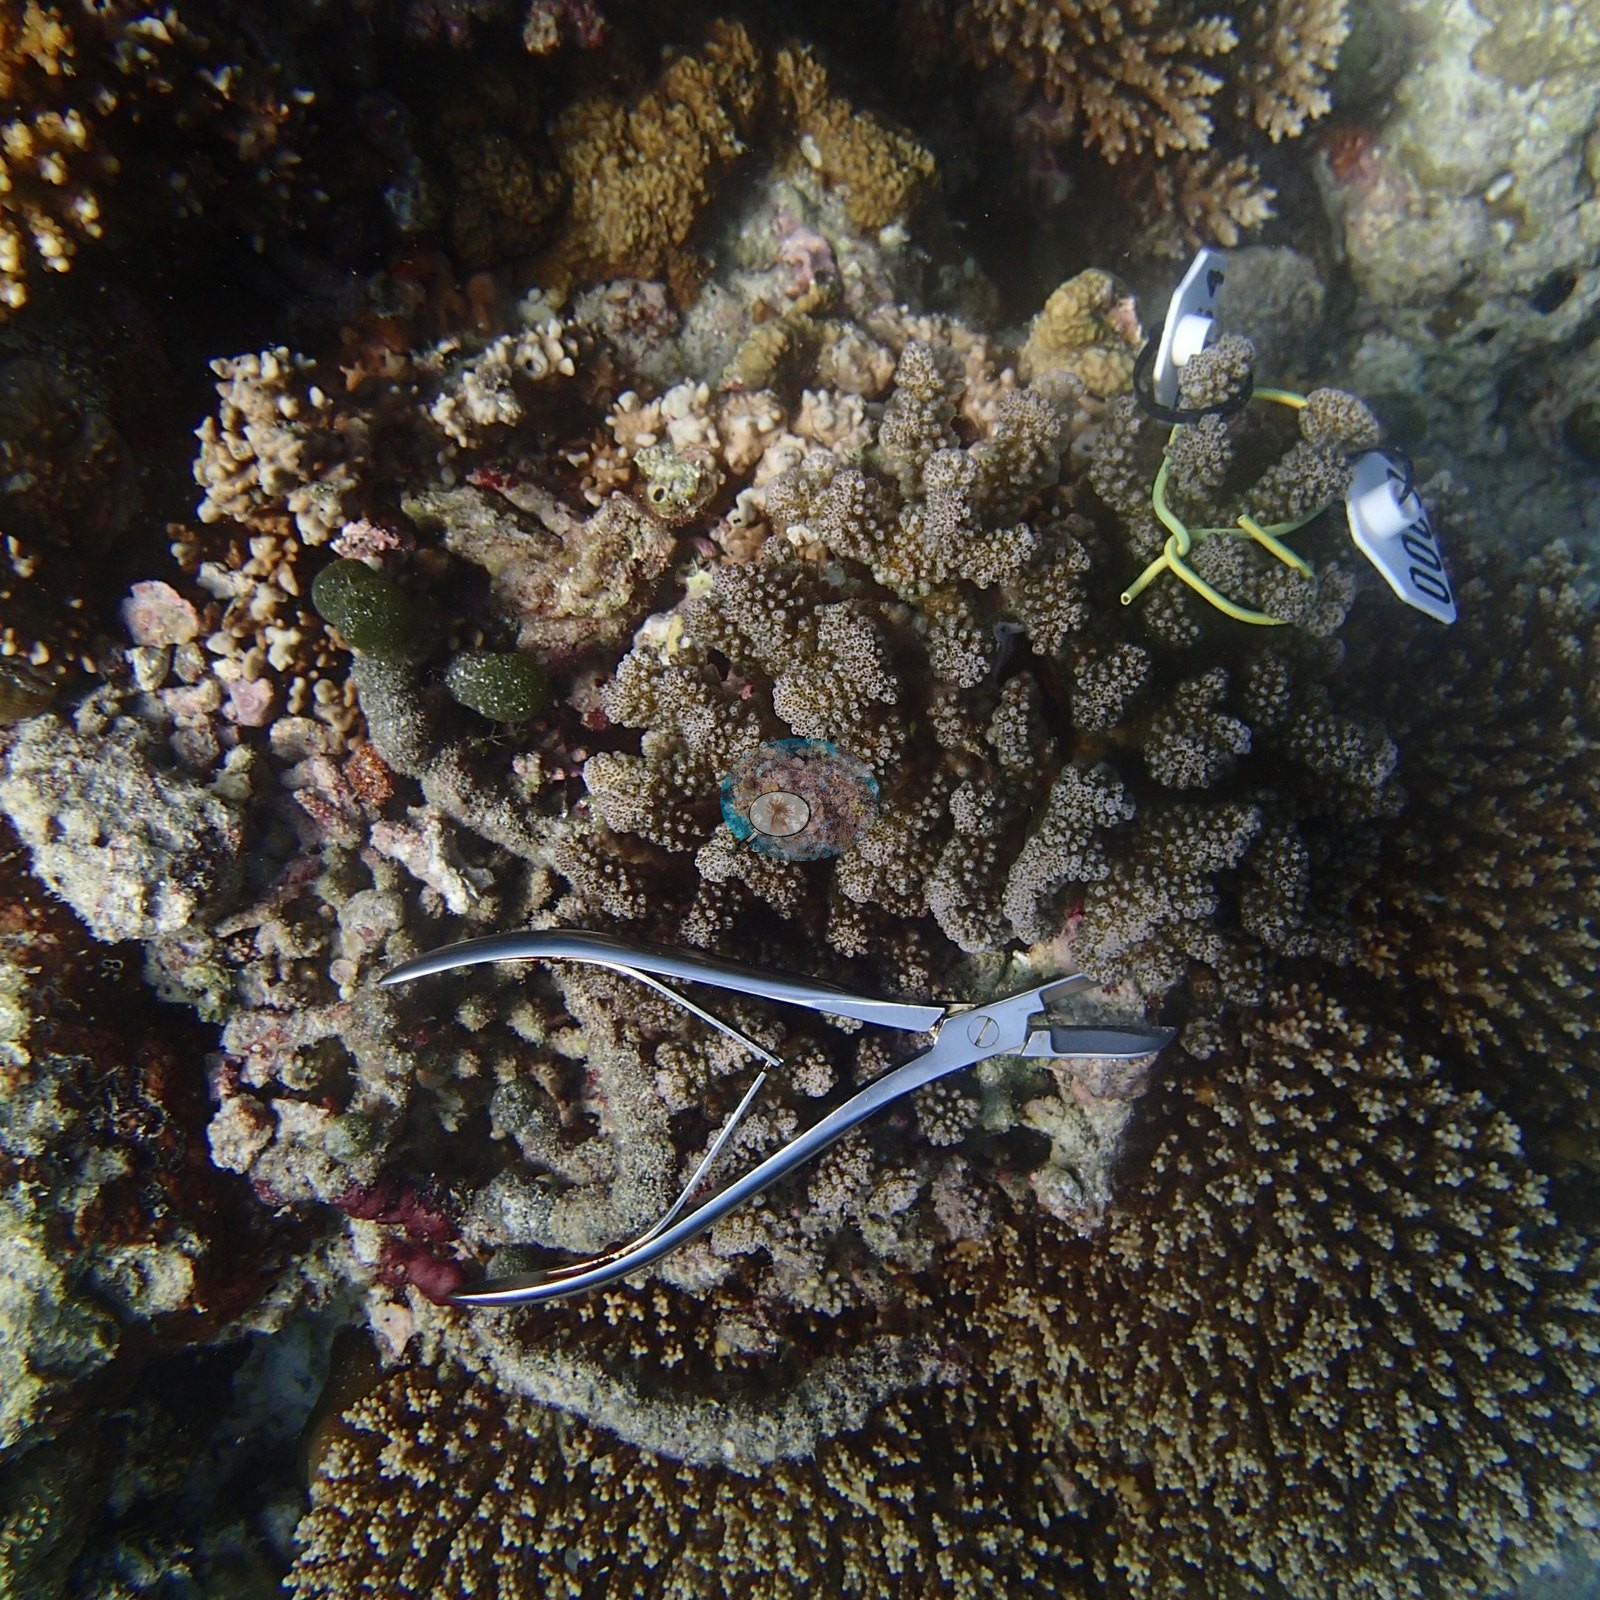
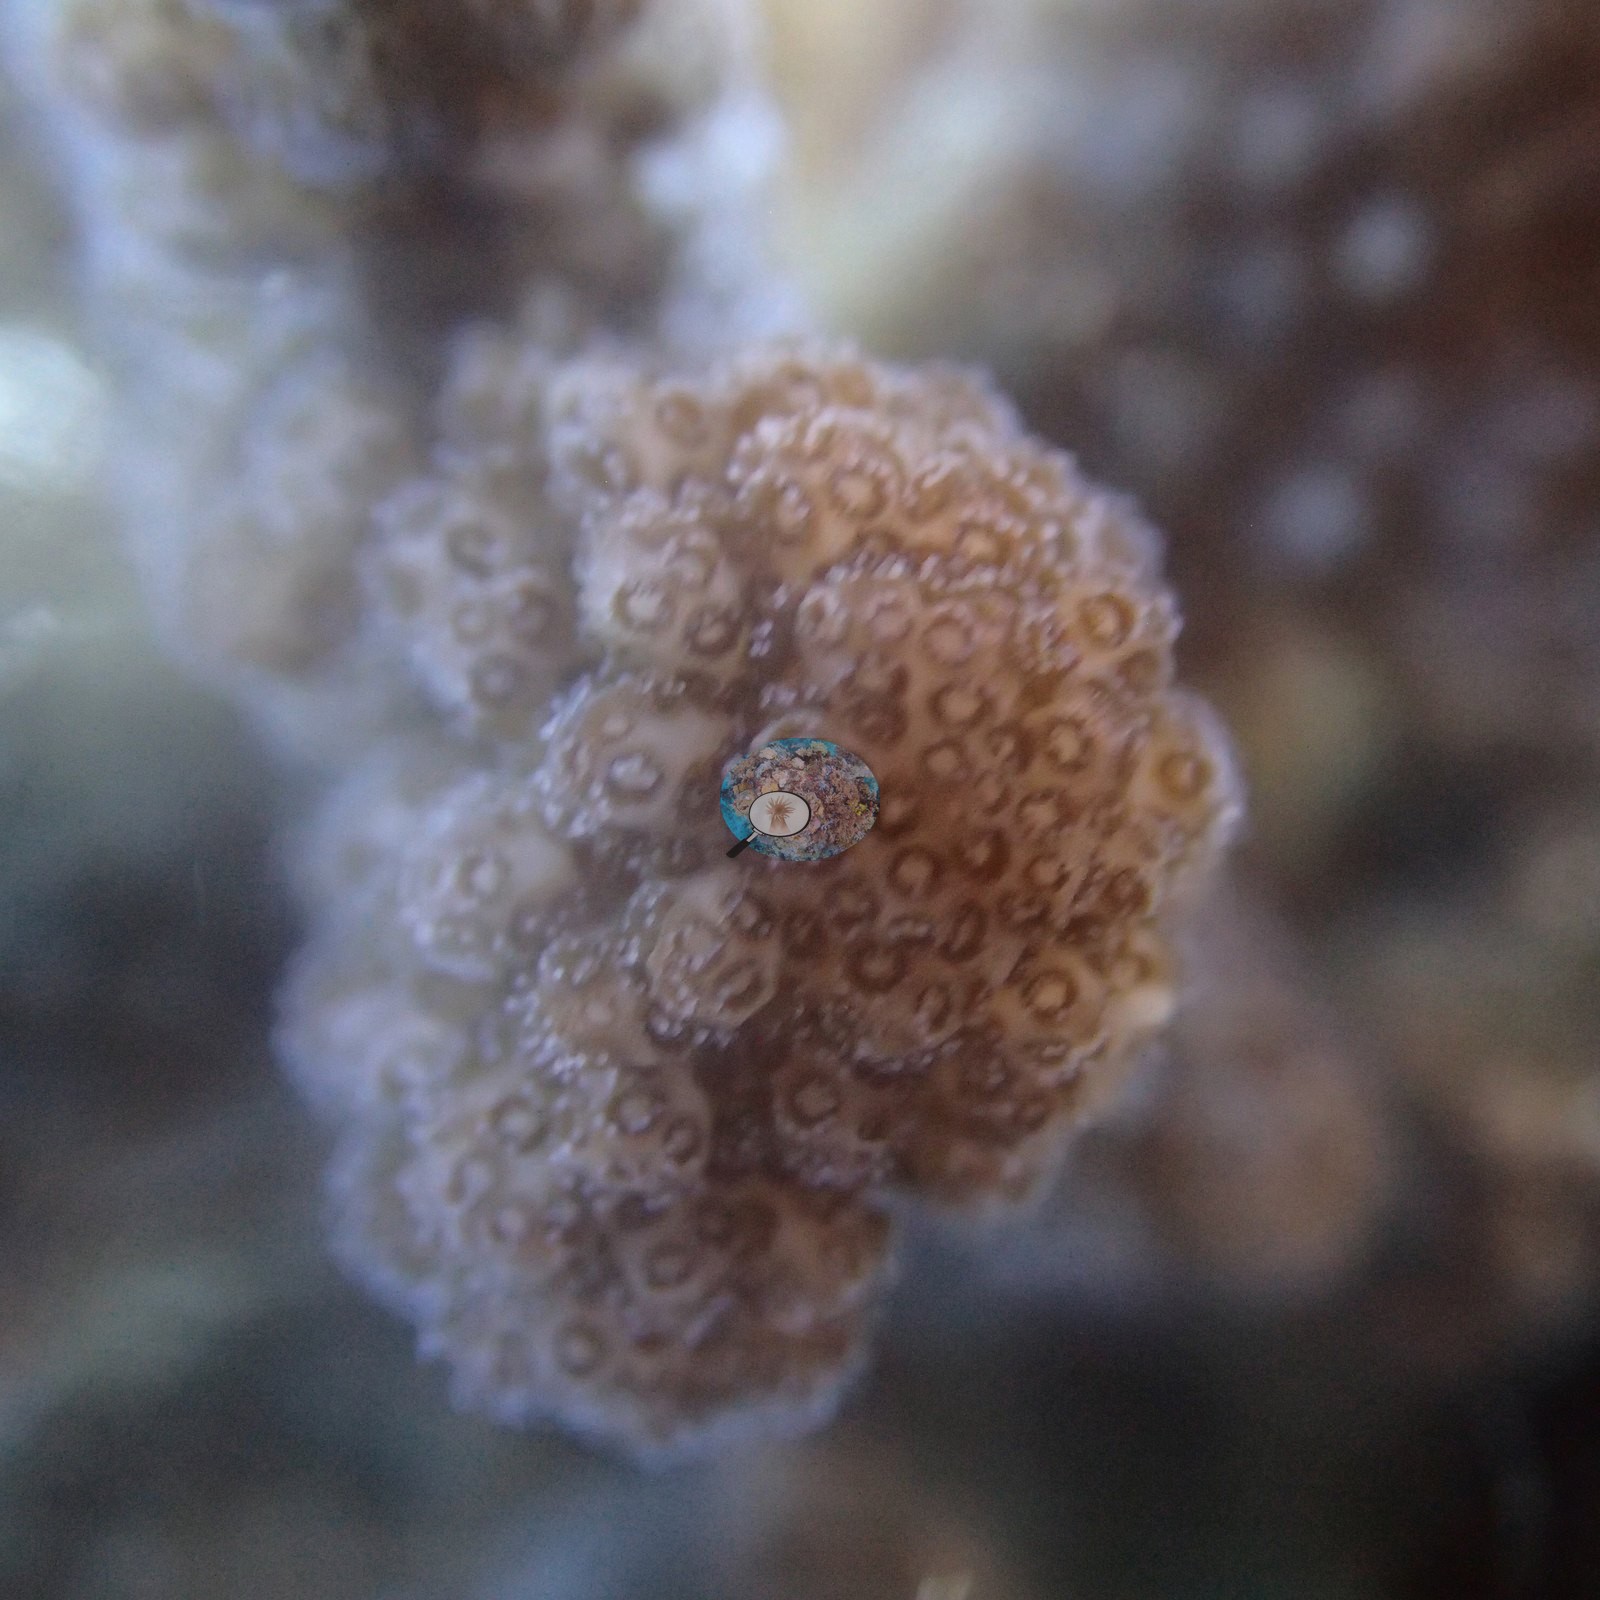
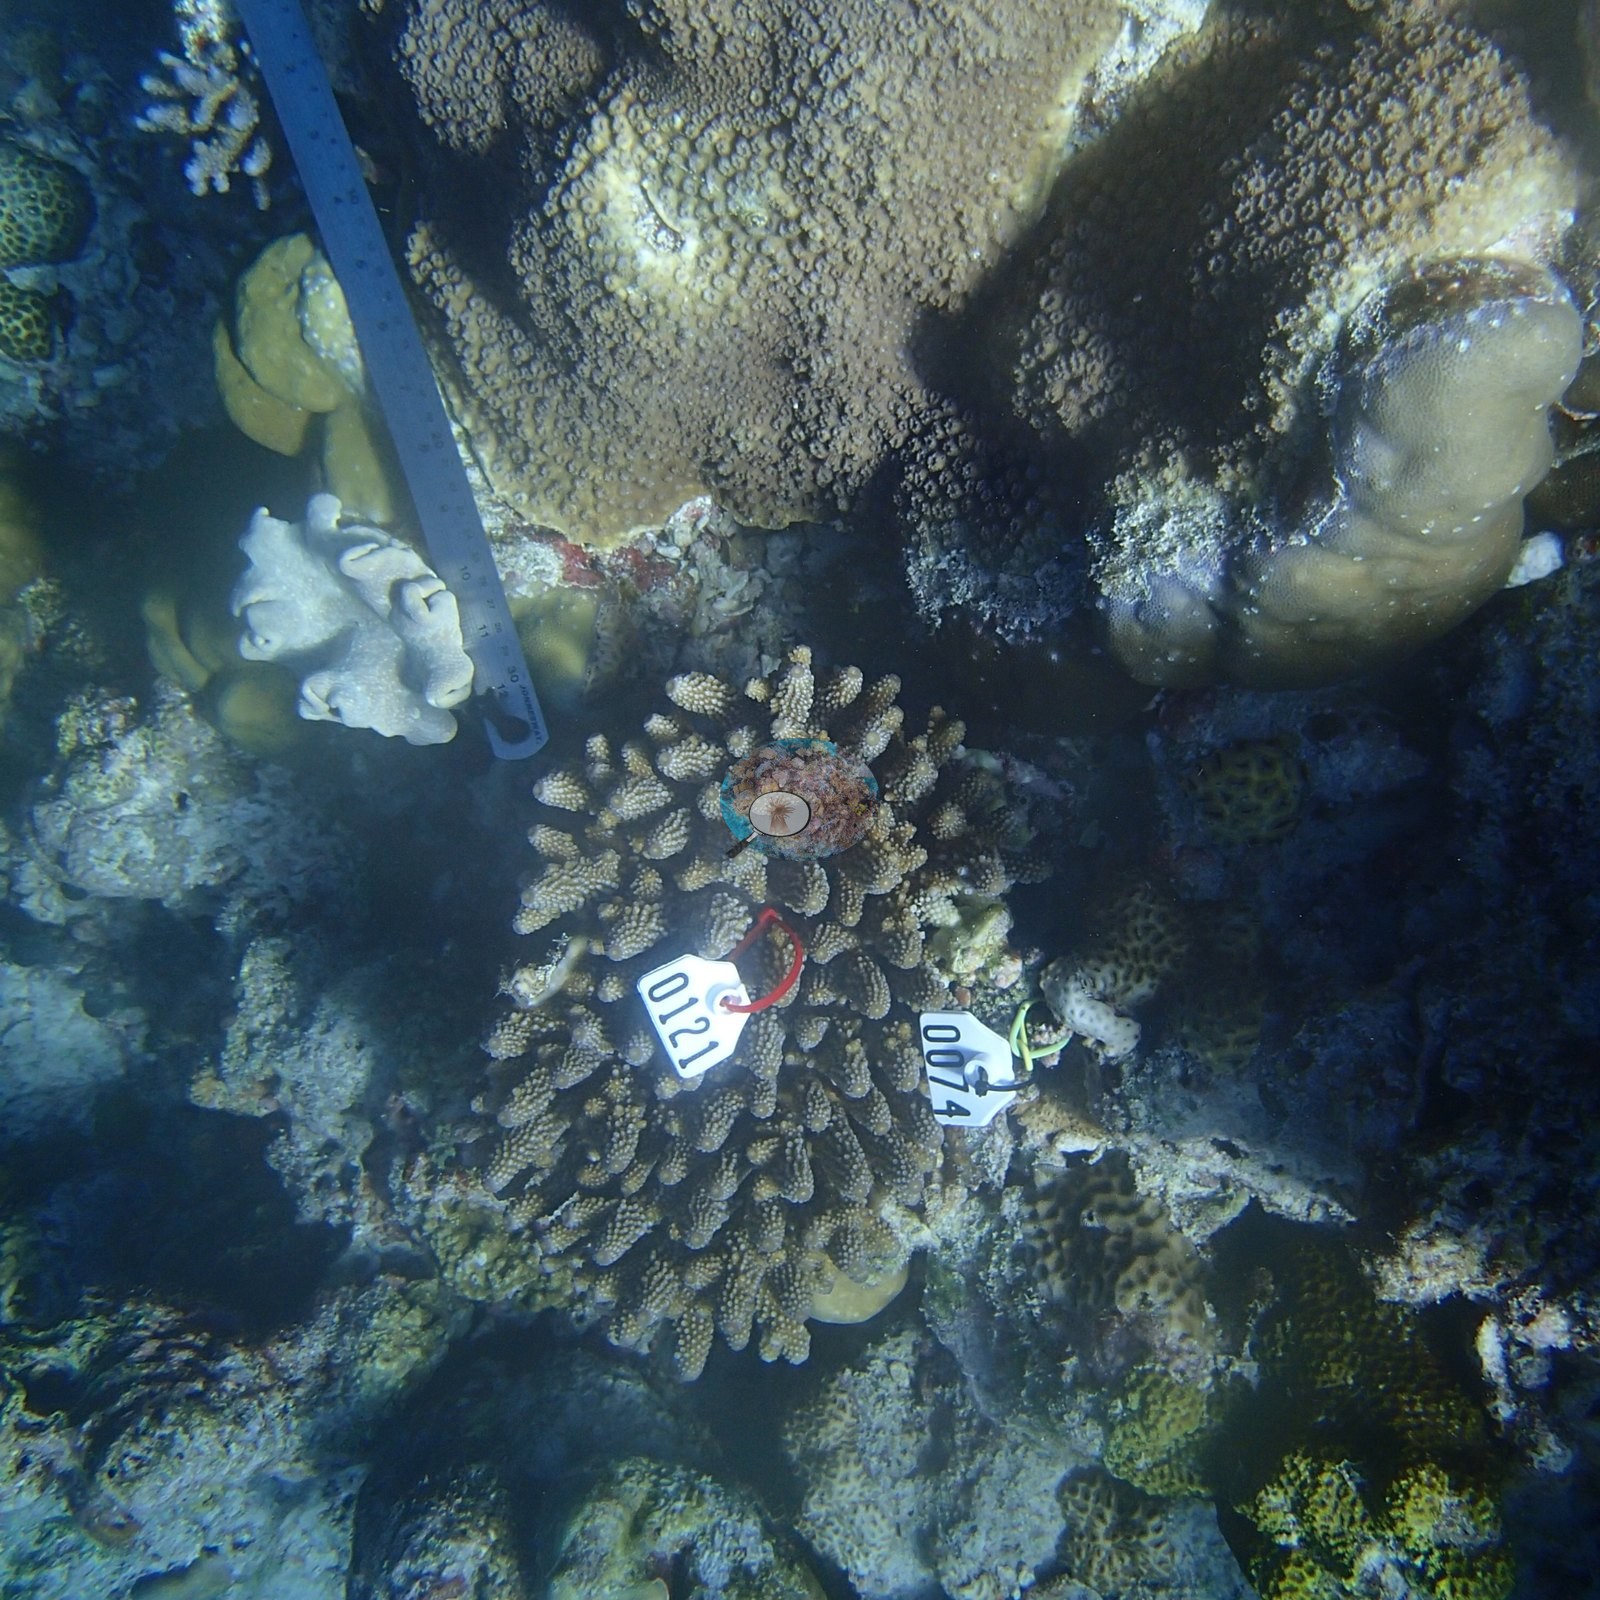
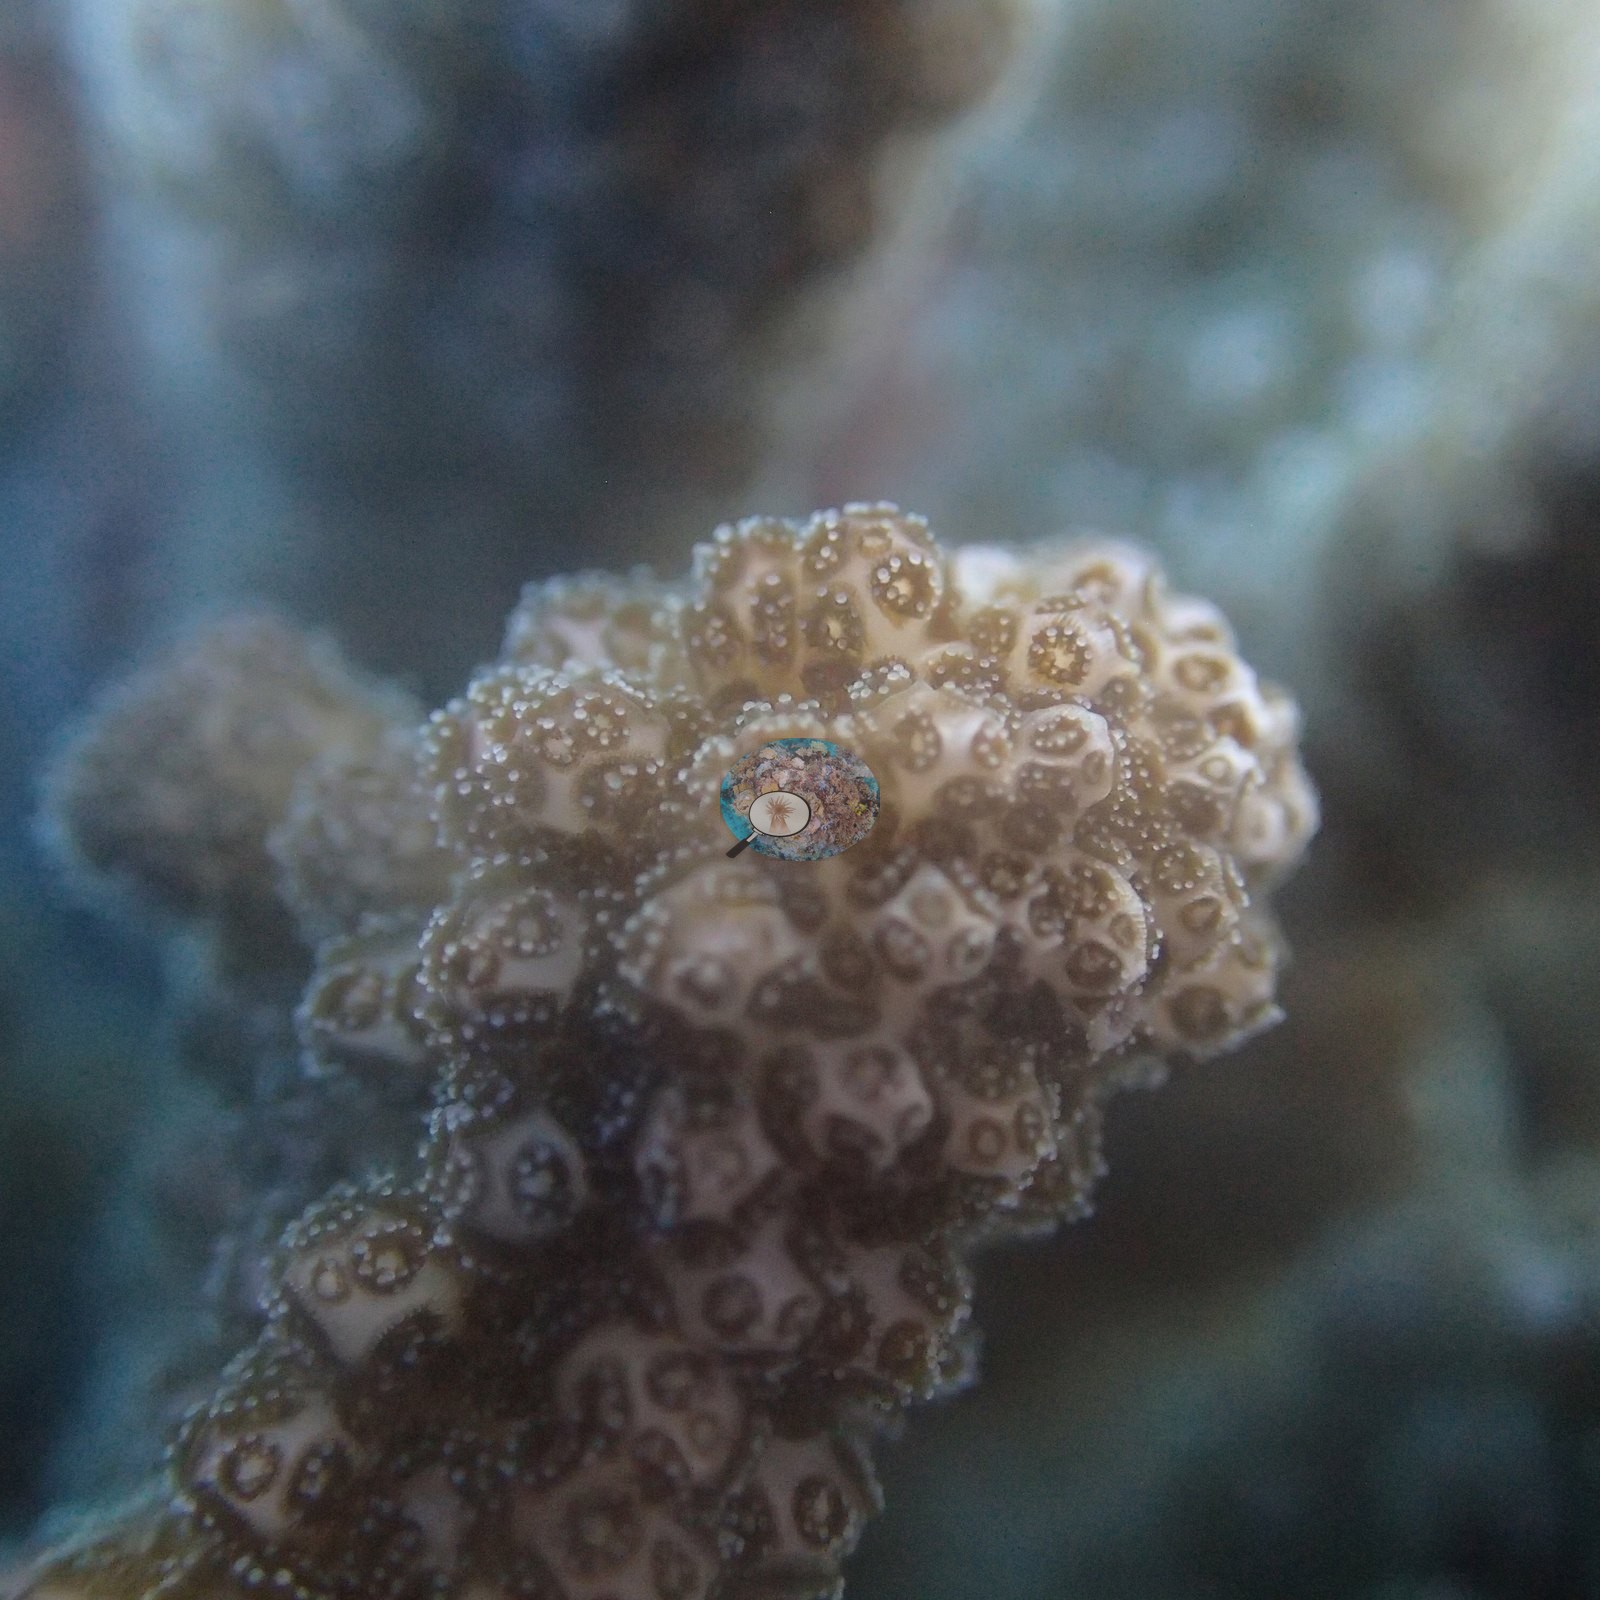
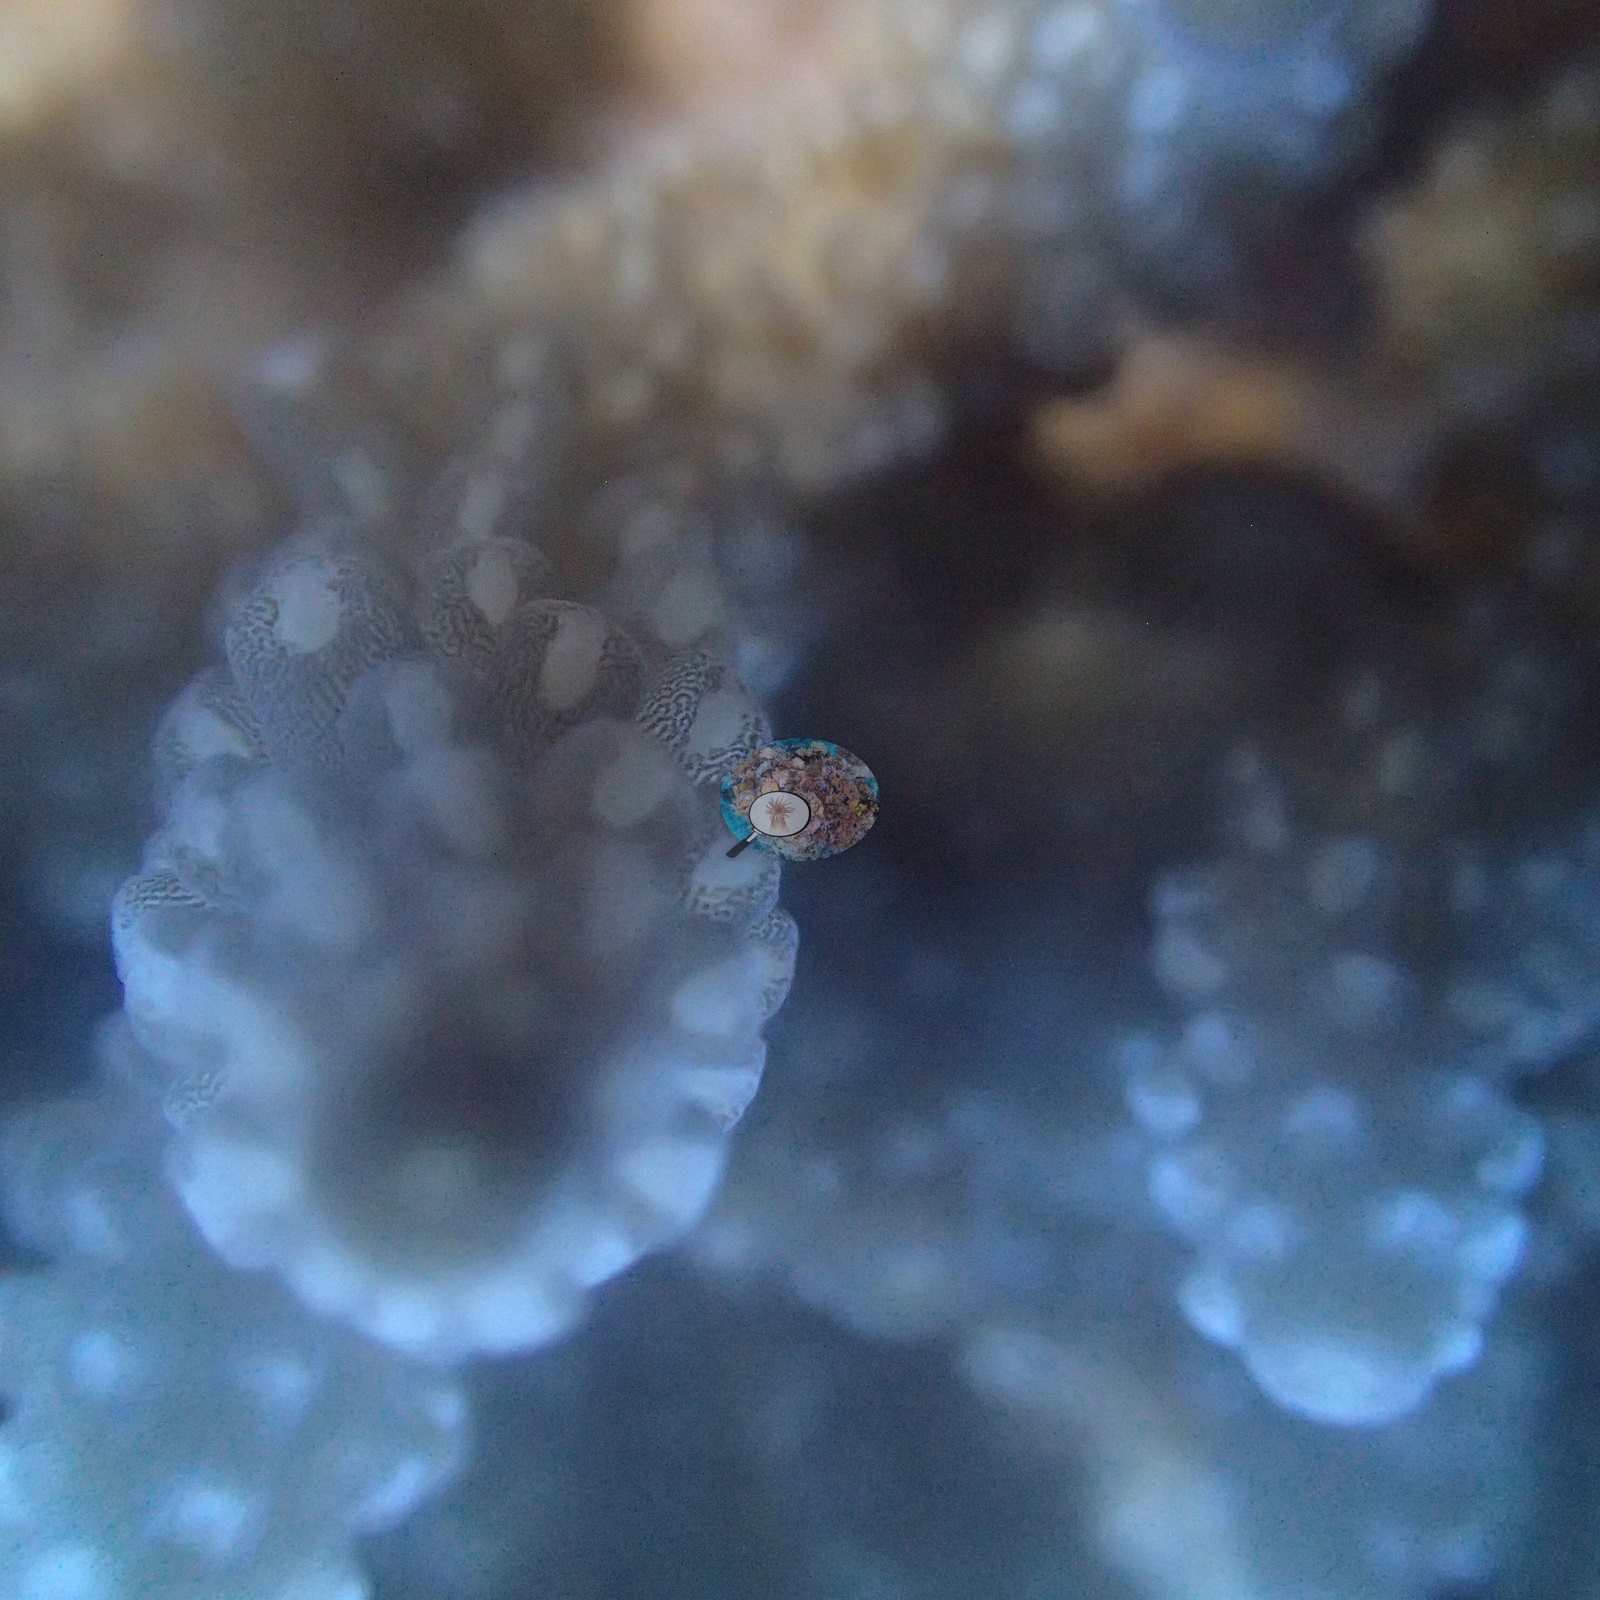
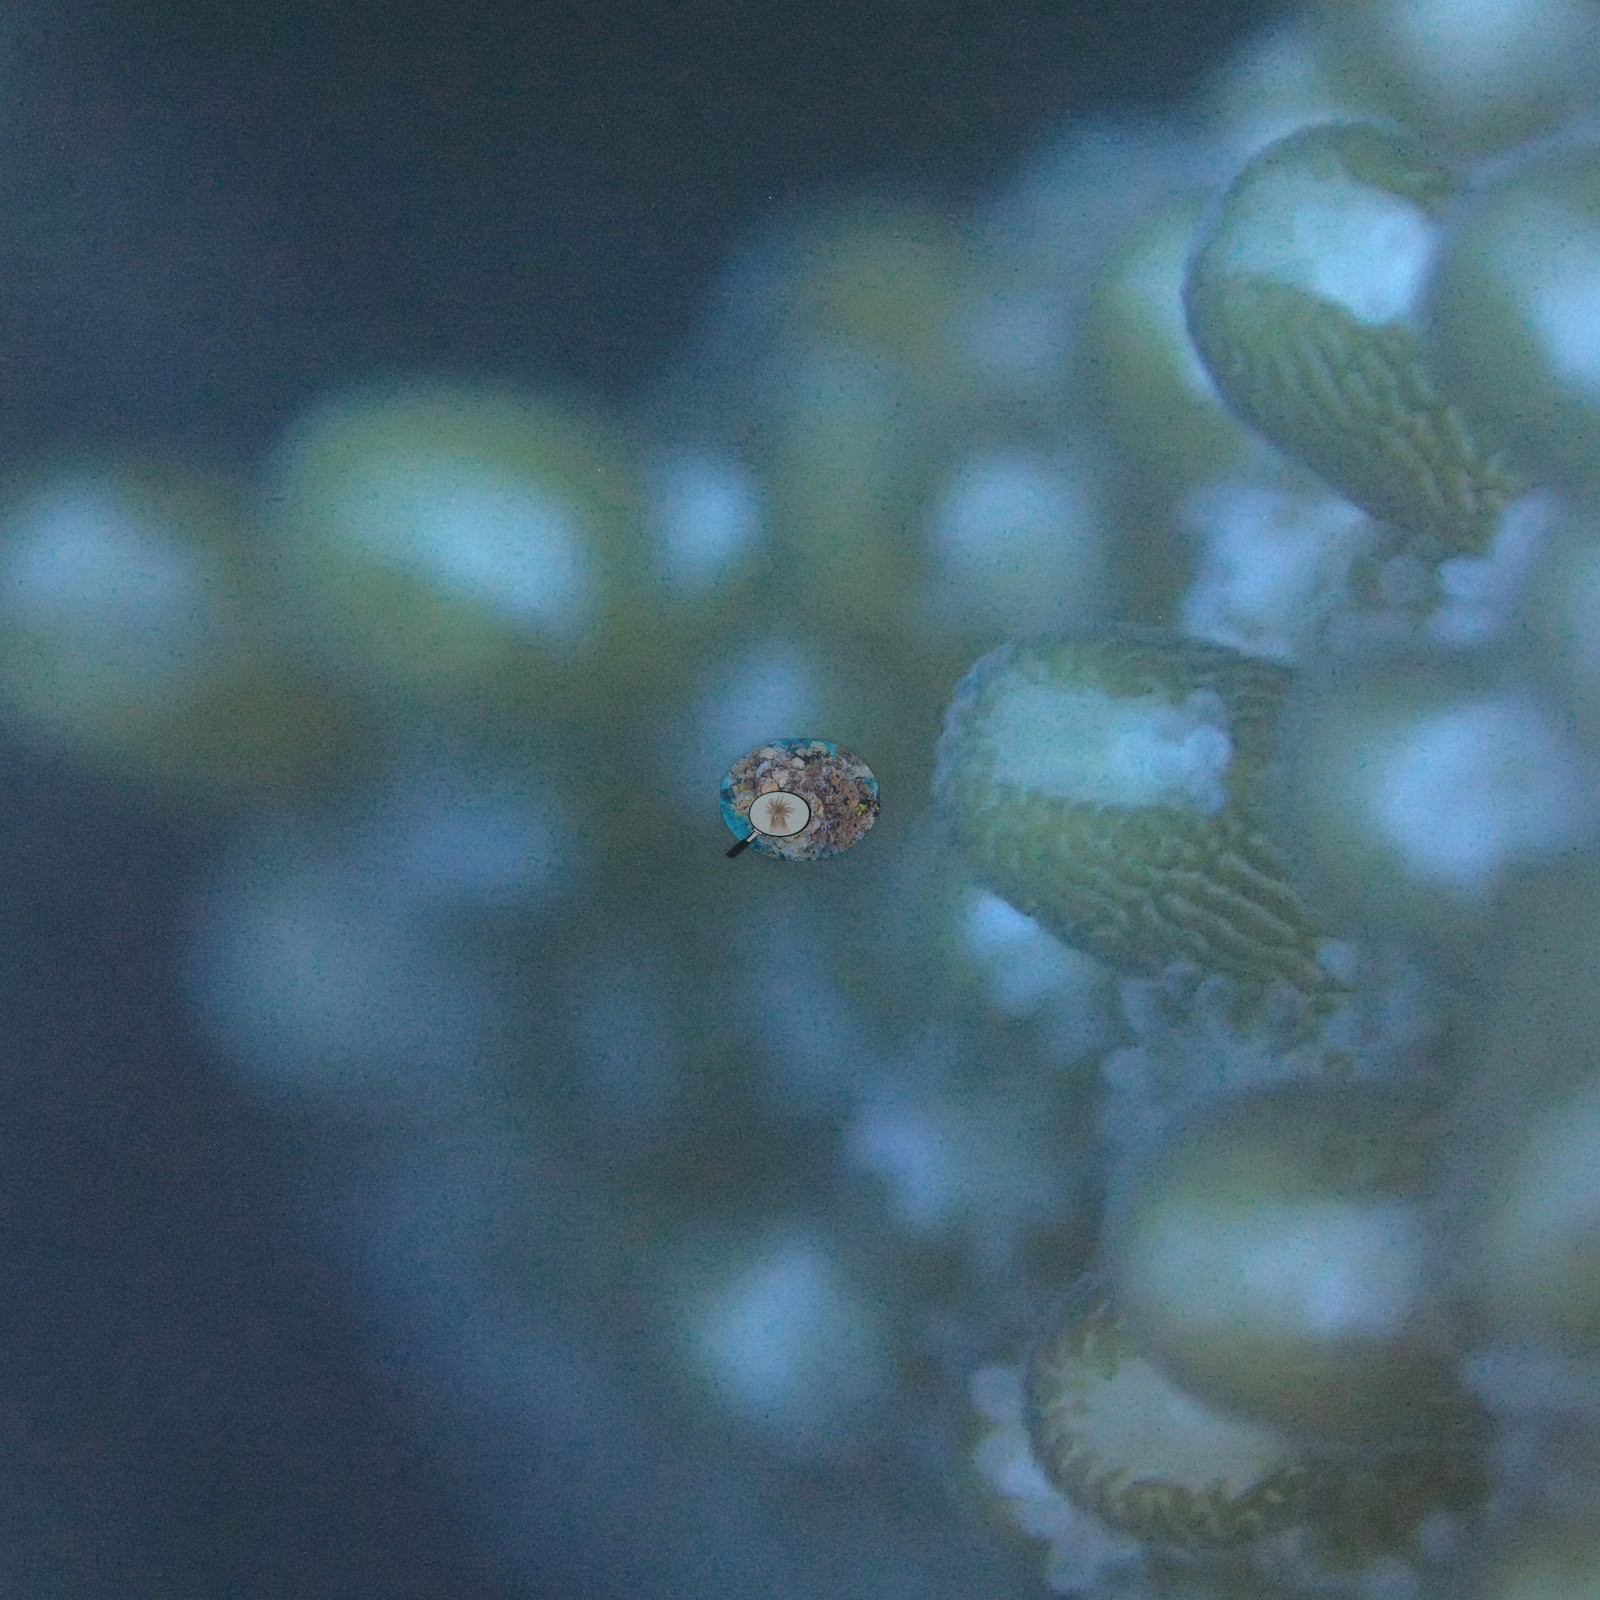
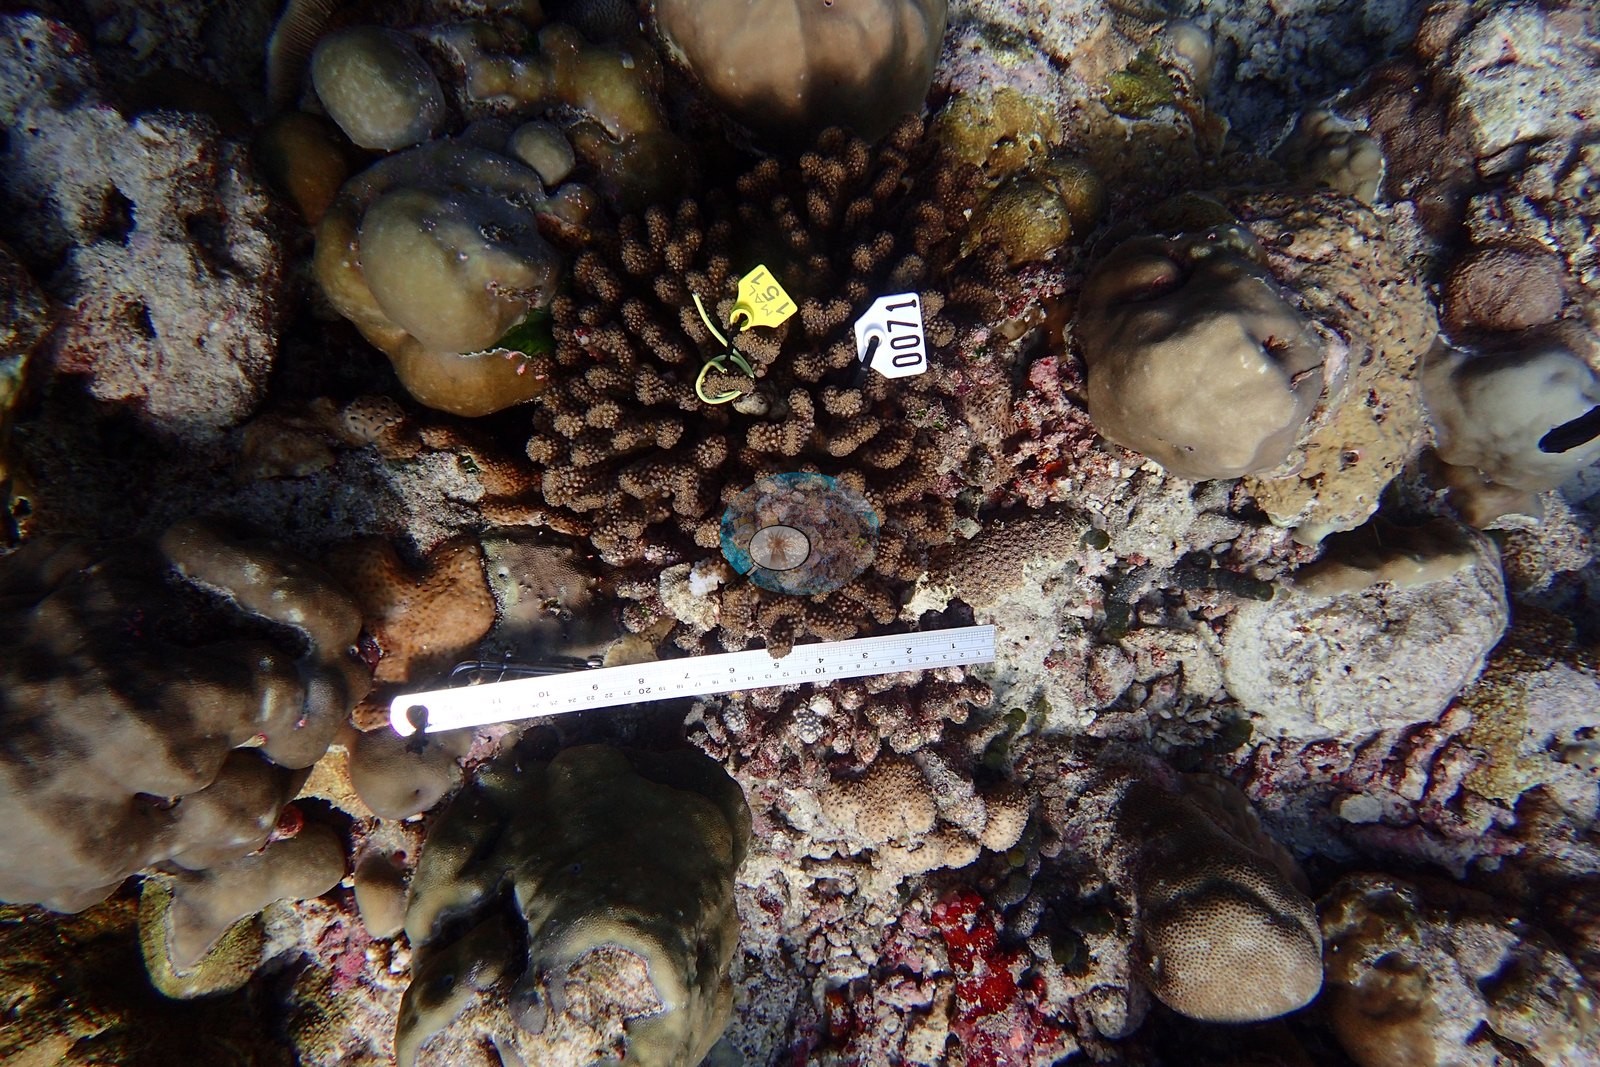
Site 10, the last of the run: a gently sloping field of Porites domes and bommies some the size of armchairs, leather corals crowning the gaps, a lone table Acropora, and — the first hint of trouble at any of the five sites — scattered bone-white branch tips among the tagged colonies (e.g., Image 1, Image 3, Image 4, Image 6, Image 7, Image 8, Image 9, Image 14, Image 20, Image 21, Image 22, Image 23, Image 24, Image 25).
Coral cover
Coral cover: 27% — photo-derived, from two computer vision methods. The figure is the mean of a DINOv3 calibrated point classifier and a CoralSCOP computer vision run over Anderson's own frames from this site. The site record does not carry the two individual method values, so the spread between them cannot be shown here; where both are recorded elsewhere on this map they routinely differ by 3-19 percentage points. Anderson keeps an eye out for newer CV models and will refresh this CoralSCOP and DINOv3 figure once a more trustworthy option is available.
Stressors
All three were tagged-and-measured monitoring work, photographed roughly three months before the 2016 El Niño bleached the vast majority of corals across Baa's study reefs. No crown-of-thorns starfish (COTS) or other corallivores evident.
Comparisons with other data
No independent survey was made at this exact site; the nearest ones are listed in the table below.
Other notes
Three more January 2016 Baa Atoll research dives, parked here on the coarse atoll marker because the exact reefs (candidates include Kashidhoo Giri and Vinaneiy Faru, per Anderson's own bleaching spreadsheet) couldn't be geocoded from any public source — not necessarily Hanifaru itself.
Coral cover: method notes
Independent surveys nearby
 Dr. Coral (CRD)
Within 5 km, 1 independent survey station recorded hard coral cover in 4 surveys between 2011 and 2016. Of the 1 station surveyed in more than one year, 1 declined between their first and latest surveys. The longest record, Kendhoo (ReefCloud, 4.96 km away), went from 21% in 2011 to 13% in 2016. The most recent nearby survey is from 2016, so these values predate recent heat stress. This site's own estimate (27%) is indistinguishable from the range of these surveys (13–21%): the 5.9-point gap is inside the ±7 percentage-point noise between methods; the methods differ, so the comparison is context, not a like-for-like test.
Collected by other programs using different methods, so these are context for the figures above, not a like-for-like comparison. Where a station was surveyed more than once the range is shown. Station names are not dive-site names.
| Agency | Site / location | Date | Hard coral cover (%) | Distance | Link |
|---|---|---|---|---|---|
| ReefCloud | Kendhoo | 2011–2016 | 13–21% (4 surveys) | 4.96 km | HeatCRD database |
Data & links
All images from Coral Reef Diagnostics. Data are from Coral Reef Diagnostics and the organizations named in the data-sources table above.
© Coral Reef Diagnostics.