i 5-year mean max. DHW is the mean of the annual maximum DHWs over the five complete years named above, not conditions today. More infoSoutheast Florida (NOAA CRW virtual station)
Photographs
86
7 shown on this page
Site summary
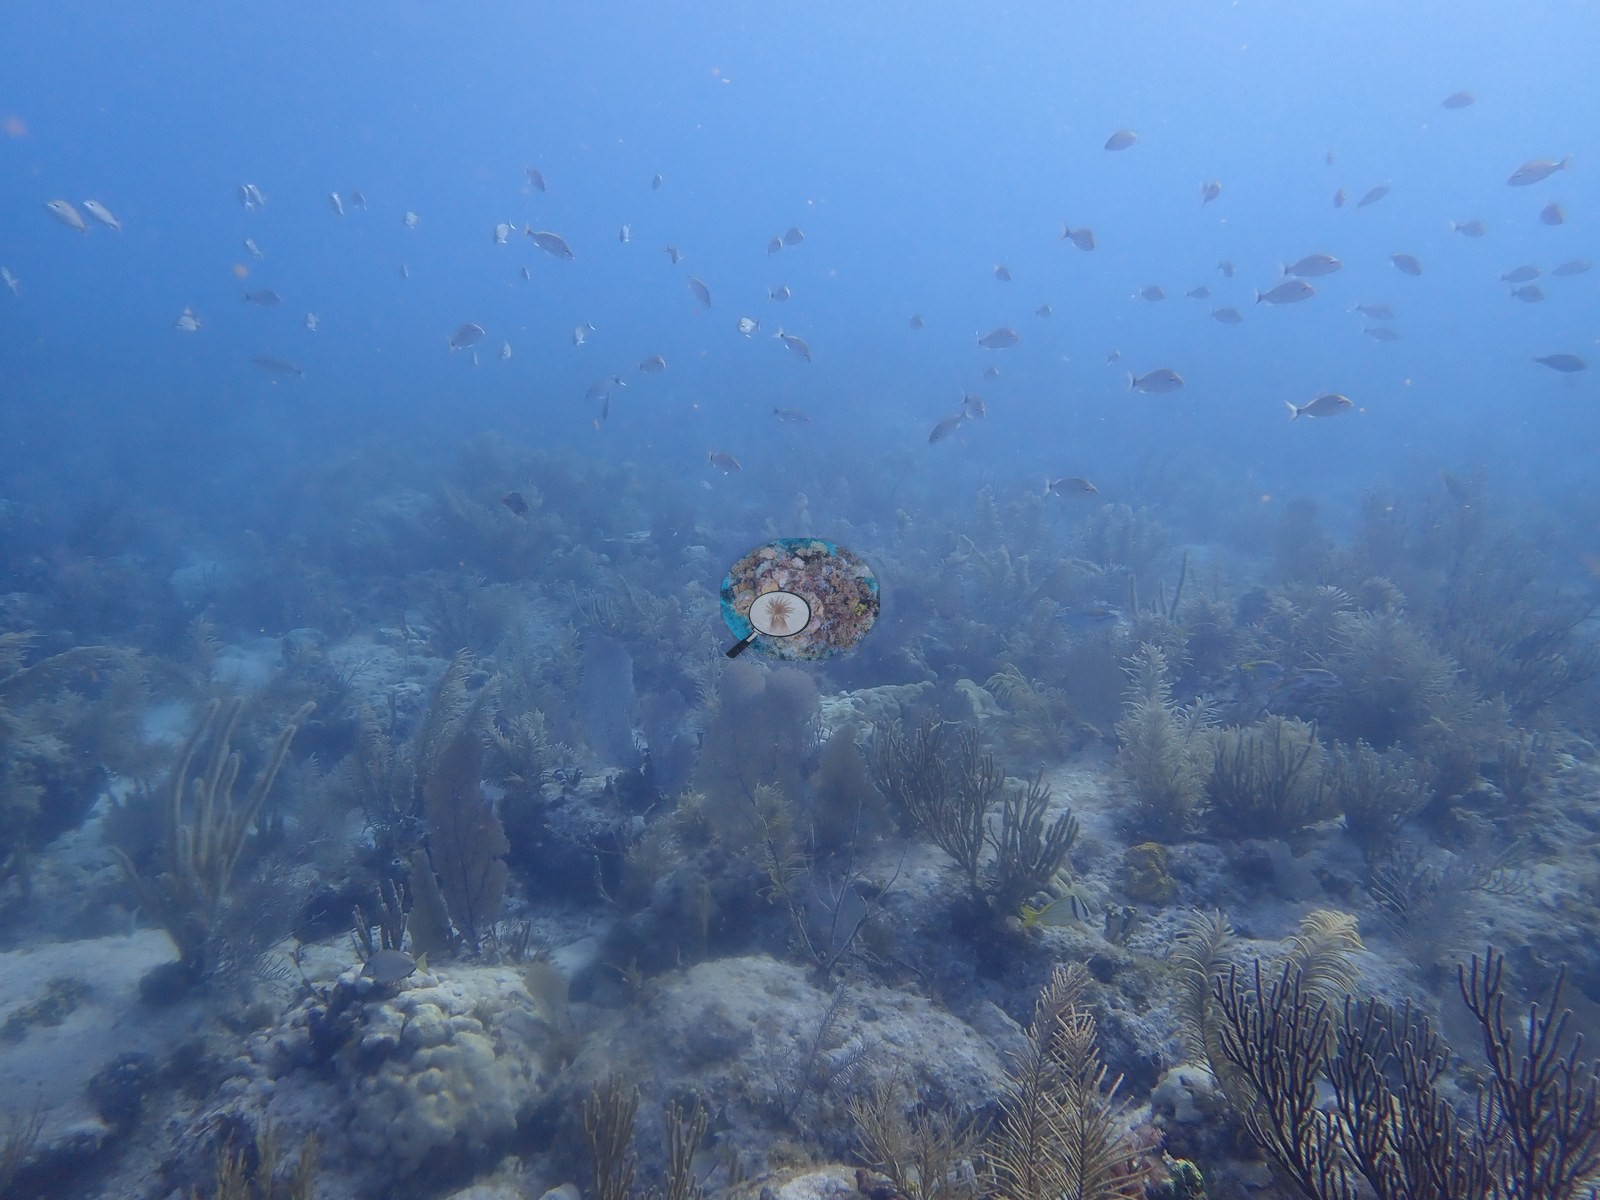
Emerald Reef, a shallow patch reef a mile off Key Biscayne, is the clean-water yardstick for the Urban Corals study, with clear blue water over a low limestone pavement carpeted in sea plumes, sea rods, and purple sea fans. Scattered star and brain corals, some tagged for condition scoring, share the meadow with outplanted staghorn and nursery-reared corals, and a large green moray patrols the sand.
Max. depth dived
9.8 m
deepest of 7 logged dives
Water temp. during survey
27.0–30.4°C
Logged water temperatures of the 7 dives at this site, May 2019 to May 2021 (dive log).
Seventeen independent survey stations shown with the program’s logo — click one to see how far it is from this site.
Five other CRD dive sites with their own pages within 5 km shown in orange — click a marker to open its page.
5 of the 7 photographs on this page are shown beside the text that discusses them under "Site description" below.
Emerald Reef sits offshore of Key Biscayne, and it is the yardstick for the whole Urban Corals study — the clean-water comparison against the corals scraping a living off Miami's causeways and seawalls. The difference is obvious the moment you drop in: blue water, sunlight reaching the bottom, no film of sediment on anything. It is a shallow patch reef about 1 mile east of Key Biscayne, the site of the University of Miami's urban-coral restoration work.
General benthic features
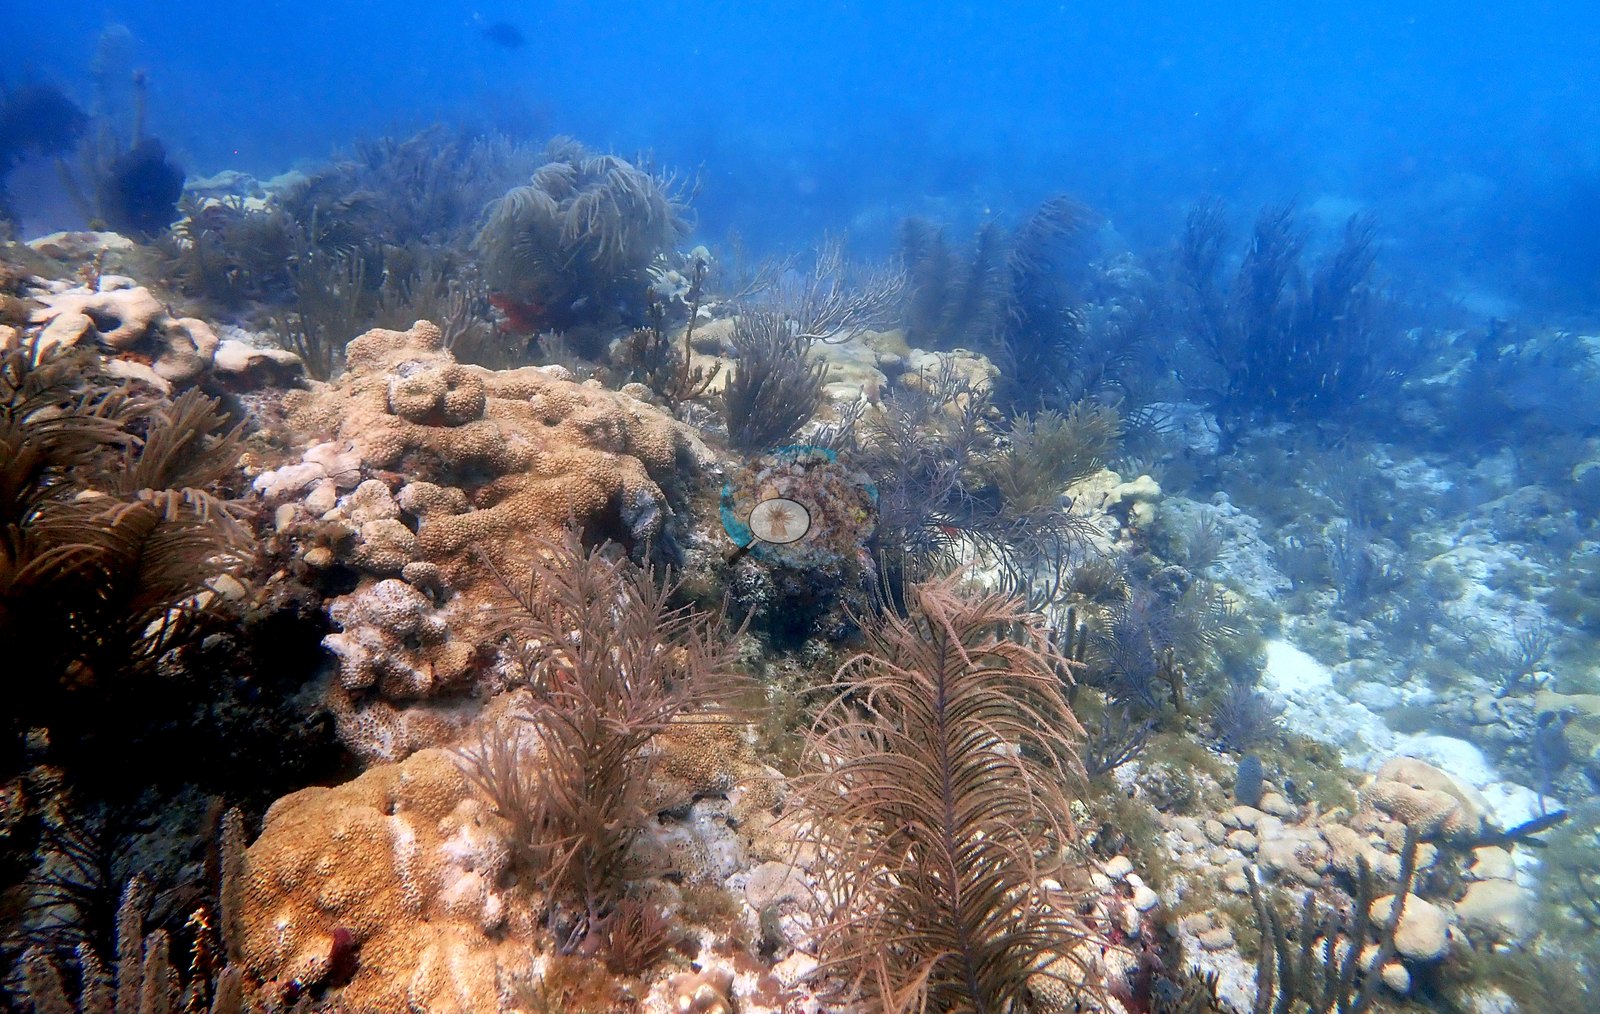
The reef itself is a low limestone pavement rather than a towering structure, and most of what moves is octocoral — a waist-deep meadow of sea plumes and sea rods with purple sea fans standing above it (e.g., Image 5).
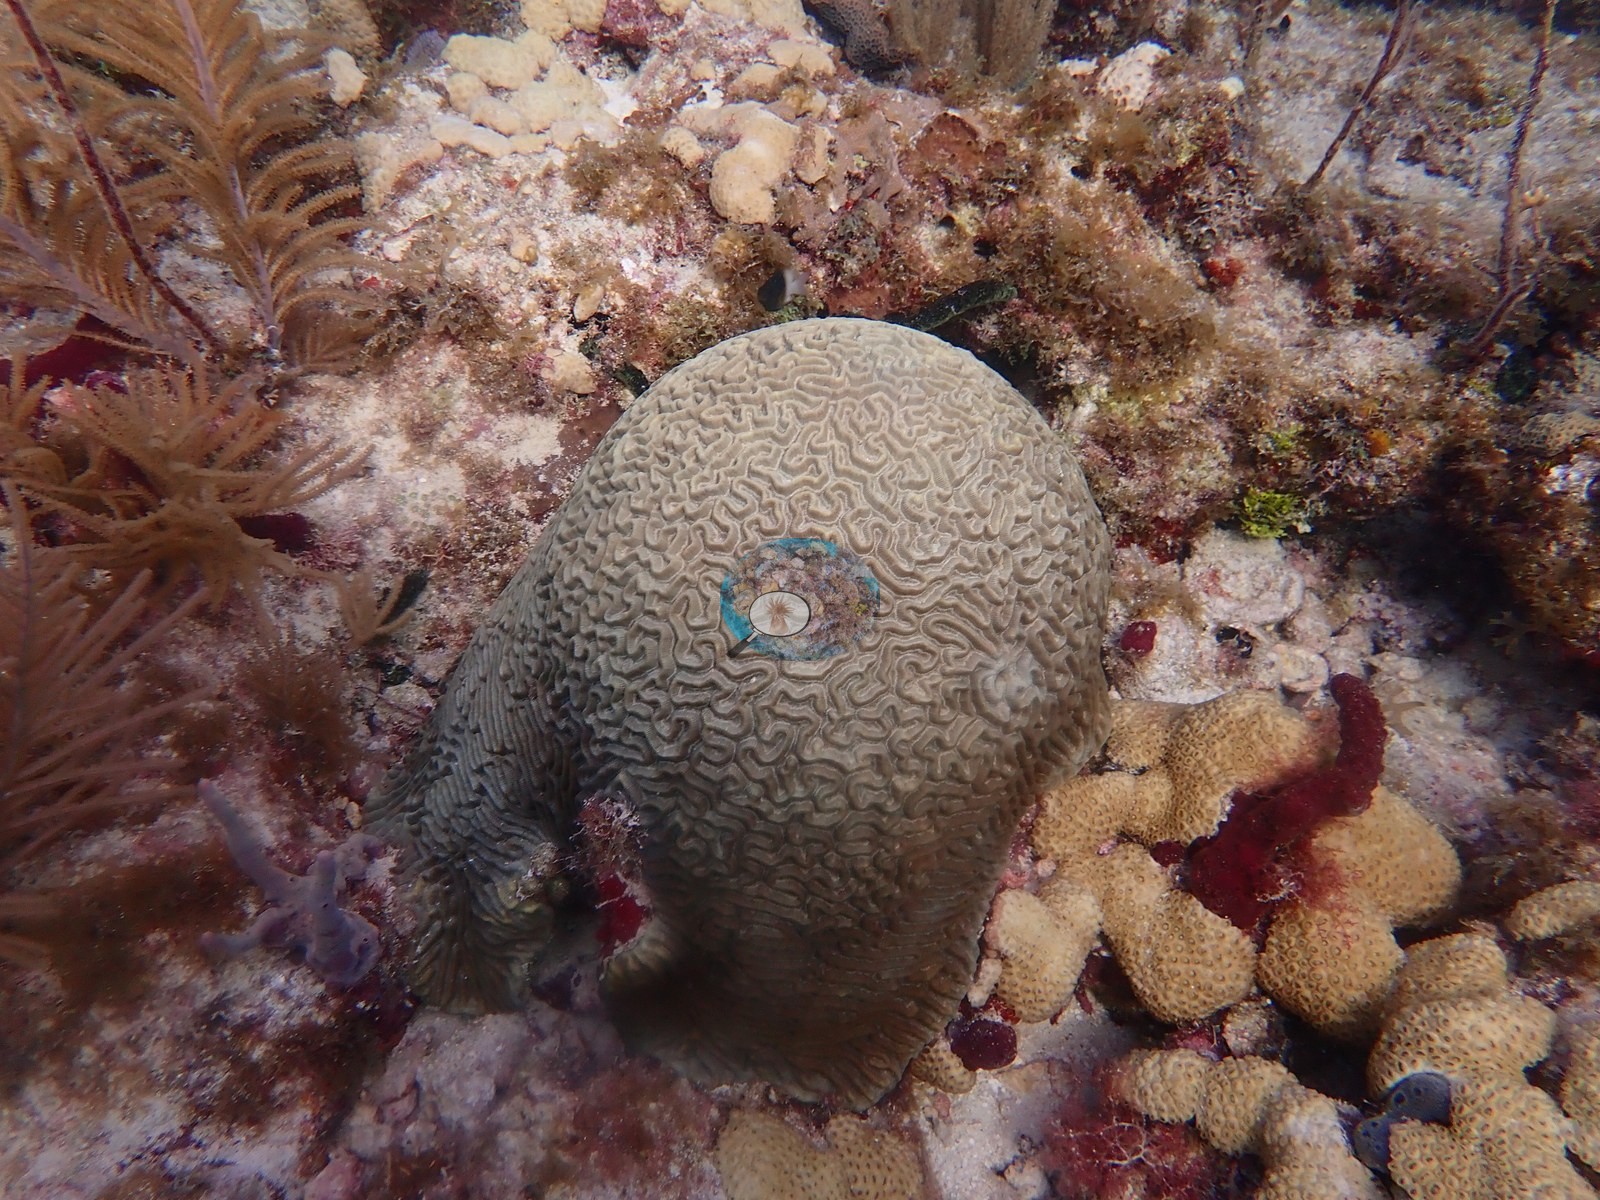
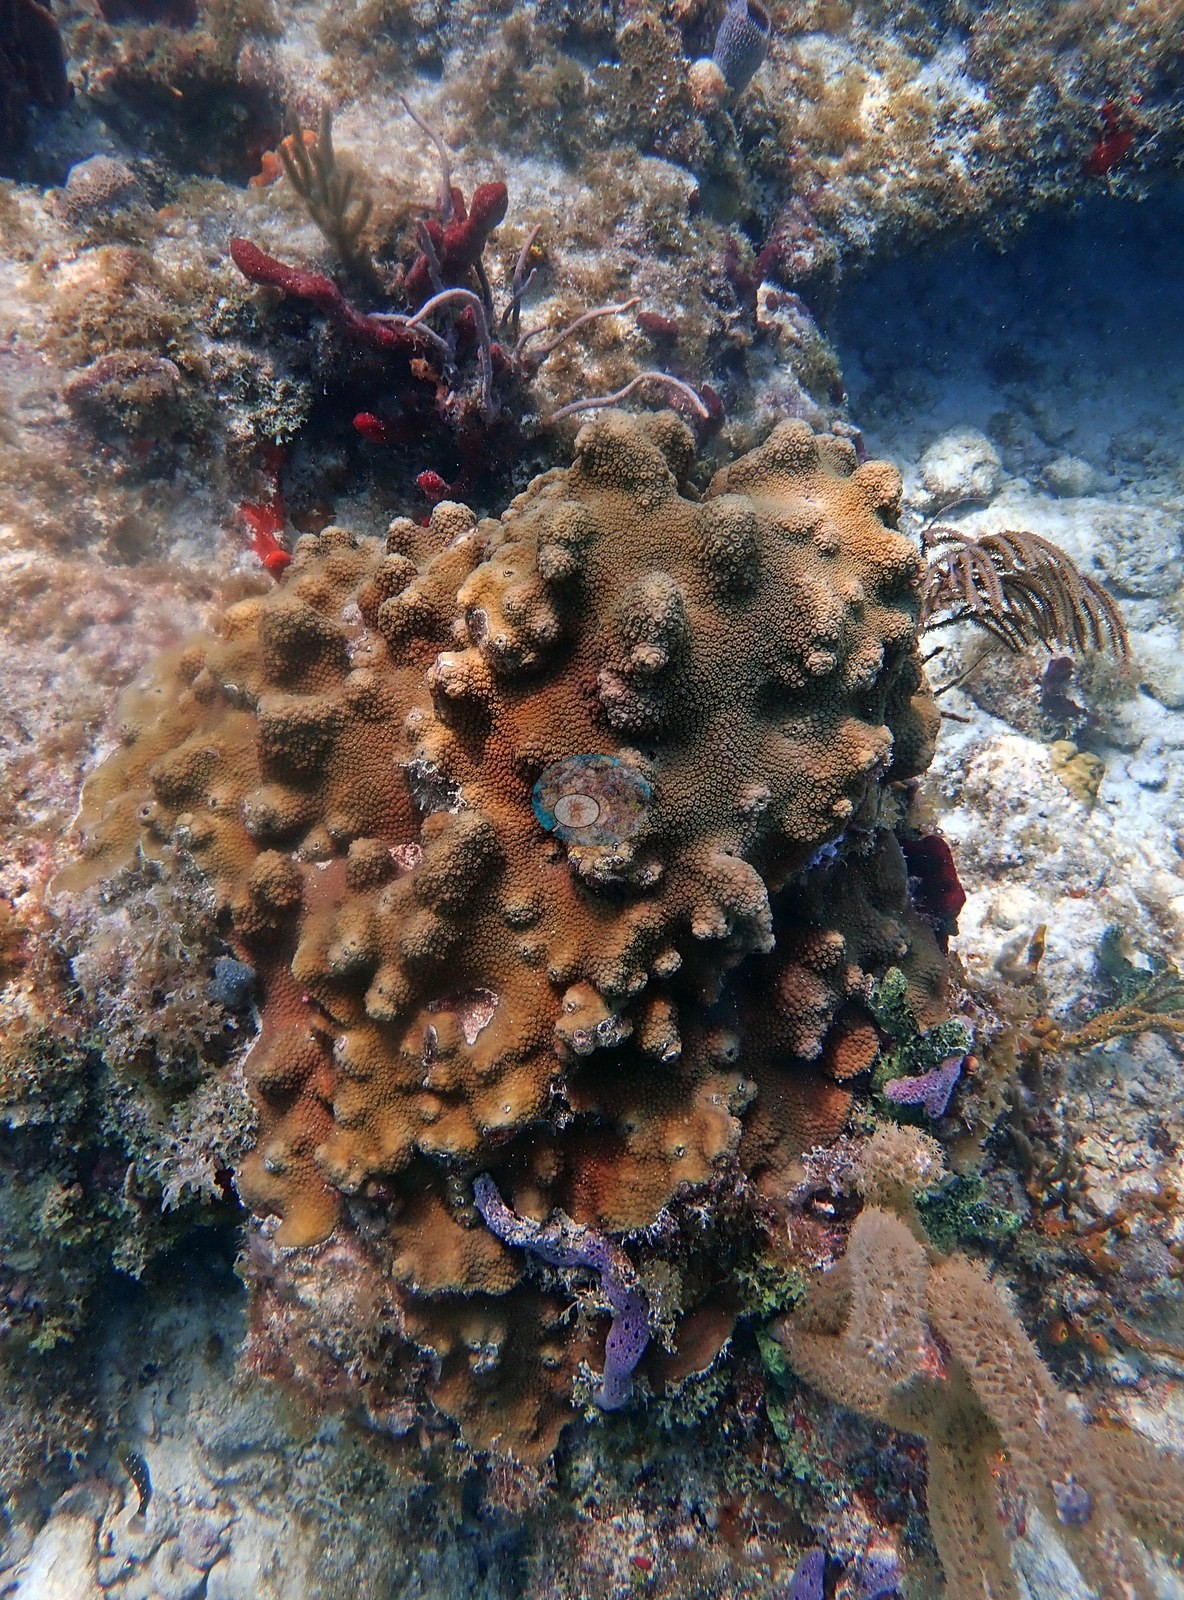
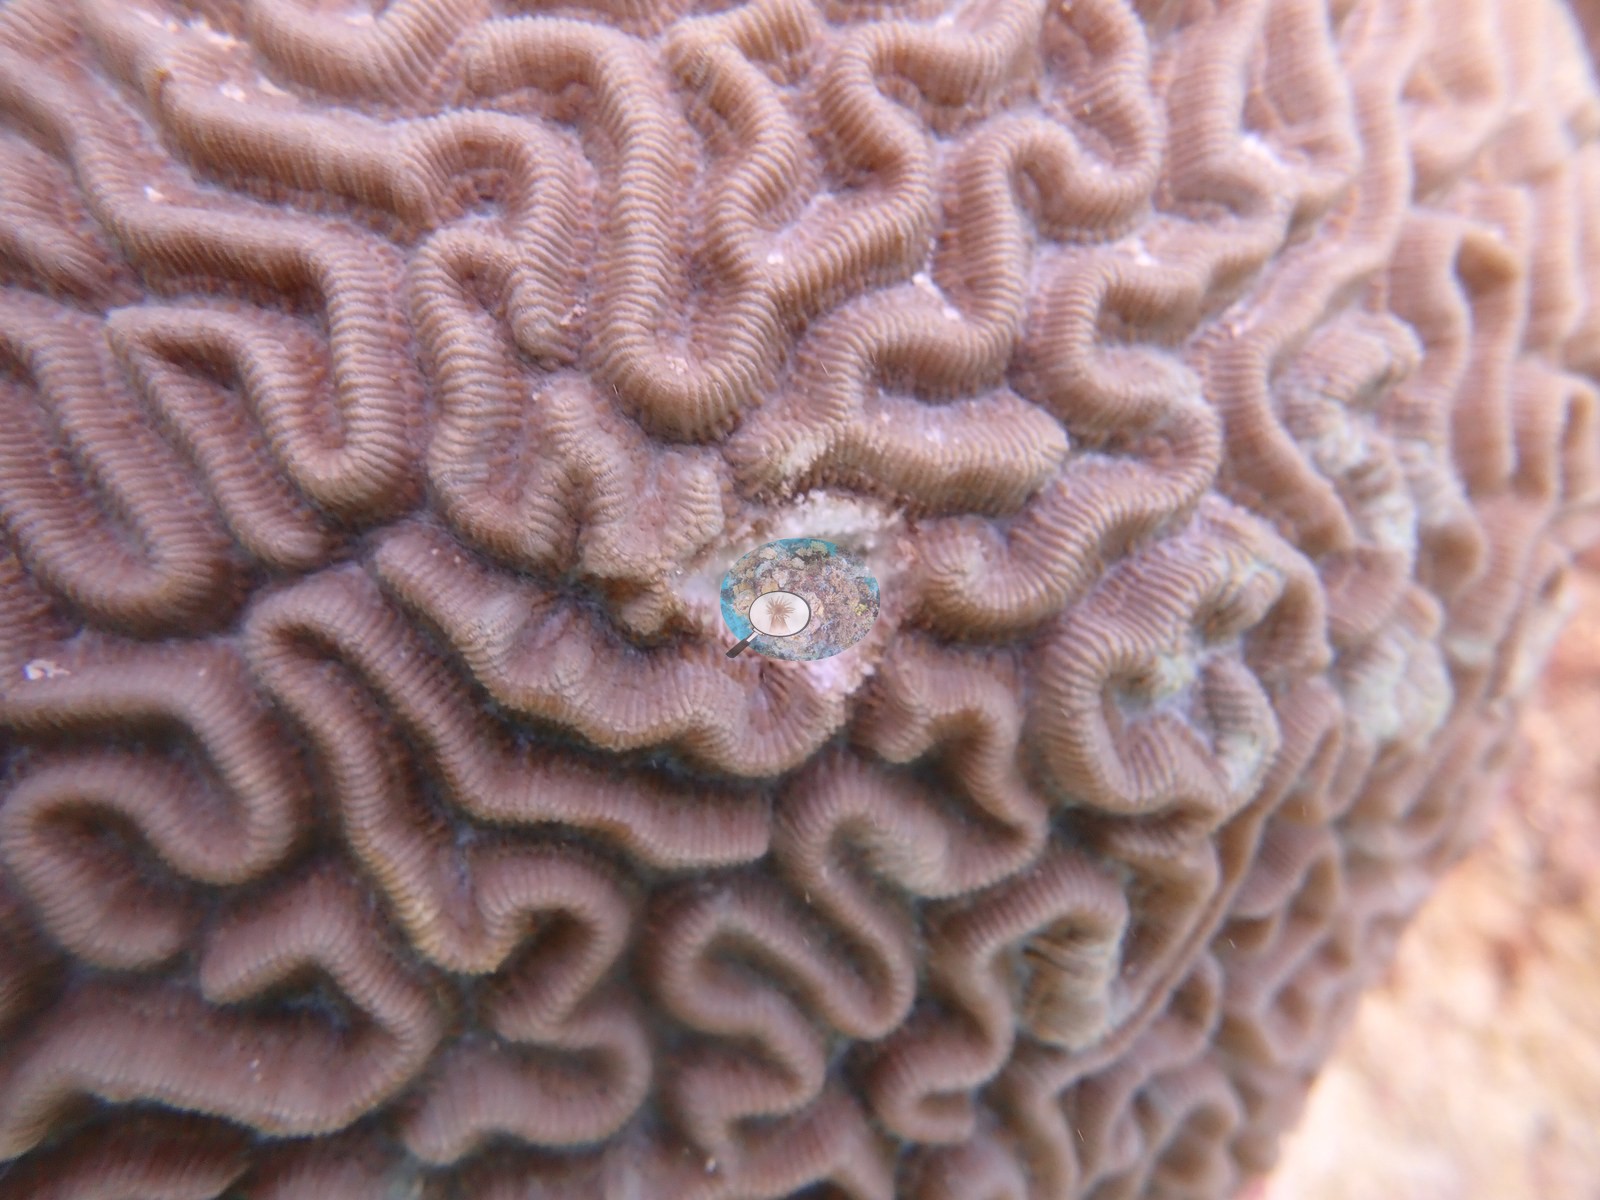
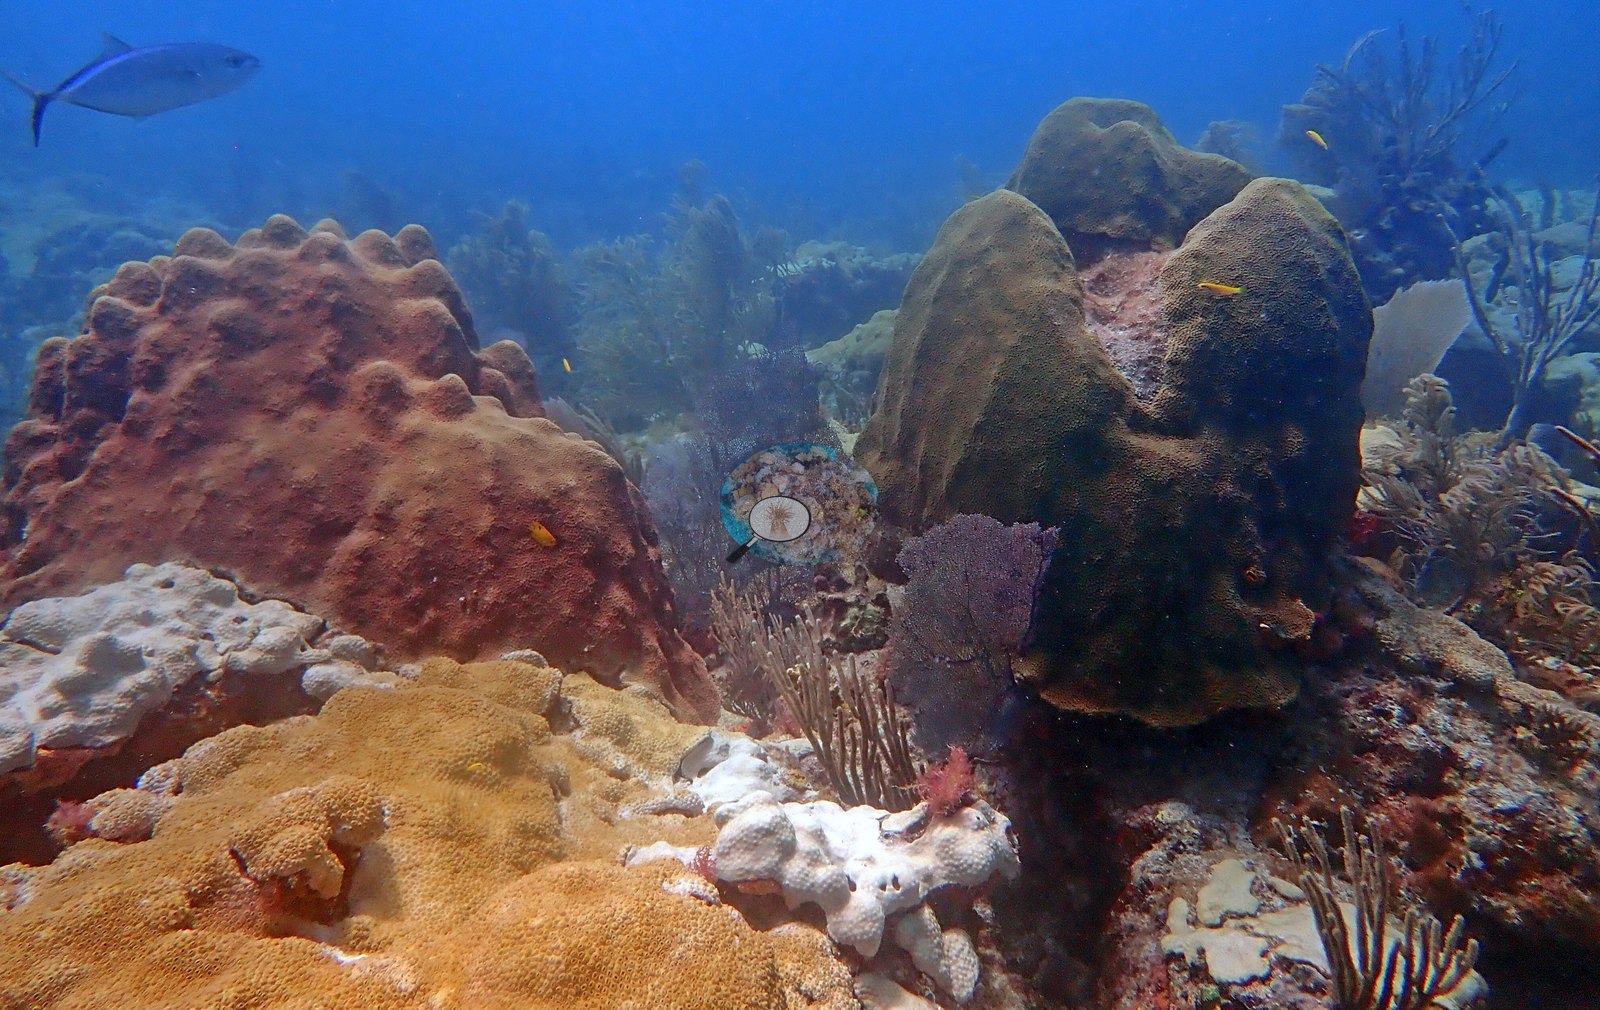
The stony corals are scattered heads in that meadow: boulder-forming star corals (e.g., Image 3), and ten tagged brain corals, each photographed beside a dive slate for condition scoring (tag close-up, Image 2).
Look closely and you'll also find outplanted staghorn and nursery-reared starlet corals, plus one very large green moray patrolling the open sand.
Coral cover
Reference: Claude CV point count (this site's photos)
Coral cover: 12% — a blind Claude computer-vision point count of 50 of Anderson's edited photographs (20 points per photo; water, fish, and obstructions excluded). Other computer-vision methods are listed in the method table.
Stressors
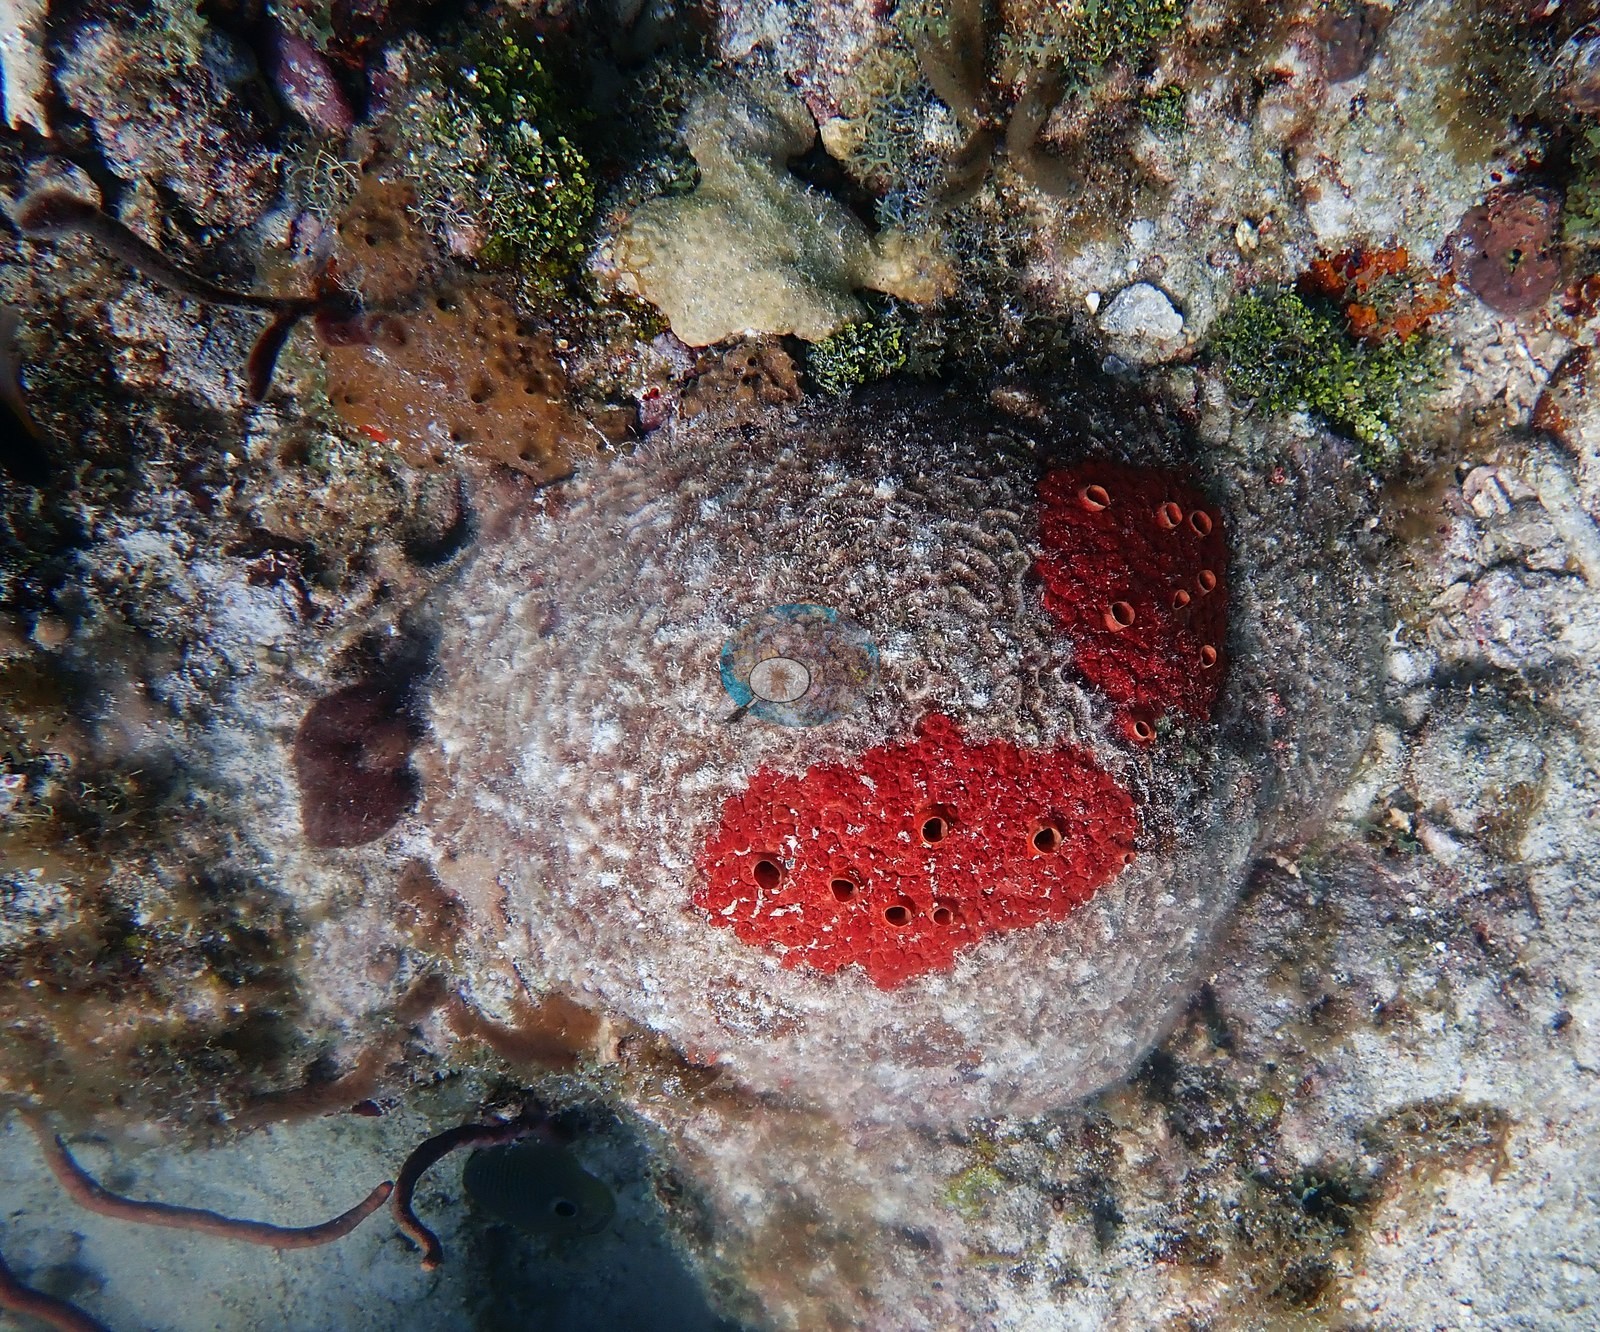
In May 2021, zoanthid (Palythoa) carpets spread over parts of the framework (e.g., Image 6), and one white lobed mass among them is bleachedPalythoa (e.g., Image 7).
Perry et al. (2018) surveyed this site (Emerald Reef) in September 2014, 0.14 km from the pin. Within 5 km, seventeen independent stations recorded station-year means of 0.1–5.8% hard coral cover between 2004 and 2024; the nearest of these, Lirman et al. (2007) at Key Biscayne, 0.66 km away, read 1.4% in 2004.
CV model comparison
Mean 12%, median 5.4% across 50 photos. More infoA few colony-focused photos raise the mean; the median is the typical photo. No computer-vision method yet estimates coral cover accurately on new images, so treat this as indicative rather than a measurement; it is revised as the methods improve.
Headline: Claude computer vision, a blind point count of this site's own photographs. More infoOther rows are for comparison only and are never averaged. No diver transect exists for these photos, so agreement between rows is not accuracy.
Method
Hard coral cover (%)
Photos (n) ± SE
CoralSCOP edited
33.9
n = 57
Claude (edited photos)
11.8
n = 50 · SE 2.0
CoralSCOP (edited photos) reads 33.9%, 22.1 pp above Claude's blind point count (11.8%); the headline stays Claude's blind point count because no transect or manual count exists here.
Hard coral cover over time — this site and every independent station within 5 km. Programs are shown separately because they use different methods at different stations; the lines are not one comparable series.
Within 5 km, 17 independent survey stations recorded hard coral cover in 173 records between 2004 and 2024. Of the 12 stations surveyed in more than one year, 10 declined (by 0.2–2.2 points) and 2 increased (by 0.2–0.5 points) between their first and latest surveys. 8 stations share the longest span (2010–2024); one, Dade County 4 #991 (FWCCREMP (Southeast Florida, SECREMP), 1.04 km away), went from 0.9% in 2010 to 1.1% in 2024. Since 2021, station-year means average 1.1% (range 0.1–3.0%; n = 51 station-years from 51 records). This site's own estimate (12%) sits 9.0 points above the recent range of station-year means up to 2 km away (0.2–3.0%); the methods differ, so the comparison is context, not a like-for-like test.
Collected by other programs using different methods (NOAA rows come from NOAA monitoring programs (NCRMP, PIFSC, NCCOS), and each row's method is in its hover text; FWC-FWRI uses fixed-station point counts), so these are context for the figures above, not a like-for-like comparison. Where a station was surveyed more than once, the cell shows either the range of its values or, as a single value, the mean of surveys made in one year. Station names are not dive-site names.
Lirman D, Gracias NR, Gintert BE, Gleason ACR, Reid RP, Negahdaripour S, et al. (2007). Development and application of a video-mosaic survey technology to document the status of coral reef communities. Environmental Monitoring and Assessment 125:59-73. DOI
Perry CT, Alvarez-Filip L, Graham NAJ, Mumby PJ, Wilson SK, Kench PS, et al. (2018). Loss of coral reef growth capacity to track future increases in sea level. Nature 558:396-400. DOI

 Coral Reef DiagnosticsYear-average (illustrative only, programs differ)