
Dominica - Champagne Reef

Part of the regional summary: Dominica
More info
Leeward Caribbean Islands (NOAA CRW virtual station) · Eastern Caribbean ecoregion mean: 13.1 degree heating weeksA Soufrière Bay reef famous for the volcanic gas bubbles that rise through it. Beyond that, the record holds only a computer-vision cover estimate and no habitat notes.
Eleven independent survey stations shown with the program’s logo — click one to see how far it is from this site.
Two other CRD dive sites within 5 km shown in orange — click a marker to open its page.
Site description
Setting
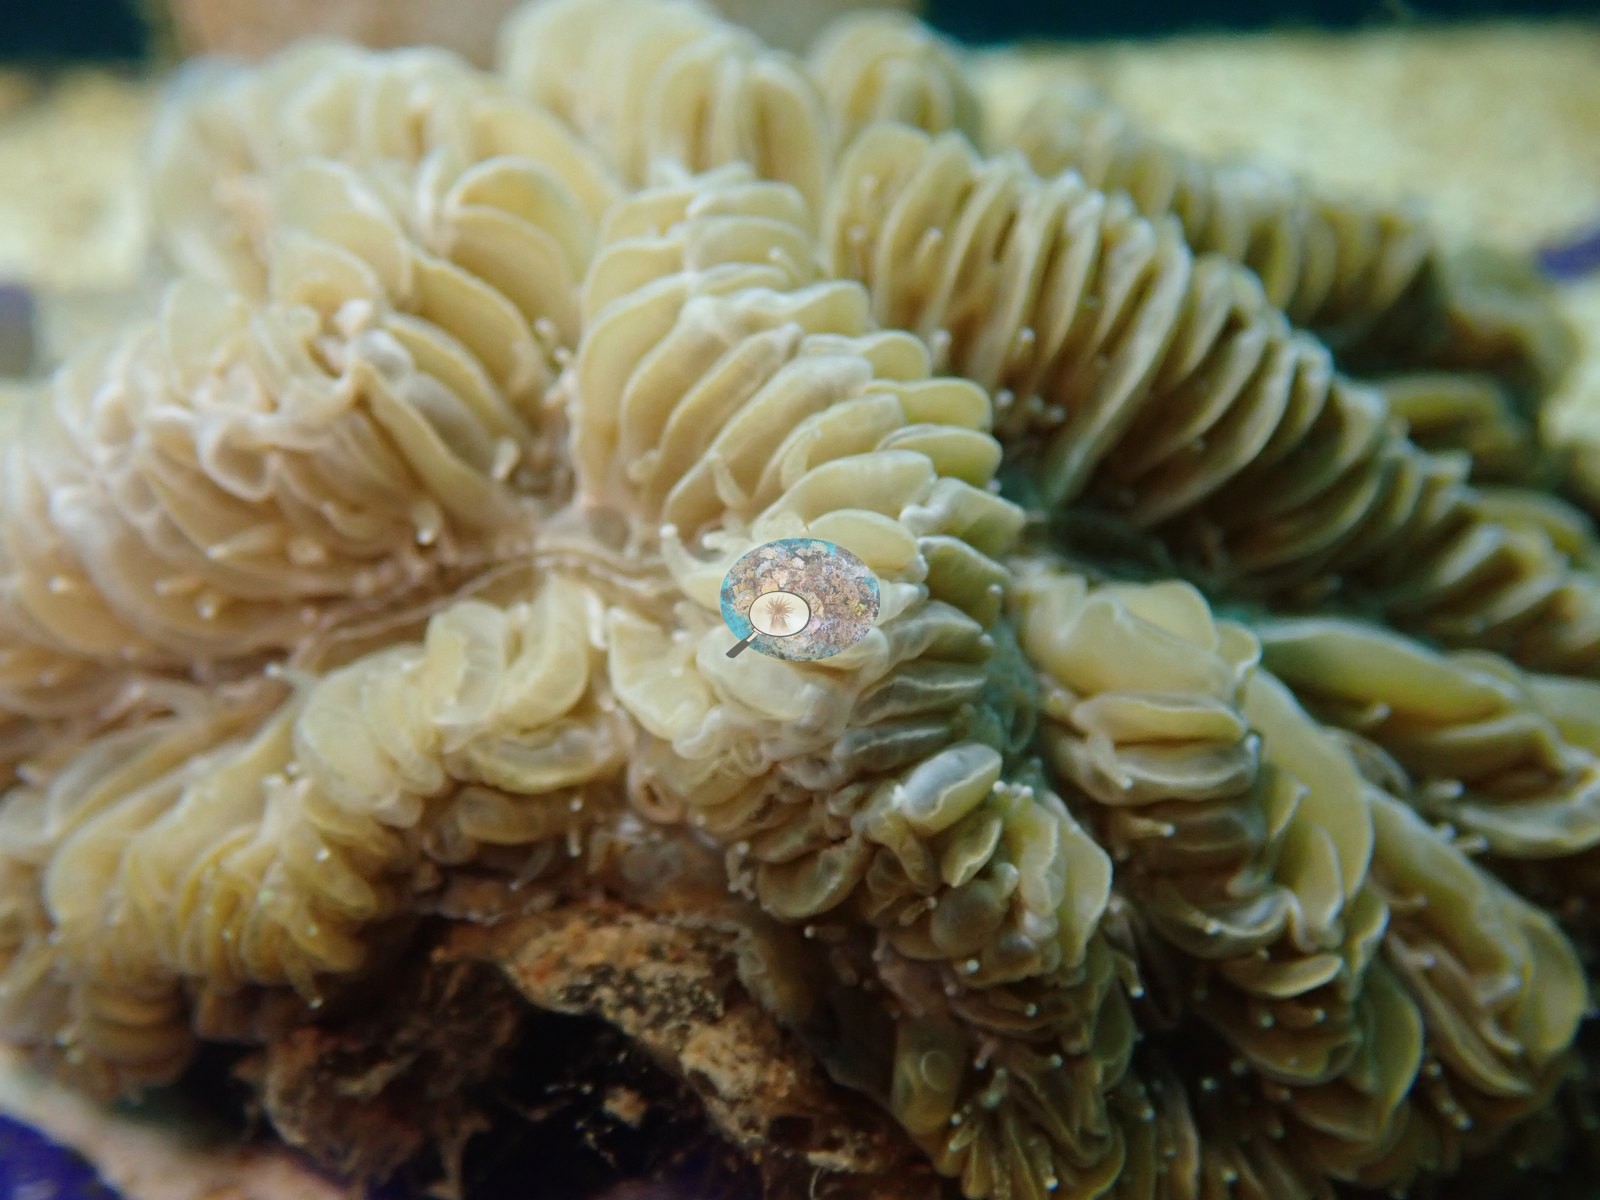
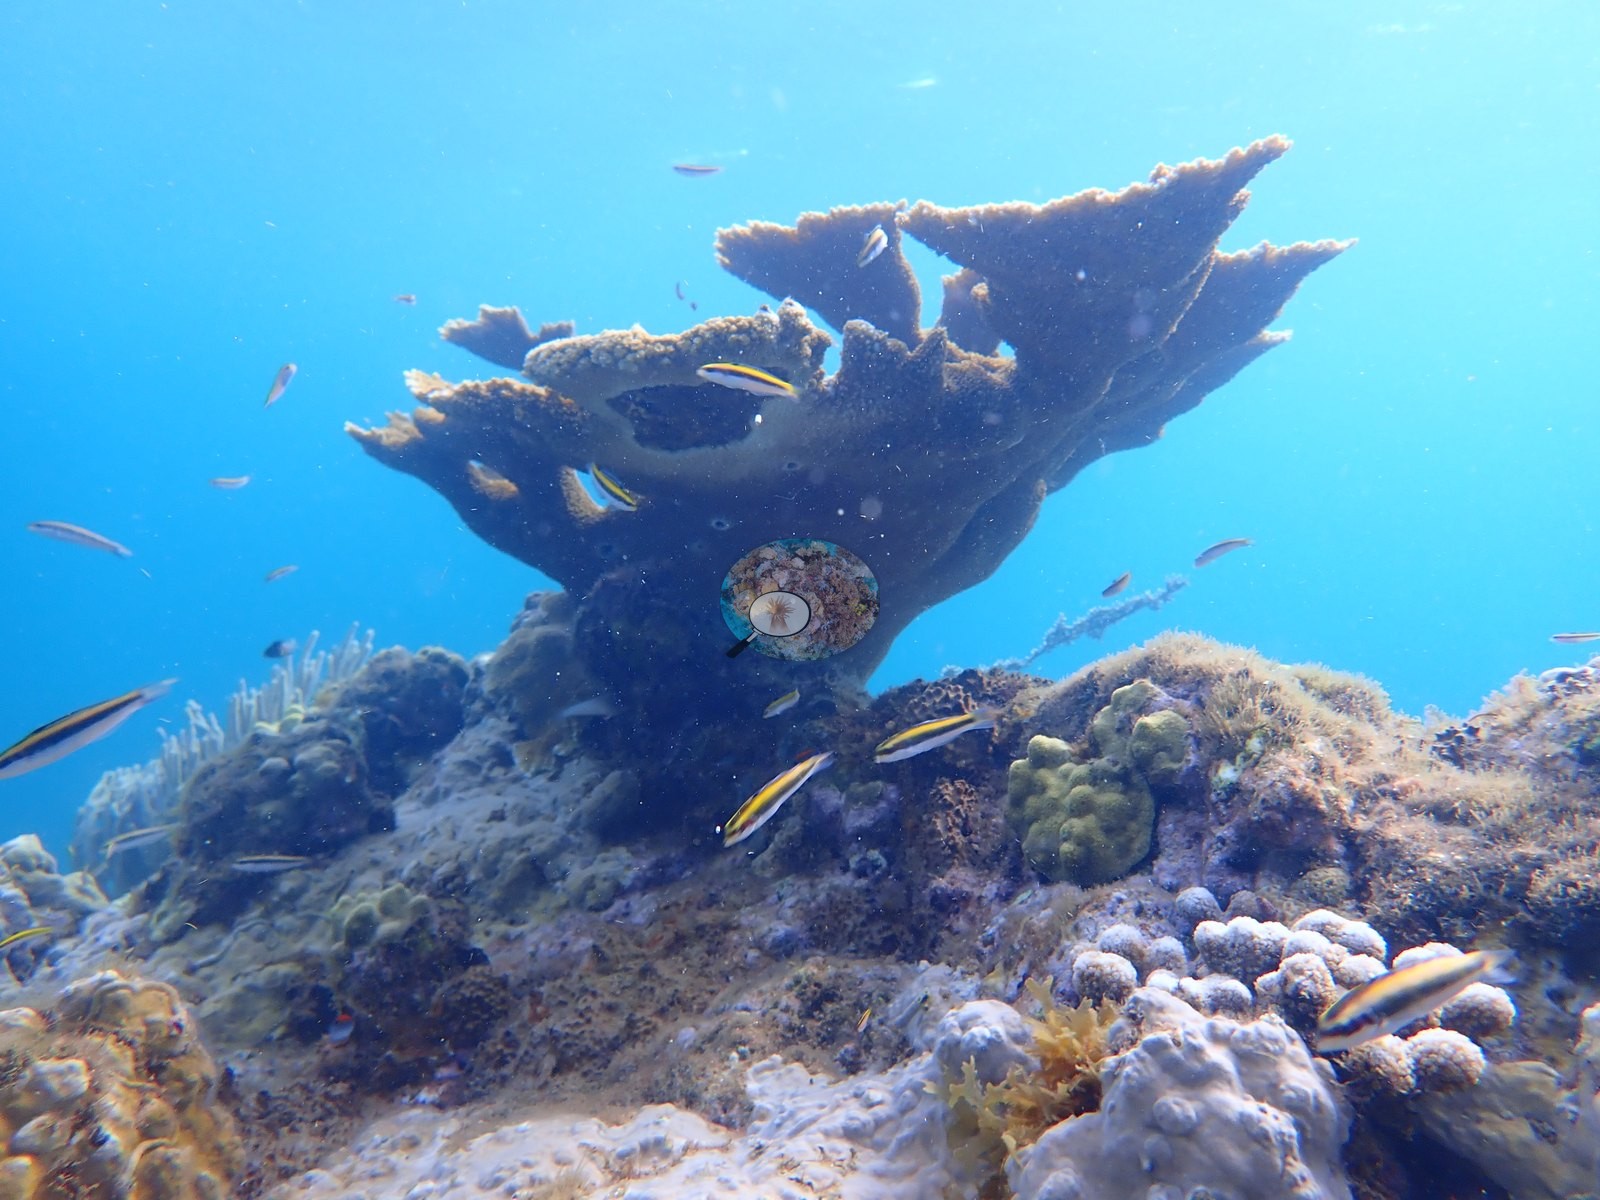
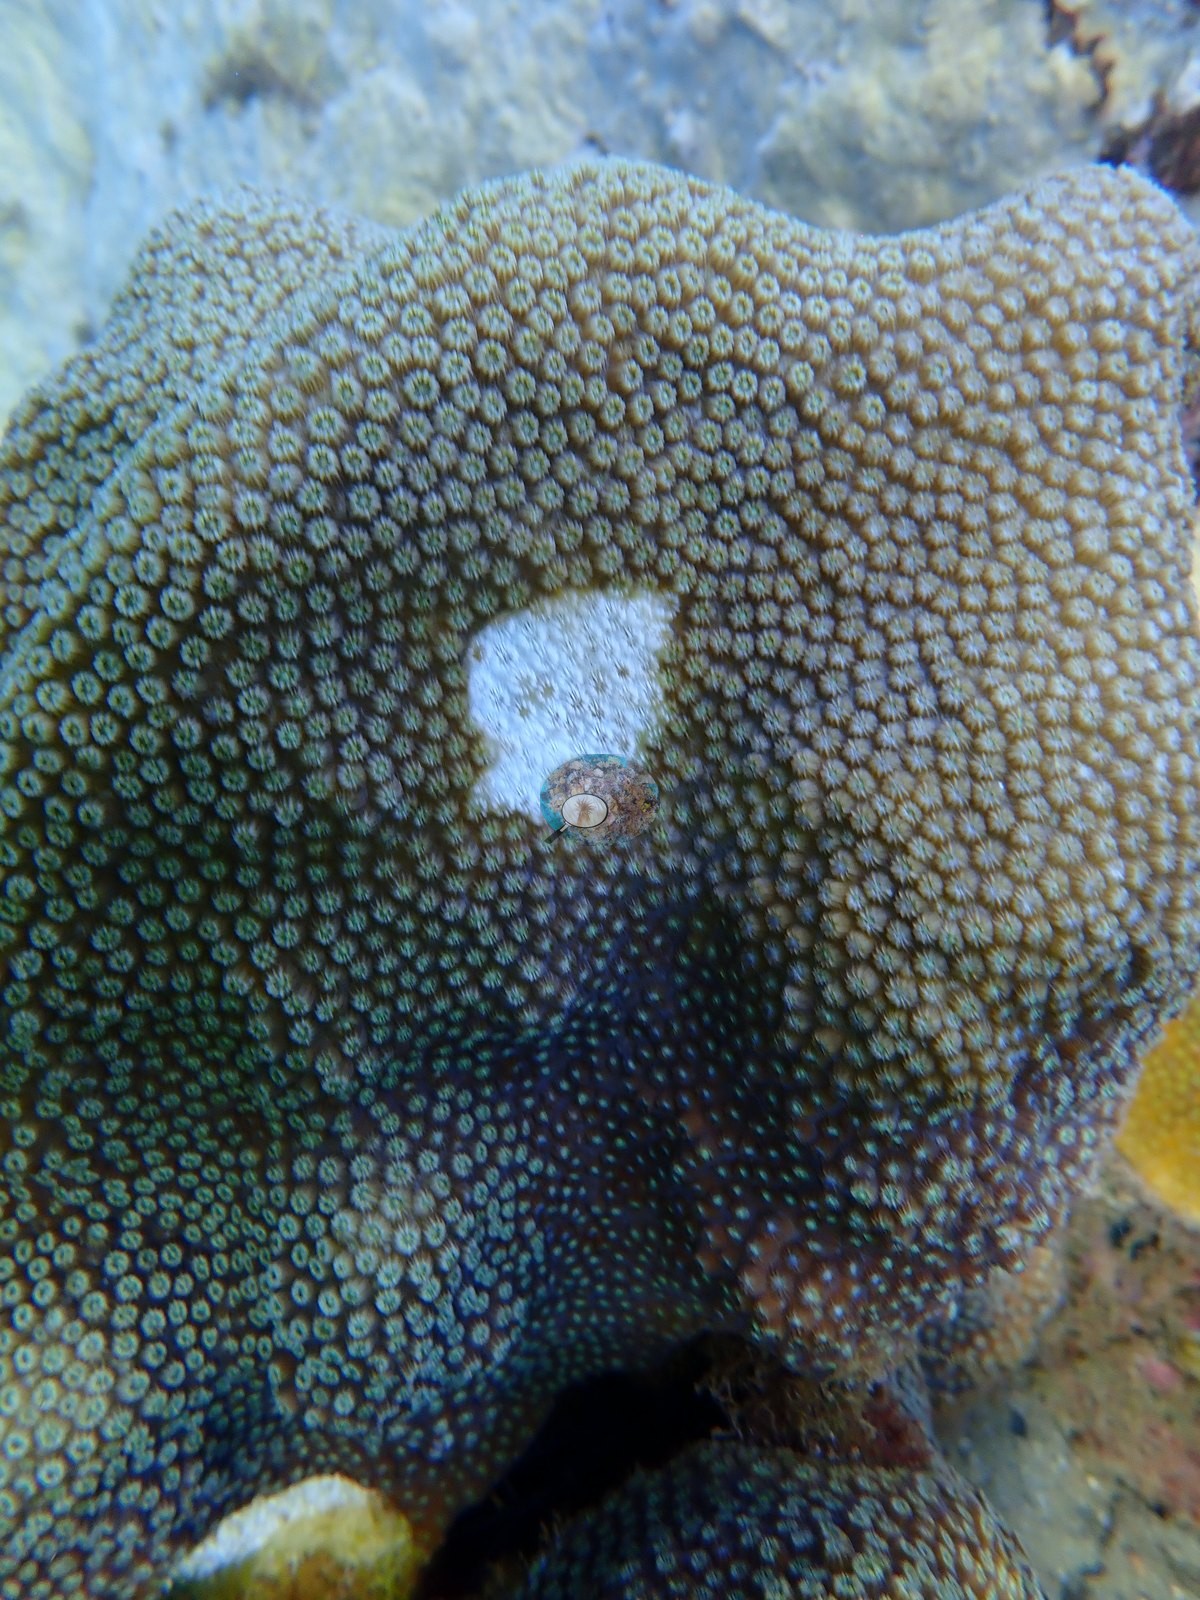
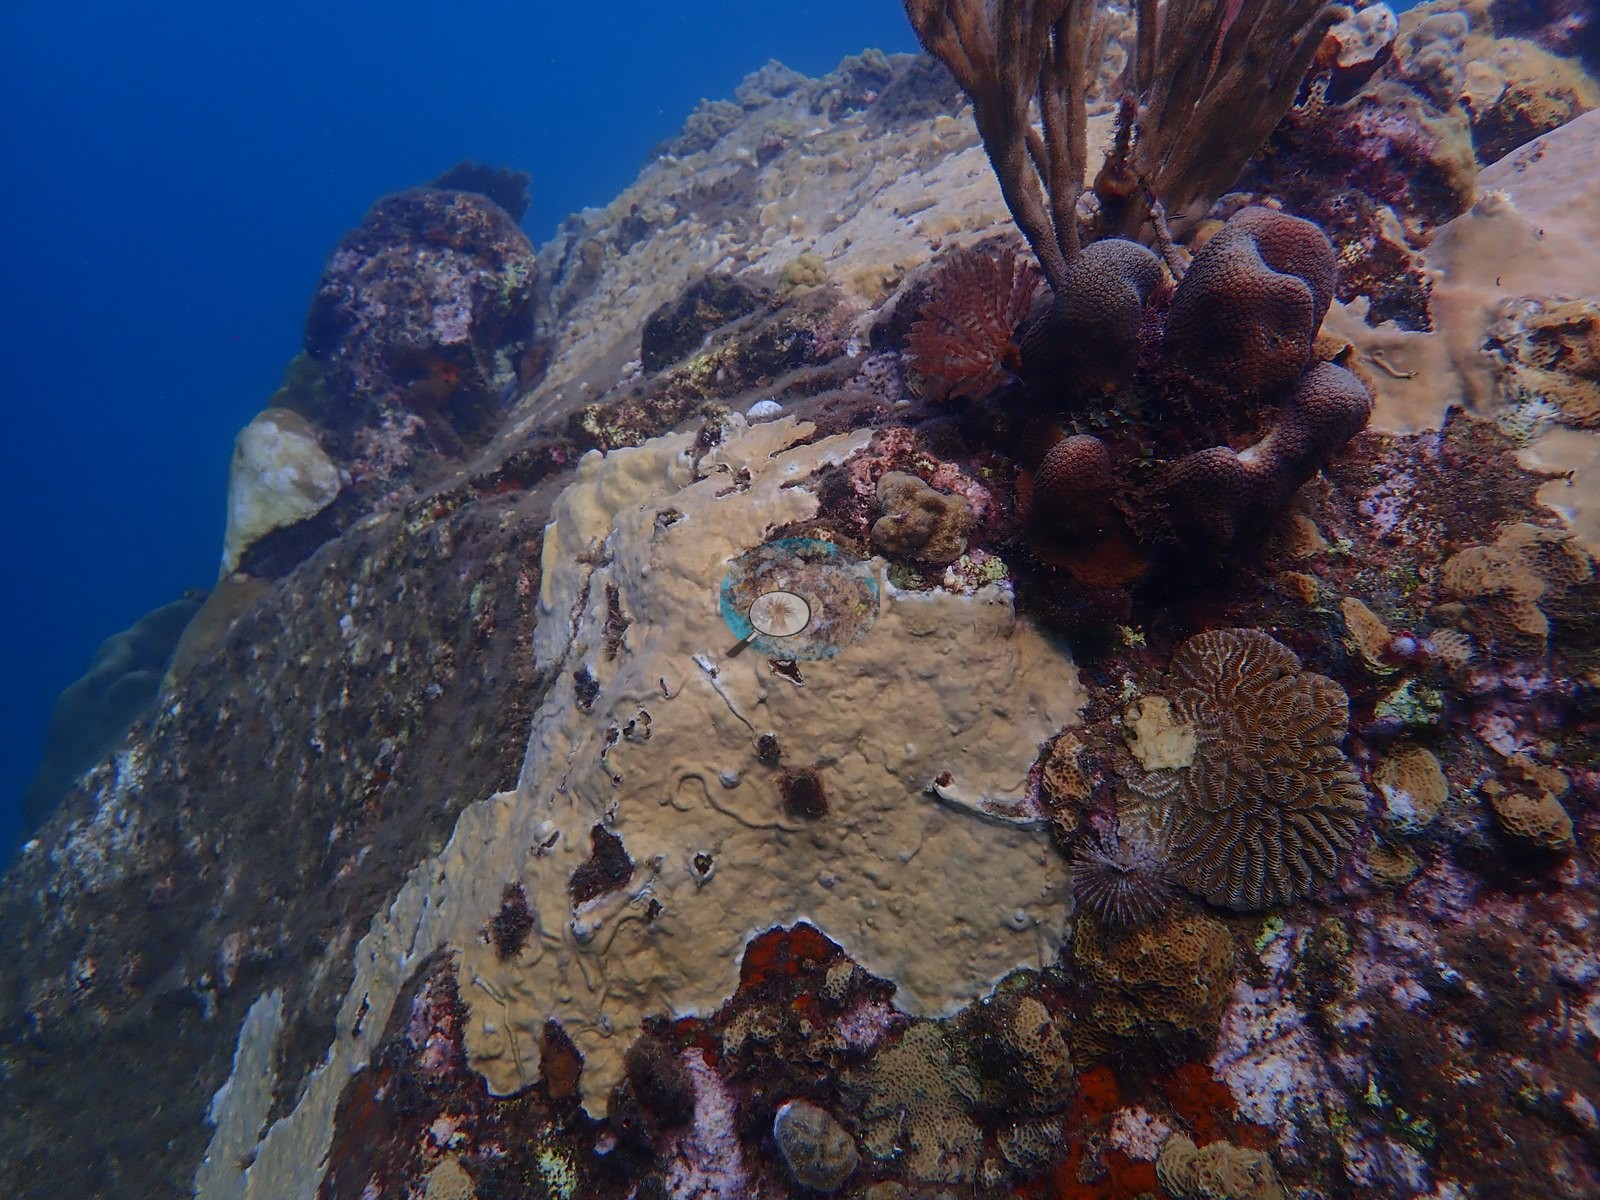
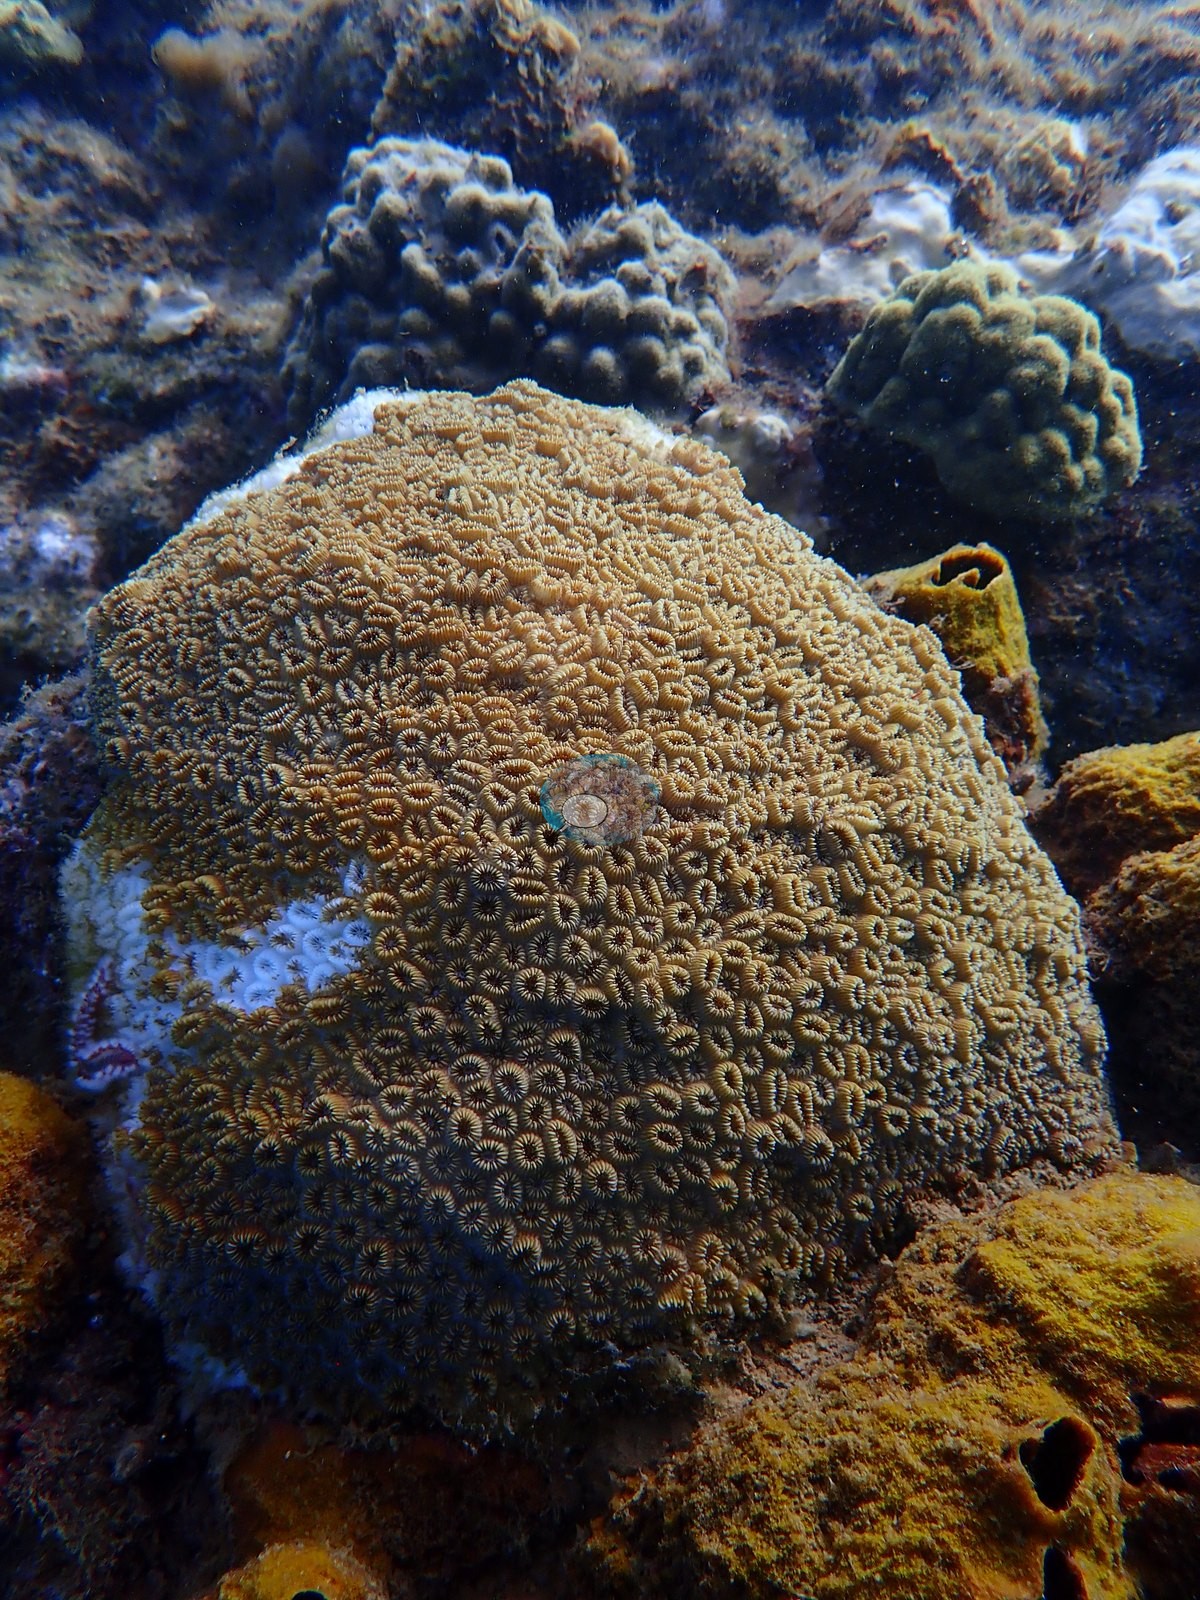
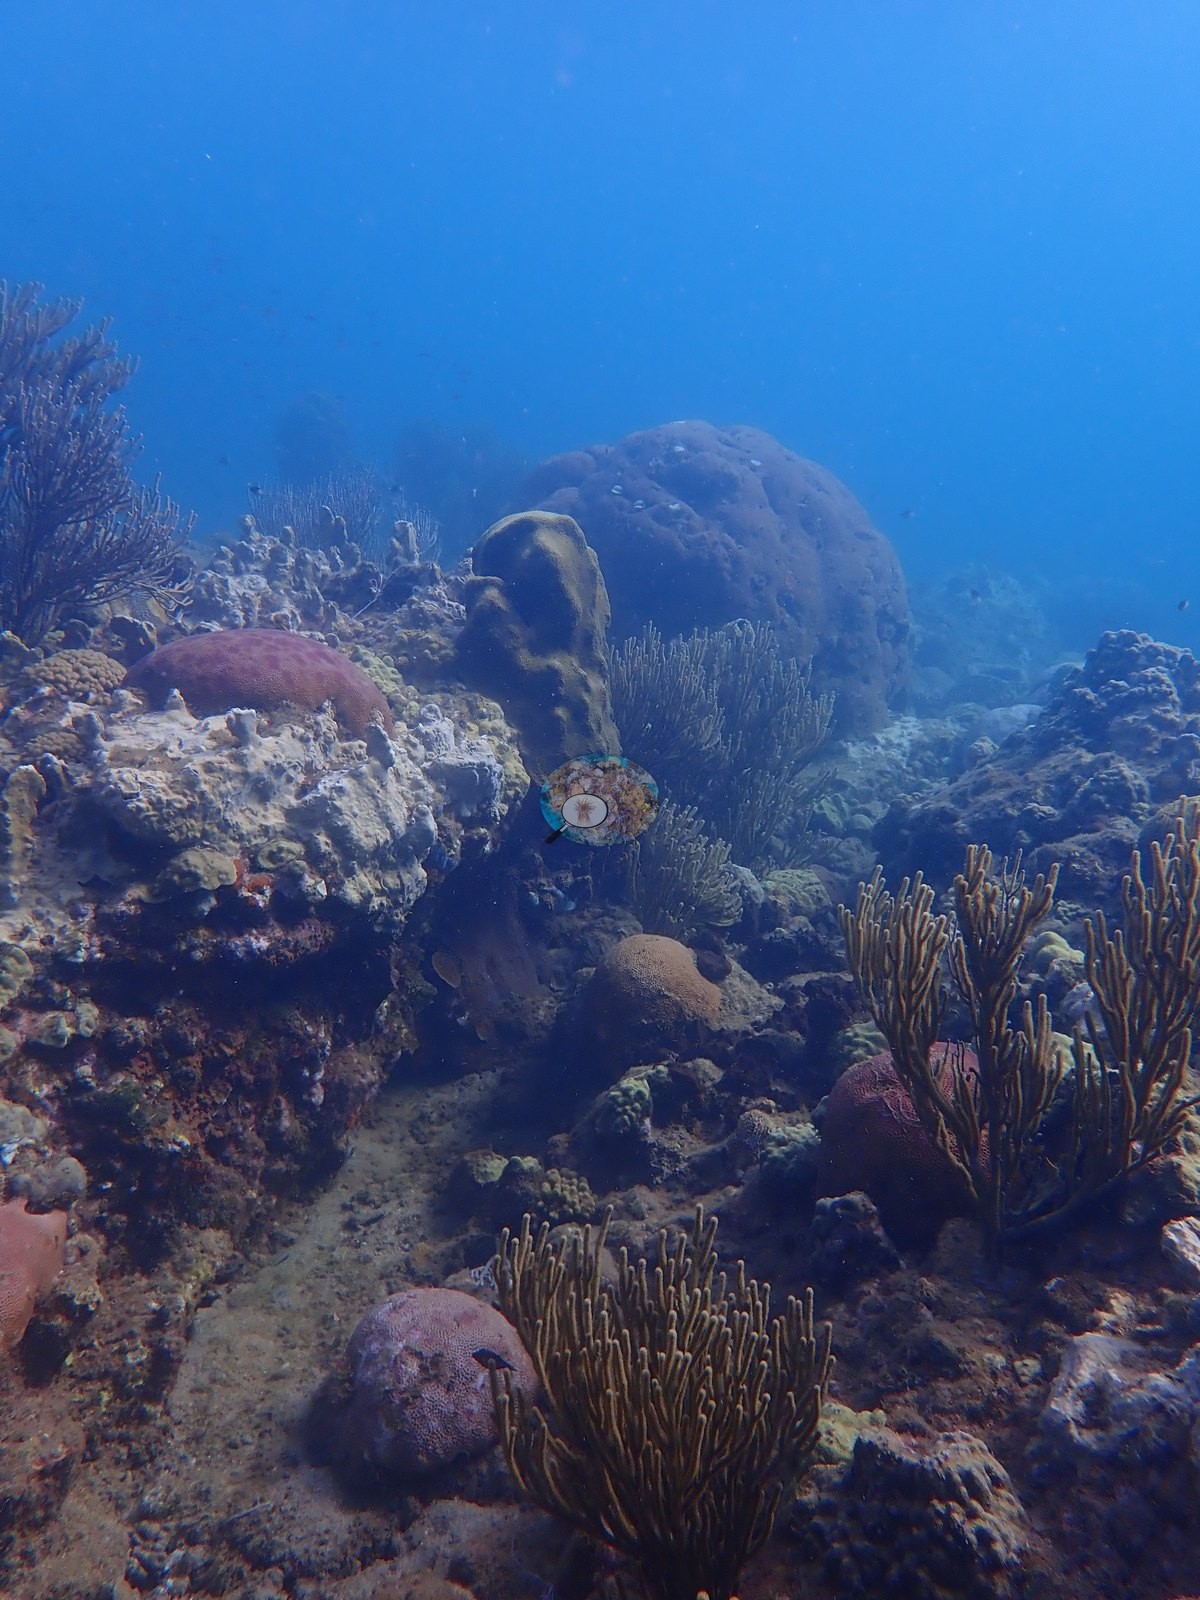
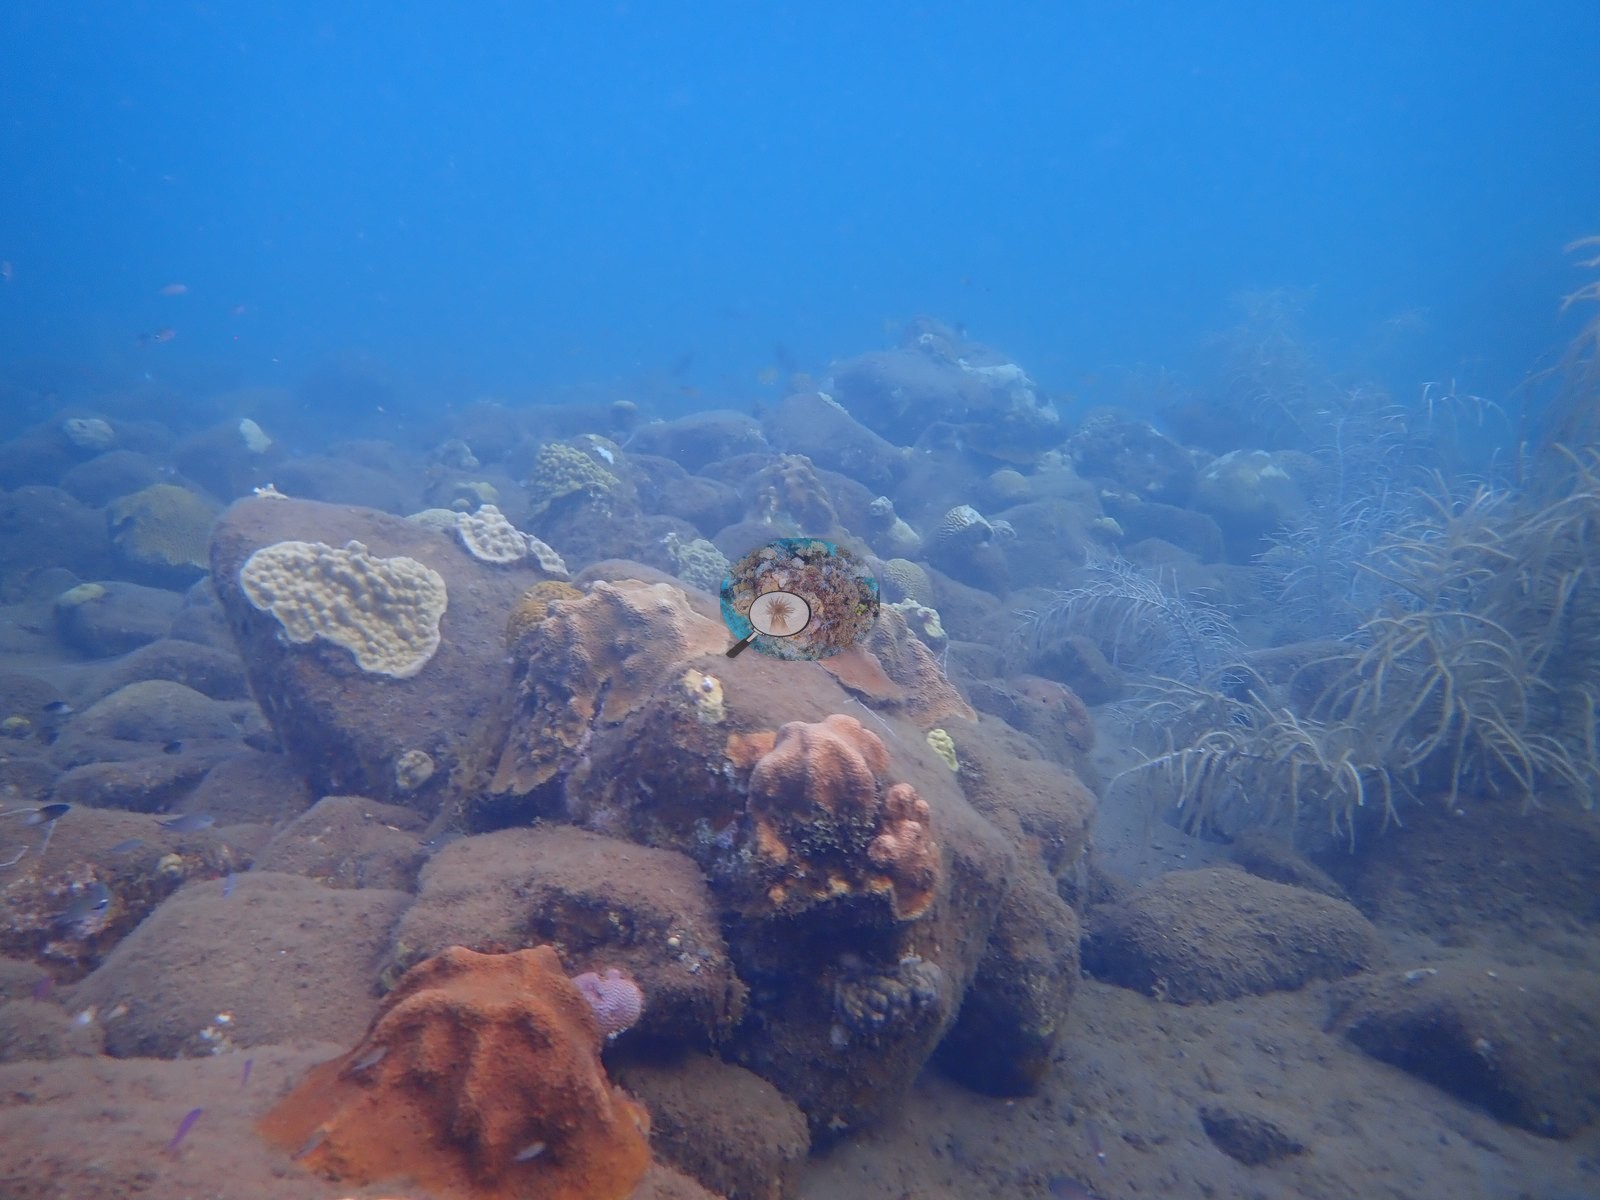
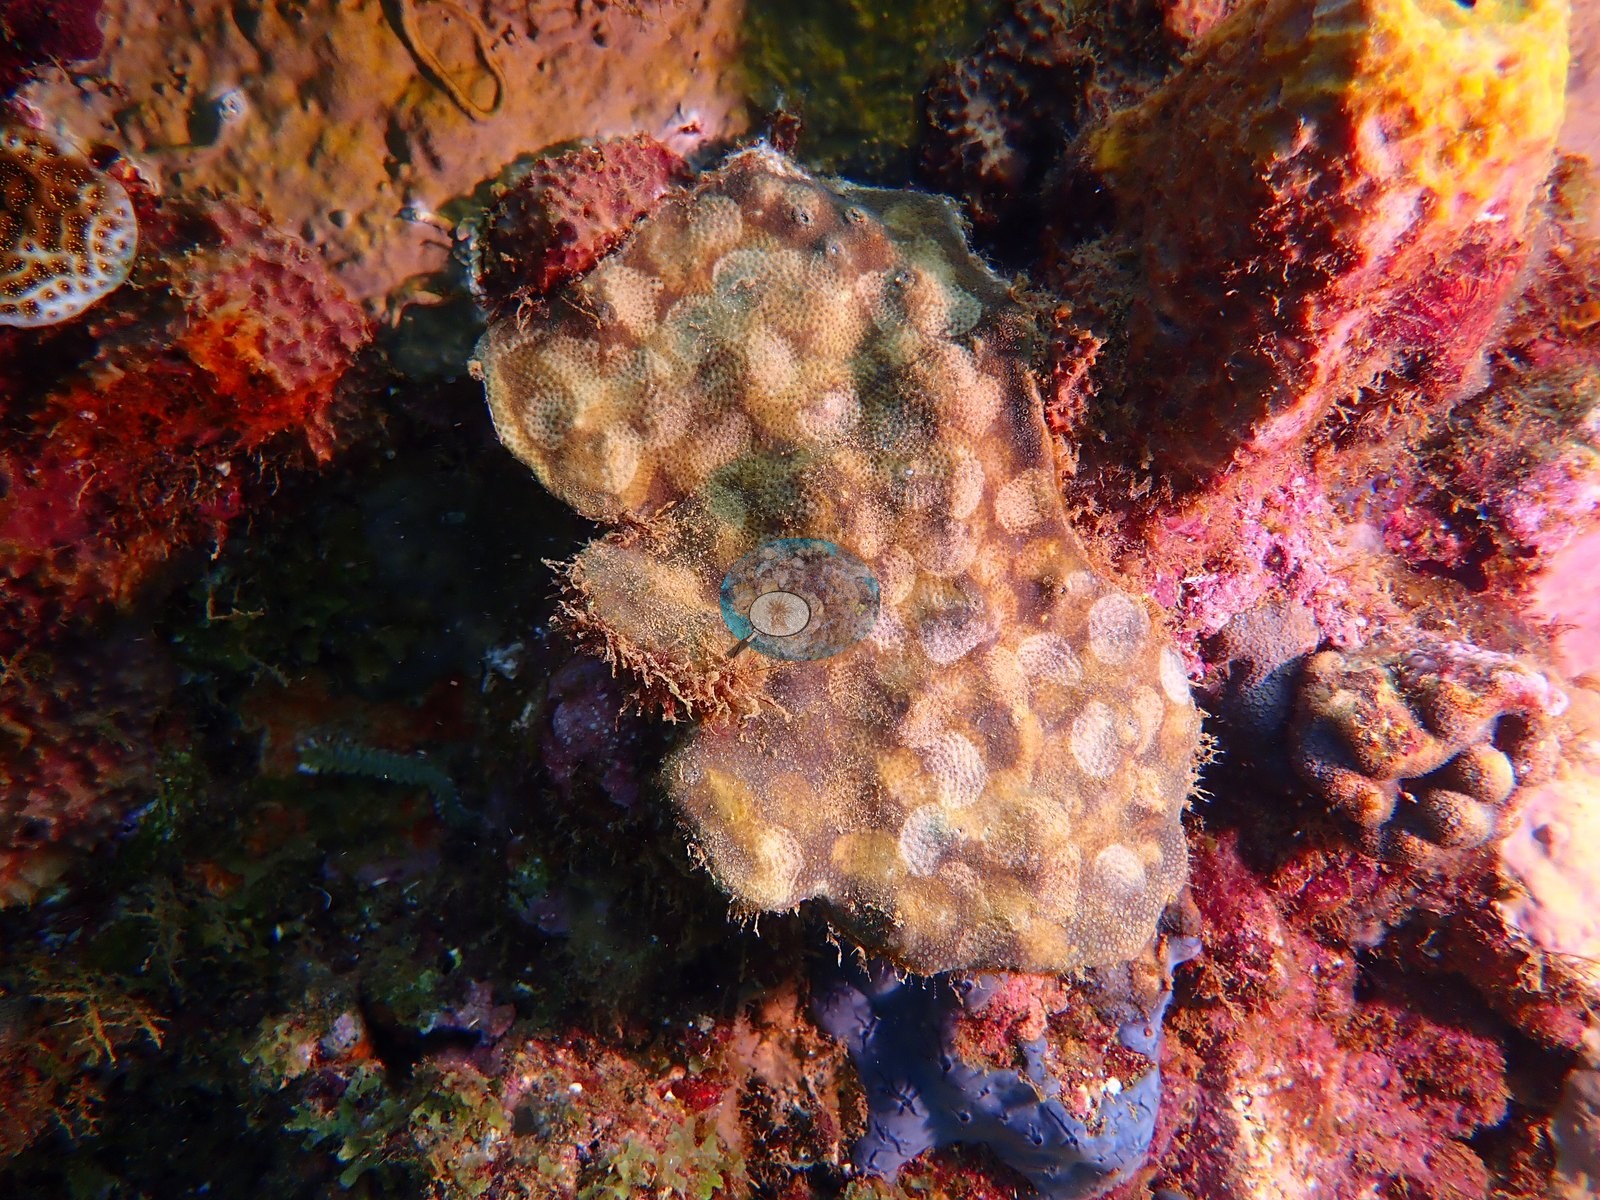
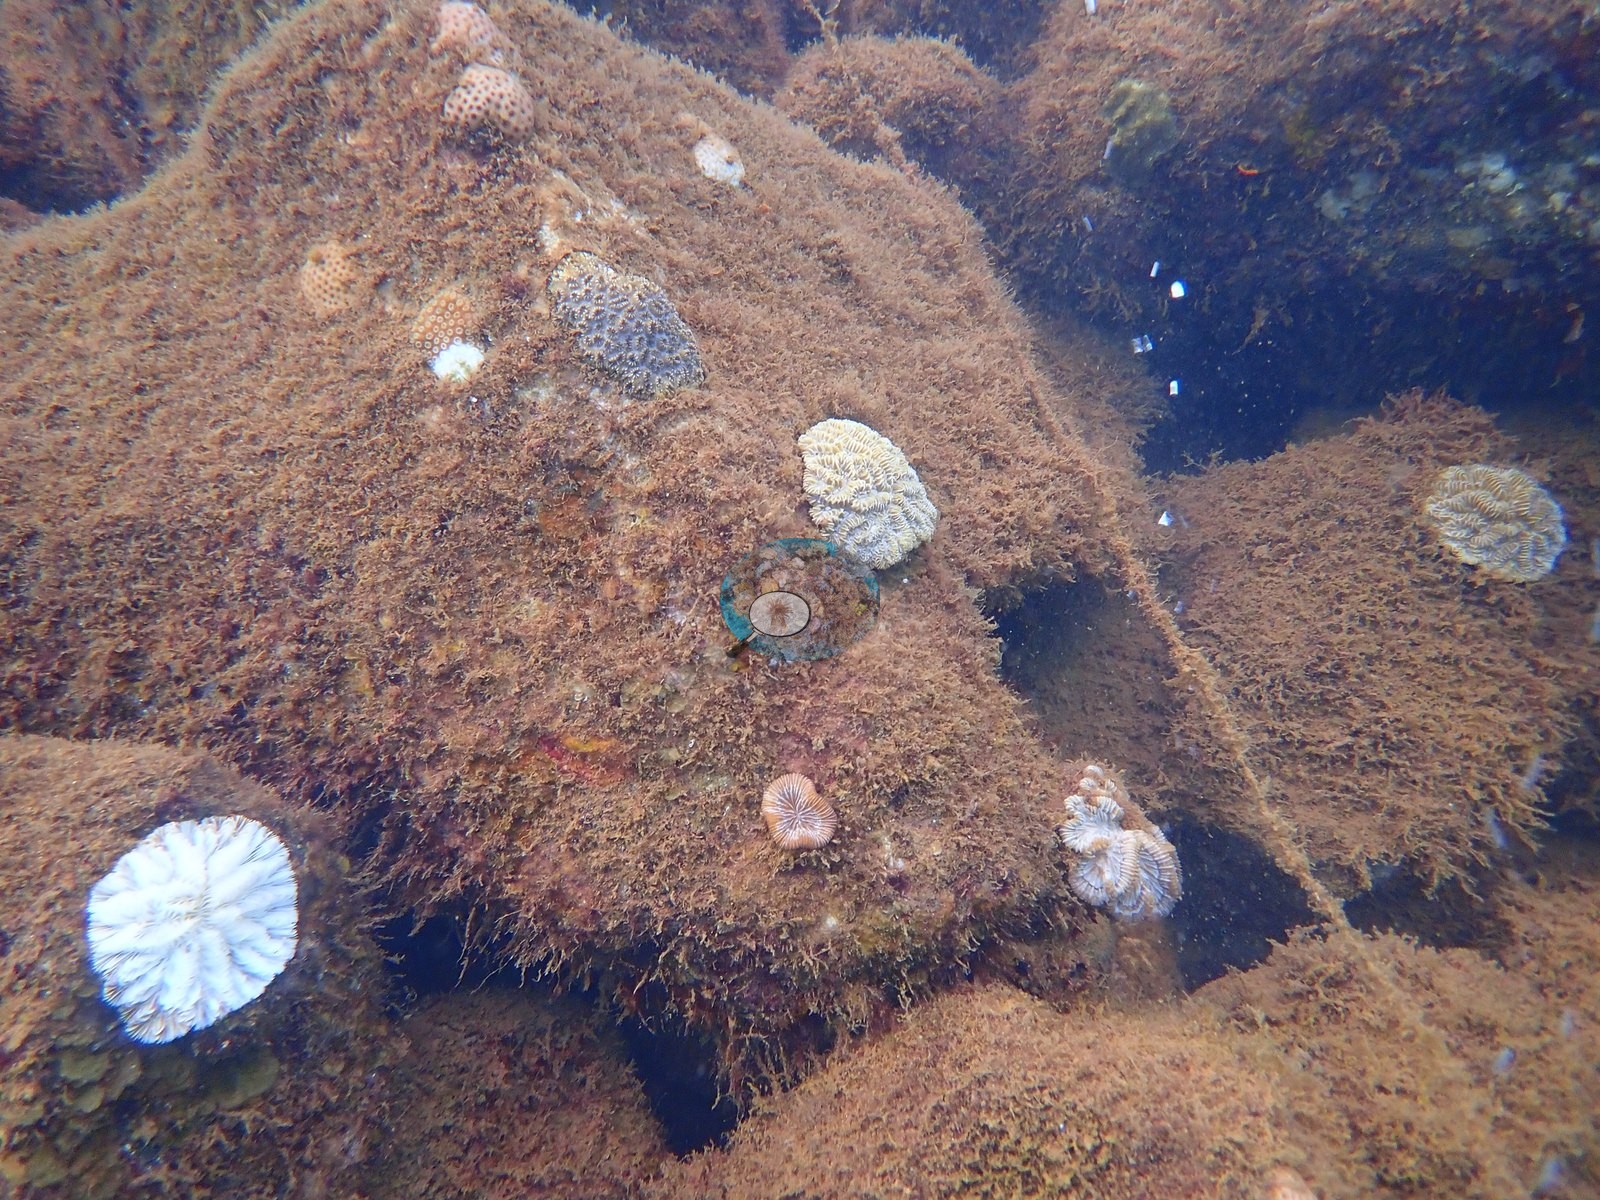
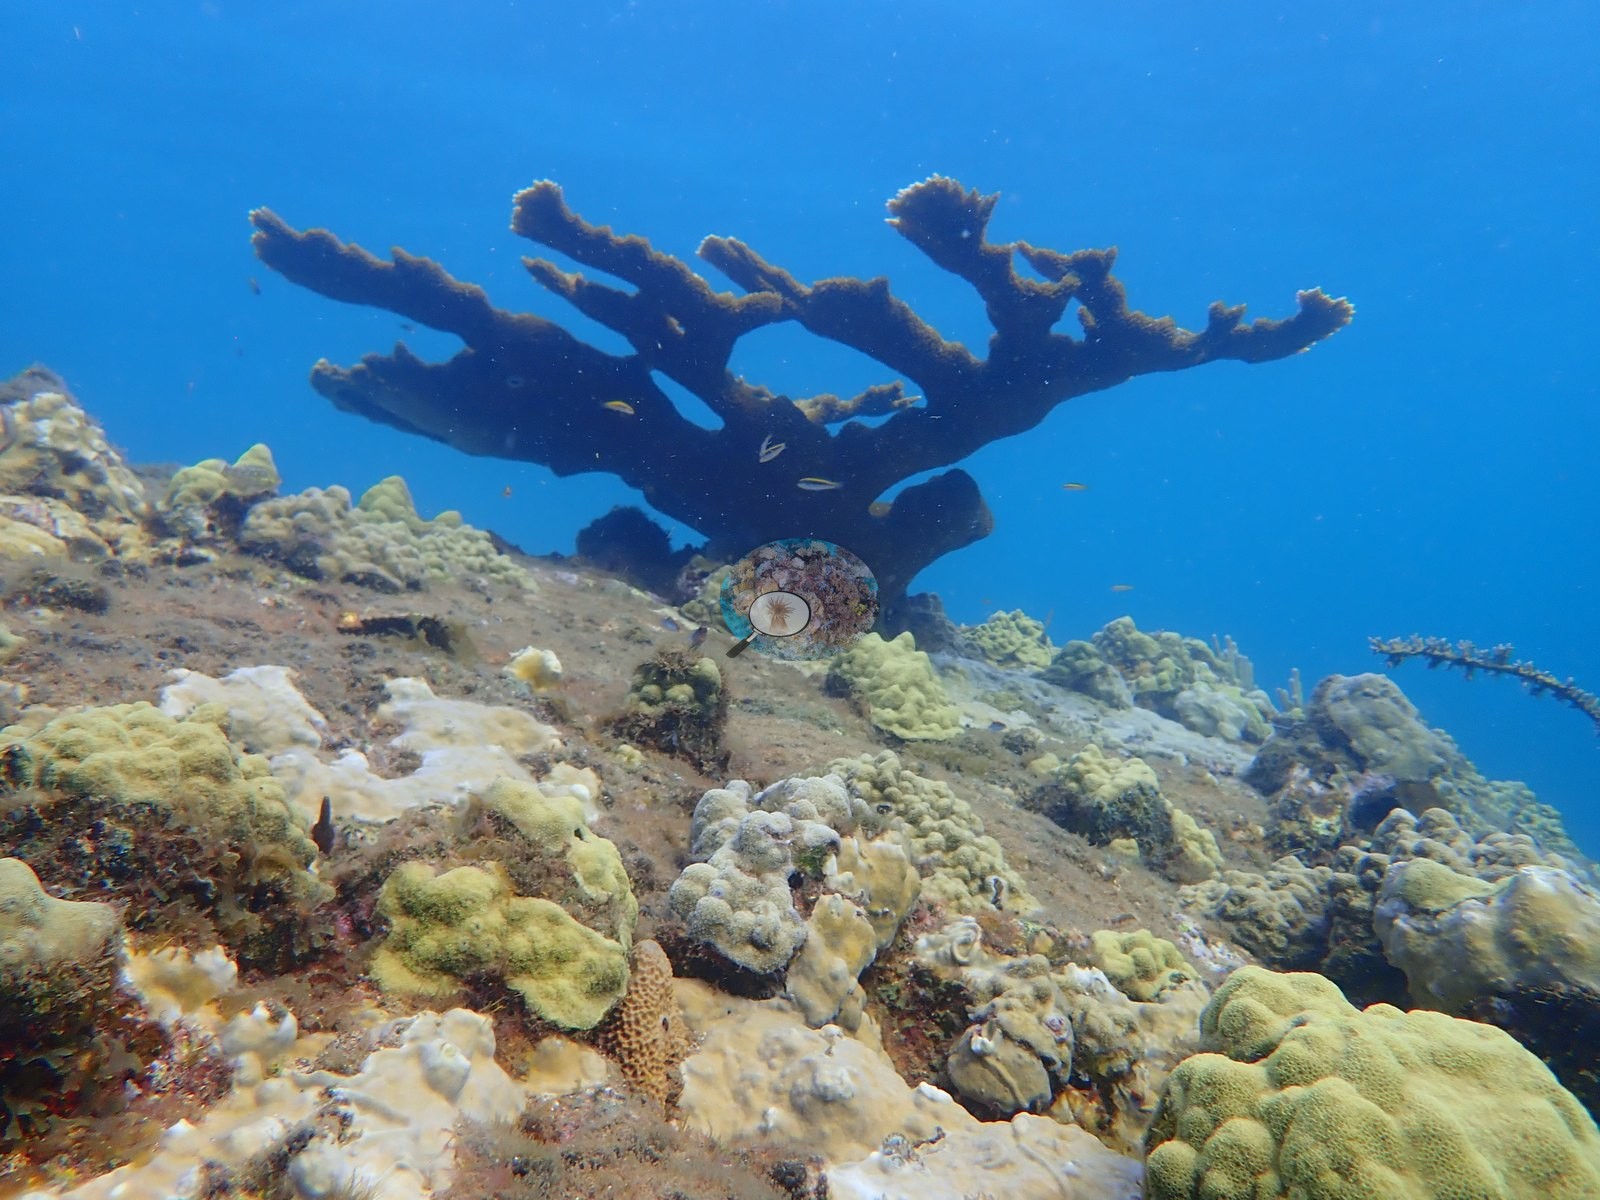
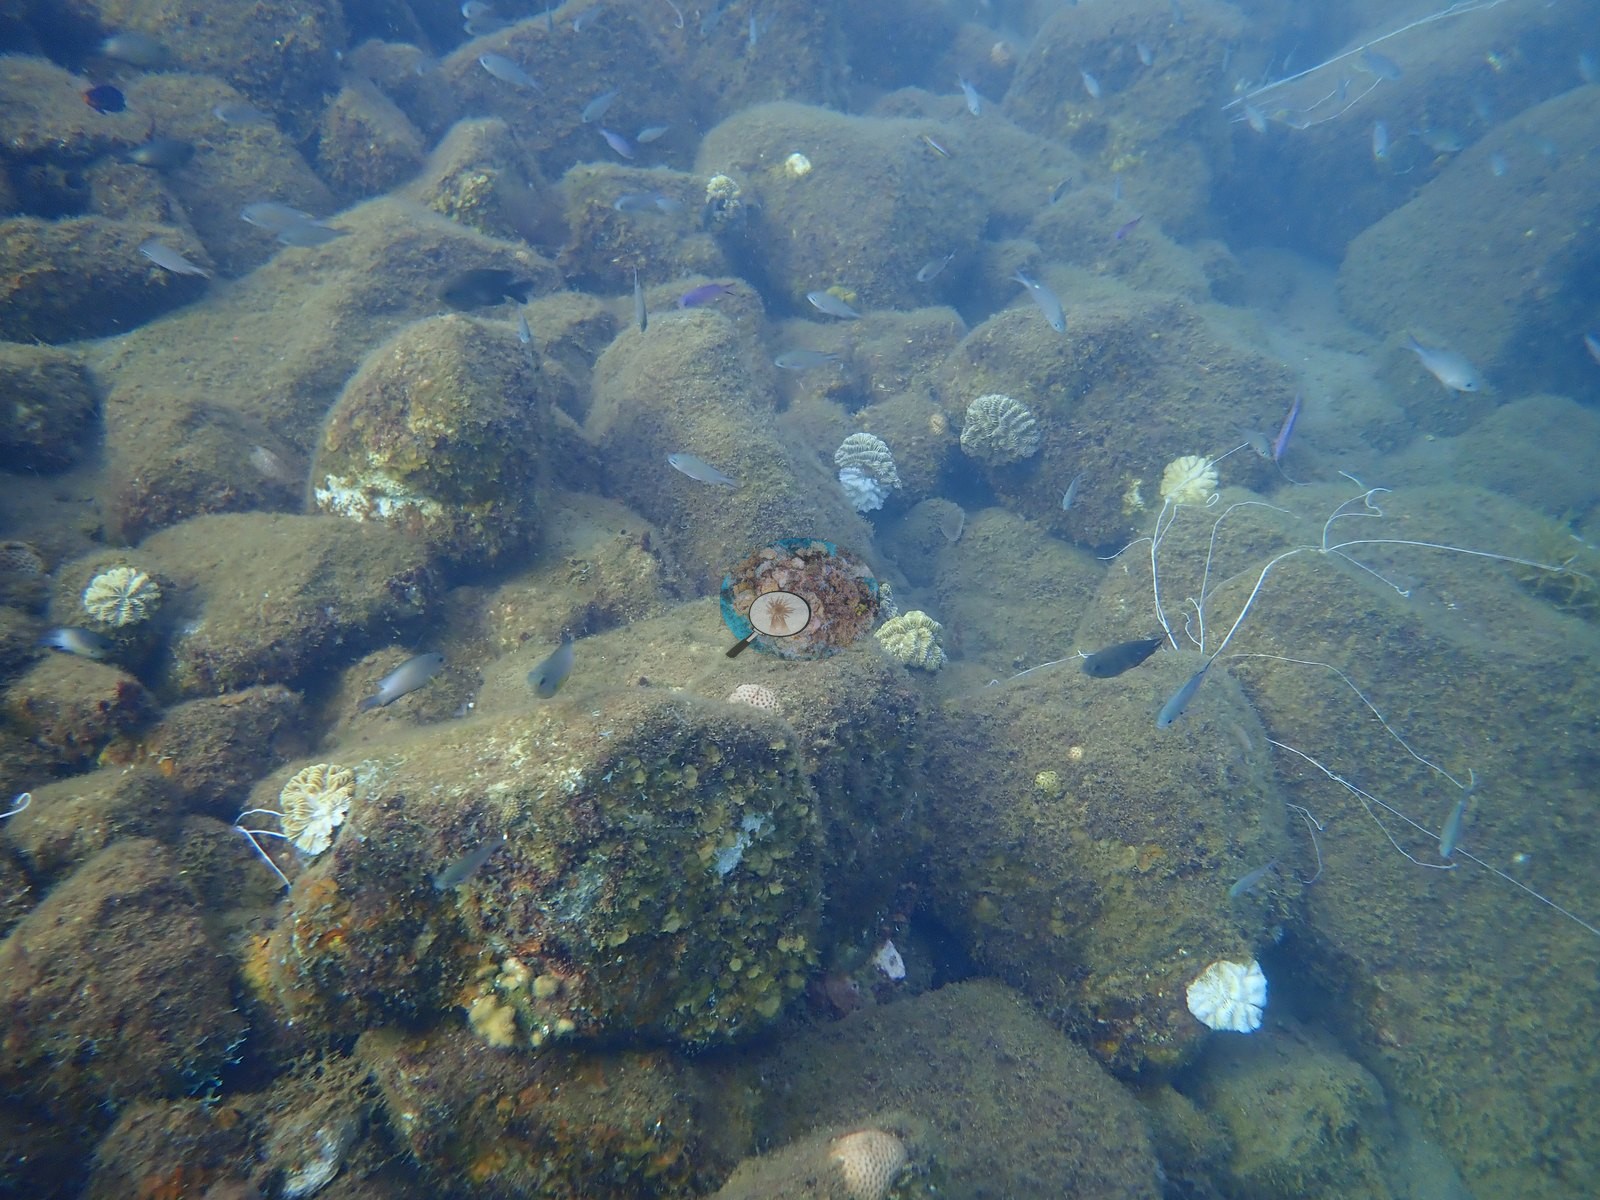
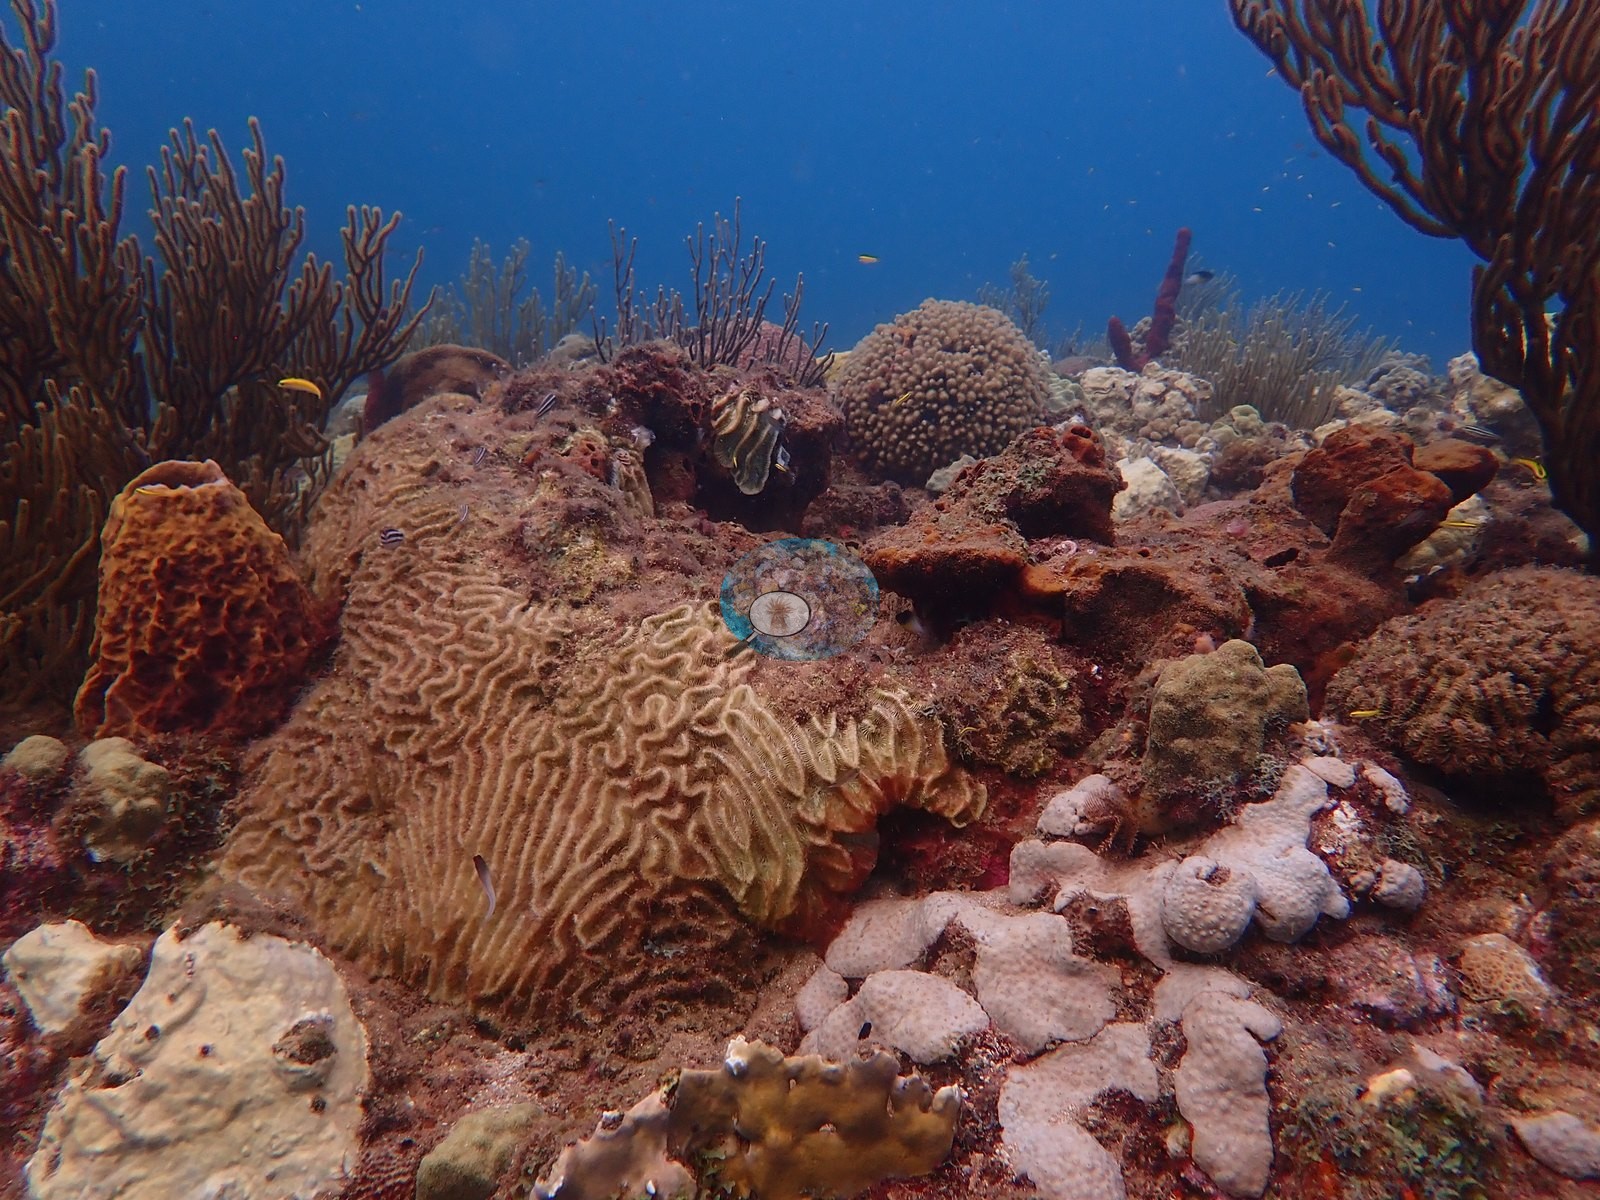
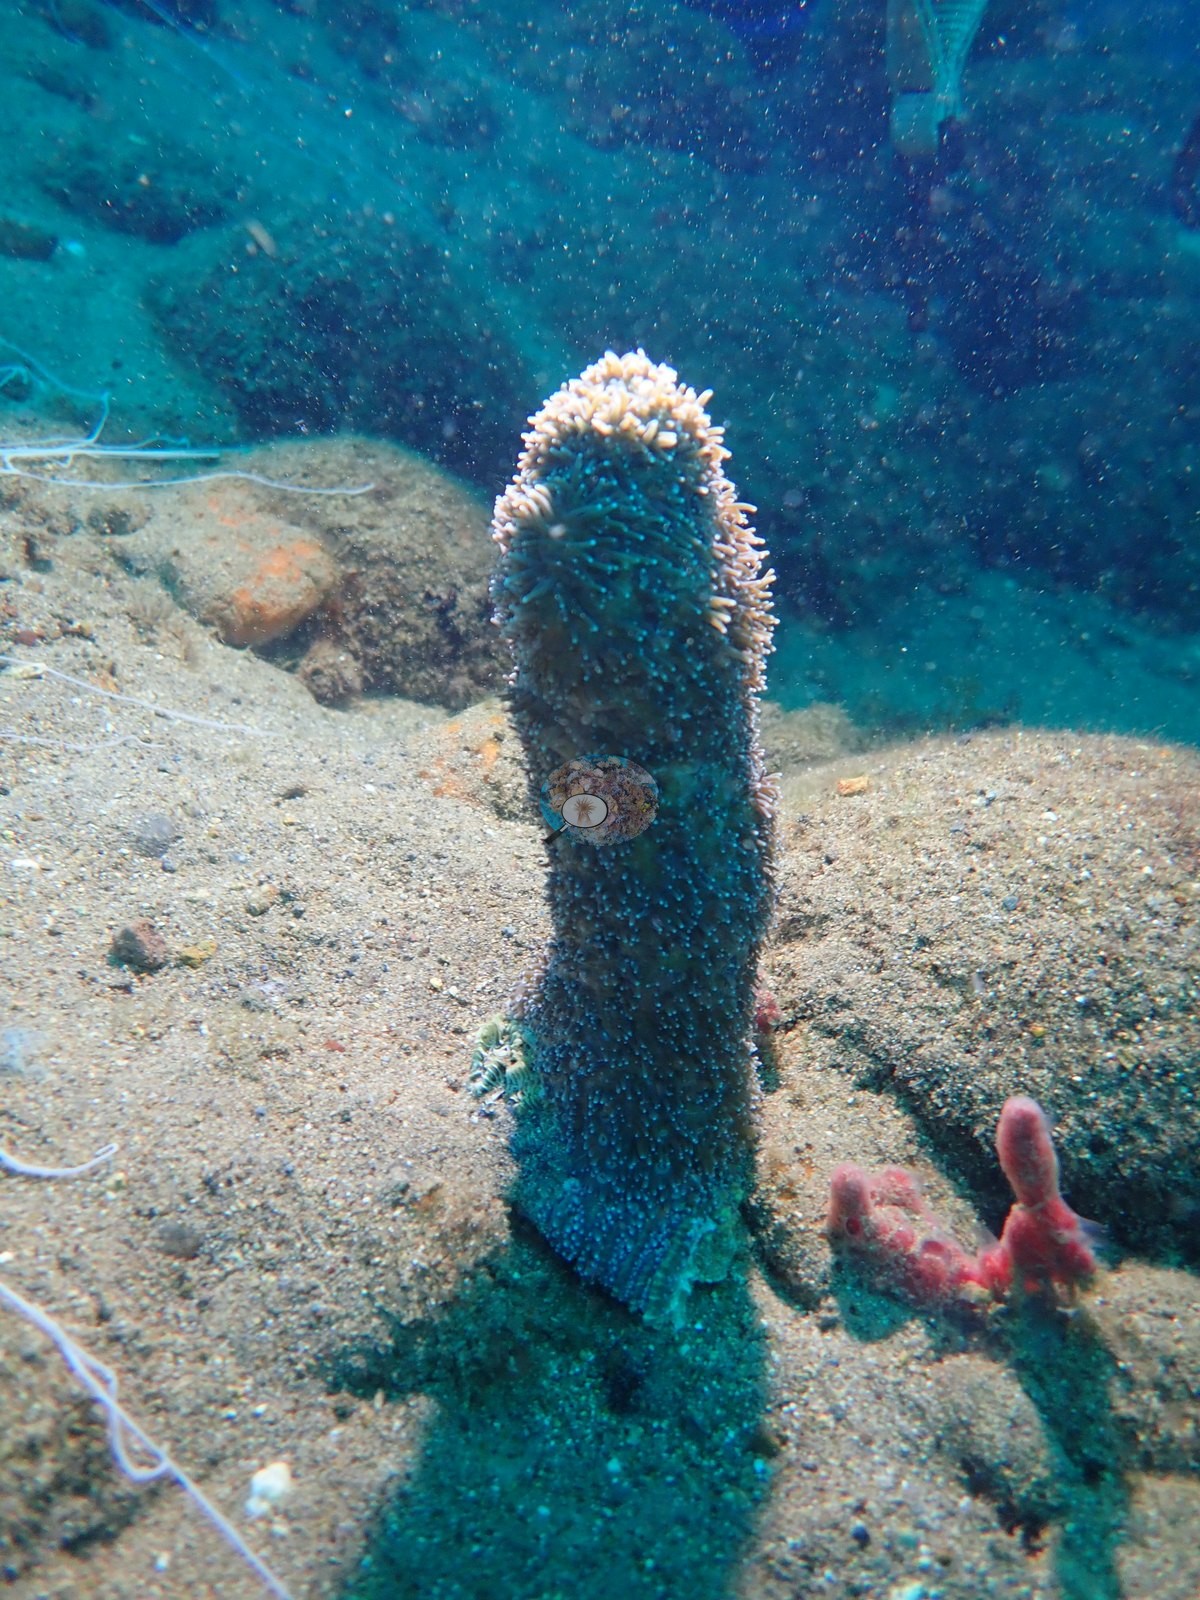
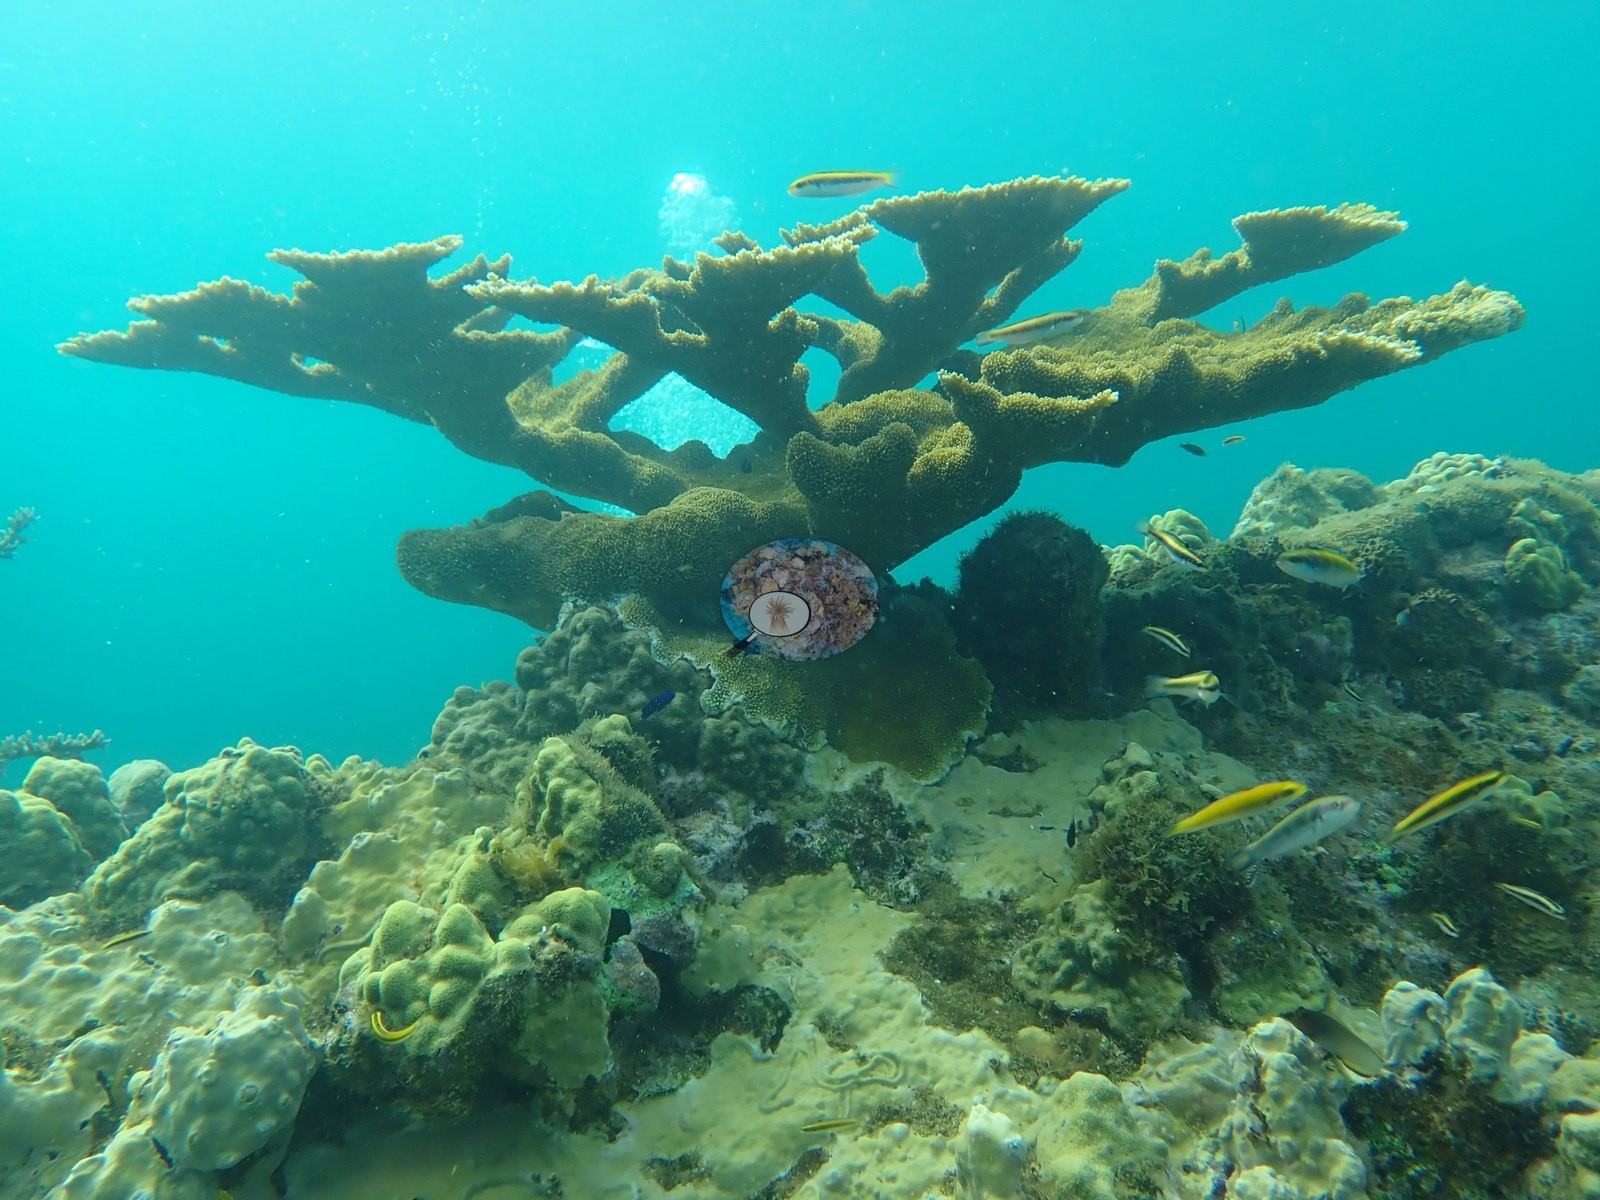
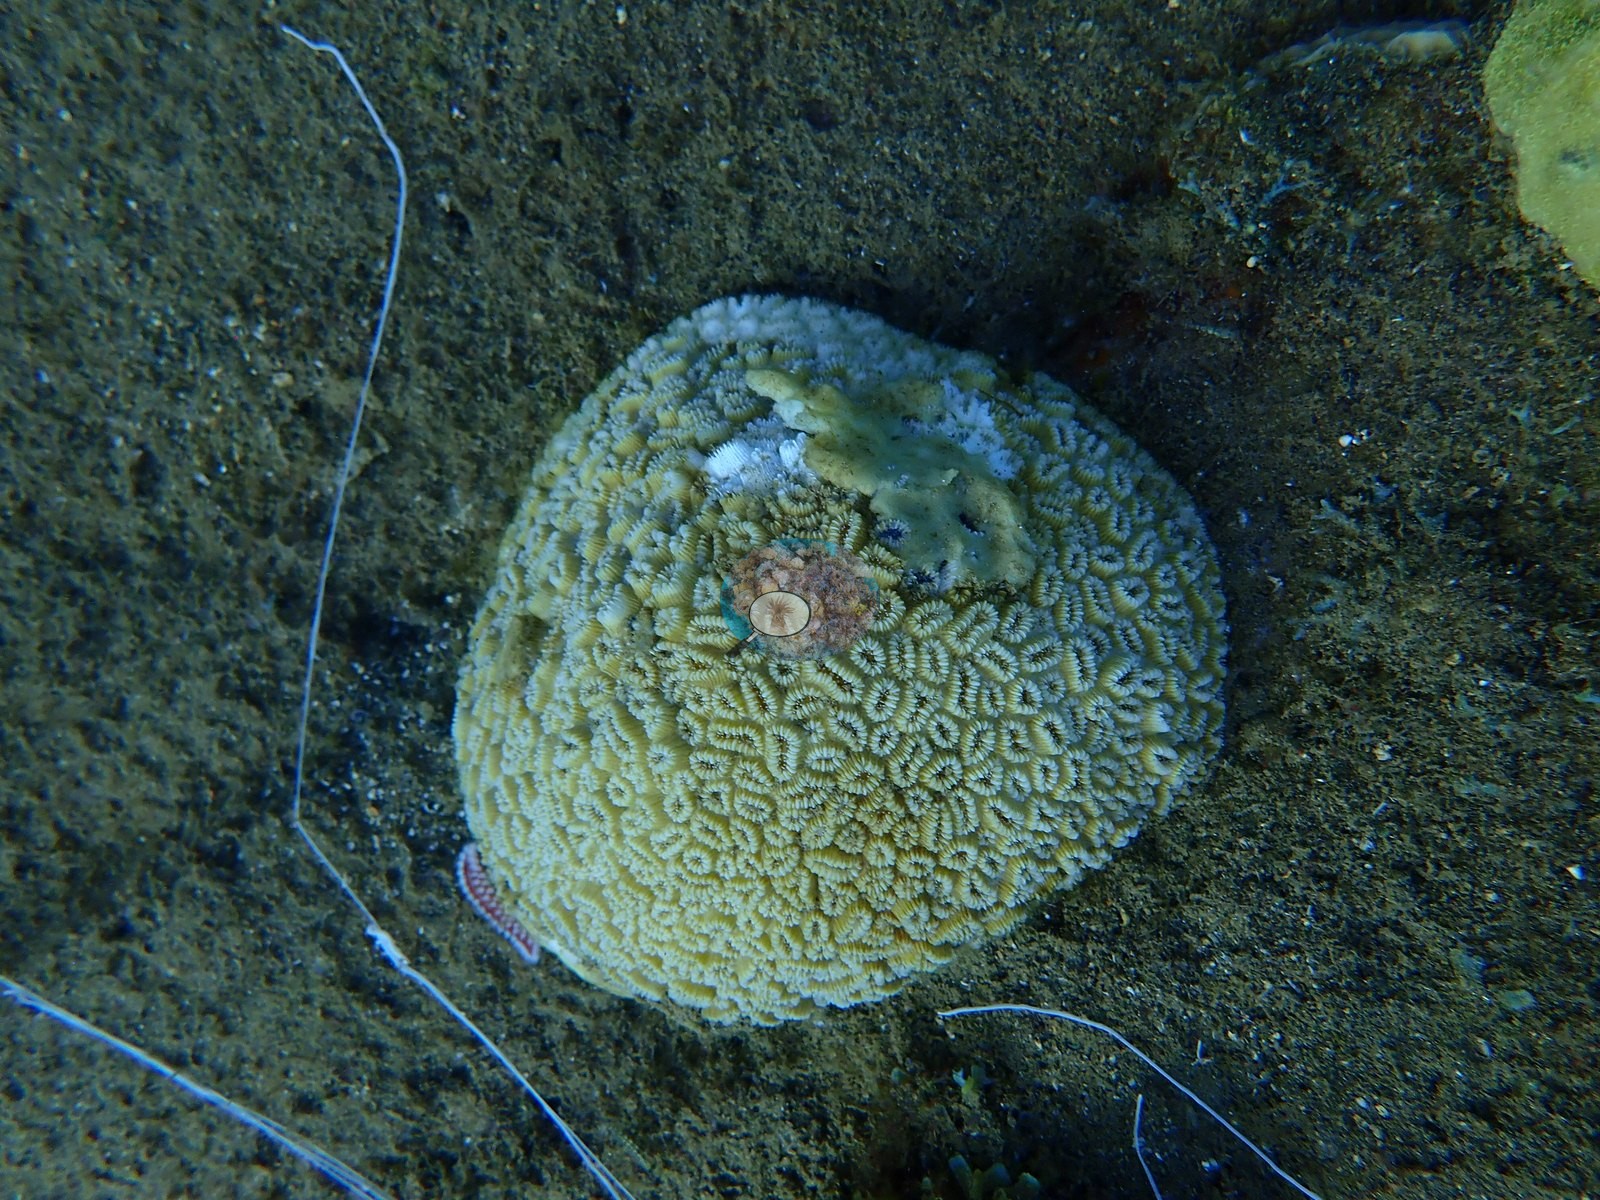
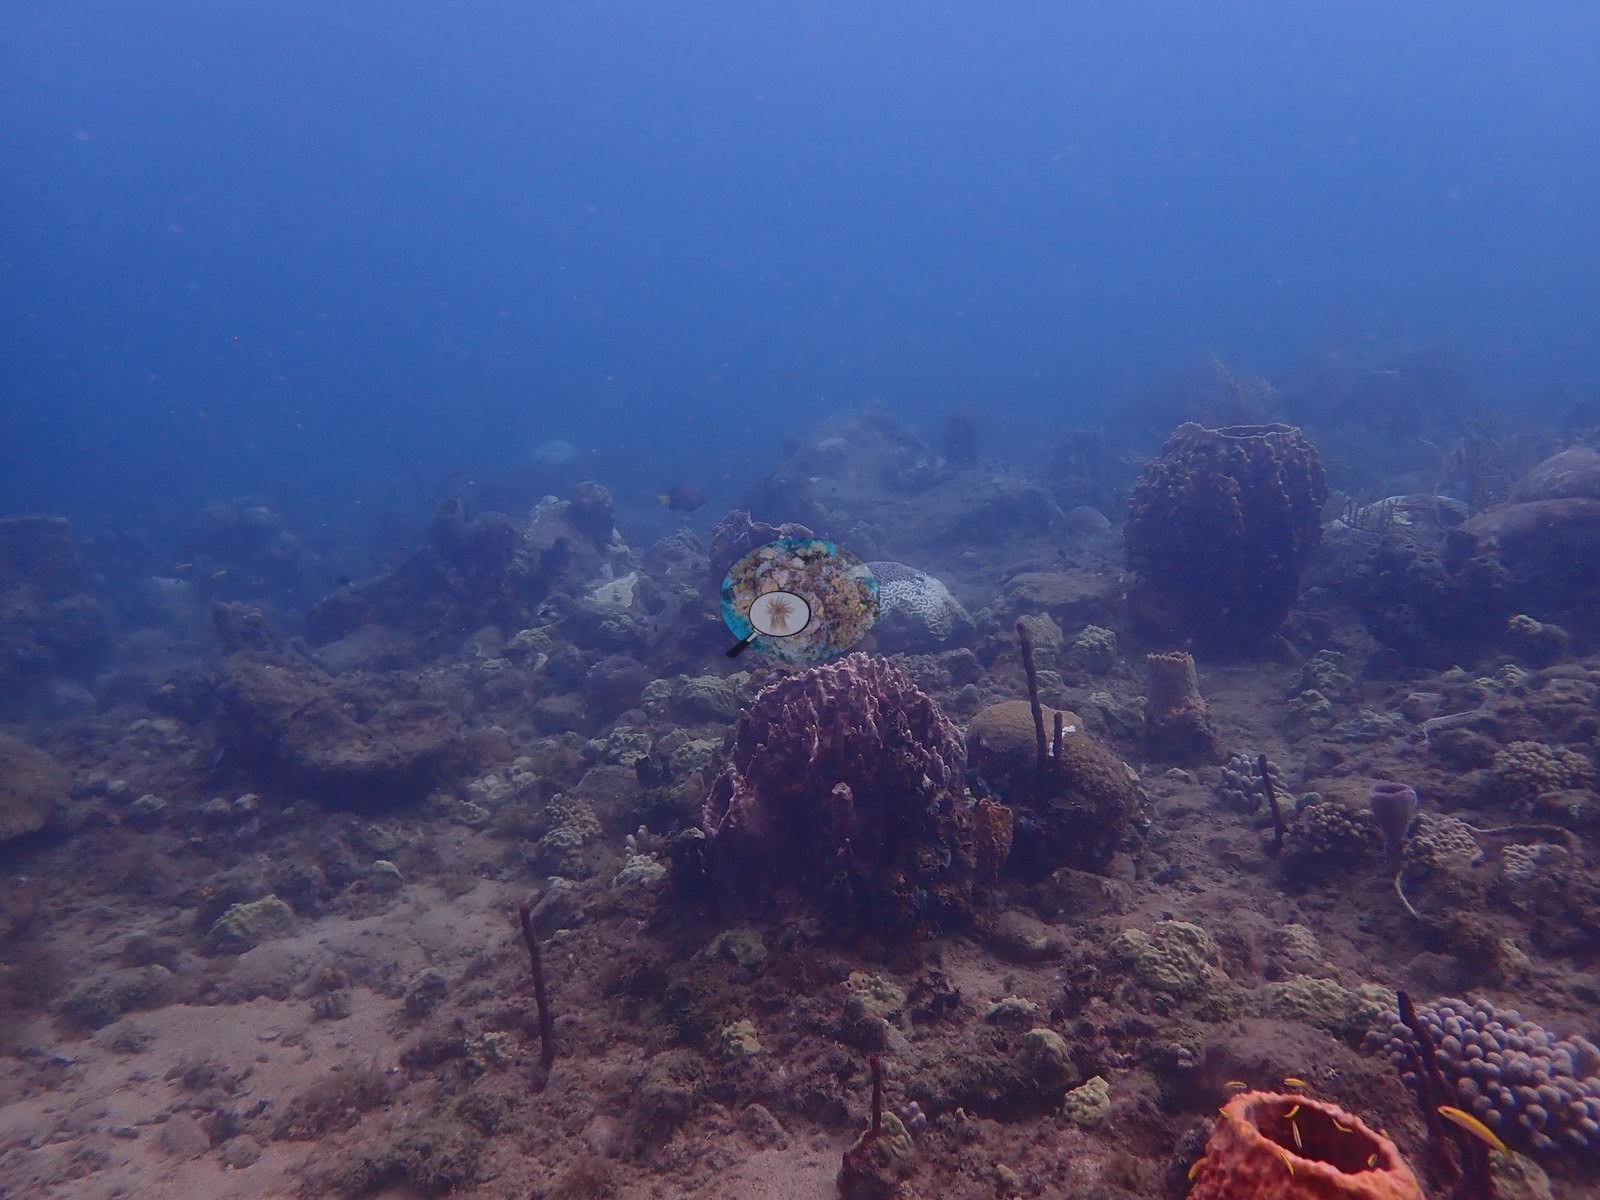
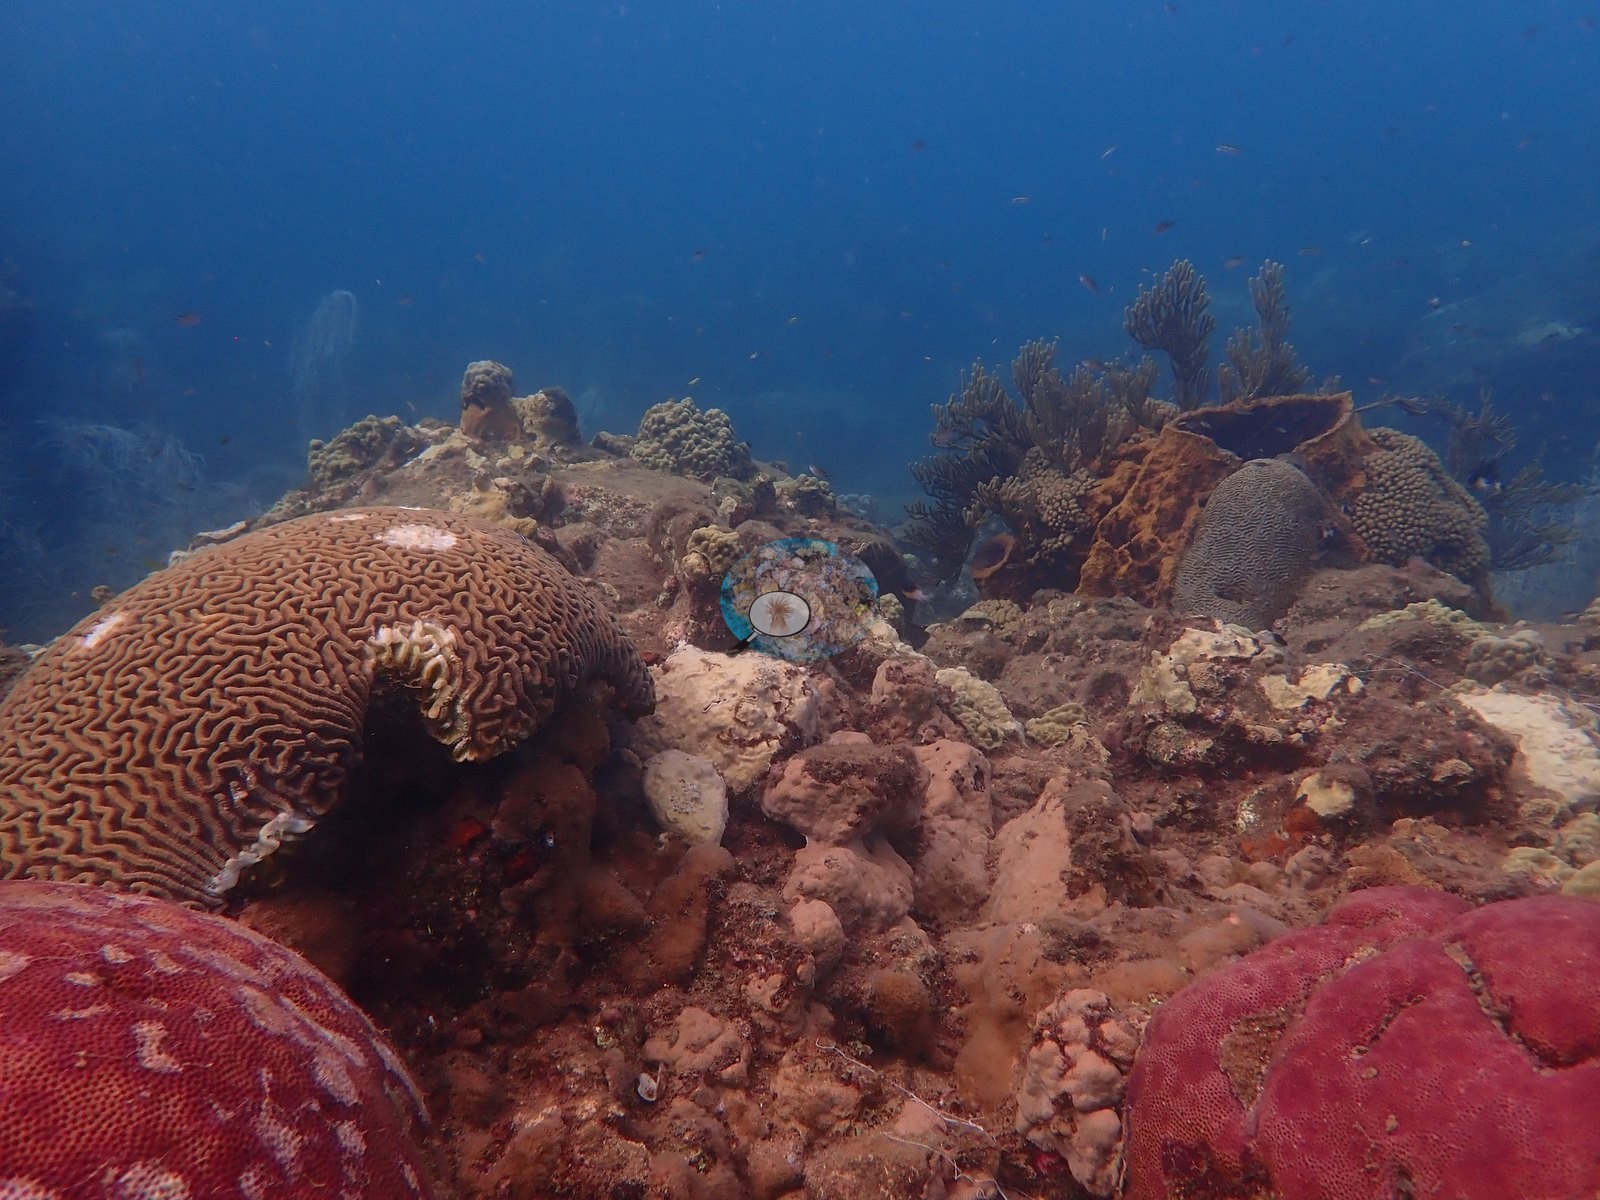
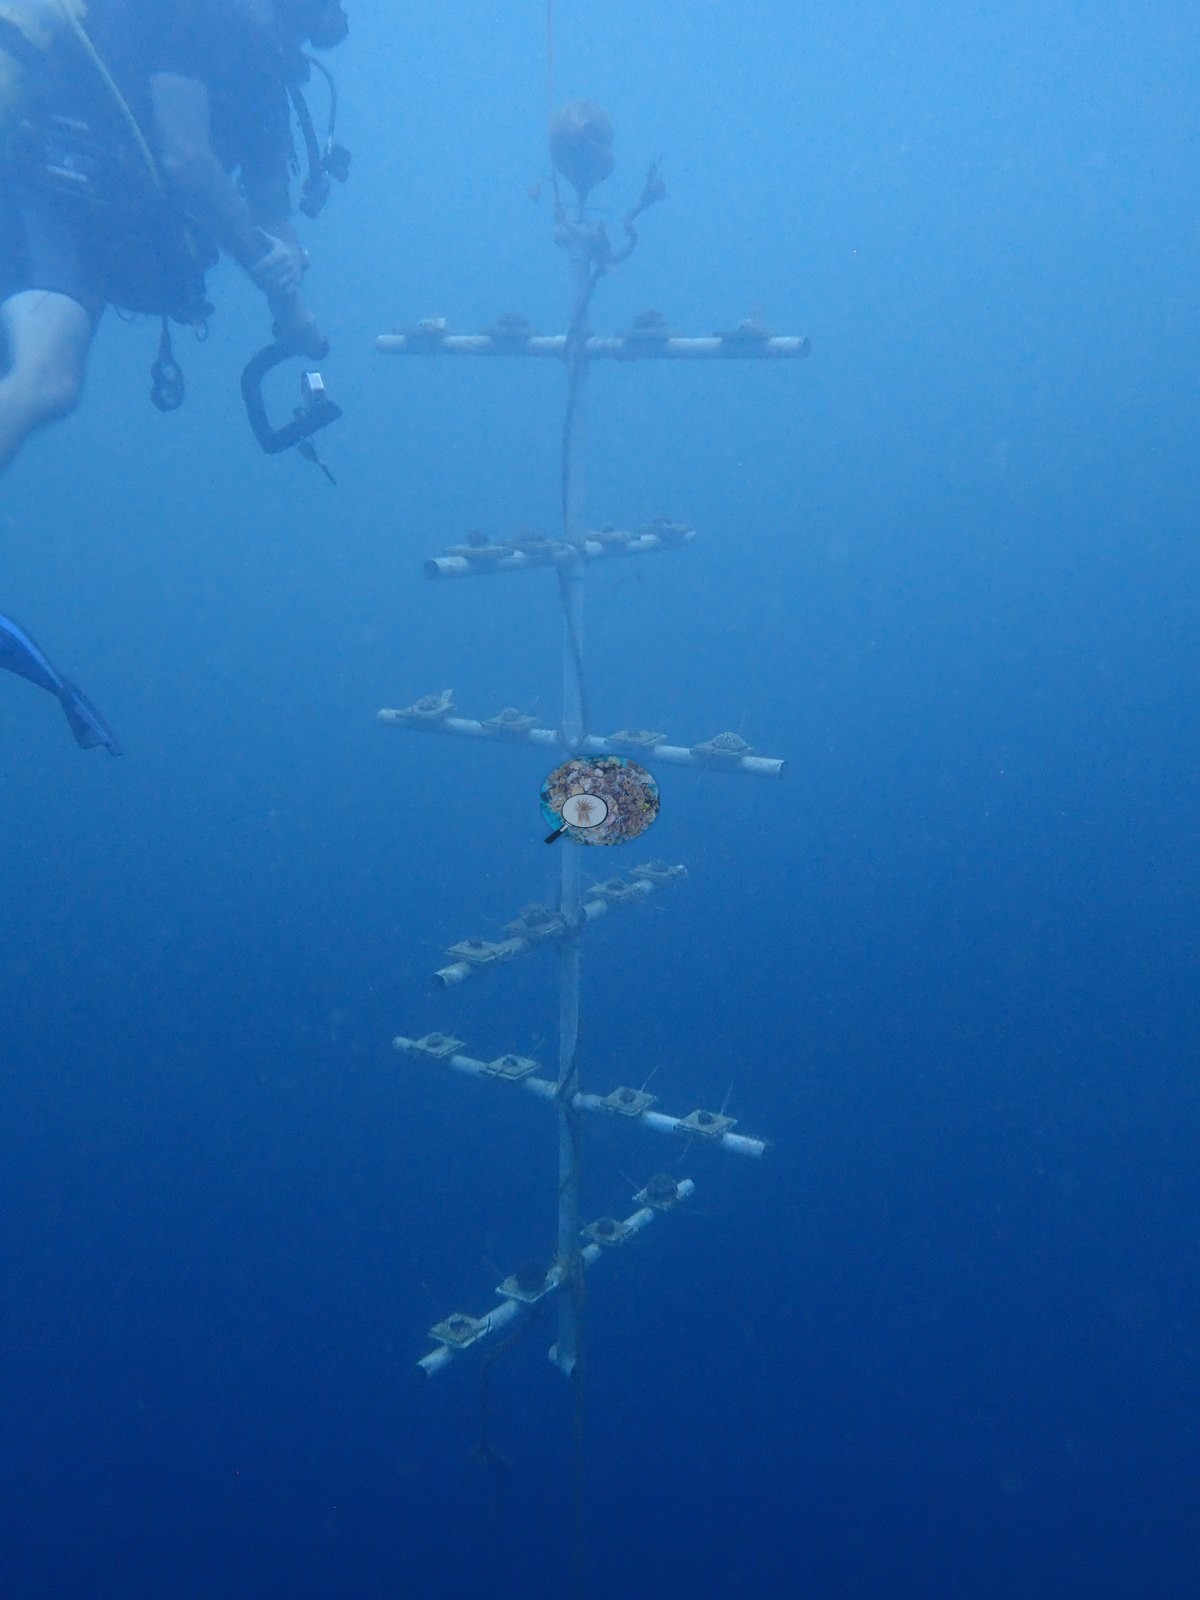
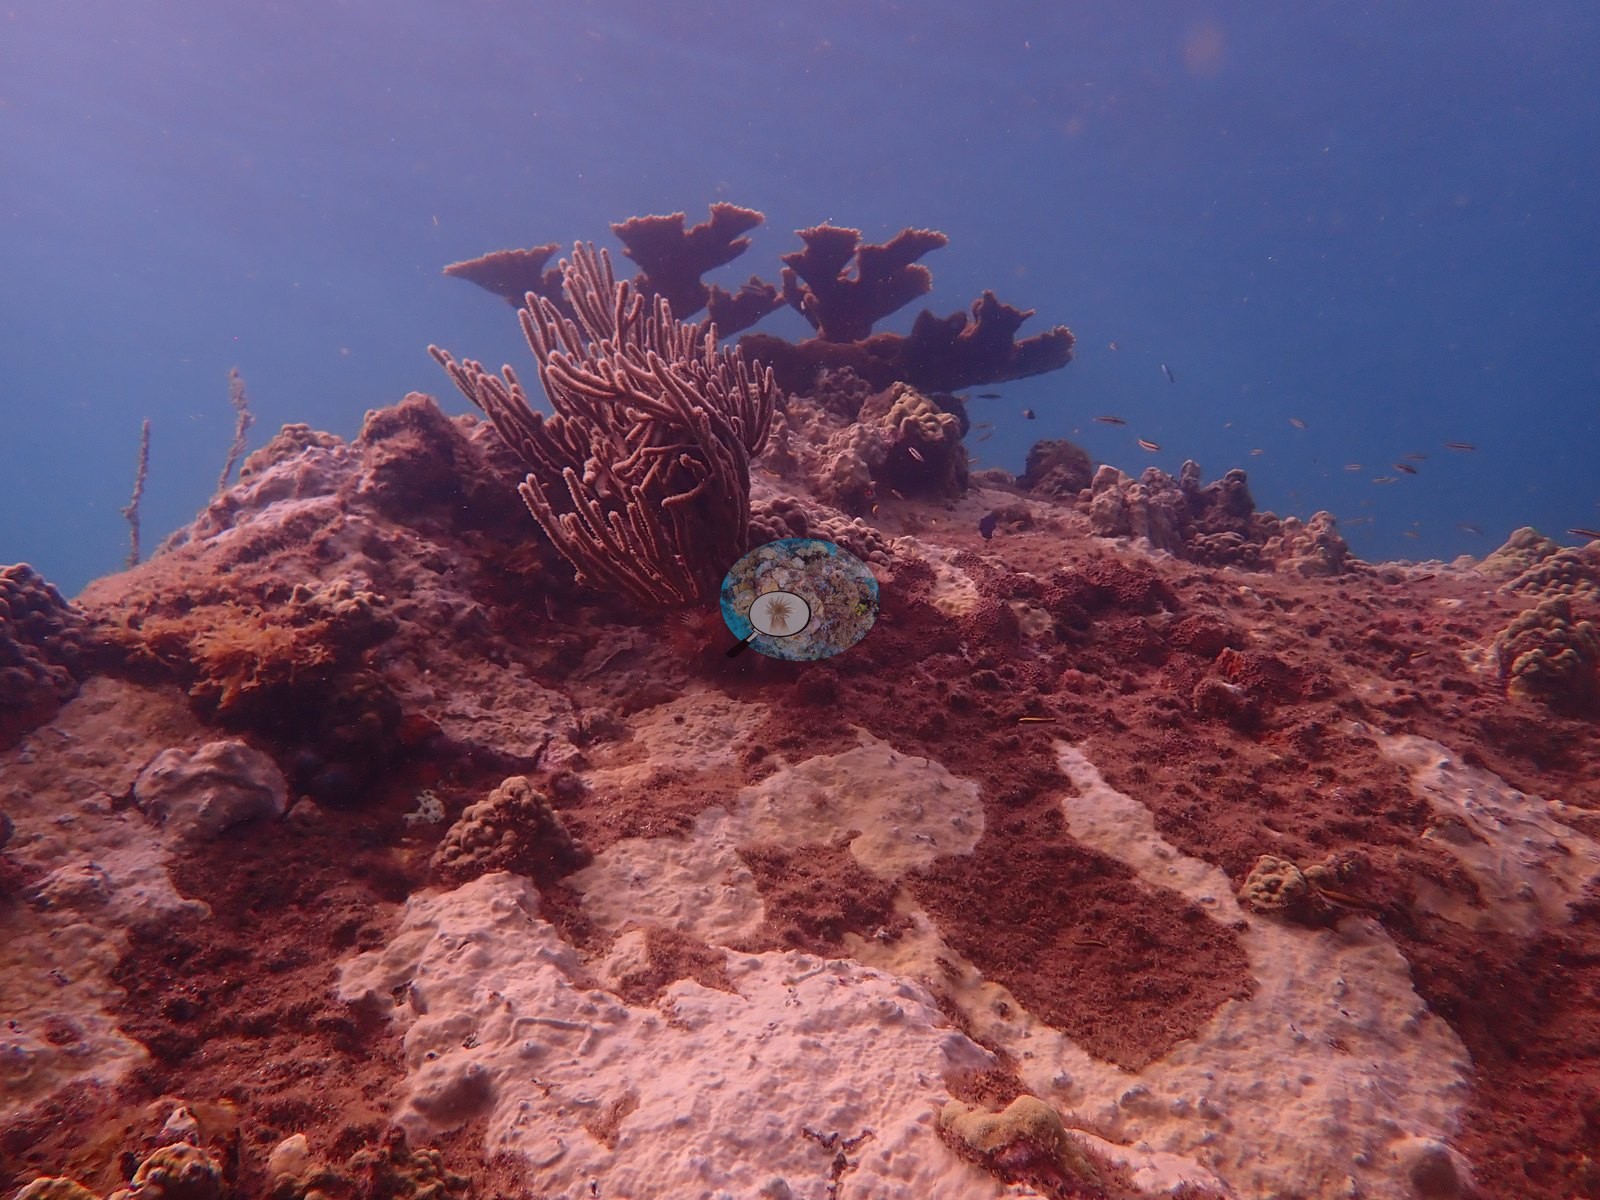
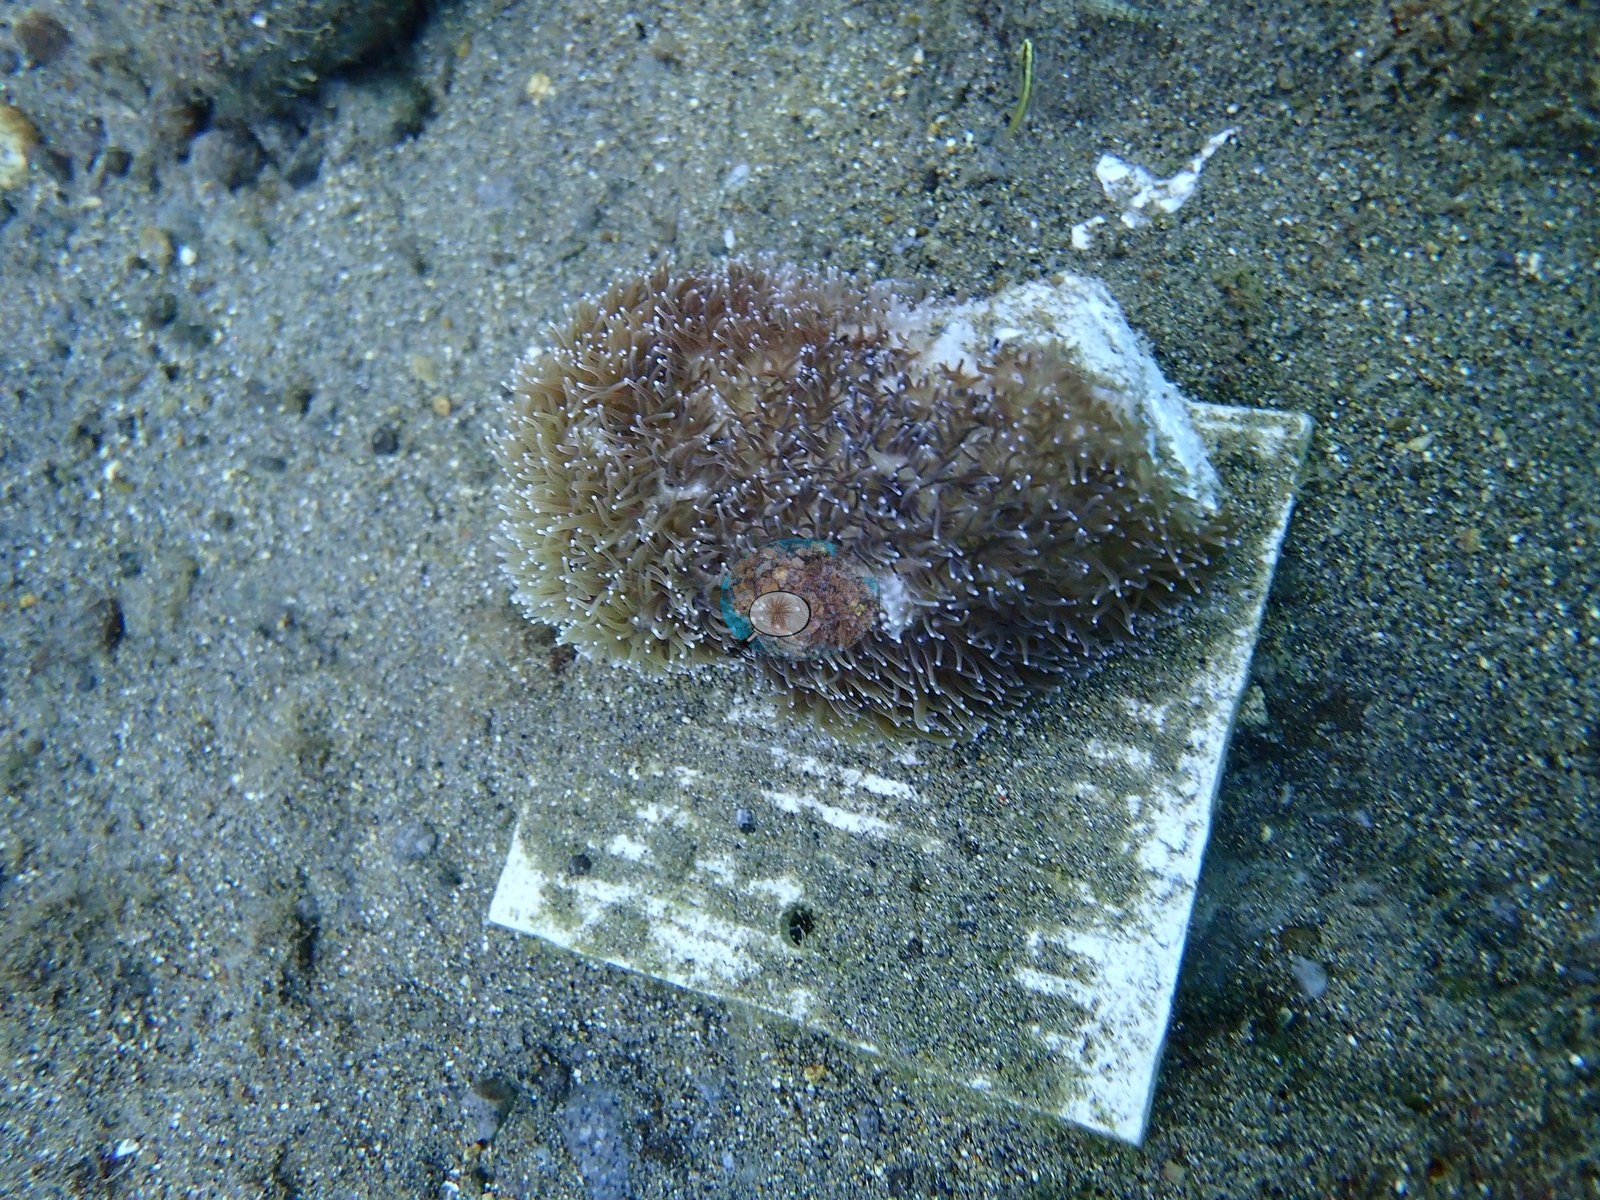
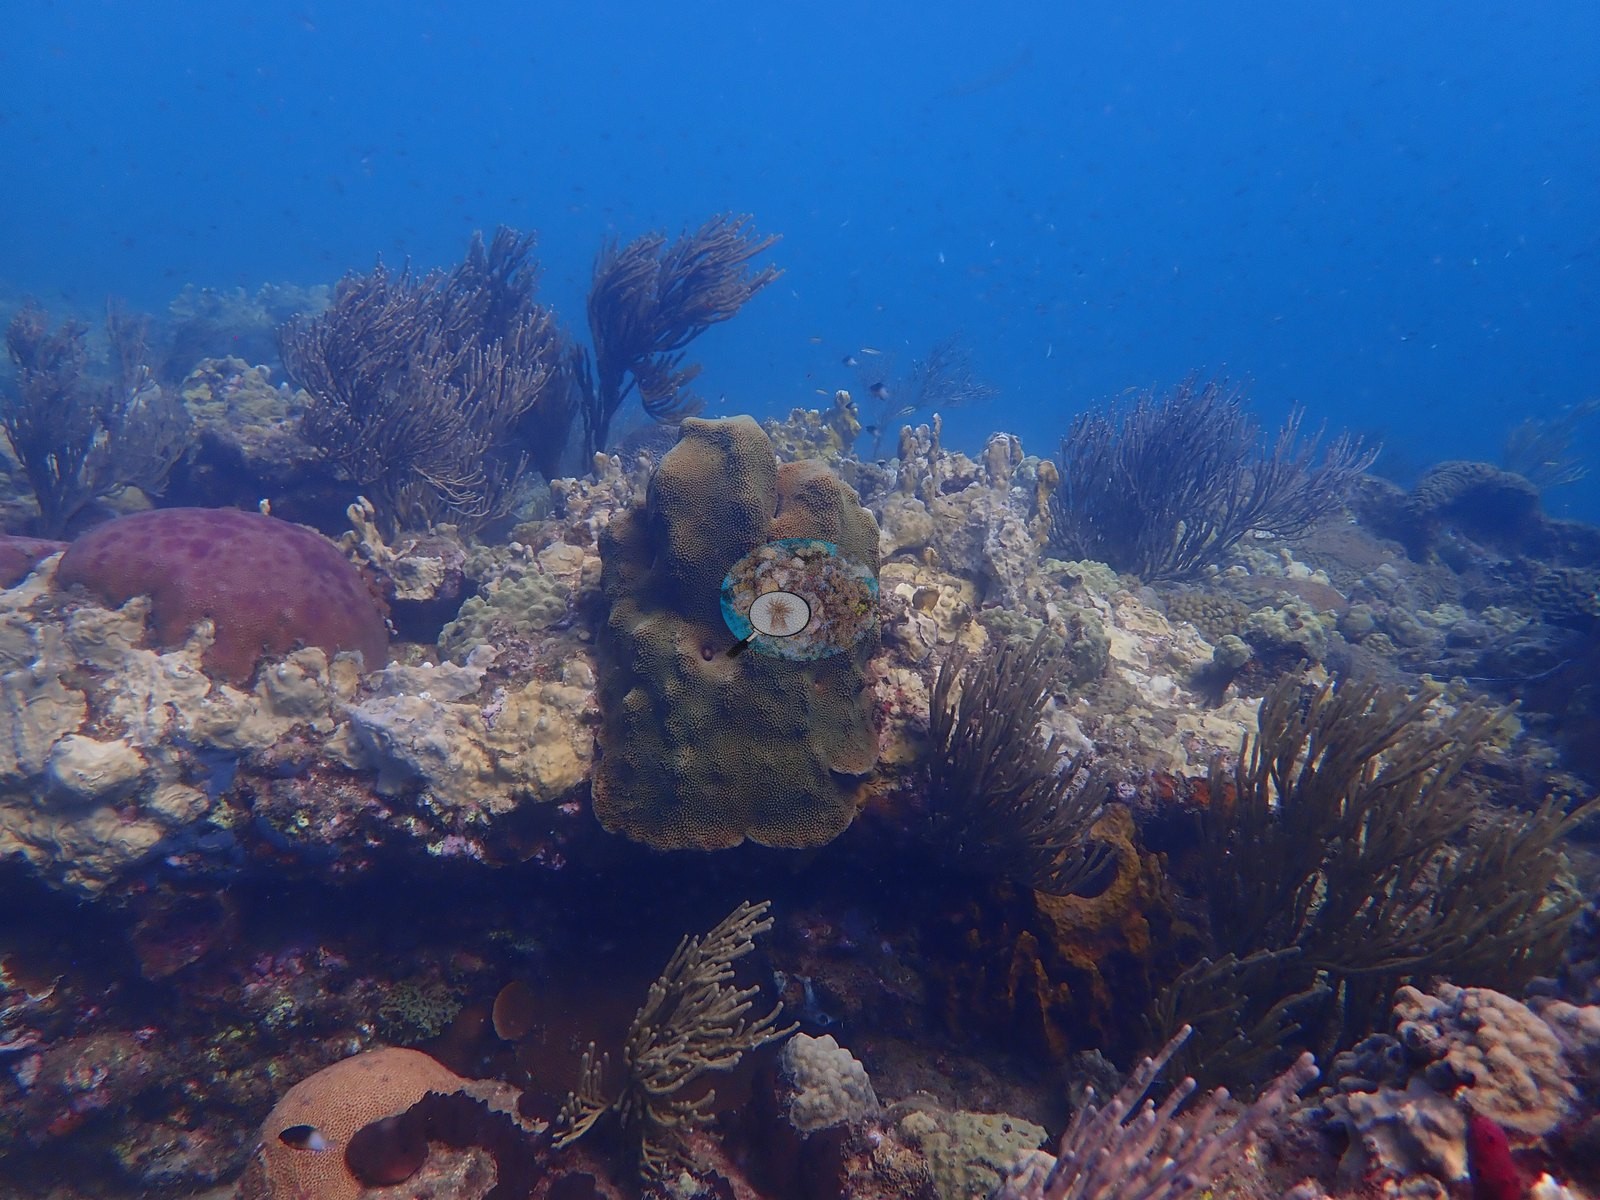
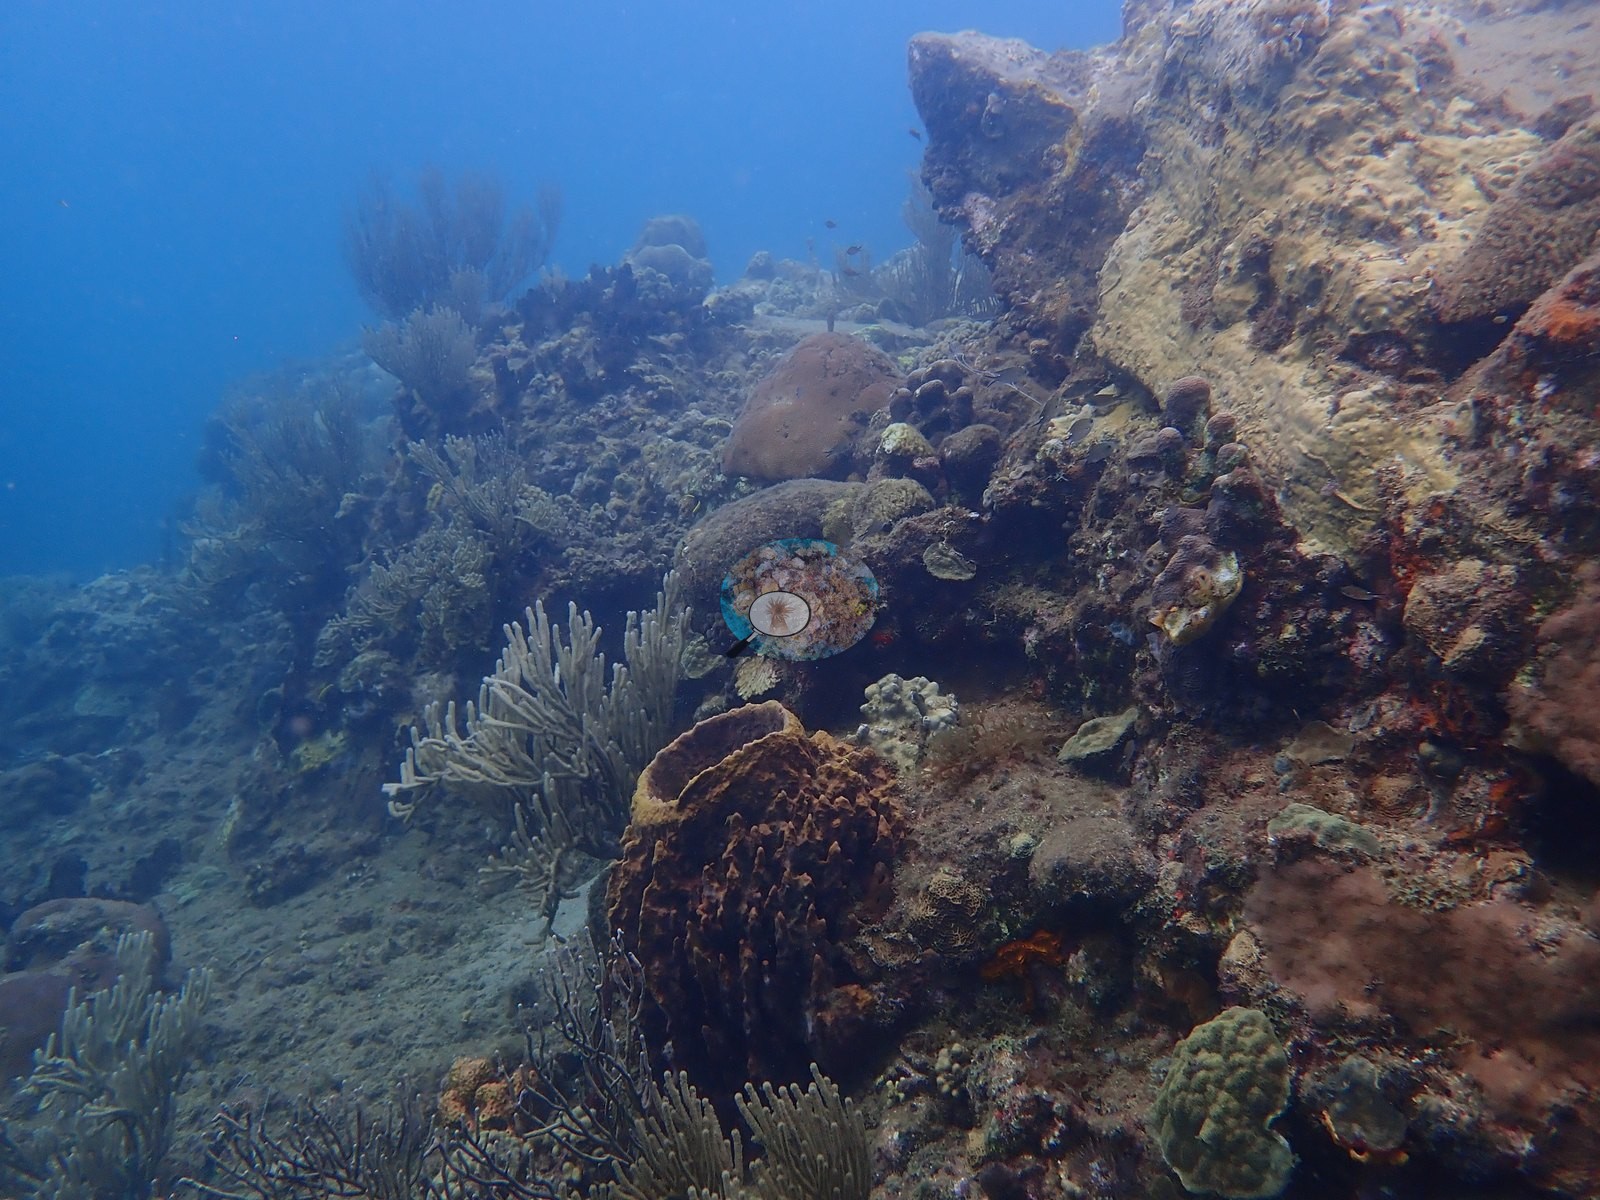
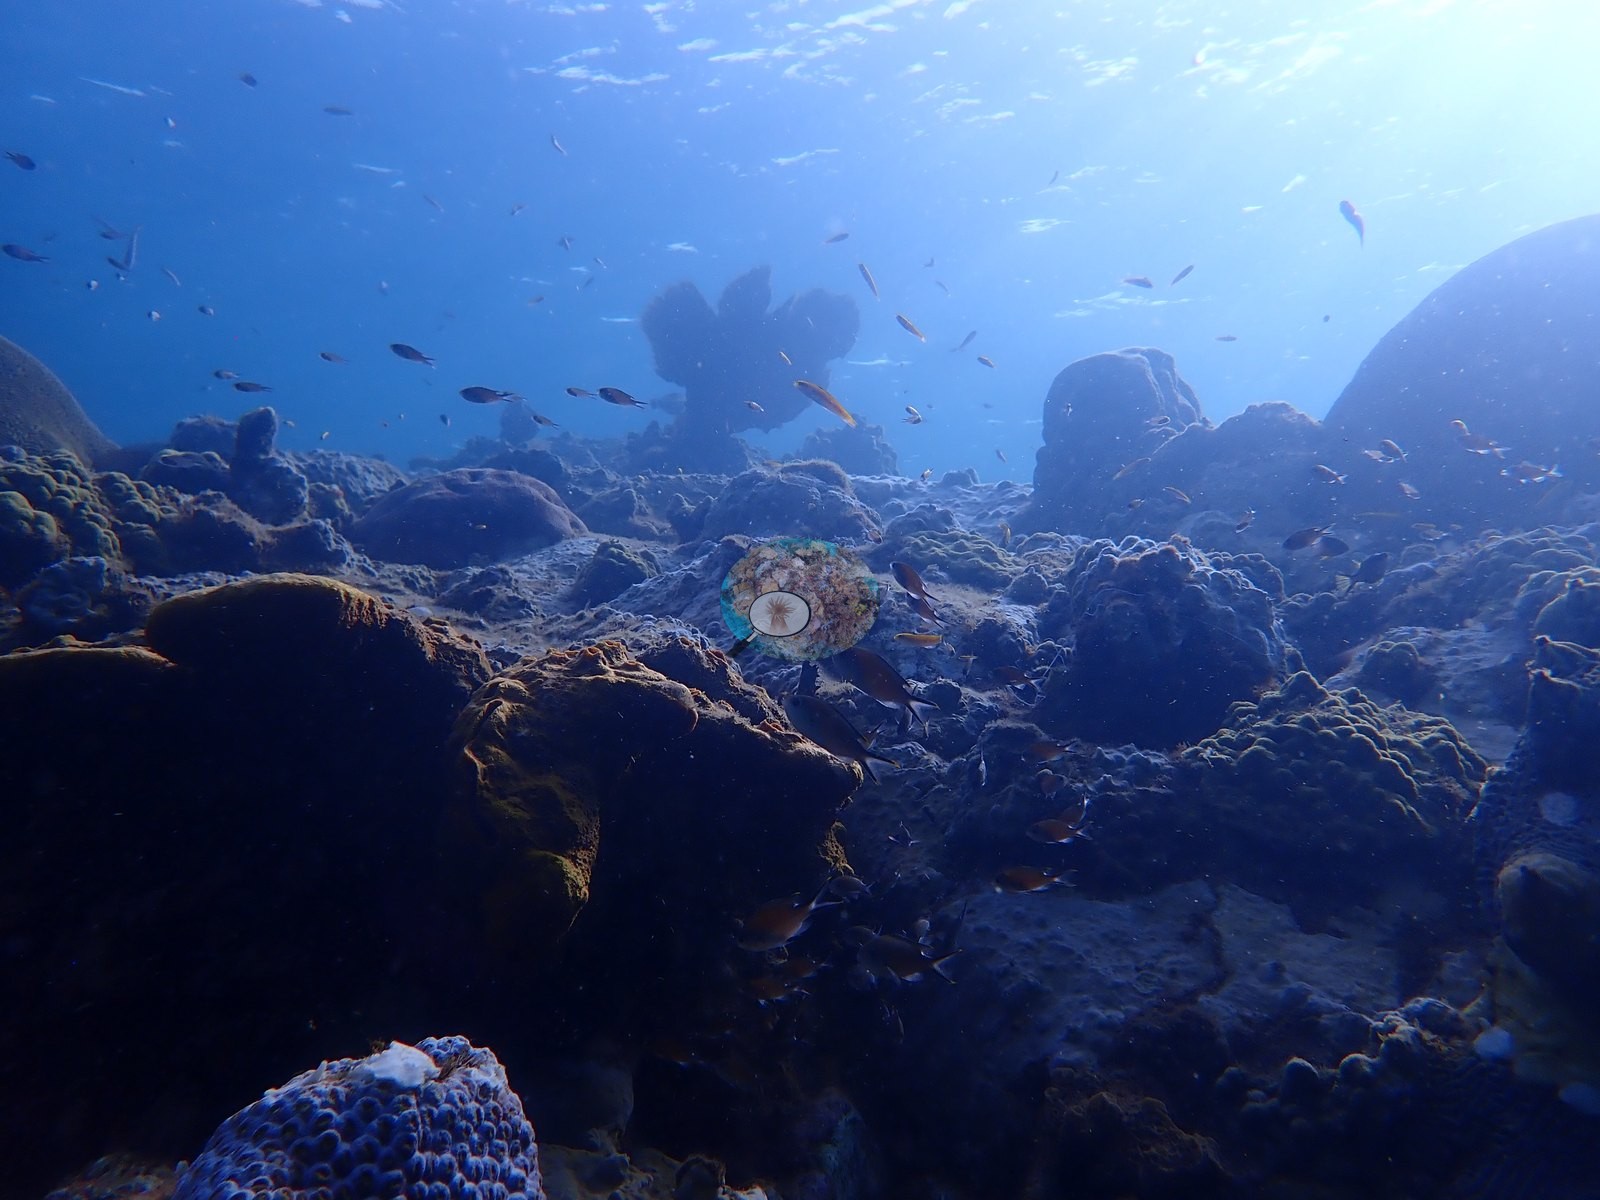
Champagne Reef, Soufrière Bay, Dominica — volcanic gas bubbles rise through the reef.
Coral cover
- Reference: Claude CV point count (this site's photos)
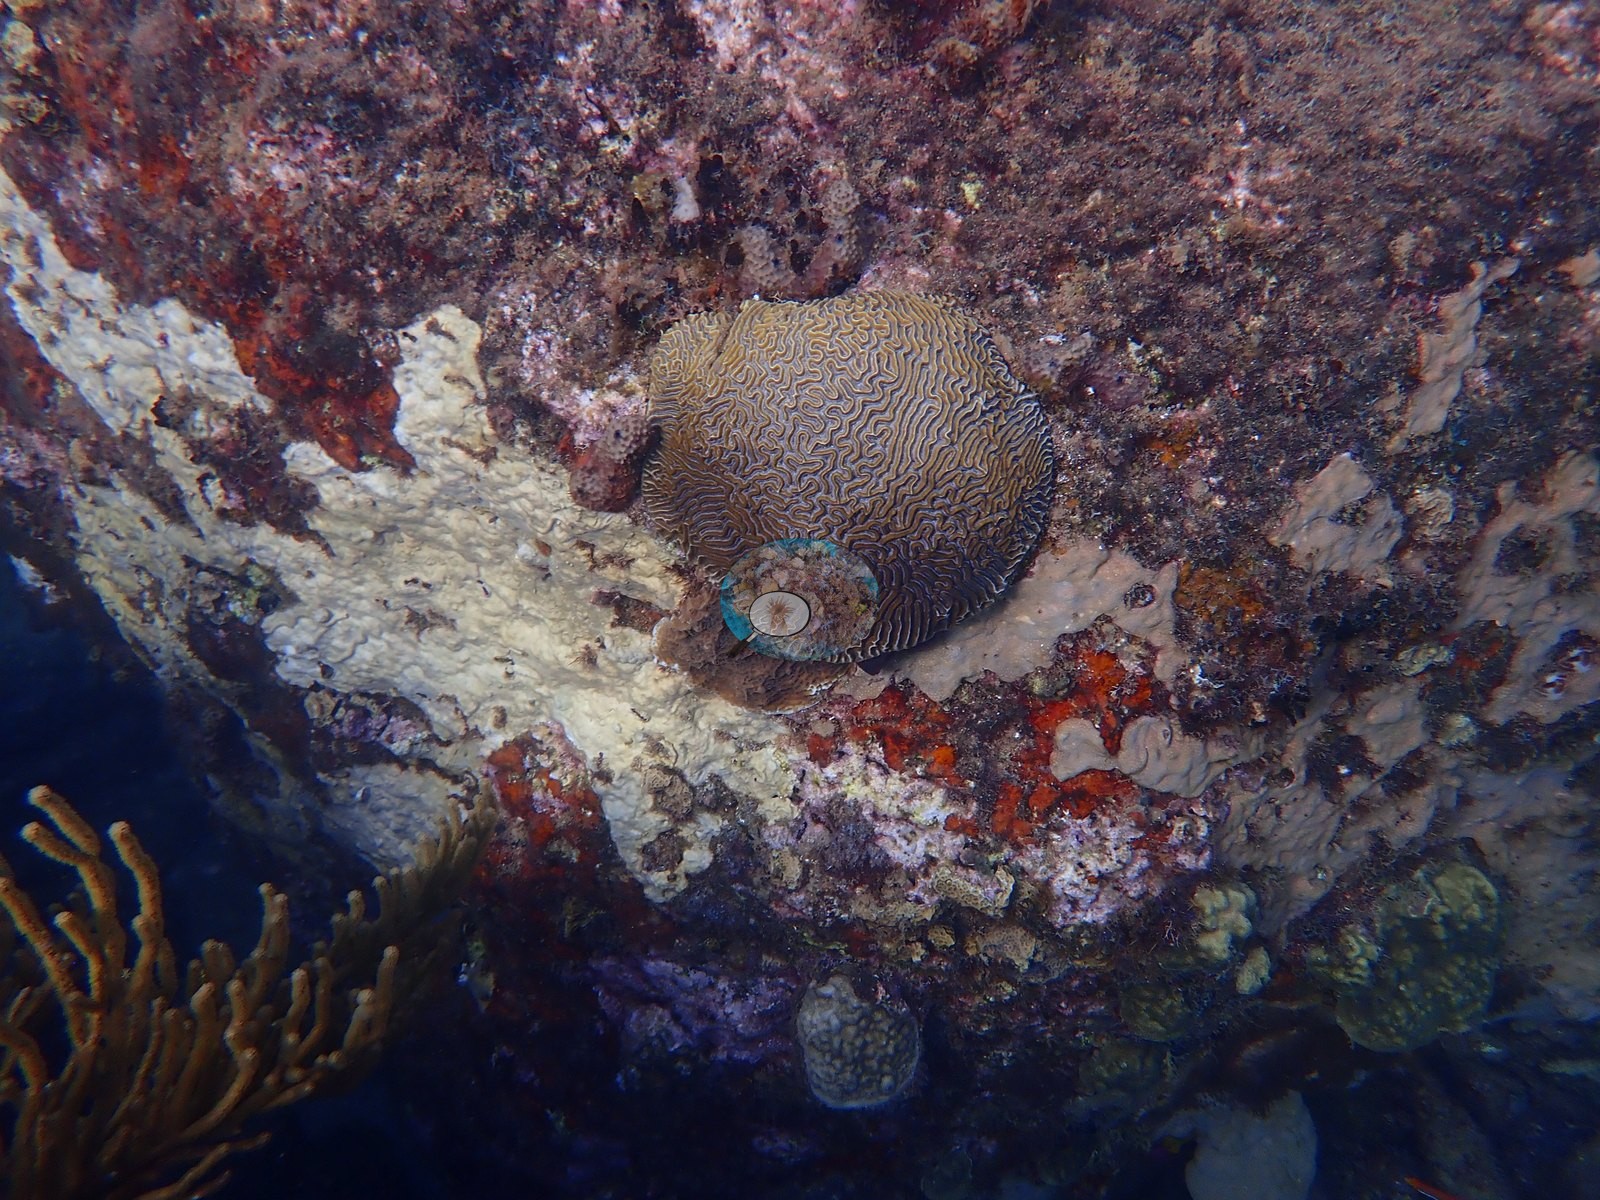
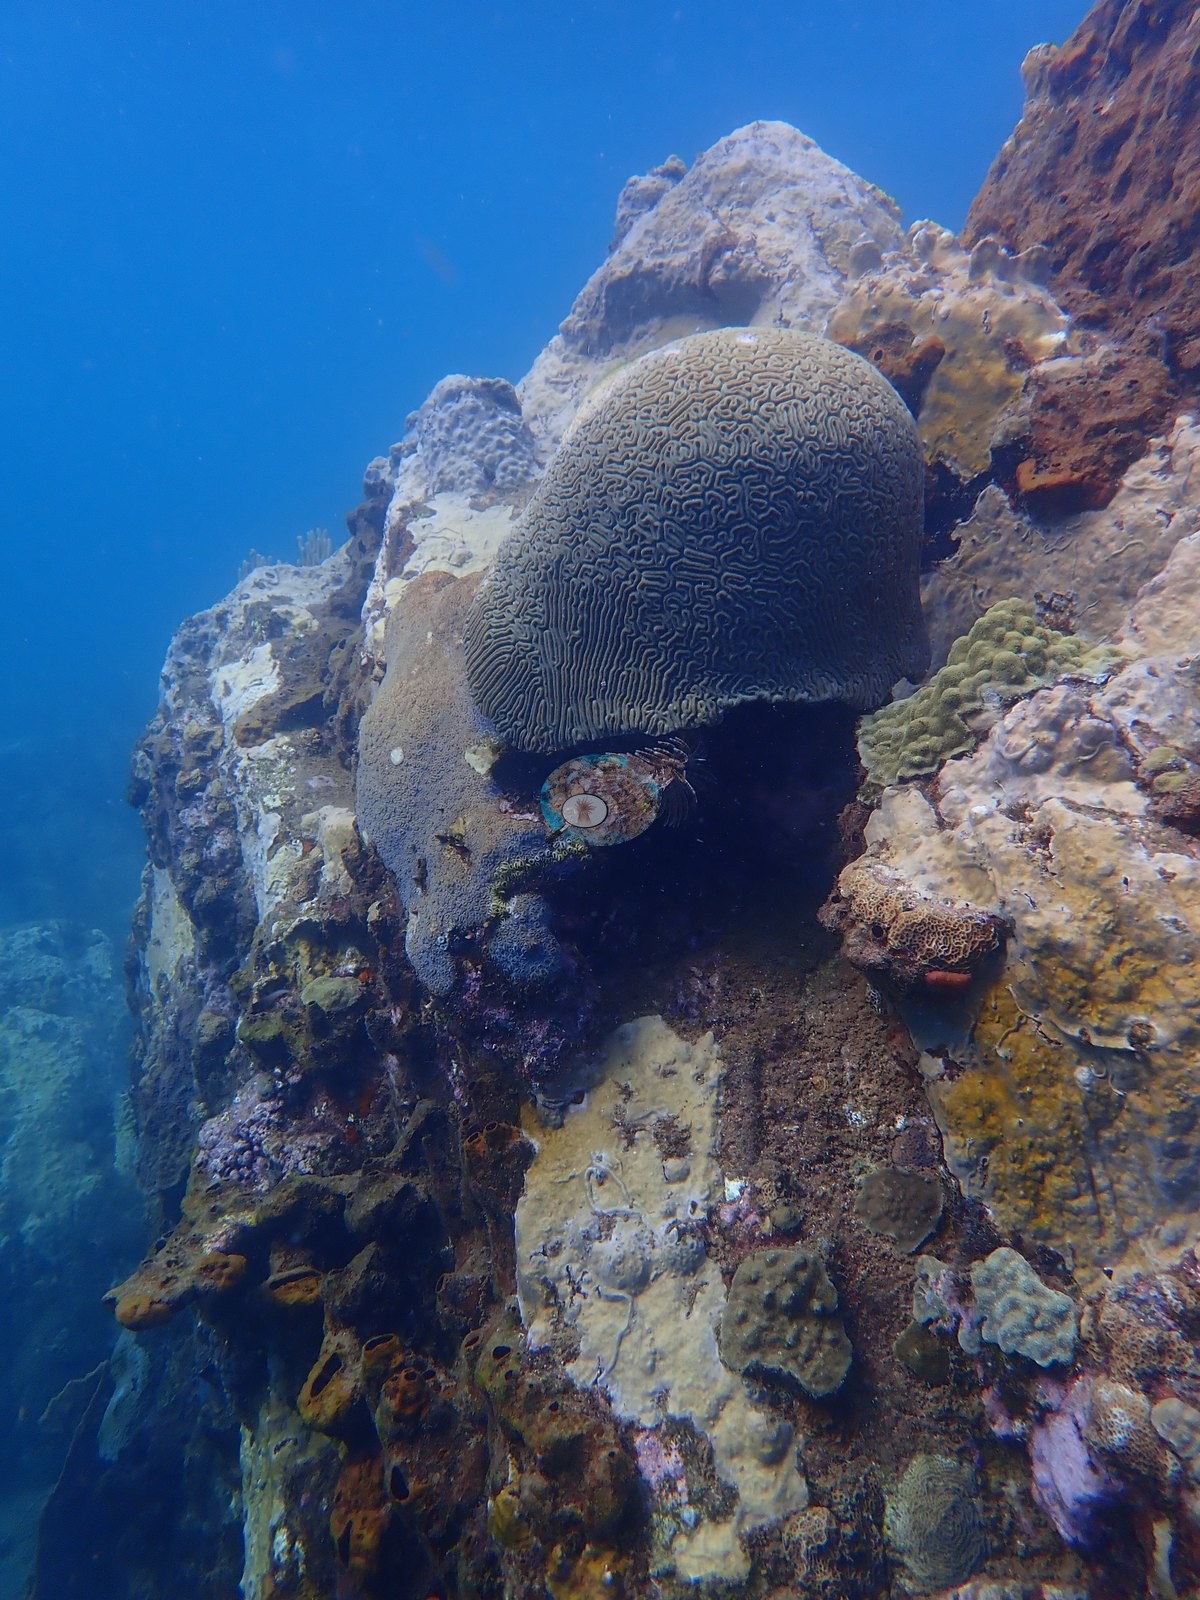
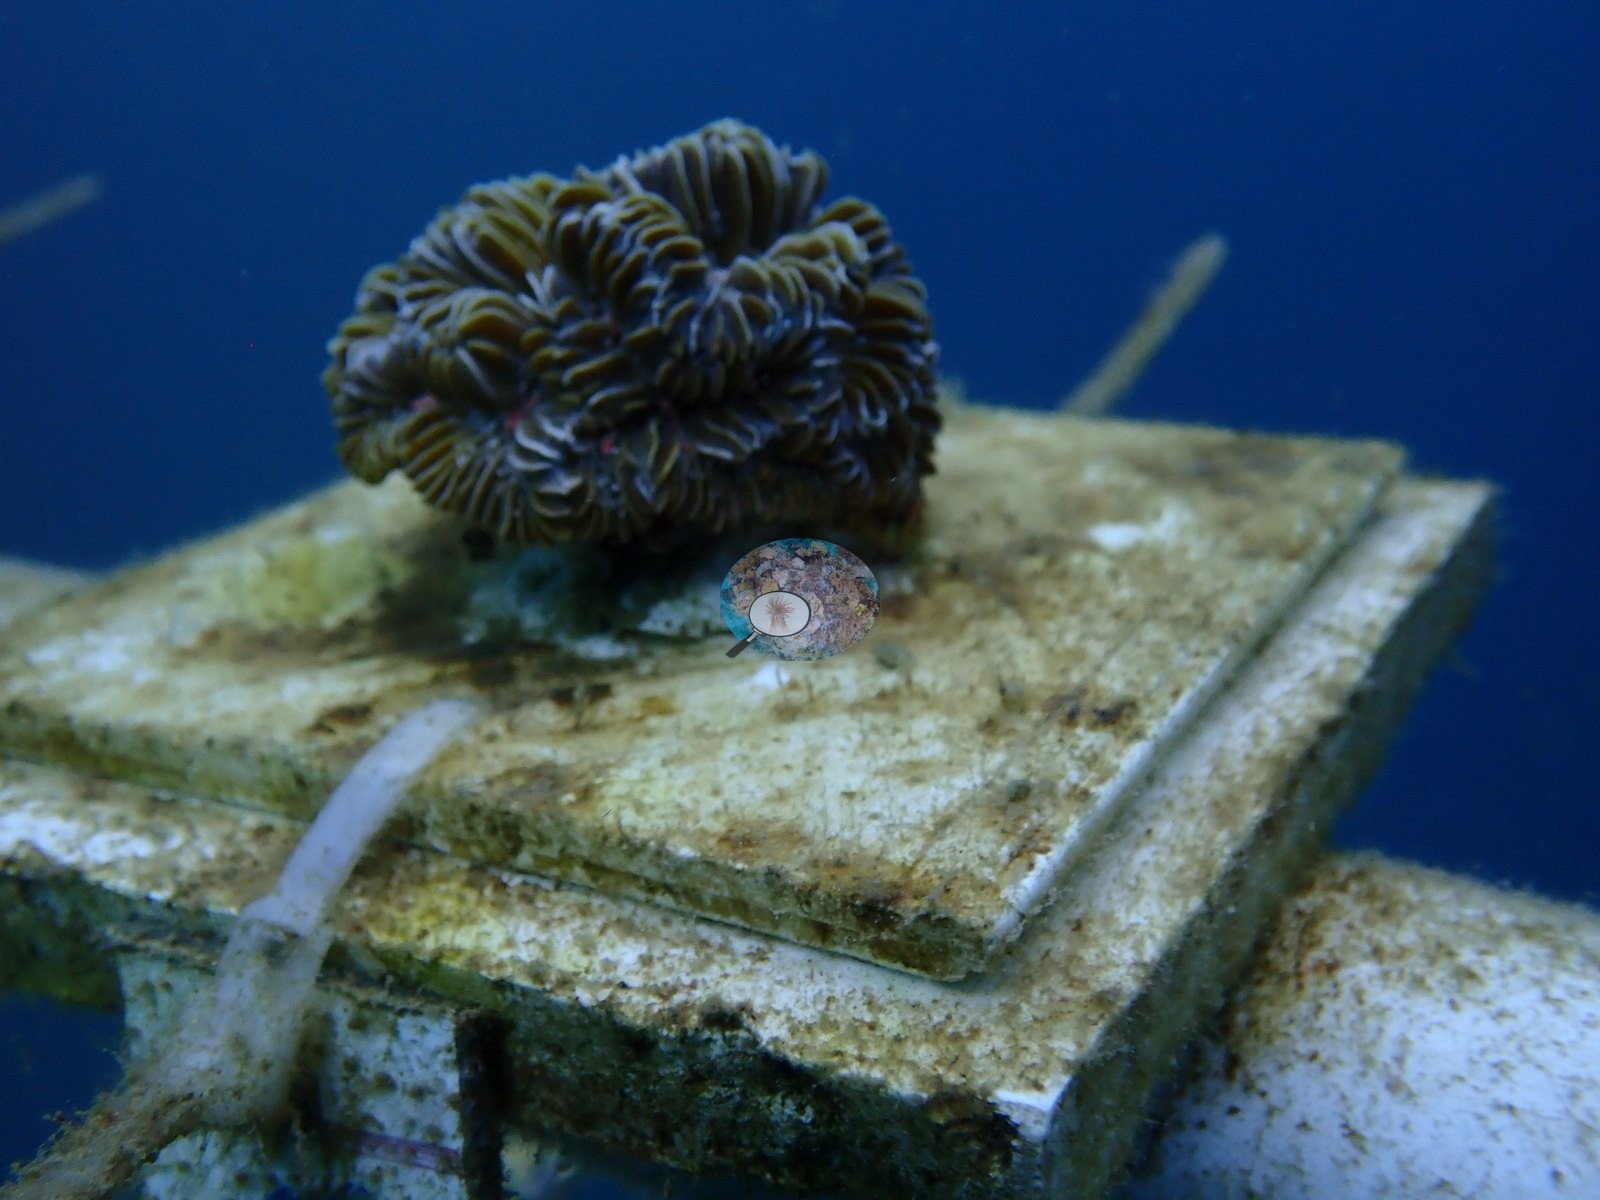
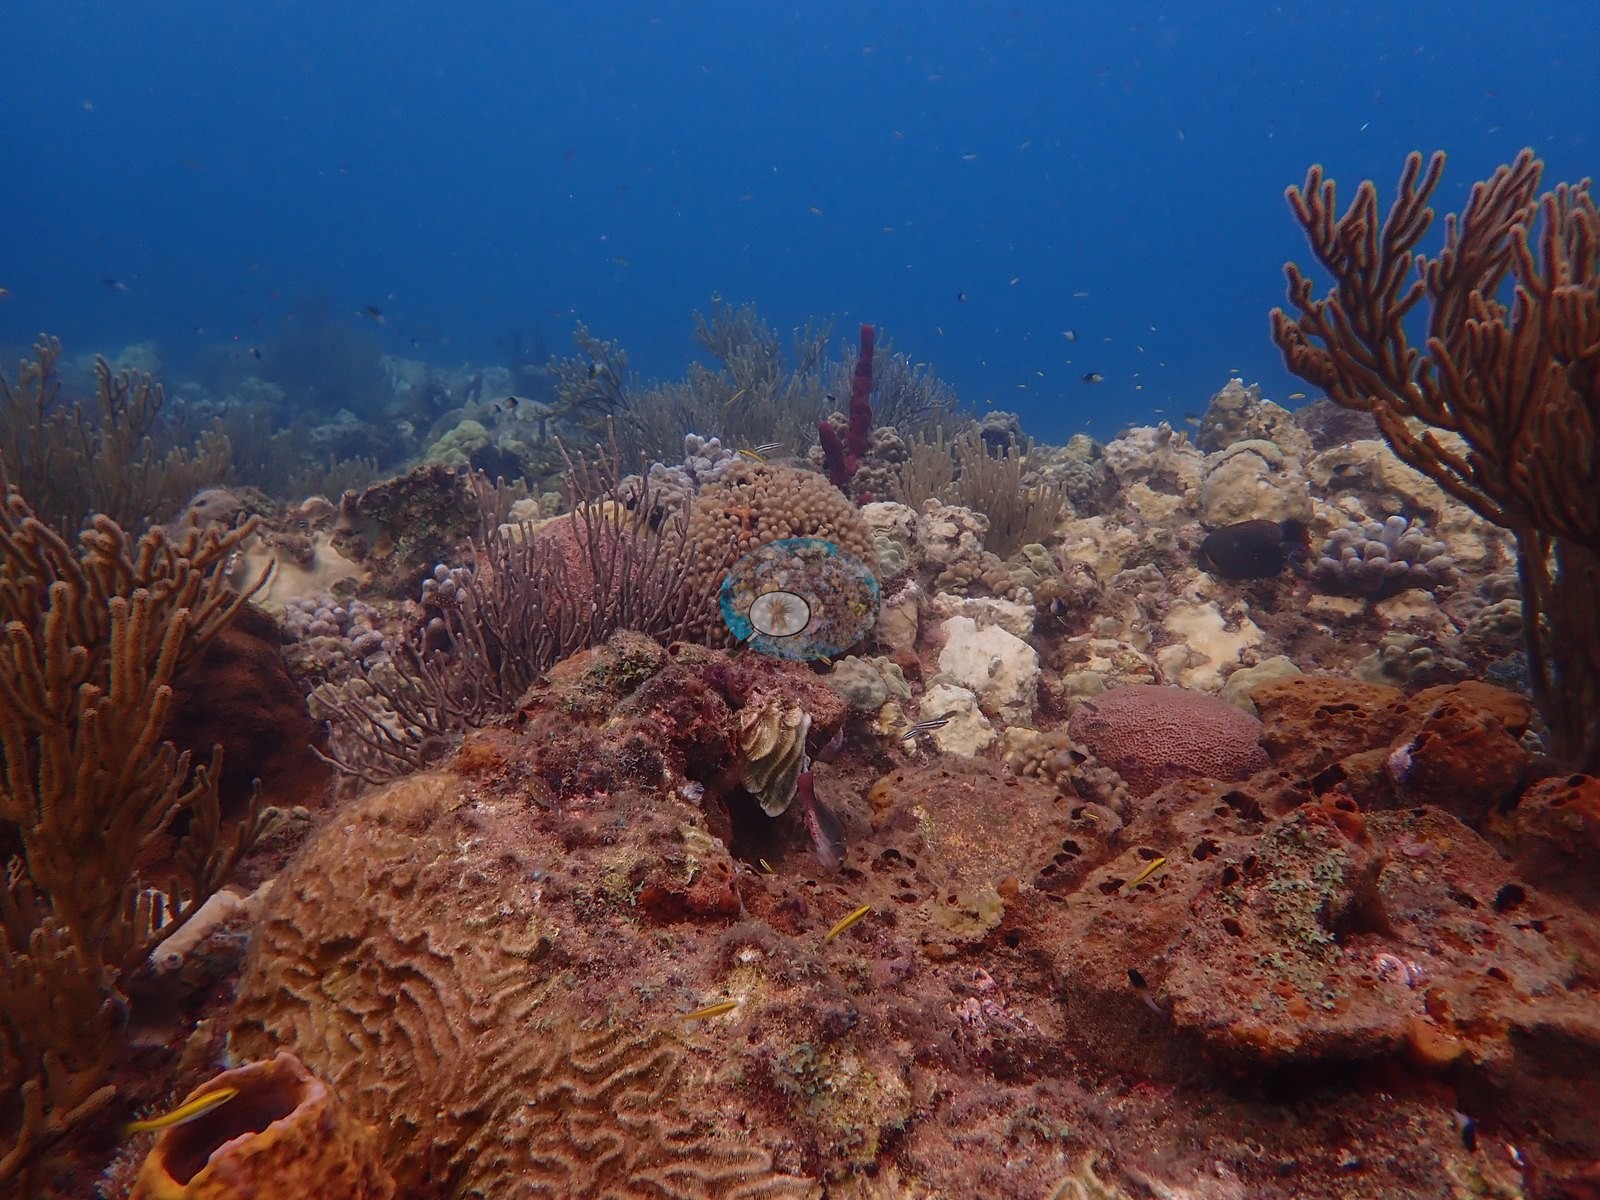
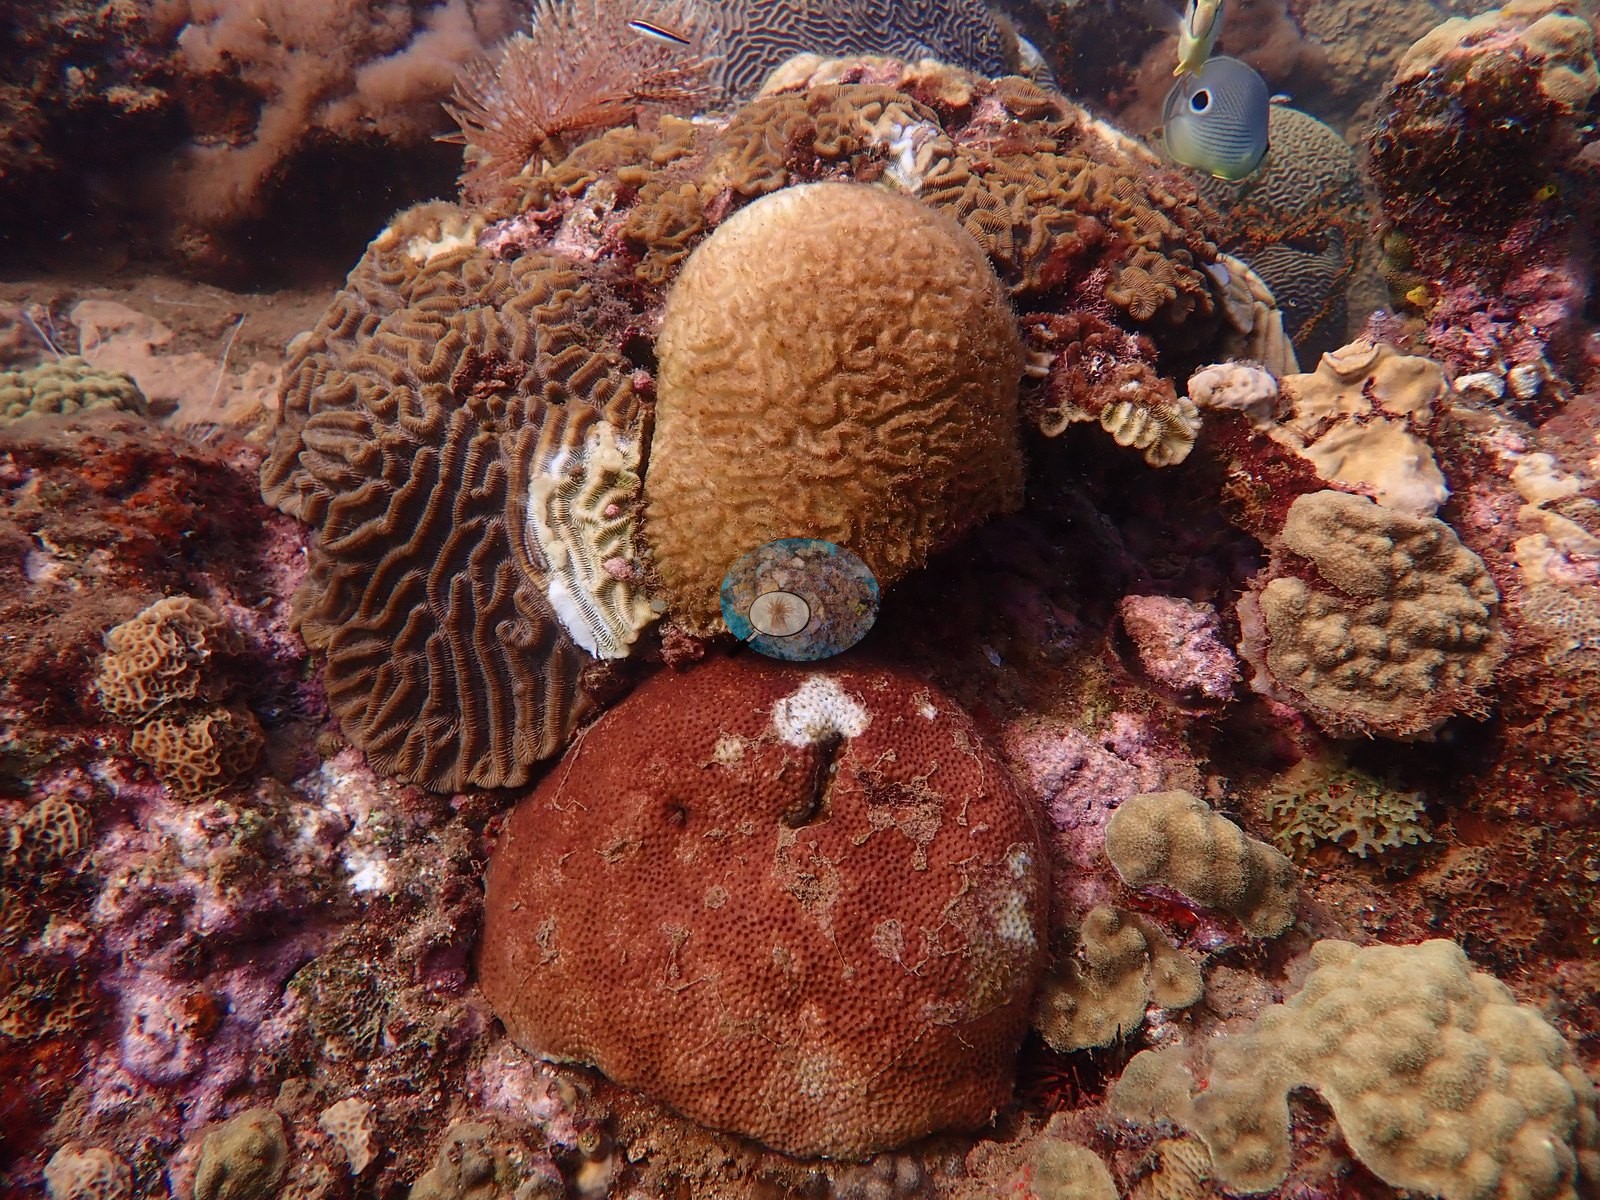
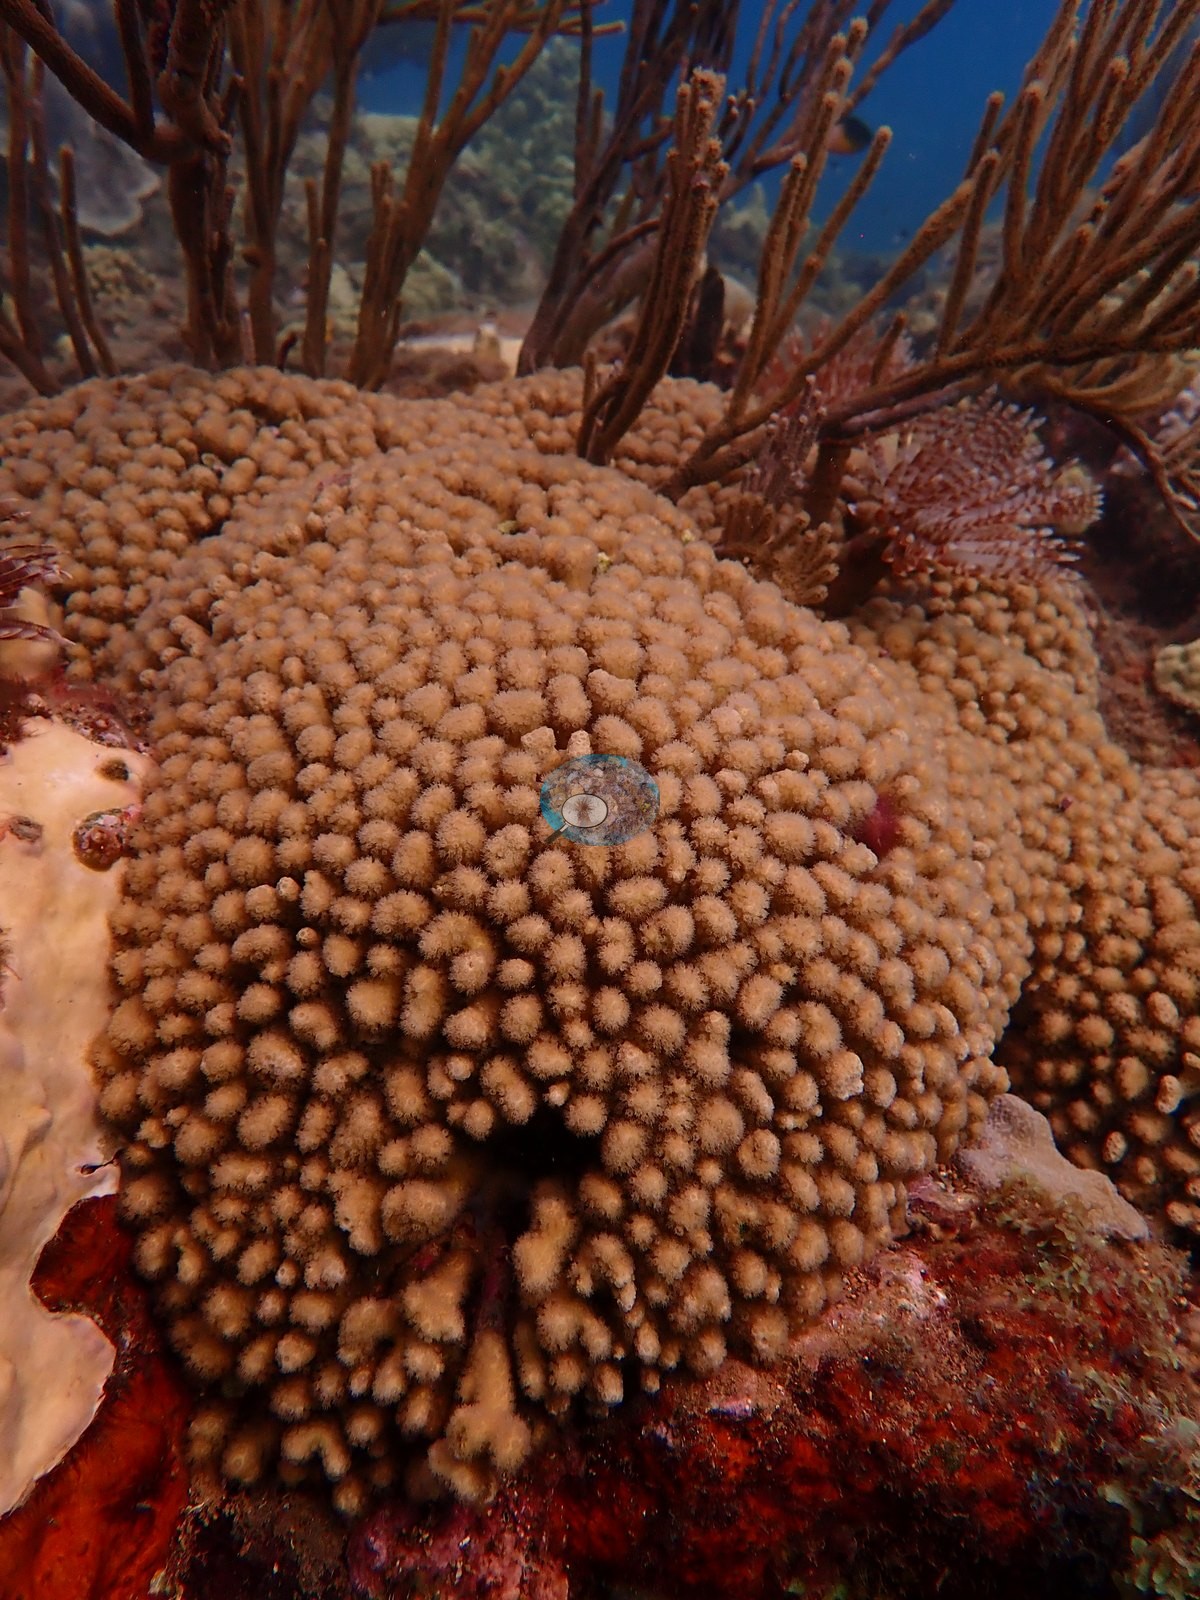
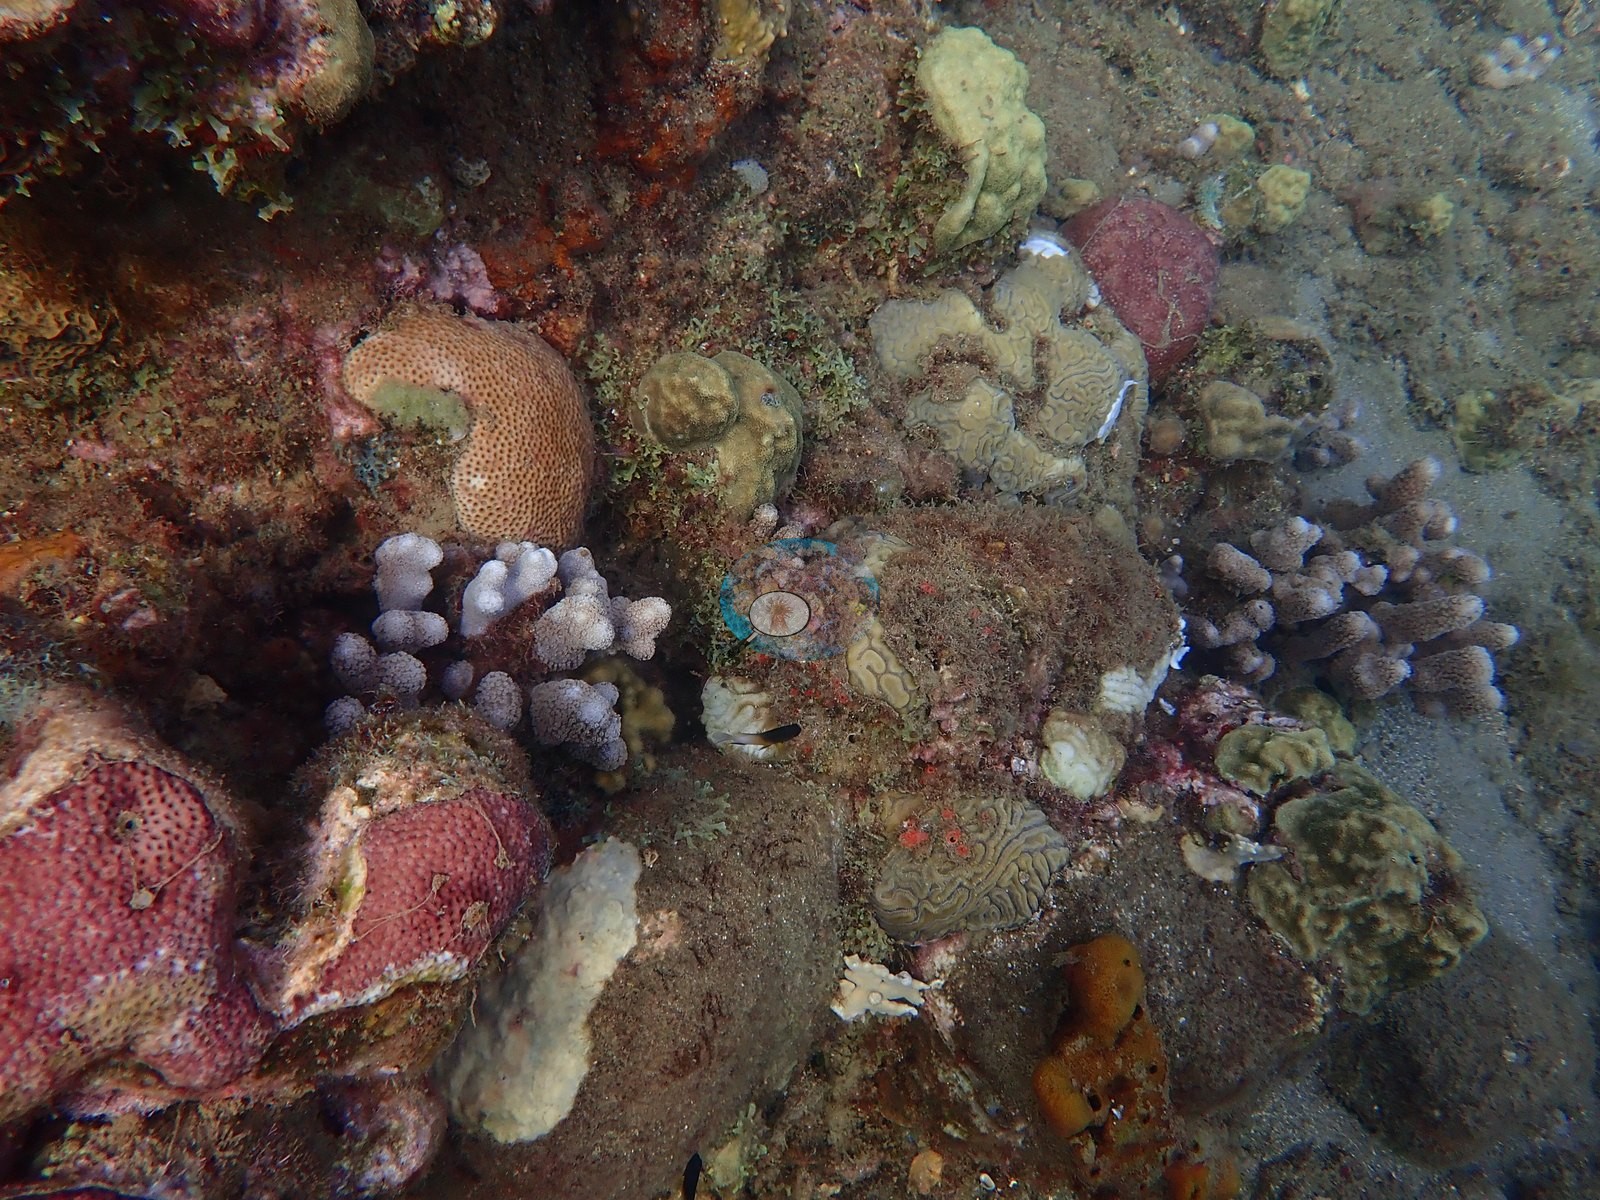
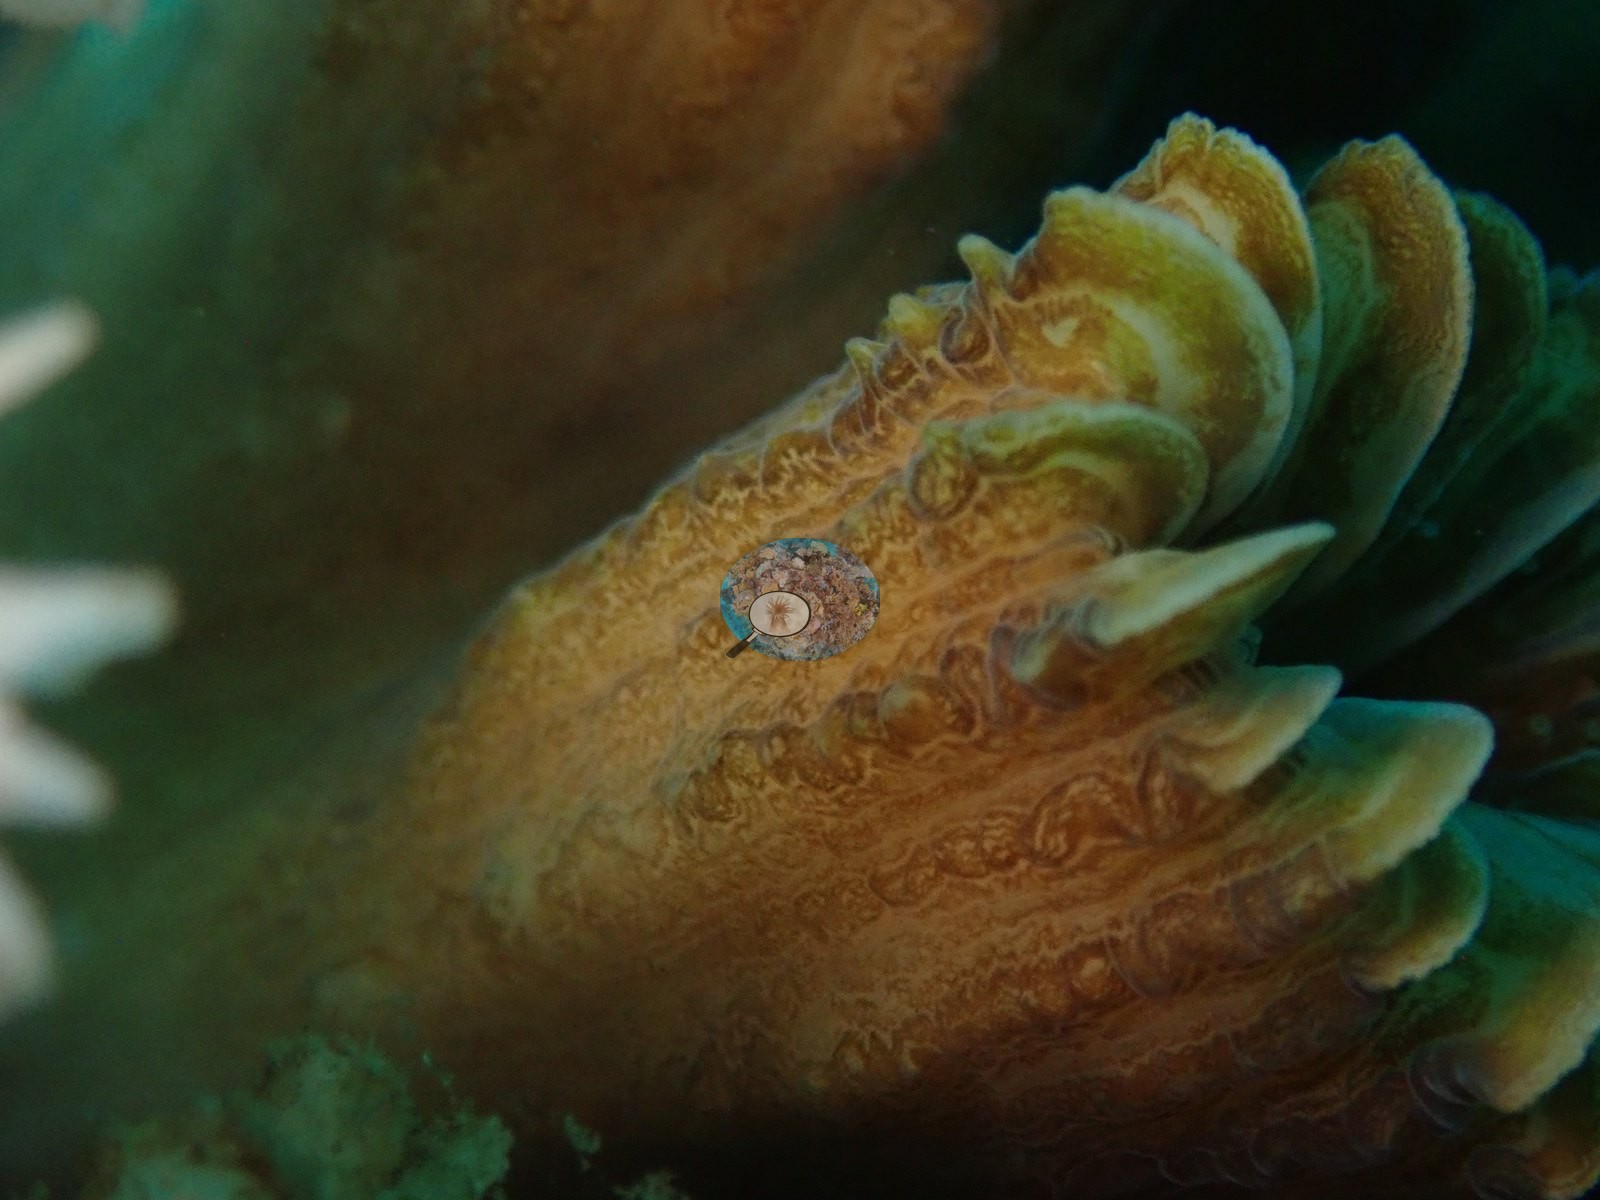
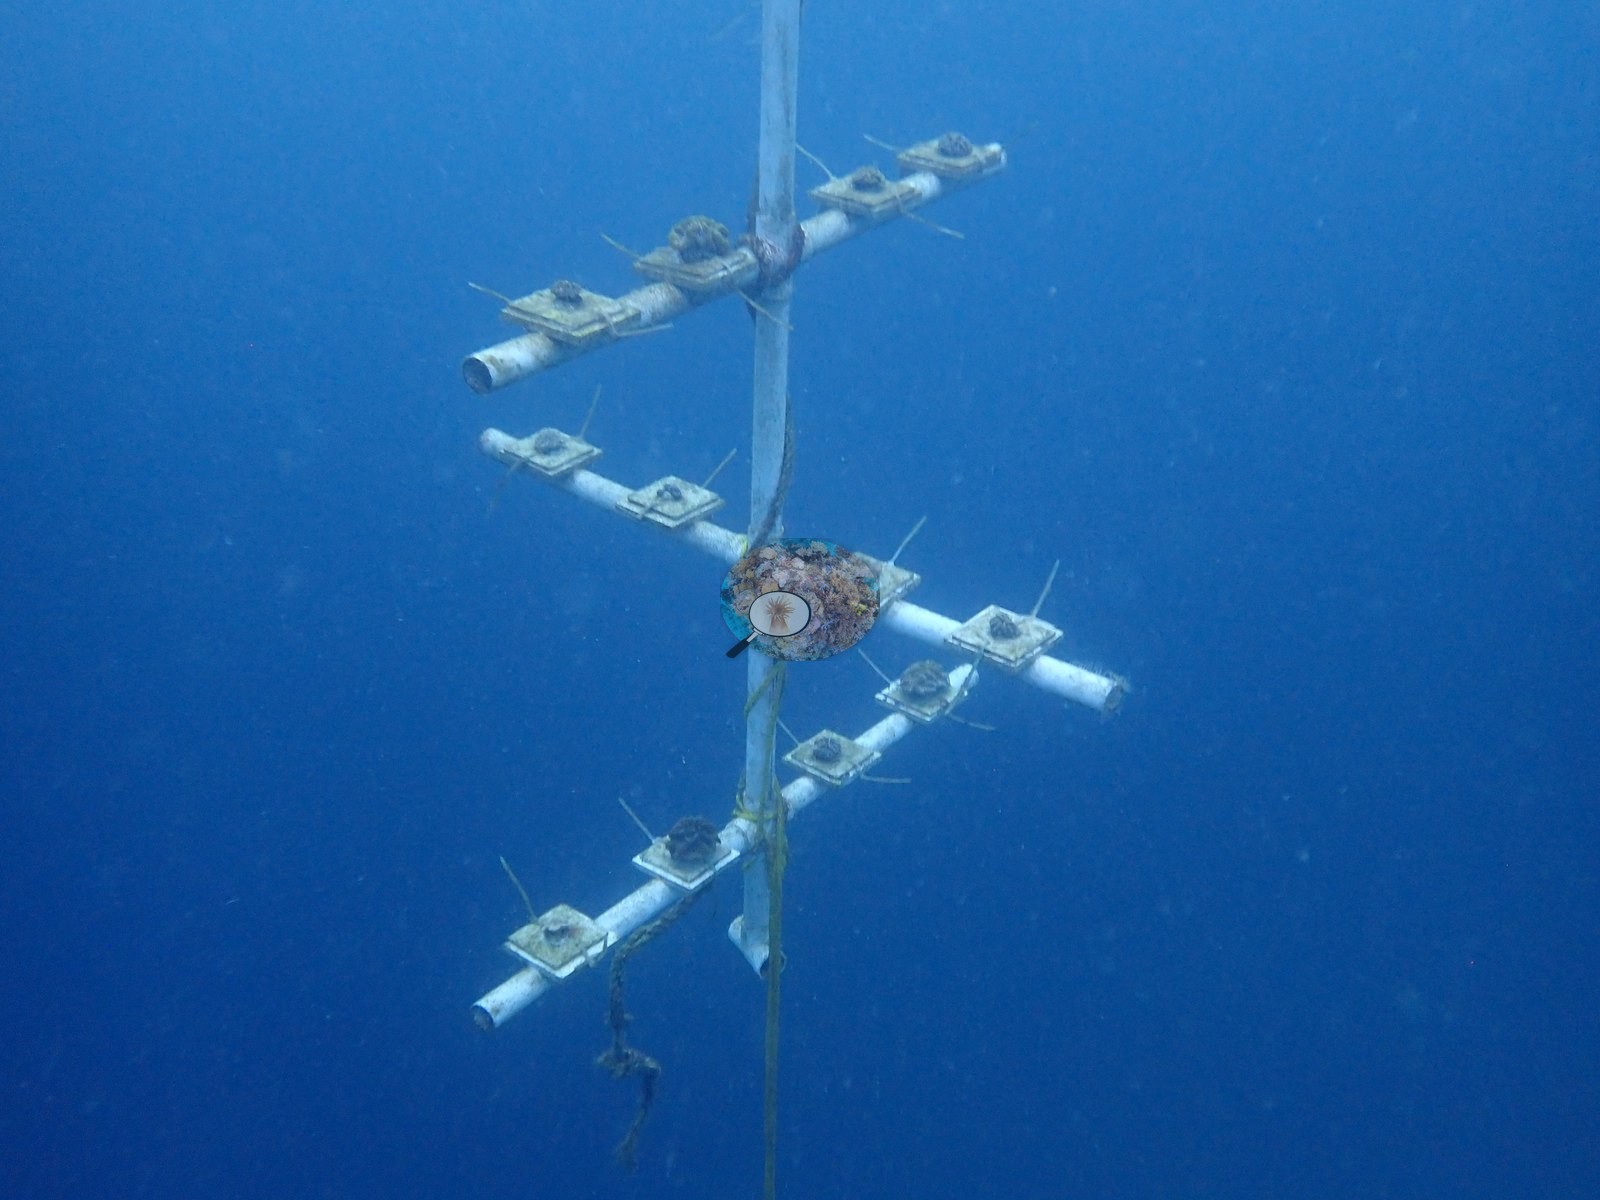
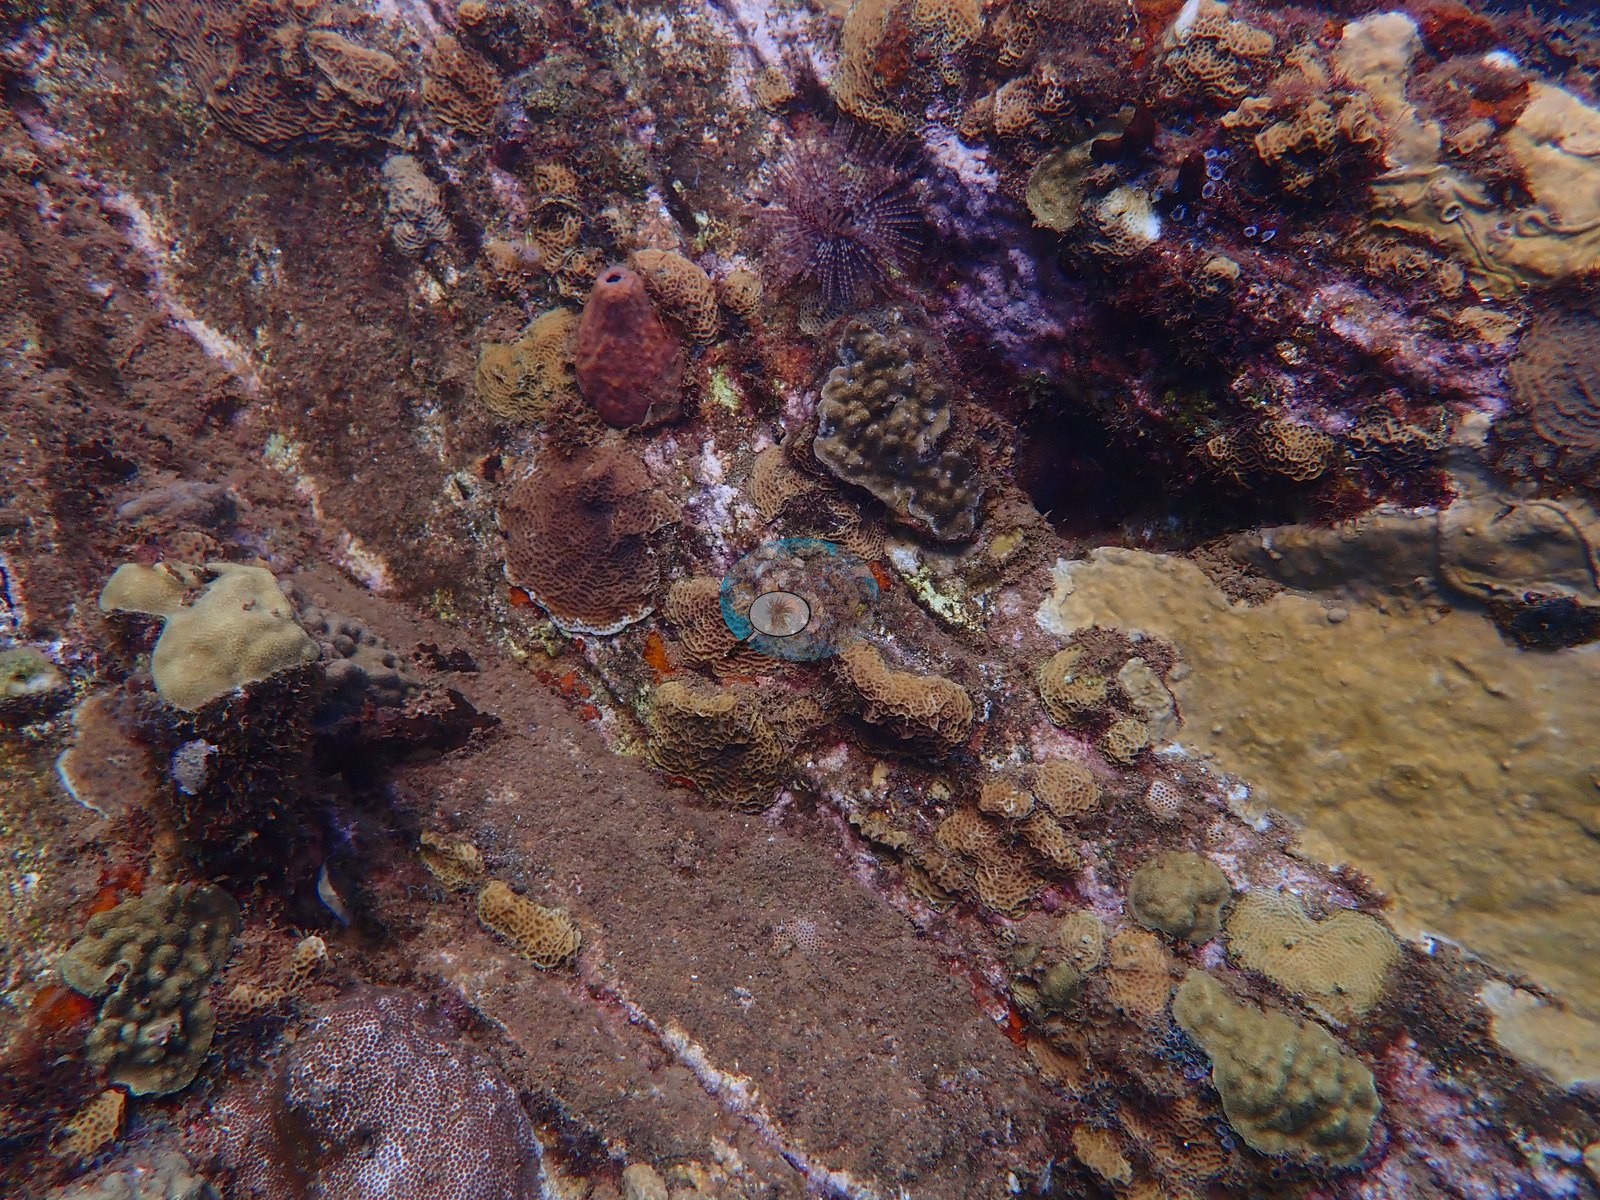
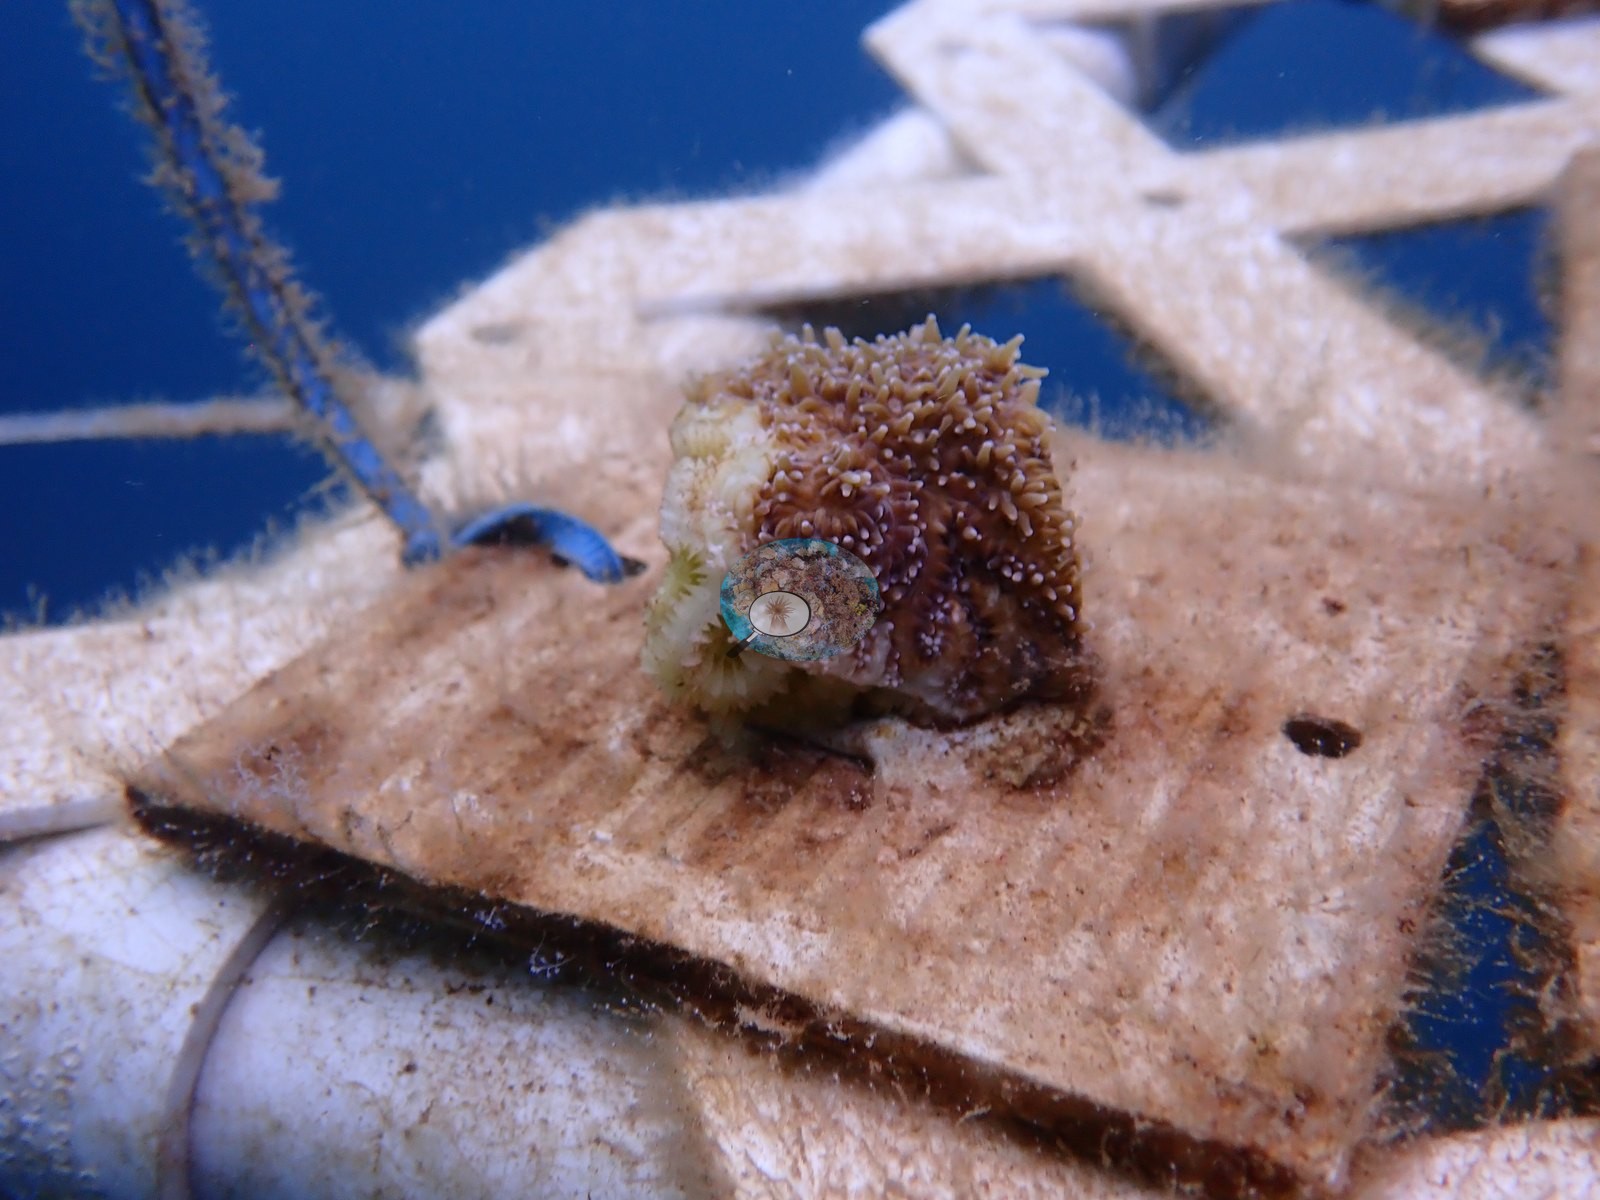
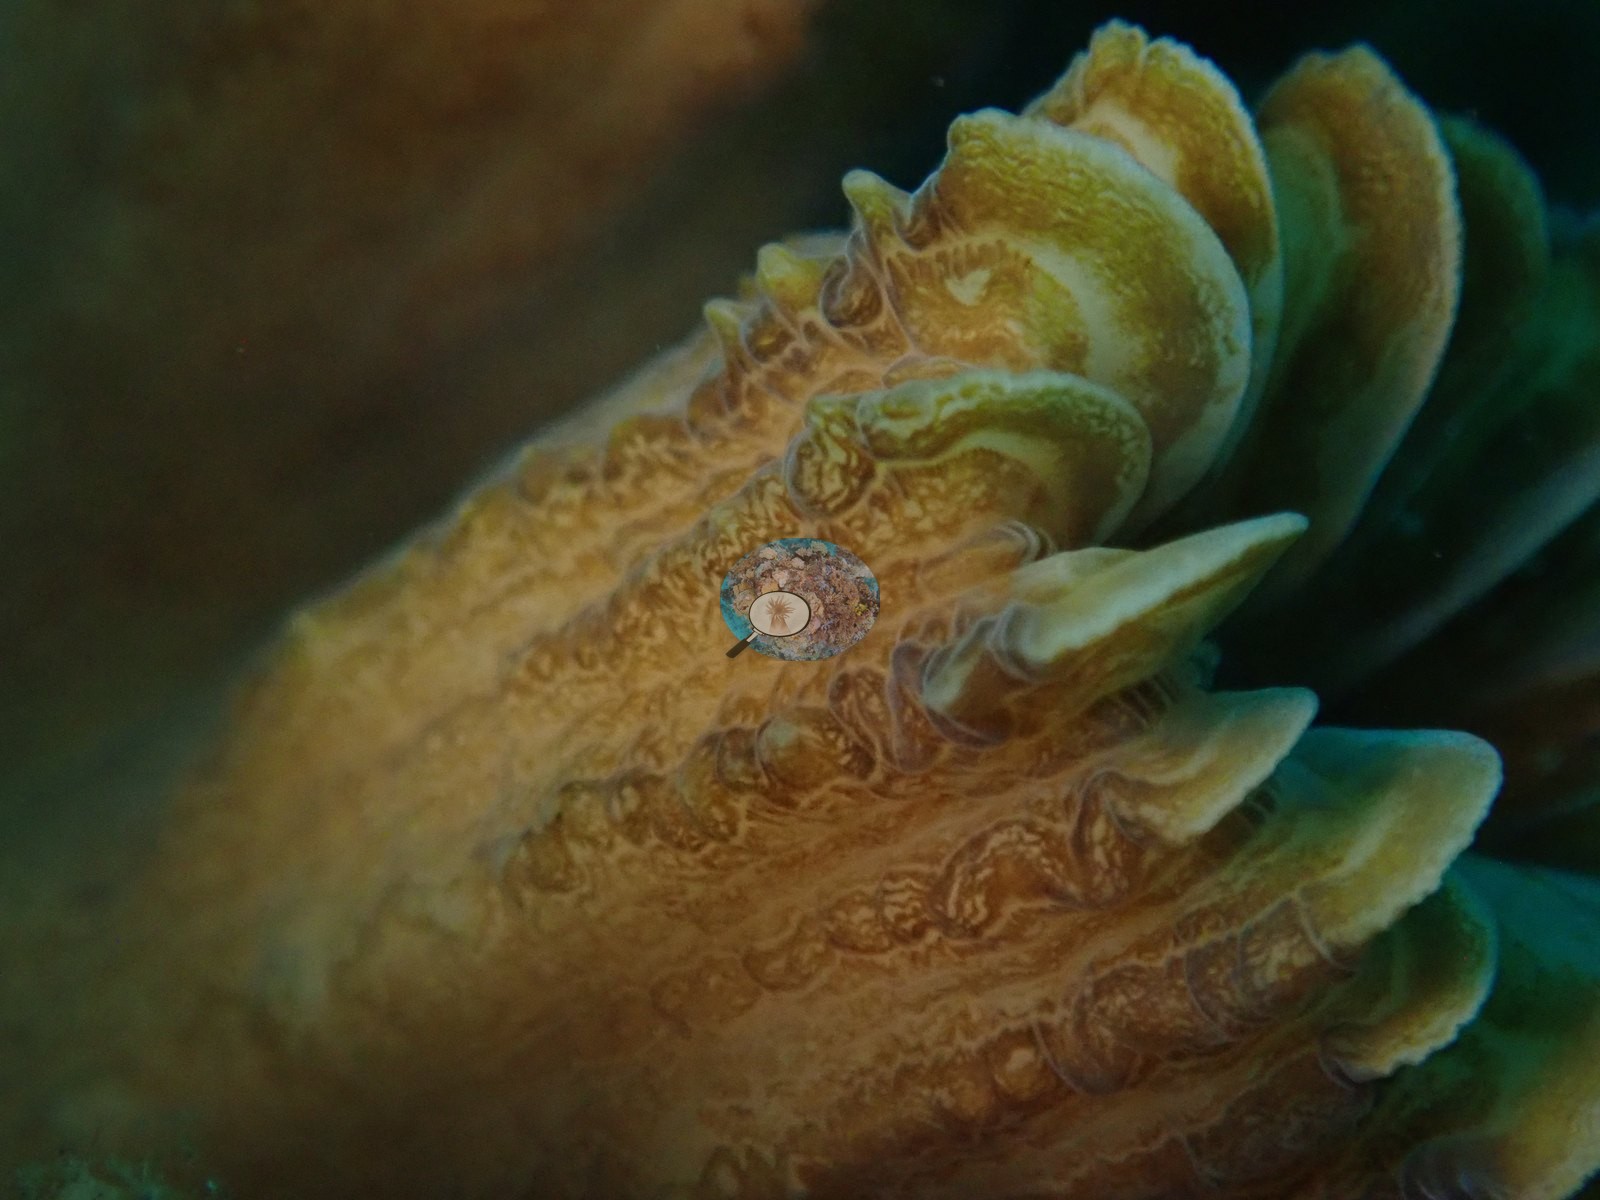
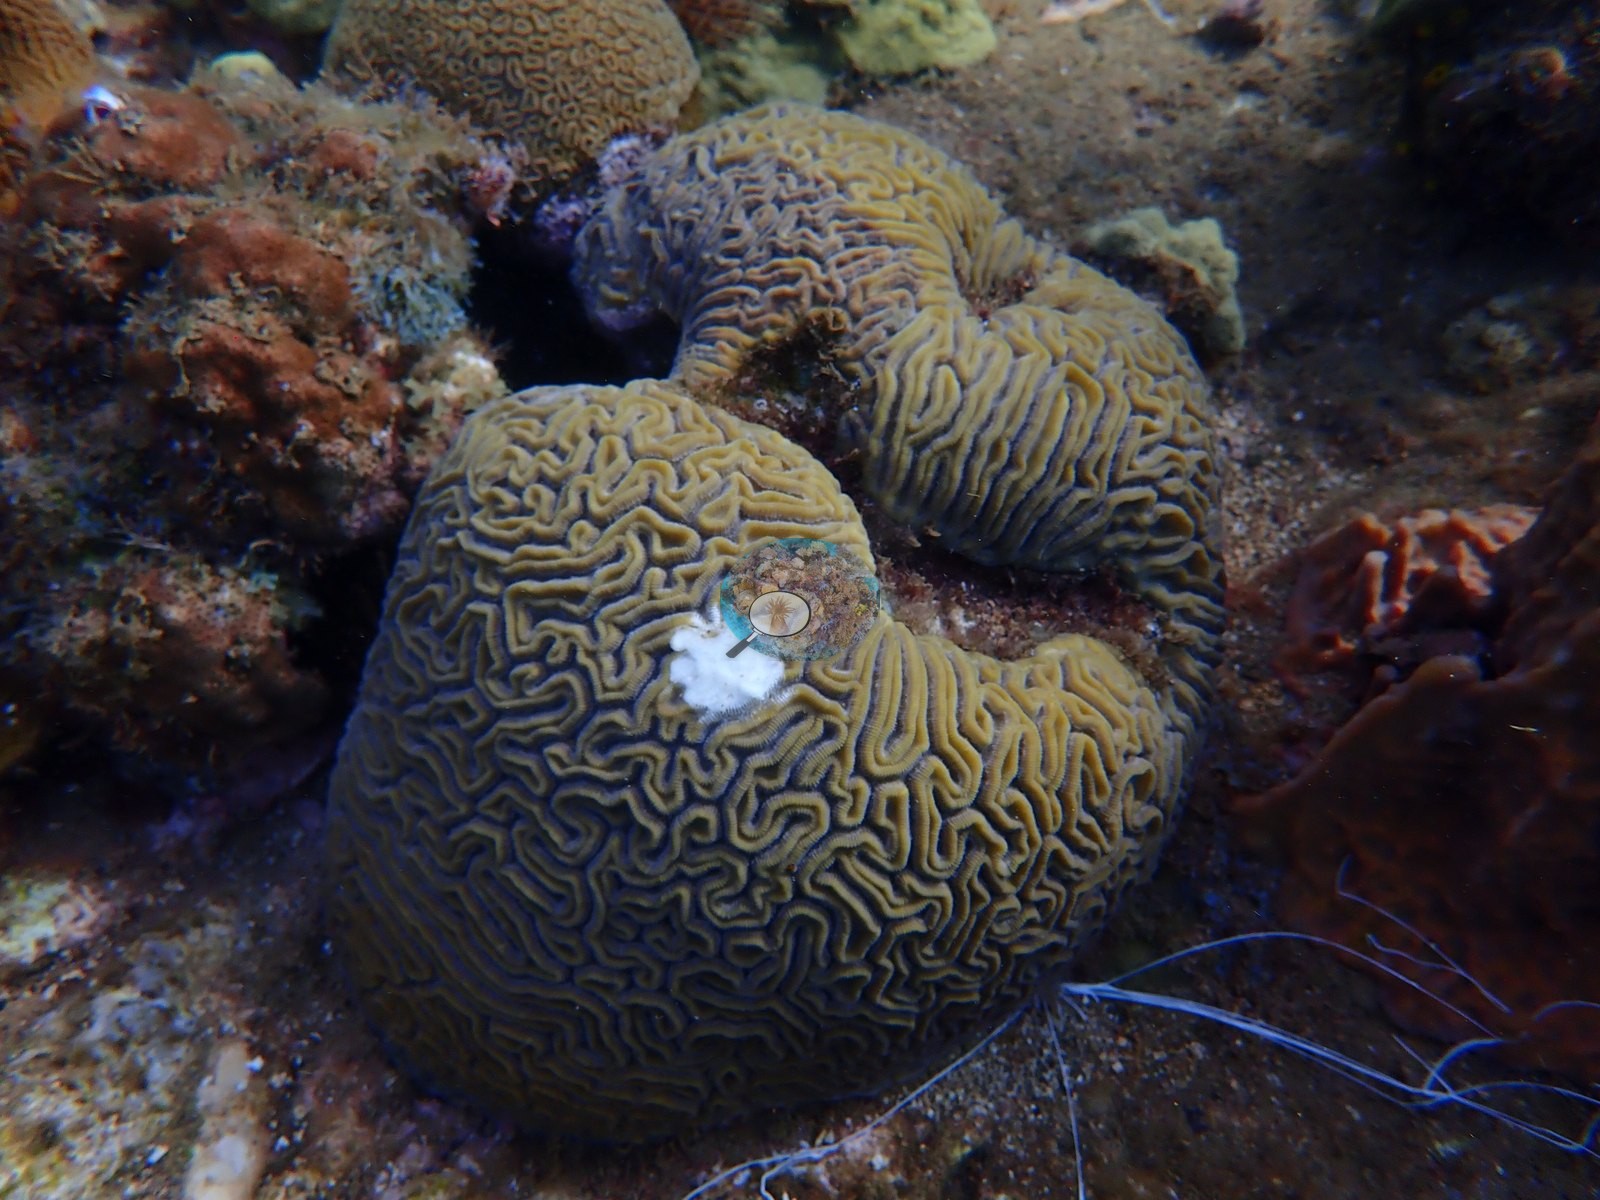
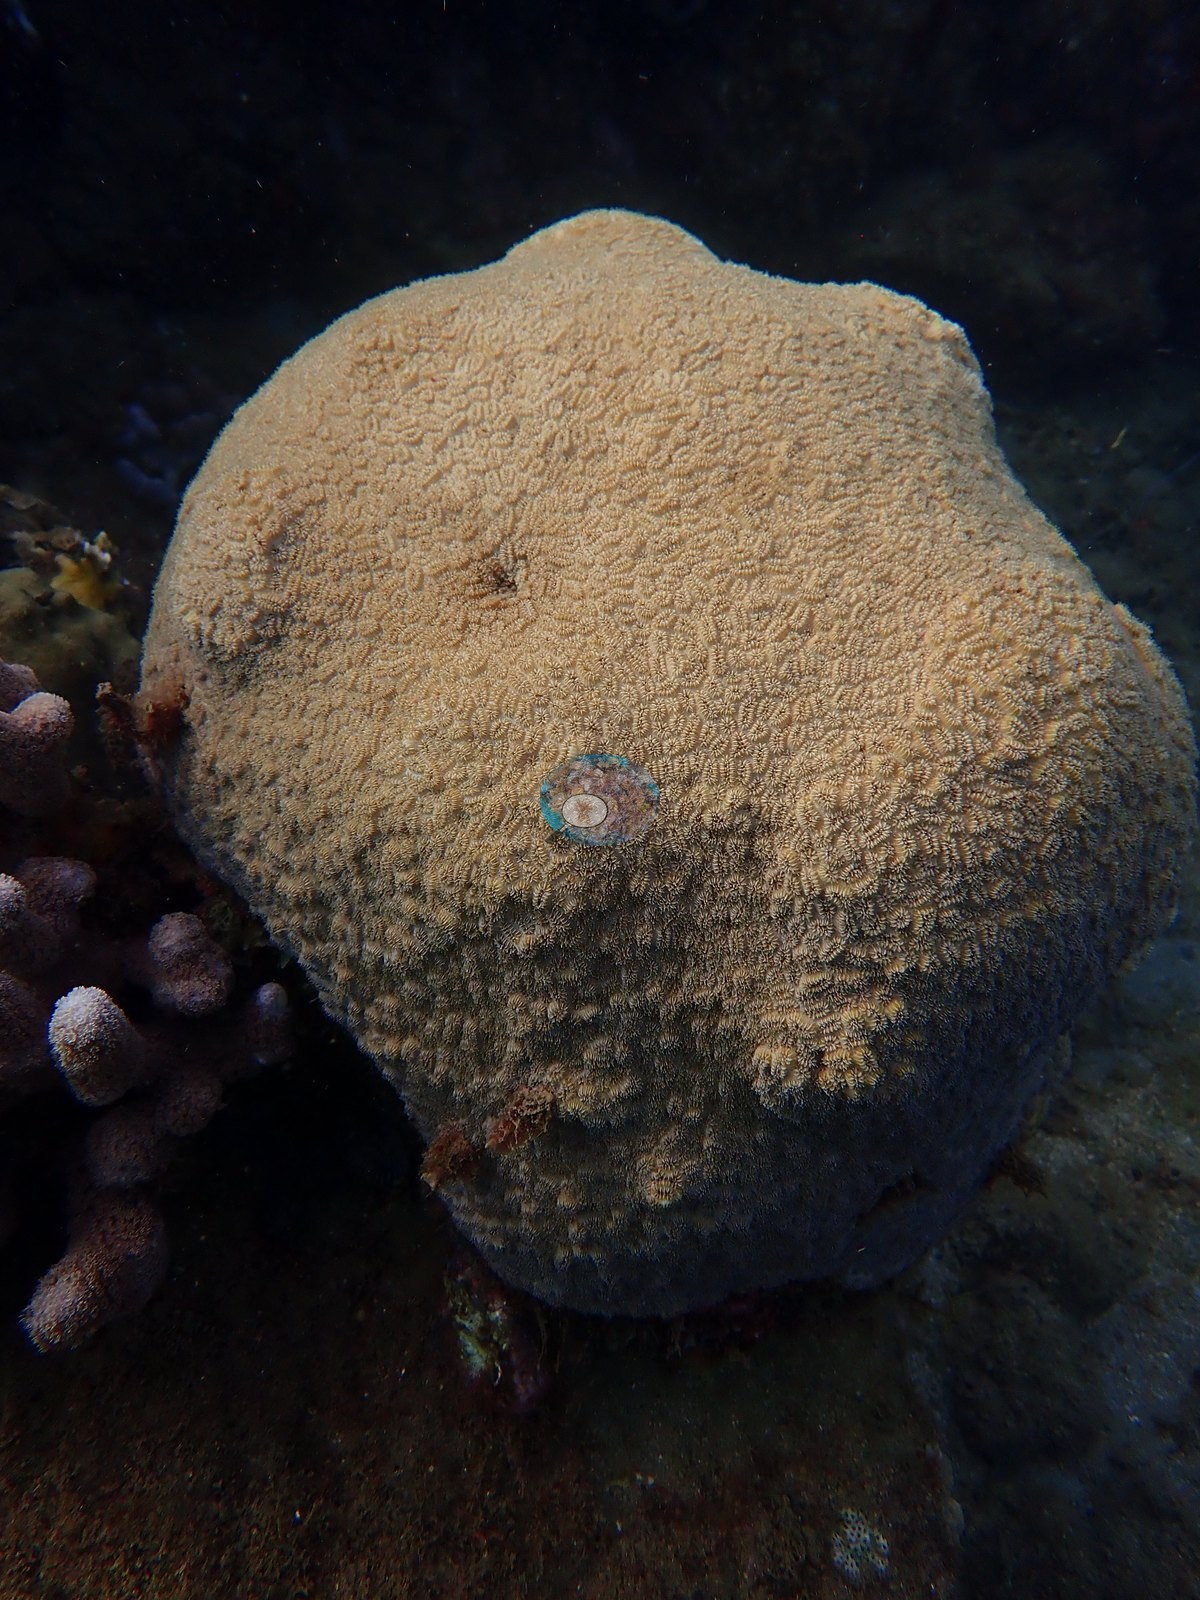
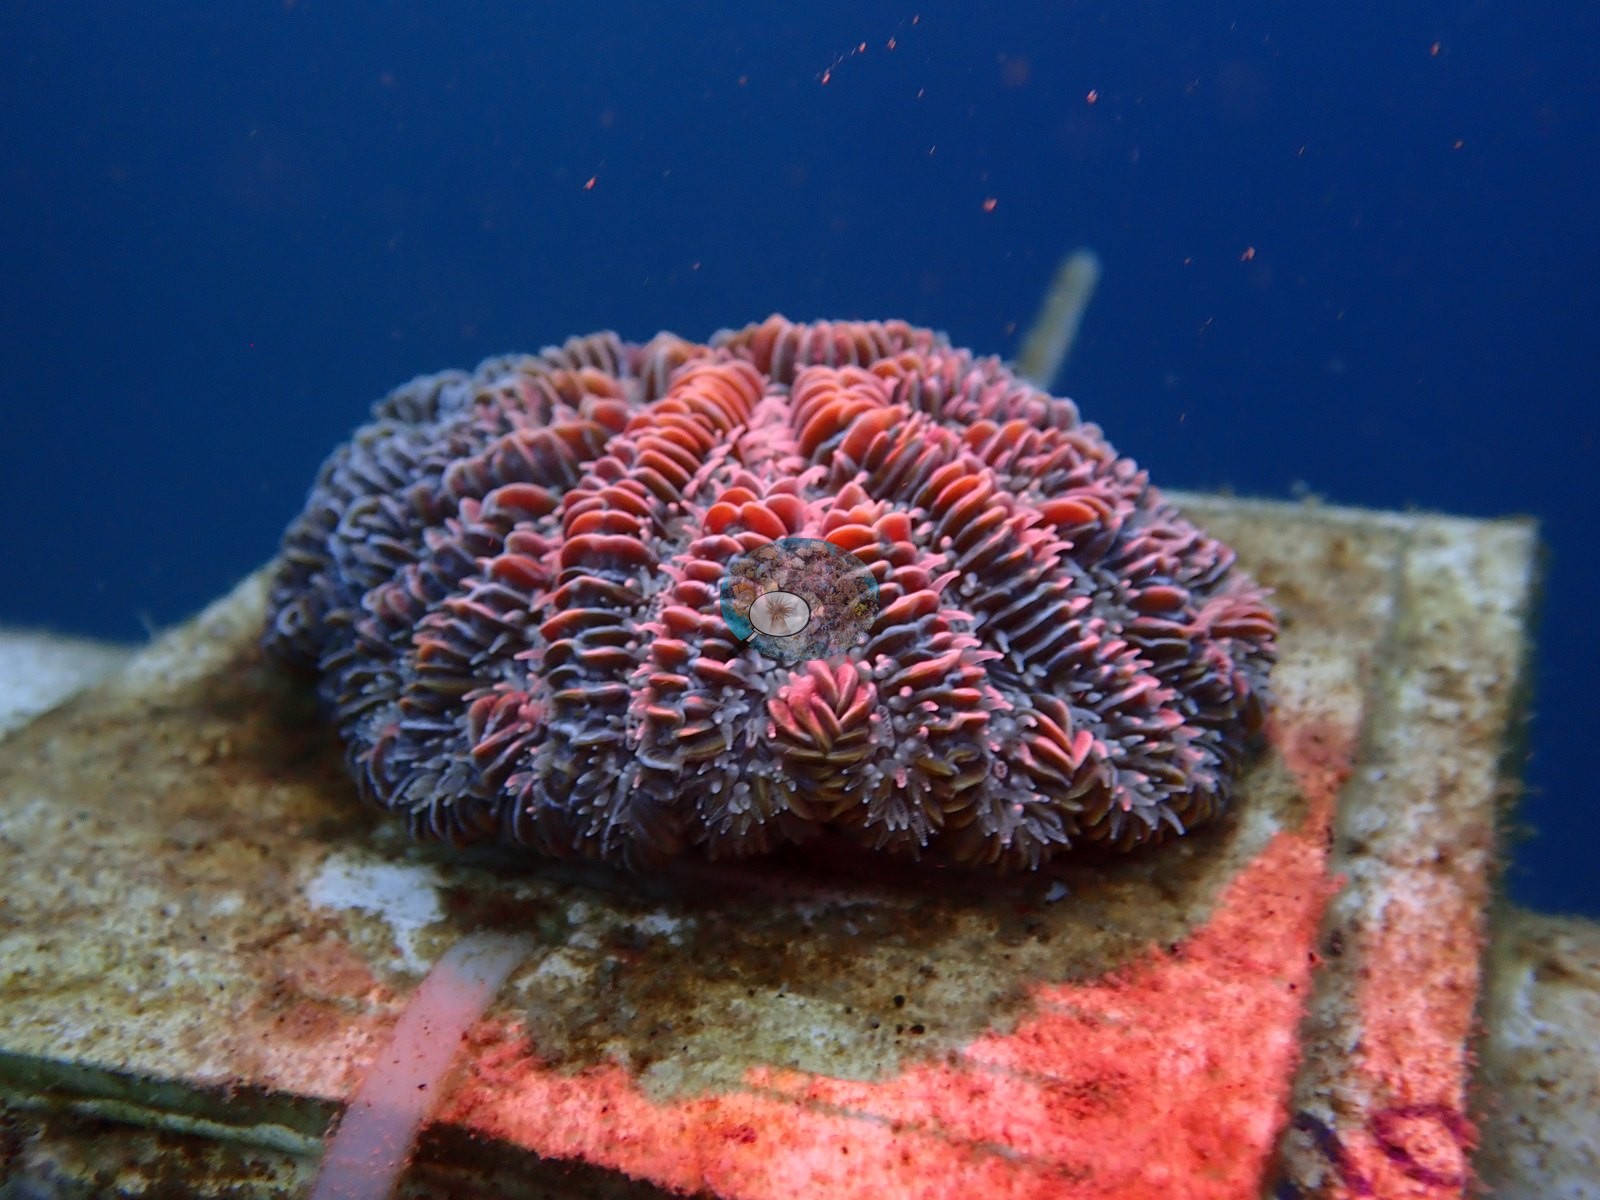
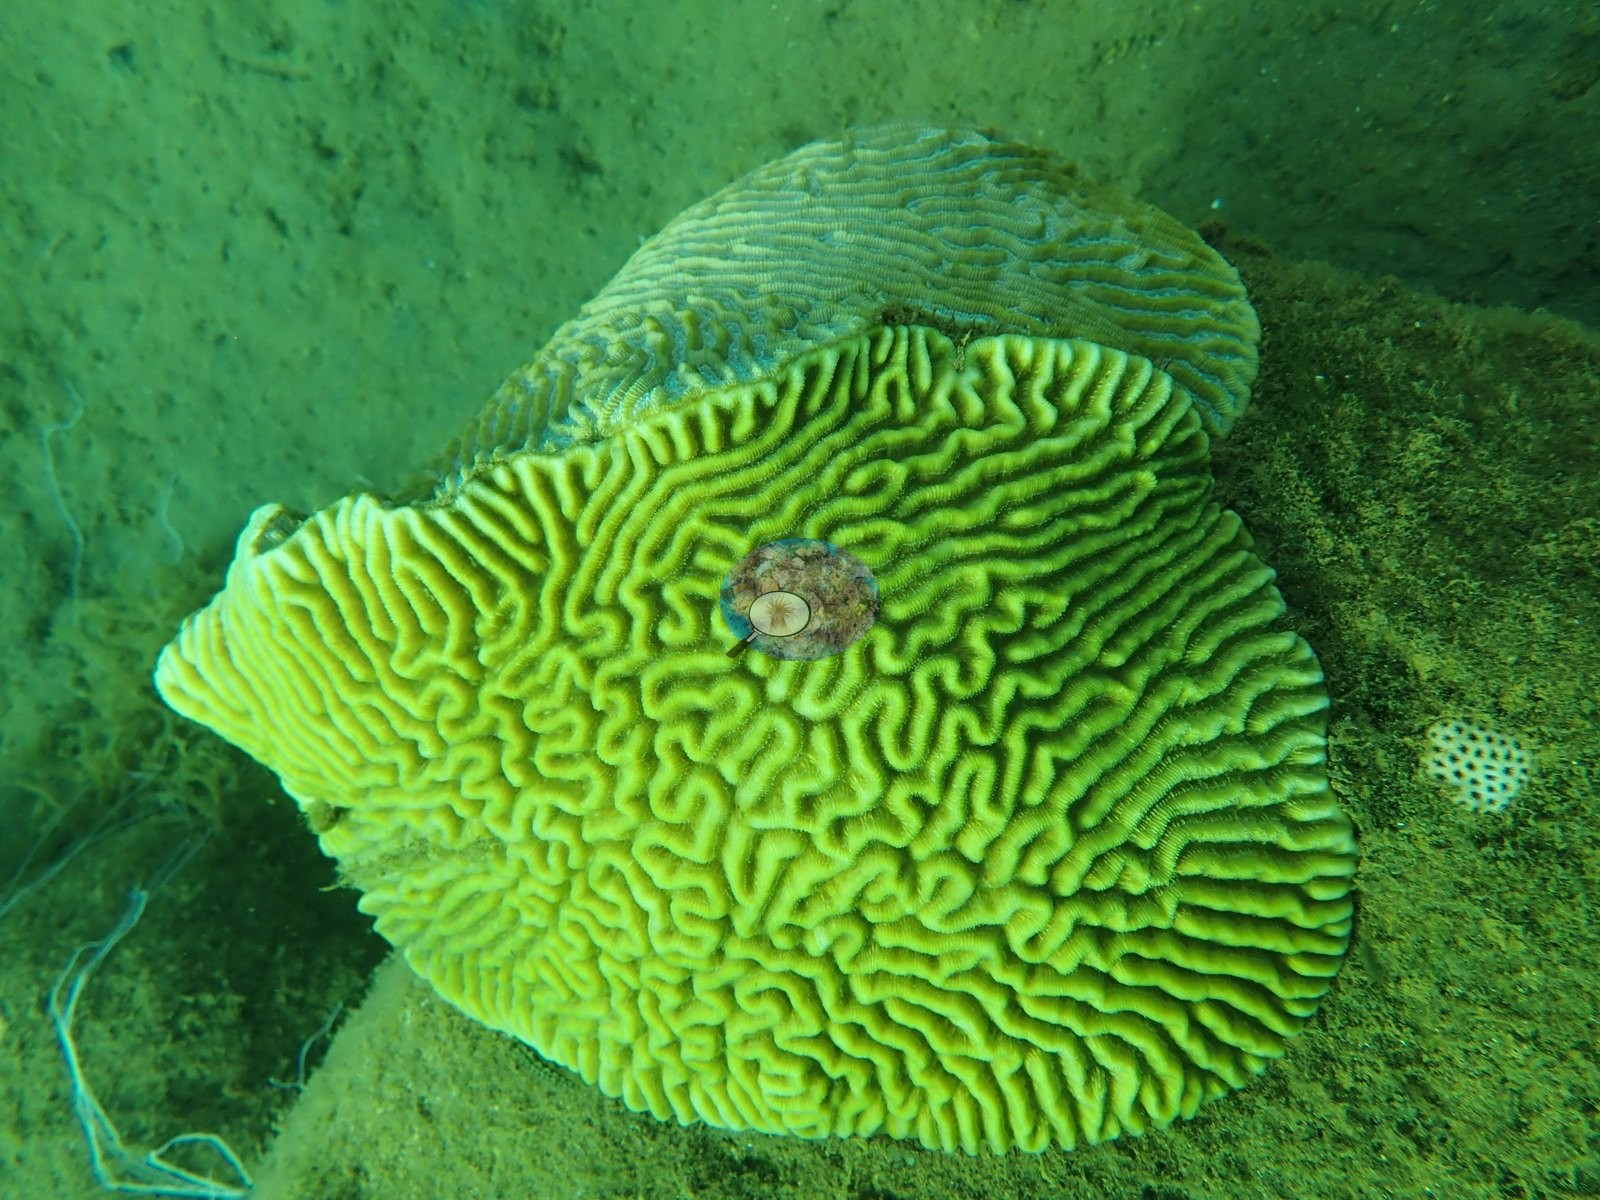
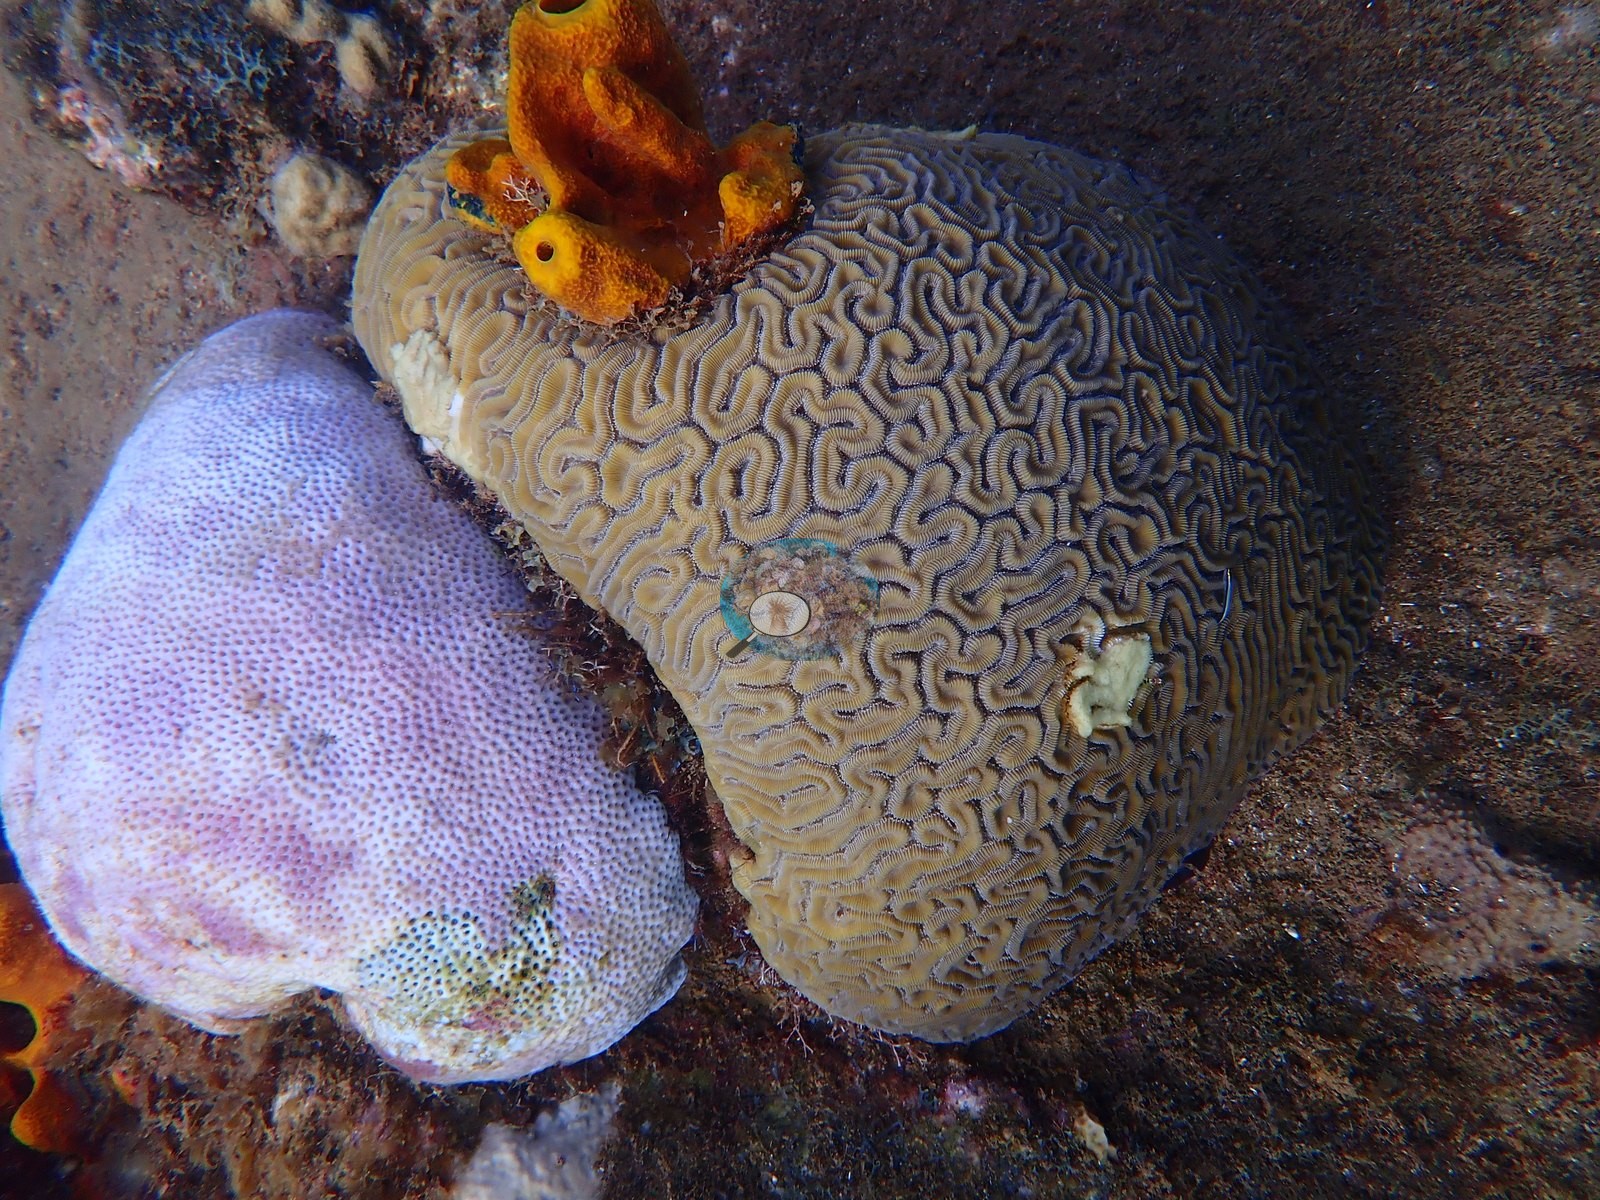
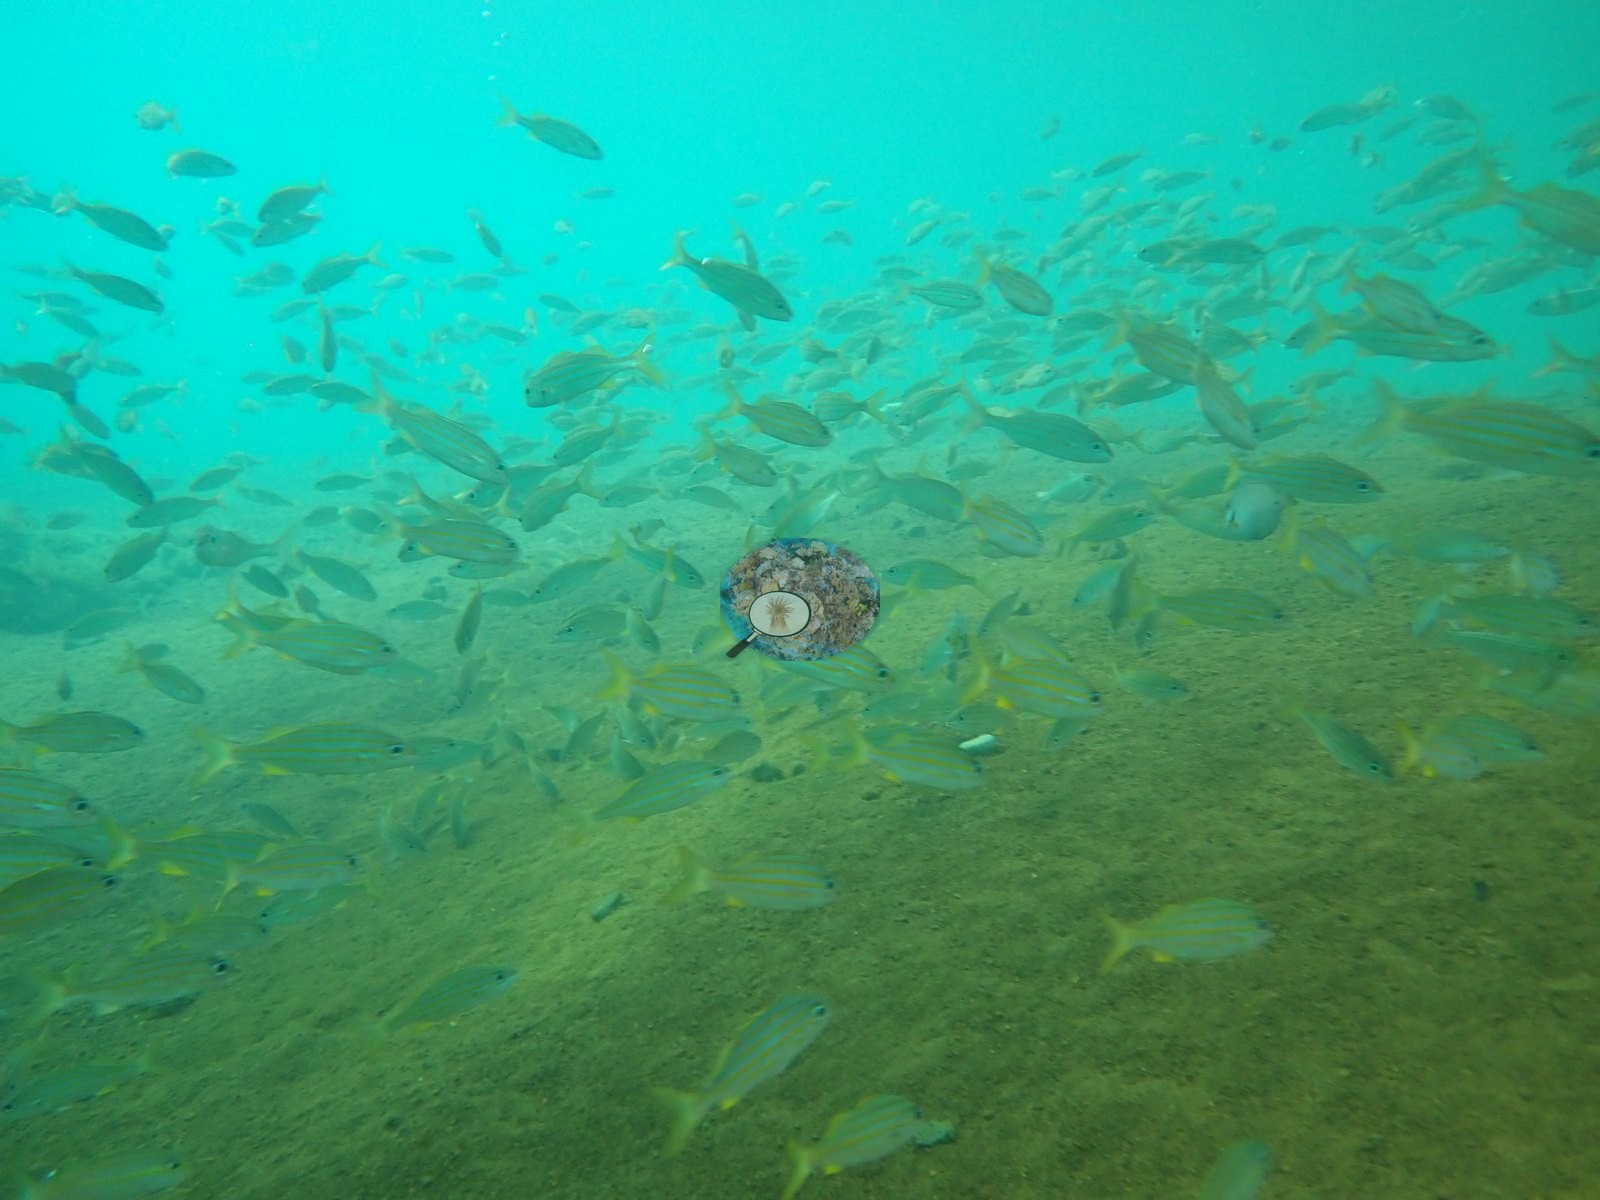
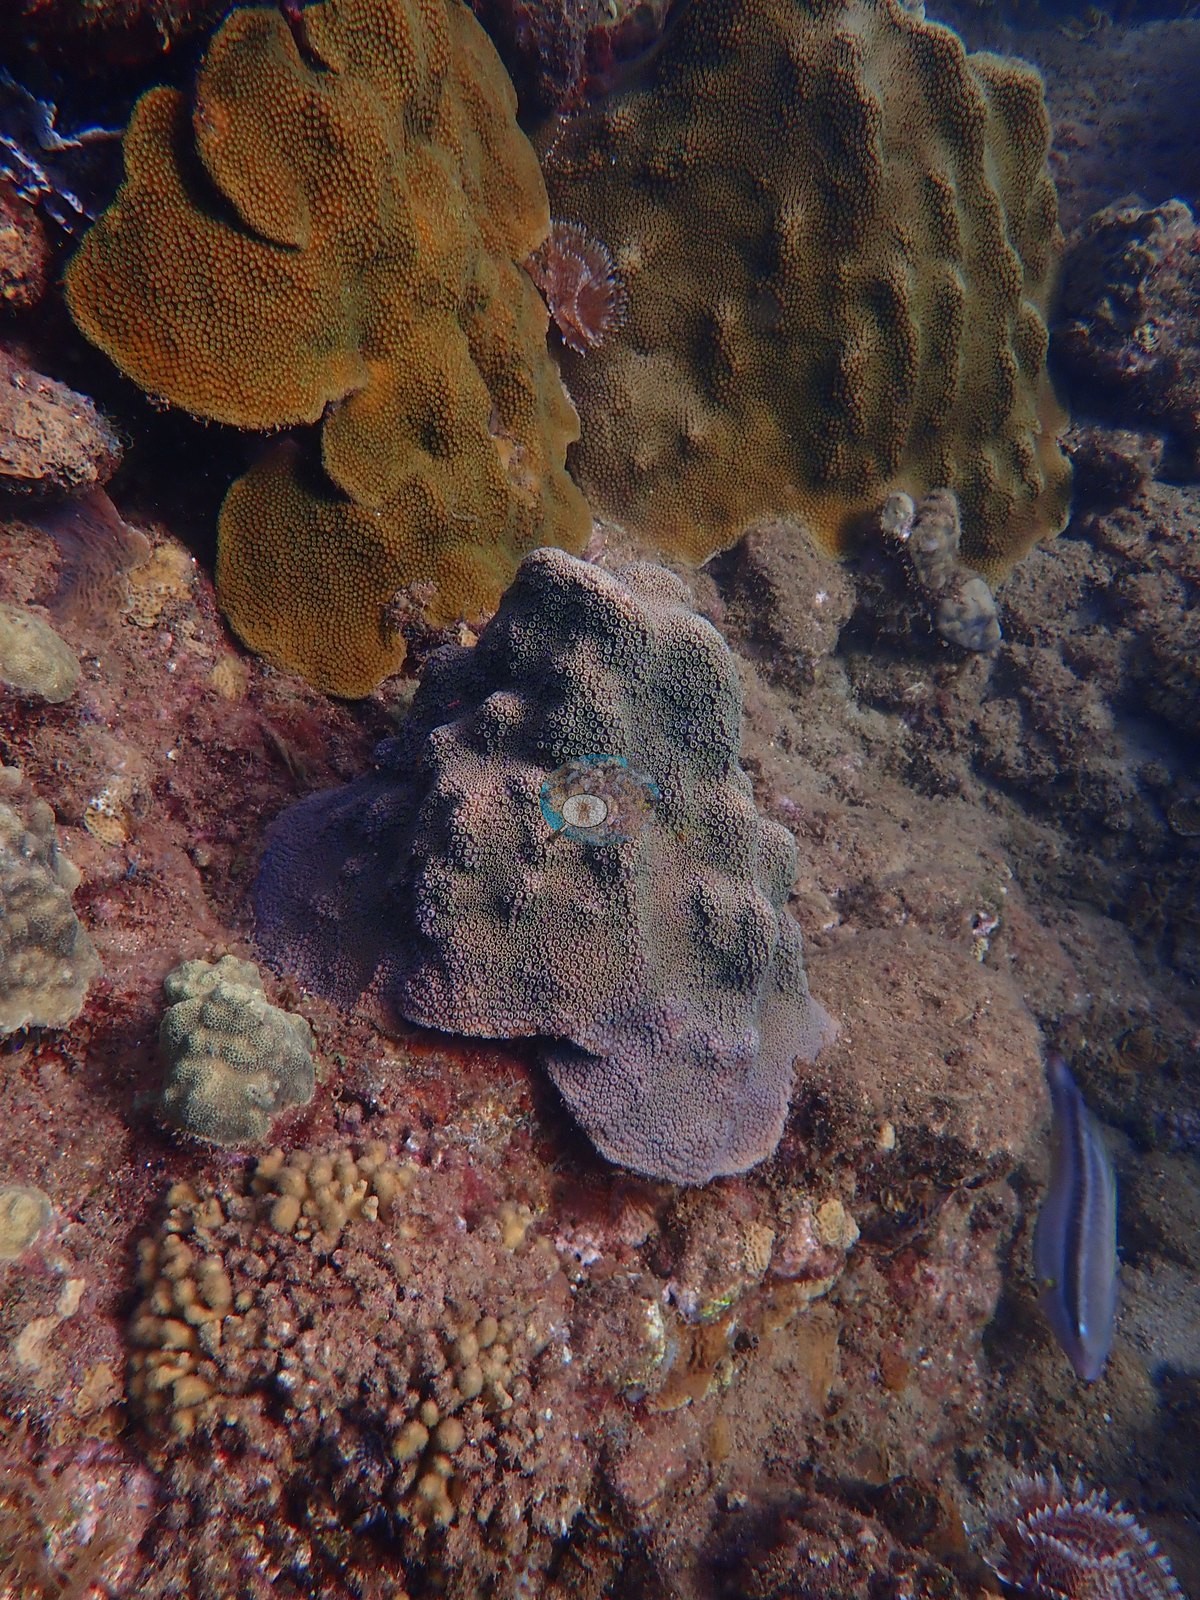
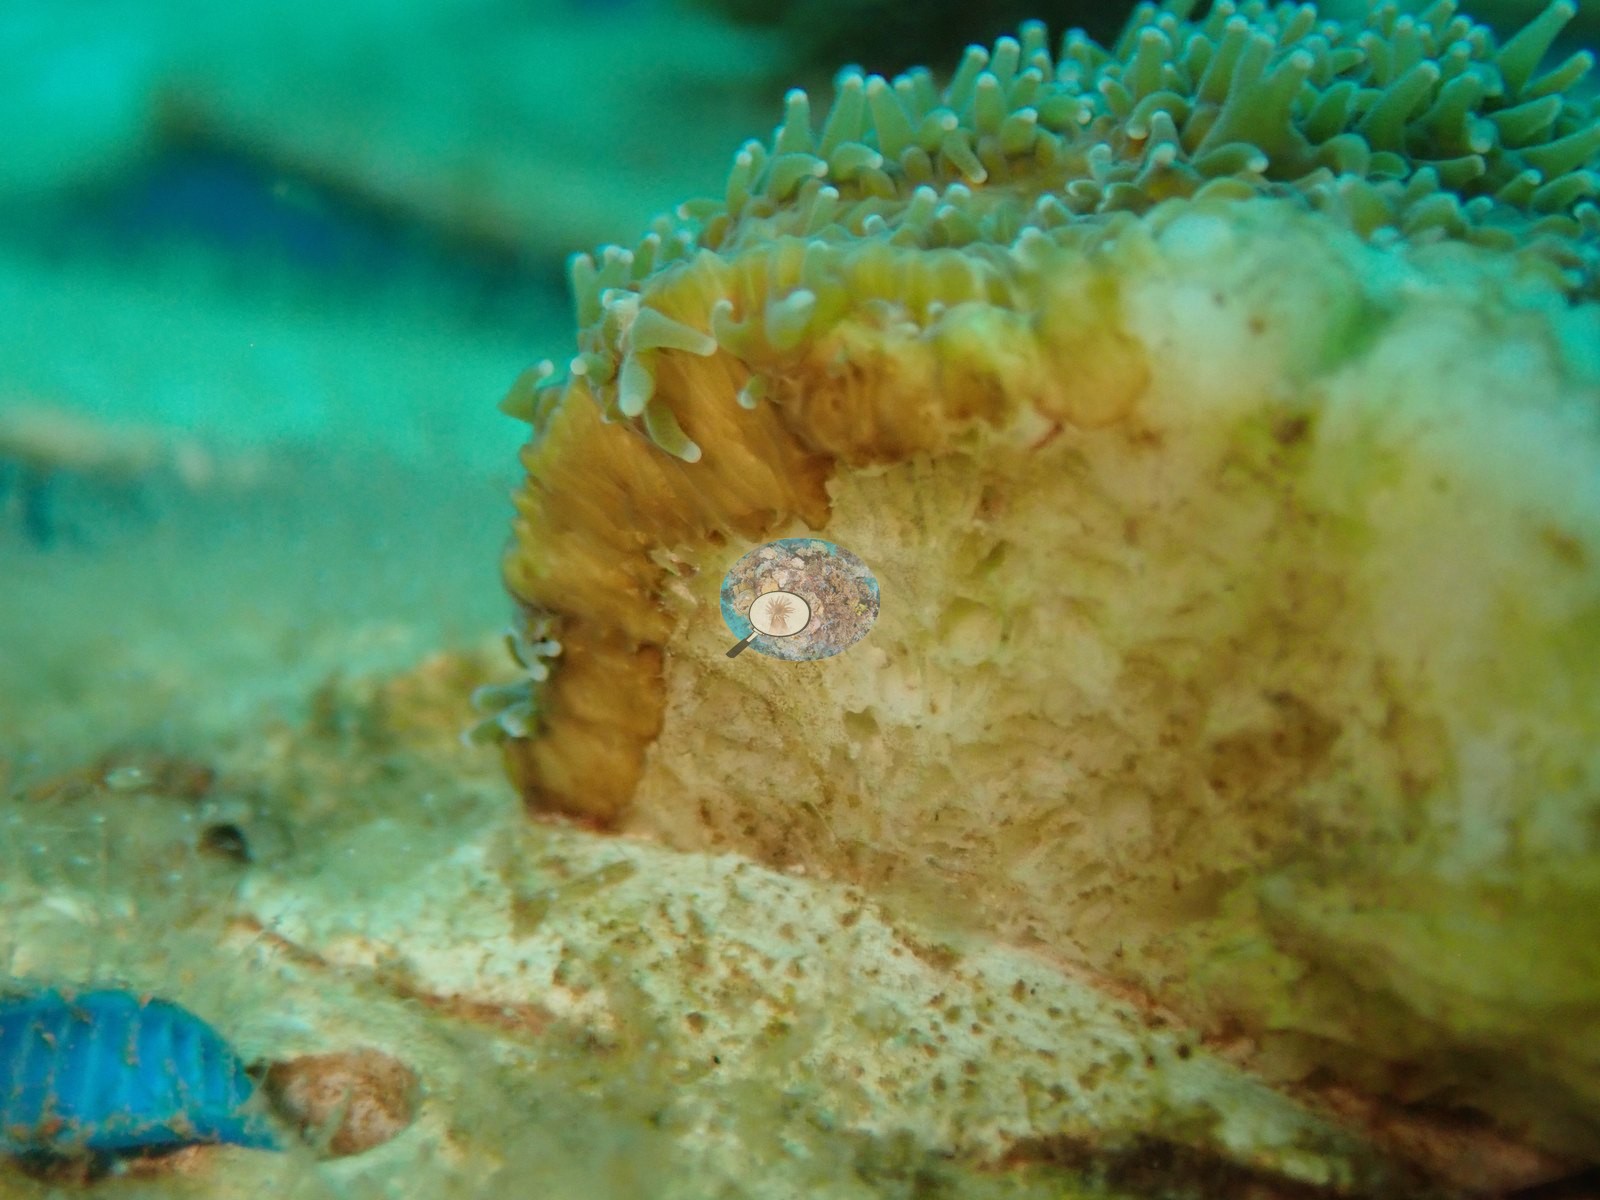
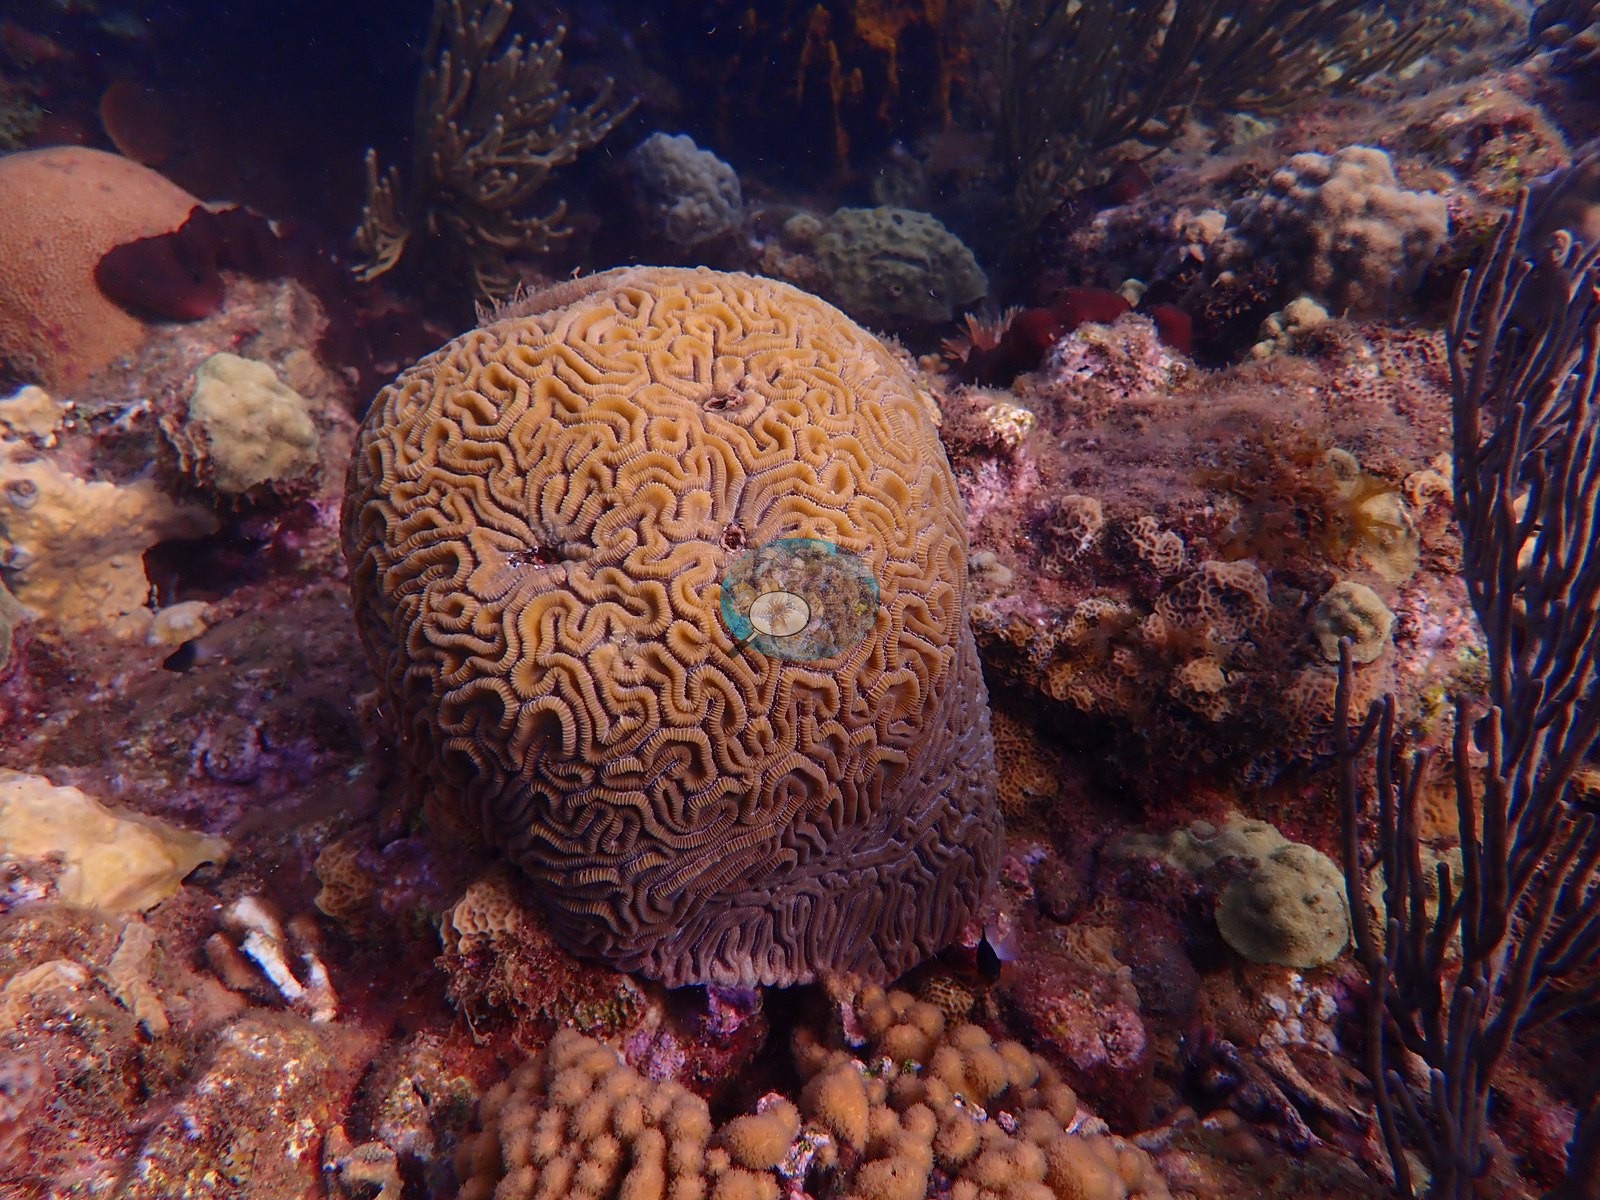
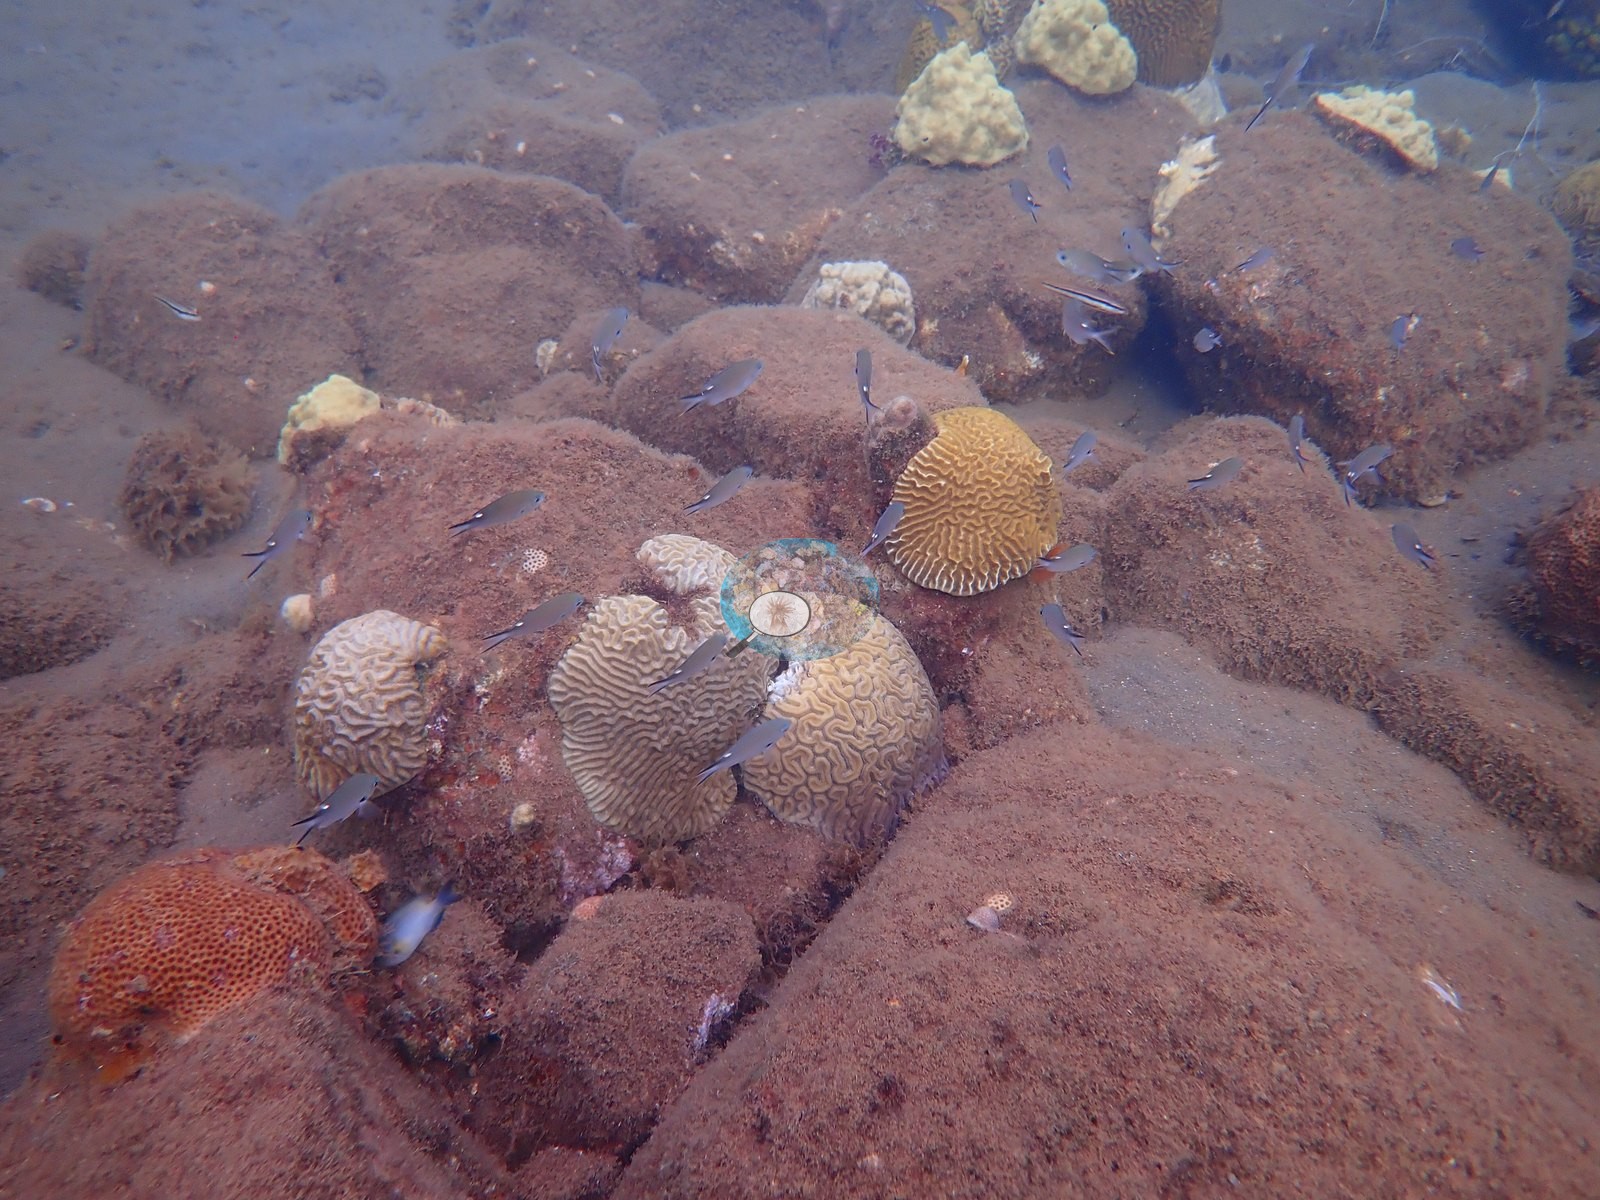
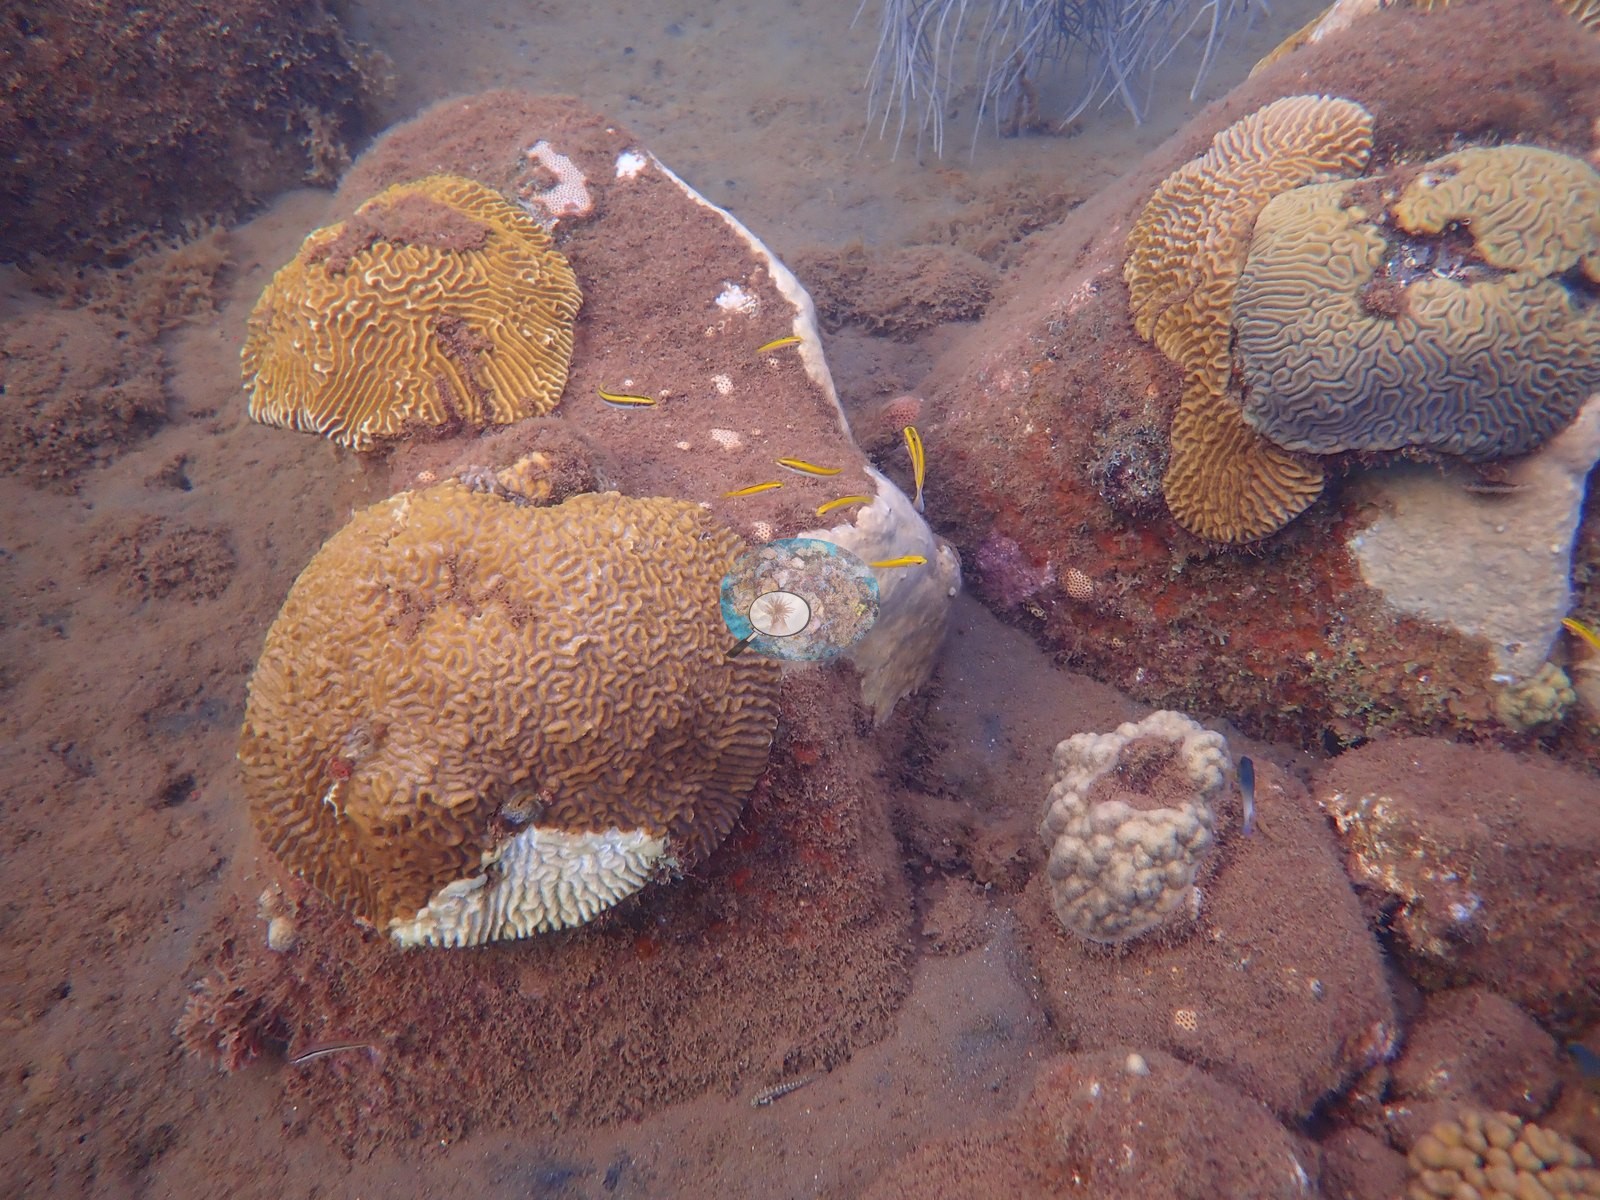
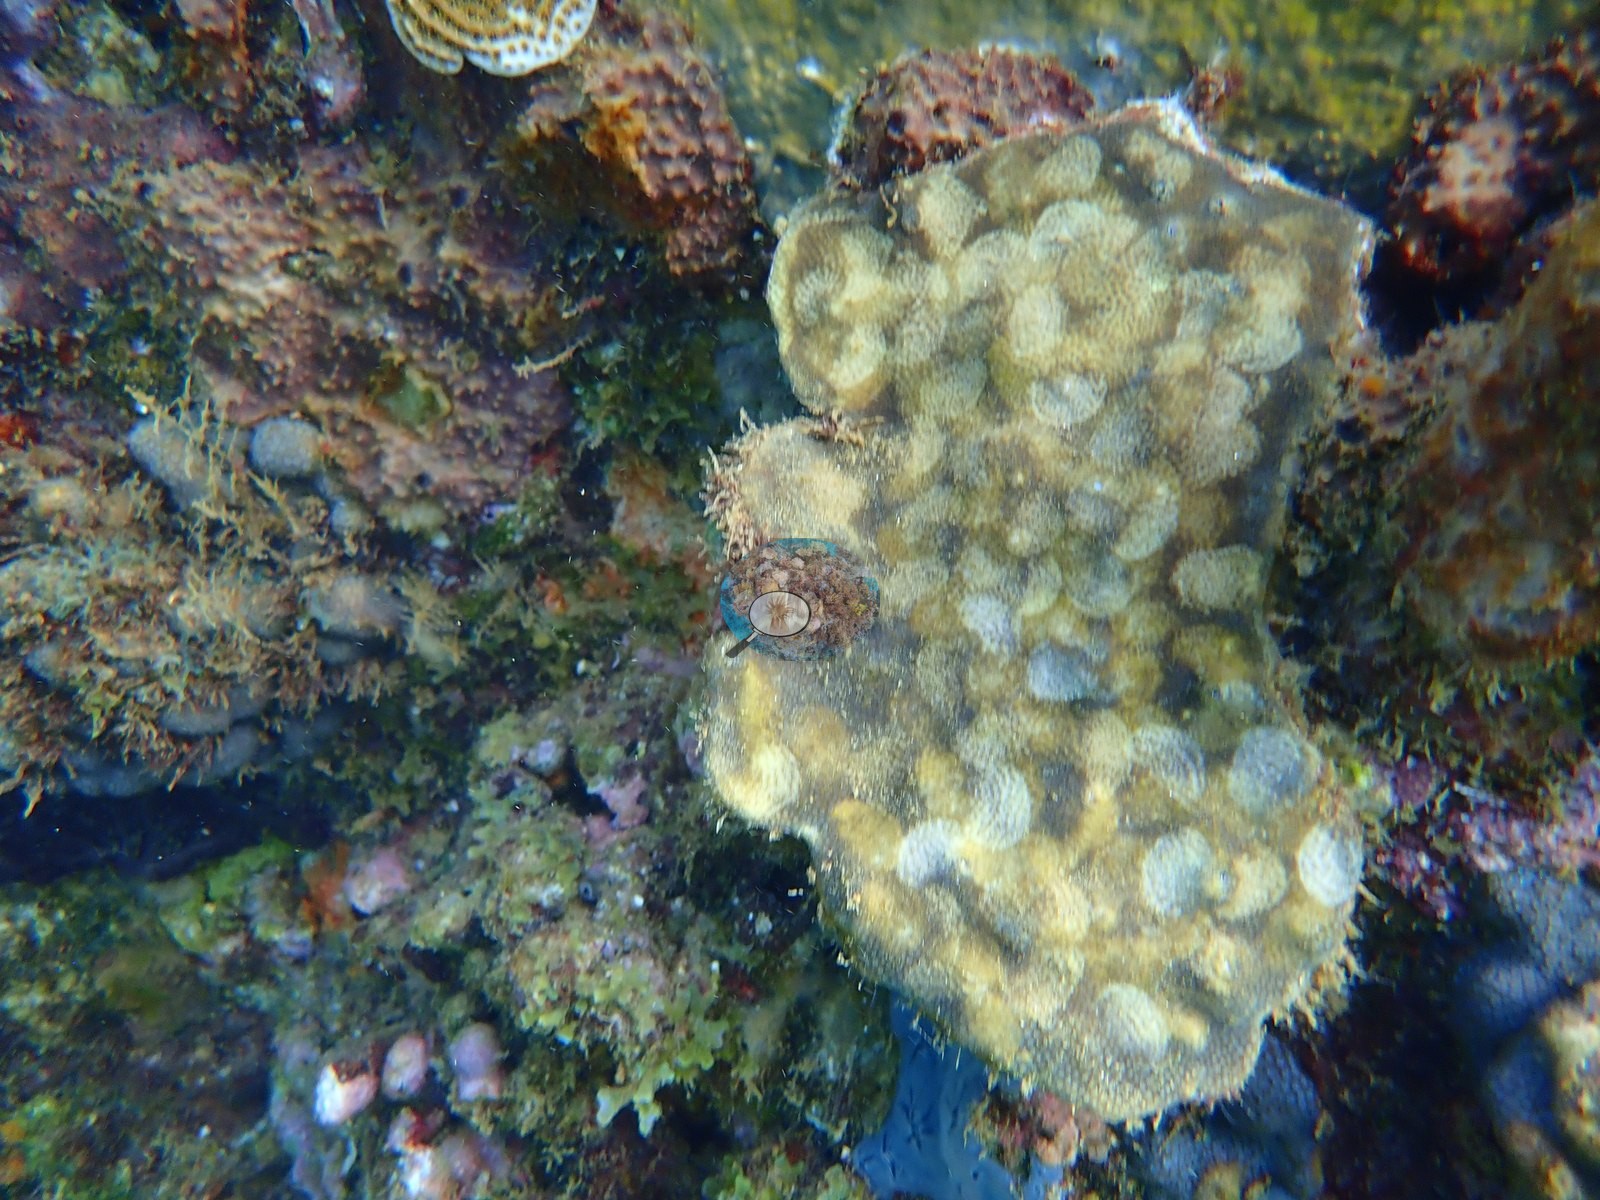
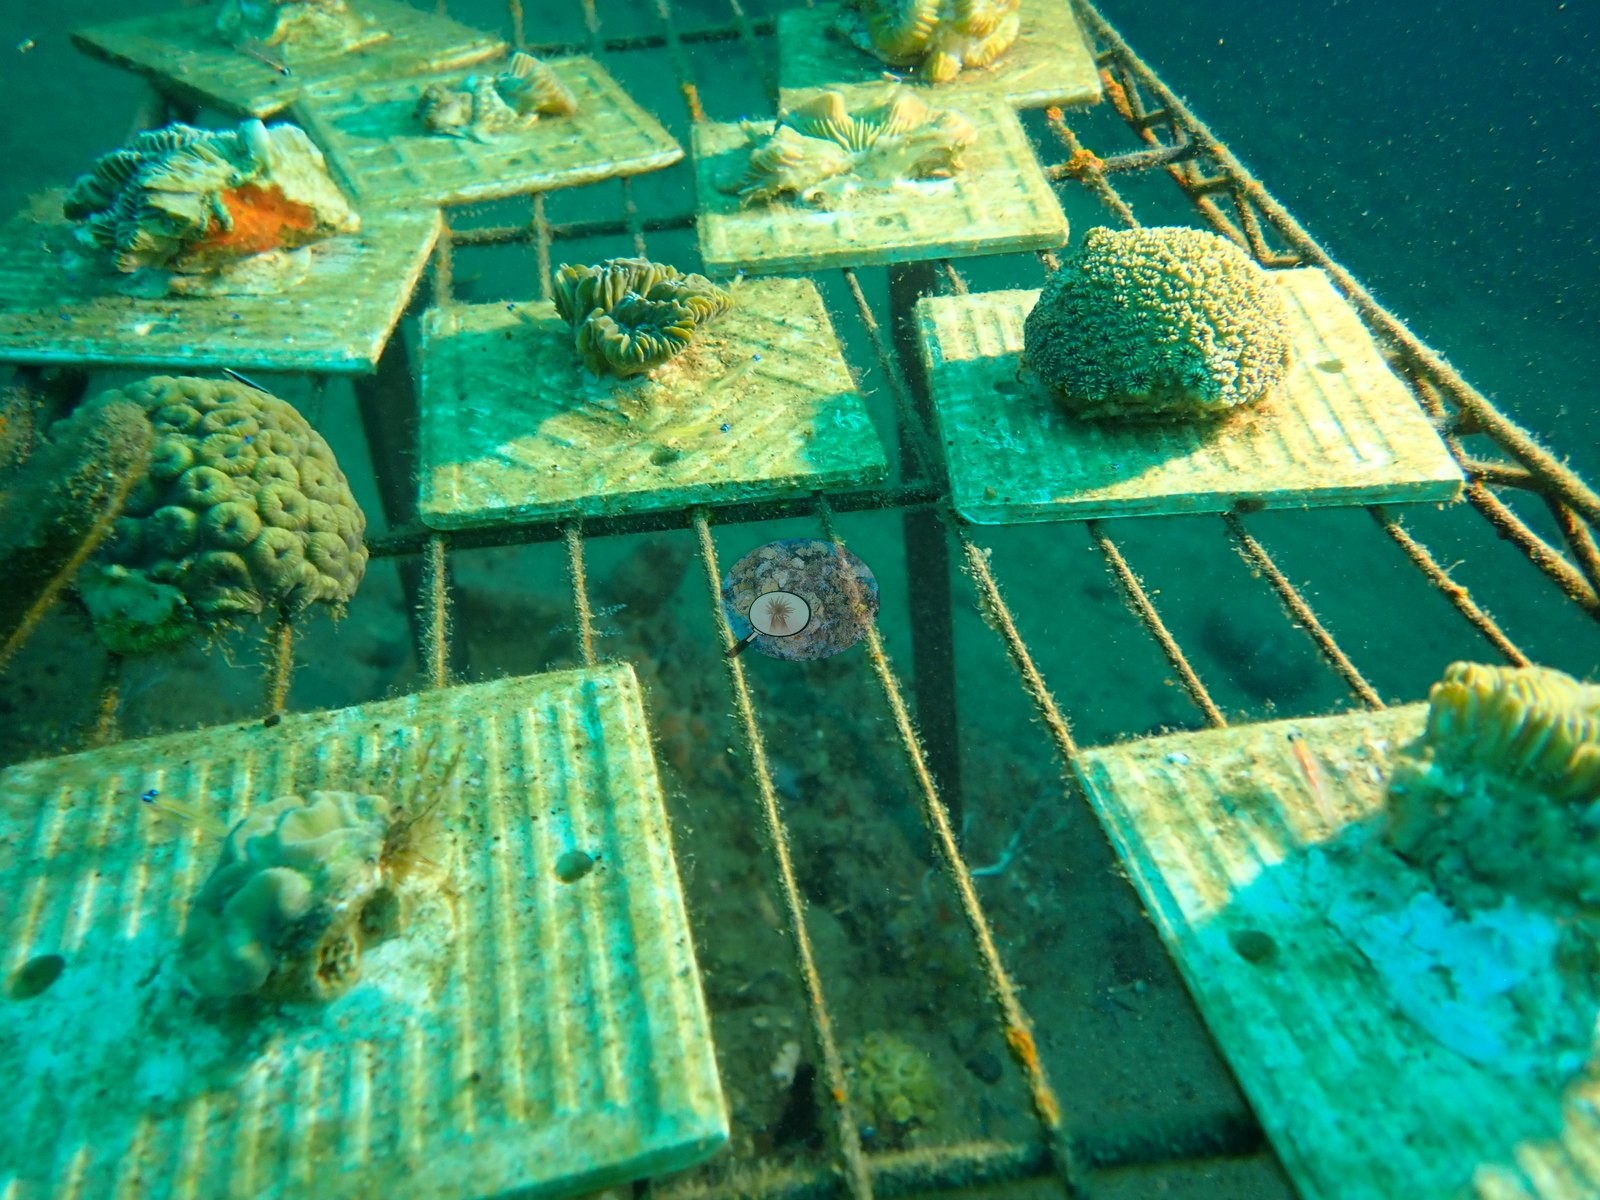
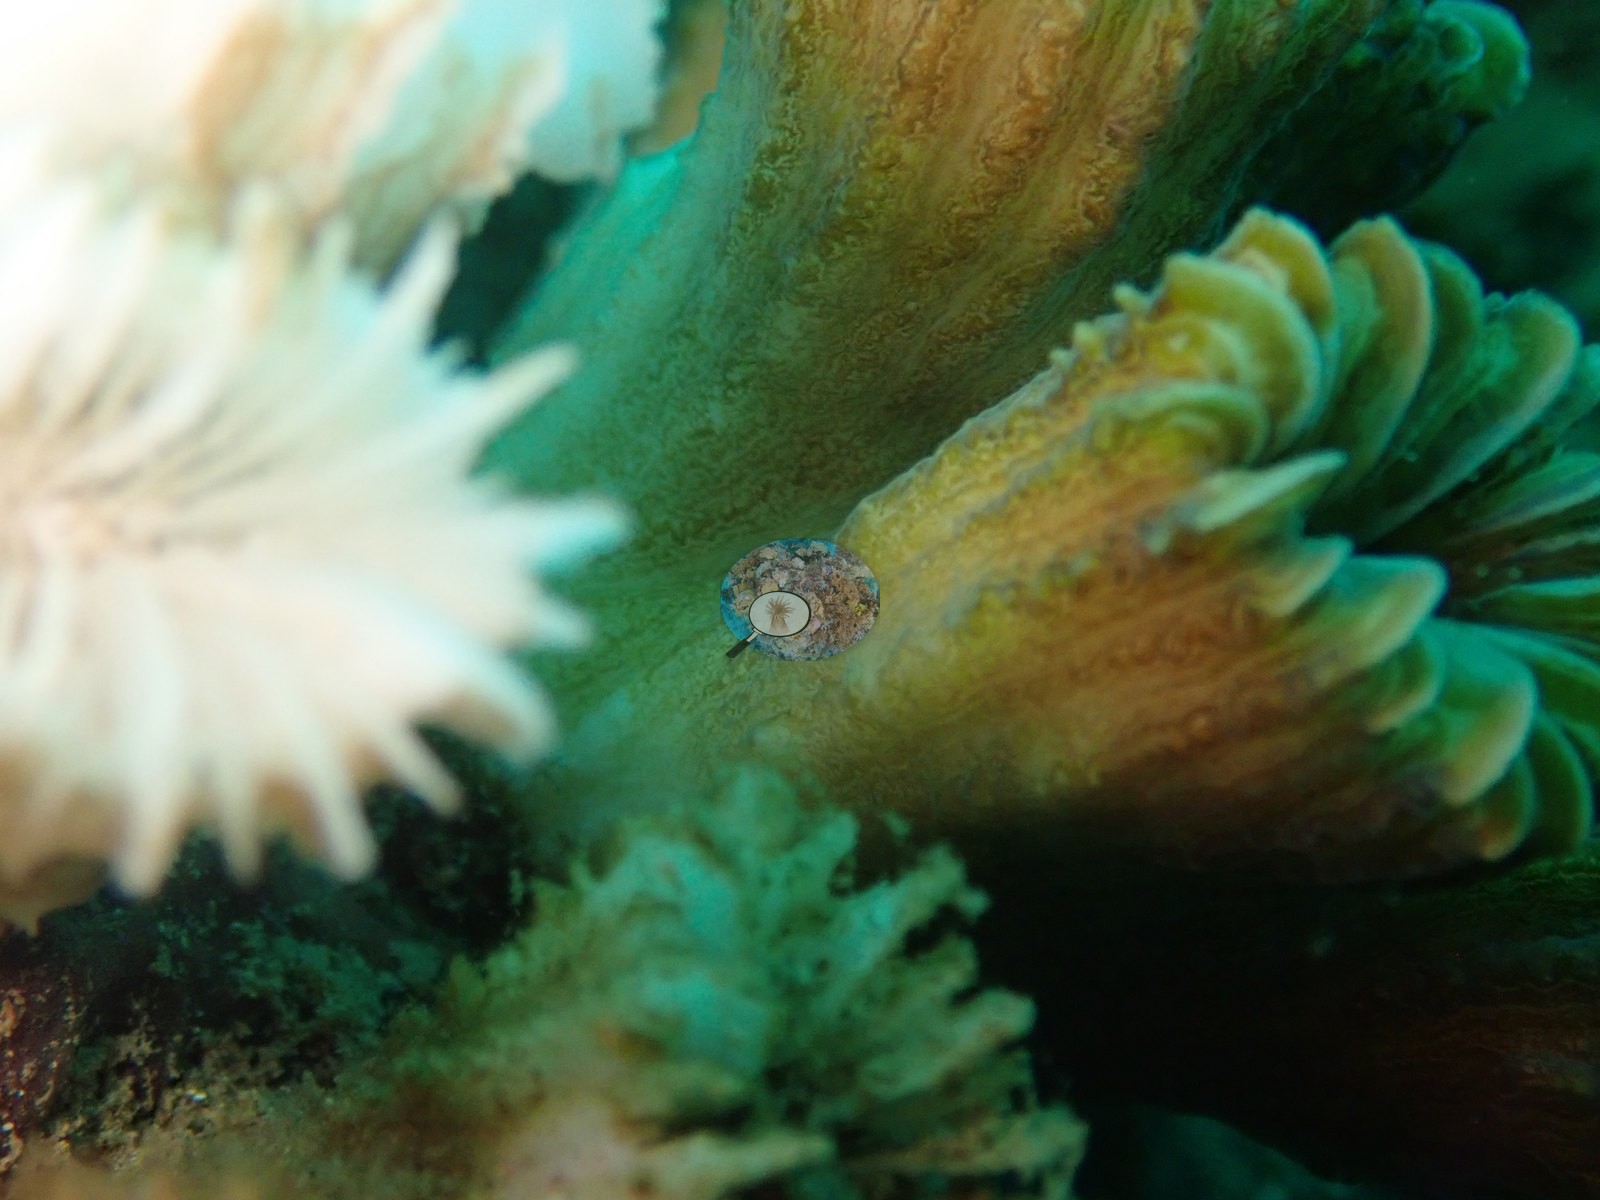
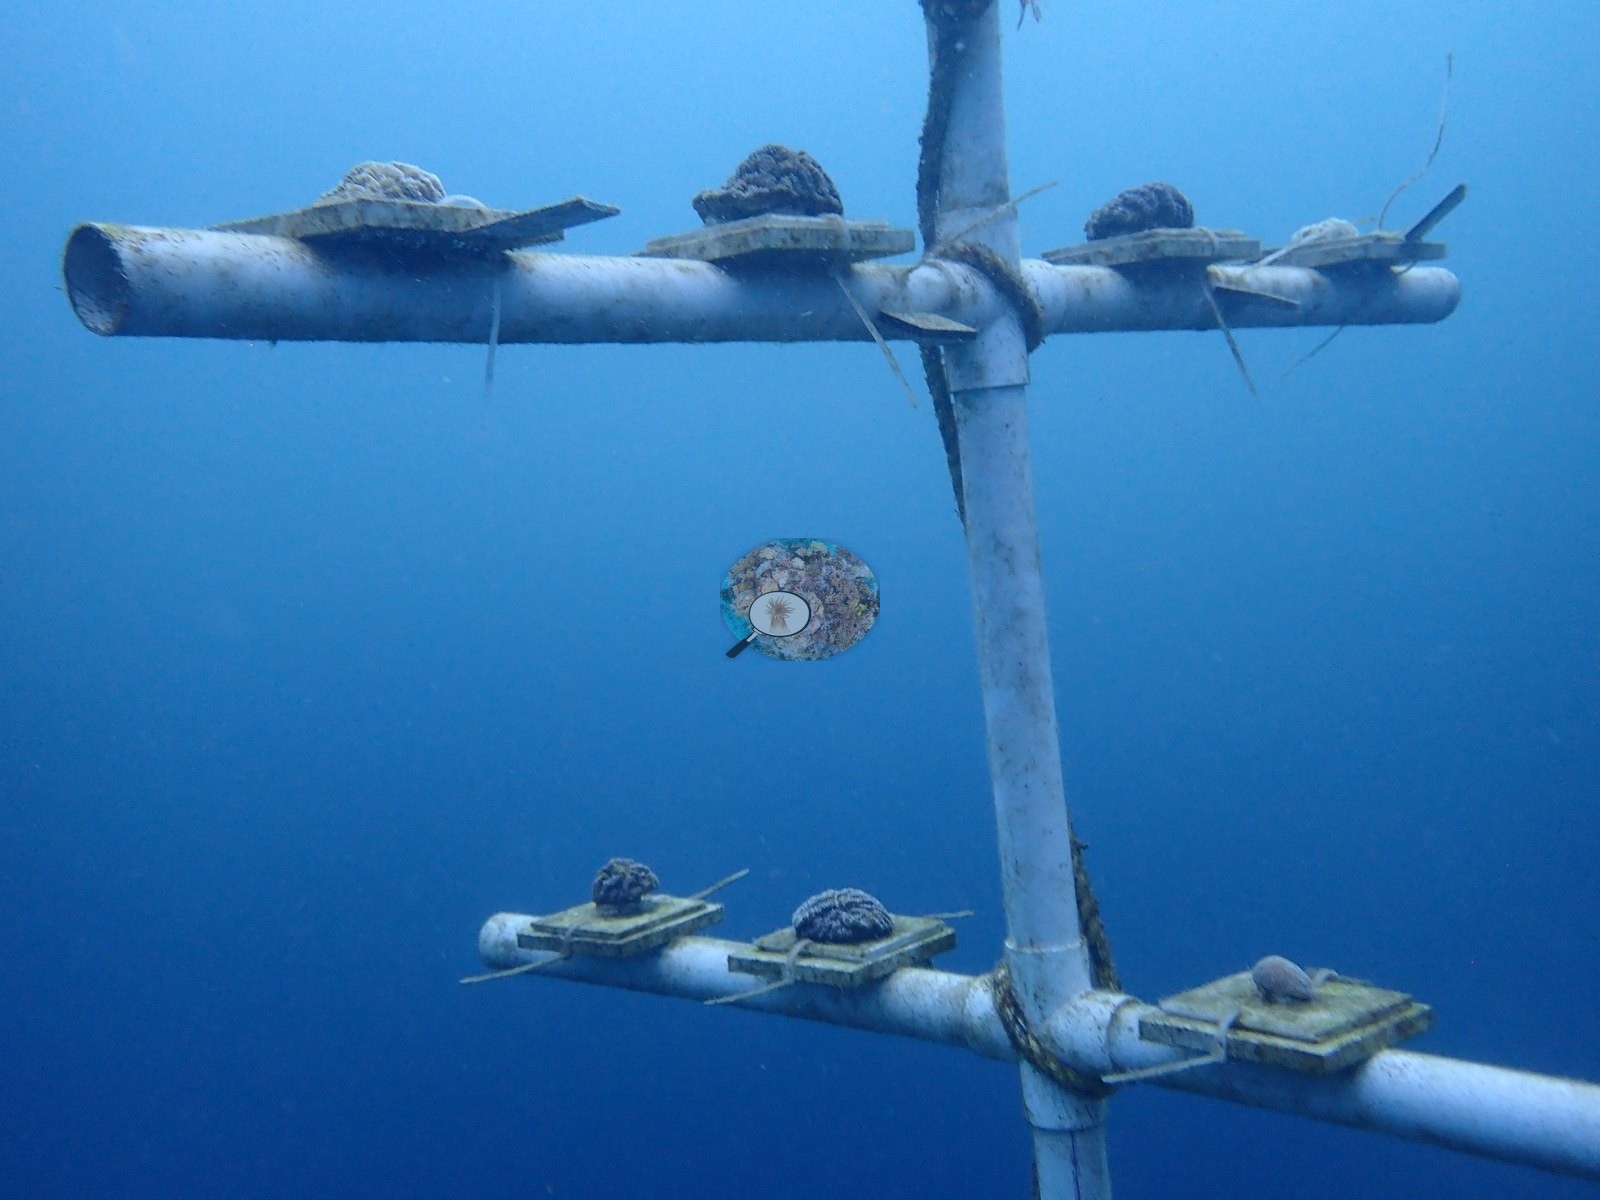
- Coral cover: 29% — a blind Claude computer-vision point count of 153 of Anderson's edited photographs (6 photos of artificial objects left out; 20 points per photo; water, fish, and obstructions excluded). Other computer-vision methods are listed in the method table.
Stressors
No corallivores evident.
Comparisons with other data
No other surveys have been conducted at this site to date. Within 5 km, eleven Reef Check stations recorded 1.9–39% hard coral cover between 2004 and 2018; the nearest, Reef Check at Champagne Outer, 0.55 km away, read 20–39% between 2004 and 2006.
CV model comparison
More info
A few colony-focused photos raise the mean; the median is the typical photo. No computer-vision method yet estimates coral cover accurately on new images, so treat this as indicative rather than a measurement; it is revised as the methods improve.More info
Other rows are for comparison only and are never averaged. No diver transect exists for this trip, so agreement between rows is not accuracy.| Method | Hard-coral cover (%) |
|---|---|
| CoralSCOP edited | 32.8 |
| Claude (edited photos) | 29.1 |
See a more detailed, stand-alone version of this table.
Independent surveys nearby
 Coral Reef Diagnostics
Within 5 km, 11 independent survey stations recorded hard coral cover in 20 surveys between 2004 and 2018. Of the 5 stations surveyed in more than one year, 3 declined and 2 changed by less than 5 percentage points between their first and latest surveys. The longest record, La Bym (Reef Check, 0.82 km away), went from 20% in 2004 to 16% in 2018. The most recent nearby survey is from 2018, so these values predate recent heat stress. This site's own estimate (29%) sits within the range of these surveys (1.9–39%); the methods differ, so the comparison is context, not a like-for-like test.
Collected by other programs using different methods (Reef Check uses point-intercept transects), so these are context for the figures above, not a like-for-like comparison. Where a station was surveyed more than once the range is shown. Station names are not dive-site names.
Show all 11 independent survey records
| Agency | Site / location | Date | Hard coral cover (%) | Distance |
|---|---|---|---|---|
| Reef Check | Champagne Outer | 2004–2006 | 20–39% (3 surveys) | 0.55 km |
| Reef Check | La Bym | 2004–2018 | 9.2–20% (3 surveys) | 0.82 km |
| Reef Check | Solomon A | 2007 | 6.2% | 3.22 km |
| Reef Check | Solomon B | 2007 | 13% | 4.04 km |
| Reef Check | Solomon Reef Site A | 2008–2009 | 5.6–11% (3 surveys) | 2.92 km |
| Reef Check | Solomon Reef Site B | 2008–2009 | 3.8–4.1% (3 surveys) | 3.28 km |
| Reef Check | Solomon | 2014 | 15% | 3.28 km |
| Reef Check | Scotts Head Dropoff - Tous Sable | 2014–2018 | 1.9–12% (2 surveys) | 3.29 km |
| Reef Check | La Sorciere | 2018 | 32% | 0.85 km |
| Reef Check | Coral Gardens | 2018 | 17% | 1.22 km |
| Reef Check | Inshore Suburbs | 2018 | 15% | 4.85 km |
Data & links
All images from Coral Reef Diagnostics. Data are from Coral Reef Diagnostics and the organizations named in the data sources above.
© Coral Reef Diagnostics.