
Part of the regional summary: USA - Florida
2019-07-10
2019-07-11
2019-08-21
2019-08-22
2019-10-09
2019-12-04
2021-05-06
More info
Florida Keys (NOAA CRW virtual station)An Upper Keys inshore patch reef with colonies tagged and genotyped by the NOAA AOML team in July 2017, which Anderson resampled in 2019 for thermal-stress and molecular research. NOAA's 2016 photo-transect survey put its coral cover at about 32% (29% on permanent plots in 2014, Gintert et al. 2018), though heat stress peaked at a severe 22.3 degree heating weeks in 2023 (NOAA Coral Reef Watch, Florida Keys virtual station).
Twenty independent survey stations shown with the program’s logo — click one to see how far it is from this site.
13 of the 18 photographs on this page are shown beside the text that discusses them under "Site description" below.
Site description
Setting
Cheeca Rocks is an Upper Keys inshore patch reef off Islamorada, a NOAA coral-monitoring station with colonies tagged and genotyped by the NOAA AOML team in July 2017, which Anderson resampled repeatedly in 2019 for the thermal-stress and molecular work published as Mayfield et al. 2021–2023.
General benthic features
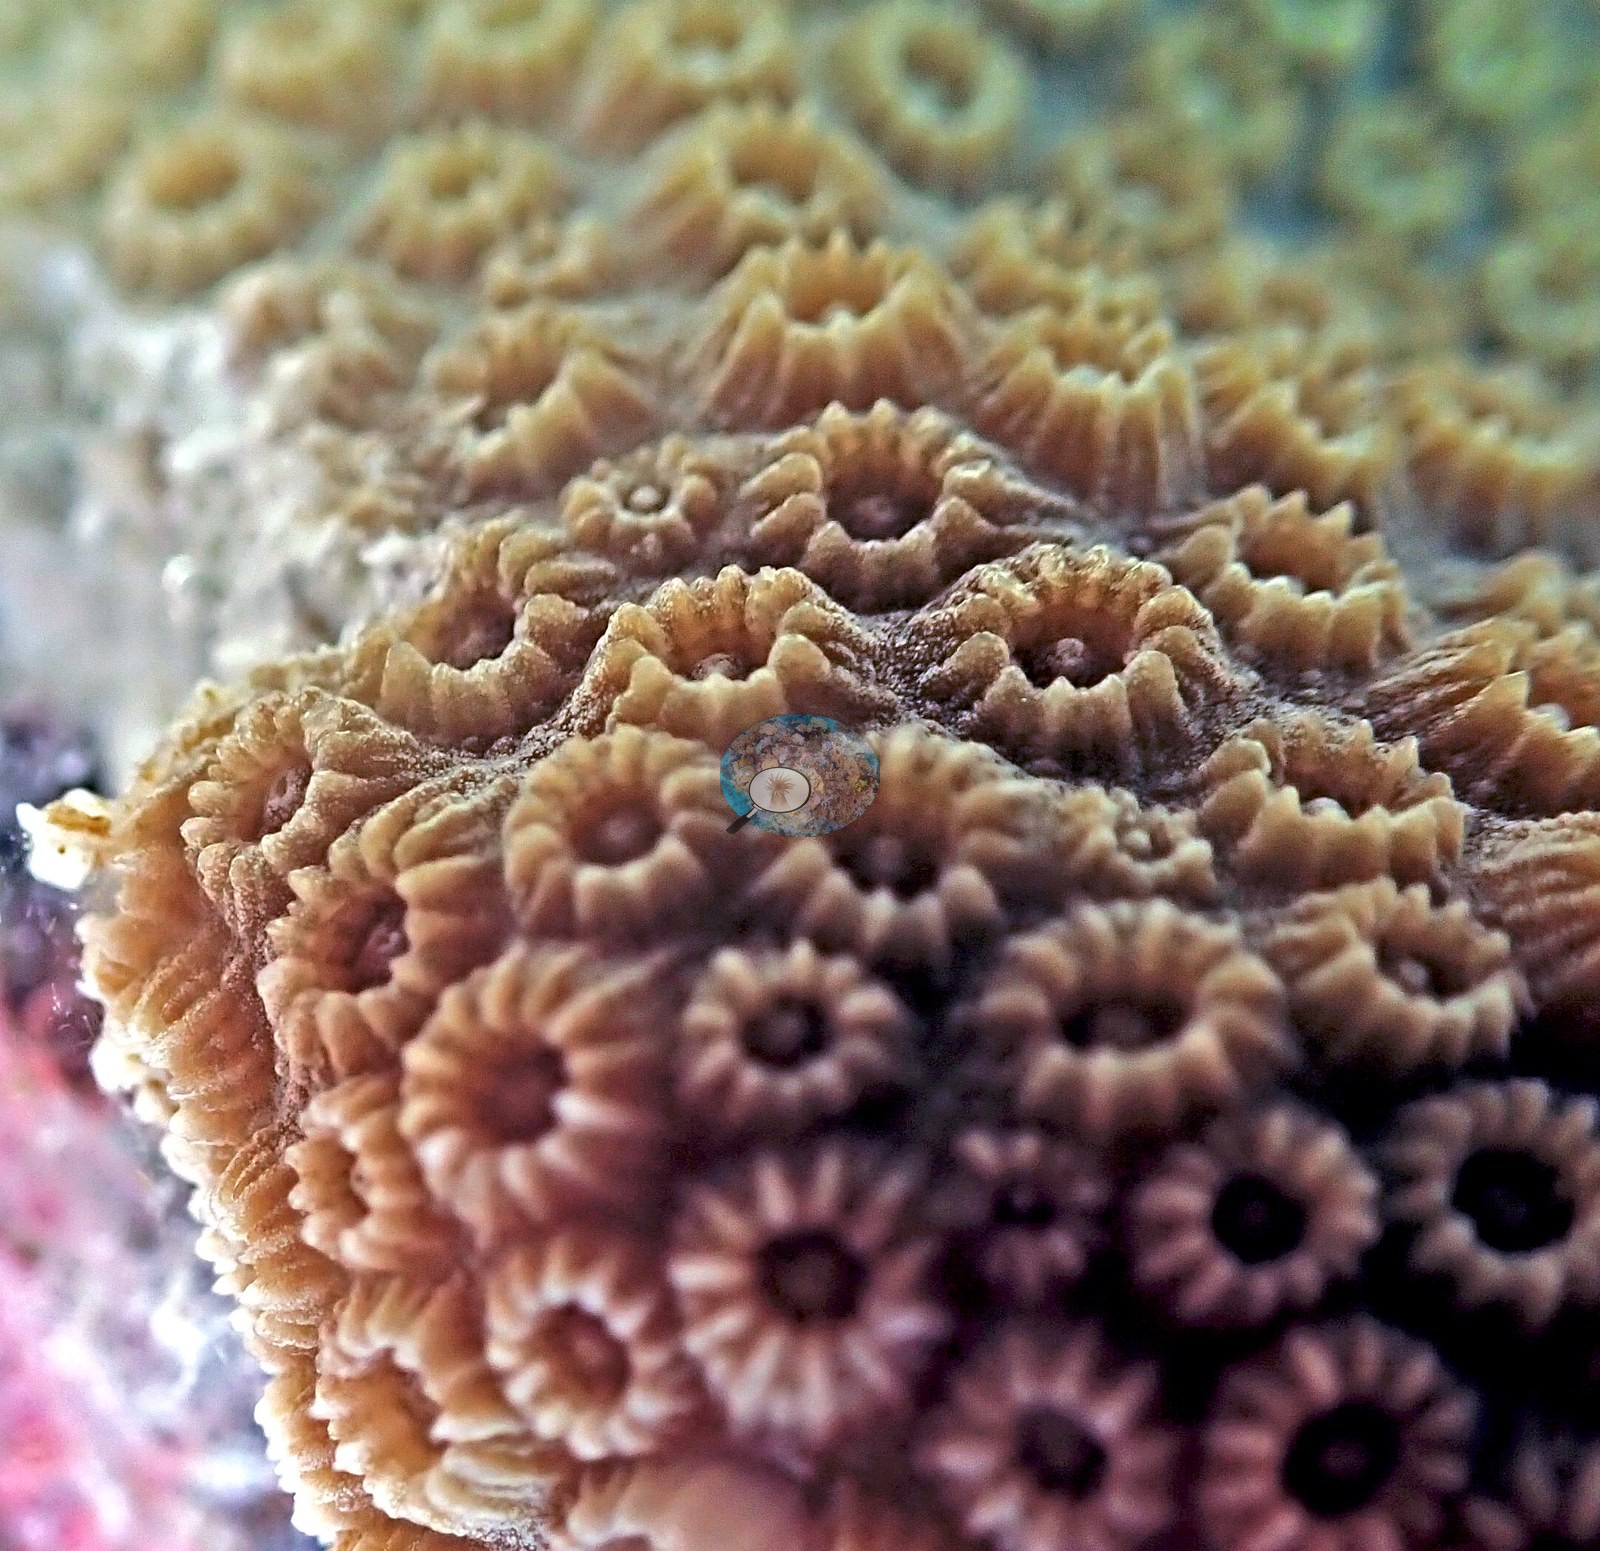
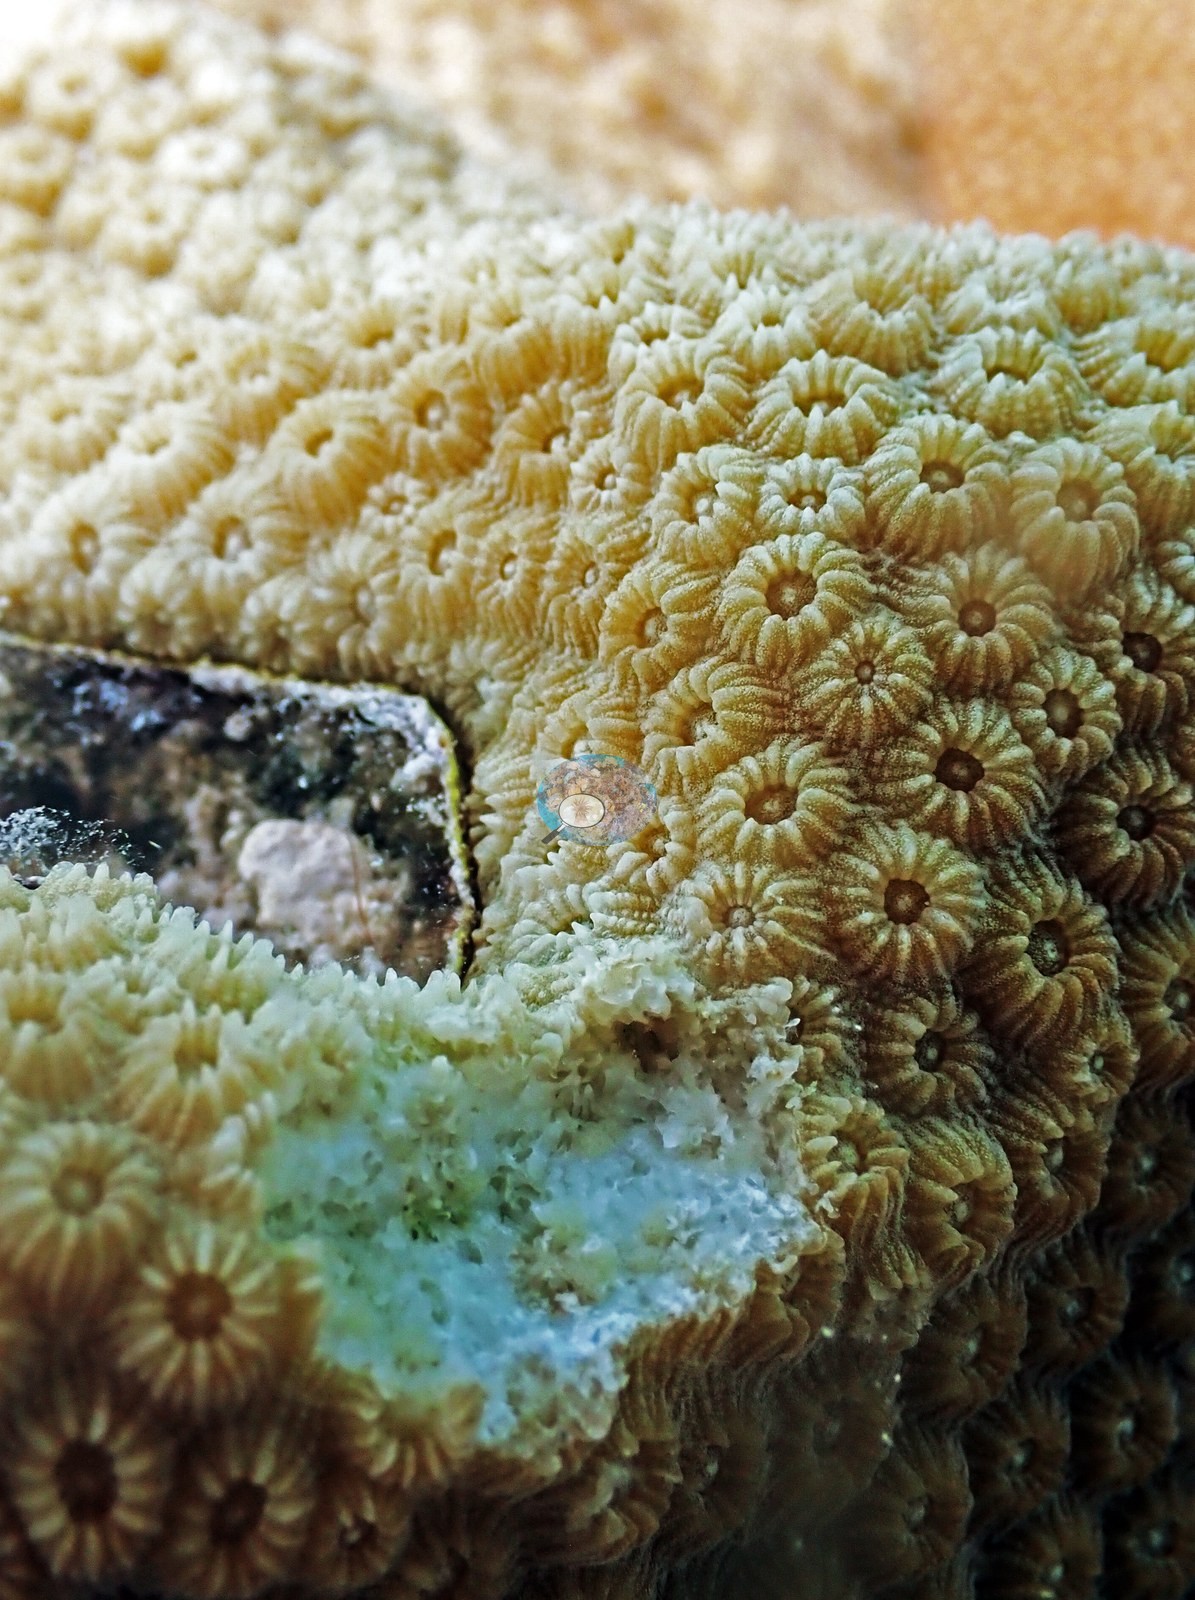
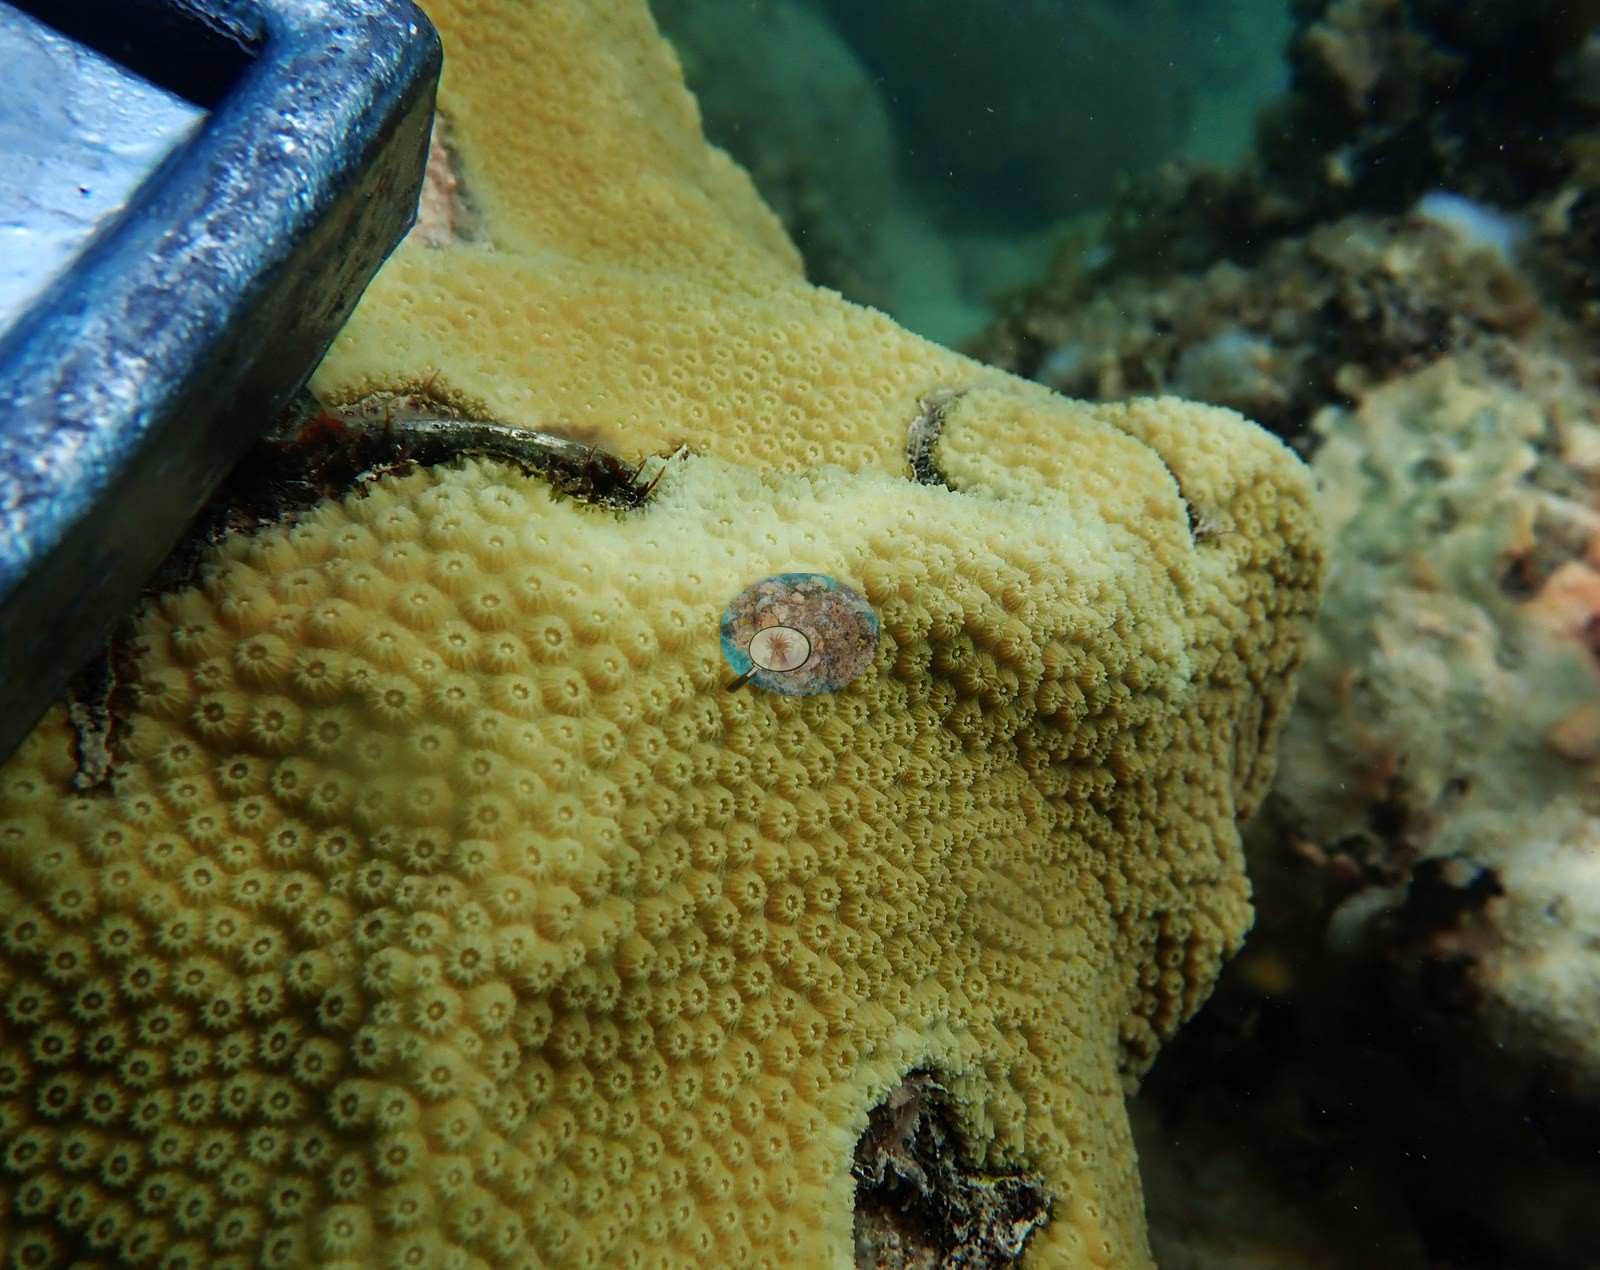
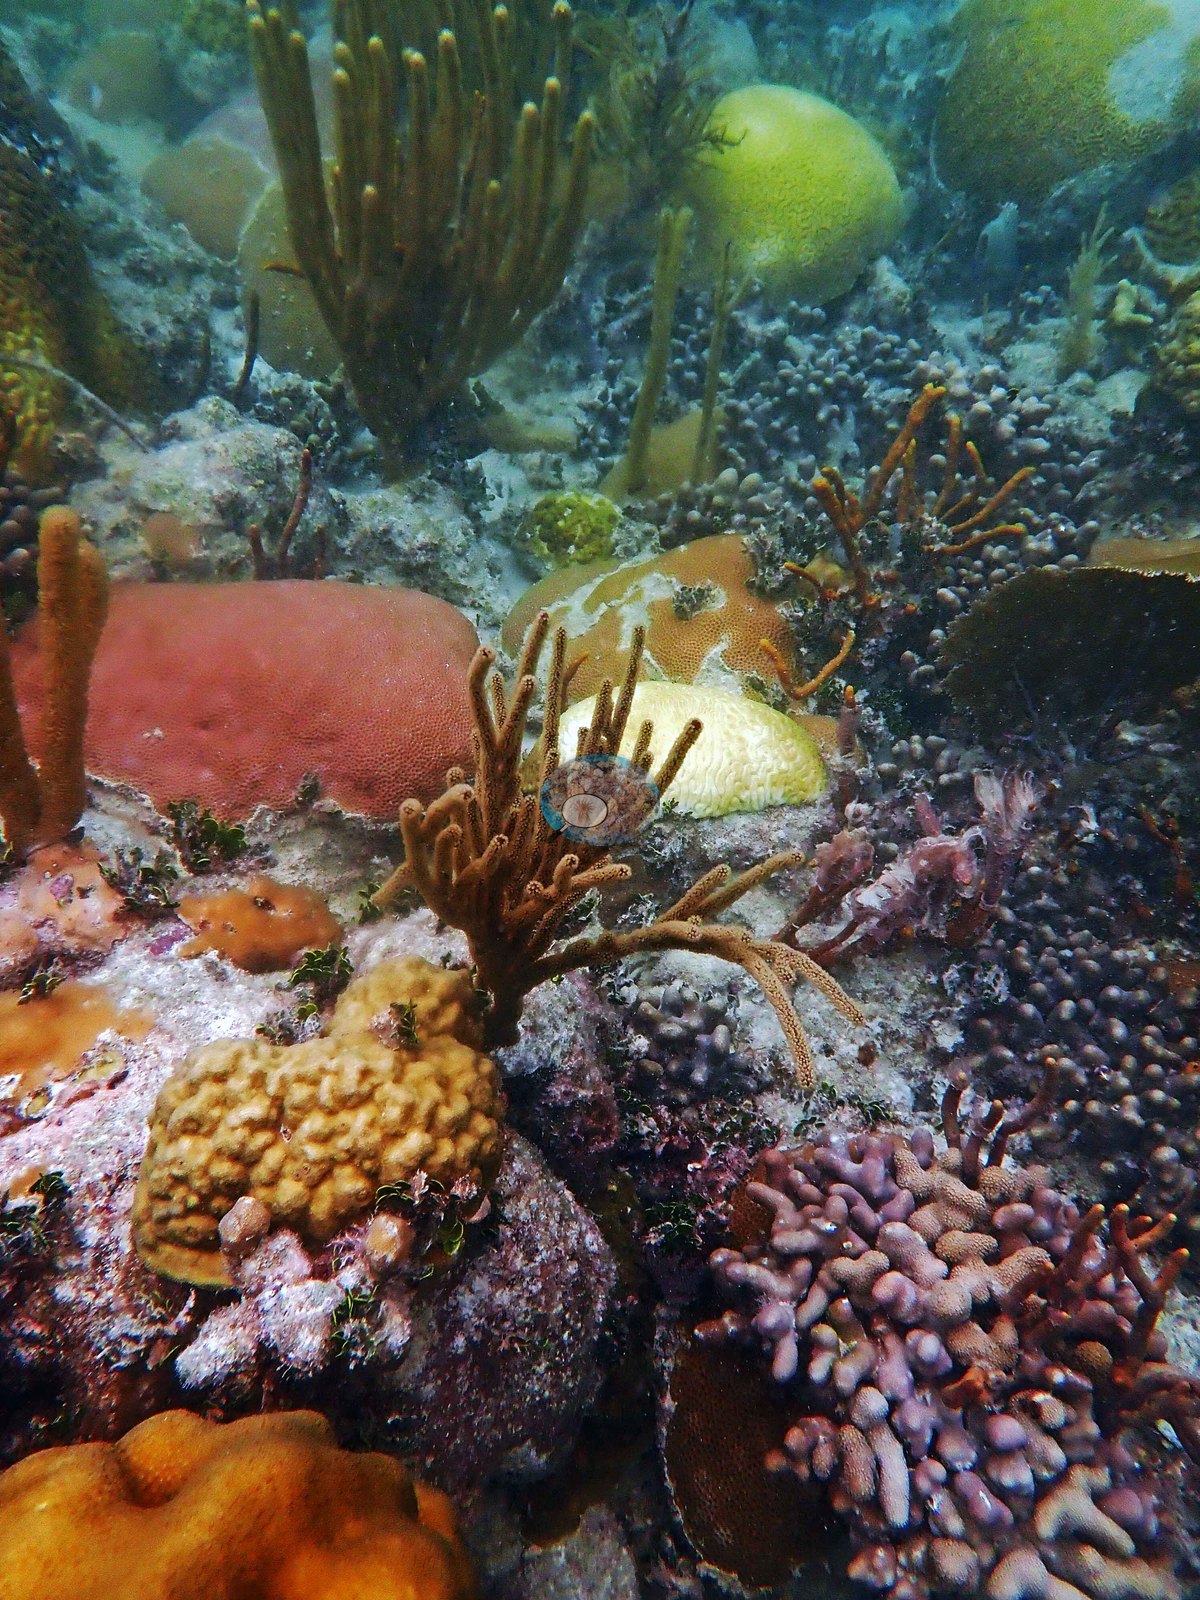
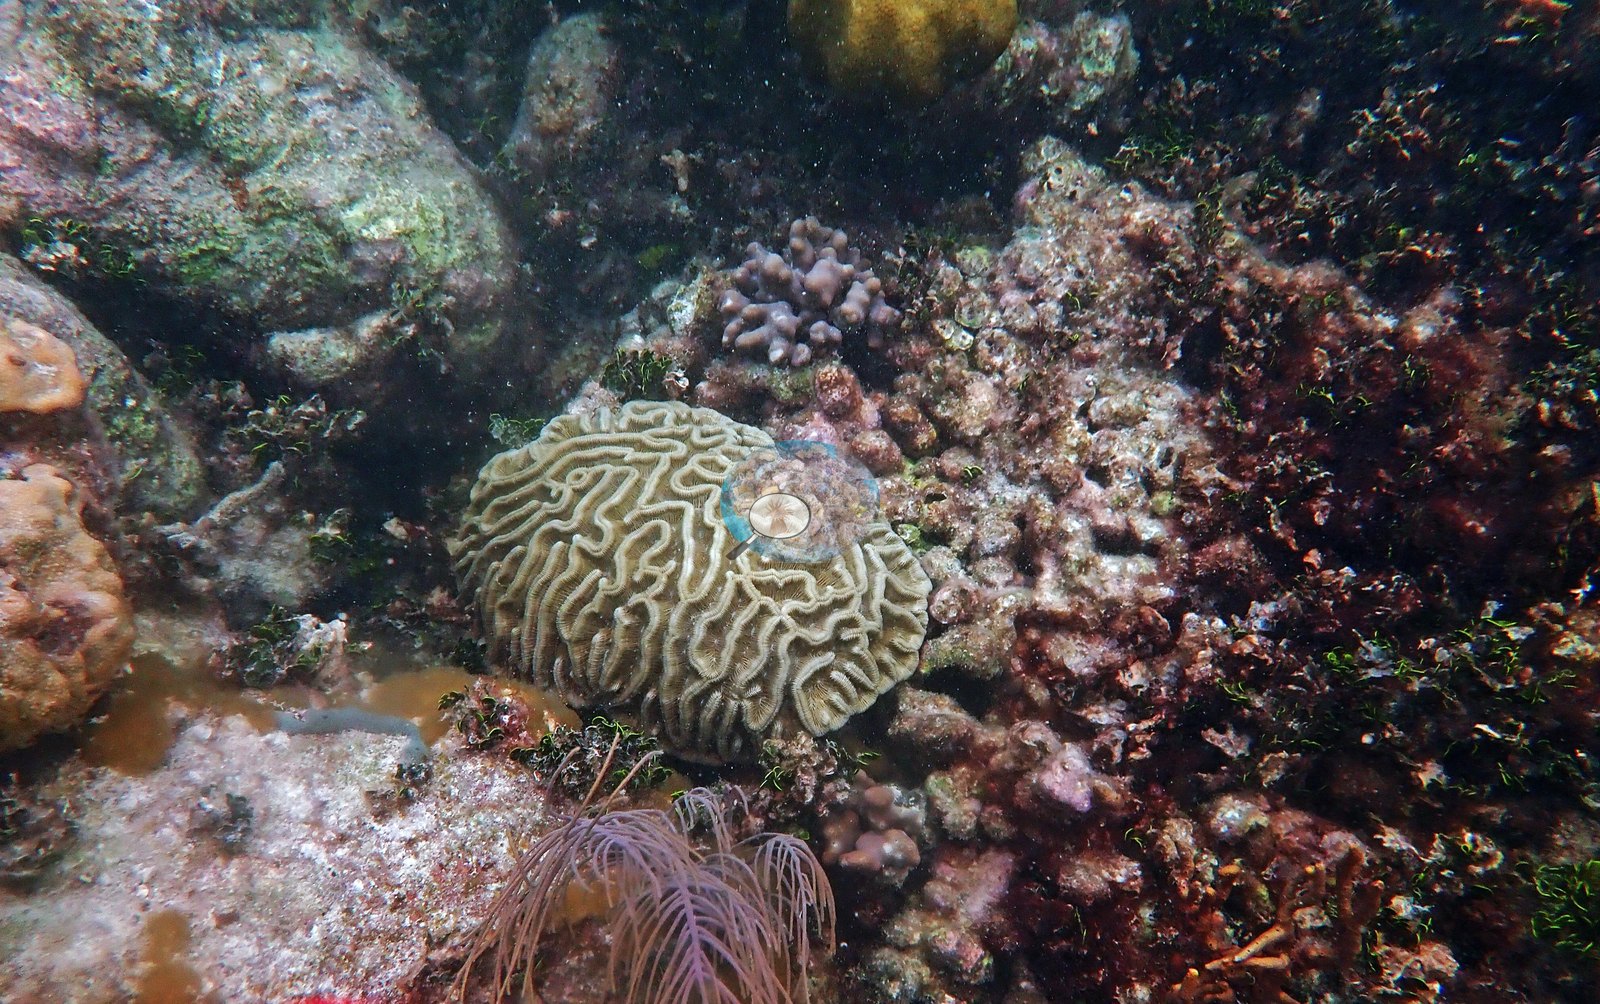
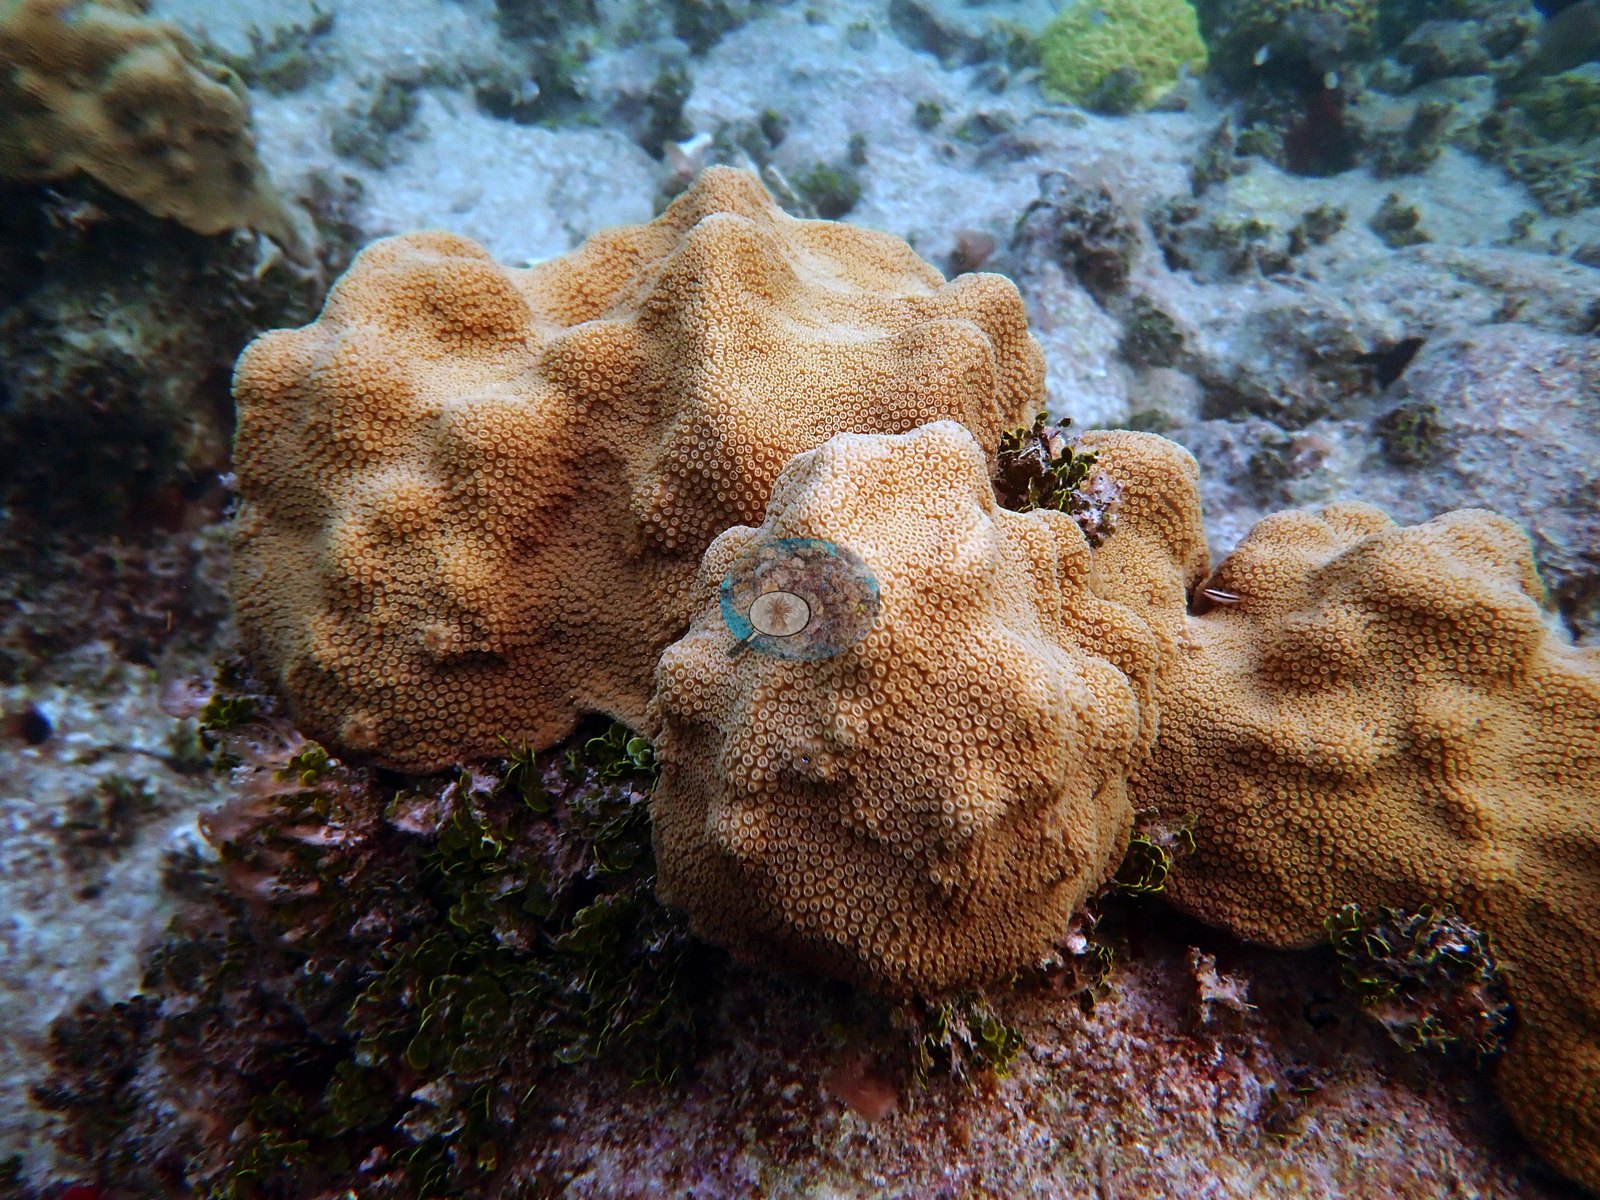
The photographs show dome after dome of large mounding Orbicella faveolata, several meters across, standing shoulder to shoulder in shallow, often murky green water — a coral landscape rather than scattered colonies on pavement. Between and around them are mustard-yellow mounding colonies (e.g., Image 6), pink-lavender Porites porites finger thickets (e.g., Image 7), brain corals (e.g., Image 8), large-polyped mounding colonies (e.g., Image 9), branching and encrusting fire coral (e.g., Image 10), Palythoa zoanthid mats (e.g., Image 11), sea plumes, sea rods, and thick brown macroalgae.
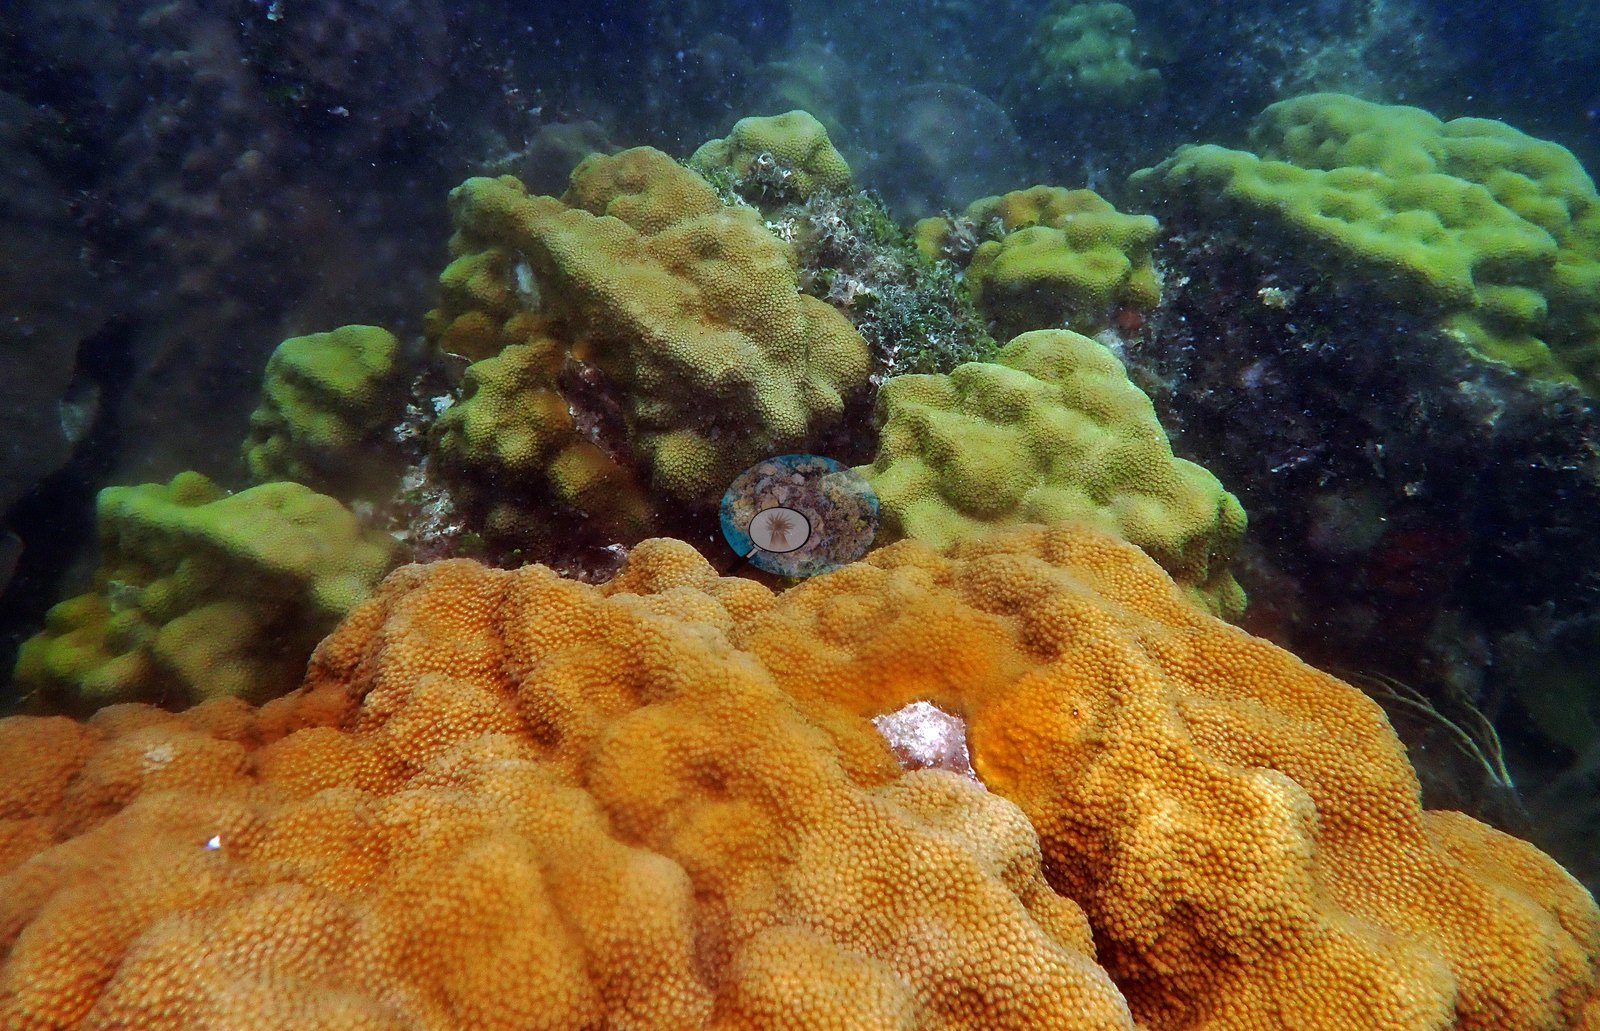
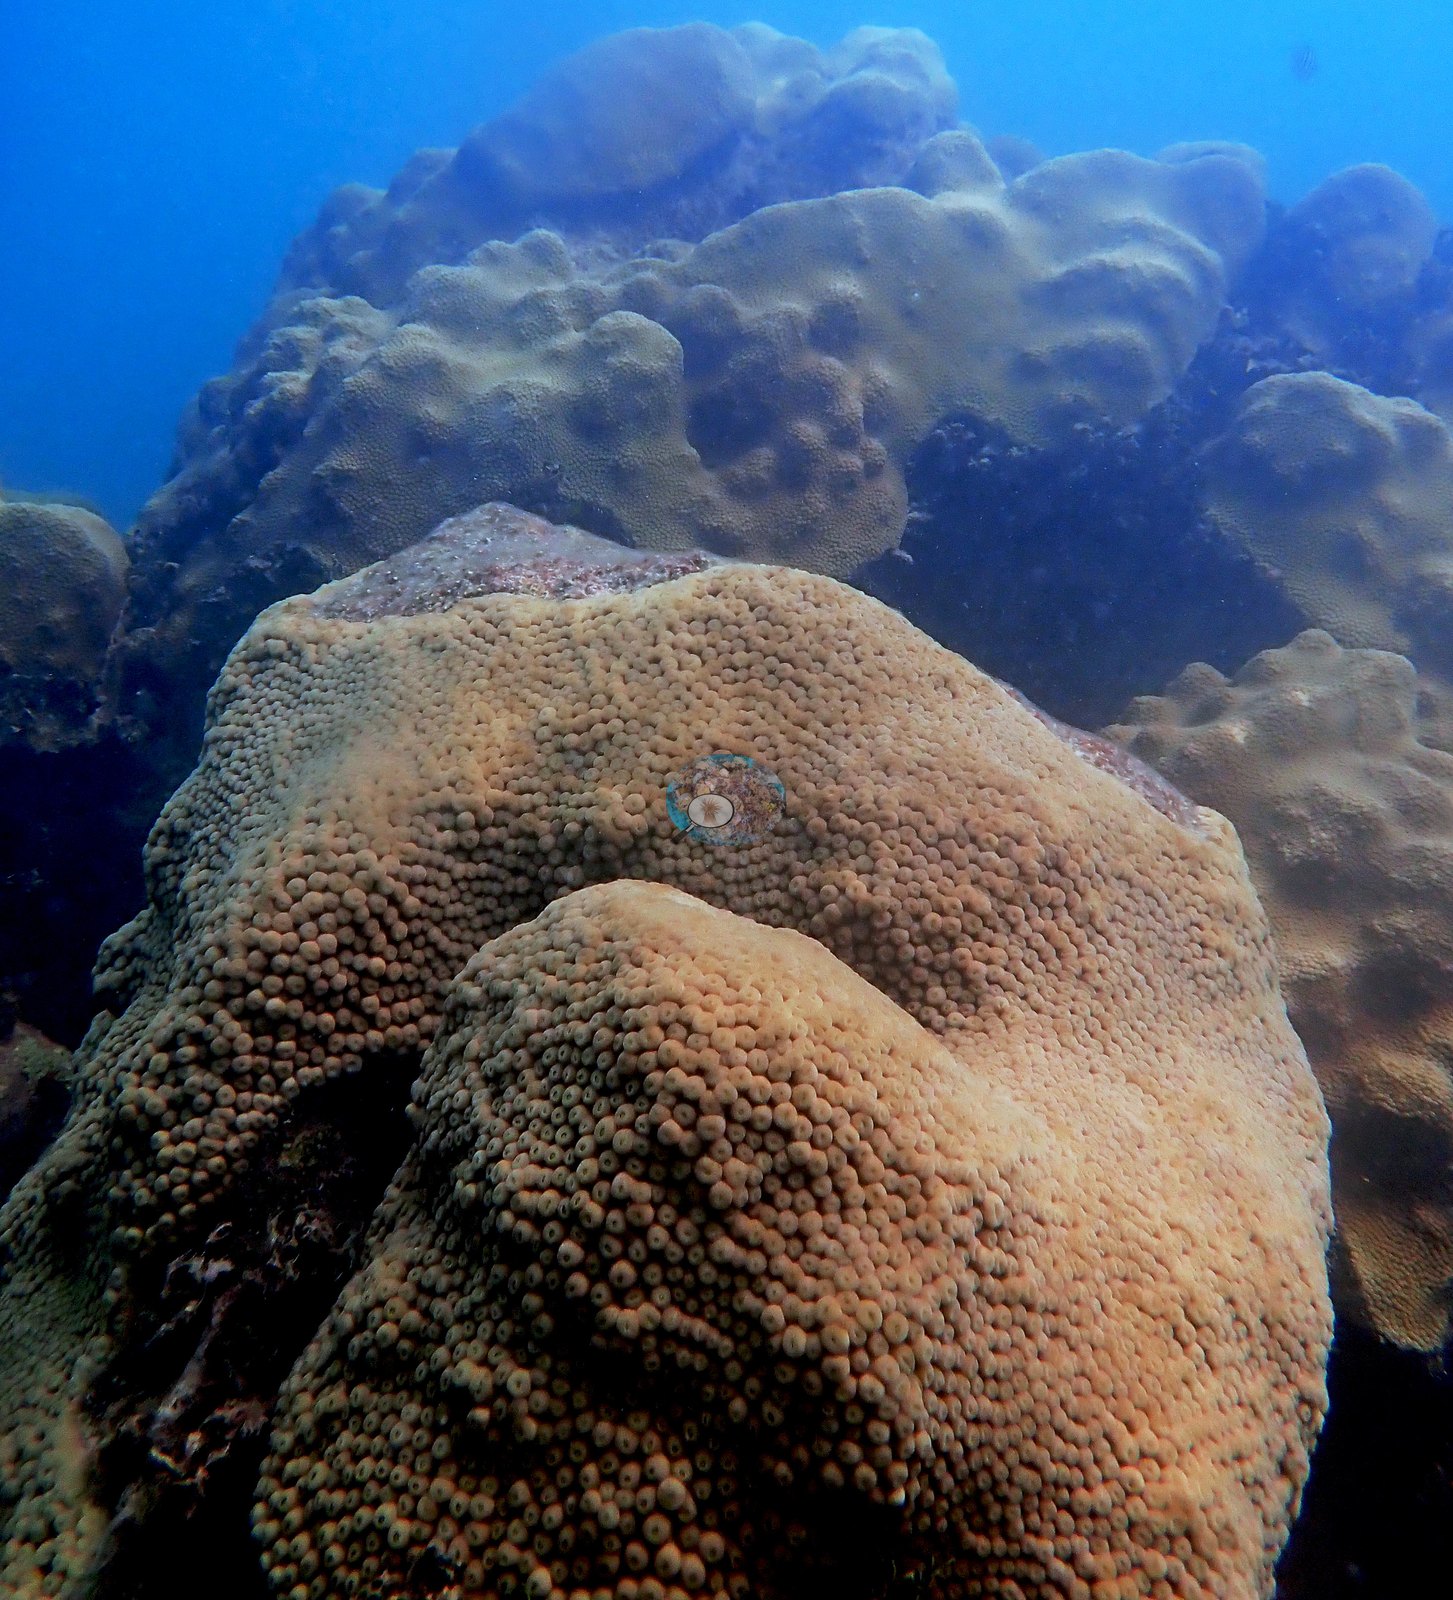
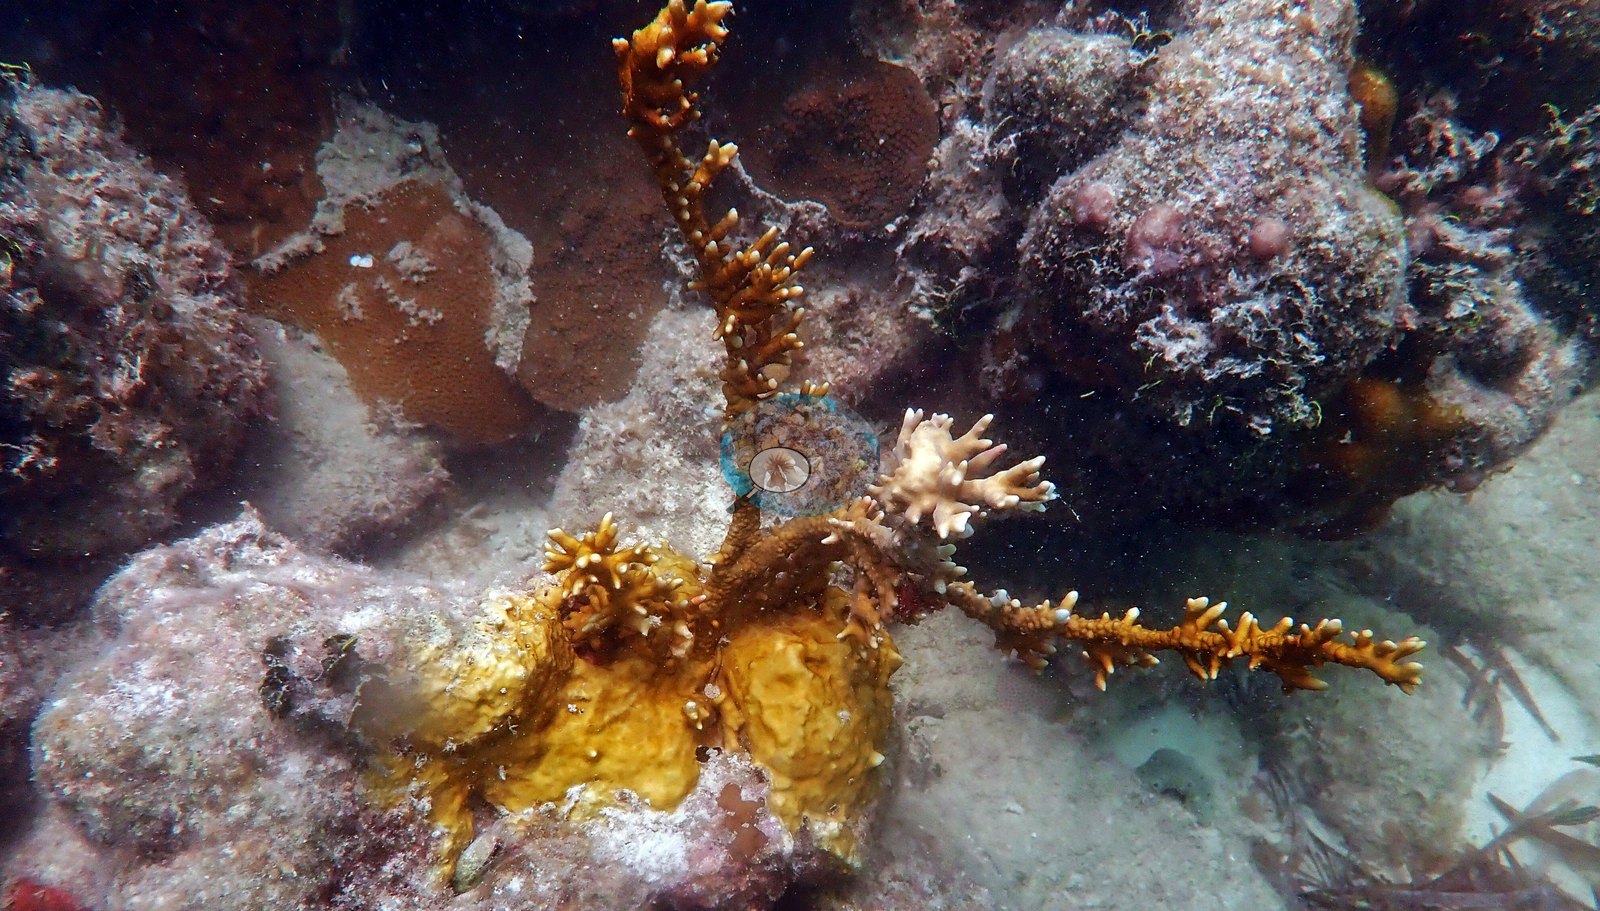
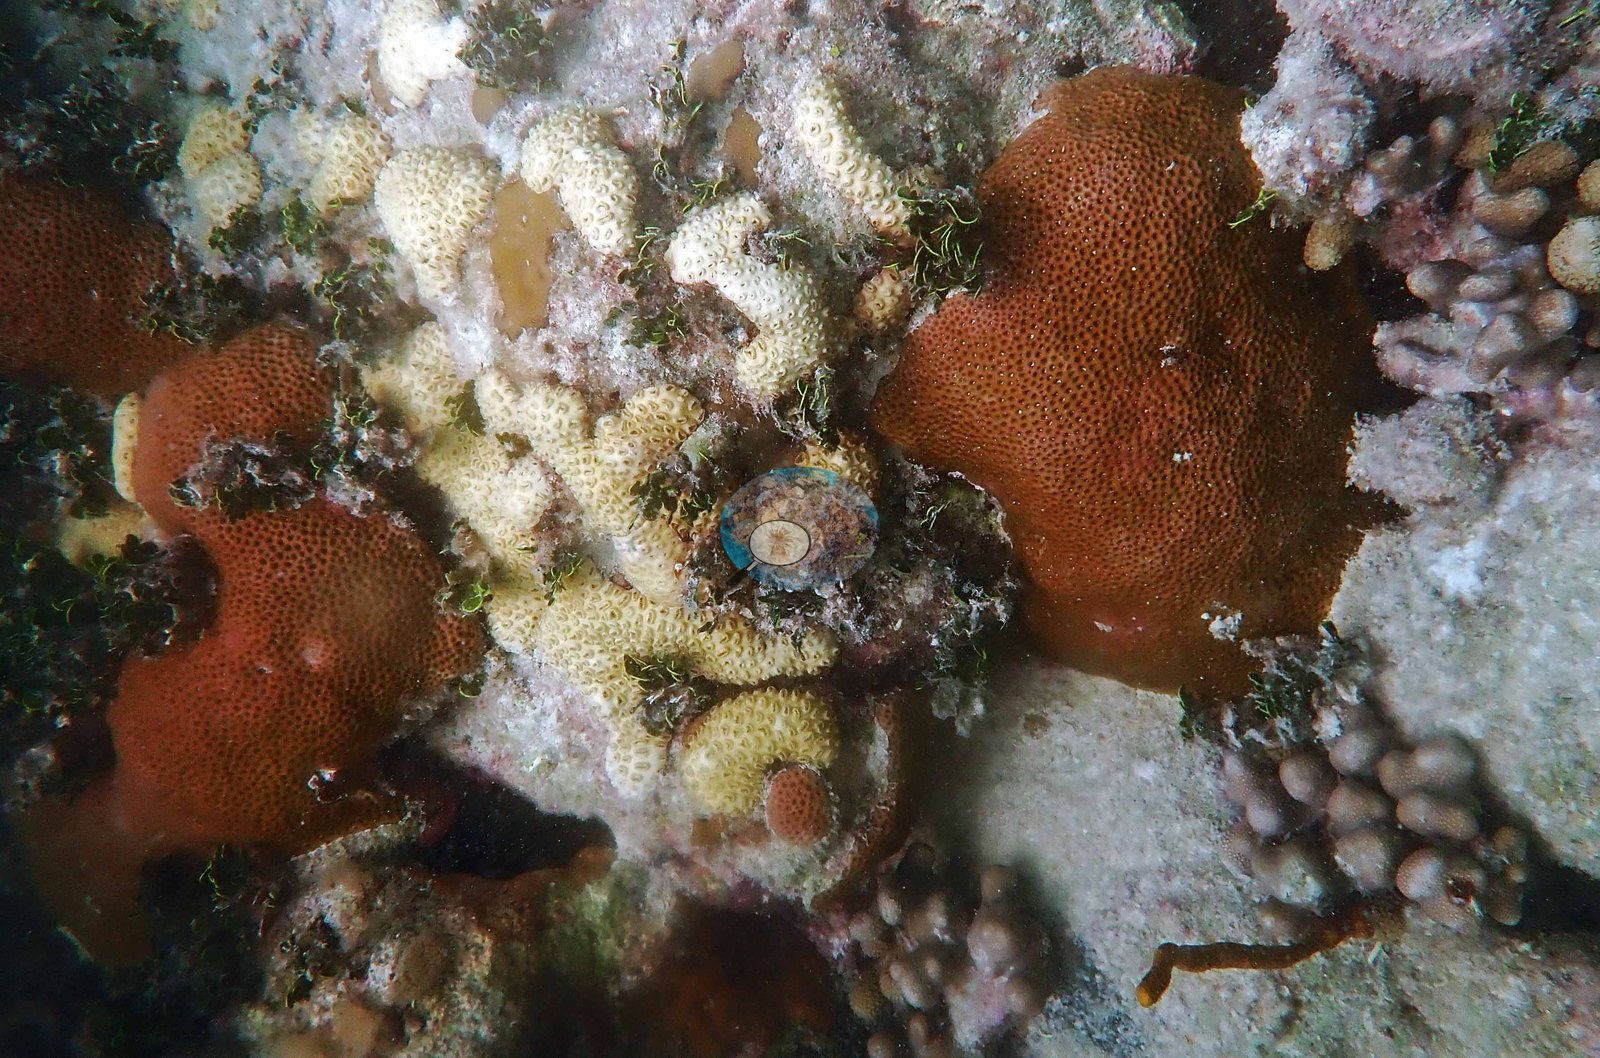
Study colonies are visible as such: several large O. faveolata heads carry rows of circular core holes from tissue biopsies, and transect line runs through the frames.
Coral cover
- Coral cover: 32% (August 2016), from the NOAA NCRMP and NOAA AOML photo-transect survey of this reef published by Manzello et al. (2019, Global Change Biology) — 40 frames on two 10 m transects, point-counted. The inshore average of 17% in that study includes it. Separately, Gintert et al. (2018) mapped 29% cover on six permanent mosaic plots here in 2014, falling to 26% by July 2016; that is a different method and plot set, reported alongside rather than averaged.
Stressors
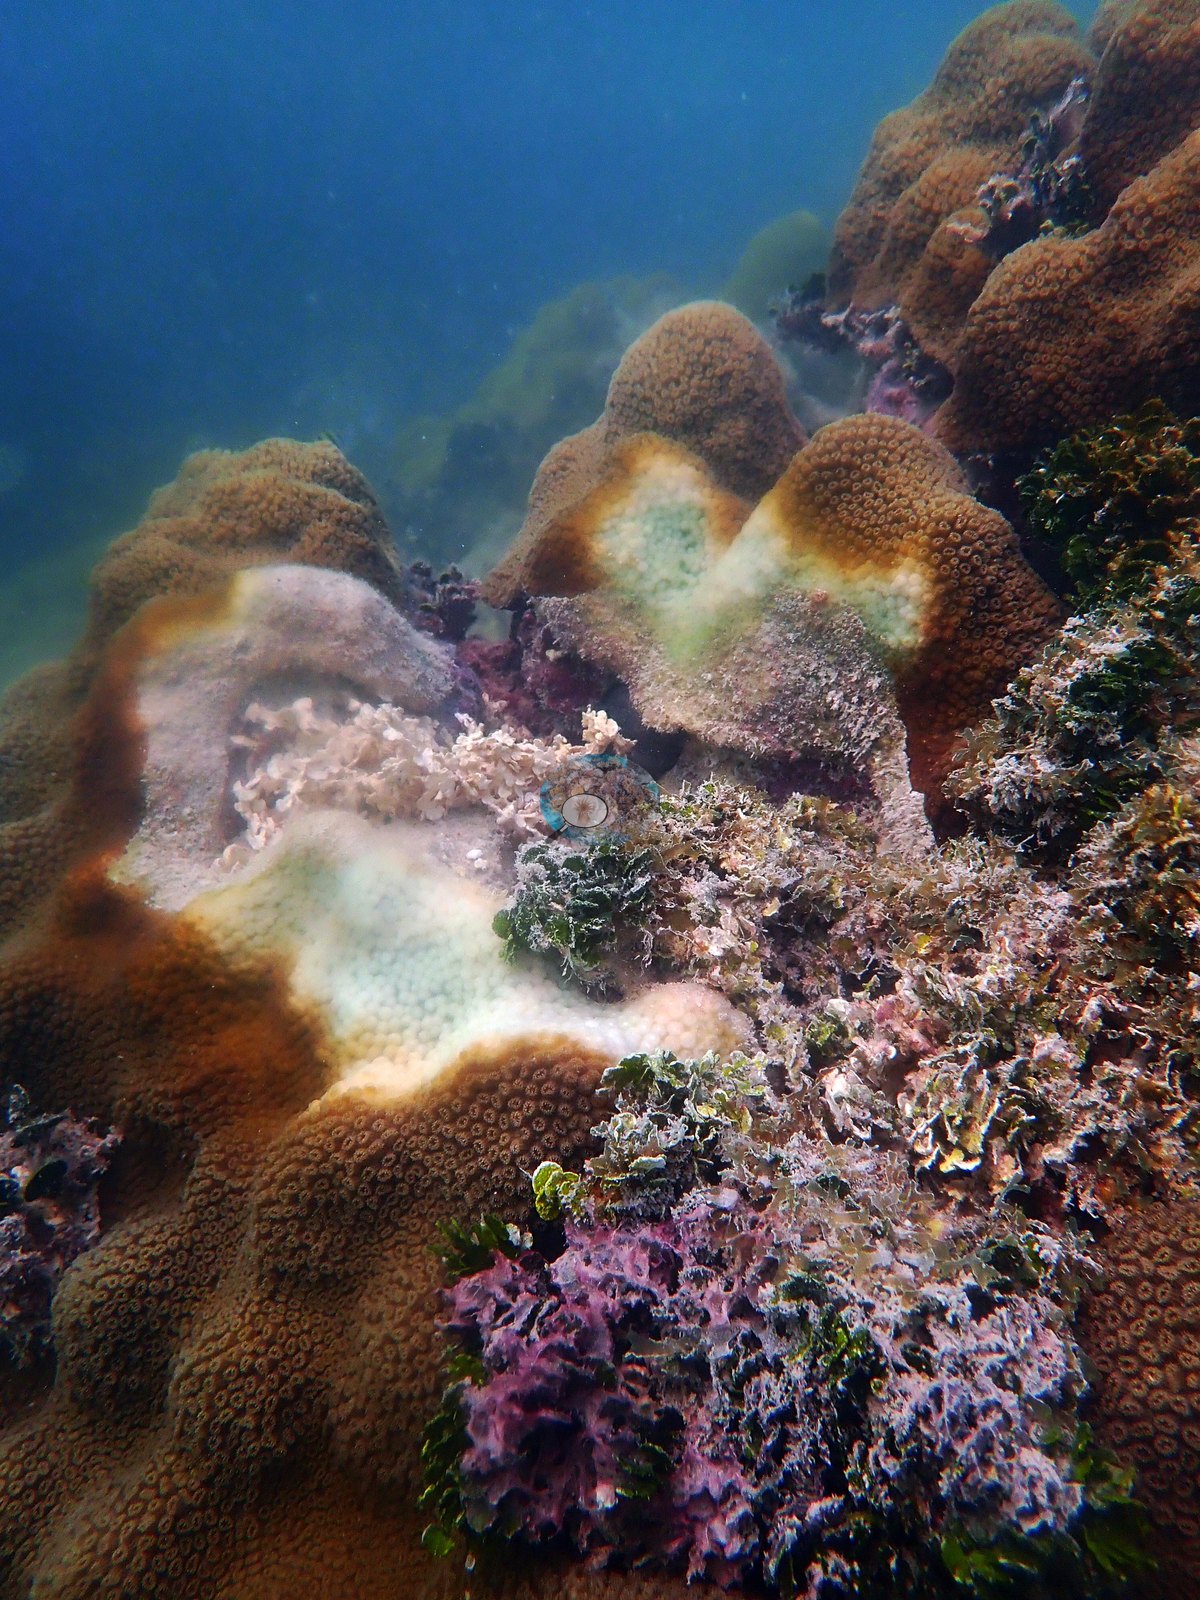
The 2019 condition record is severe, and it is Anderson's own read, not an inference from these photographs — the records from the August 2019 dives note stony coral tissue loss disease; diseased, sick, and paling Orbicella faveolata; bleaching in fire coral, in poritids, and in other corals; paling brain corals; and partial bleaching, so these are field calls, recorded at the time. Tissue loss: one frame, in which Anderson recorded stony coral tissue loss disease (SCTLD), shows a mustard massive colony with a sharp band of freshly bare white skeleton advancing across it (e.g., Image 12), and another, from the October 2019 Cheeca photographs, shows a large Orbicella faveolata recorded as diseased, with multifocal lesions, knife-edge margins between brown tissue and denuded skeleton (e.g., Image 13).
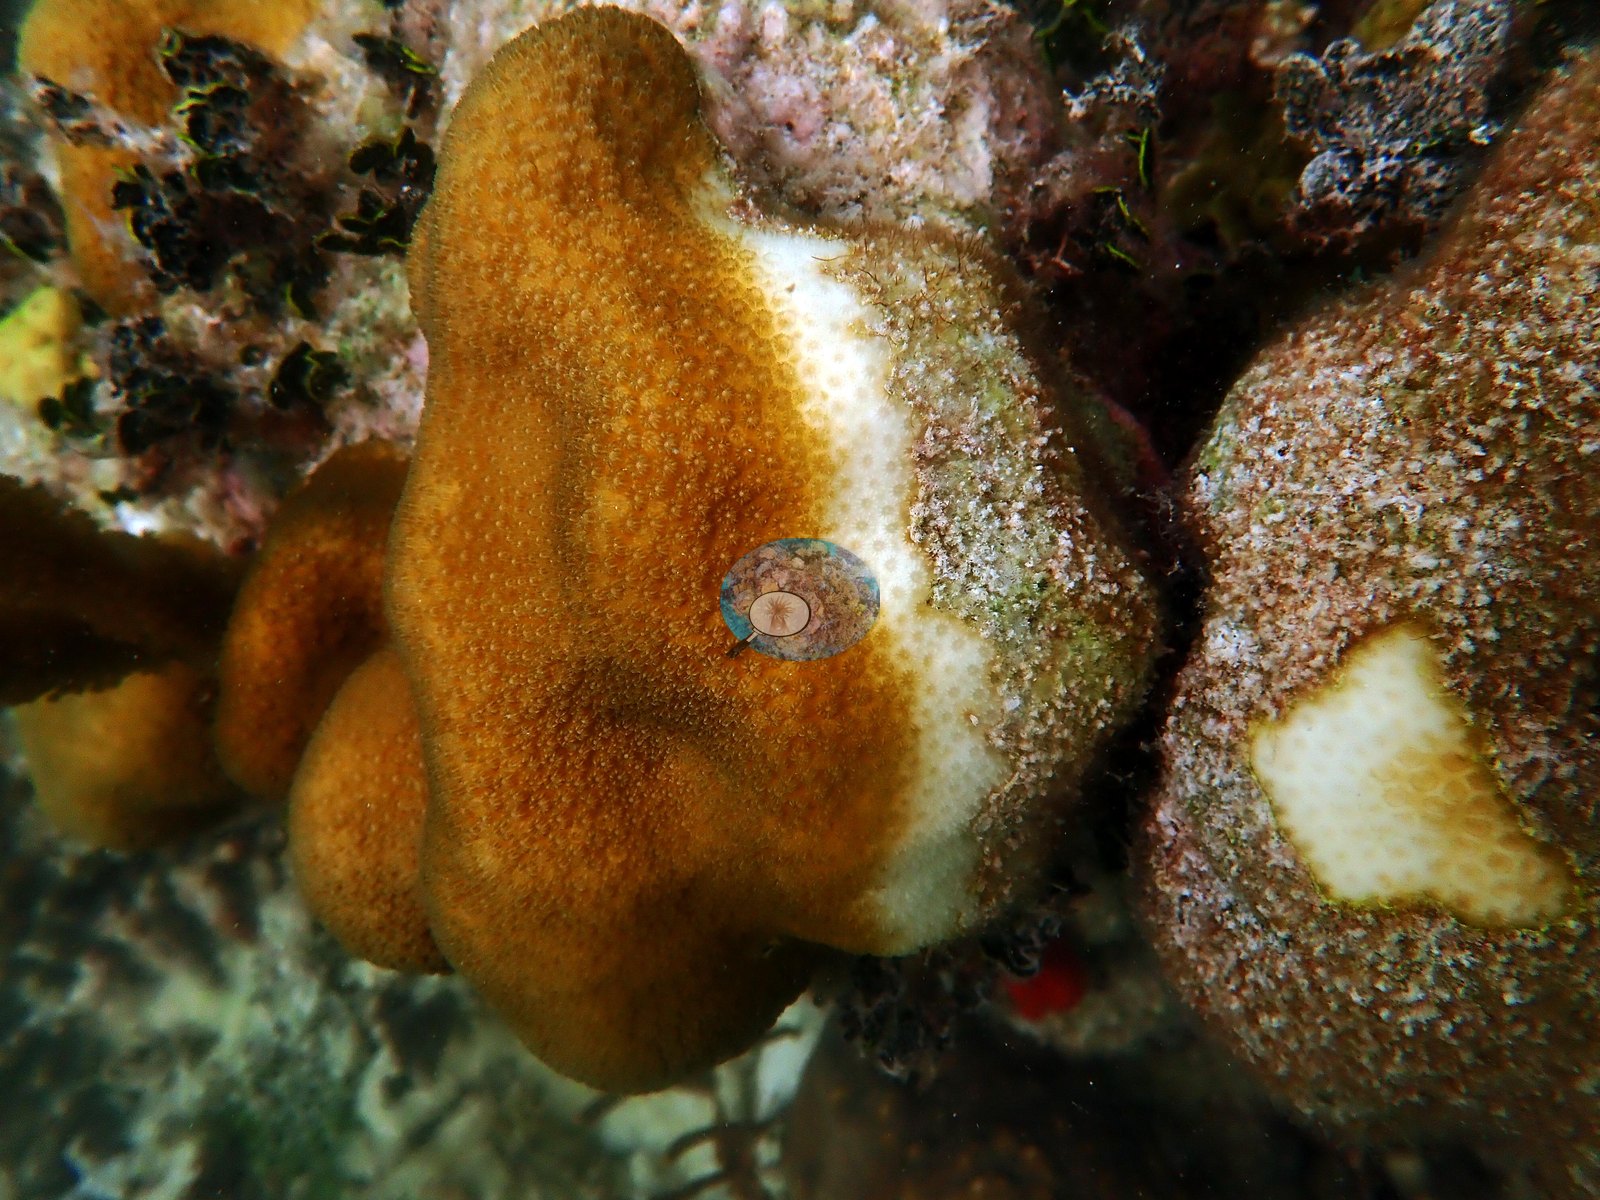
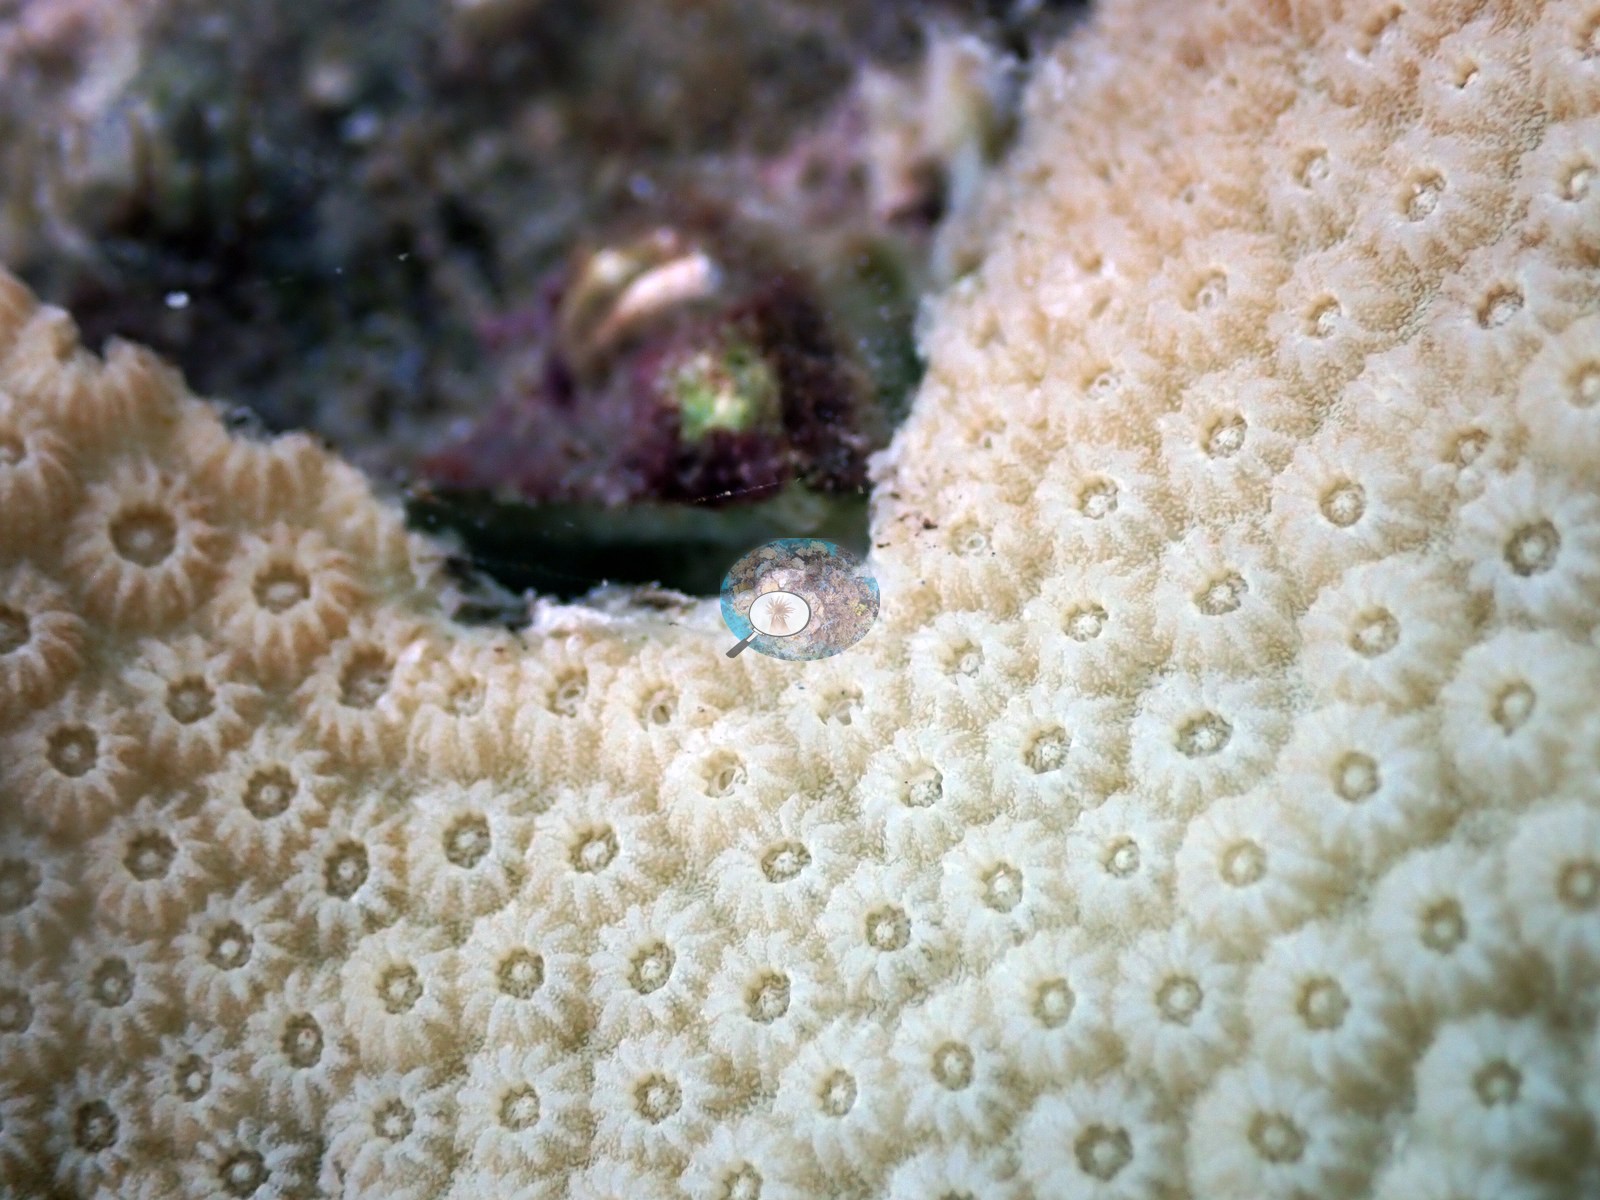
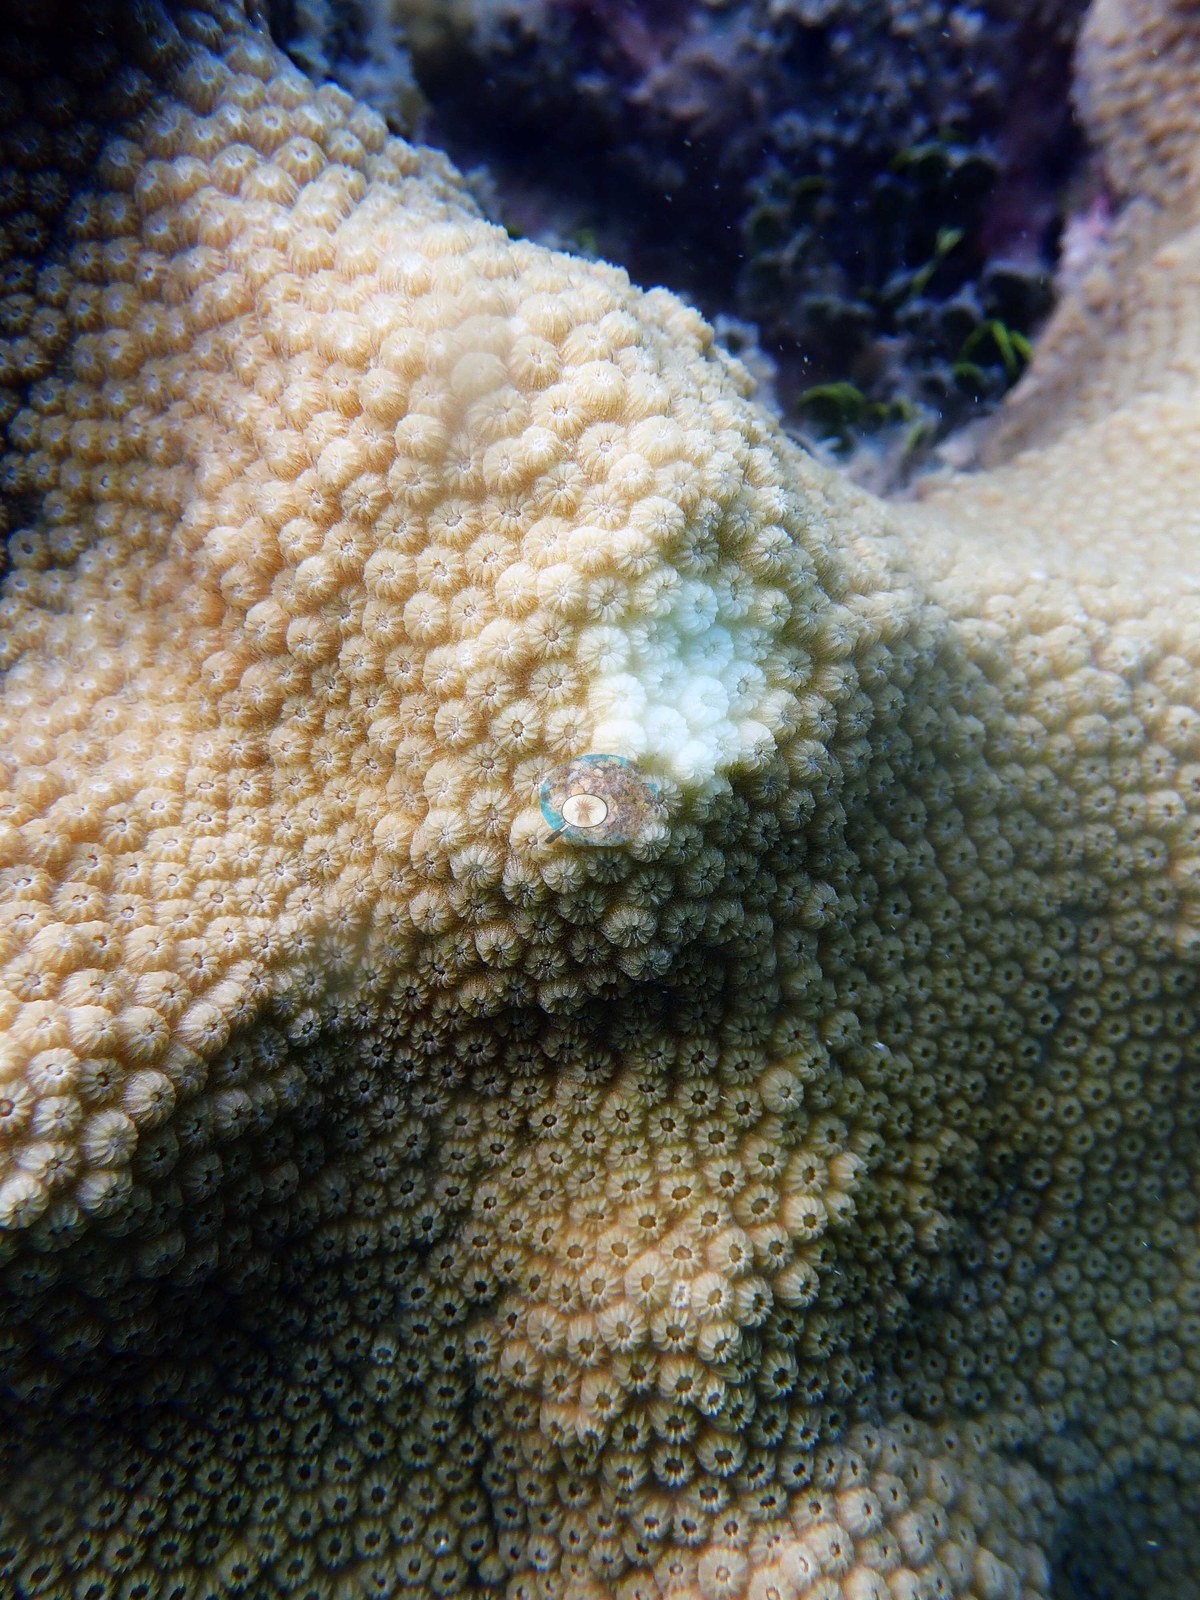
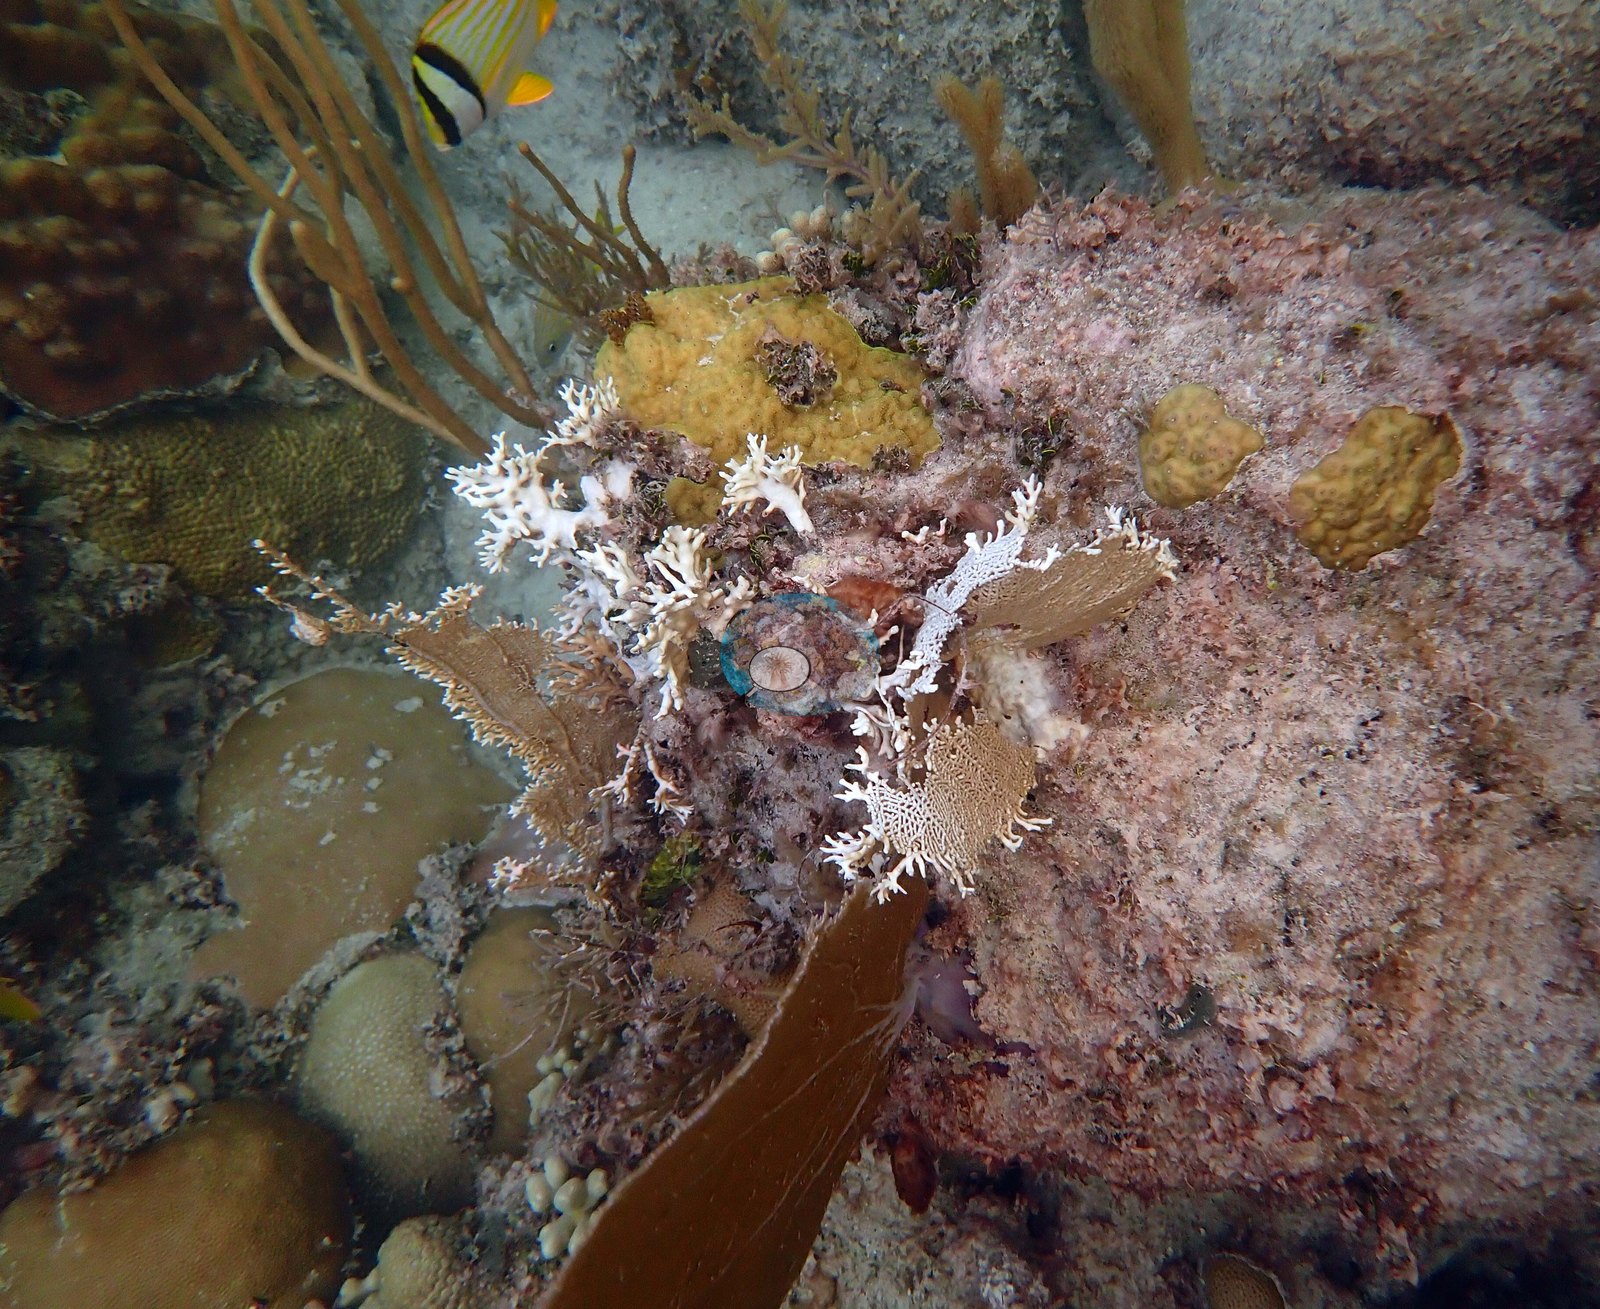
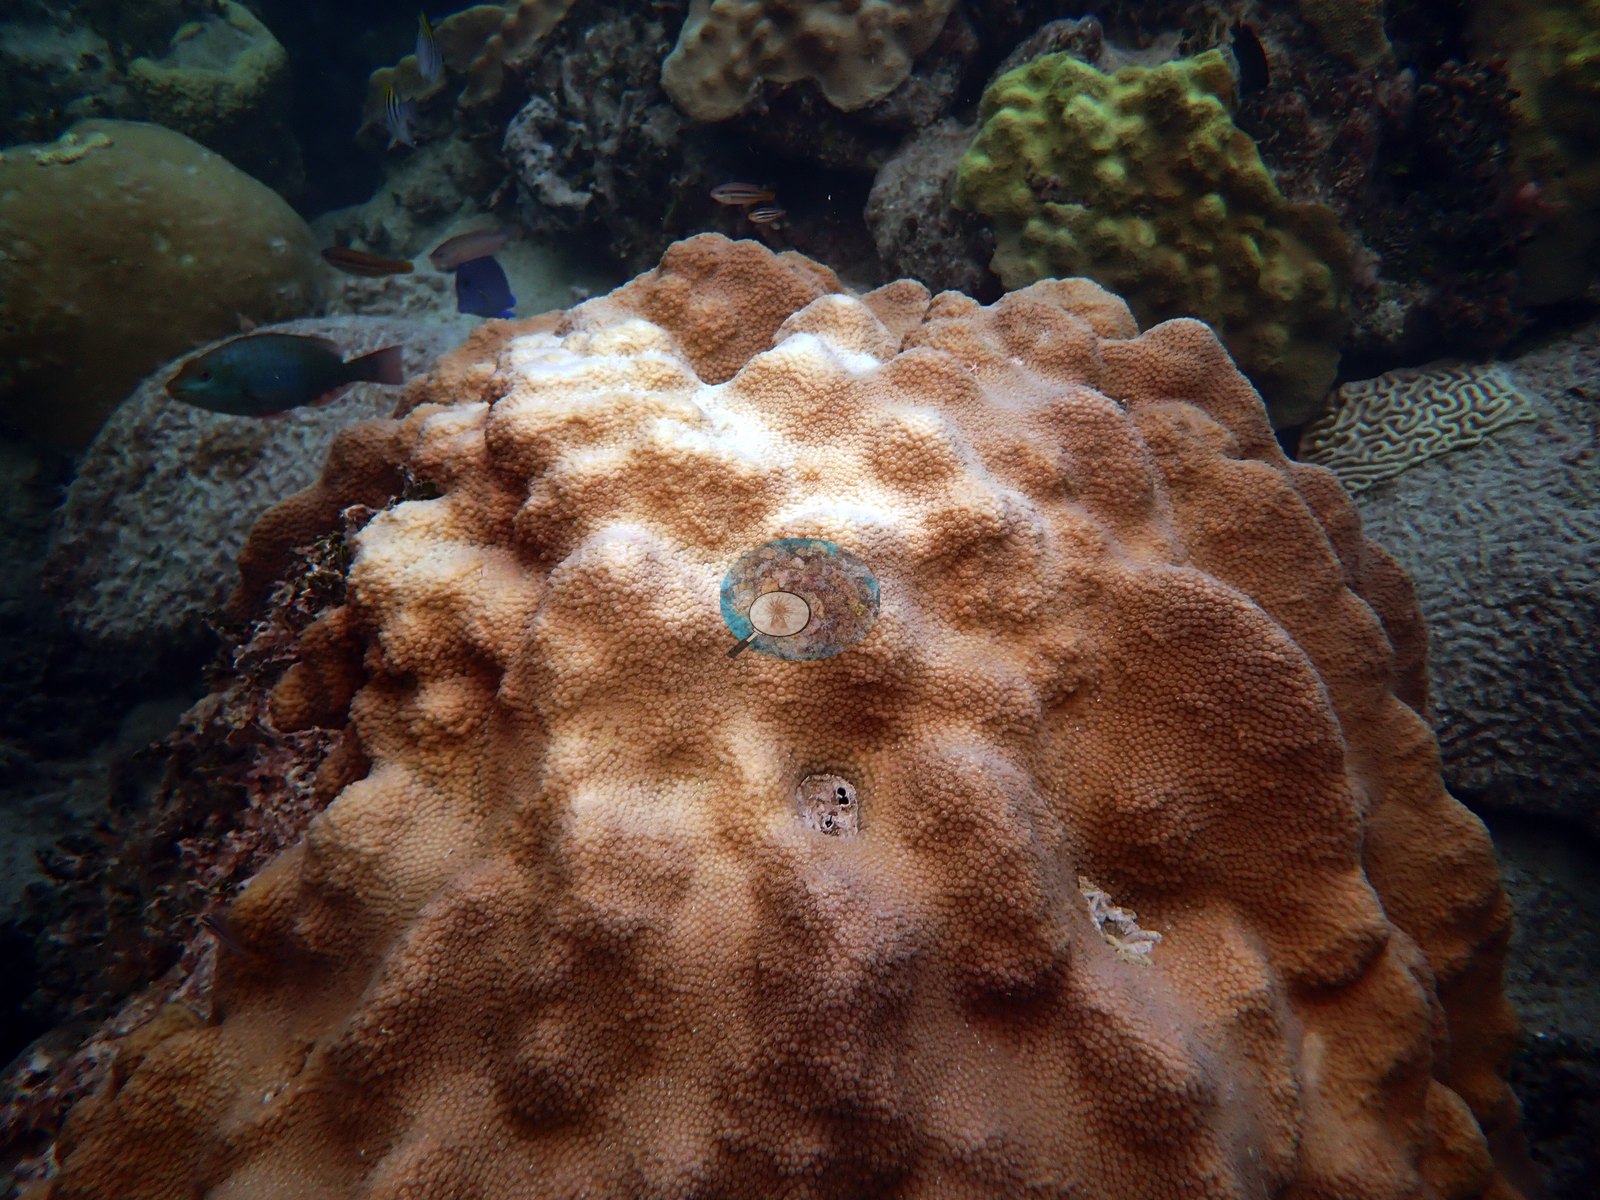
Bleaching, August 2019: branching fire coral stark white (e.g., Image 14), a knobby Porites colony fully white beside normally pigmented neighbors (e.g., Image 15), and one O. faveolata mottled with white zones (e.g., Image 16); two brain corals (e.g., Image 17) and a whole O. faveolata colony (Image 18) are pale with tissue still present (paling, not bleaching).
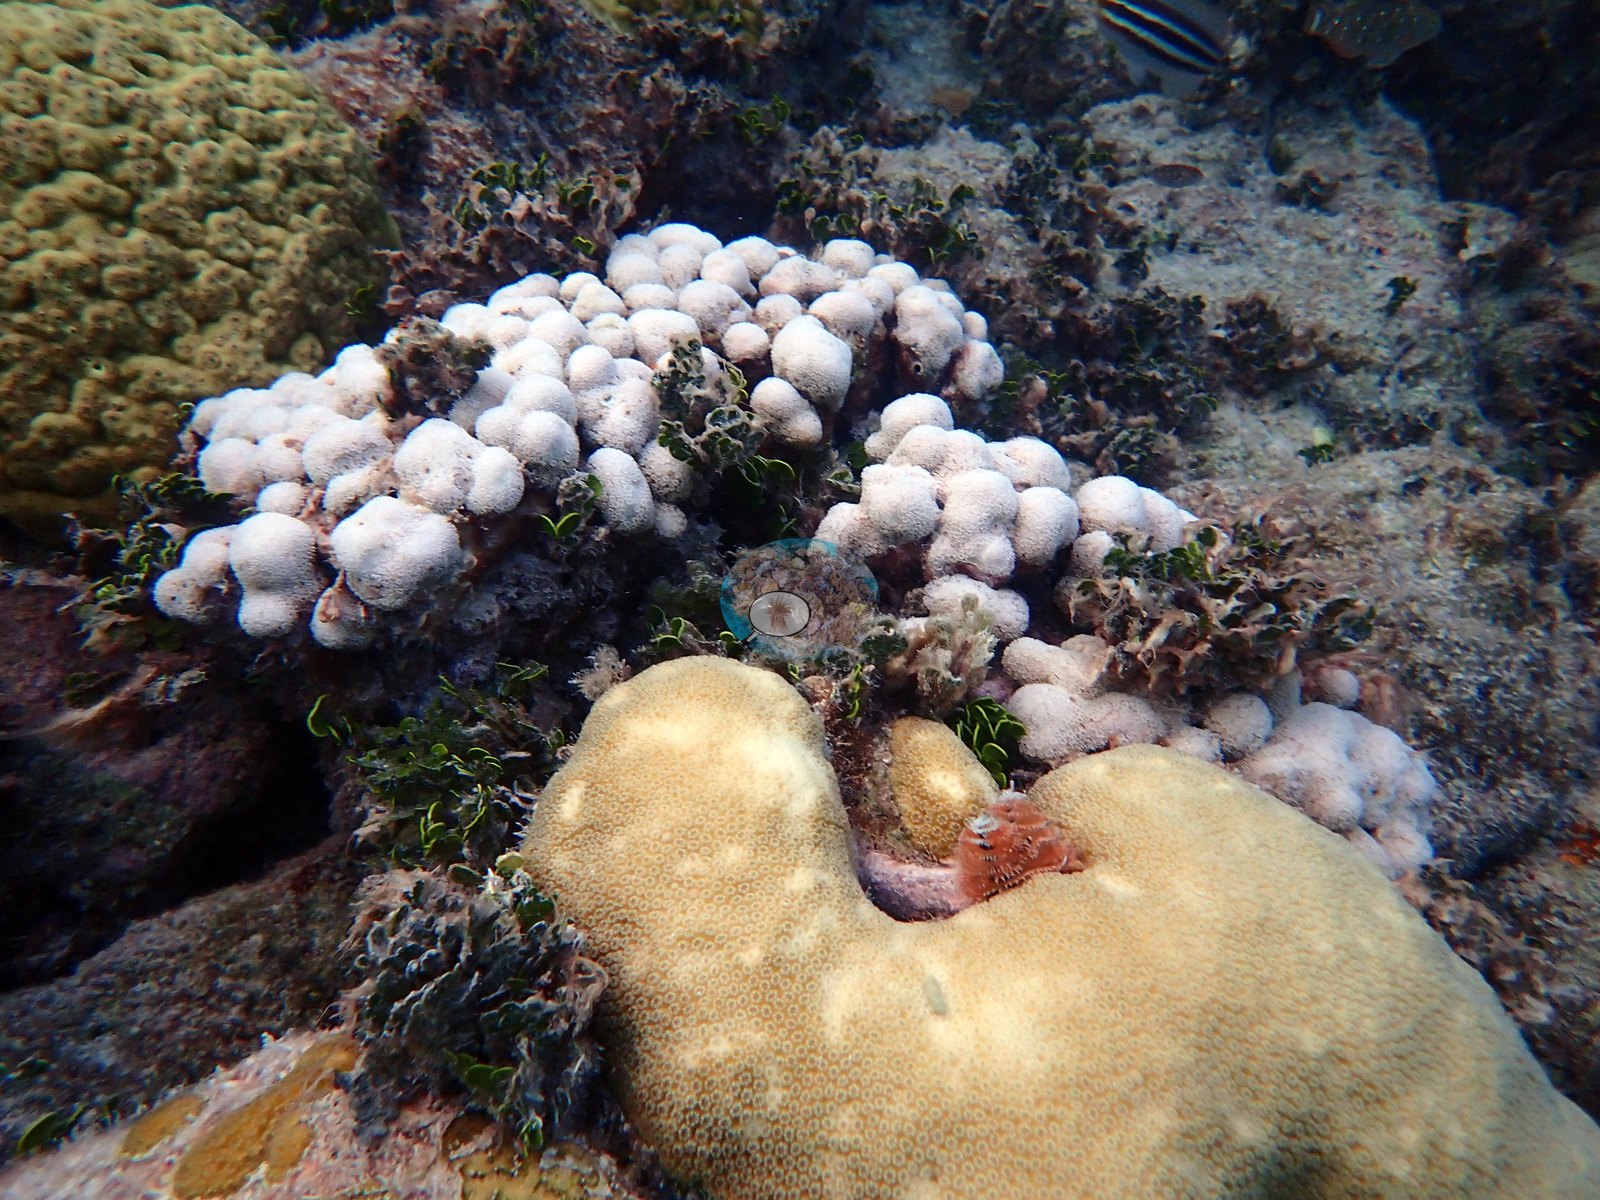
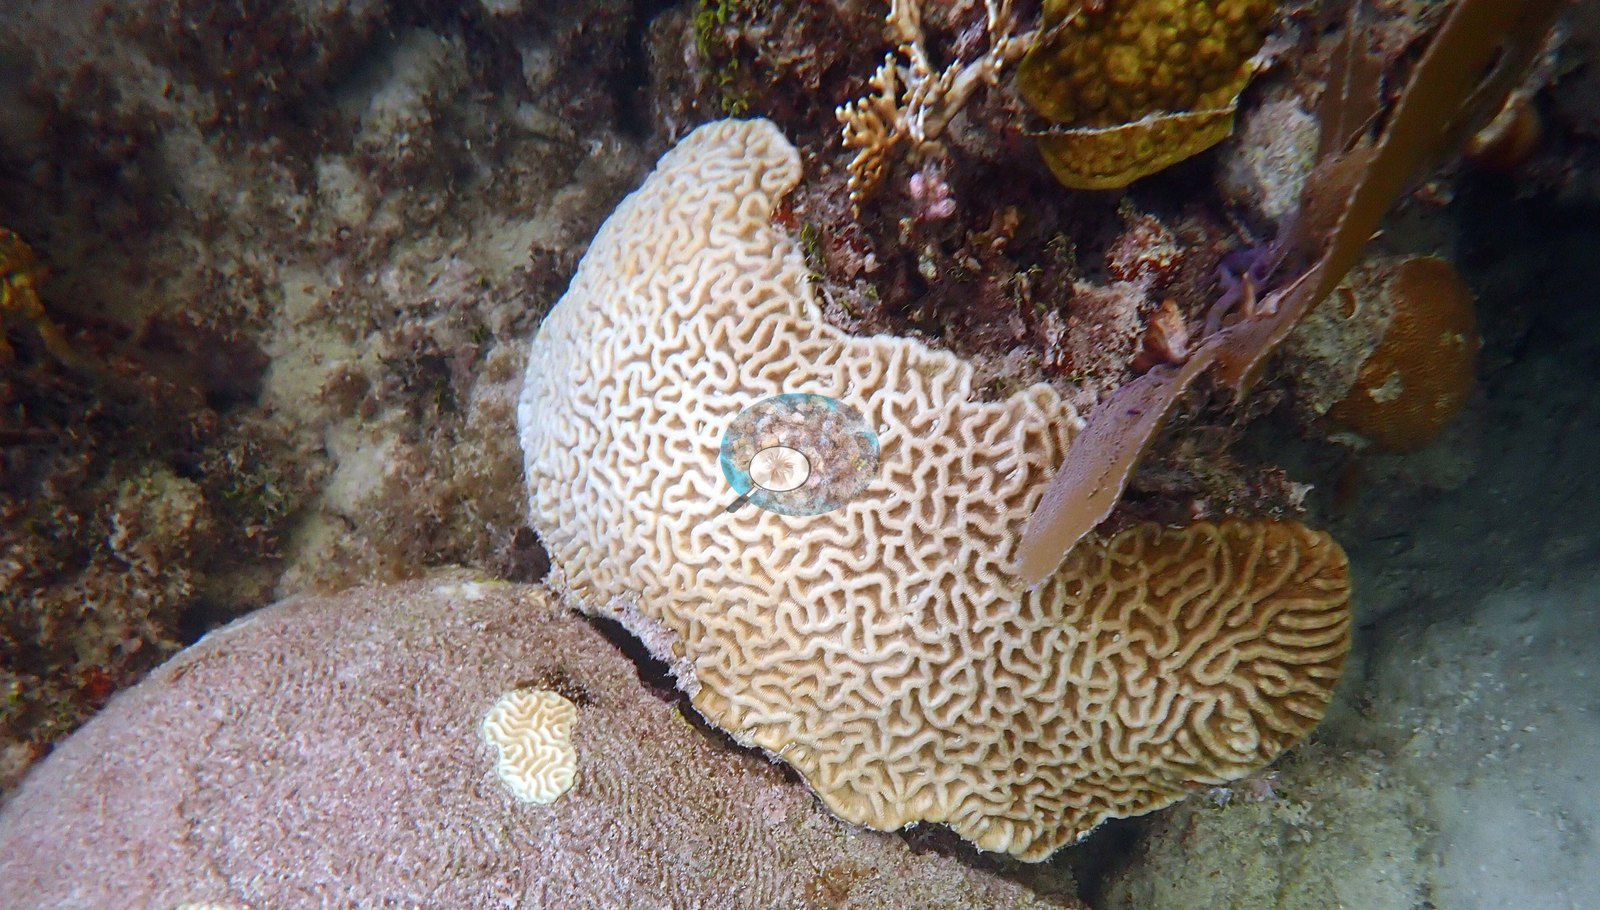
Anderson's log for the 31 May 2019 night dive adds "disease on all O. annularis colonies (but not Orbicella faveolata)". The only worm in Anderson's bleached-coral frame (Image 15) is a Christmas tree worm in the neighboring brain coral. No corallivores were evident.
Comparisons with other data
NOAA NCRMP Florida surveyed a nearby station (FLK PSU 8018-1) in 2024, 0.14 km from the pin. Within 5 km, twenty independent stations (NOAA NCRMP, NOAA NCRMP Florida, and Reef Check) recorded station-year means of 0.0–44% hard coral cover between 1997 and 2024; the nearest, NOAA NCRMP Florida at FLK PSU 8018-1, 0.14 km away, read 29% in 2024.
Dive record
Anderson logged 16 dives here in 2019, all very shallow (5.2 m maximum): two on 31 May, one of them a night dive (the dive-log memo for the first reads "coral ID training and rugosity practice. actual dive was over an hour, but computer had problems logging due to shallow nature of the dive"); one on 10 July on transect 3, sampling 10 Orbicella faveolata colonies; six on 11 July for rugosity assessments and standard benthic surveys of transects 1-6, part of the lab's routine monitoring; five on 21 and 22 August on transect 3, resampling the 10 tagged O. faveolata colonies, checking the anchor, a dusk dive, and two NOAA night dives to collect coral spawn (the second succeeded); one on 9 October; and one on 4 December. Dive-average temperatures ran from 31.9°C in August to 24.3°C in December. Anderson also snorkeled the site on 6 May 2021, with no depth or temperature recorded.
CV model comparison
More info
Claude CV on Anderson's photos is a comparison only and is never averaged.| Method | Hard coral cover (%) | Photos (n) ± SE |
|---|---|---|
| Transect (published) | 31.7 | |
| CoralSCOP edited | 47.1 | n = 136 · SE 1.6 |
| Claude (edited photos) | 39.7 | n = 136 · SE 1.8 |
The two computer-vision methods differ by 7.4 pp (39.7–47.1%) and read 8.0–15.4 pp above the in-water transect (31.7%); the headline is the in-water transect because a diver transect is independent of the photographs.
See a more detailed, stand-alone version of this table.
Dive history
| Date | Time in | Max depth (m) | Bottom time (min) |
|---|---|---|---|
| 2019-05-31 | 09:35 | 2.4 | 23 |
| 2019-05-31 | 21:35 | 2.7 | 75 |
| 2019-07-10 | 17:21 | 4.6 | 57 |
| 2019-07-11 | 09:55 | 3.4 | 33 |
| 2019-07-11 | 11:19 | 4.0 | 24 |
| 2019-07-11 | 12:13 | 3.7 | 26 |
| 2019-07-11 | 13:00 | 3.7 | 24 |
| 2019-07-11 | 13:44 | 4.3 | 23 |
| 2019-07-11 | 14:33 | 4.0 | 23 |
| 2019-08-21 | 14:19 | 4.3 | 62 |
| 2019-08-21 | 19:20 | 4.0 | 17 |
| 2019-08-21 | 22:57 | 5.2 | 55 |
| 2019-08-22 | 19:19 | 5.2 | 42 |
| 2019-08-22 | 22:52 | 4.3 | 99 |
| 2019-10-09 | 14:25 | 4.0 | 60 |
| 2019-12-04 | 13:53 | 4.3 | 27 |
| 2021-05-06 | — | — | — |
Independent surveys nearby
| Agency / program | Year(s) | Stations / distance | Link |
|---|---|---|---|
| NOAA NCRMP | 2014–2016 | 6 stations, 0.52–4.62 km | Records ↓ |
| NOAA NCRMP Florida | 2024 | 12 stations, 0.14–0.79 km | Records ↓ |
| Reef Check | 1997–2023 | 2 stations, 1.06–1.83 km | Records ↓ |
Within 5 km, 20 independent survey stations recorded hard coral cover in 21 records between 1997 and 2024. The one station surveyed in more than one year declined by 10 points between its first and latest surveys. The longest record, FLK-405 (NOAA NCRMP, 0.52 km away), went from 44% in 2014 to 34% in 2016. Since 2021, station-year means average 19% (range 6.3–34%; n = 13 station-years from 13 records). This site's headline survey value (32%) sits within the recent range of station-year means up to 2 km away (6.3–34%); the methods differ, so the comparison is context, not a like-for-like test.
Collected by other programs using different methods (Reef Check uses point-intercept transects; NOAA rows come from NOAA monitoring programs (NCRMP, PIFSC, NCCOS), and each row's method is in its hover text), so these are context for the figures above, not a like-for-like comparison. Where a station was surveyed more than once, the cell shows either the range of its values or, as a single value, the mean of surveys made in one year. Station names are not dive-site names.
Show all 21 independent survey records
| Agency | Site / location | Date | Hard coral cover (%) | Distance | Link |
|---|---|---|---|---|---|
| Reef Check | Cheeca Rocks | 1997 | 40% | 1.06 km | — |
| NOAA NCRMP | FLK-216 | 2014 | 44% | 0.52 km | — |
| NOAA NCRMP | FLK-405 | 2014–2016 | 34–44% (range of yearly means; 2 records) | 0.52 km | — |
| NOAA NCRMP | FLK-214 | 2014 | 12% | 0.52 km | — |
| NOAA NCRMP | FLK-215 | 2014 | 23% | 0.52 km | — |
| NOAA NCRMP | FLK-404 | 2016 | 0.0% | 4.45 km | — |
| NOAA NCRMP | FLK-439 | 2016 | 1.0% | 4.62 km | — |
| Reef Check | Rocky Top | 2023 | 6.3% | 1.83 km | — |
| NOAA NCRMP Florida | FLK PSU 8018-1 | 2024 | 29% | 0.14 km | NCEI 0306238 |
| NOAA NCRMP Florida | FLK PSU 8110-1 | 2024 | 17% | 0.23 km | NCEI 0306238 |
| NOAA NCRMP Florida | FLK PSU 8017-1 | 2024 | 15% | 0.26 km | NCEI 0306238 |
| NOAA NCRMP Florida | FLK PSU 8021-1 | 2024 | 34% | 0.27 km | NCEI 0306238 |
| NOAA NCRMP Florida | FLK PSU 8012-1 | 2024 | 21% | 0.29 km | NCEI 0306238 |
| NOAA NCRMP Florida | FLK PSU 8114-1 | 2024 | 21% | 0.40 km | NCEI 0306238 |
| NOAA NCRMP Florida | FLK PSU 8013-1 | 2024 | 22% | 0.44 km | NCEI 0306238 |
| NOAA NCRMP Florida | FLK PSU 8019-1 | 2024 | 20% | 0.49 km | NCEI 0306238 |
| NOAA NCRMP Florida | FLK PSU 8020-1 | 2024 | 12% | 0.58 km | NCEI 0306238 |
| NOAA NCRMP Florida | FLK PSU 1298-1 | 2024 | 15% | 0.75 km | NCEI 0306238 |
| NOAA NCRMP Florida | FLK PSU 8116-1 | 2024 | 18% | 0.77 km | NCEI 0306238 |
| NOAA NCRMP Florida | FLK PSU 8115-1 | 2024 | 20% | 0.79 km | NCEI 0306238 |
Data & links
All images from Coral Reef Diagnostics. Data are from Coral Reef Diagnostics and the organizations named in the data sources above.
 © Coral Reef Diagnostics.