
Bonaire - Wayaka II

Part of the regional summary: Bonaire
More about this place: Bonaire on Wikipedia
More info
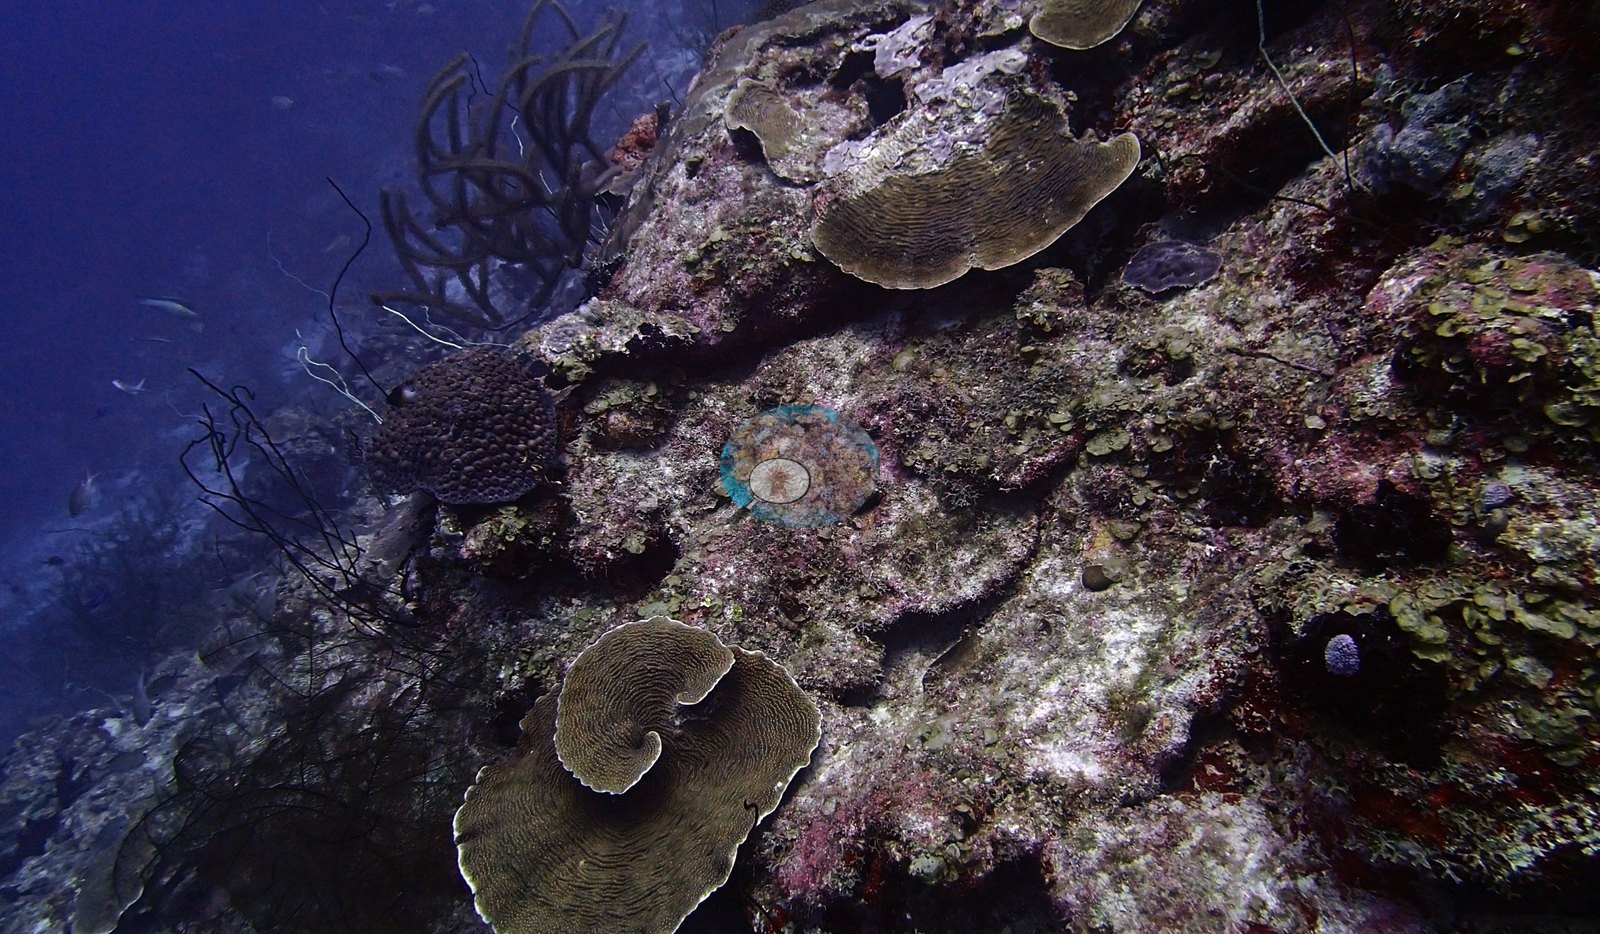
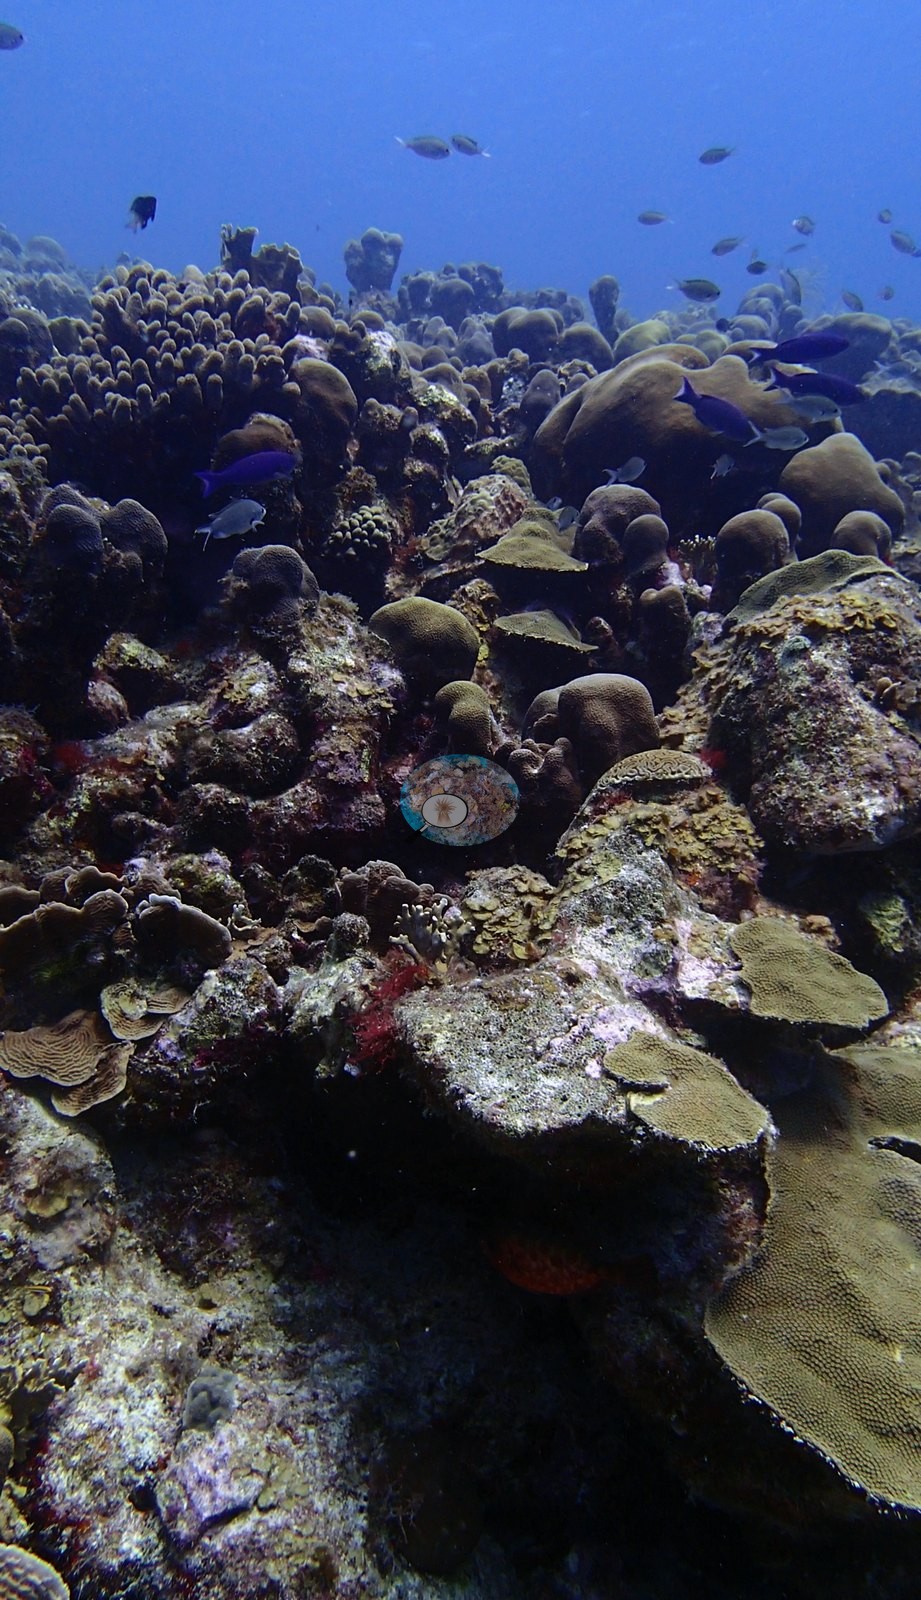
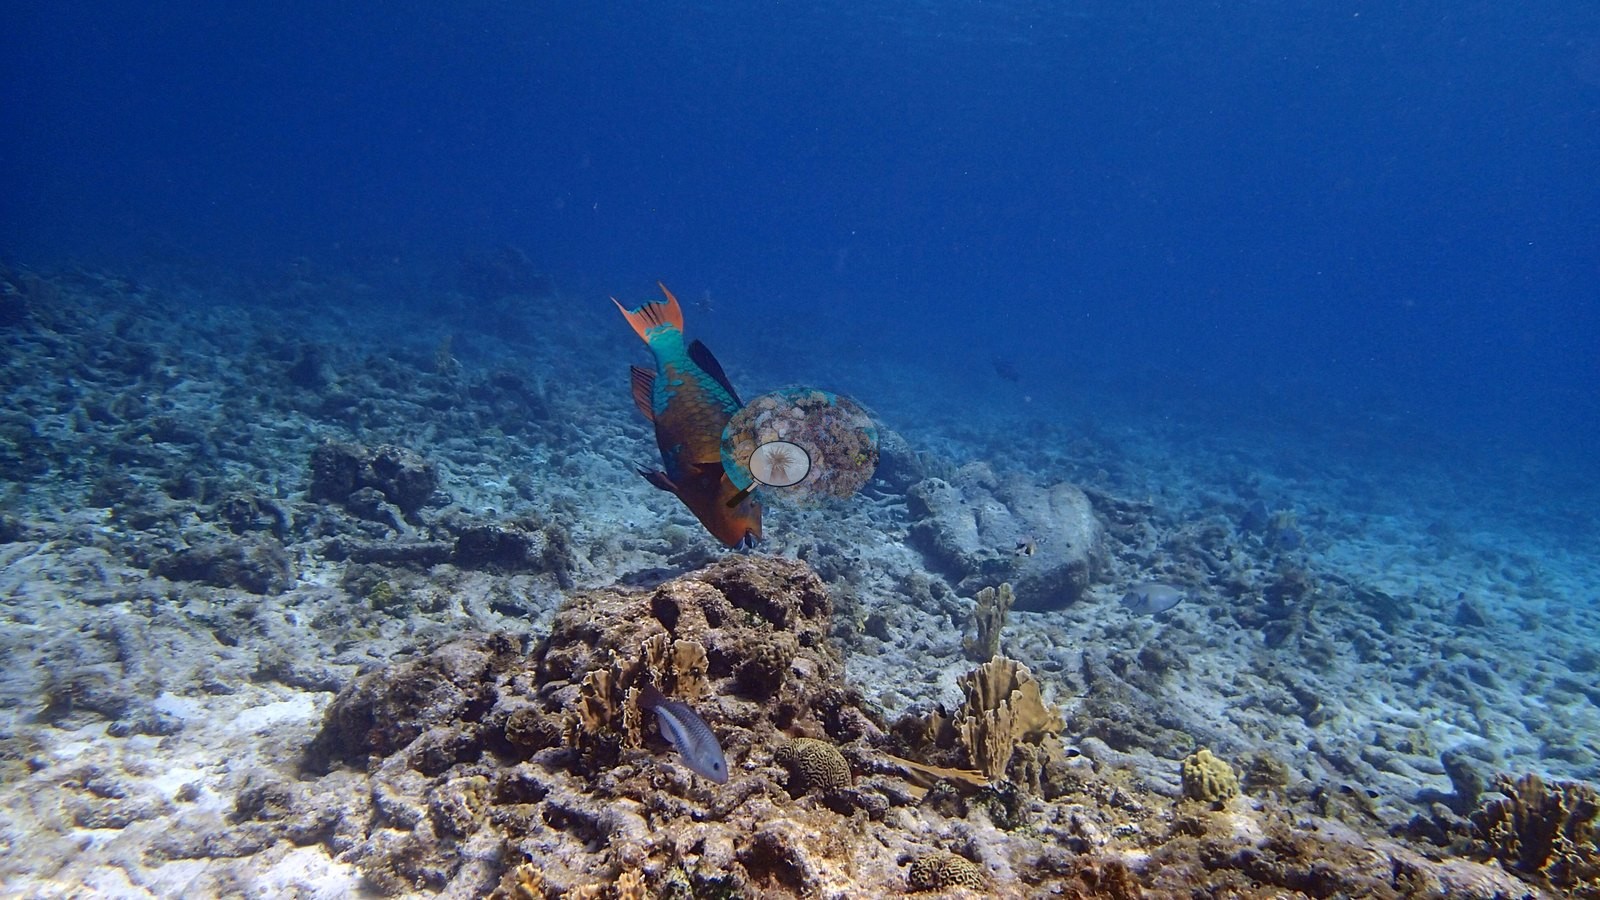
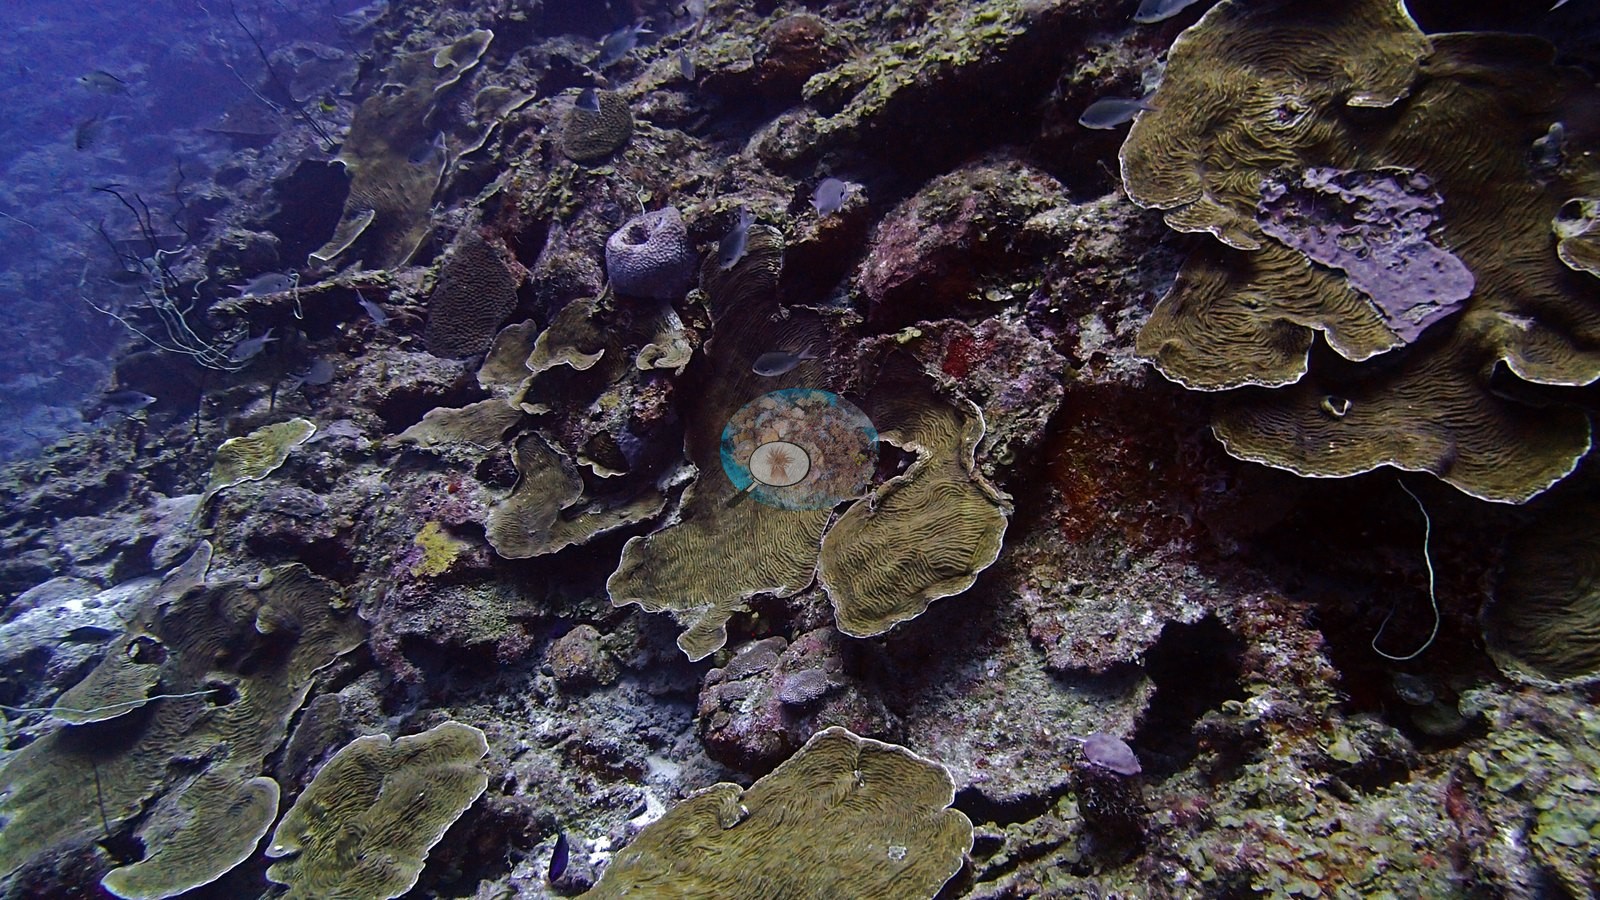
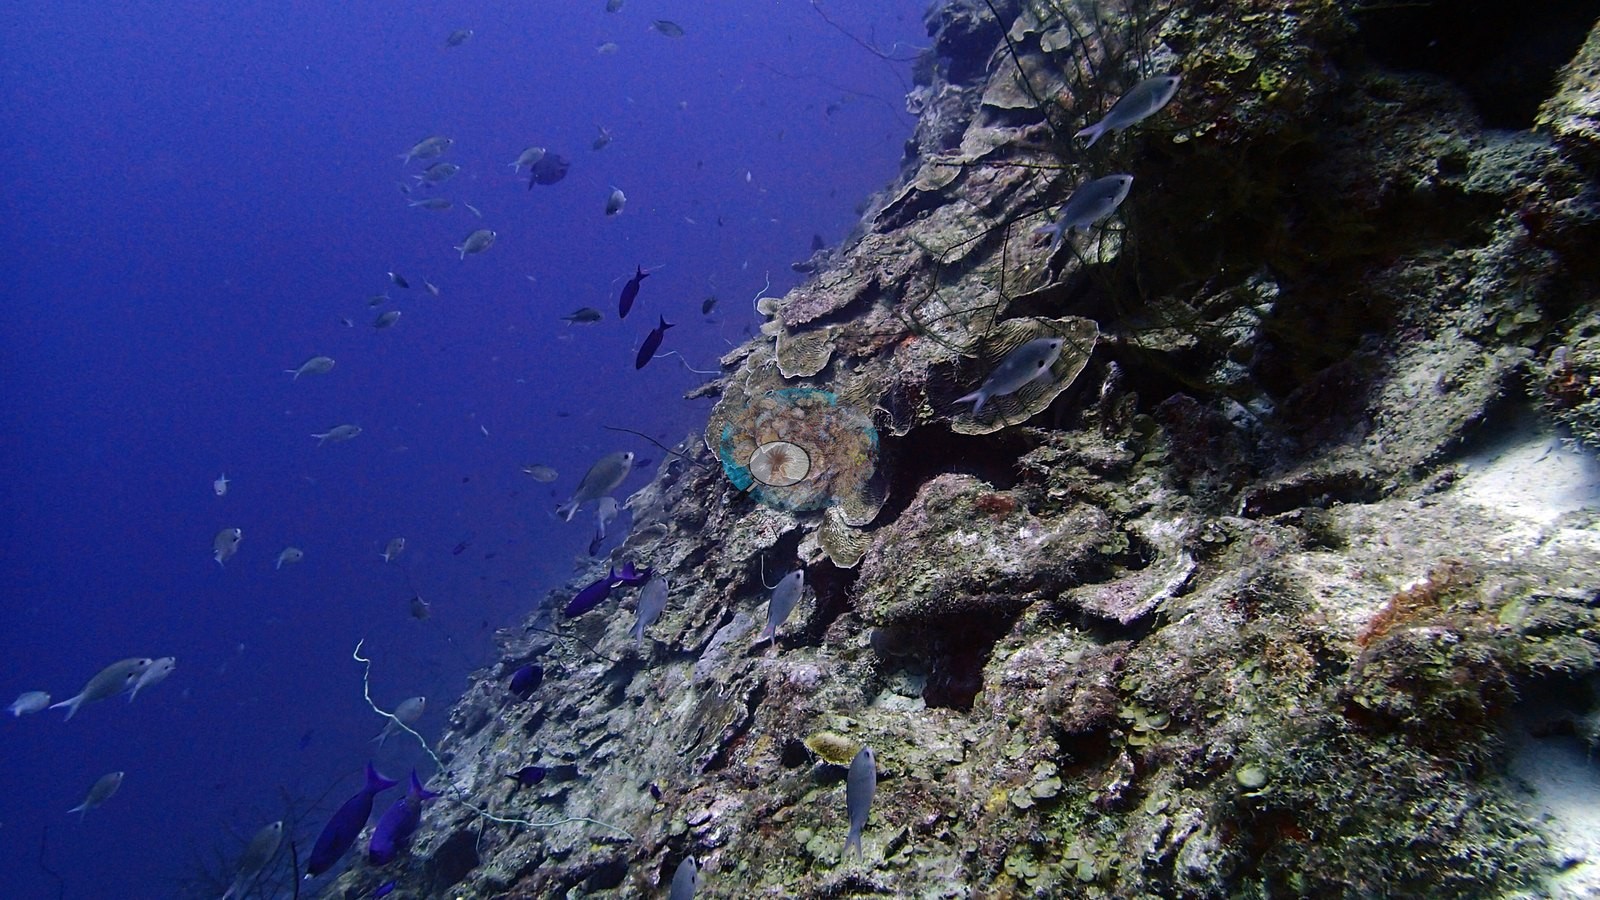
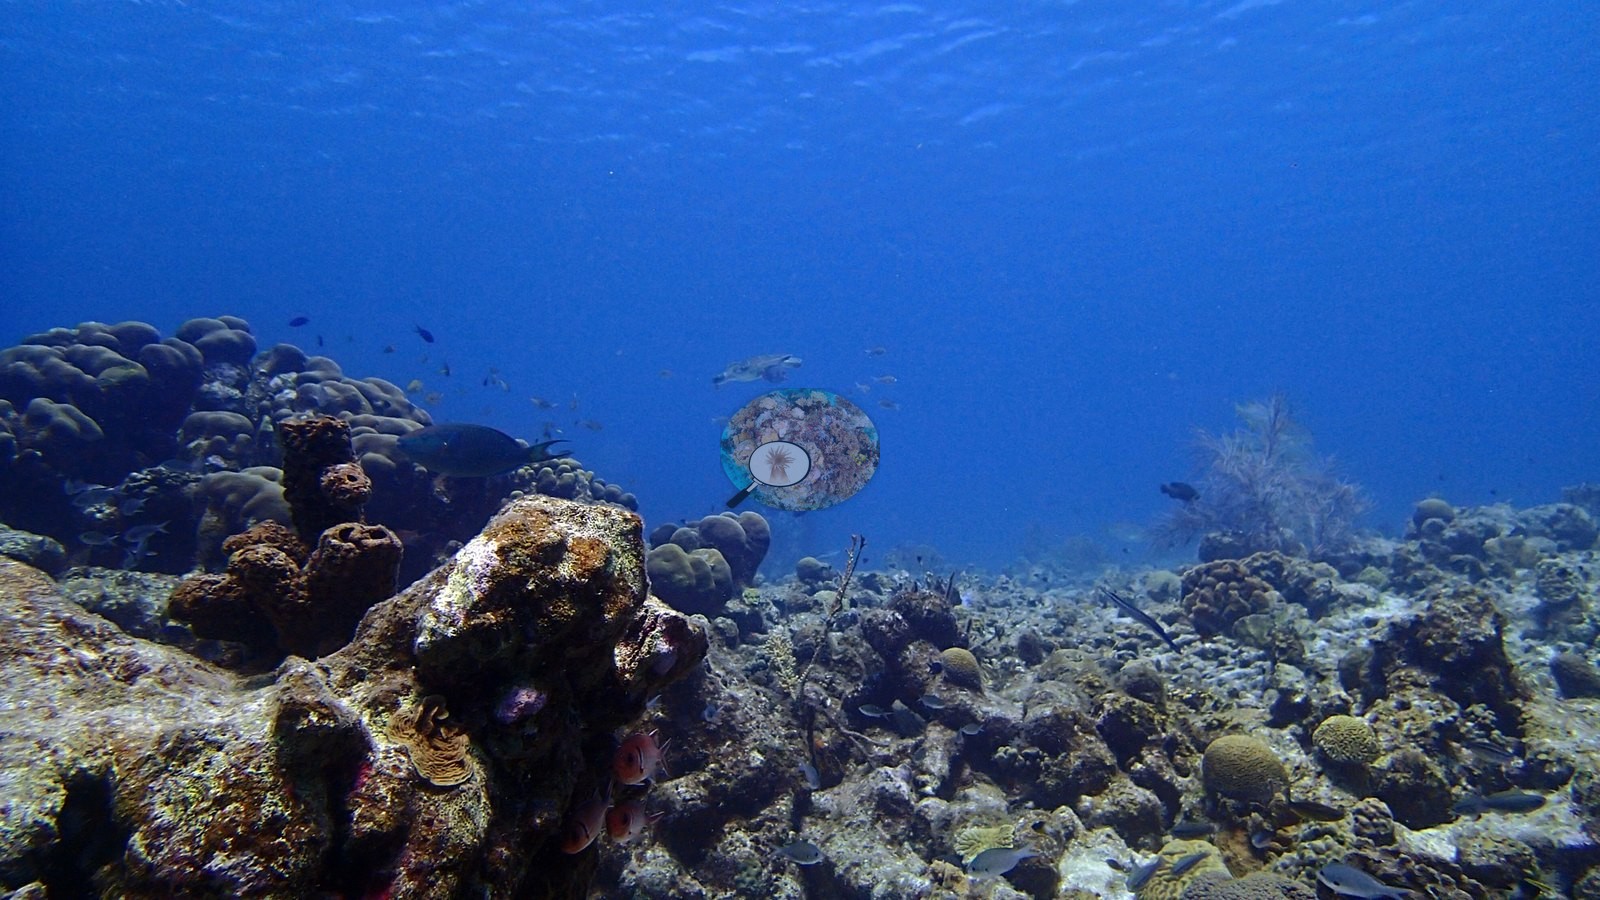
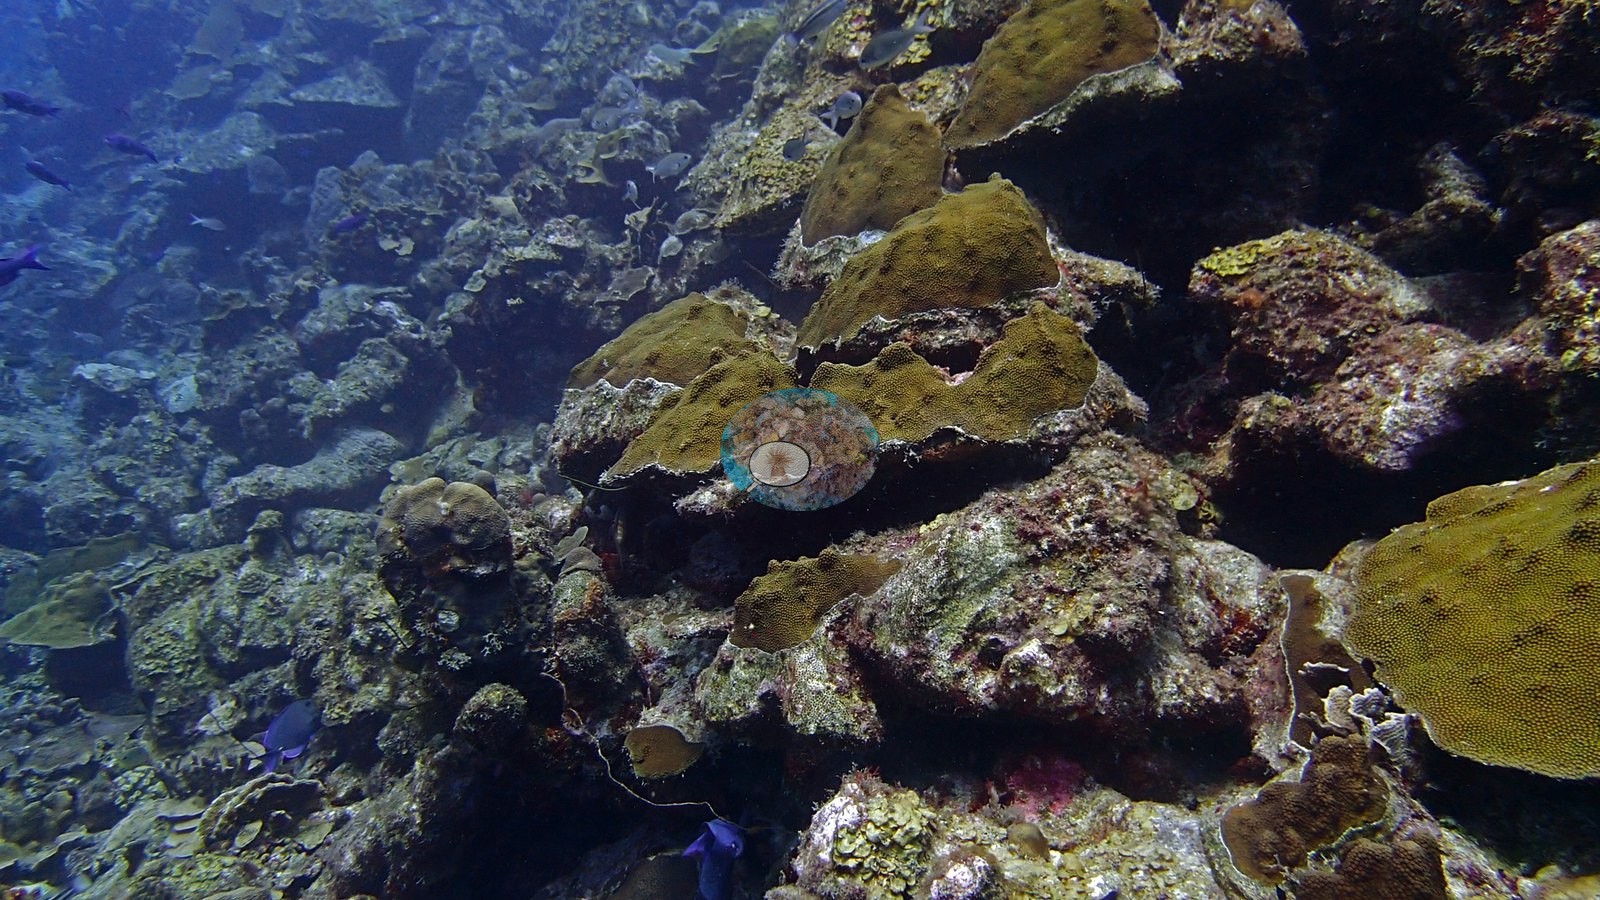
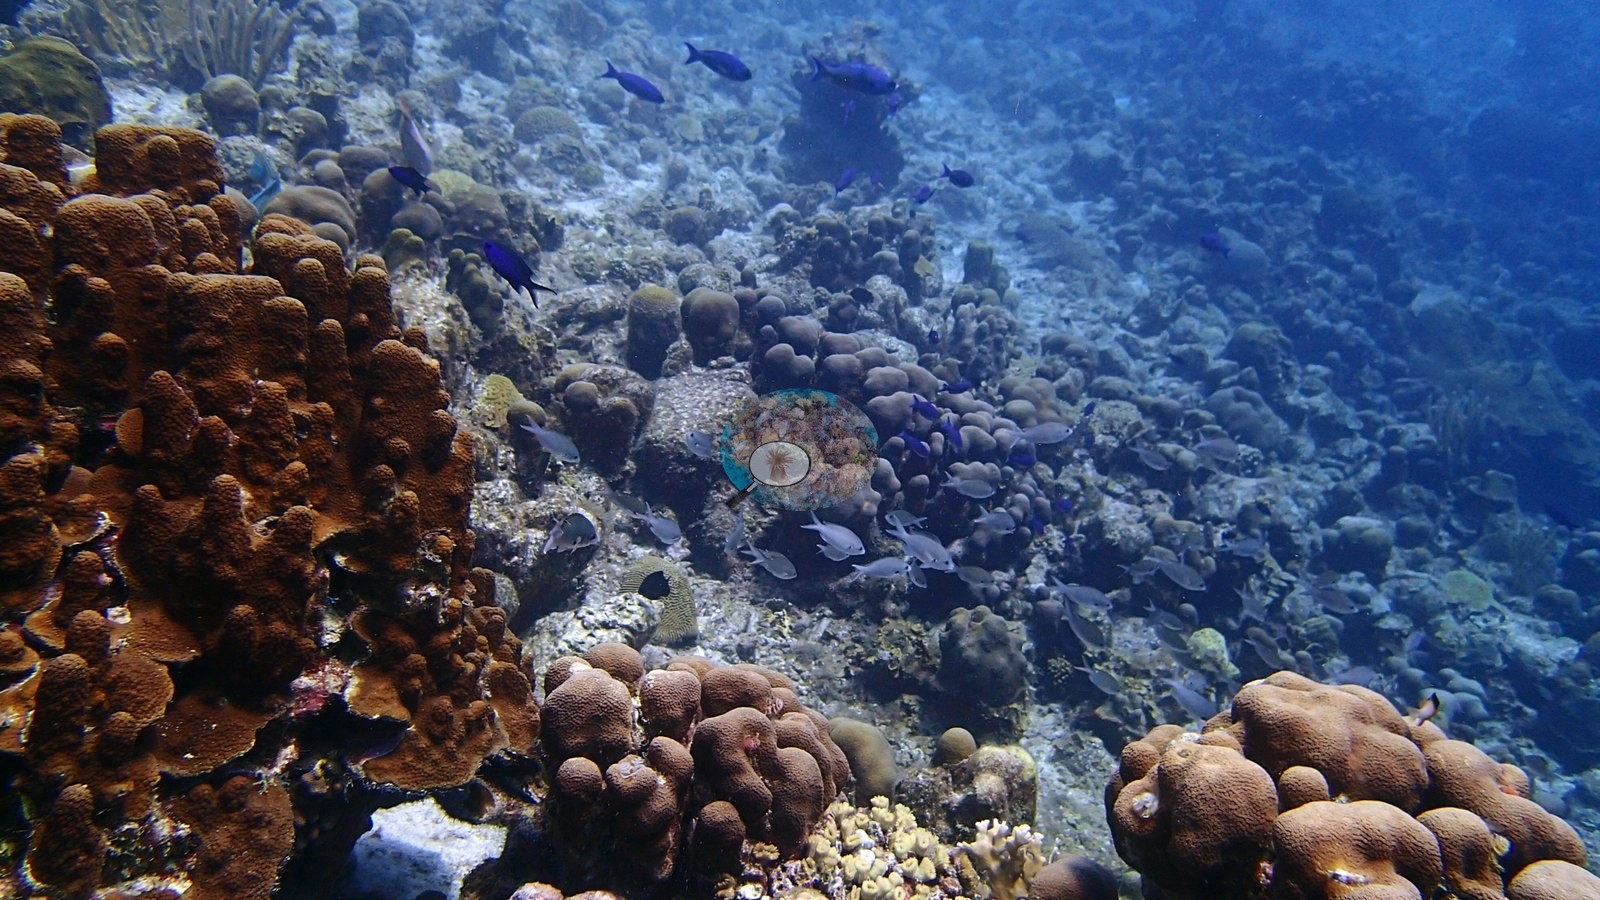
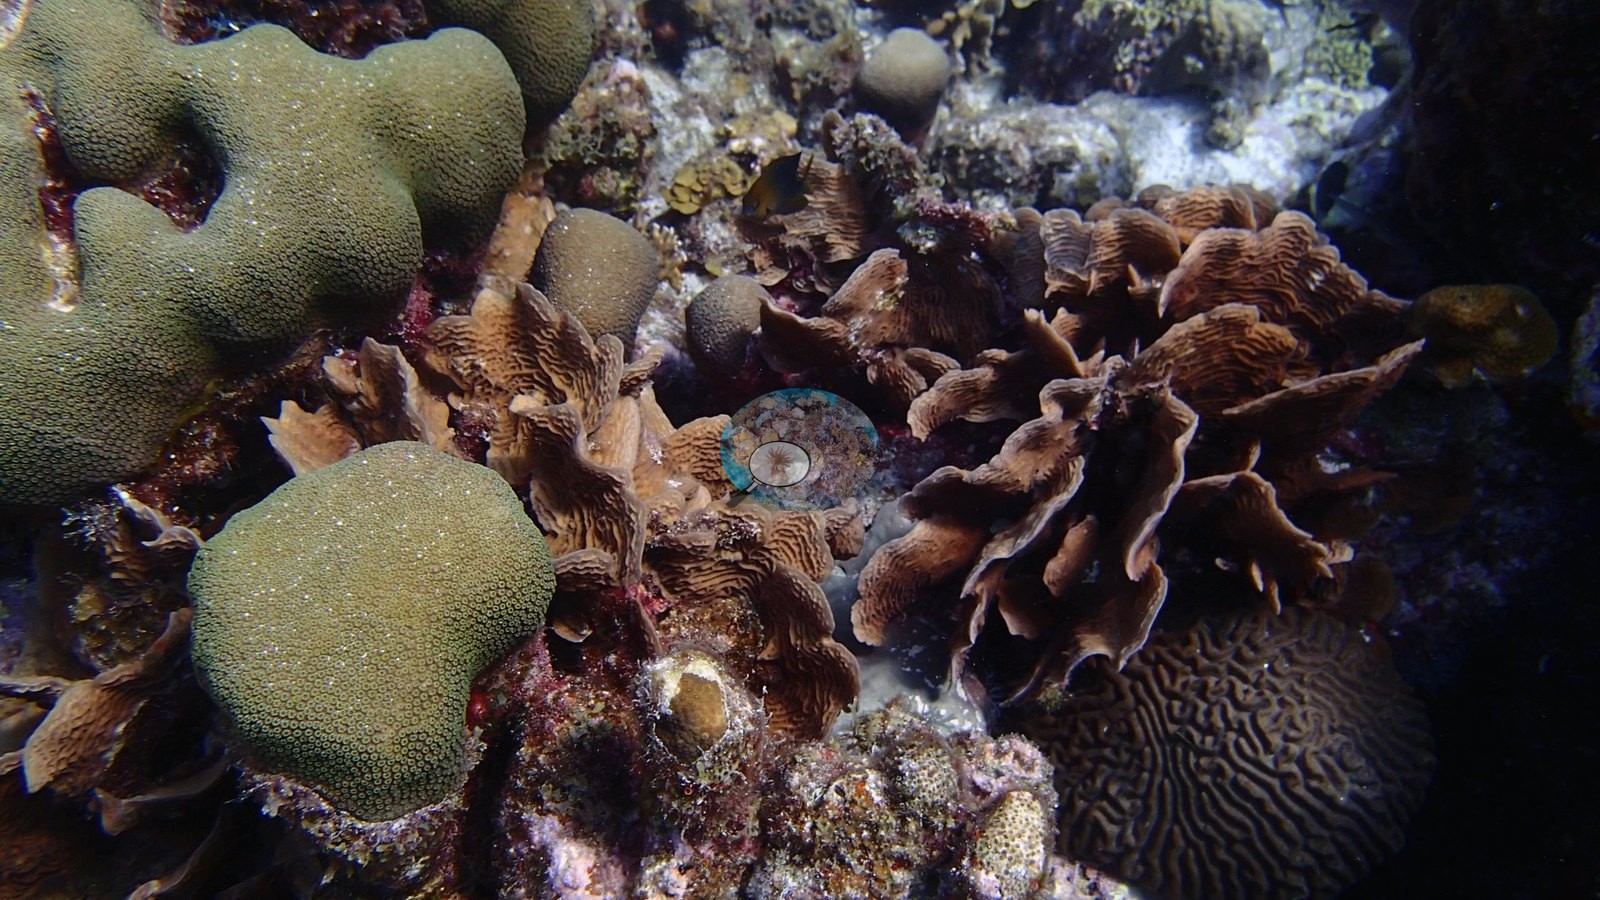
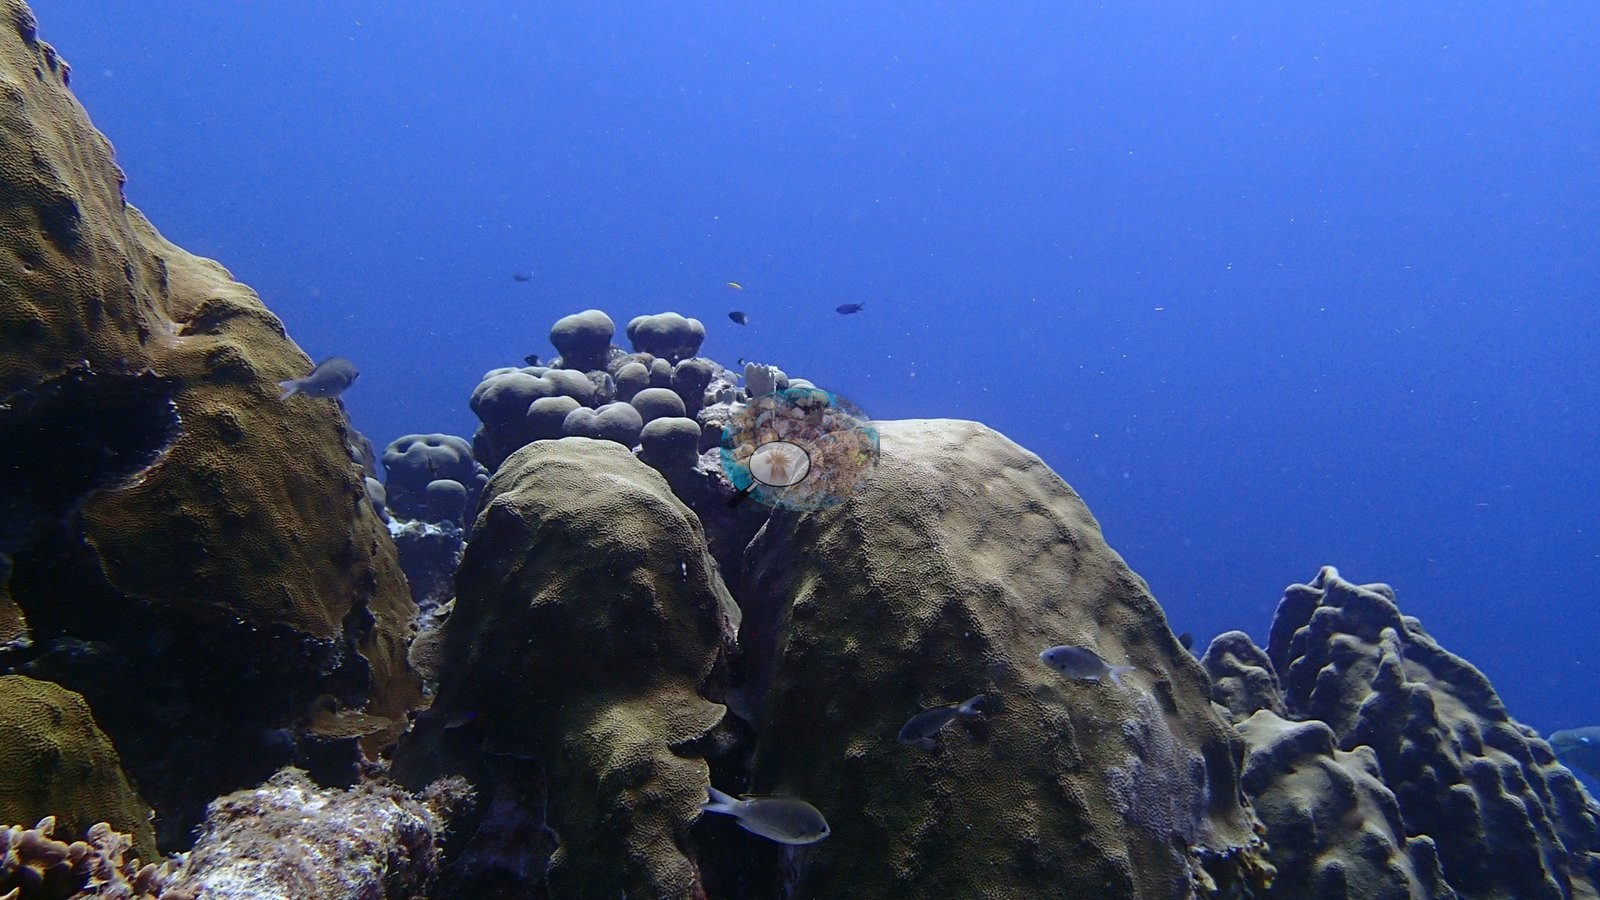
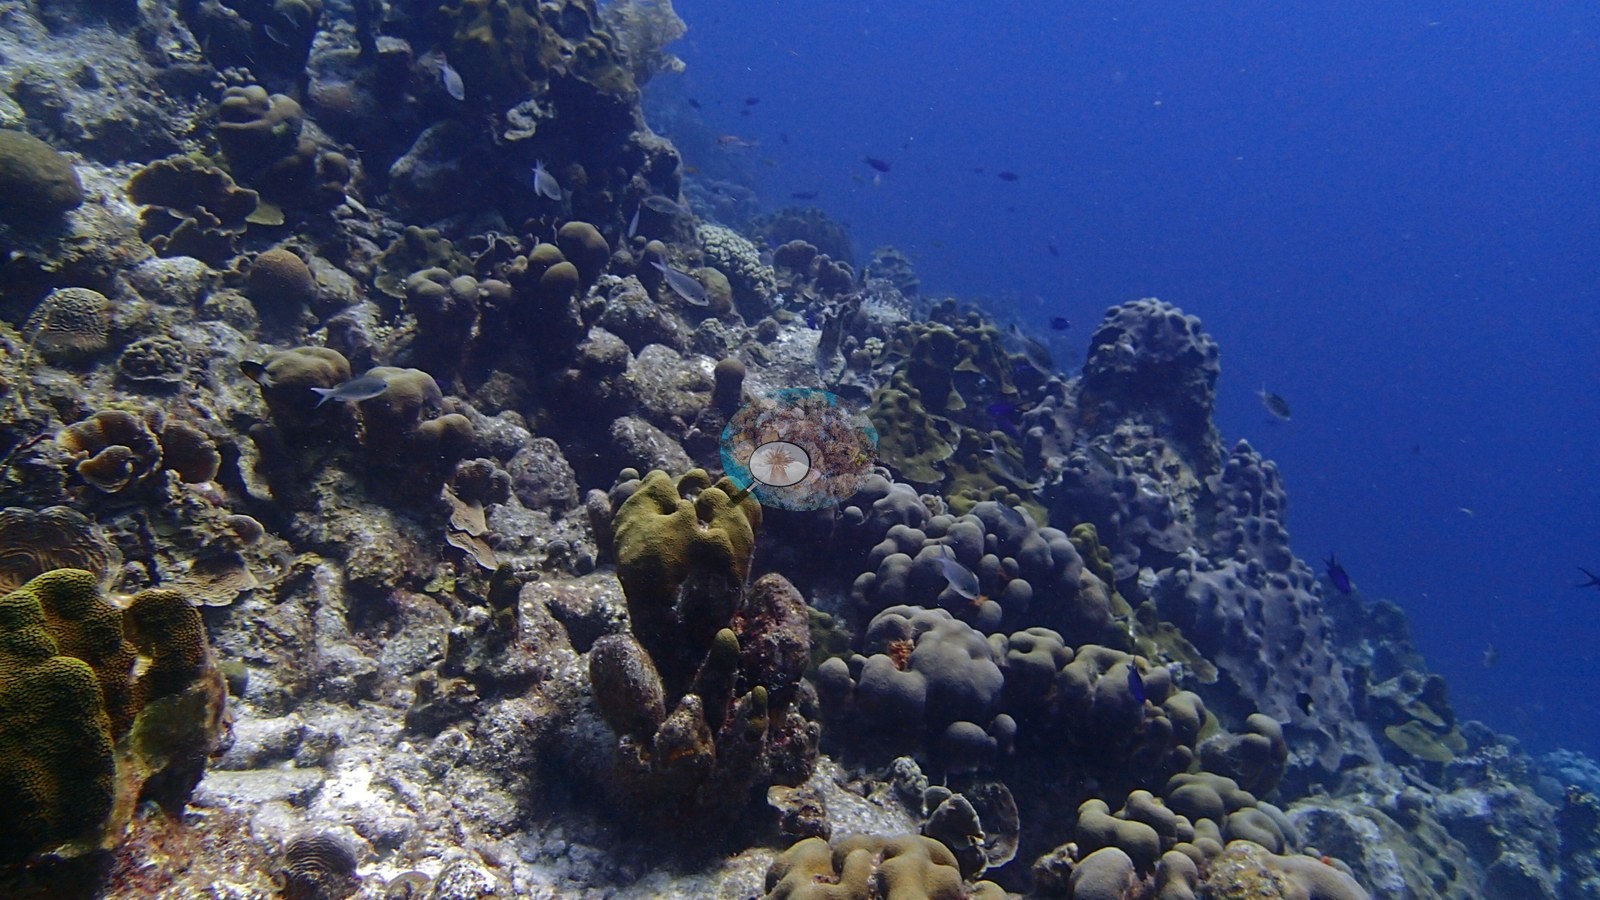
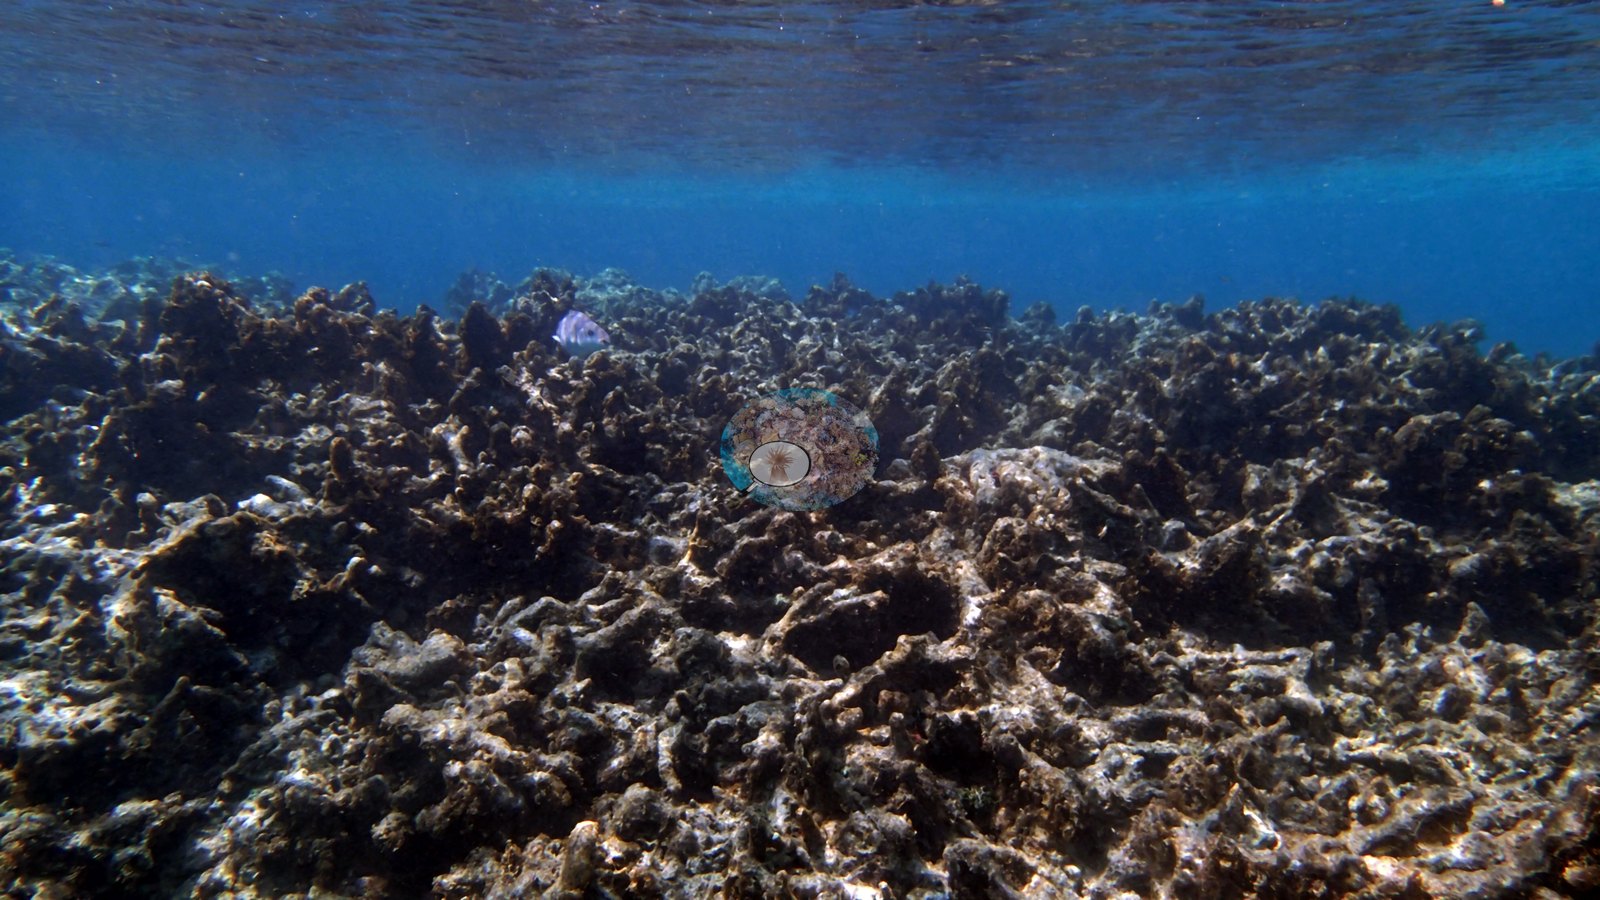
Aruba, Curacao, and Bonaire (NOAA CRW virtual station)A steep wall of stacked plate and lettuce corals over massive and brain coral heads, visited by a hawksbill turtle and a spiny lobster. It is a reef of two halves, though: the deeper wall and slope are coral-dense, while the shallows hold an extensive field of old, eroded dead branching coral.
Een steile wand van opgestapelde plaat- en slakoralen boven massieve koralen en hersenkoraalkoppen, bezocht door een karetschildpad en een langoest. Het is echter een rif met twee gezichten: de diepere wand en helling zijn dicht met koraal begroeid, terwijl het ondiepe deel een uitgestrekt veld van oud, geërodeerd, dood vertakt koraal bevat.
AI translation of this summary; the English is authoritative.
Three independent survey stations shown with the program’s logo — click one to see how far it is from this site.
This page shows 50 of the 58 photographs from this site, including every one the text cites.
10 of the 50 photographs on this page are shown beside the text that discusses them under "Site description" below.
Site description
General benthic features
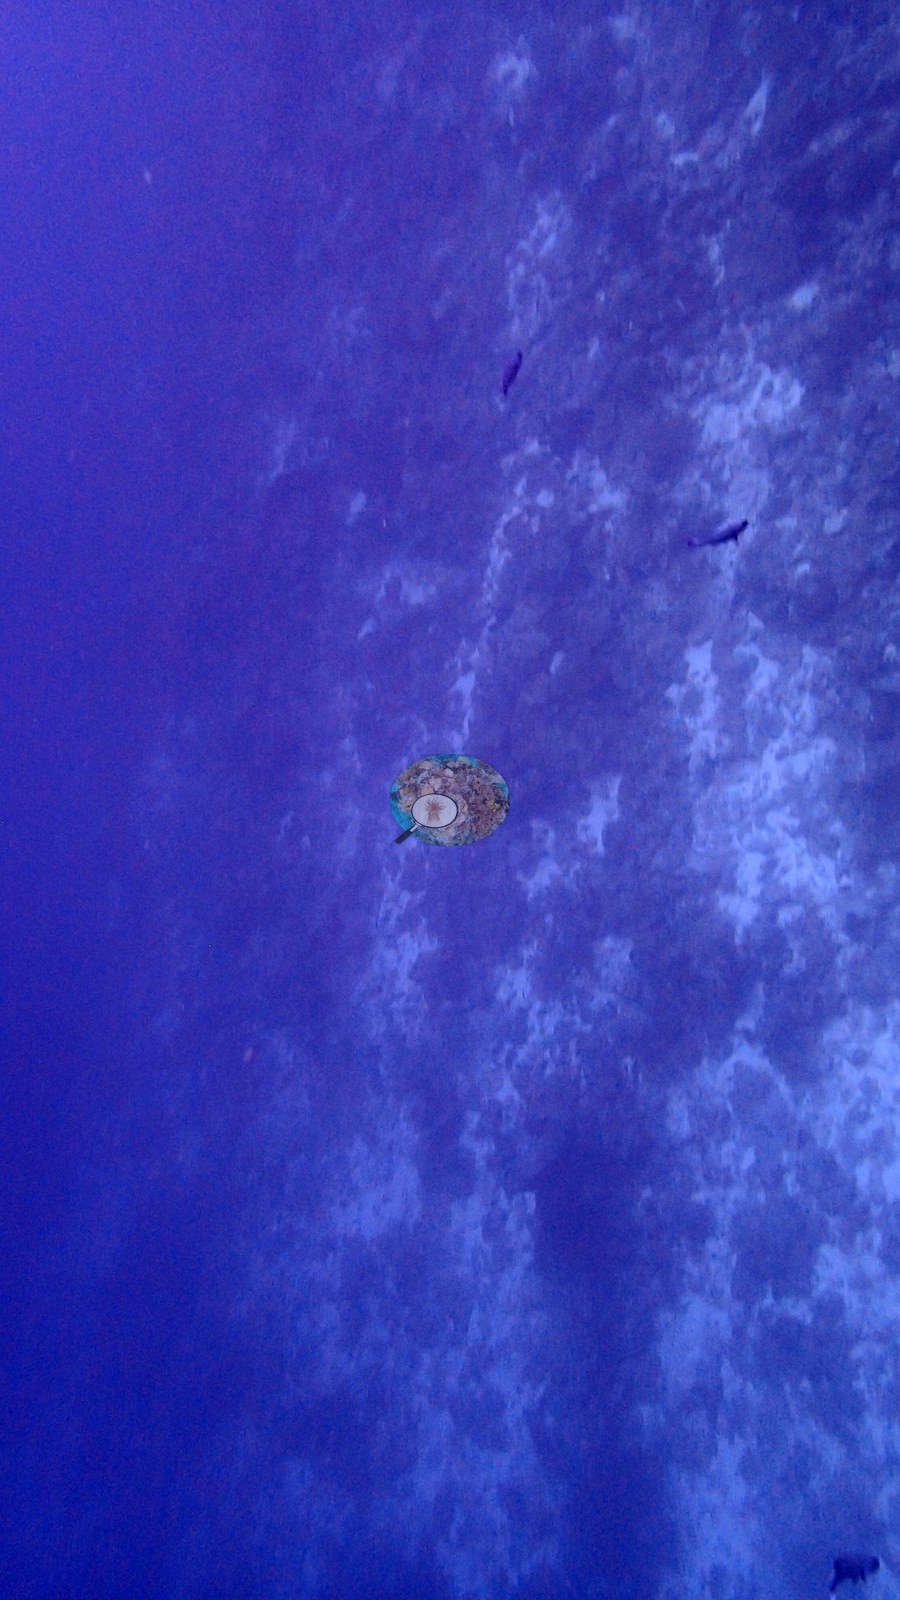
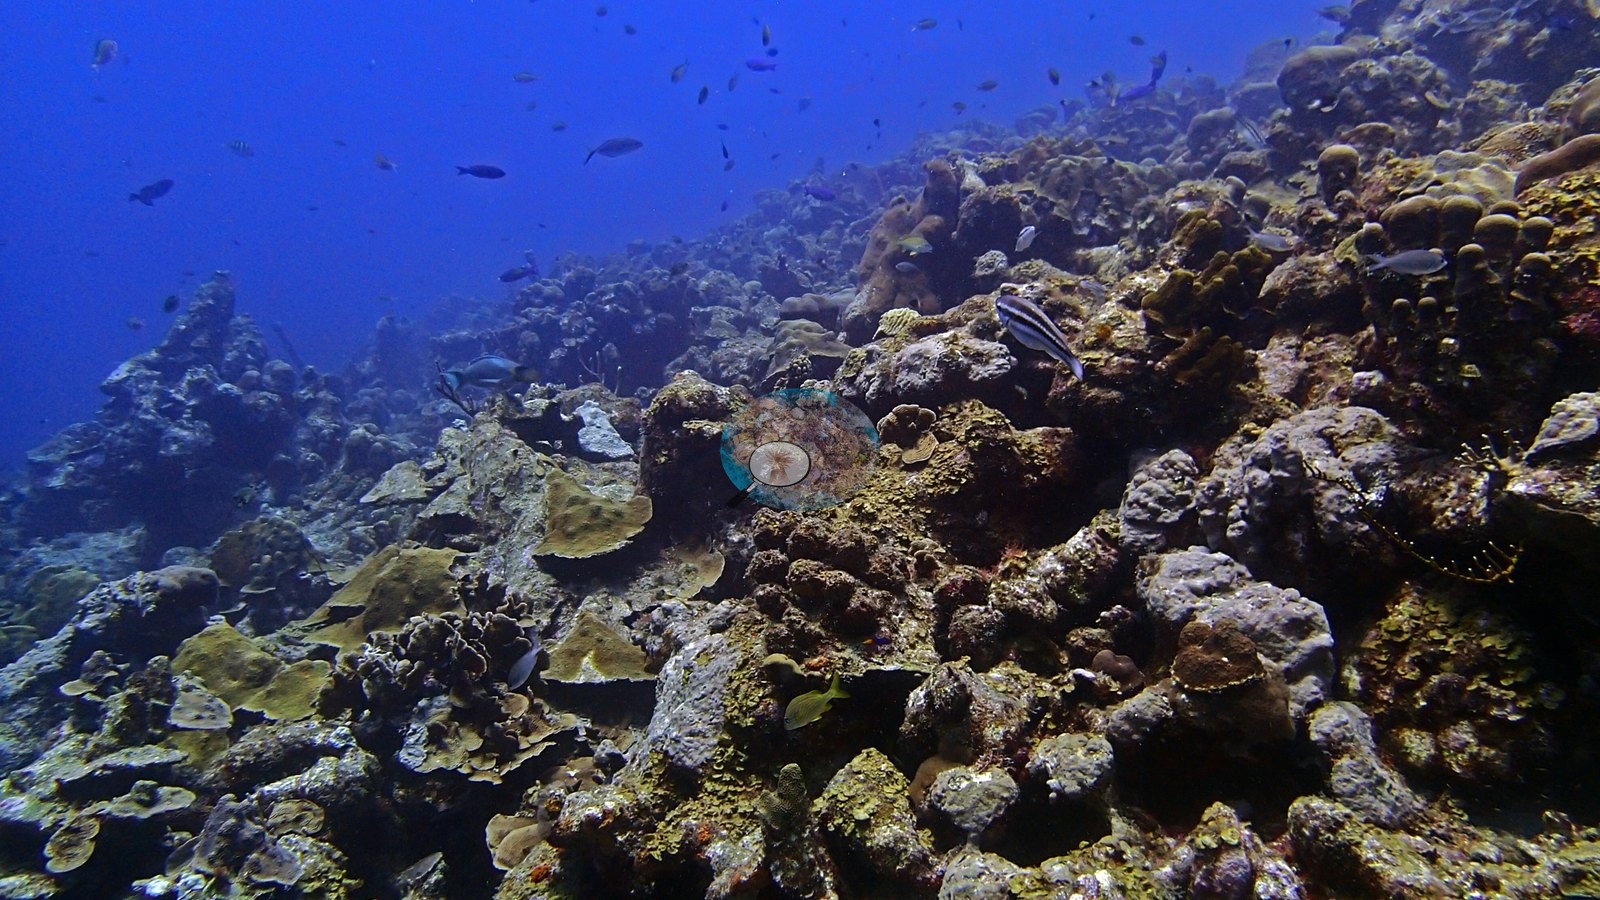
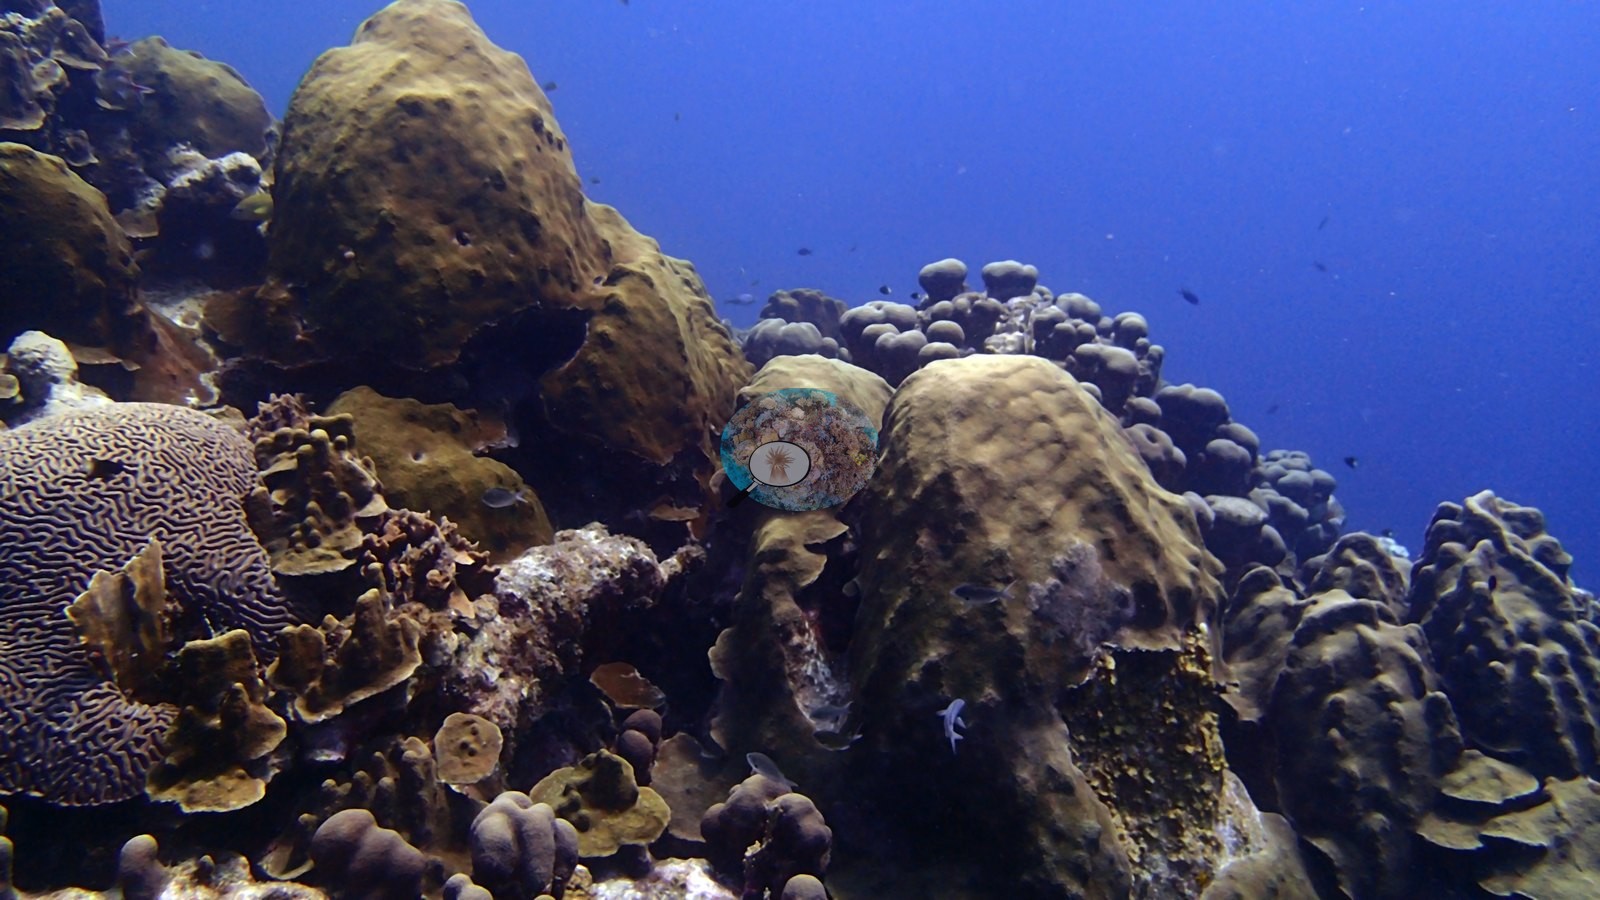
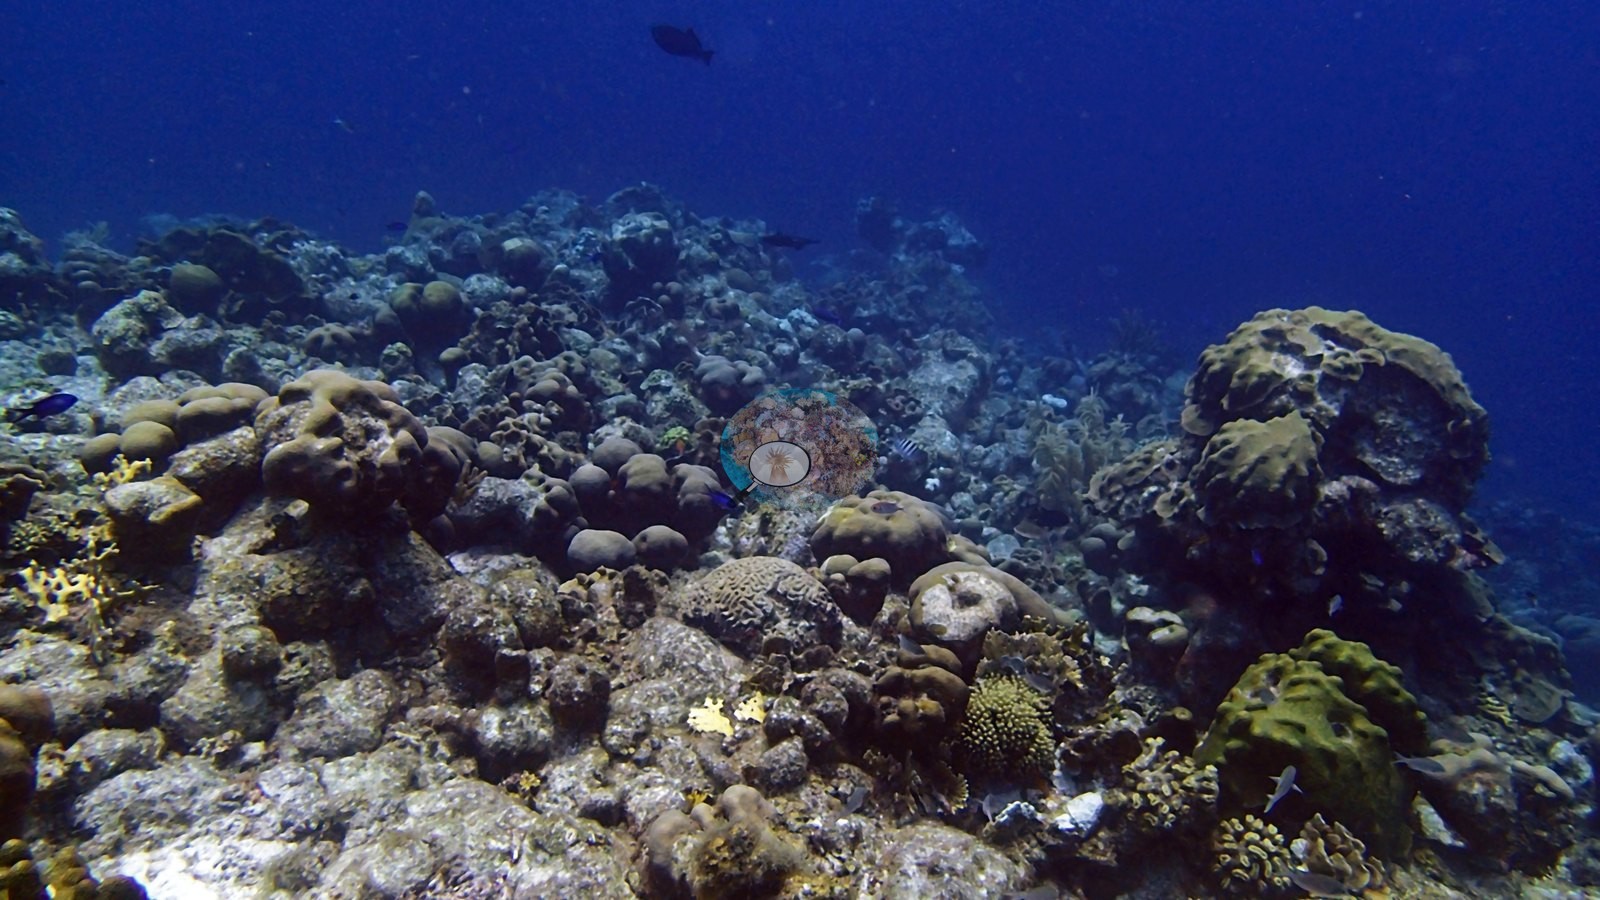
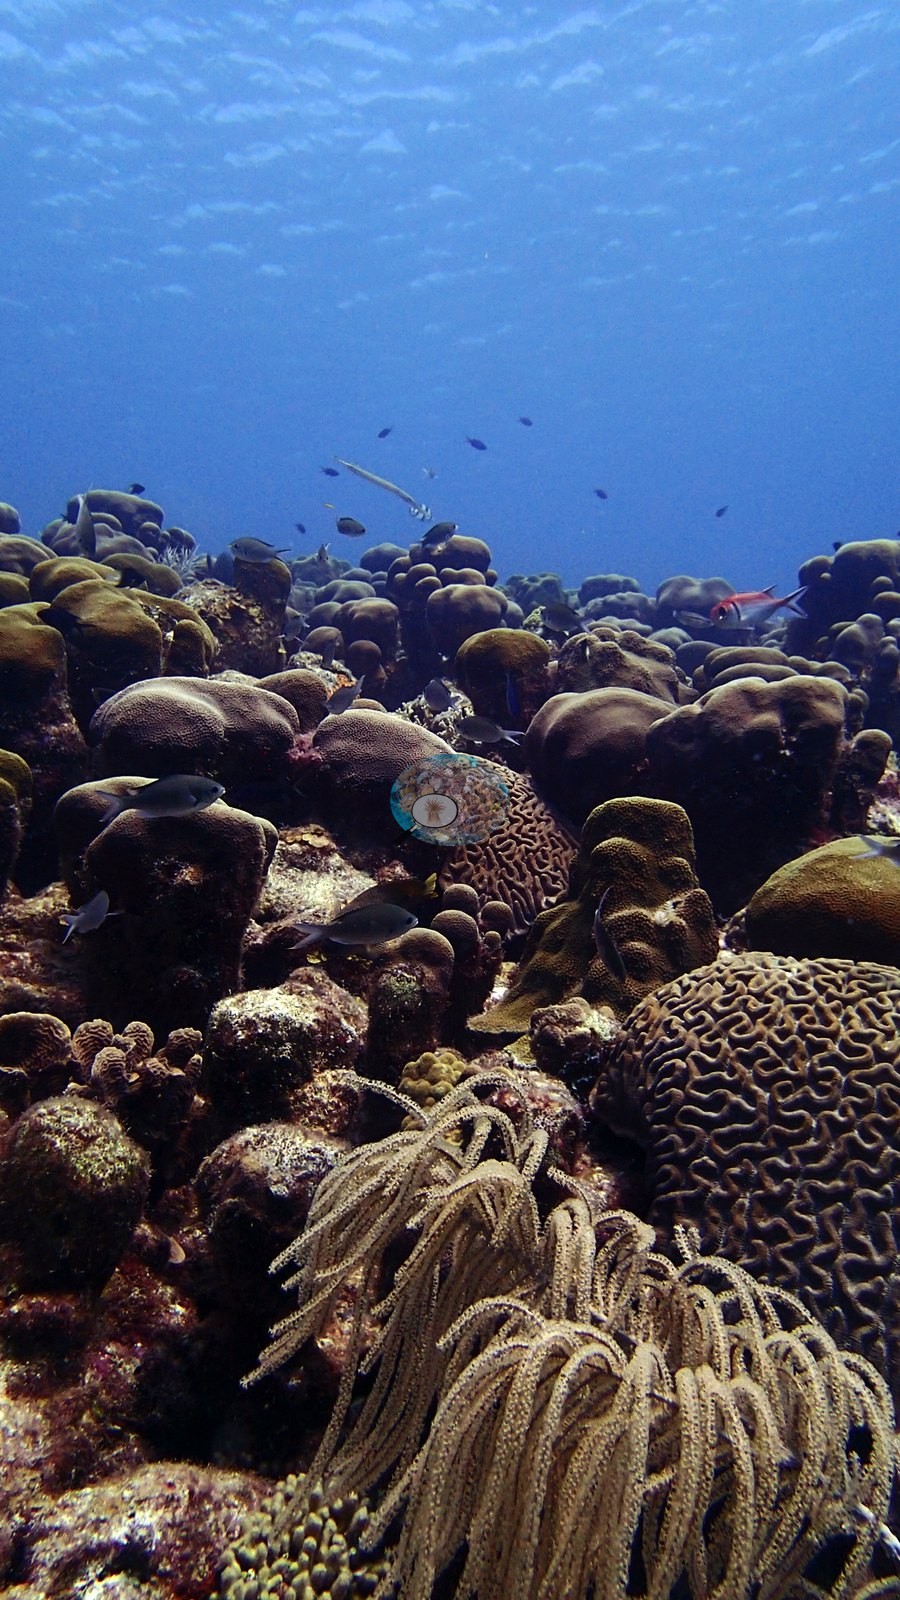
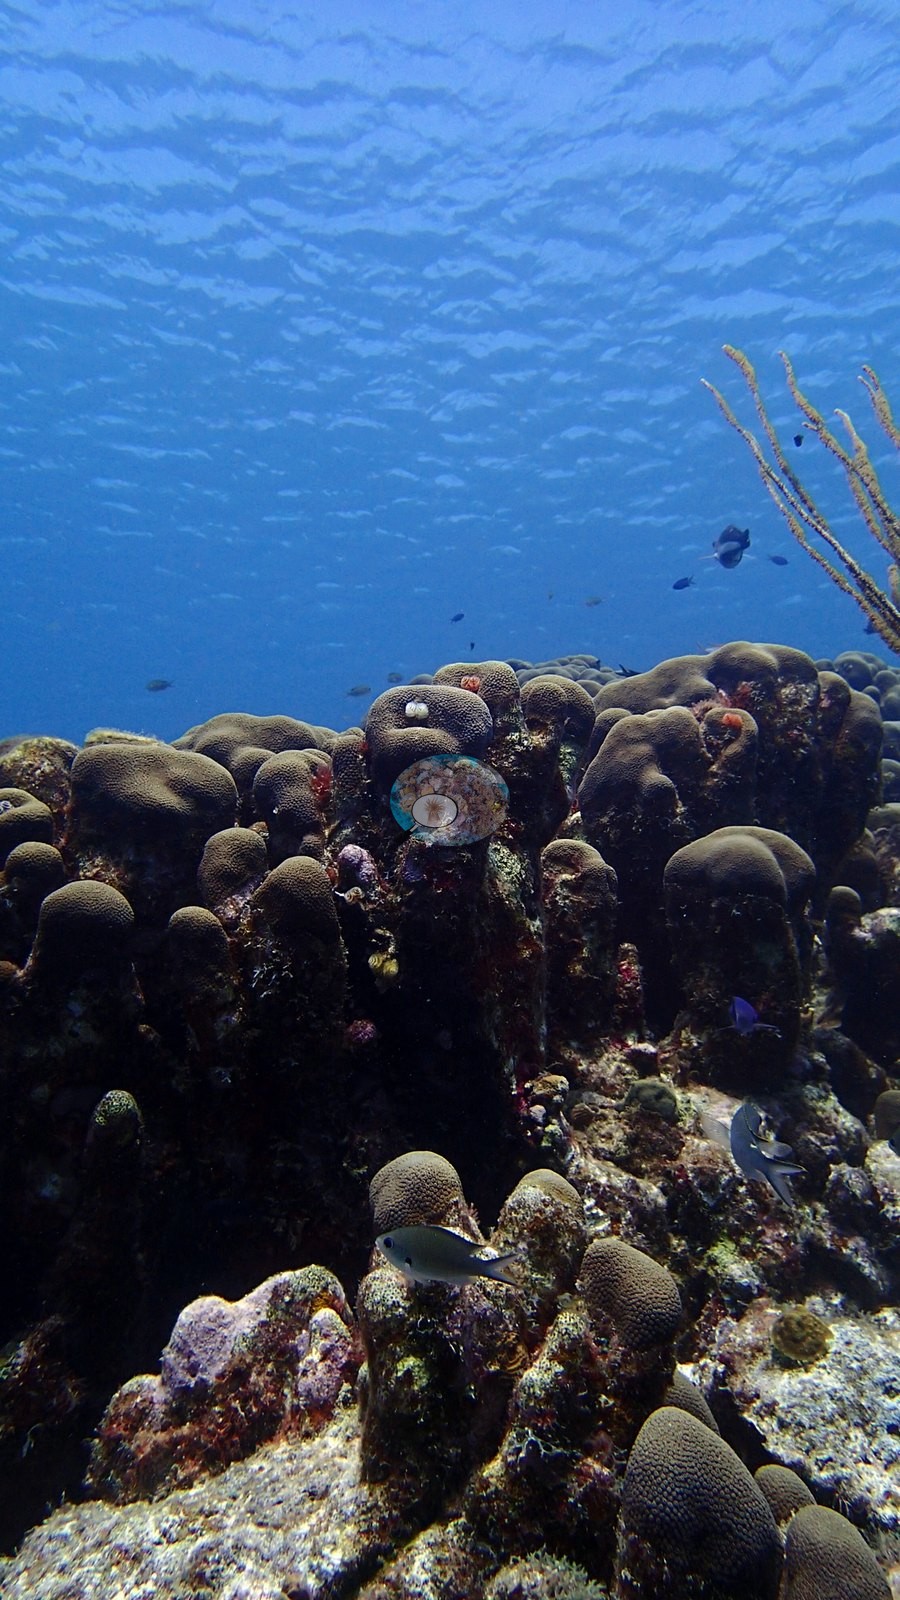
A steep coral wall with terraces of plate and lettuce corals stacked over massive and brain coral heads, dropping into deep blue water (e.g., Image 2).
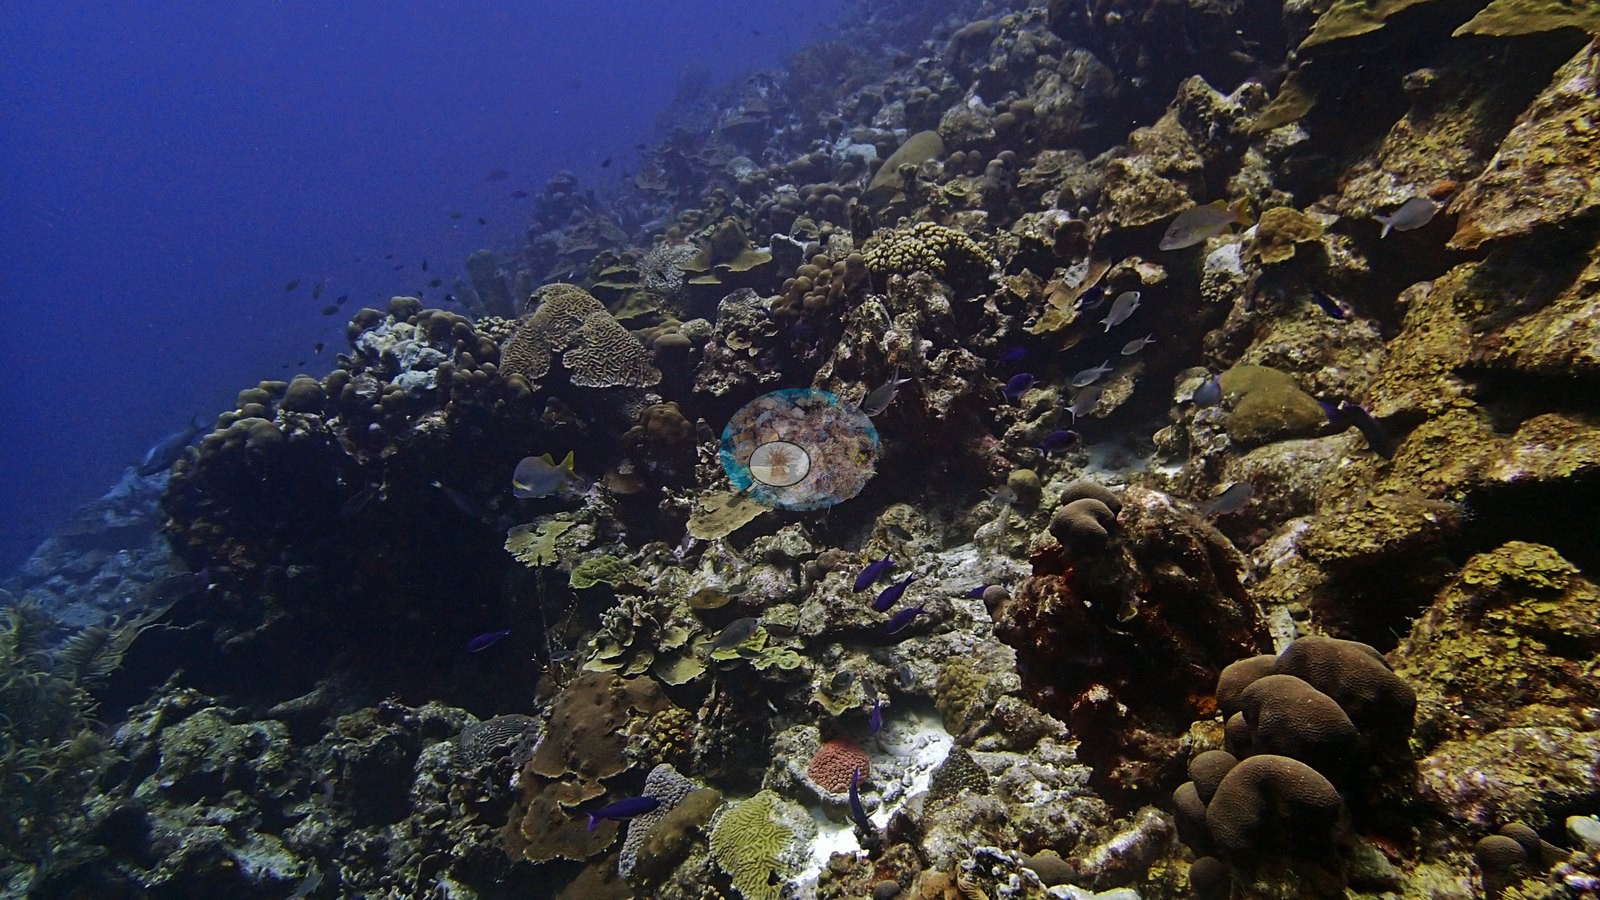
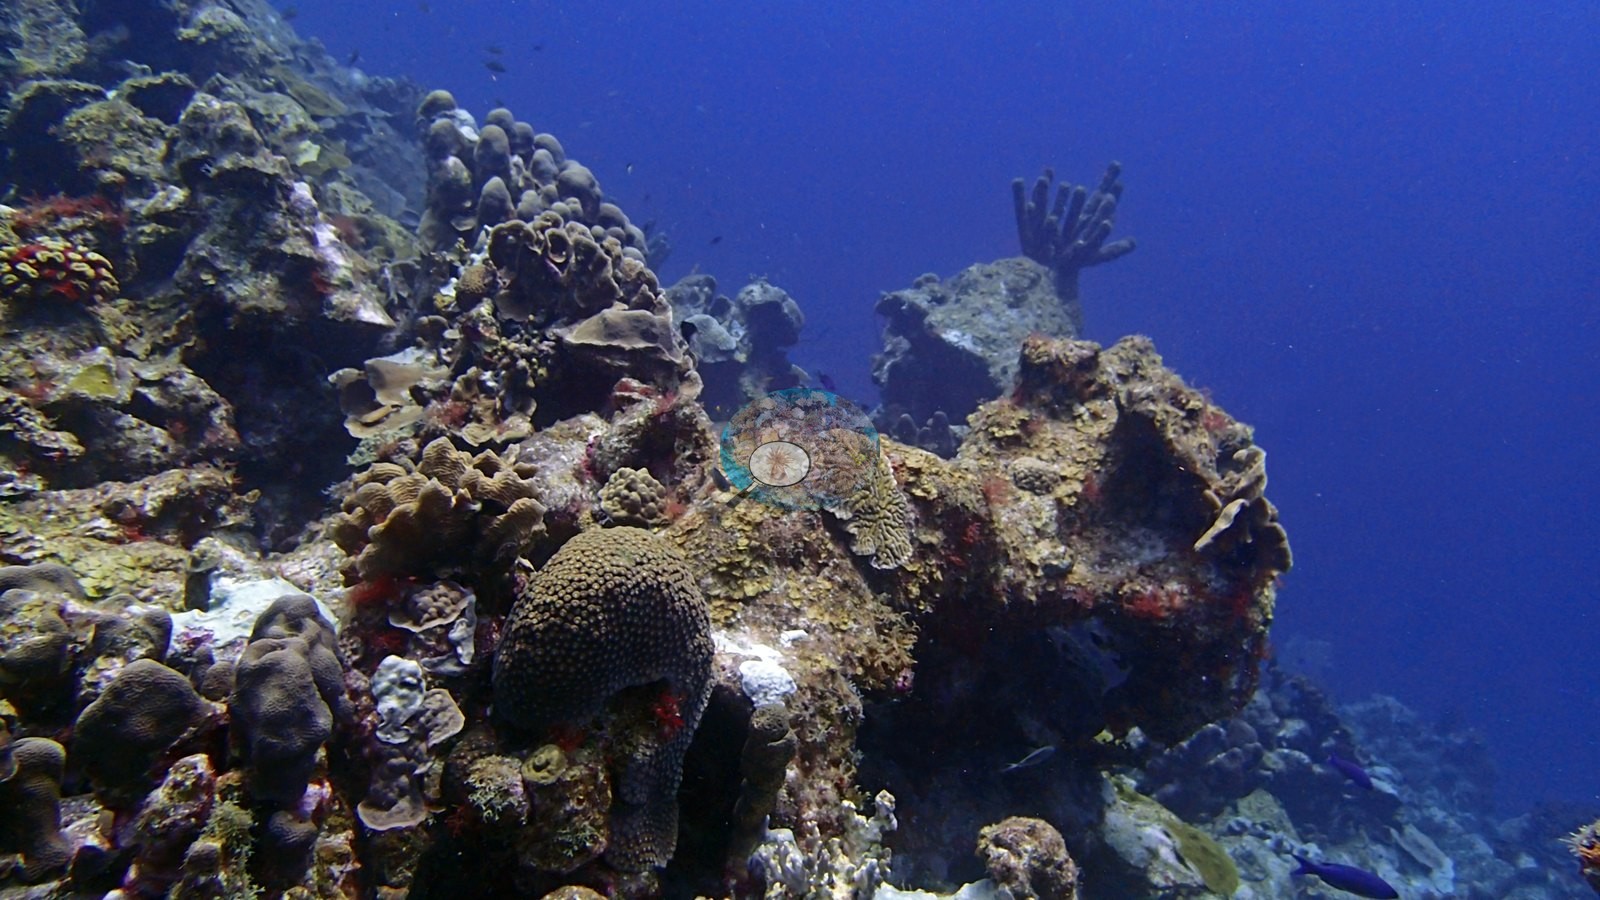
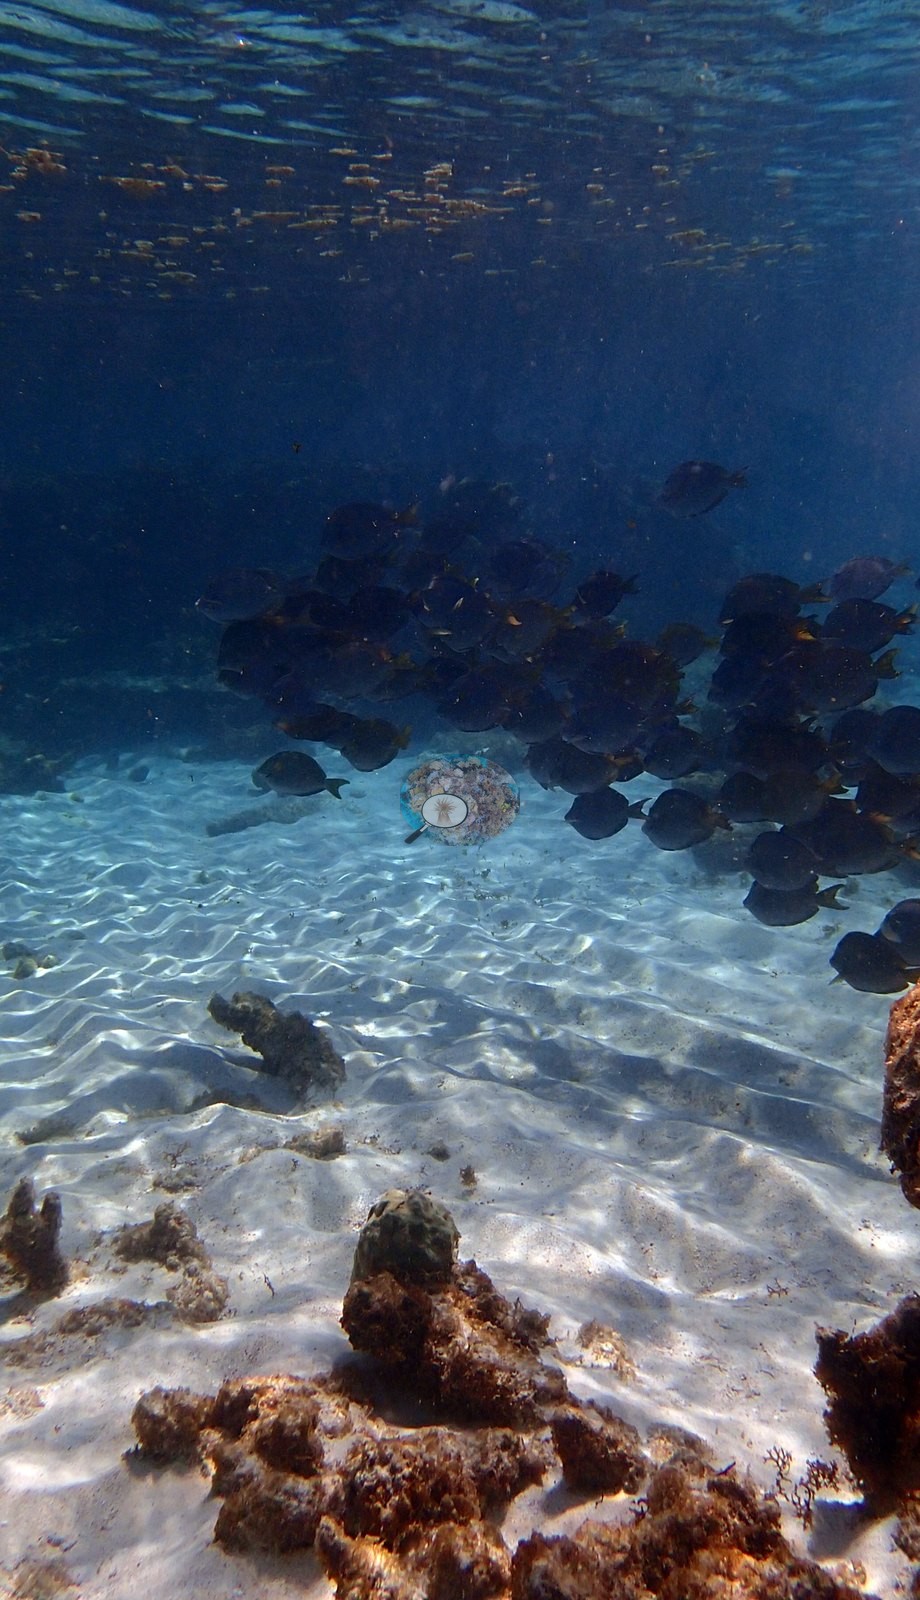
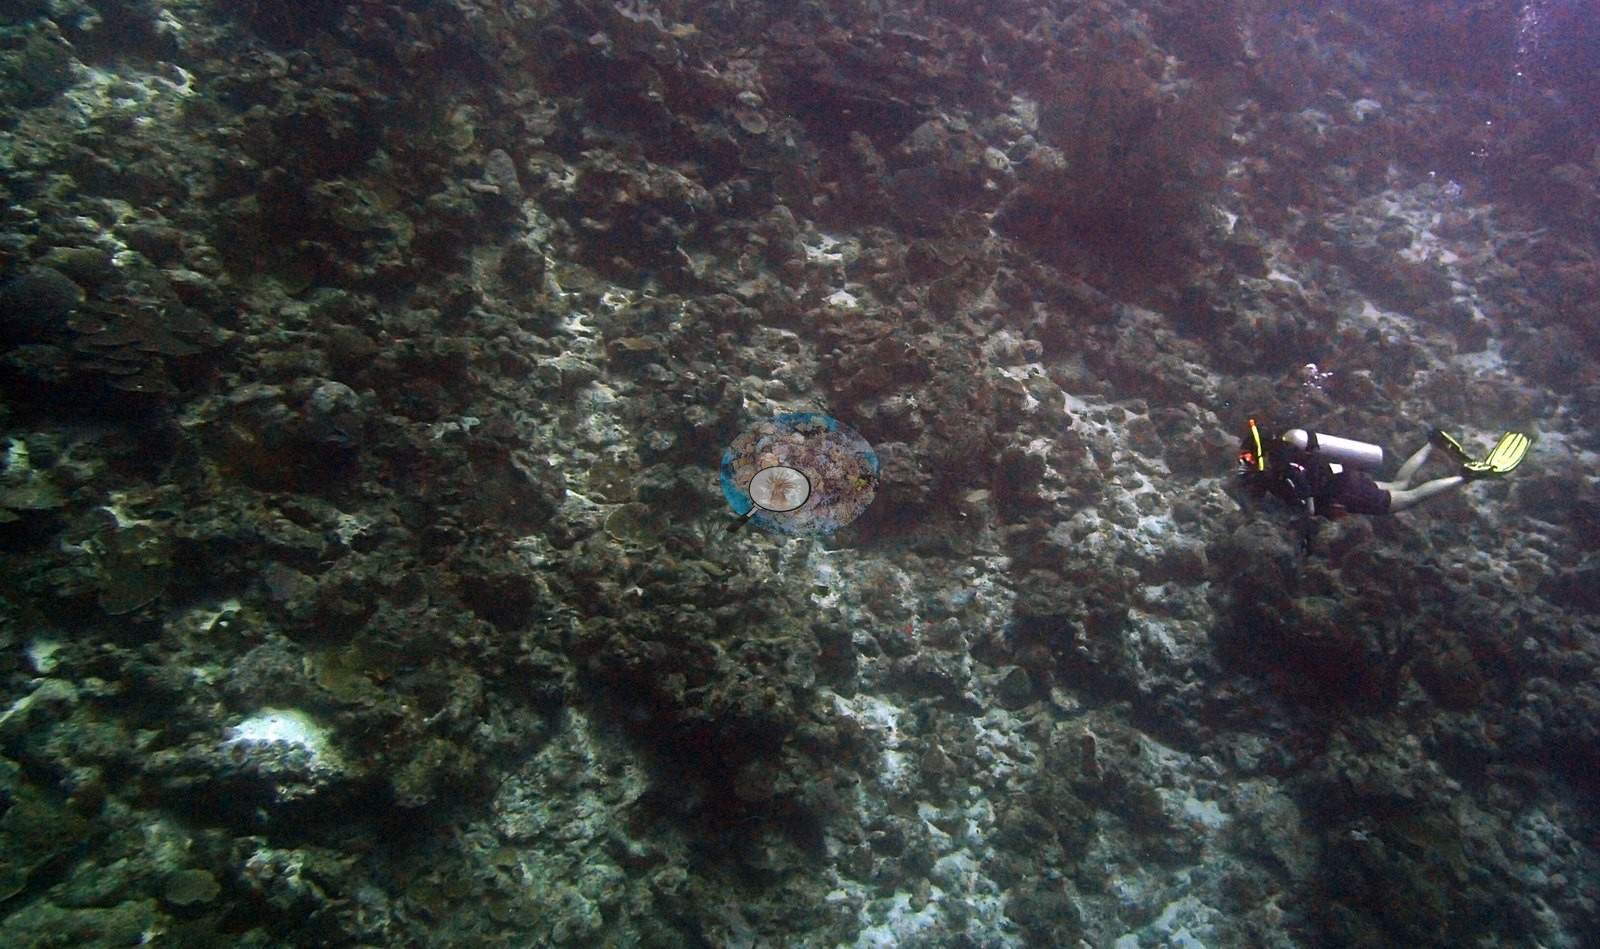
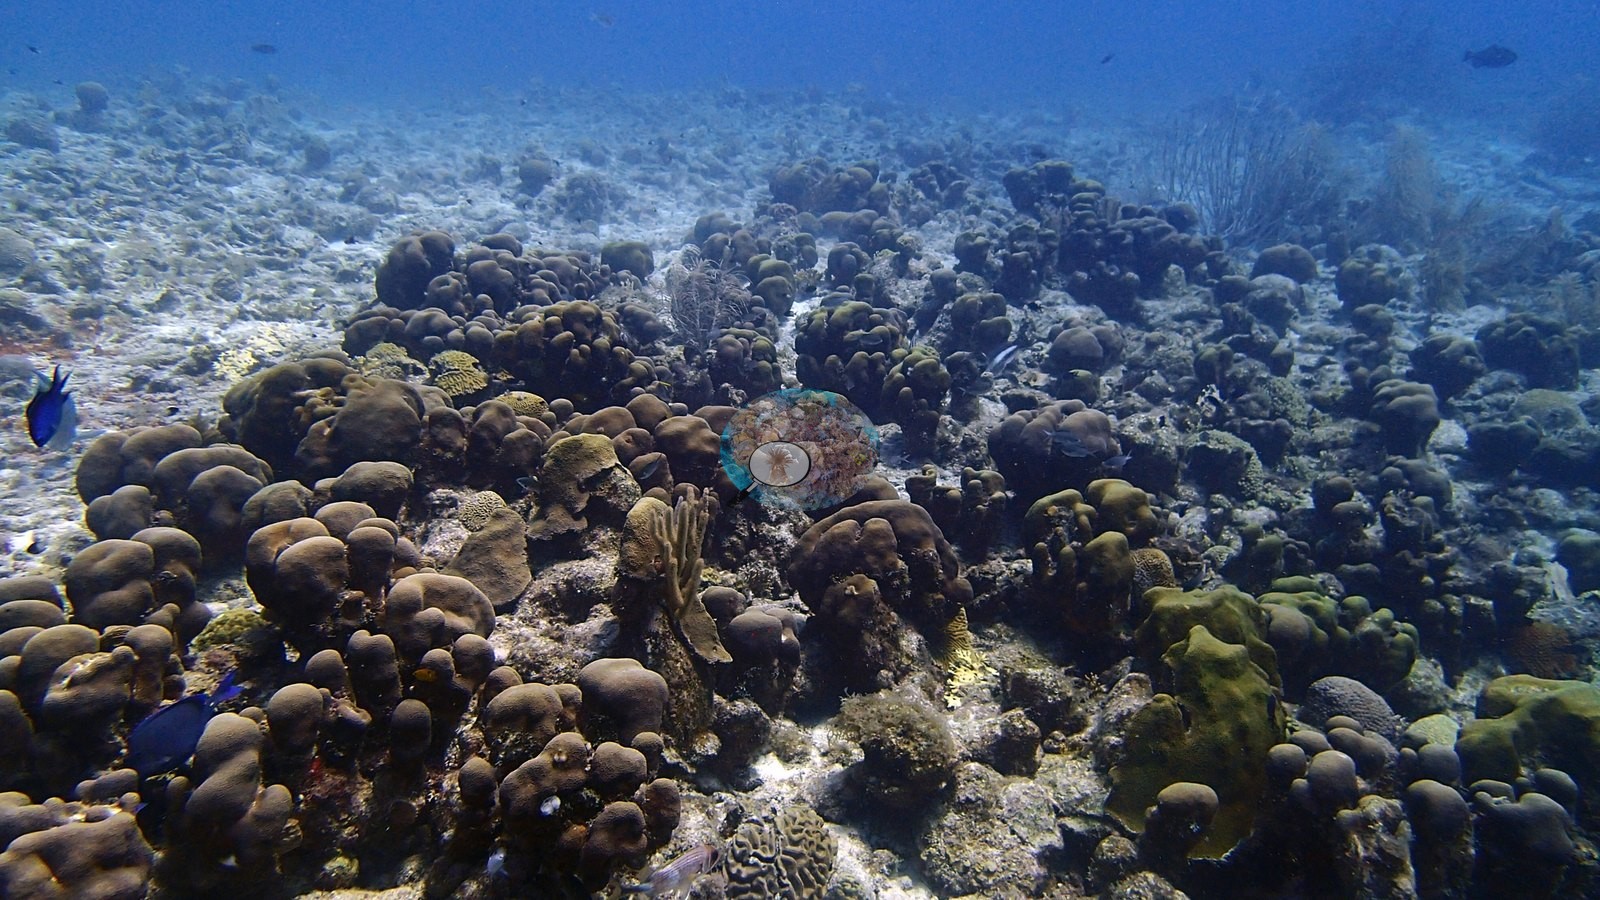
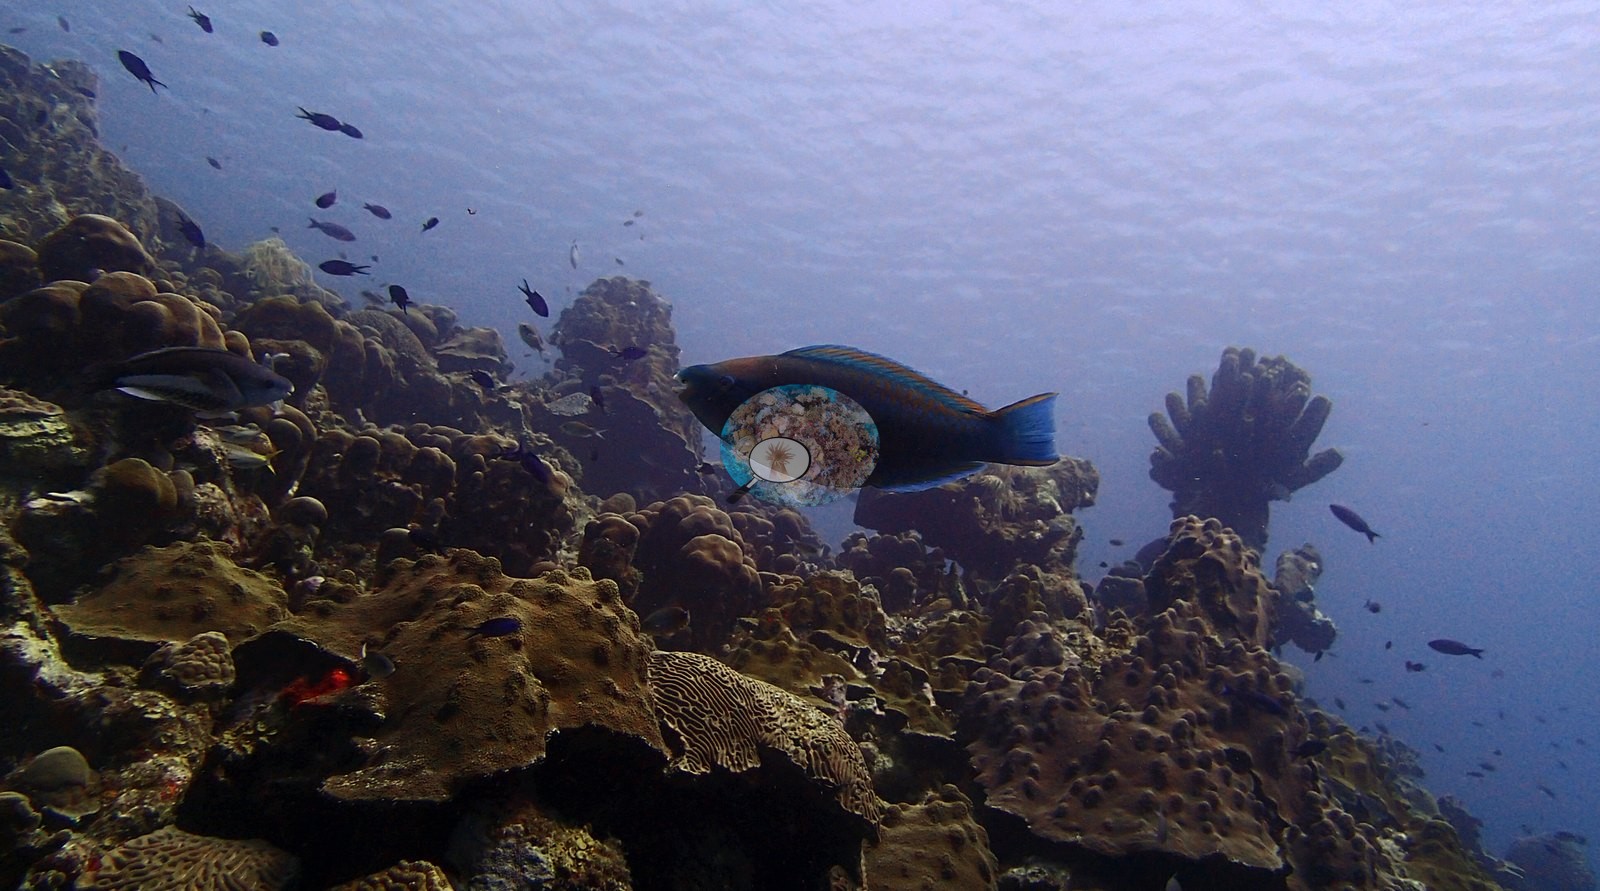
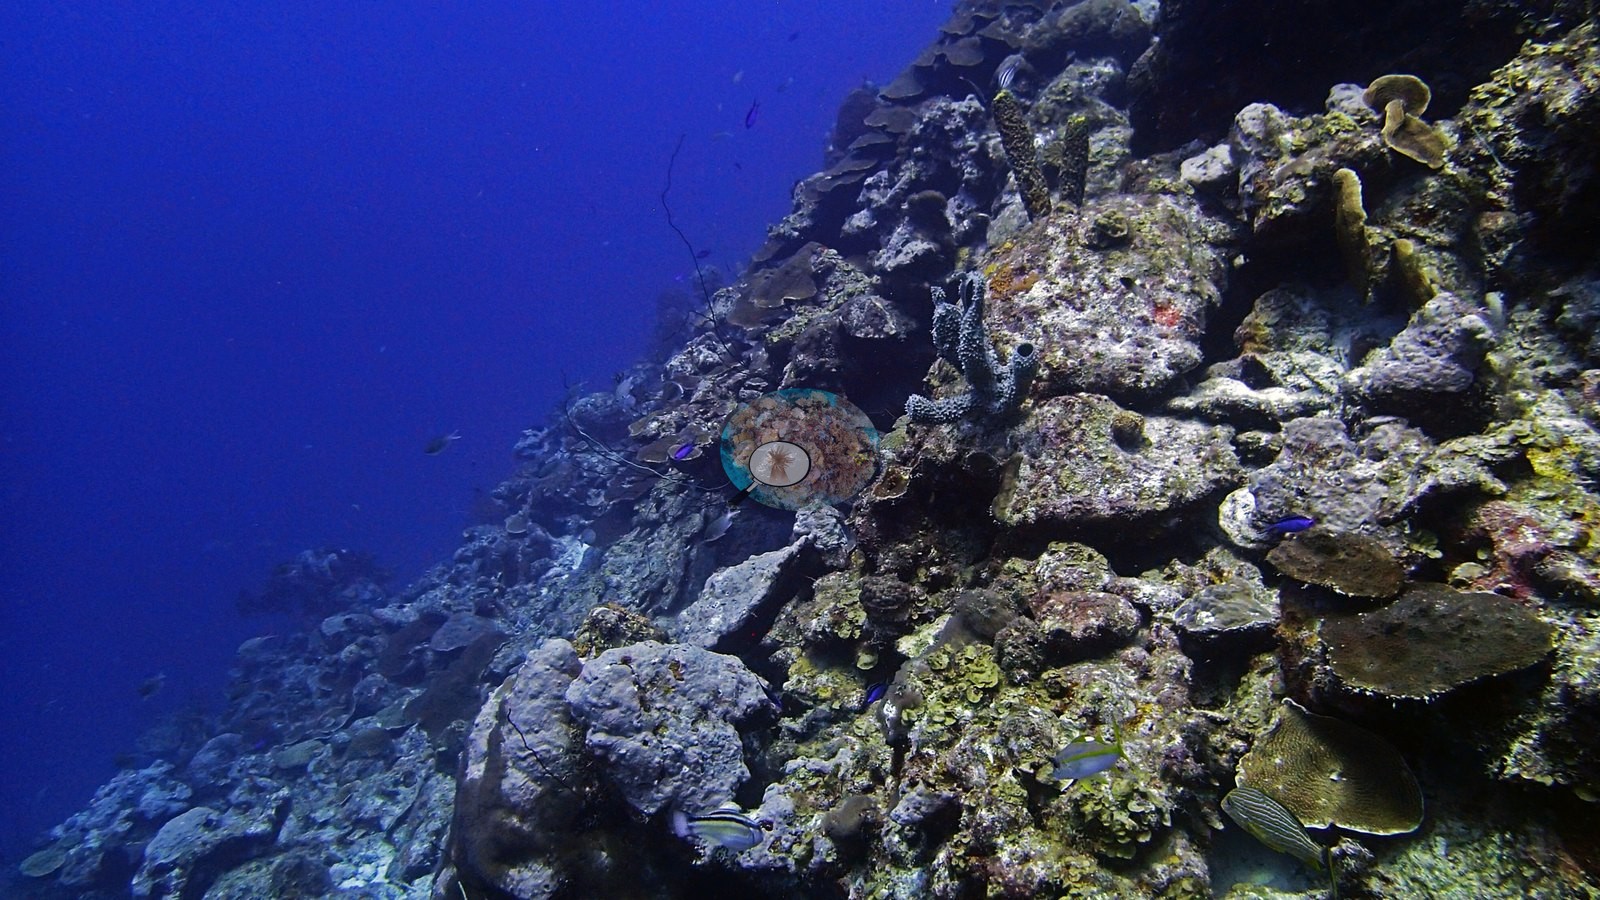
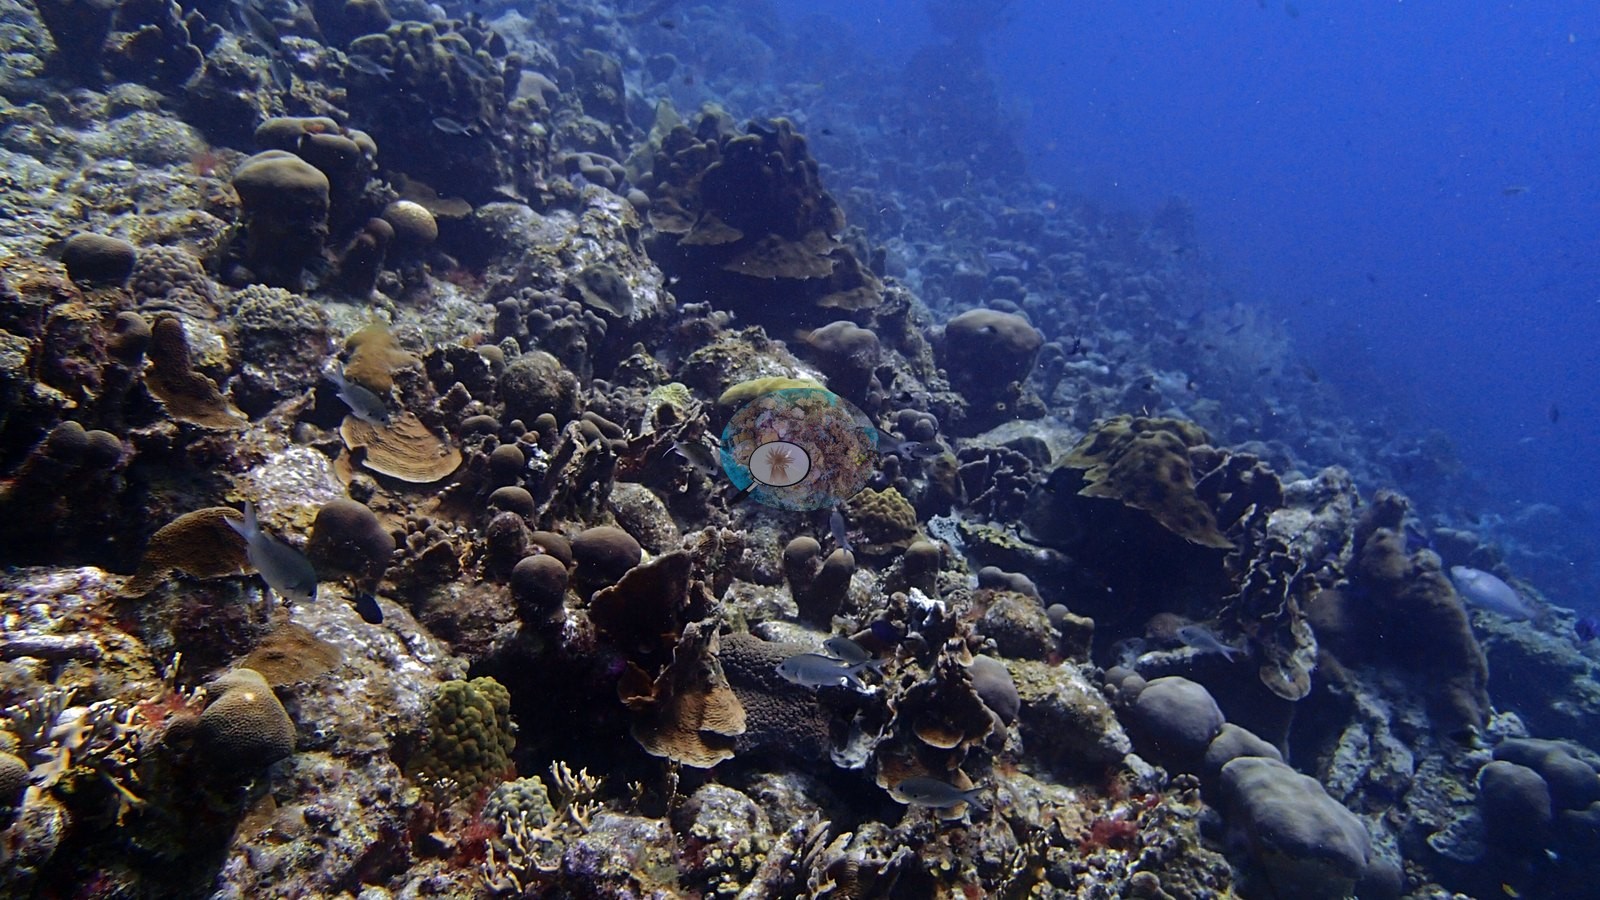
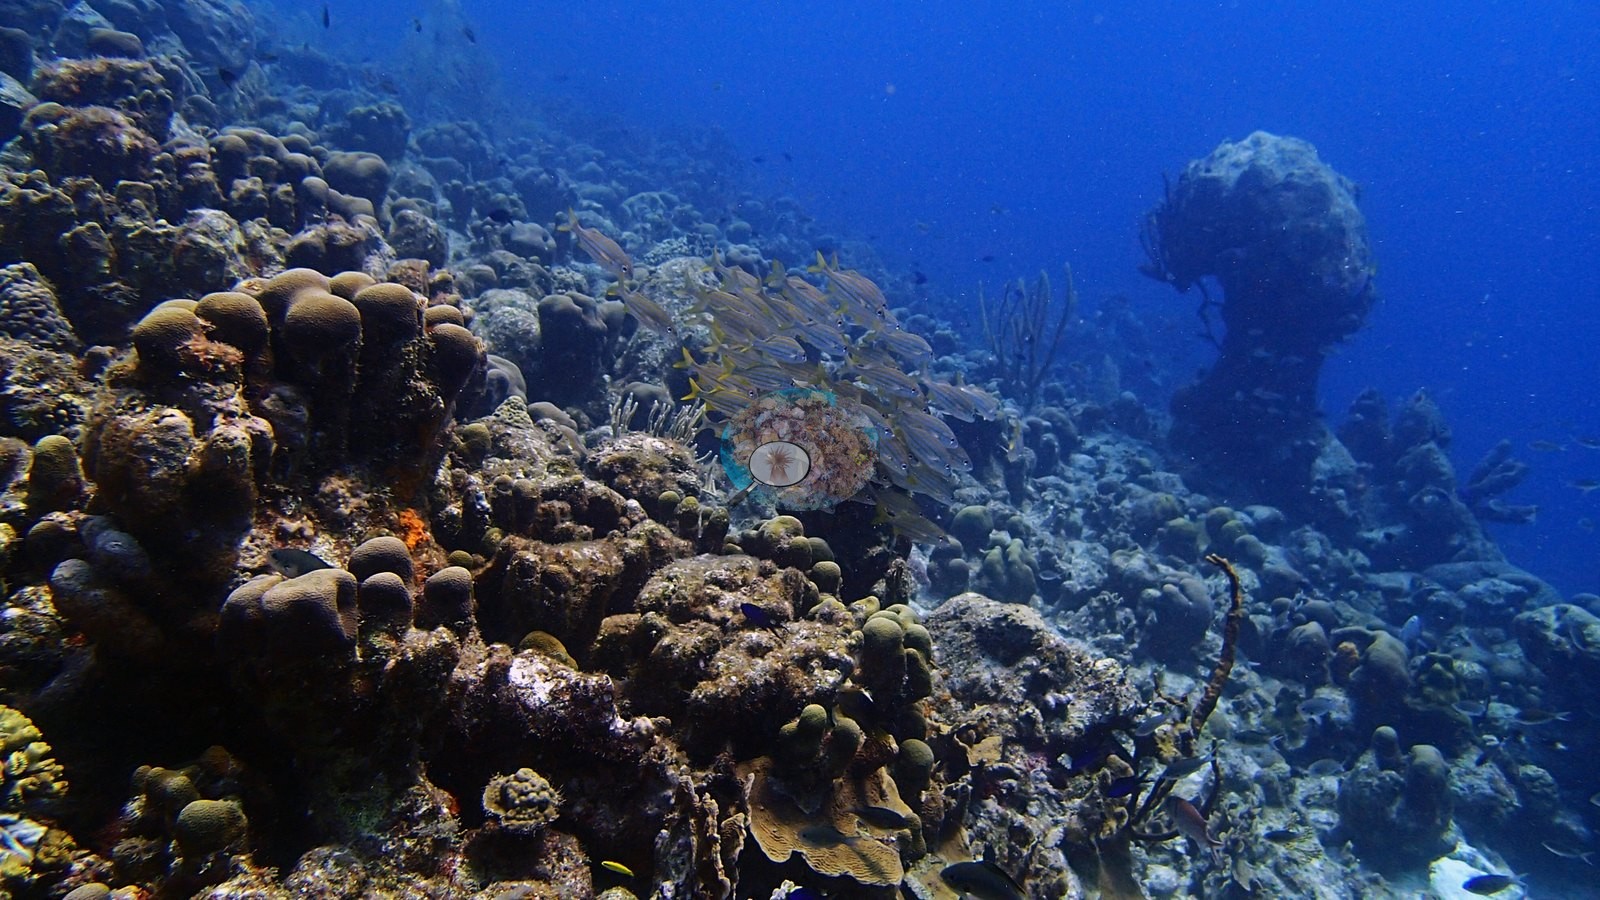
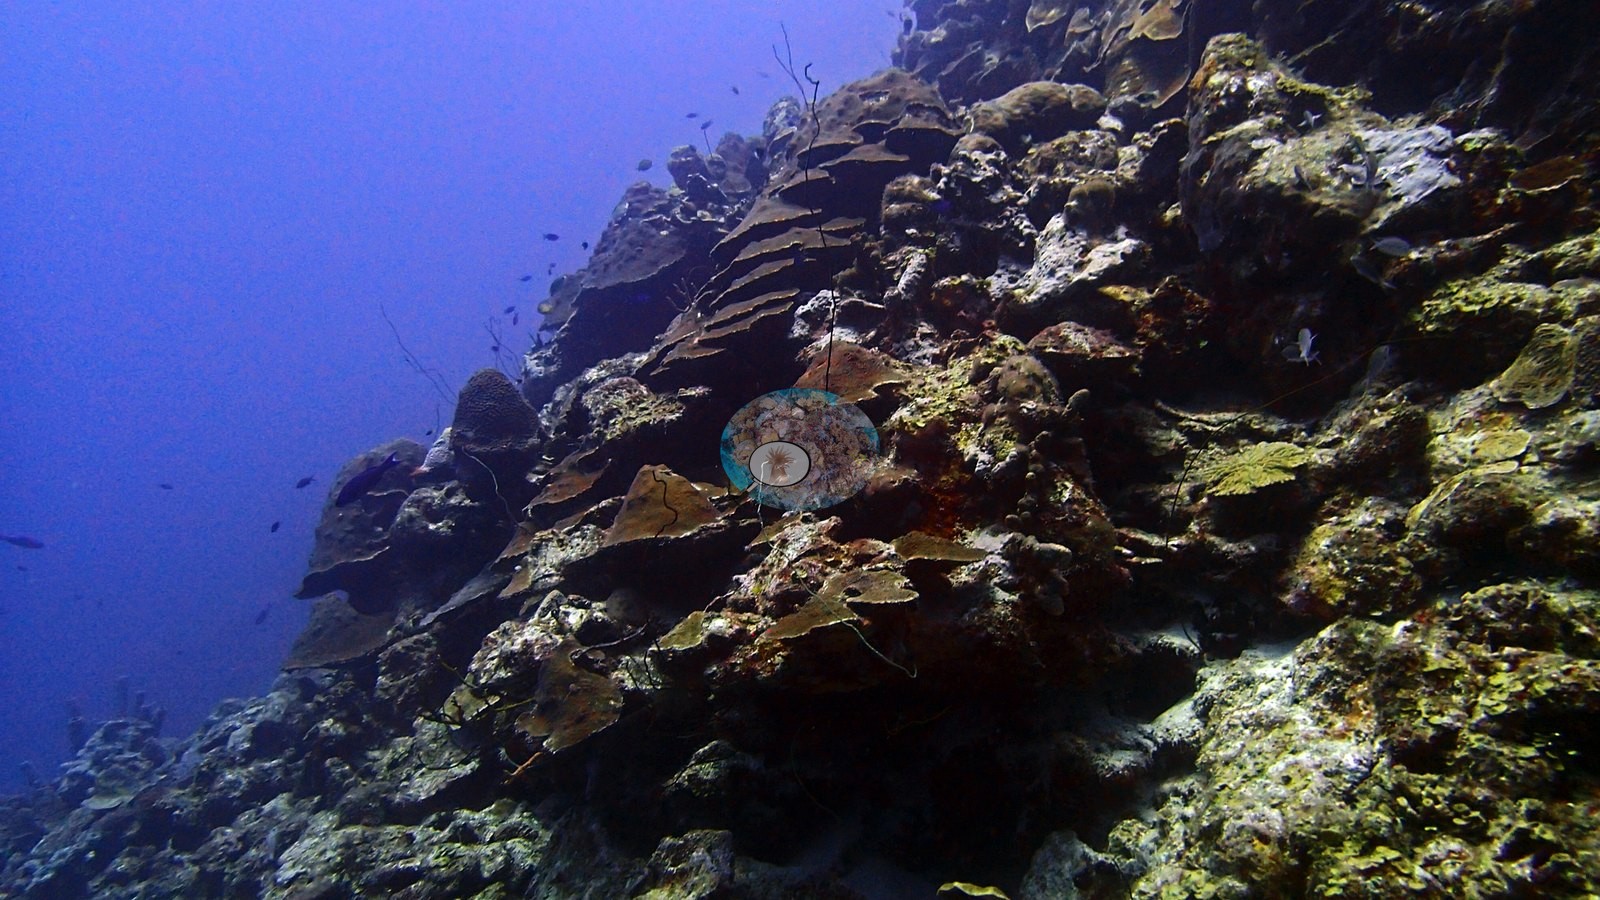
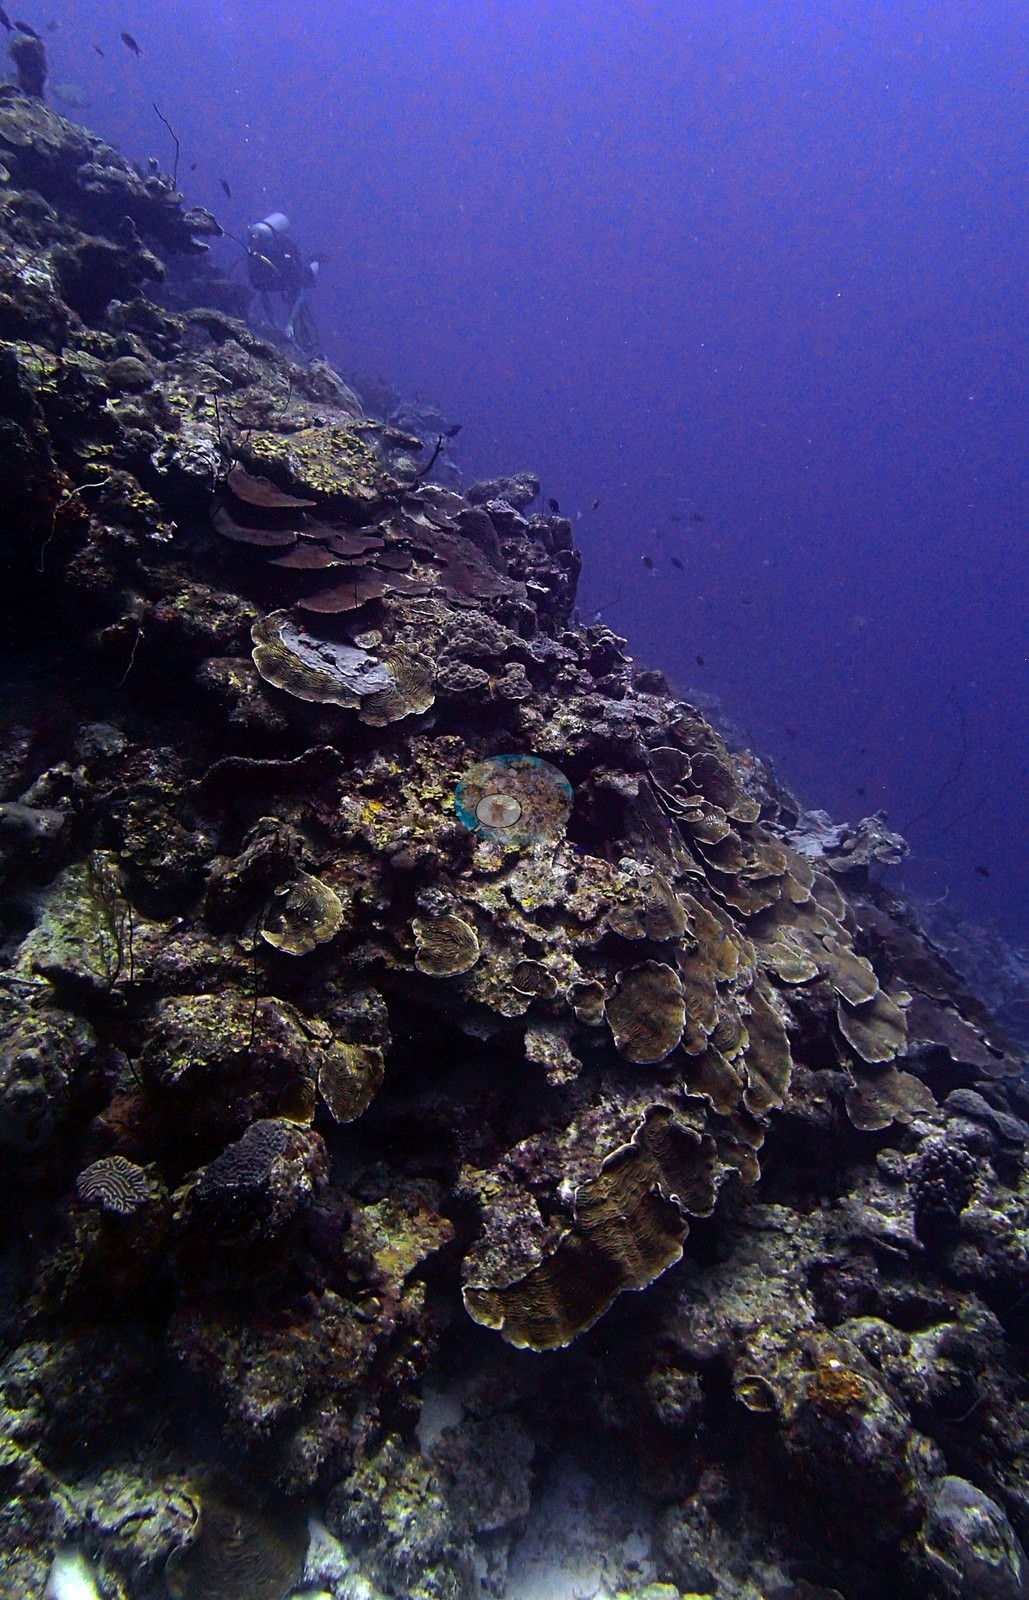
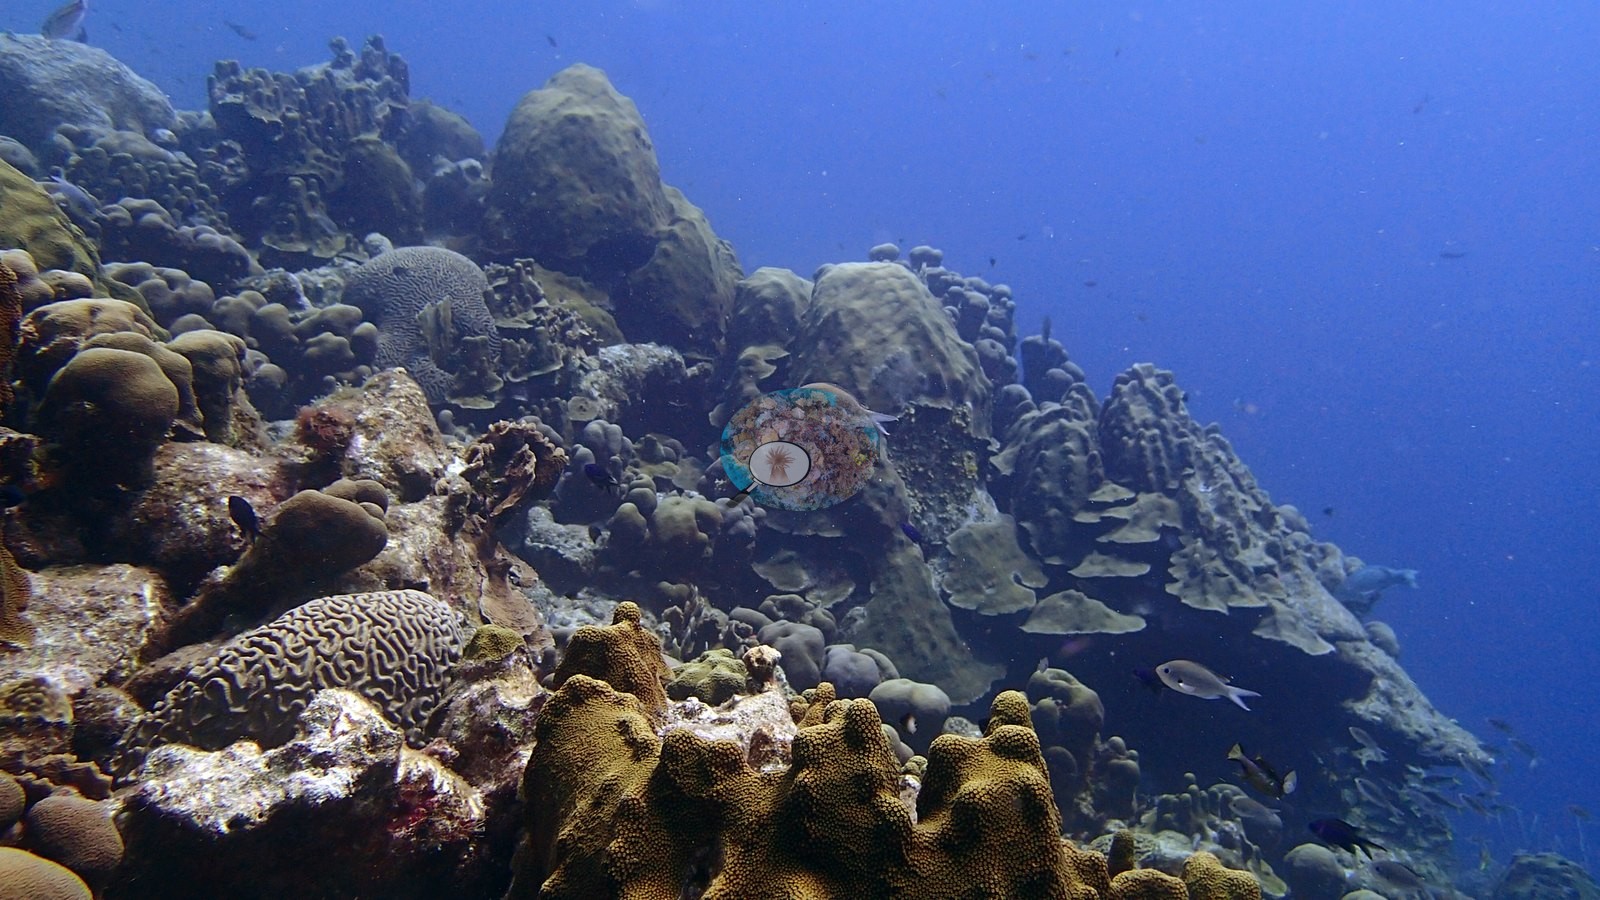
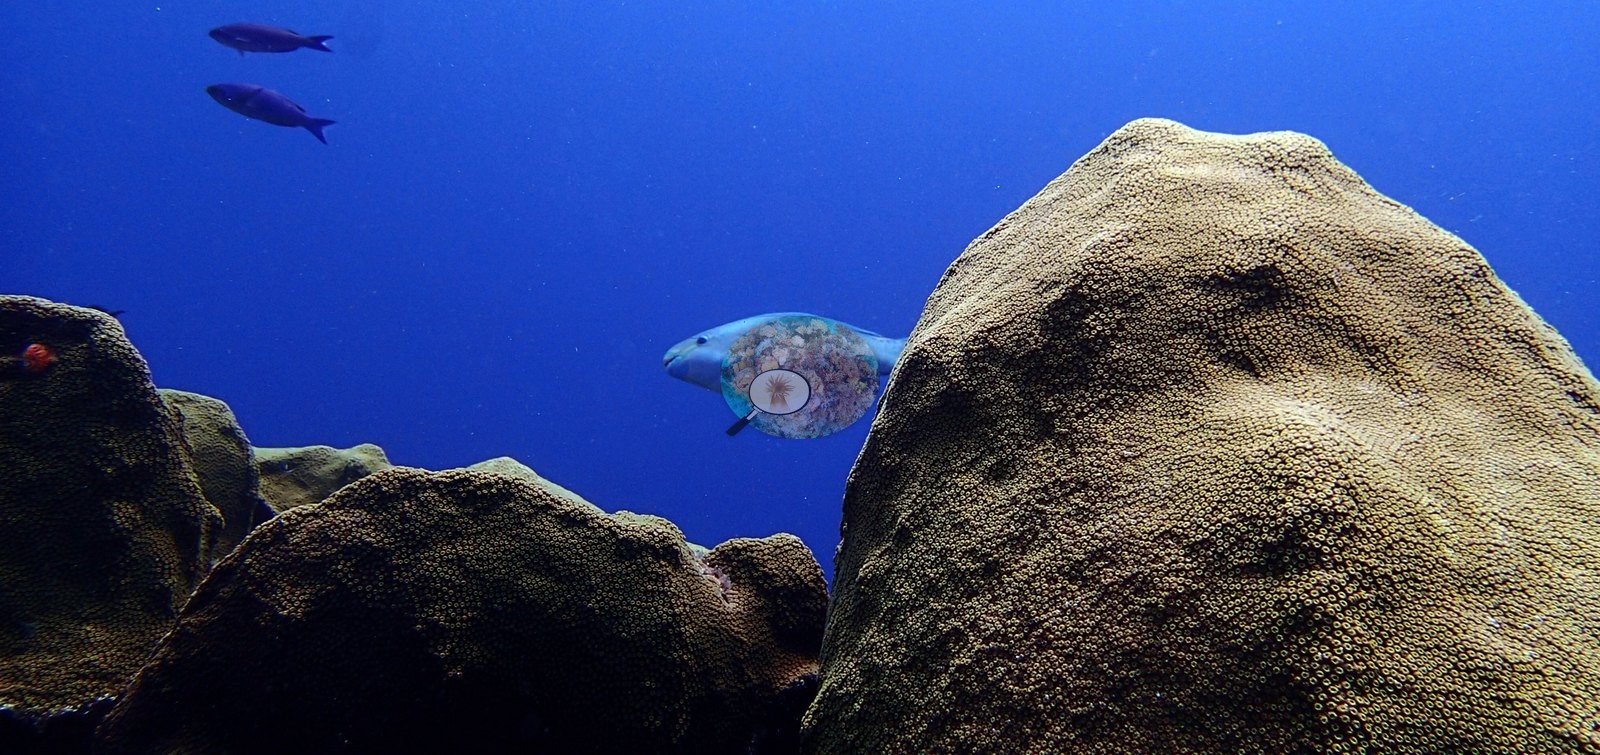
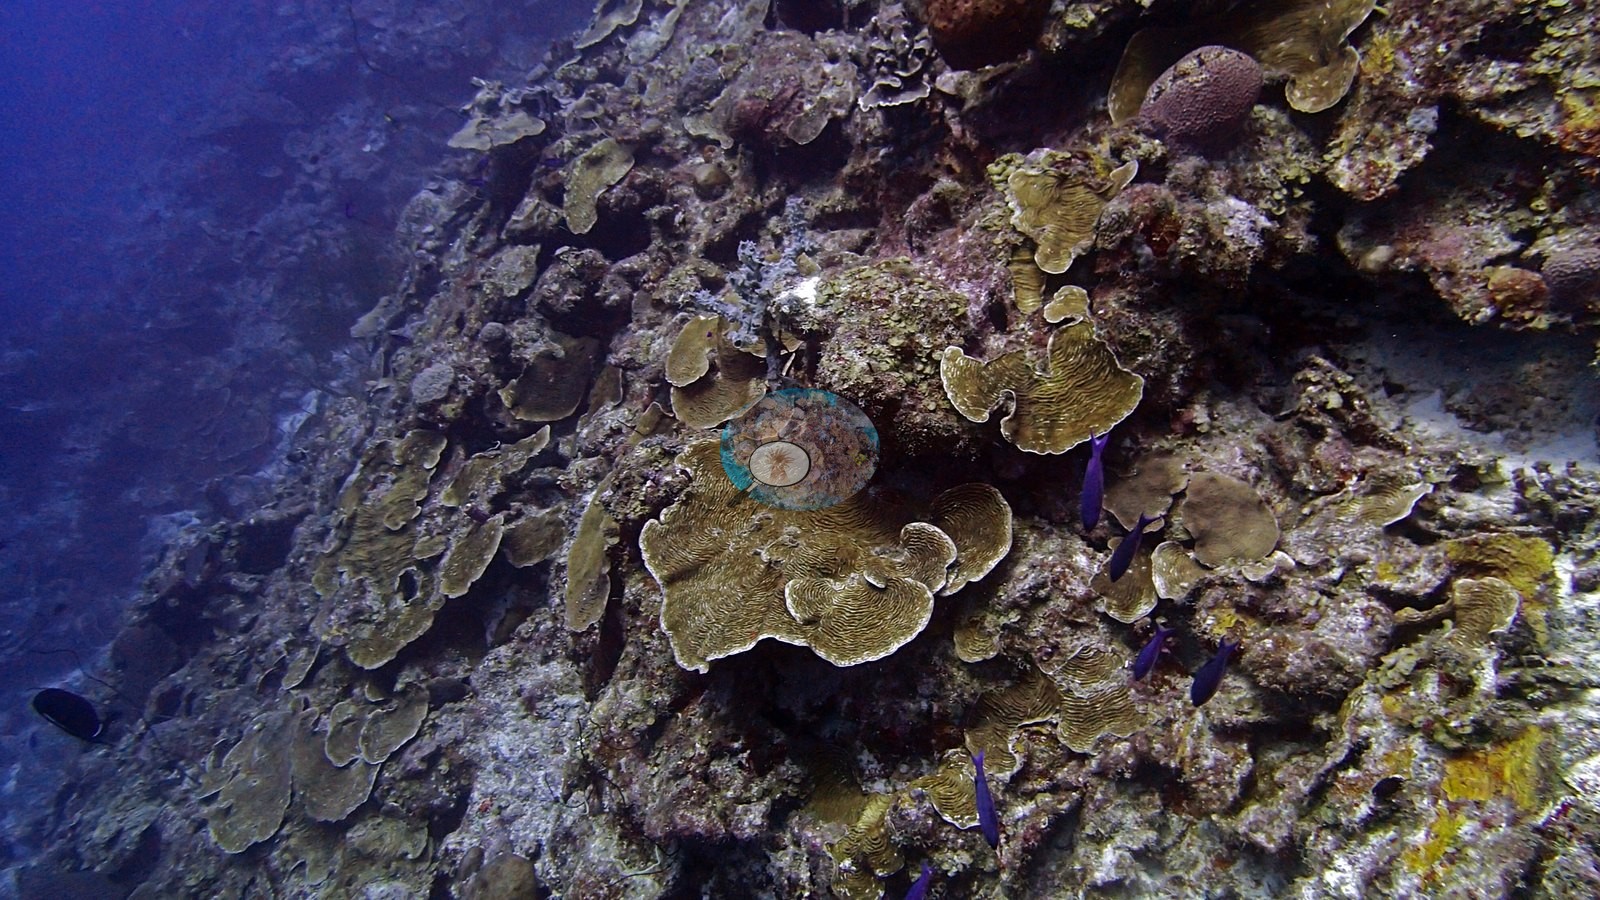
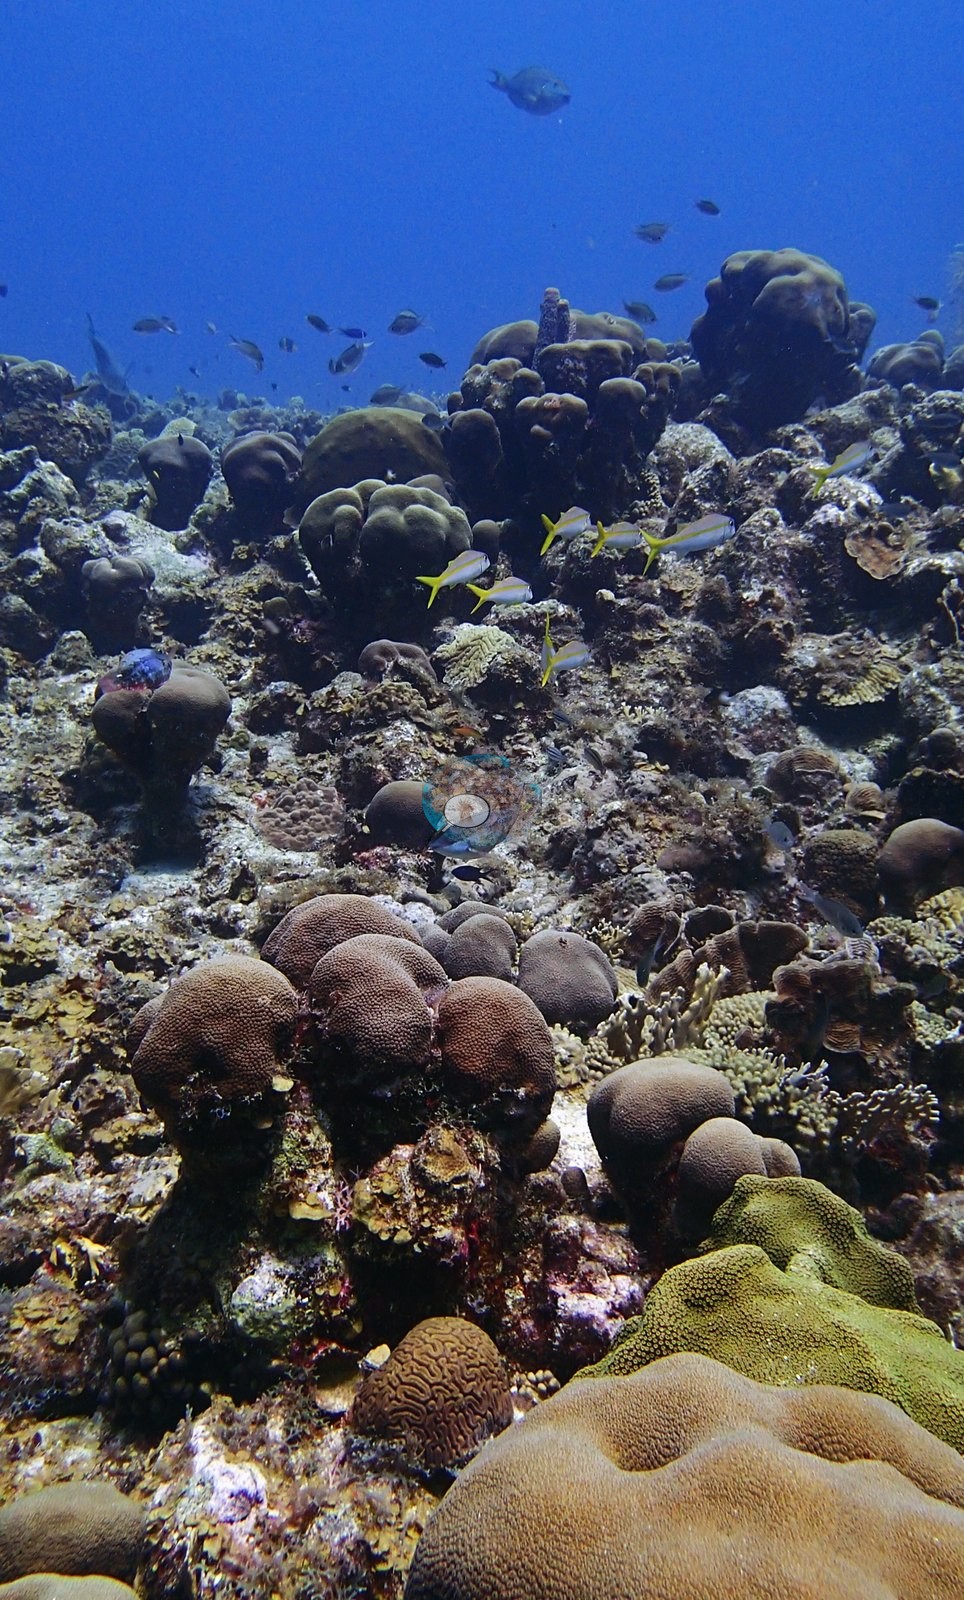
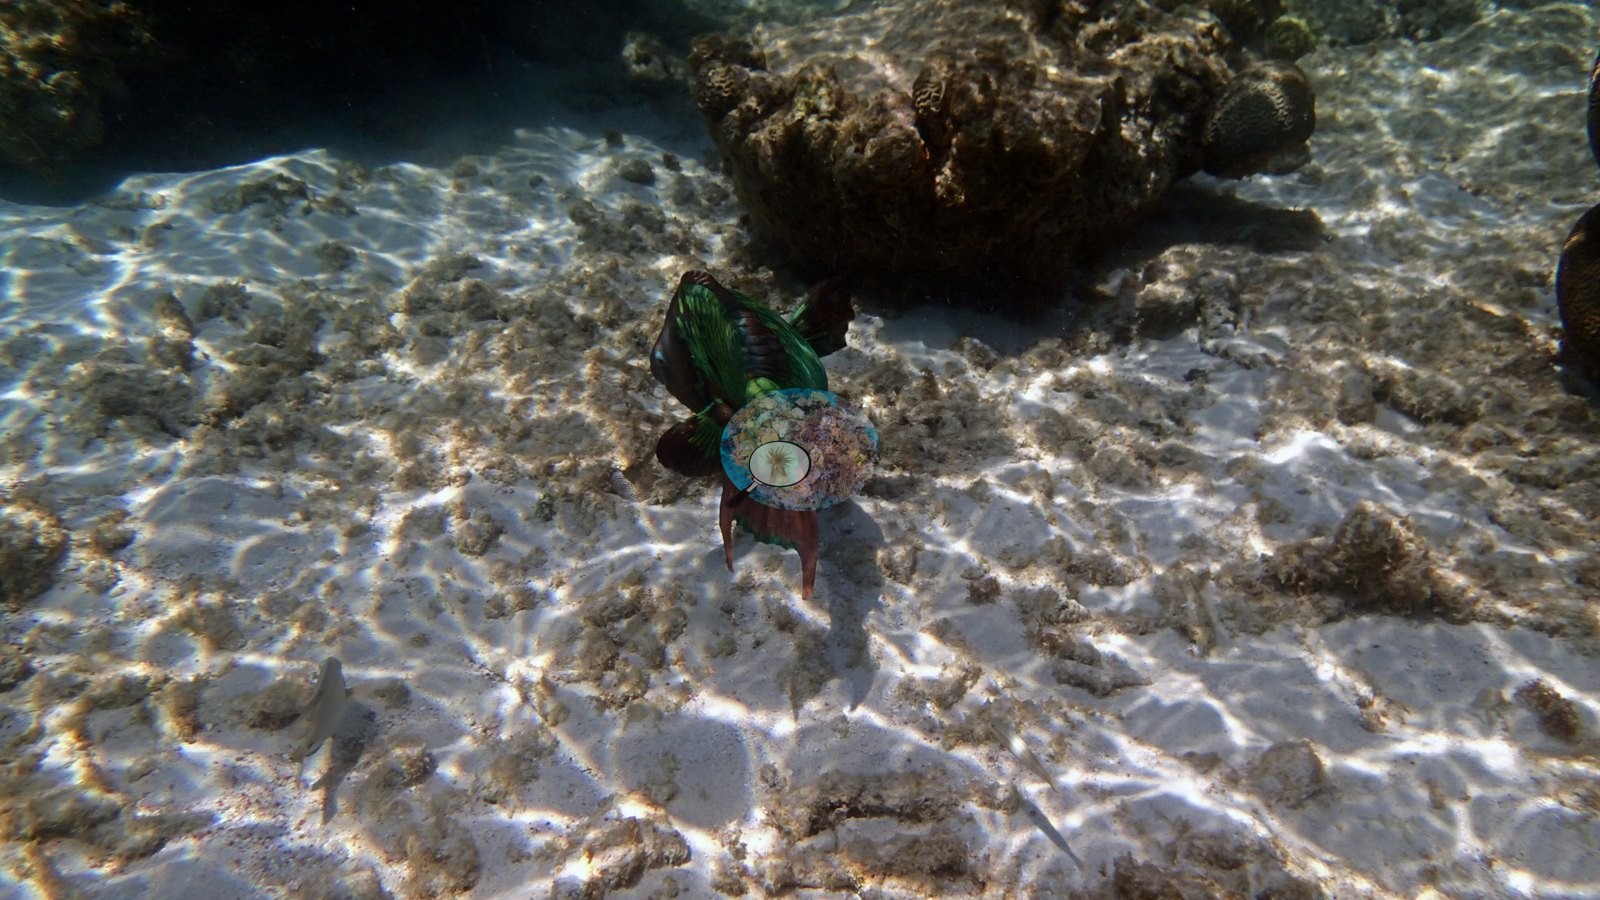
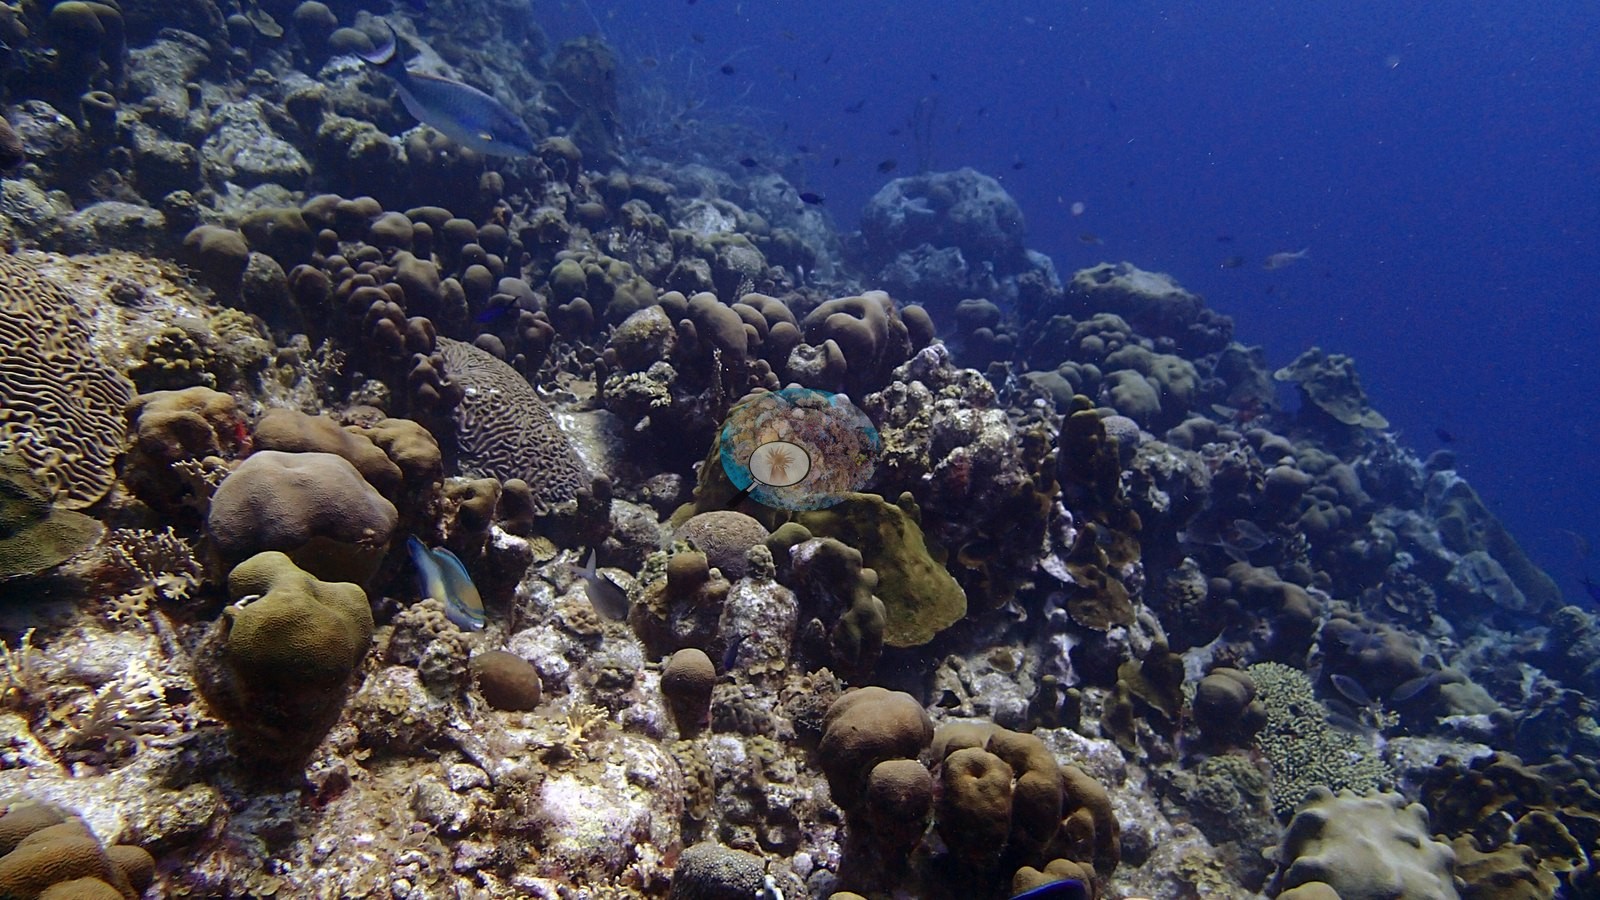
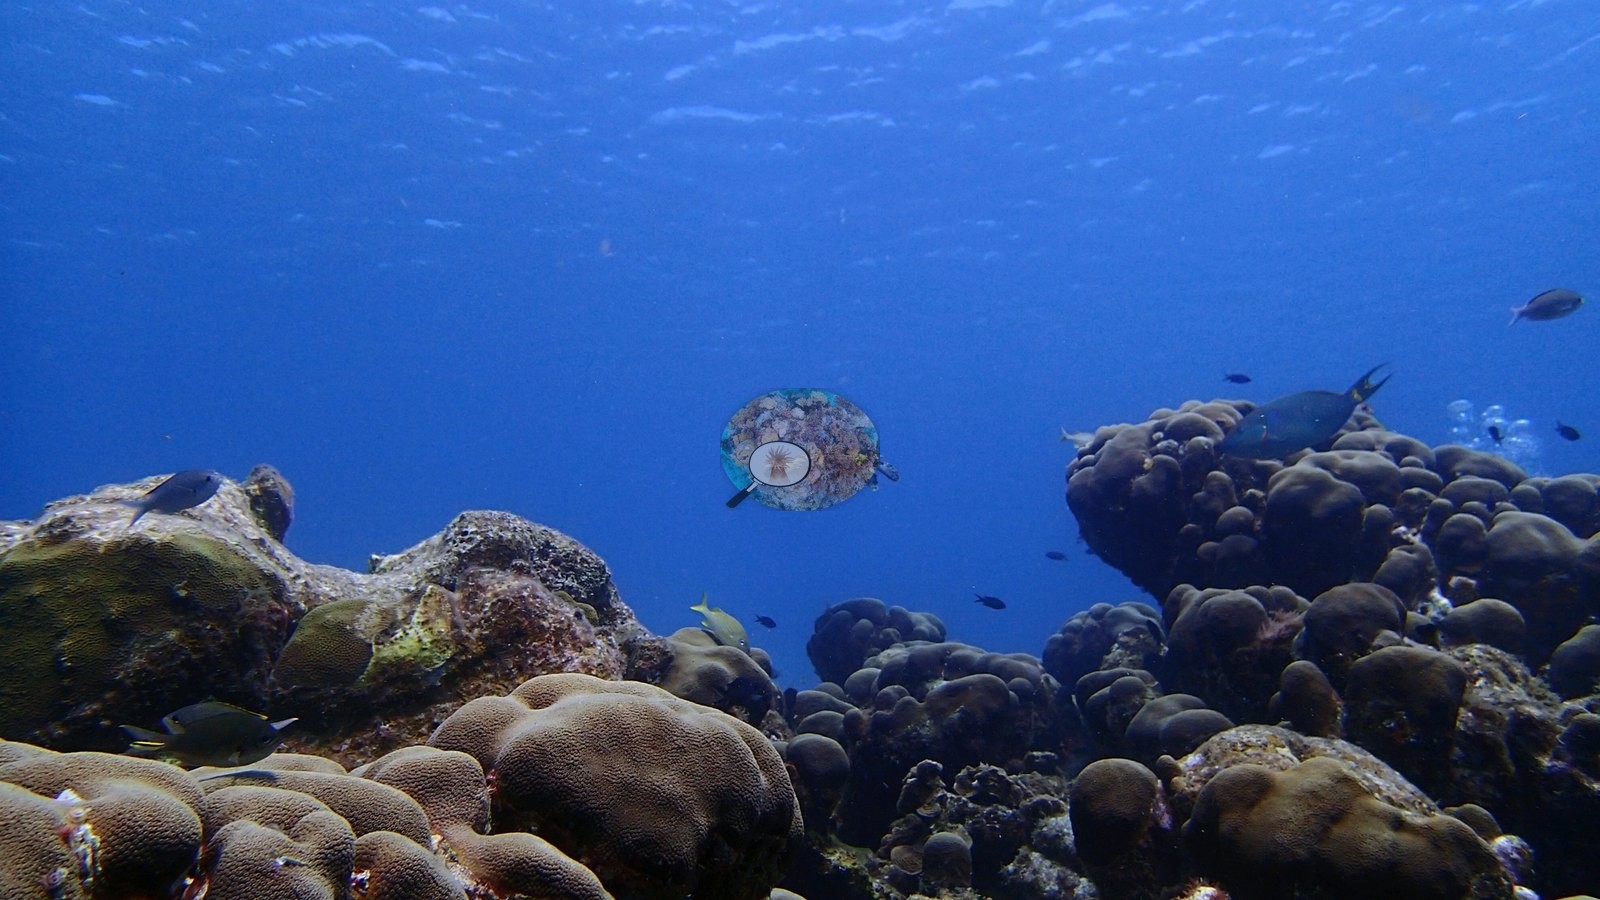
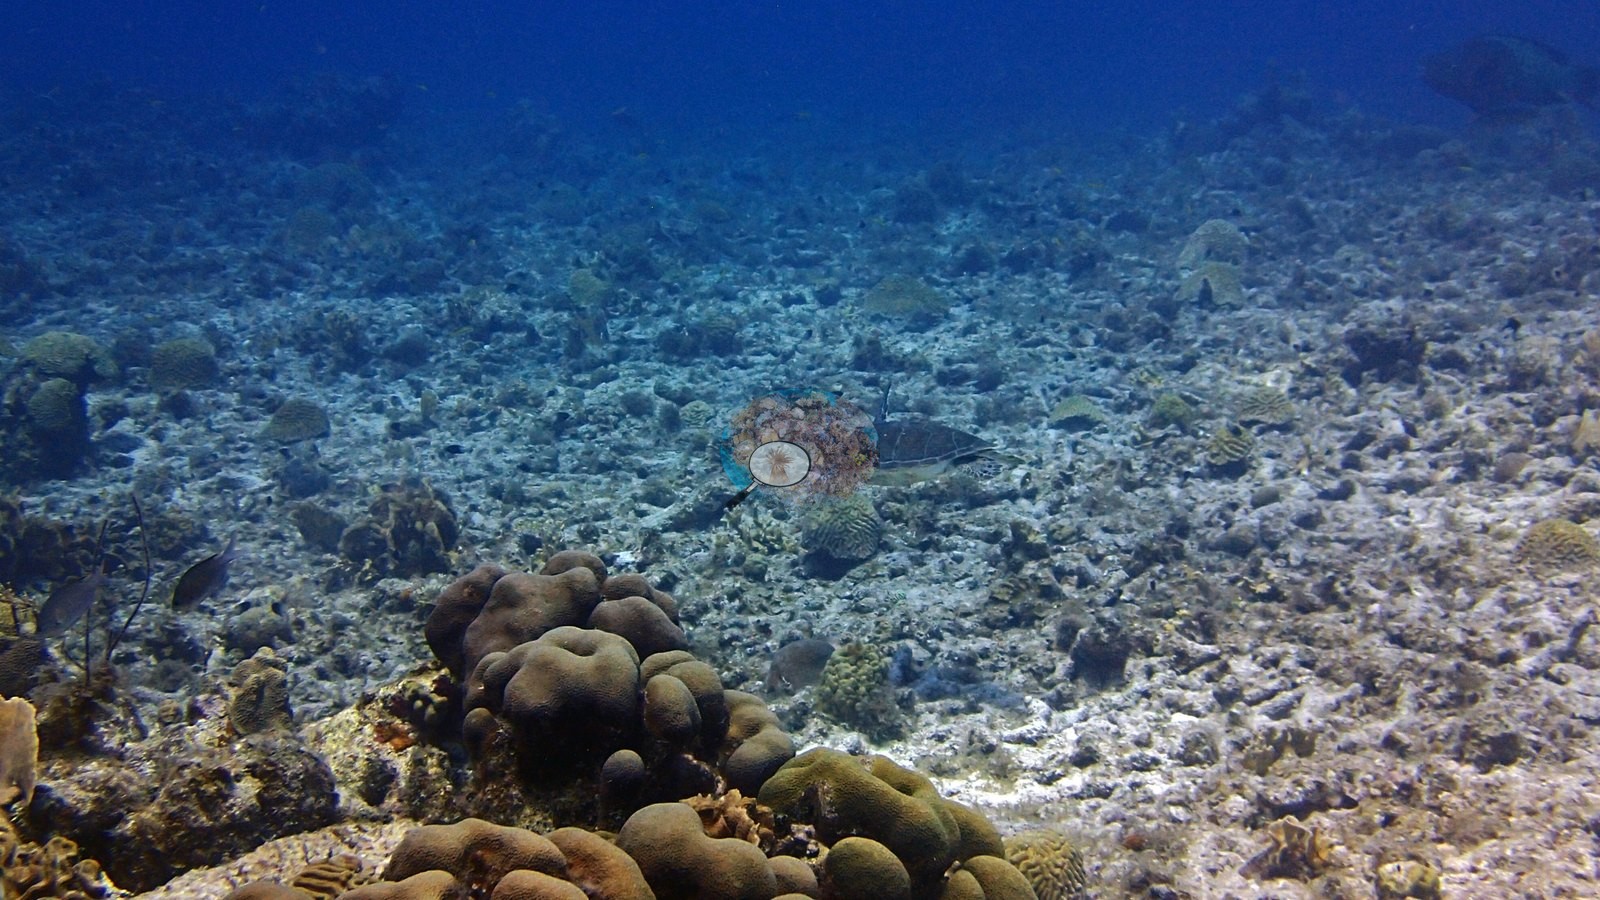
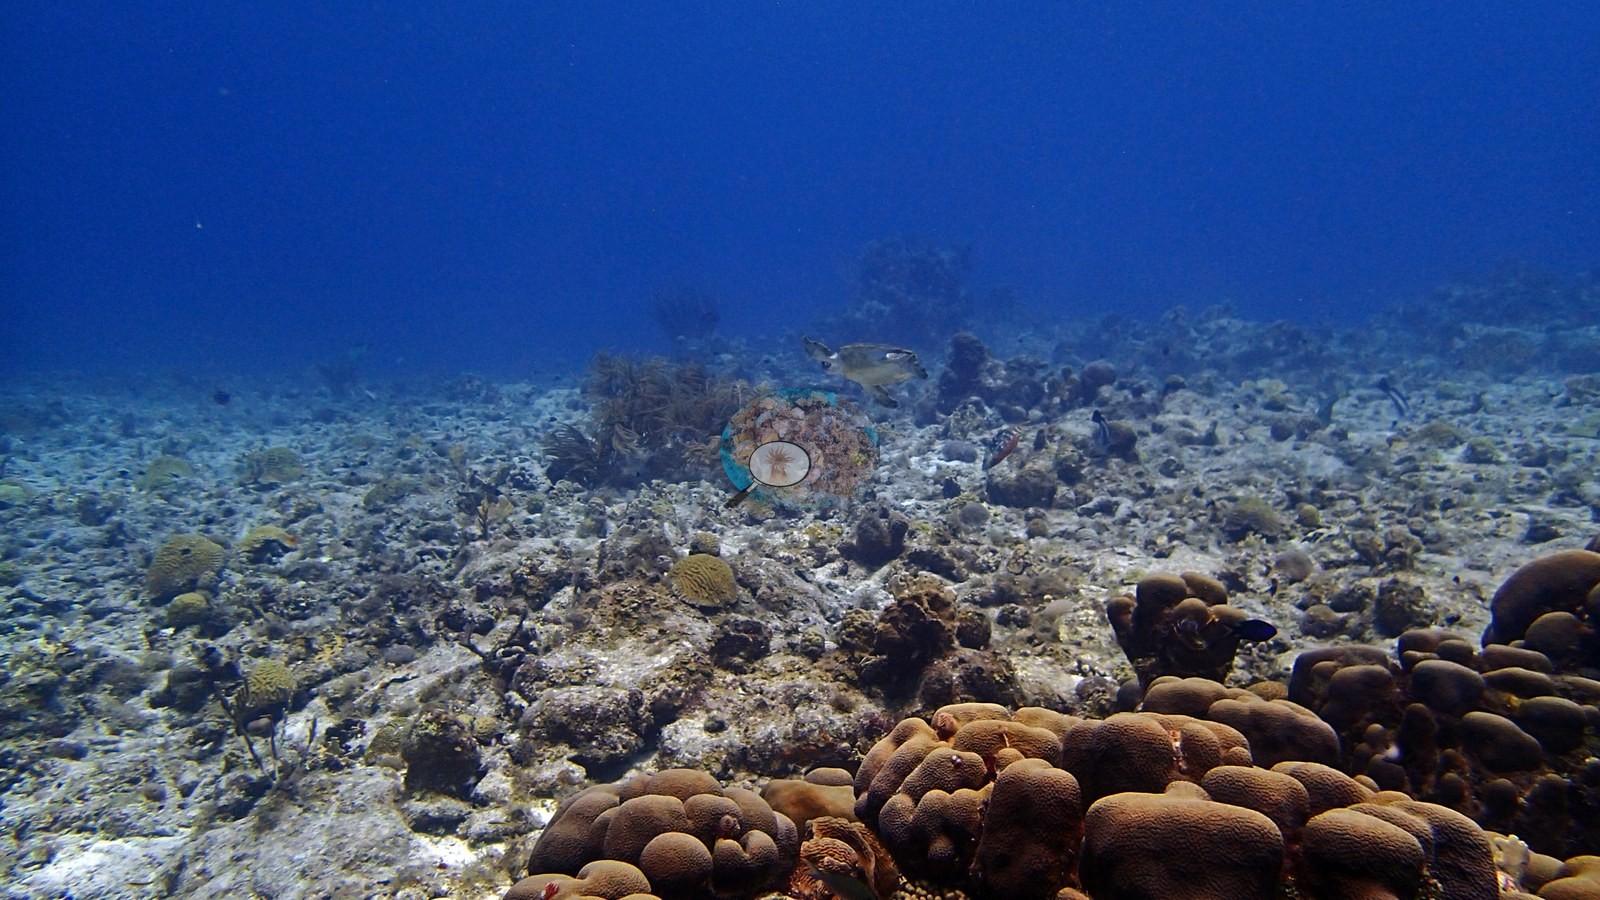
Wayaka II spans a steep wall with abundant plate/lettuce corals, a slope dominated by massive/lobate and brain corals (e.g., Image 3, Image 4), and a shallow zone with rubble and extensive dead branching framework (a frame labeled as dead reef) (e.g., Image 51).
Coral cover
- Reference: Claude CV point count (this site's photos)
- Coral cover: 24% — a blind Claude computer-vision point count of 52 of Anderson's edited photographs (20 points per photo; water, fish, and obstructions excluded). Other computer-vision methods are listed in the method table.
Stressors
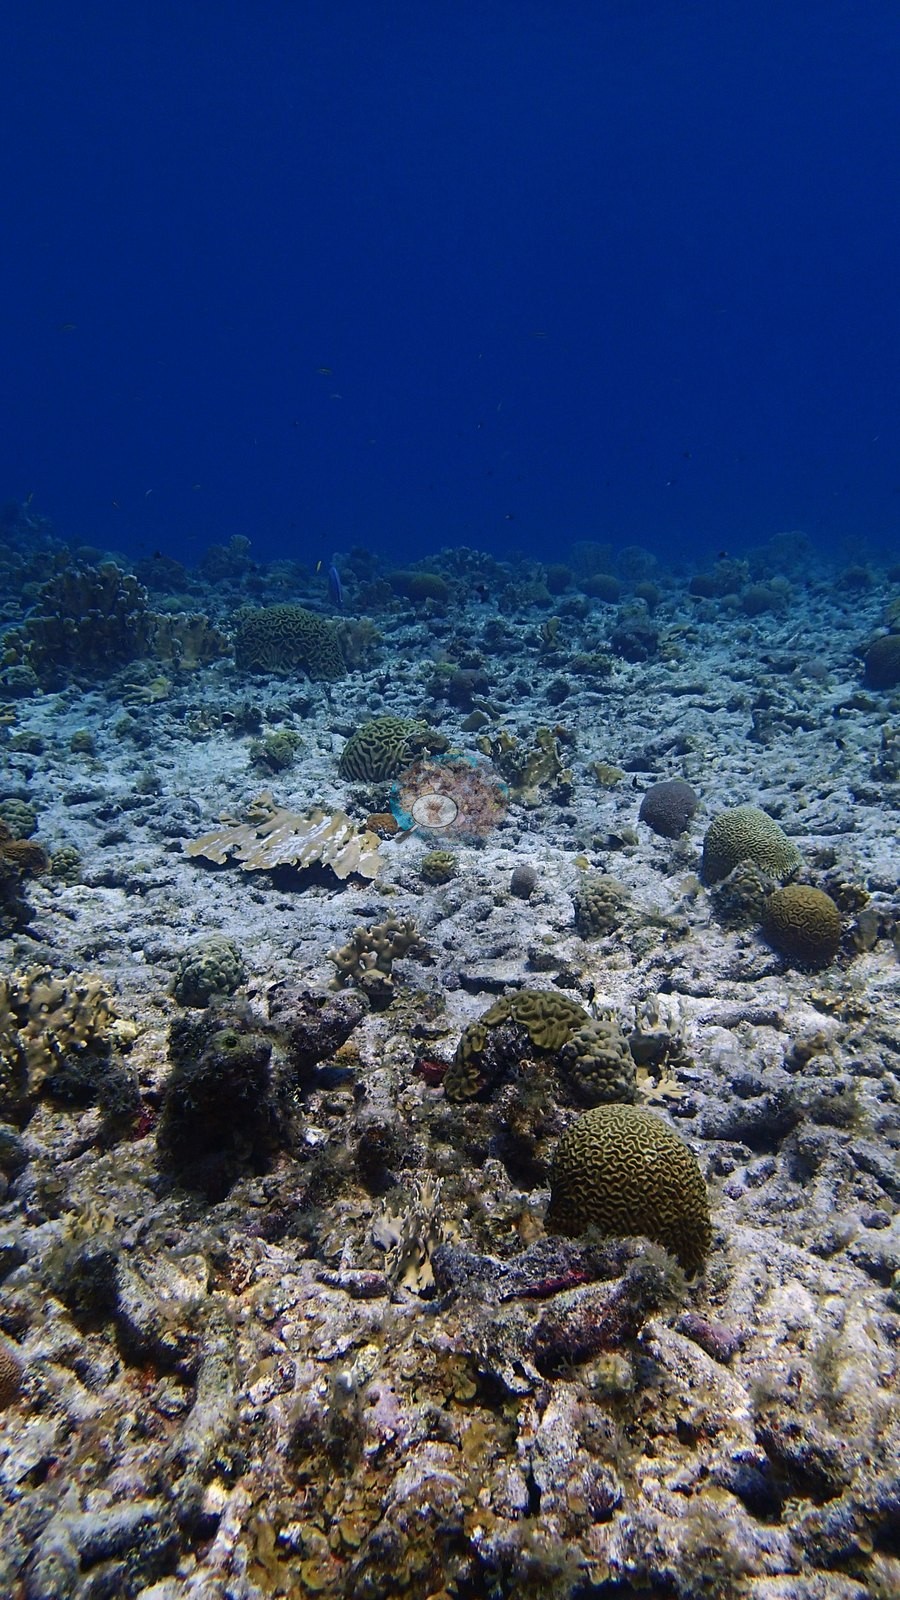
The strong cross-habitat contrast is important: coral-dense wall and slope images coexist with a visibly degraded shallow framework field. No broad bleaching signal is apparent on the wall or deeper slope, where many colonies retain pigmented tissue; the exception is one bleached plating colony, stark white atop a mound beside olive-brown plates of the same form (e.g., Image 42).
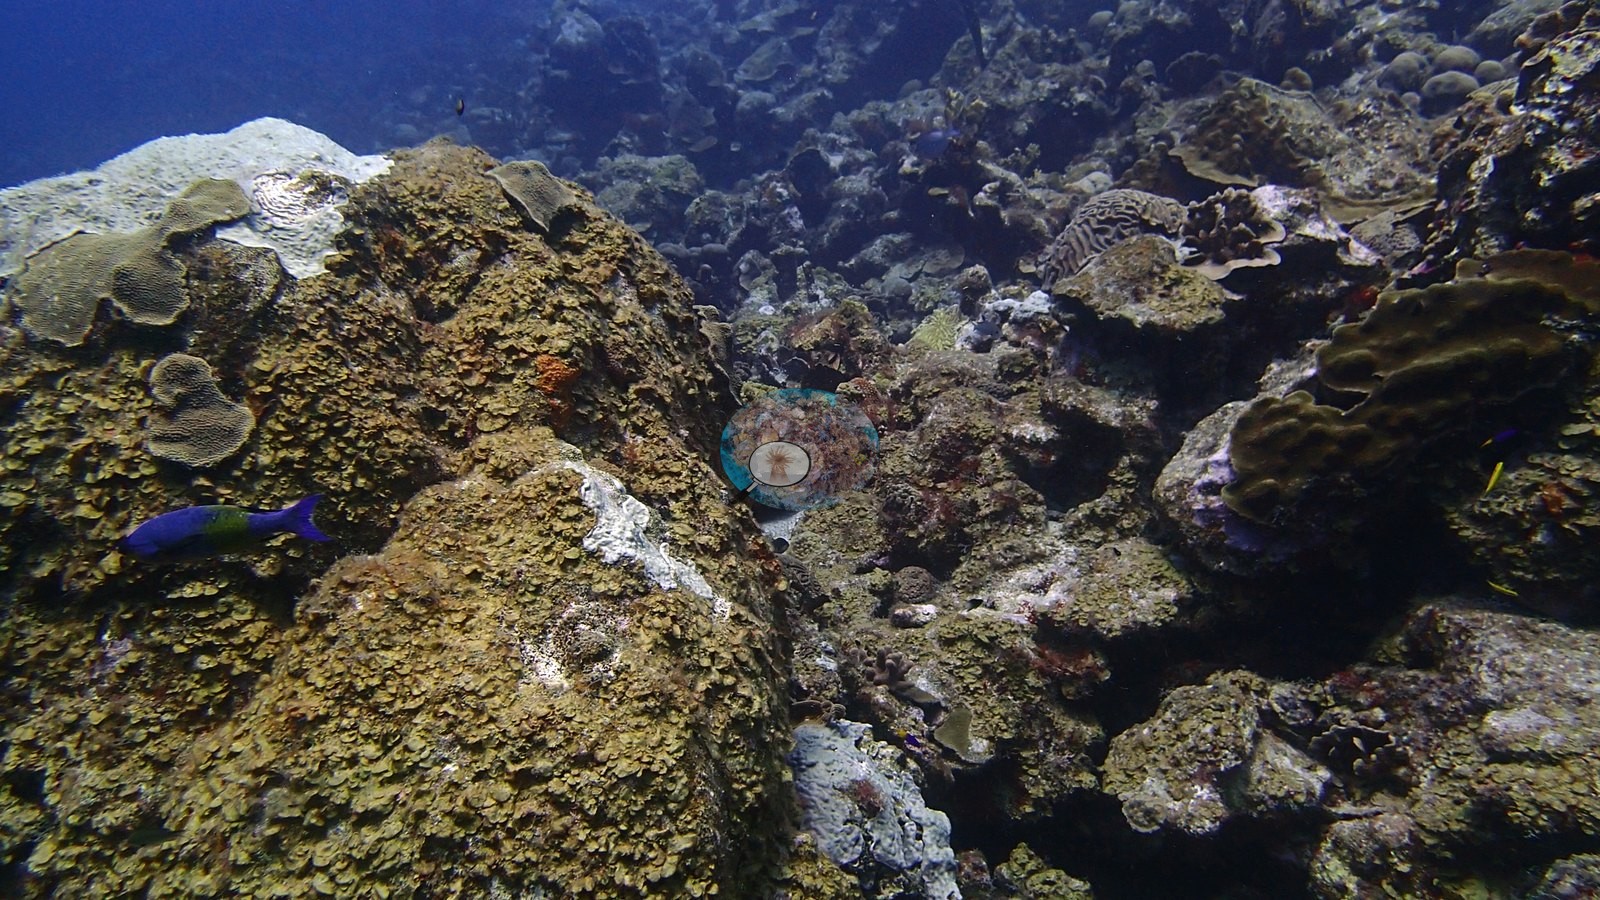
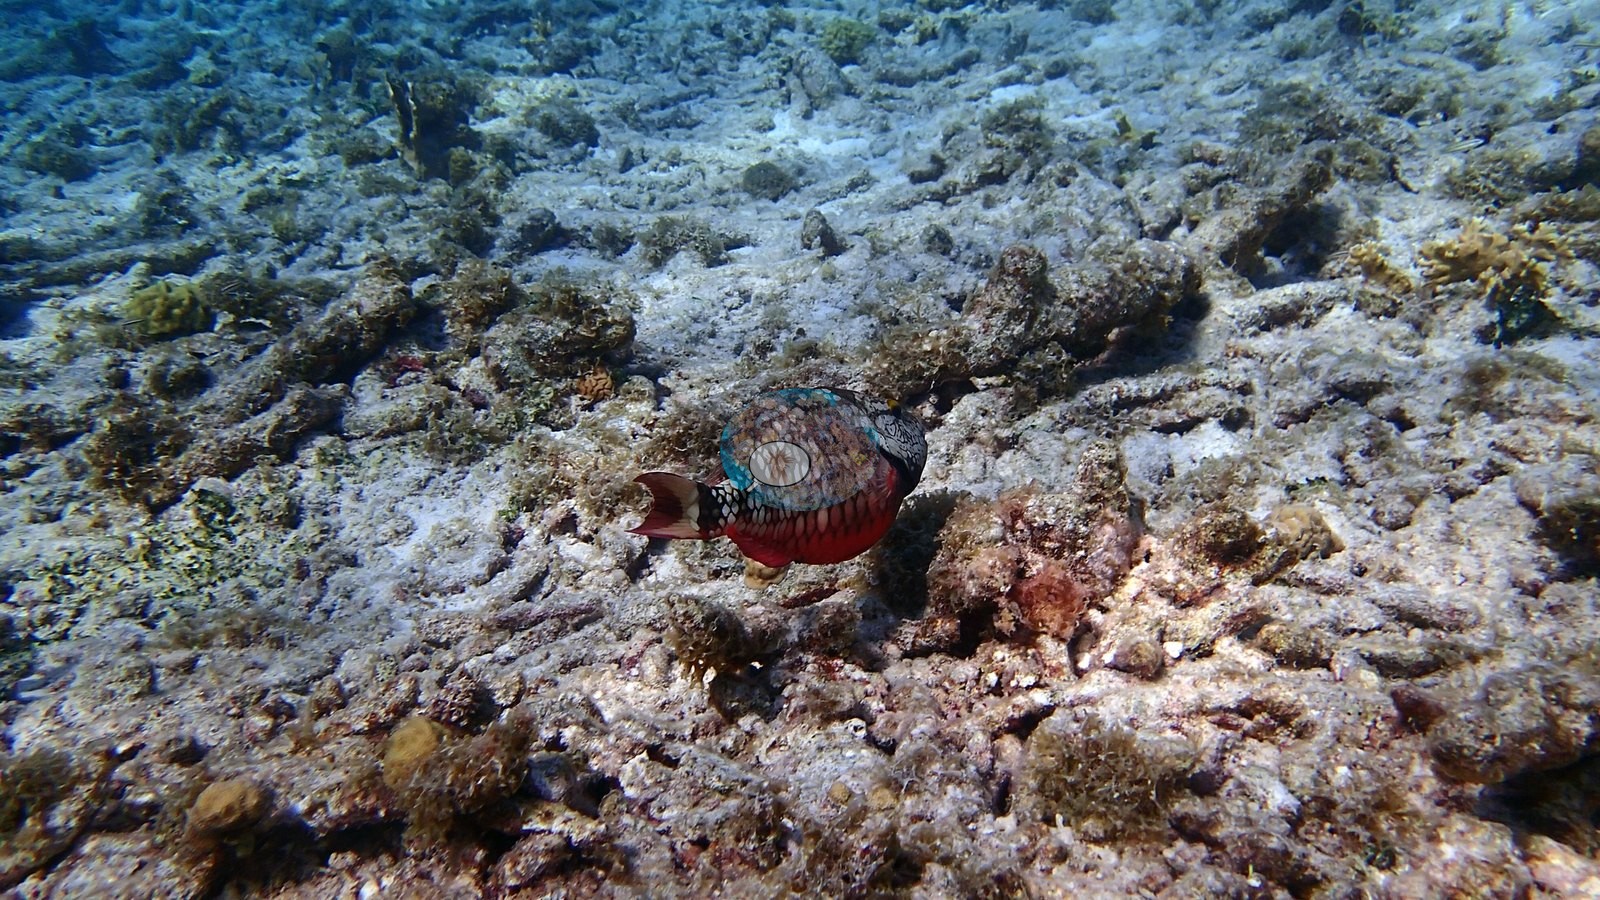
In contrast, one frame shows an extensive shallow field of old, eroded branching coral framework with little visible live coral. This is a meaningful degradation signal, but the photographs alone cannot date the mortality event or determine its cause. No corallivores were evident.
Fish and other fauna
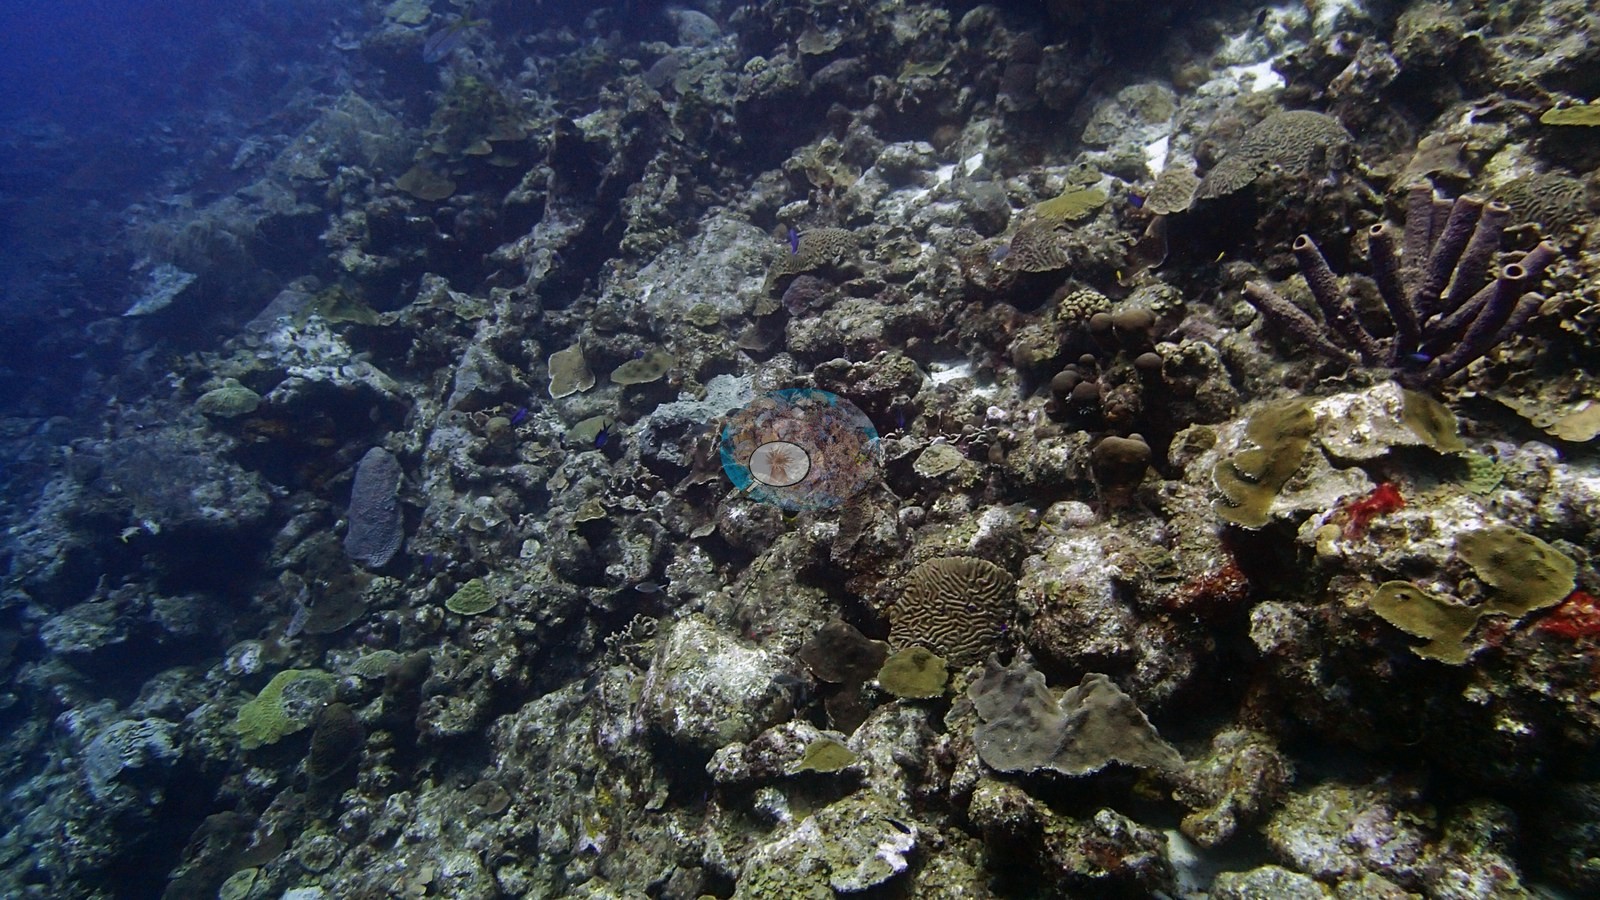
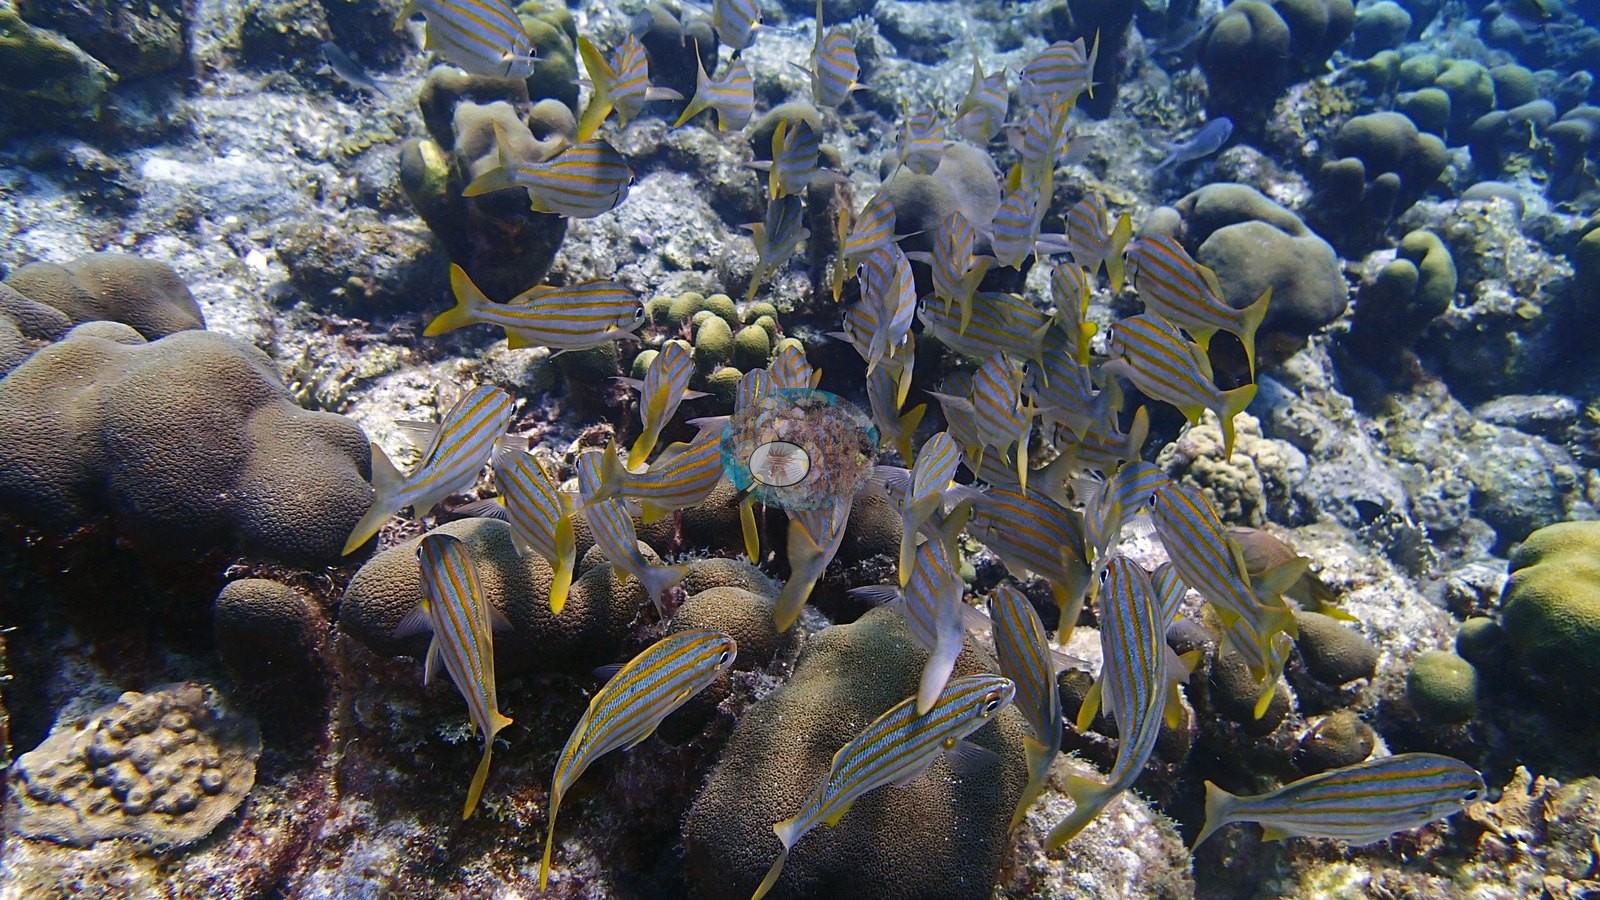
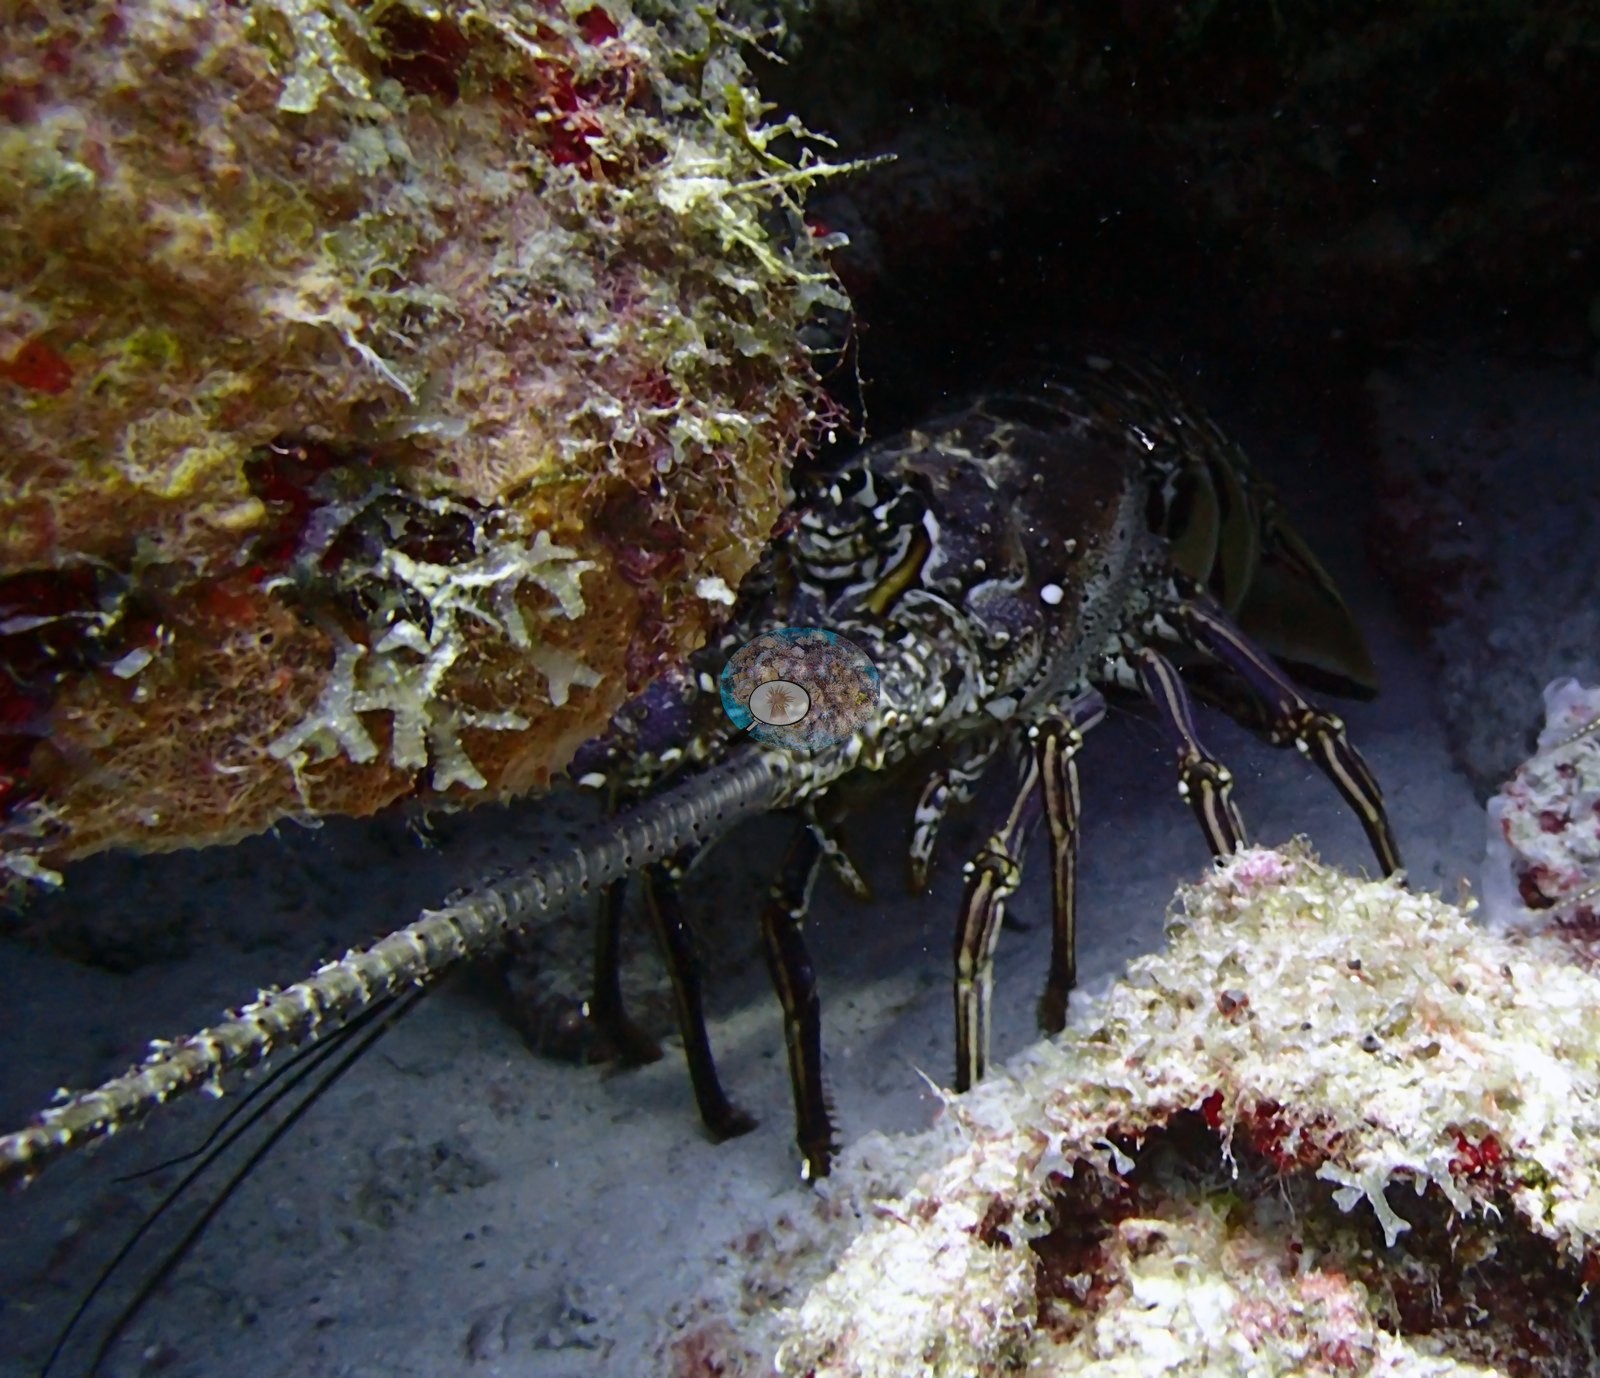
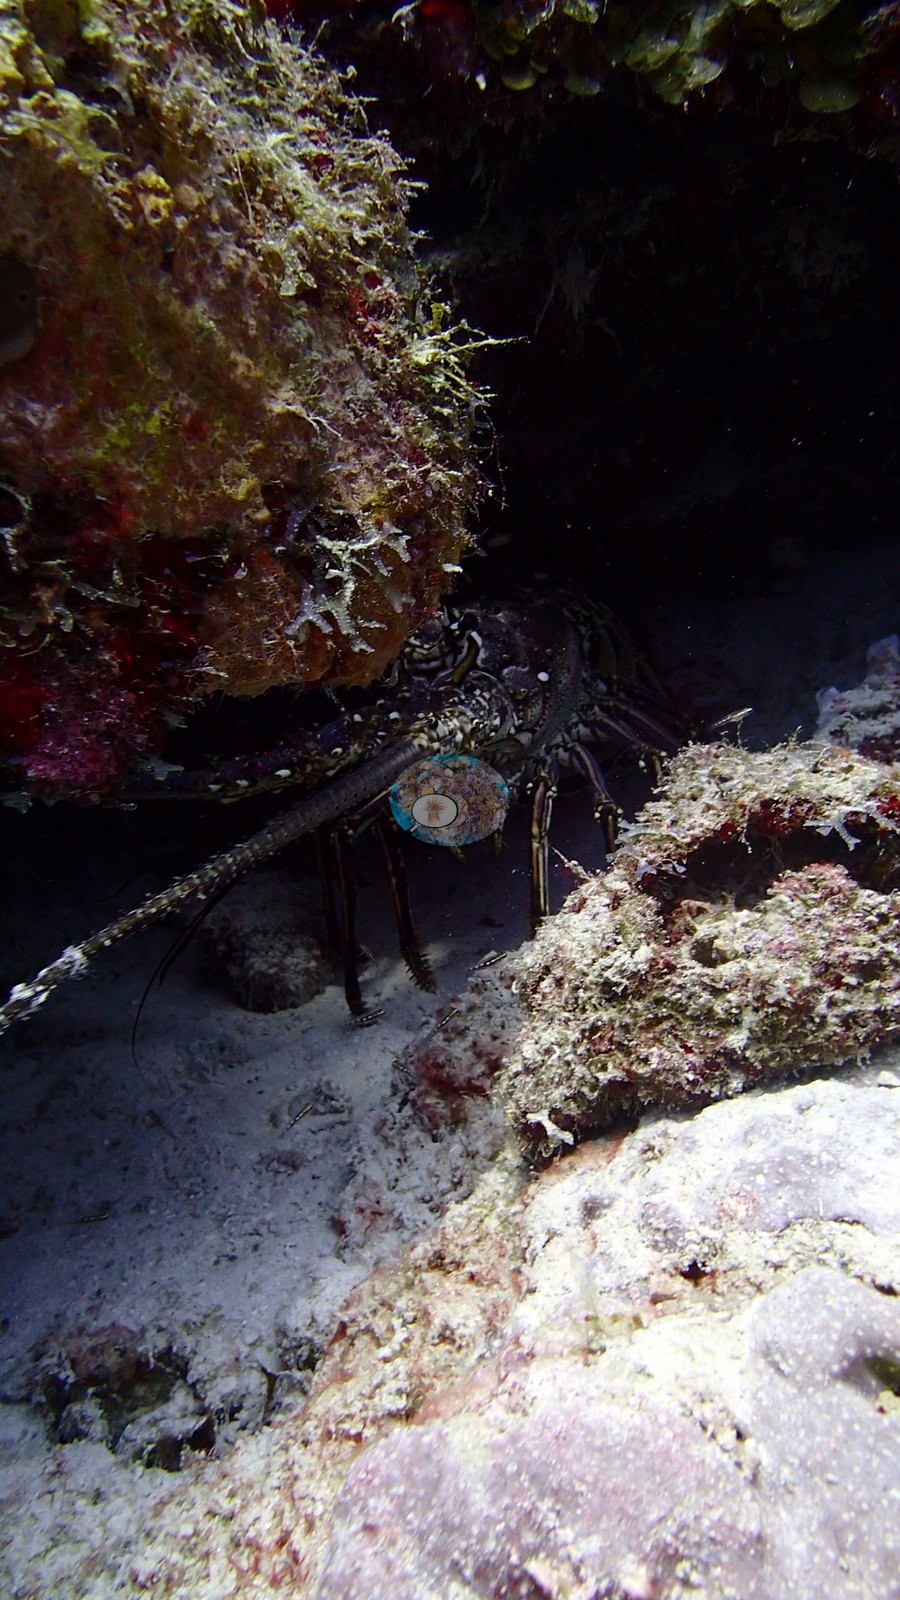
A hawksbill turtle cruised the reef face (e.g., Image 1) and a Caribbean spiny lobster sheltered under a ledge (e.g., Image 17), with a banded coral shrimp (e.g., Image 19), a purple tube-shaped sponge (e.g., Image 40), and a giant anemone (e.g., Image 35) tucked among the coral.
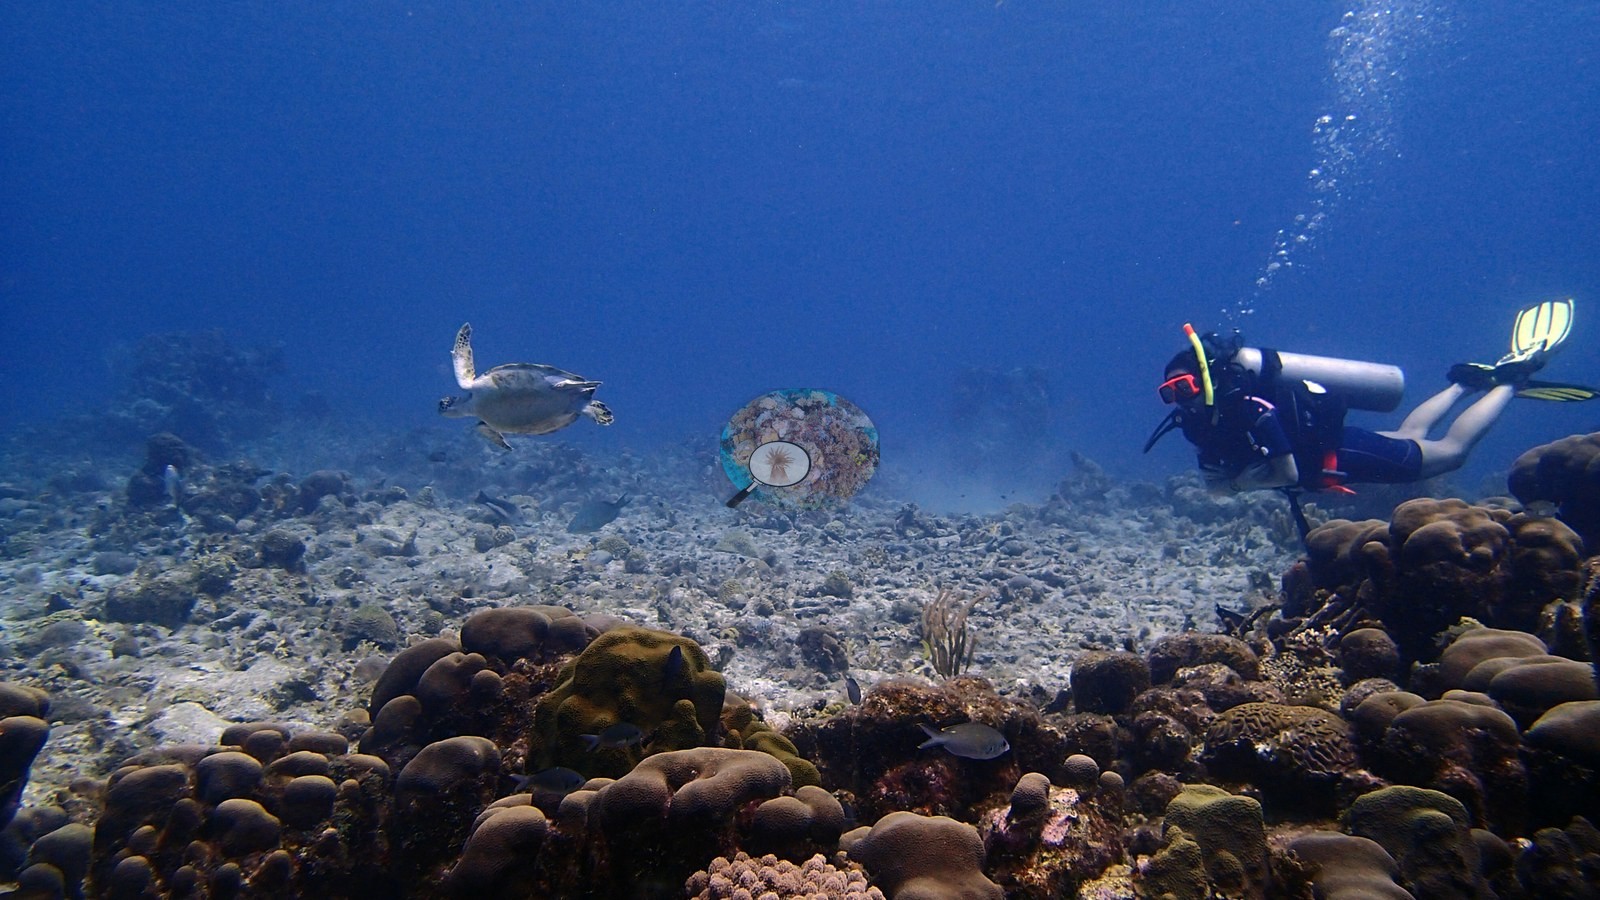
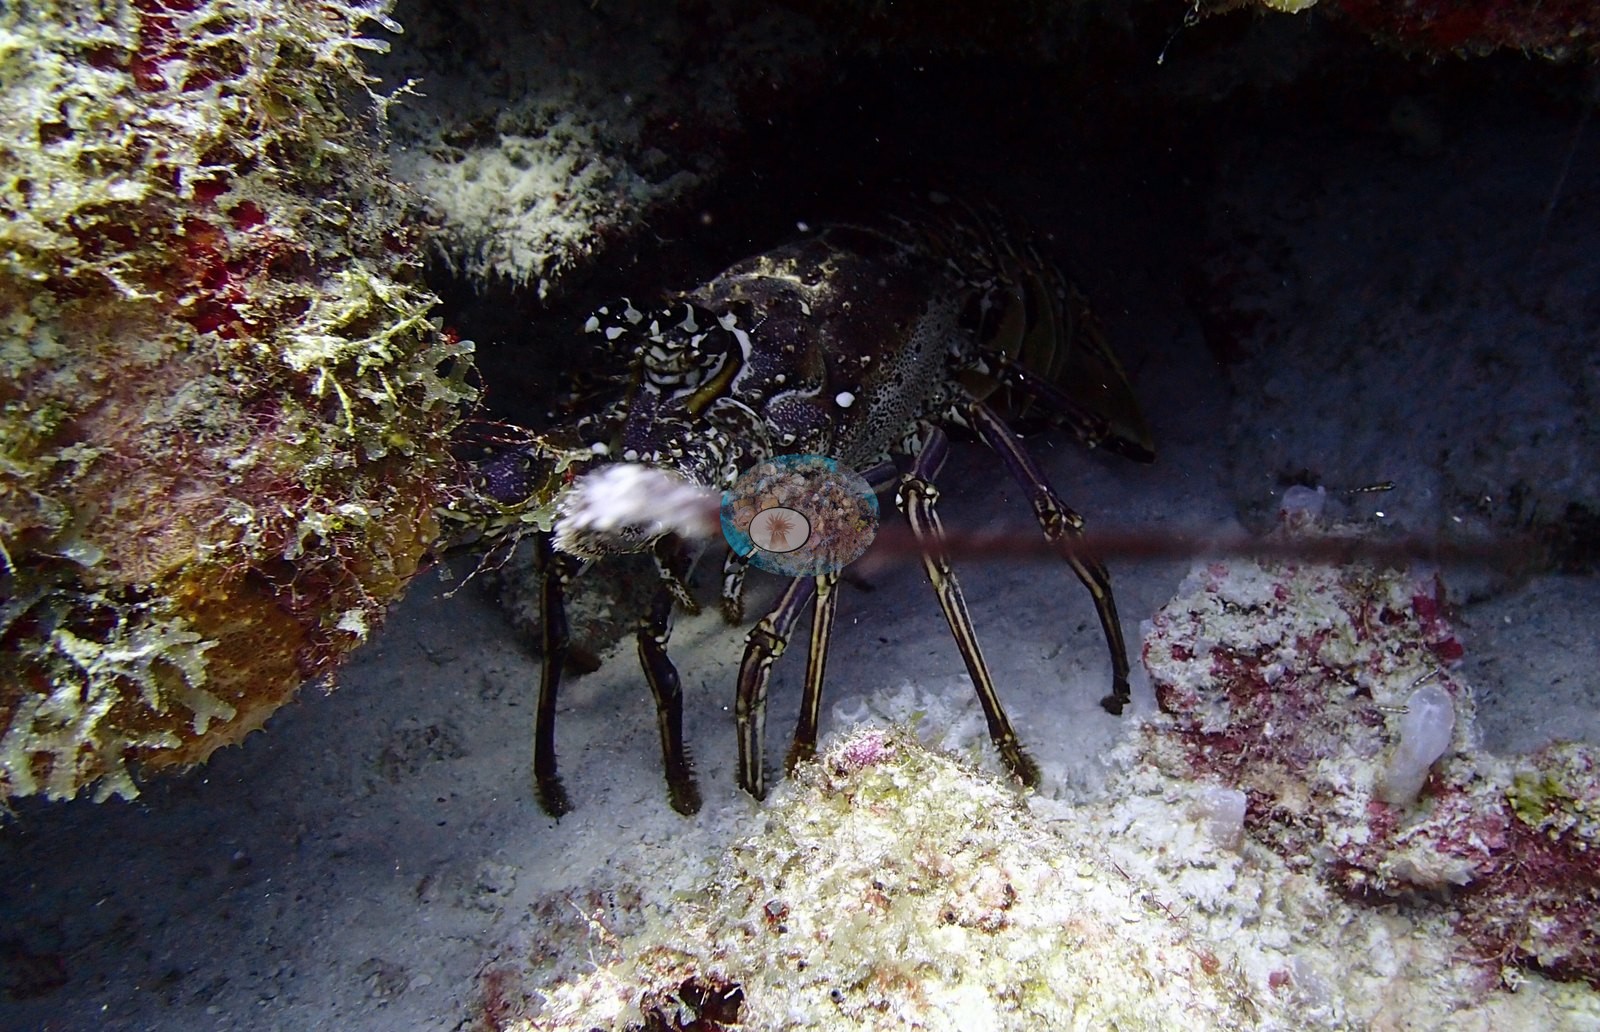
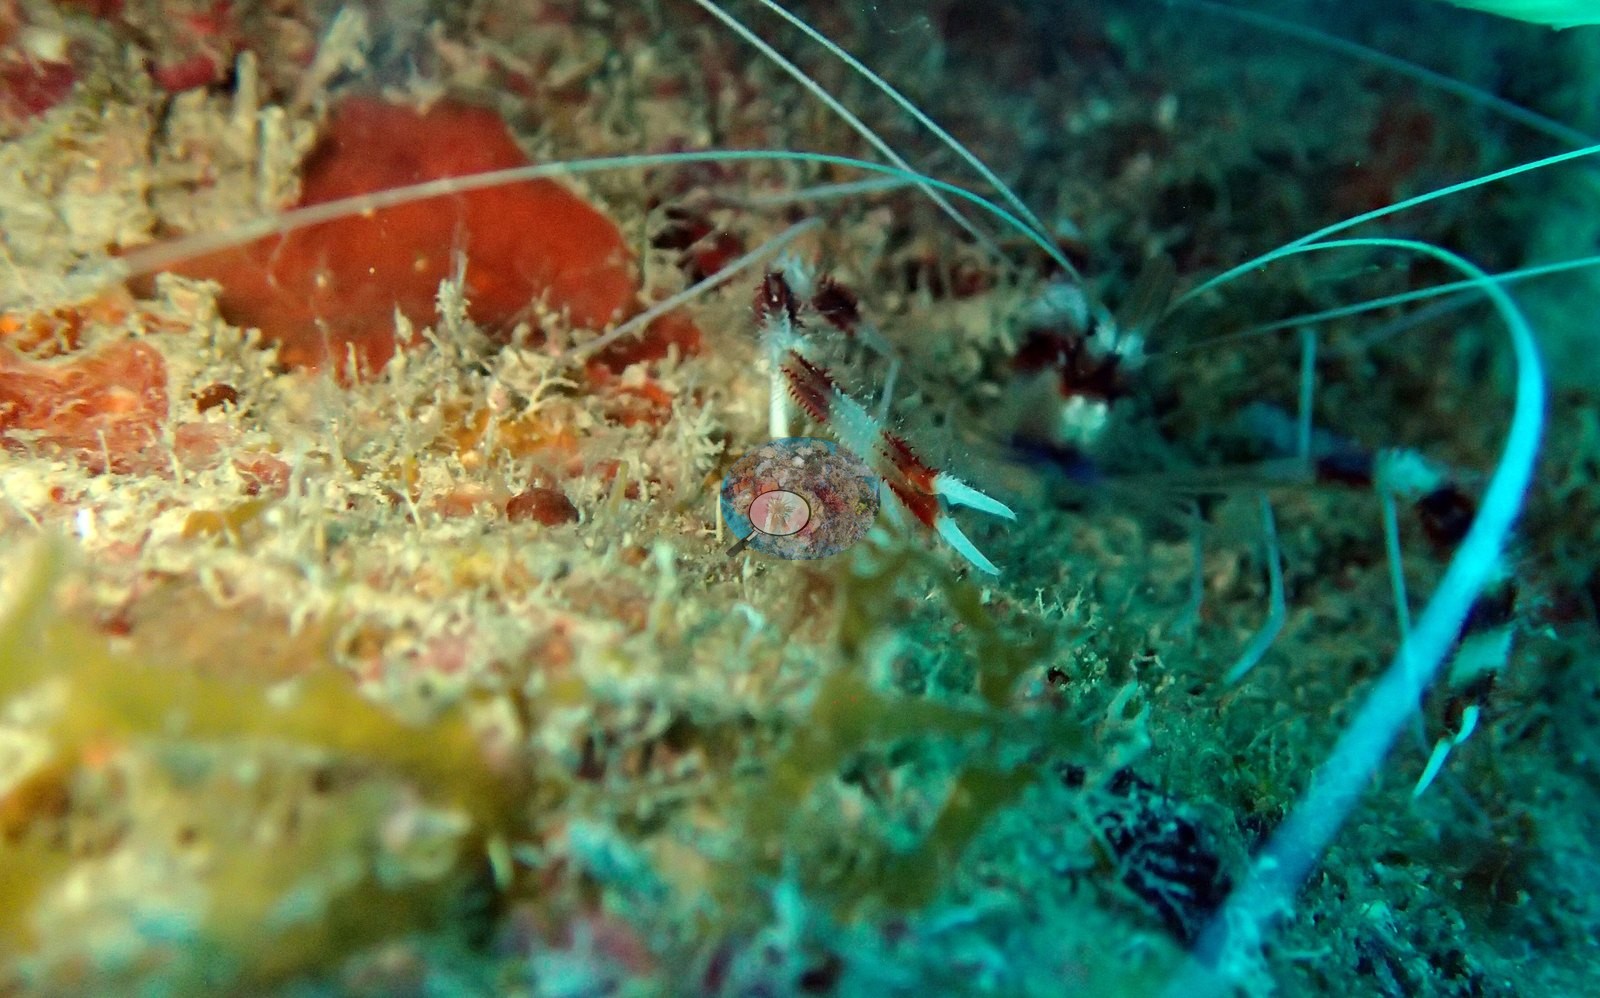
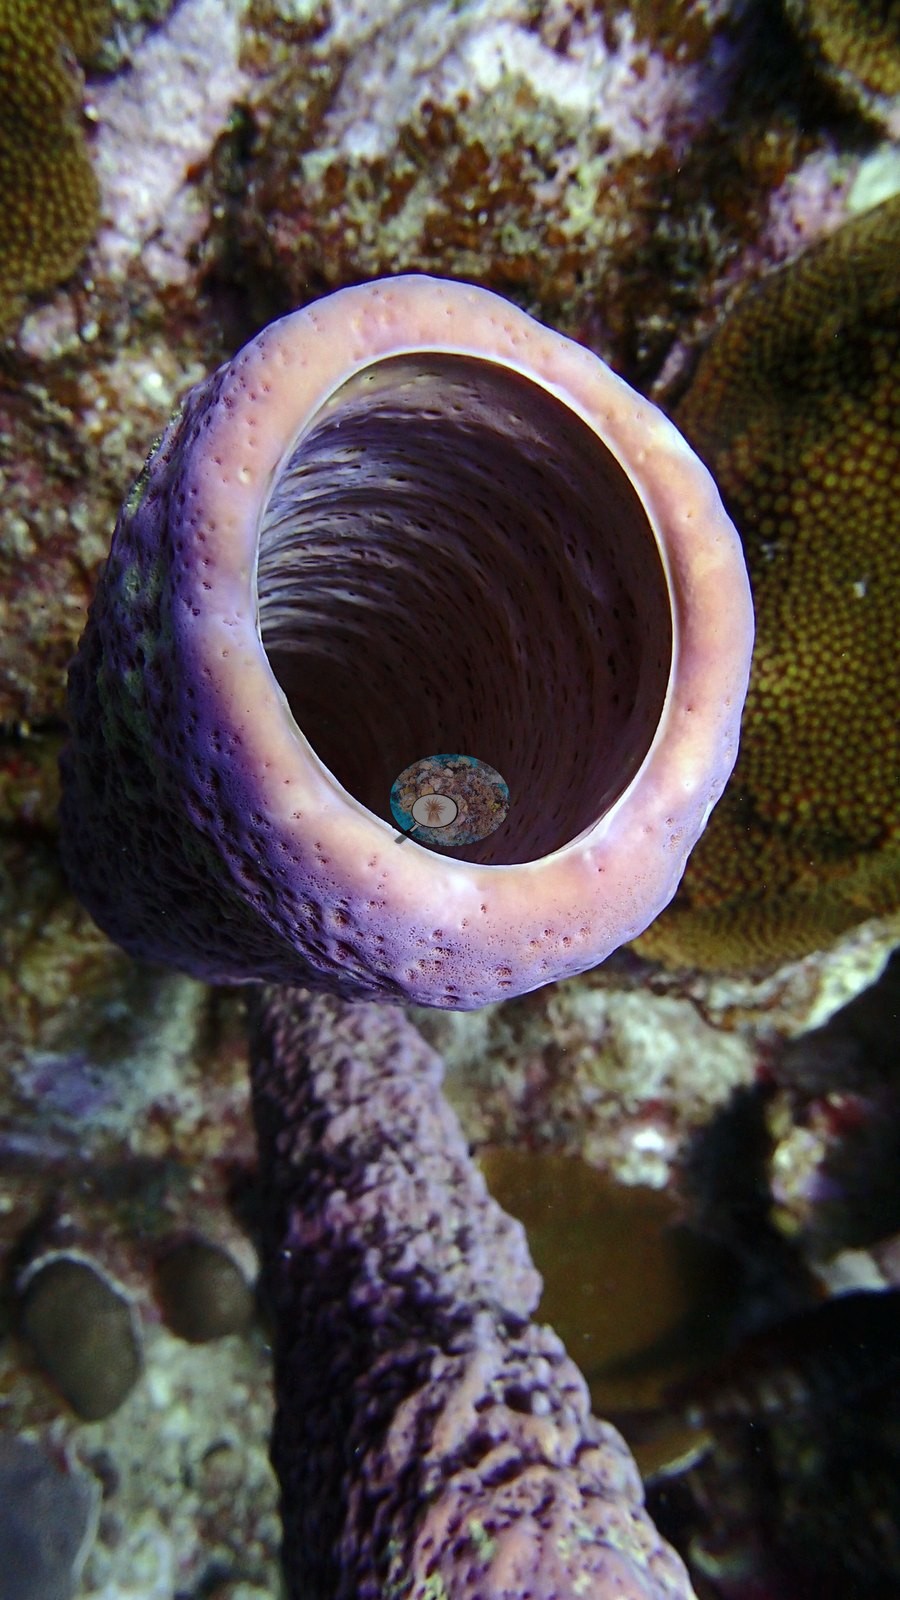
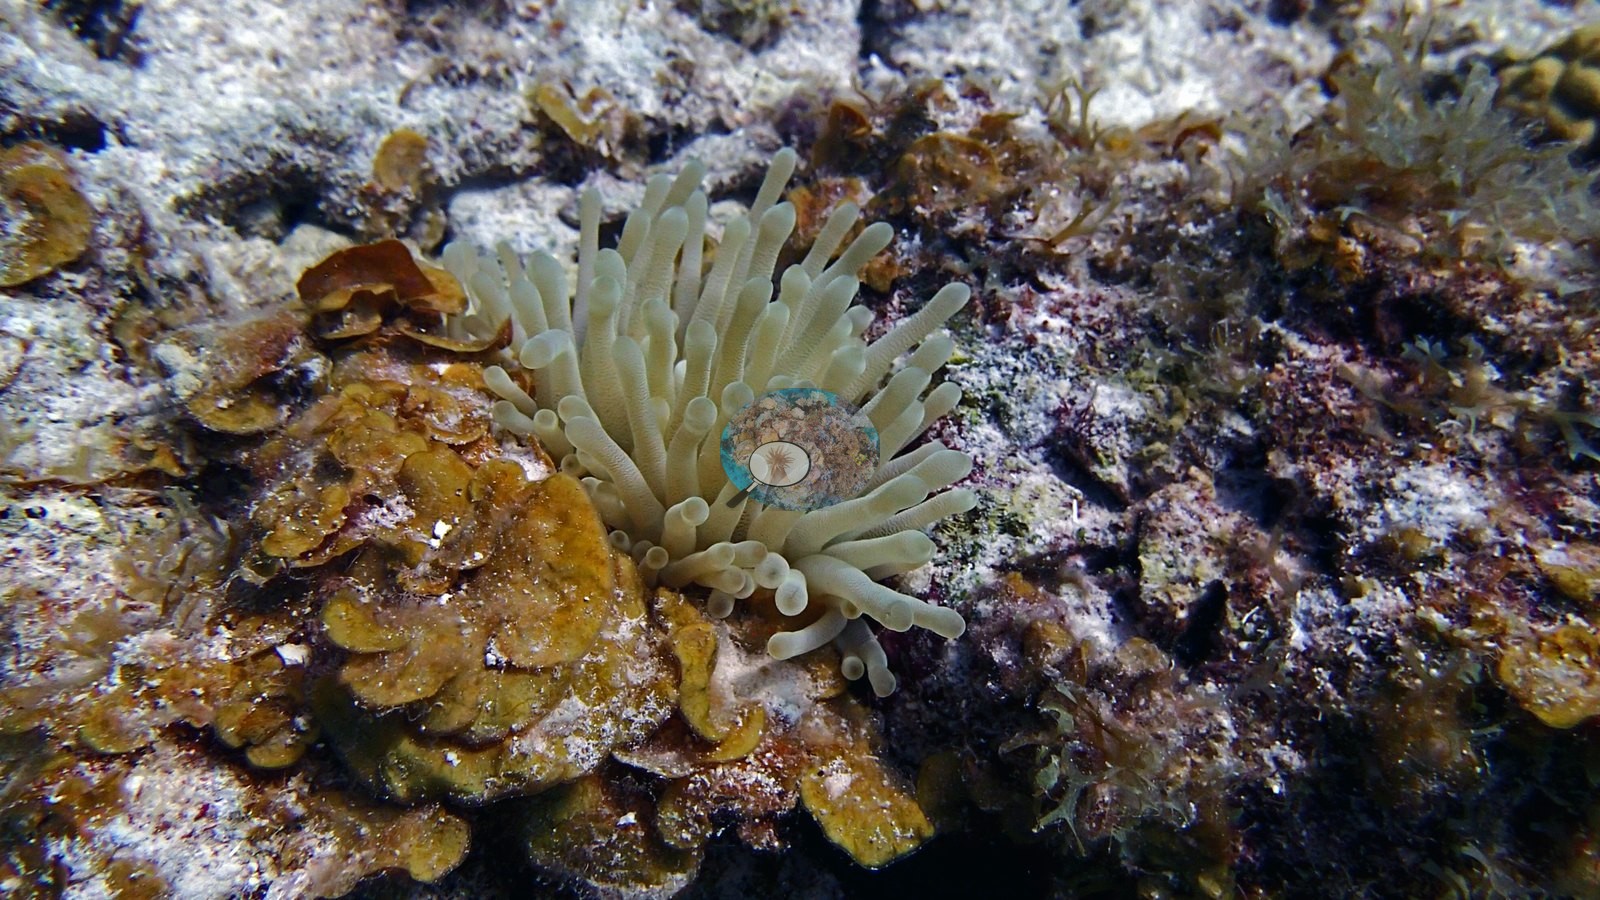
Turtle, parrotfish, lobster, shrimp, and schooling fishes are documented.
Comparisons with other data
Coral cover — external cross-reference (Reef Check). Two independent measurements, reported side by side and deliberately not averaged. Anderson Mayfield / CRD: 24% hard coral (2017). Reef Check: 43% at Twin Peaks, 0.93 km away, in 1998 (50% in 1997; 4 surveys at 3 and 10 m, 1997–1998). The two are 19 years apart (CRD later). Methods differ (CRD photographic/point-count index vs Reef Check point-intercept transect). Reef Check site positions are approximate; at 0.93 km apart the two surveys may have sampled different patches of the same reef, which is the main caveat on this comparison.
CV model comparison
More info
A few colony-focused photos raise the mean; the median is the typical photo. No computer-vision method yet estimates coral cover accurately on new images, so treat this as indicative rather than a measurement; it is revised as the methods improve.More info
Other rows are for comparison only and are never averaged. No diver transect exists for these photos, so agreement between rows is not accuracy.| Method | Hard coral cover (%) | Photos (n) ± SE |
|---|---|---|
| CoralSCOP edited | 24.4 | n = 58 · SE 2.3 |
| Claude (edited photos) | 23.8 | n = 52 · SE 2.8 |
CoralSCOP (edited photos) reads 24.4%, within 0.6 pp of Claude's blind point count (23.8%).
See a more detailed, stand-alone version of this table.
Independent surveys nearby
| Agency / program | Year(s) | Stations / distance | Link |
|---|---|---|---|
| Reef Check | 1997–2001 | 2 stations, 0.93–1.07 km | Records ↓ |
| XL Catlin Seaview Survey | 2013 | 1 station, 4.24 km | Records ↓ |
 Coral Reef DiagnosticsYear-average (illustrative only, programs differ)
Within 5 km, 3 independent survey stations recorded hard coral cover in 7 surveys between 1997 and 2013. The one station surveyed in more than one year declined by 7.0 points between its first and latest surveys. The longest record, Twin Peaks (Reef Check, 0.93 km away), went from 50% in 1997 (mean of 2 surveys) to 43% in 1998 (mean of 2 surveys). The most recent nearby survey is from 2013, so these values predate recent heat stress. This site's own estimate (24%) sits within the range of these station-year means up to 2 km away (14–50%); the methods differ, so the comparison is context, not a like-for-like test.
Collected by other programs using different methods (Reef Check uses point-intercept transects; the XL Catlin Seaview Survey uses photo-transects with automated image annotation), so these are context for the figures above, not a like-for-like comparison. Where a station was surveyed more than once, the cell shows either the range of its values or, as a single value, the mean of surveys made in one year. Station names are not dive-site names.
| Agency | Site / location | Date | Hard coral cover (%) | Distance | Link |
|---|---|---|---|---|---|
| Reef Check | Twin Peaks | 1997–1998 | 43–50% (range of yearly means; 4 surveys) | 0.93 km | — |
| Reef Check | Slagbaii Reserve | 2001 | 14%, mean of 2 surveys (3 m and 10 m) | 1.07 km | — |
| XL Catlin Seaview Survey | transect 17032 | 2013 | 7.1% | 4.24 km | doi:10.14264/uql.2019.930 |
Data & links
All images from Coral Reef Diagnostics. Data are from Coral Reef Diagnostics and the organizations named in the data sources above.
© Coral Reef Diagnostics.